Não é nem um pouco melhor do que no ano anterior: 2023 Análise do Dell XPS 13 Plus 9320 Core i7-1360P

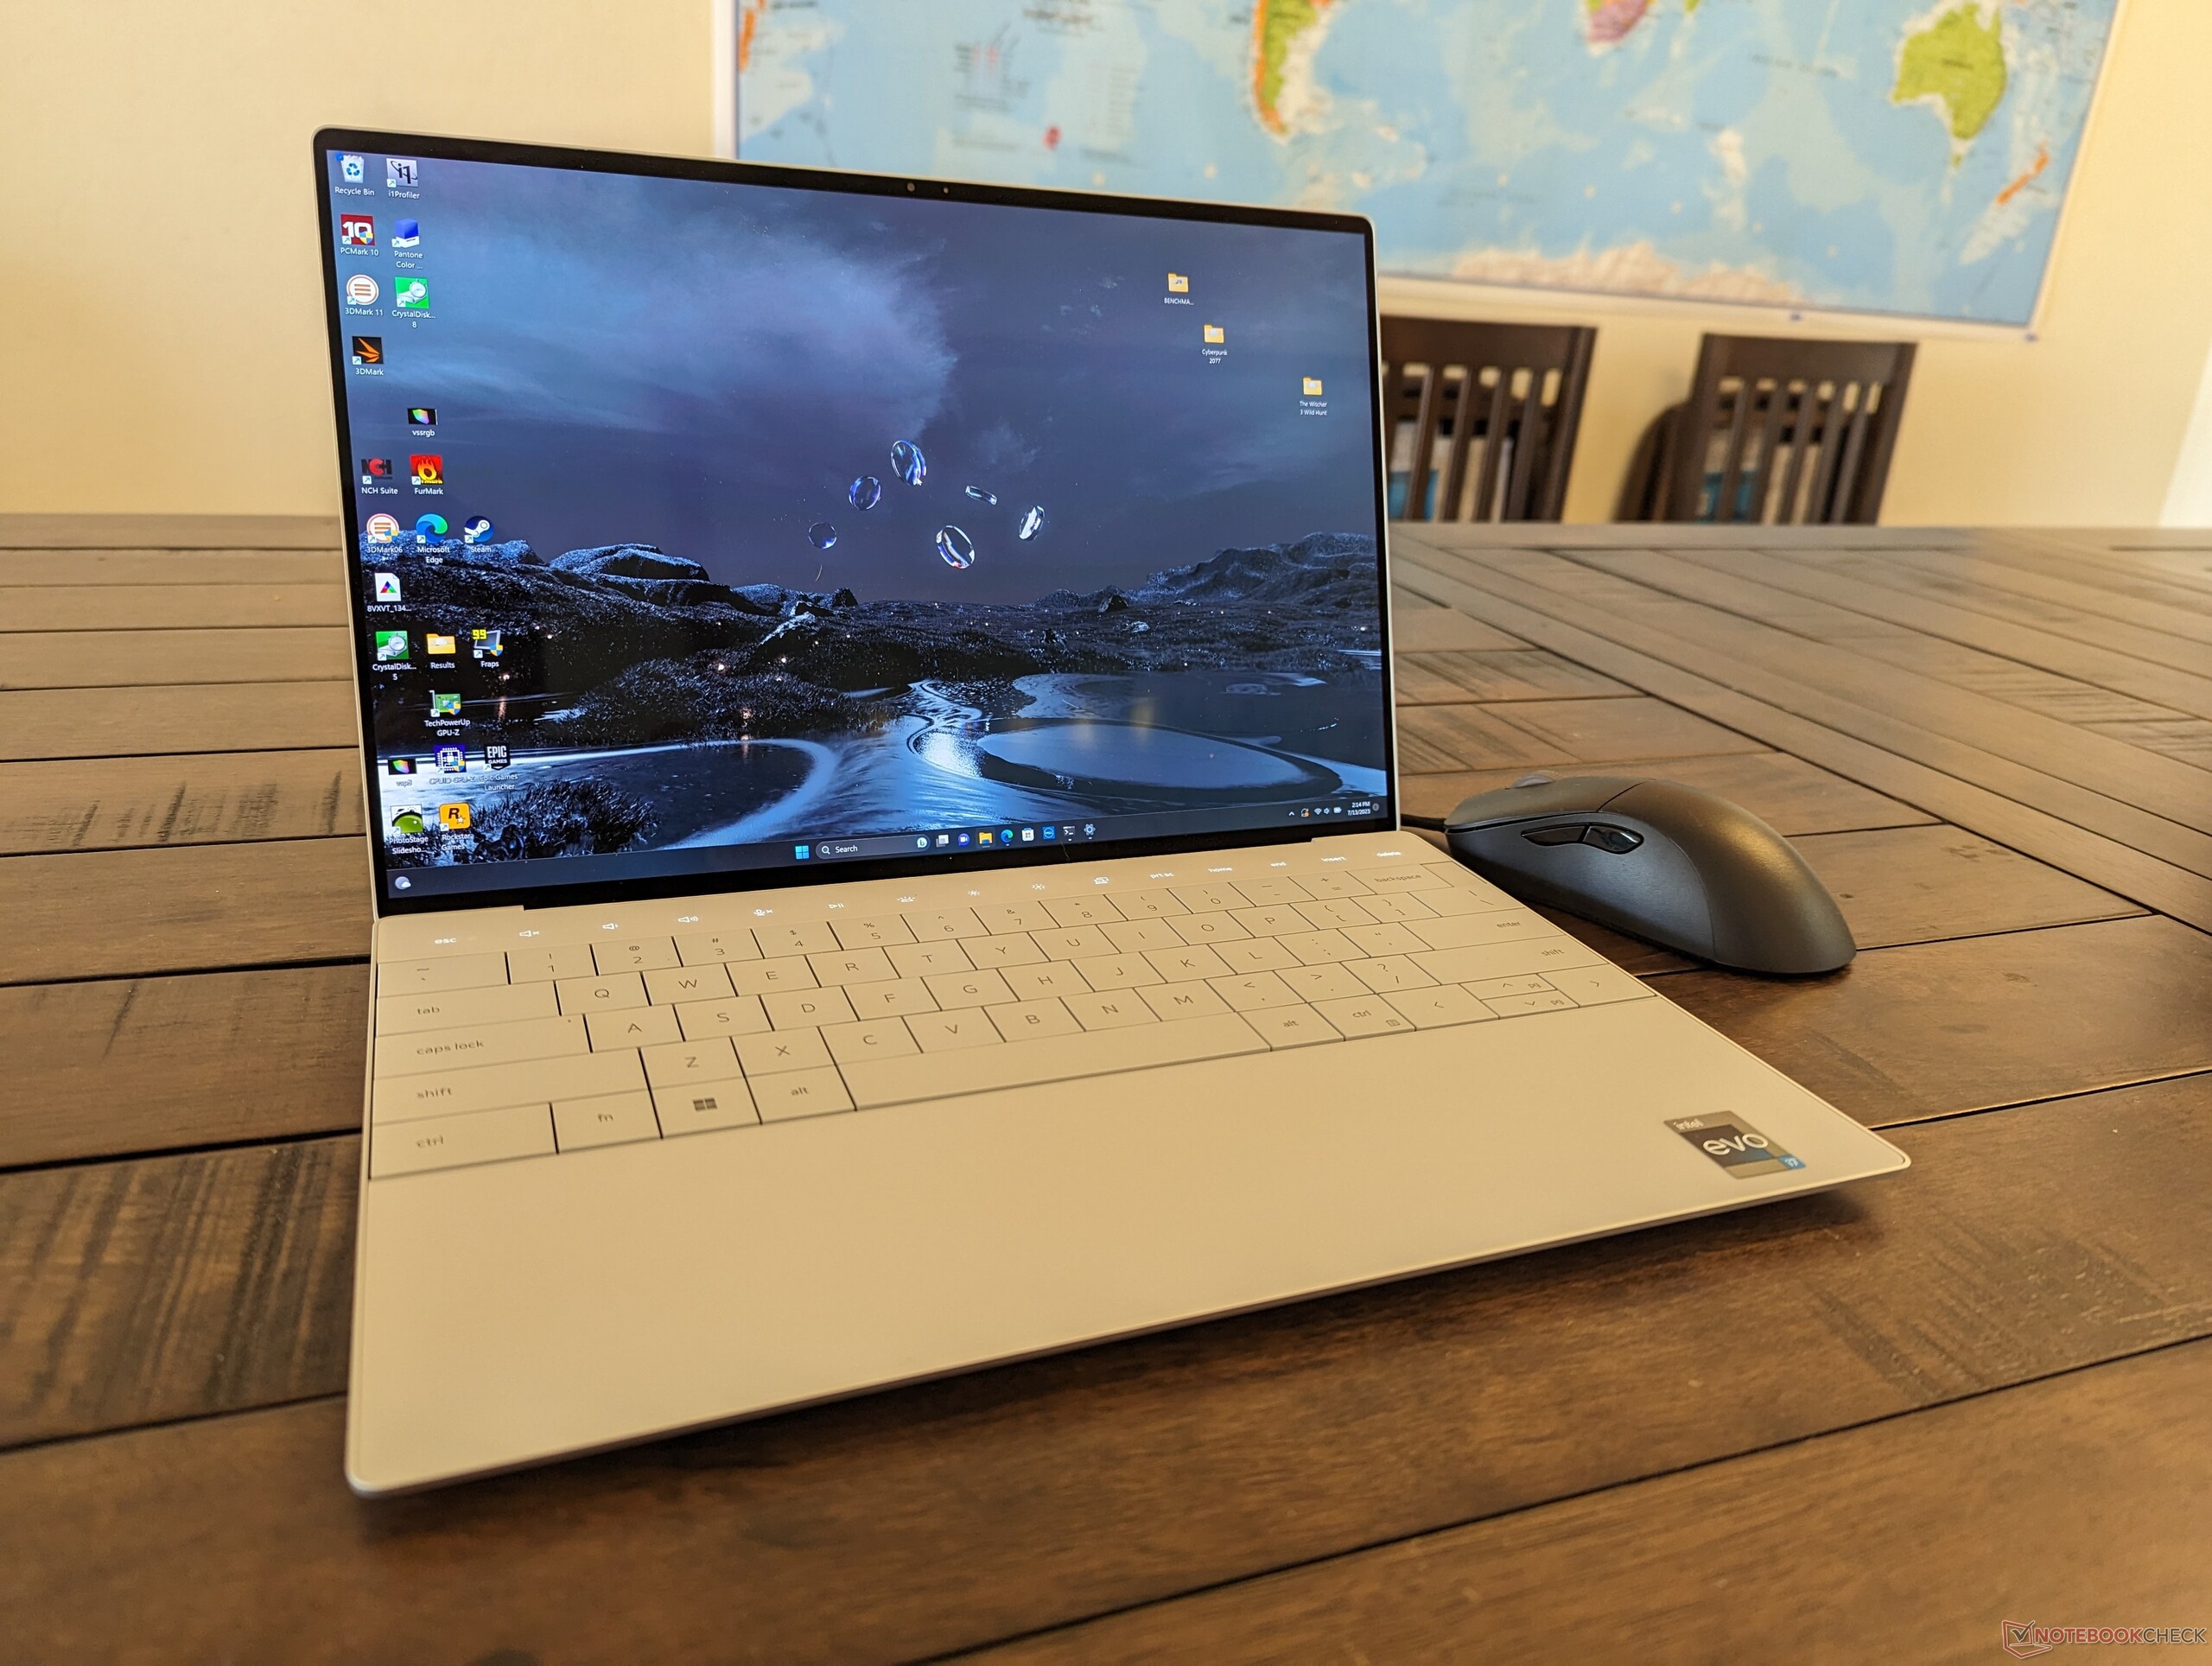
O XPS 13 Plus 9320 de 2023 é a atualização deste ano do modelo original de 2022. Ele utiliza o mesmo design de chassi, mas com opções de CPU Raptor Lake de 13ª geração mais recentes para substituir as opções Alder Lake de 12ª geração mais antigas. Por outro lado, não há mudanças externas e, portanto, recomendamos conferir nossa análise do modelo 2022 para saber mais sobre os recursos físicos do XPS 13 Plus.
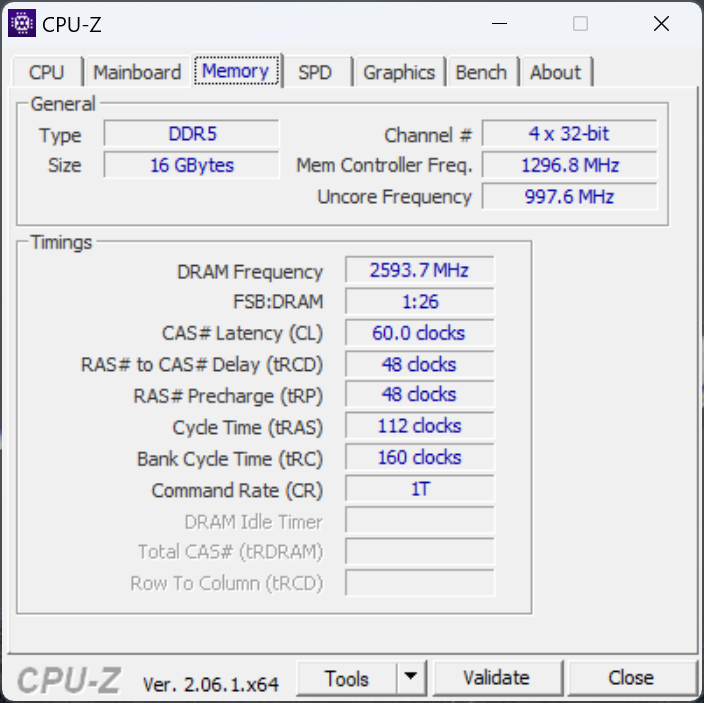
Nossa configuração é uma SKU de médio porte com a tela sensível ao toque OLED de 13,4 polegadas e 3,5K (3456 x 2160) e 16 GB de RAM LPDDR5 rápida de 6000 MHz por cerca de US$ 1300. Outras SKUs podem vir com painéis de 1200p ou 2400p, mas todas estão sendo fornecidas atualmente com o mesmo processador Core i7-1360P.
As alternativas ao XPS 13 Plus incluem outros subnotebooks de 13 polegadas, como oFramework Laptop 13.5,HP Spectre x360 13.5ou o Lenovo ThinkPad X13 G3.
Mais análises da Dell:
Possíveis concorrentes em comparação
Avaliação | Data | Modelo | Peso | Altura | Size | Resolução | Preço |
|---|---|---|---|---|---|---|---|
| 87.4 % v7 (old) | 07/2023 | Dell XPS 13 Plus 9320 Core i7-1360P i7-1360P, Iris Xe G7 96EUs | 1.3 kg | 15.3 mm | 13.40" | 3456x2160 | |
| 87.3 % v7 (old) | 09/2022 | Dell XPS 13 Plus 9320 i7-1280P OLED i7-1280P, Iris Xe G7 96EUs | 1.3 kg | 15.28 mm | 13.40" | 3456x2160 | |
| 85.9 % v7 (old) | 11/2019 | Dell XPS 13 7390 Core i7-10710U i7-10710U, UHD Graphics 620 | 1.2 kg | 11.6 mm | 13.30" | 3840x2160 | |
| 86.2 % v7 (old) | 05/2023 | Framework Laptop 13.5 13th Gen Intel i7-1370P, Iris Xe G7 96EUs | 1.3 kg | 15.85 mm | 13.50" | 2256x1504 | |
| 89.1 % v7 (old) | 06/2023 | Lenovo ThinkPad X13 Yoga G3 21AW003UGE i7-1265U, Iris Xe G7 96EUs | 1.2 kg | 15.9 mm | 13.30" | 2560x1600 | |
| 90.3 % v7 (old) | 08/2022 | HP Spectre x360 13.5 14t-ef000 i7-1255U, Iris Xe G7 96EUs | 1.4 kg | 17 mm | 13.50" | 3000x2000 |
Caso
Comunicação
| Networking | |
| iperf3 transmit AX12 | |
| Dell XPS 13 7390 Core i7-10710U | |
| iperf3 receive AX12 | |
| Dell XPS 13 7390 Core i7-10710U | |
| iperf3 transmit AXE11000 | |
| Dell XPS 13 Plus 9320 Core i7-1360P | |
| Framework Laptop 13.5 13th Gen Intel | |
| Lenovo ThinkPad X13 Yoga G3 21AW003UGE | |
| iperf3 receive AXE11000 | |
| Lenovo ThinkPad X13 Yoga G3 21AW003UGE | |
| Dell XPS 13 Plus 9320 Core i7-1360P | |
| Framework Laptop 13.5 13th Gen Intel | |
| iperf3 transmit AXE11000 6GHz | |
| HP Spectre x360 13.5 14t-ef000 | |
| Framework Laptop 13.5 13th Gen Intel | |
| Dell XPS 13 Plus 9320 Core i7-1360P | |
| iperf3 receive AXE11000 6GHz | |
| Framework Laptop 13.5 13th Gen Intel | |
| Dell XPS 13 Plus 9320 Core i7-1360P | |
| HP Spectre x360 13.5 14t-ef000 | |
Webcam
Não há alterações na webcam de 1 MP, enquanto alguns modelos concorrentes, como o HP Spectre já adotaram sensores de 5 MP de maior qualidade.


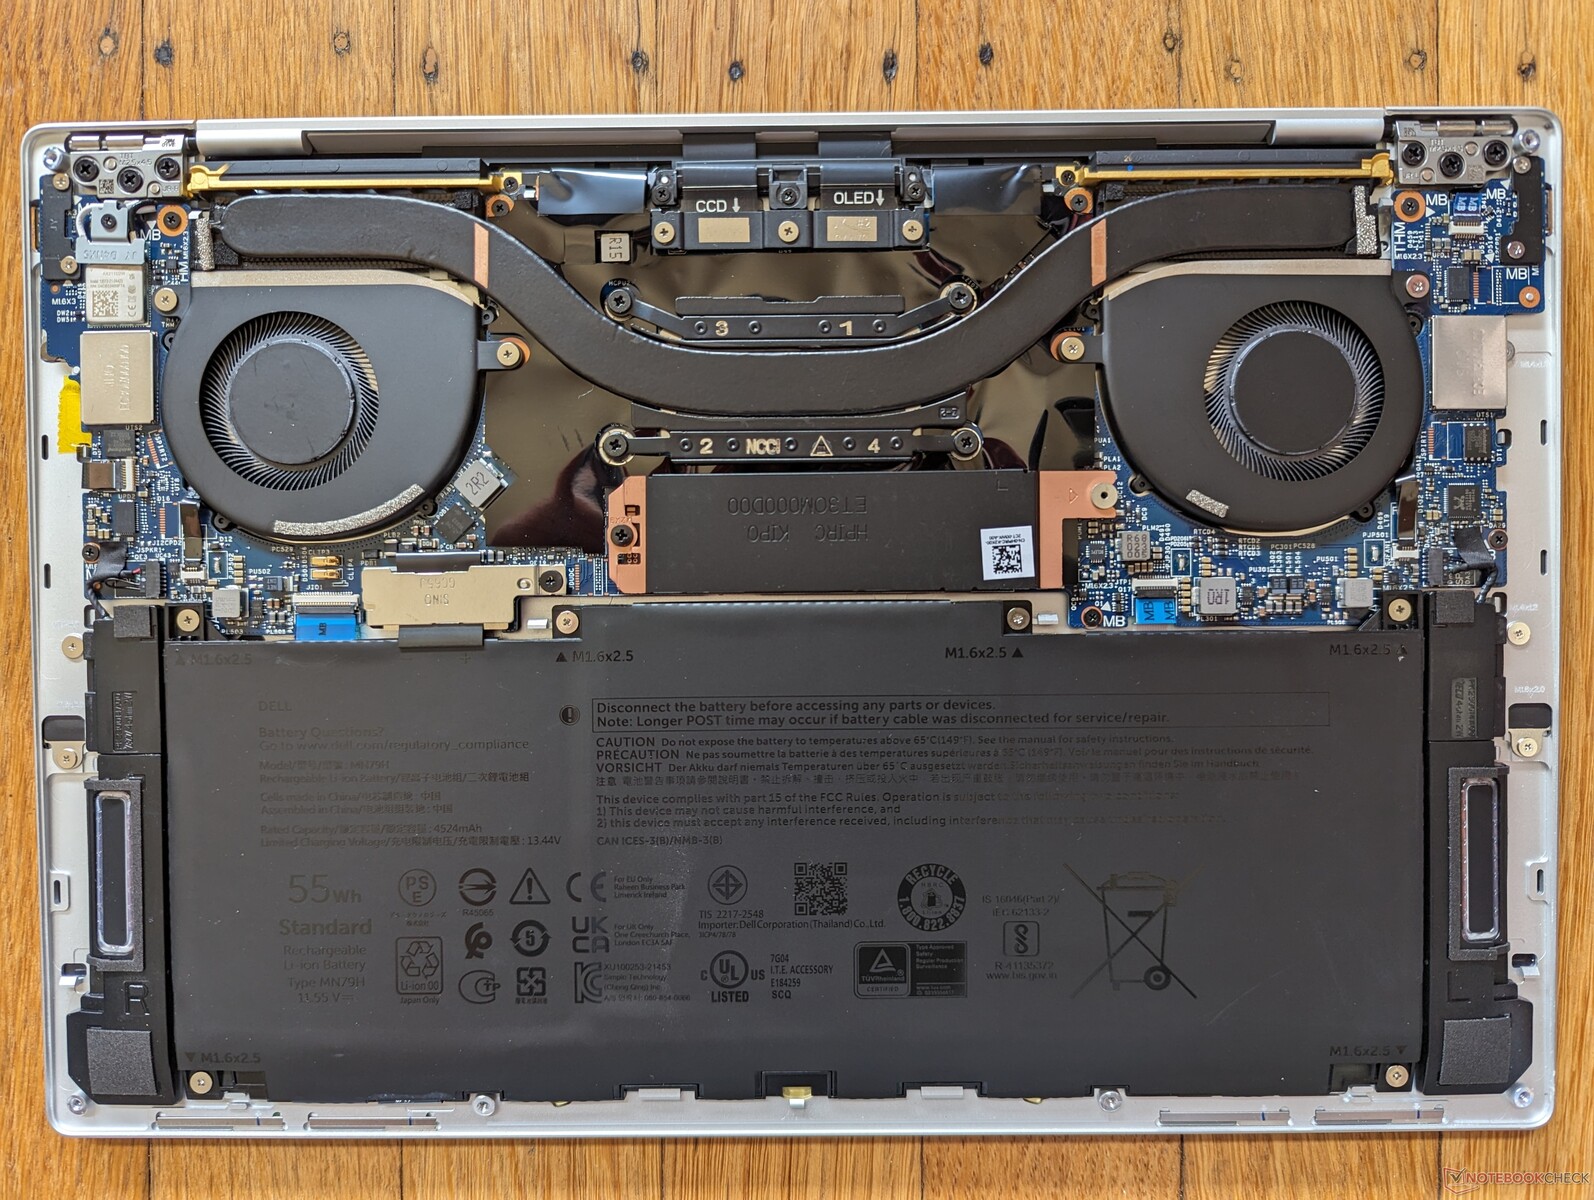
Manutenção
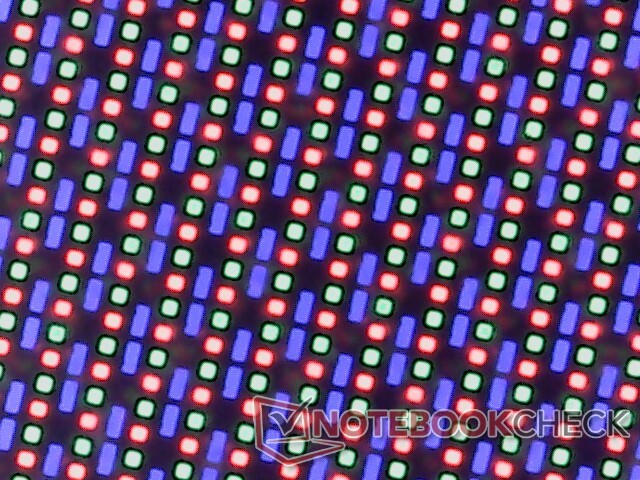
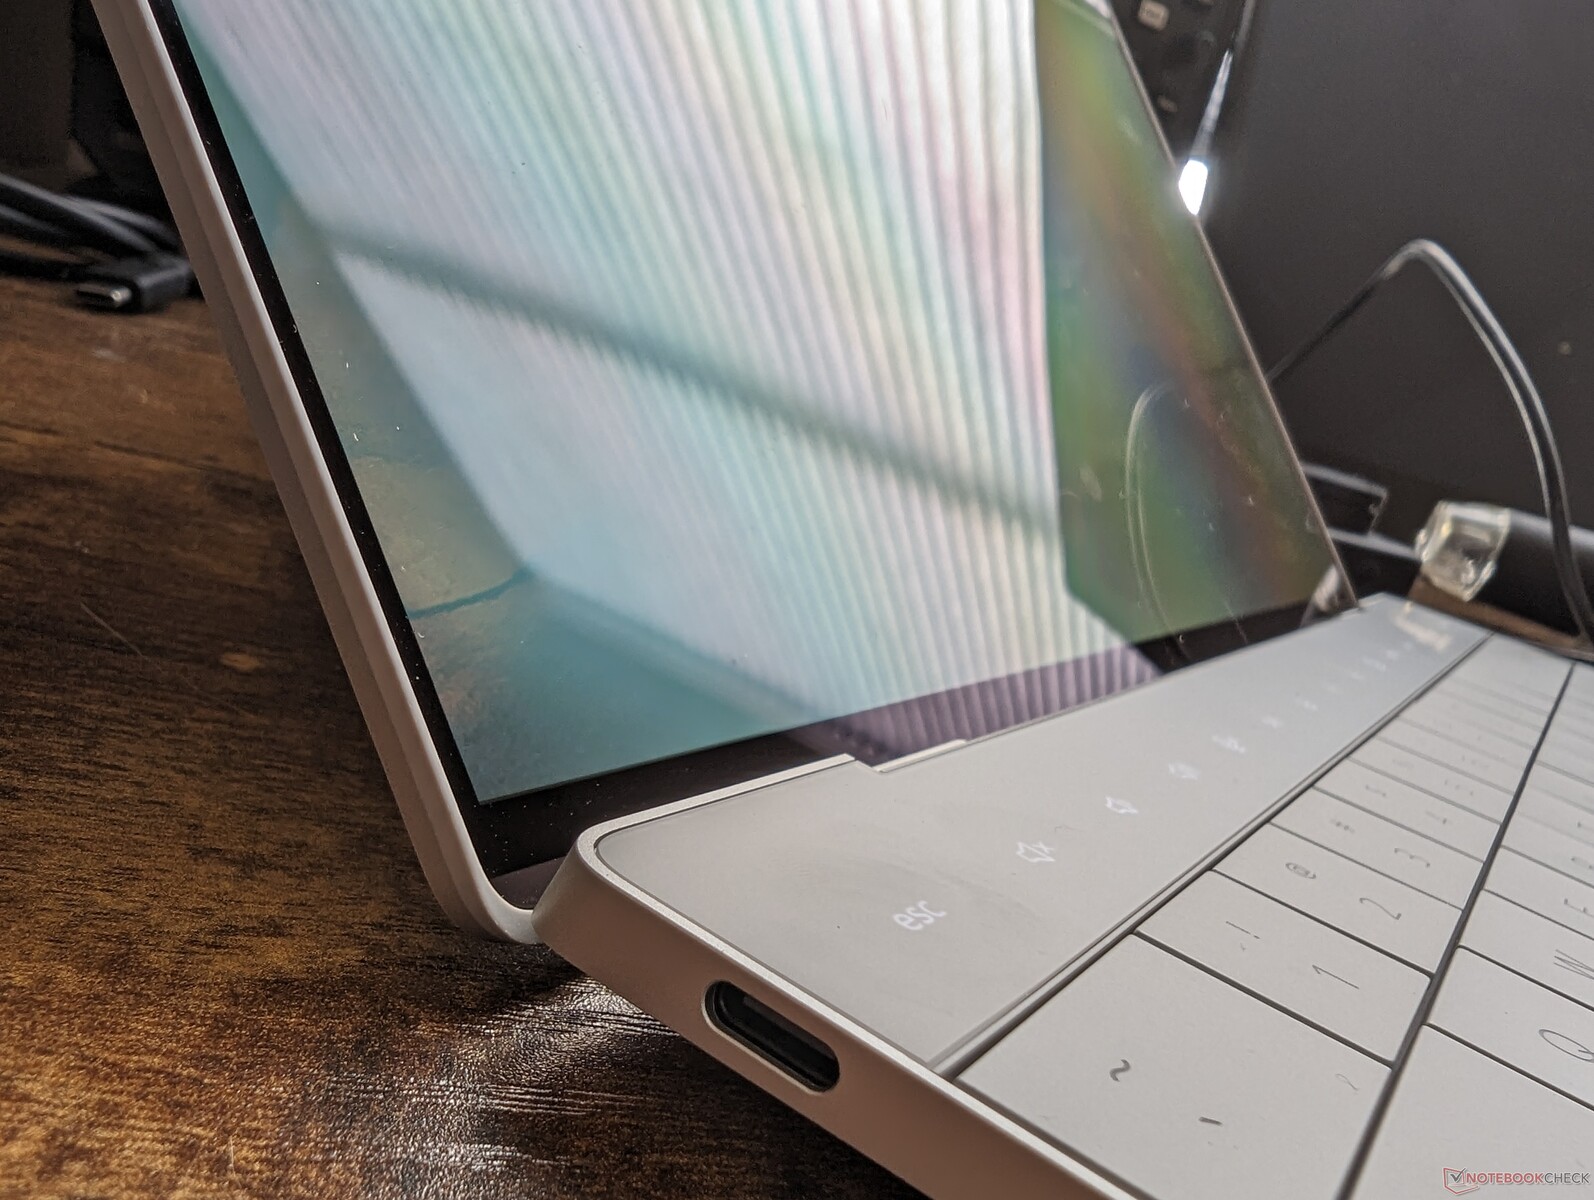
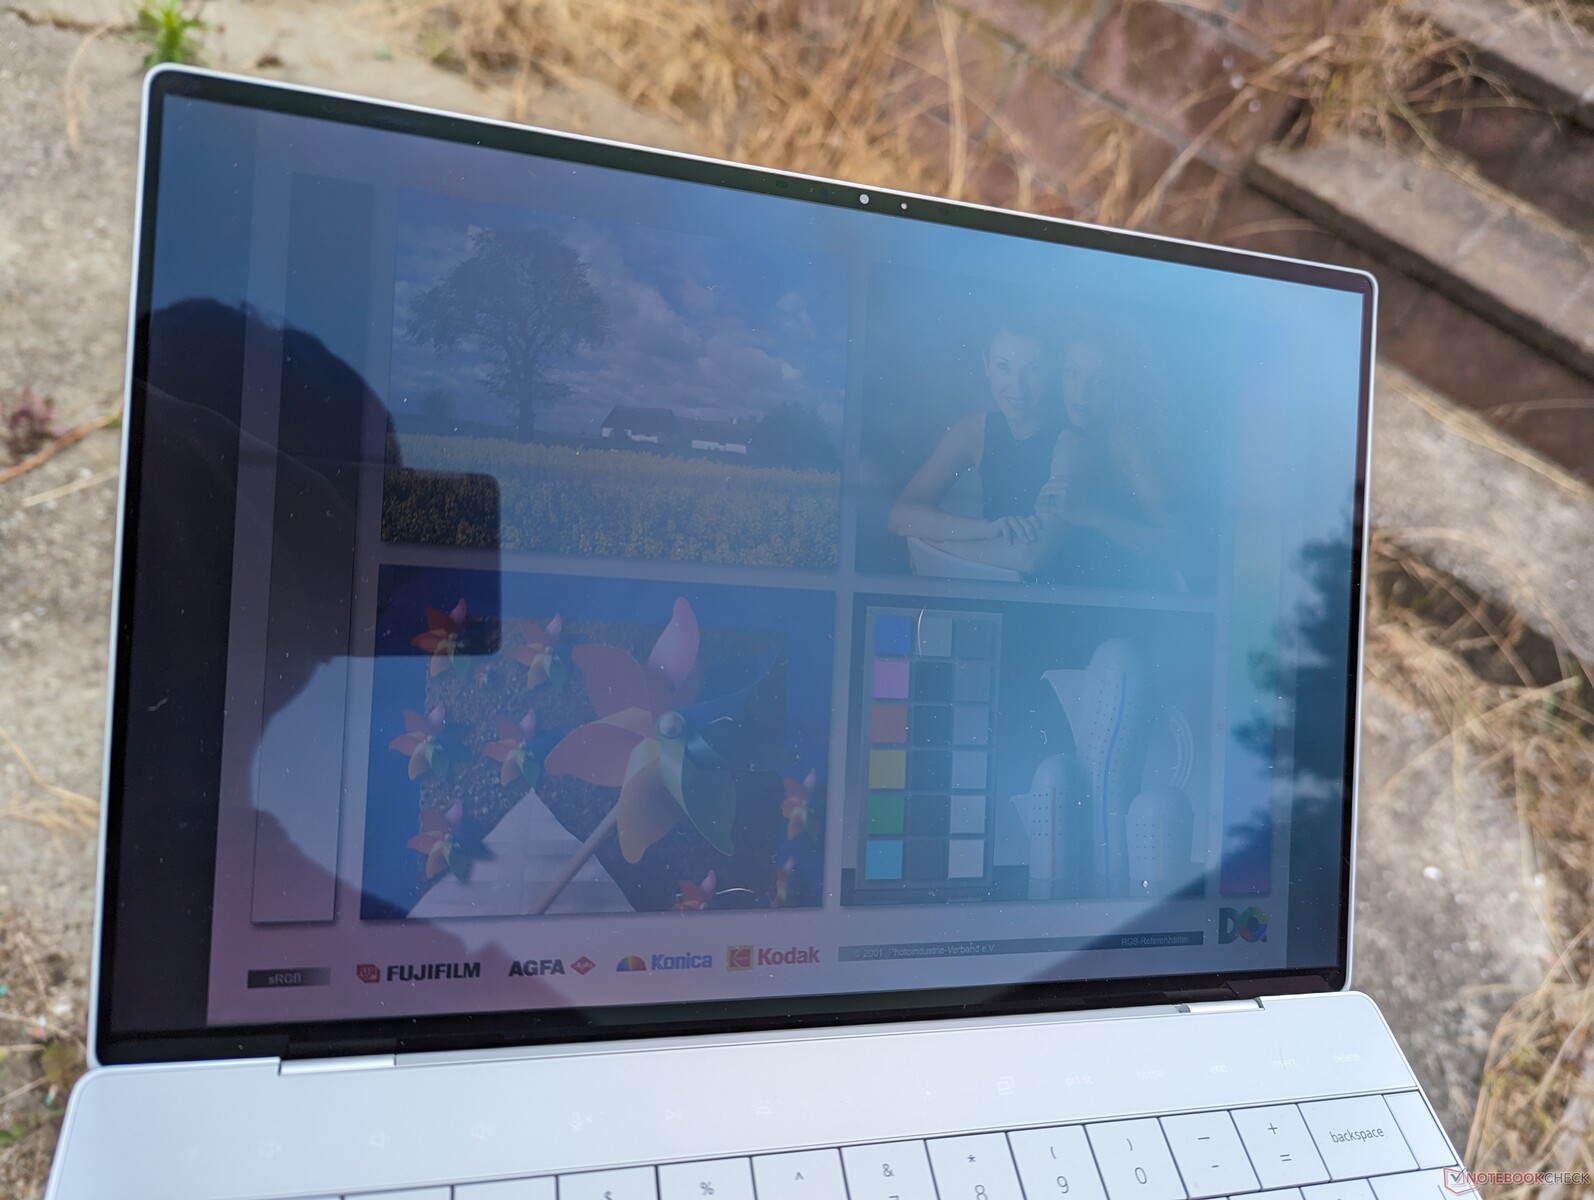
Tela
Quatro opções de tela estão disponíveis, como segue:
- 1920 x 1200, 60 Hz, IPS, sem toque, fosco, 500 nits
- 1920 x 1200, 60 Hz, IPS, sensível ao toque, fosco, 500 nits
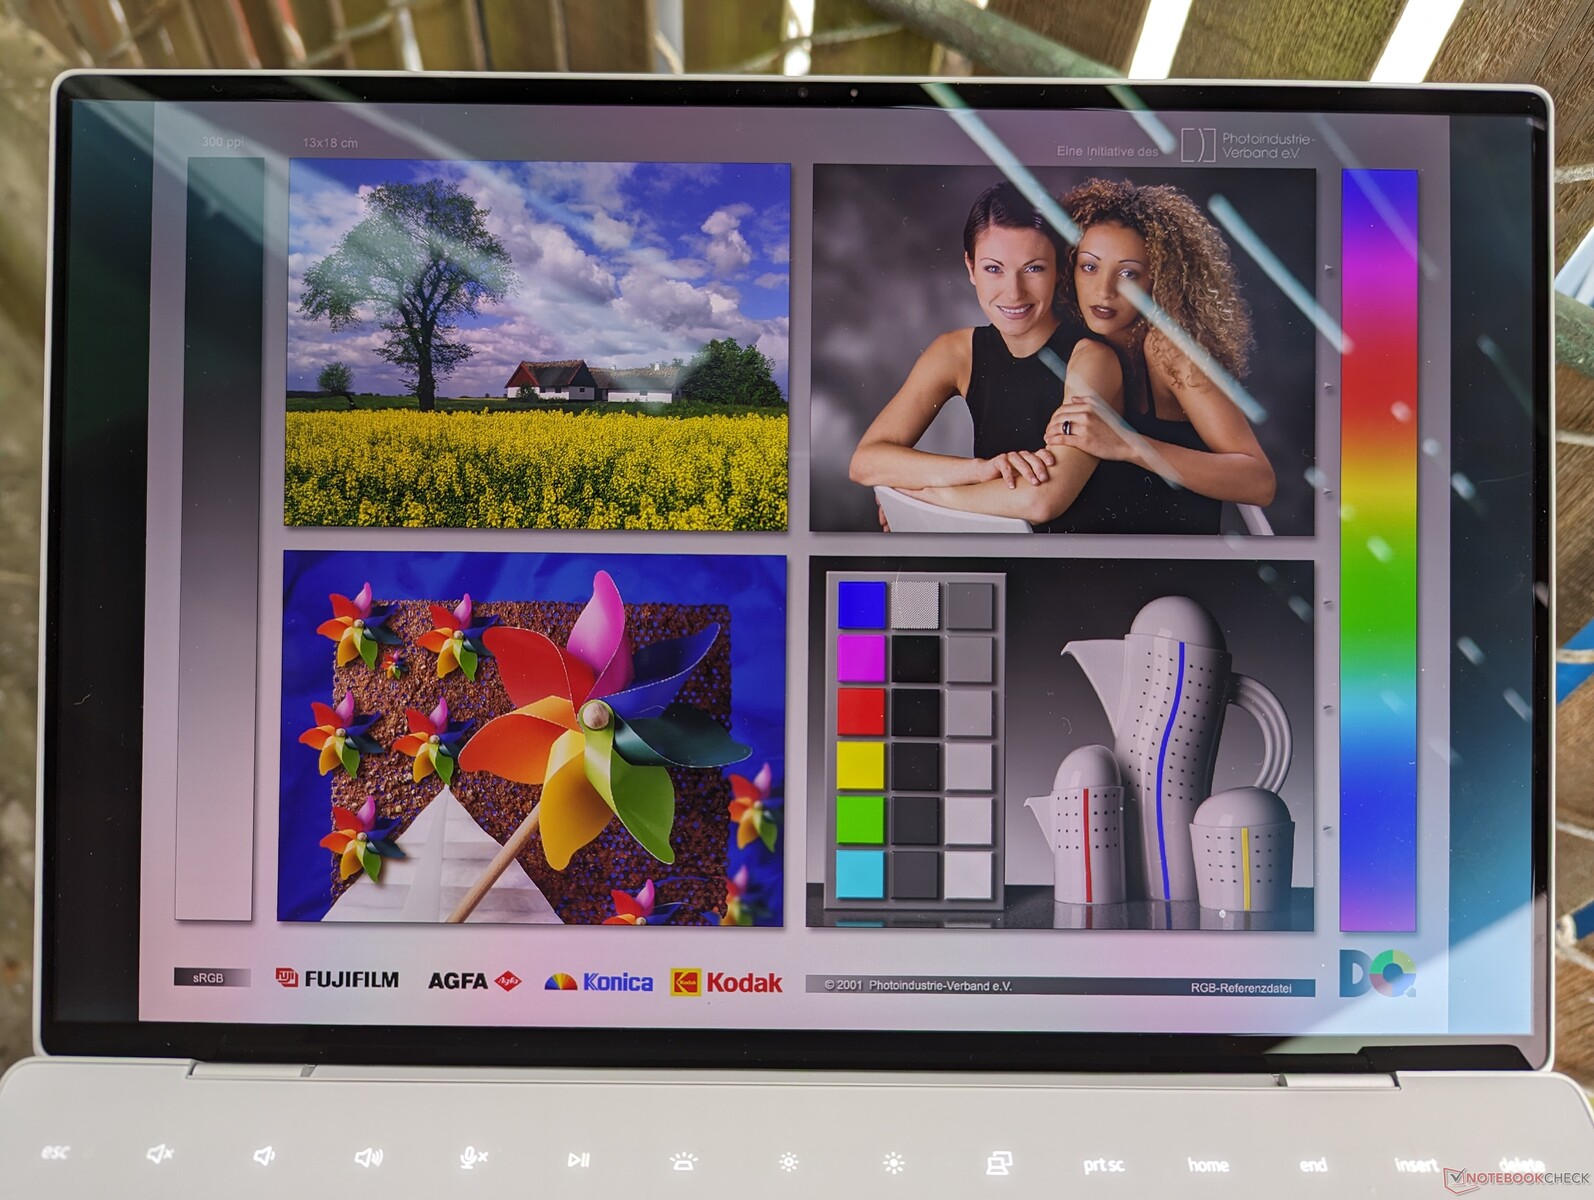
- 3456 x 2160, 60 Hz, OLED, sensível ao toque, brilhante, 400 nits
- 3840 x 2400, 60 Hz, IPS, toque, brilhante, 500 nits
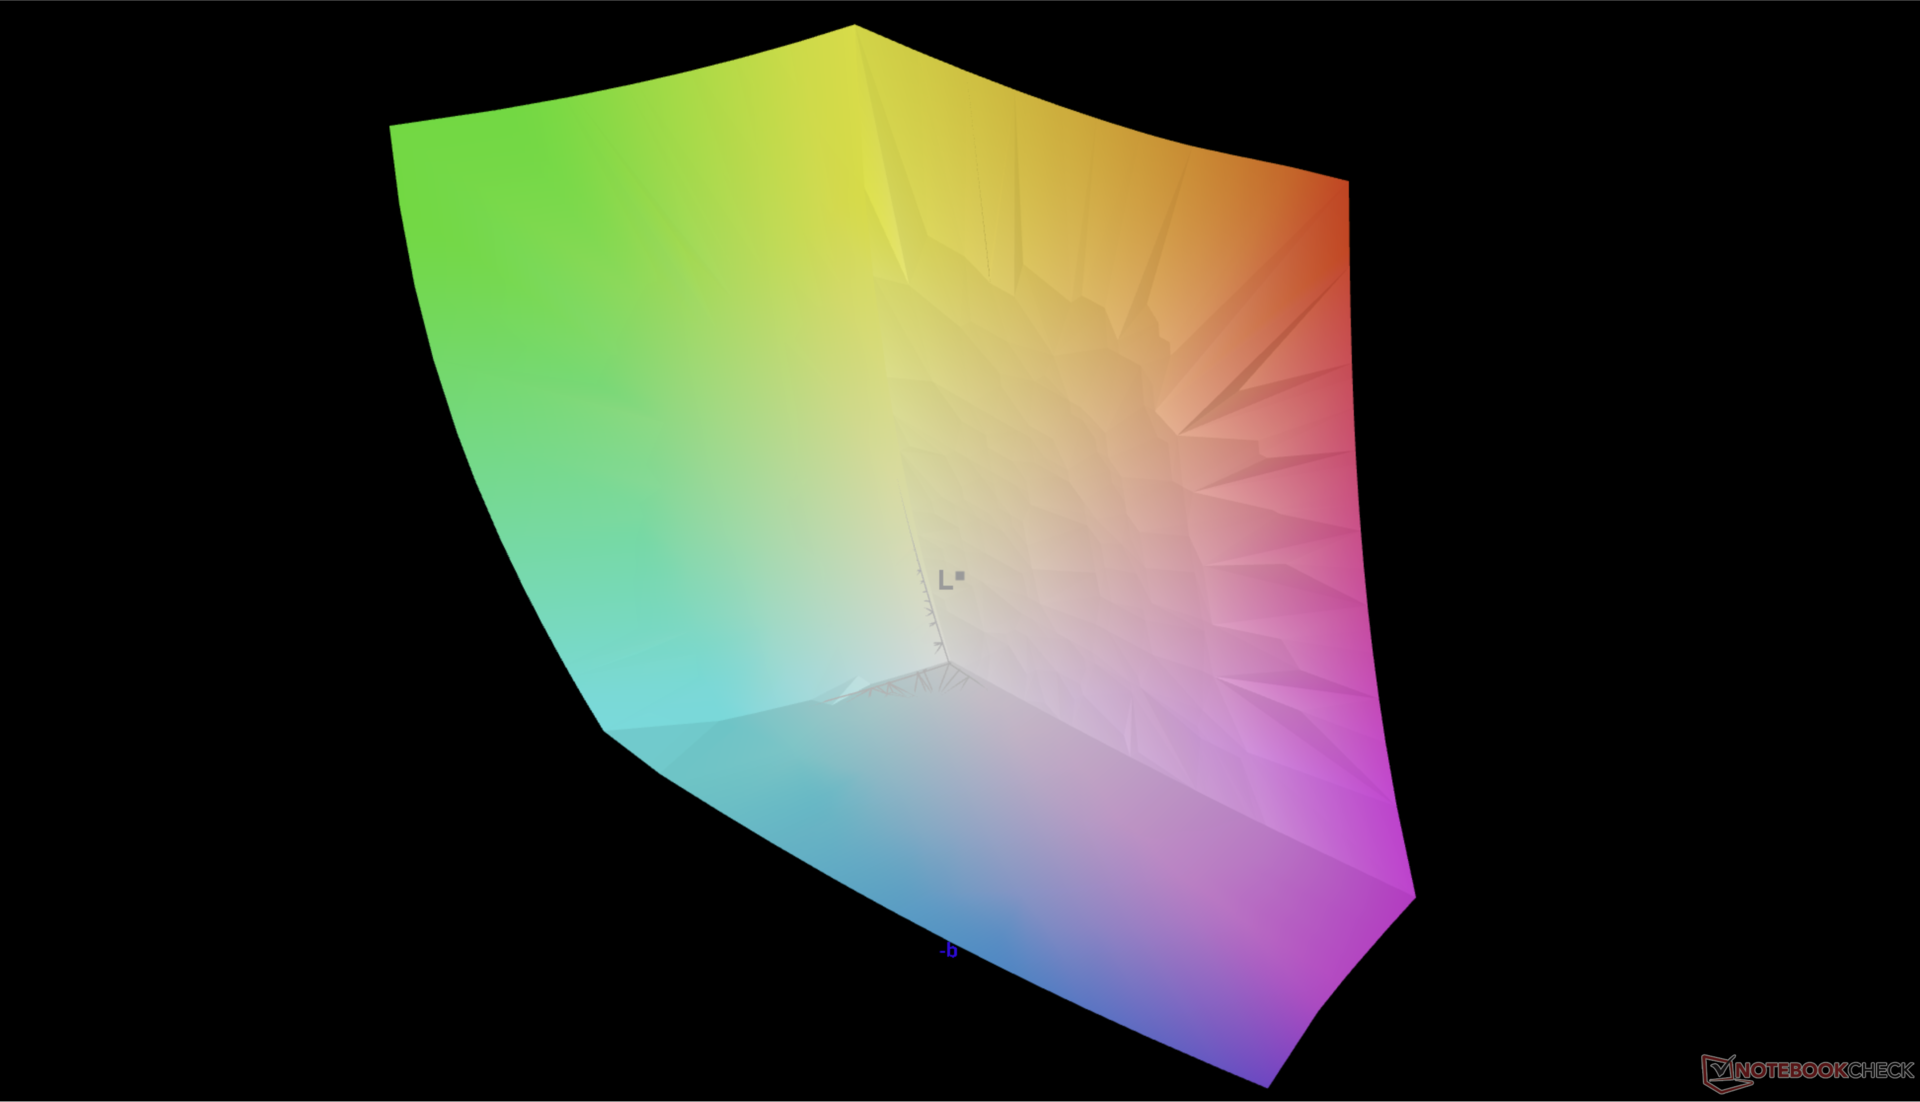
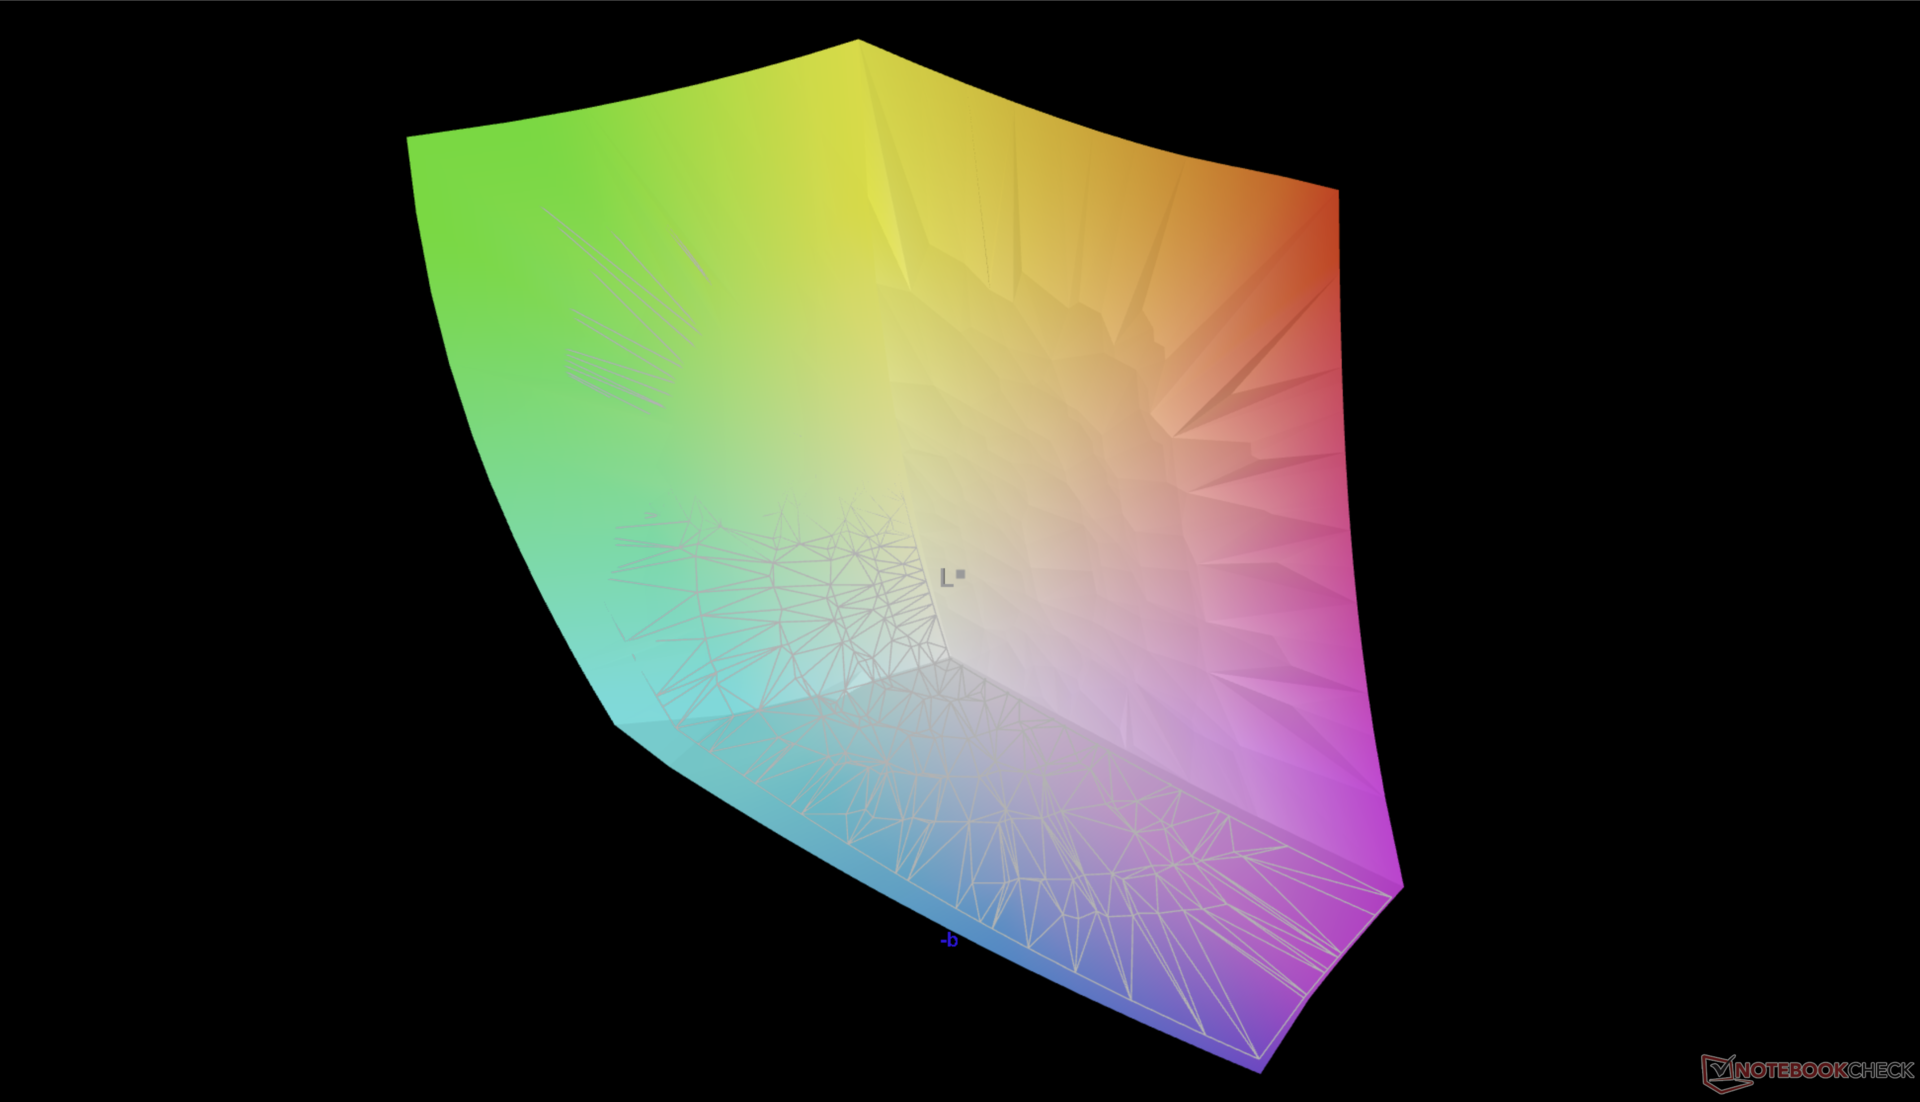
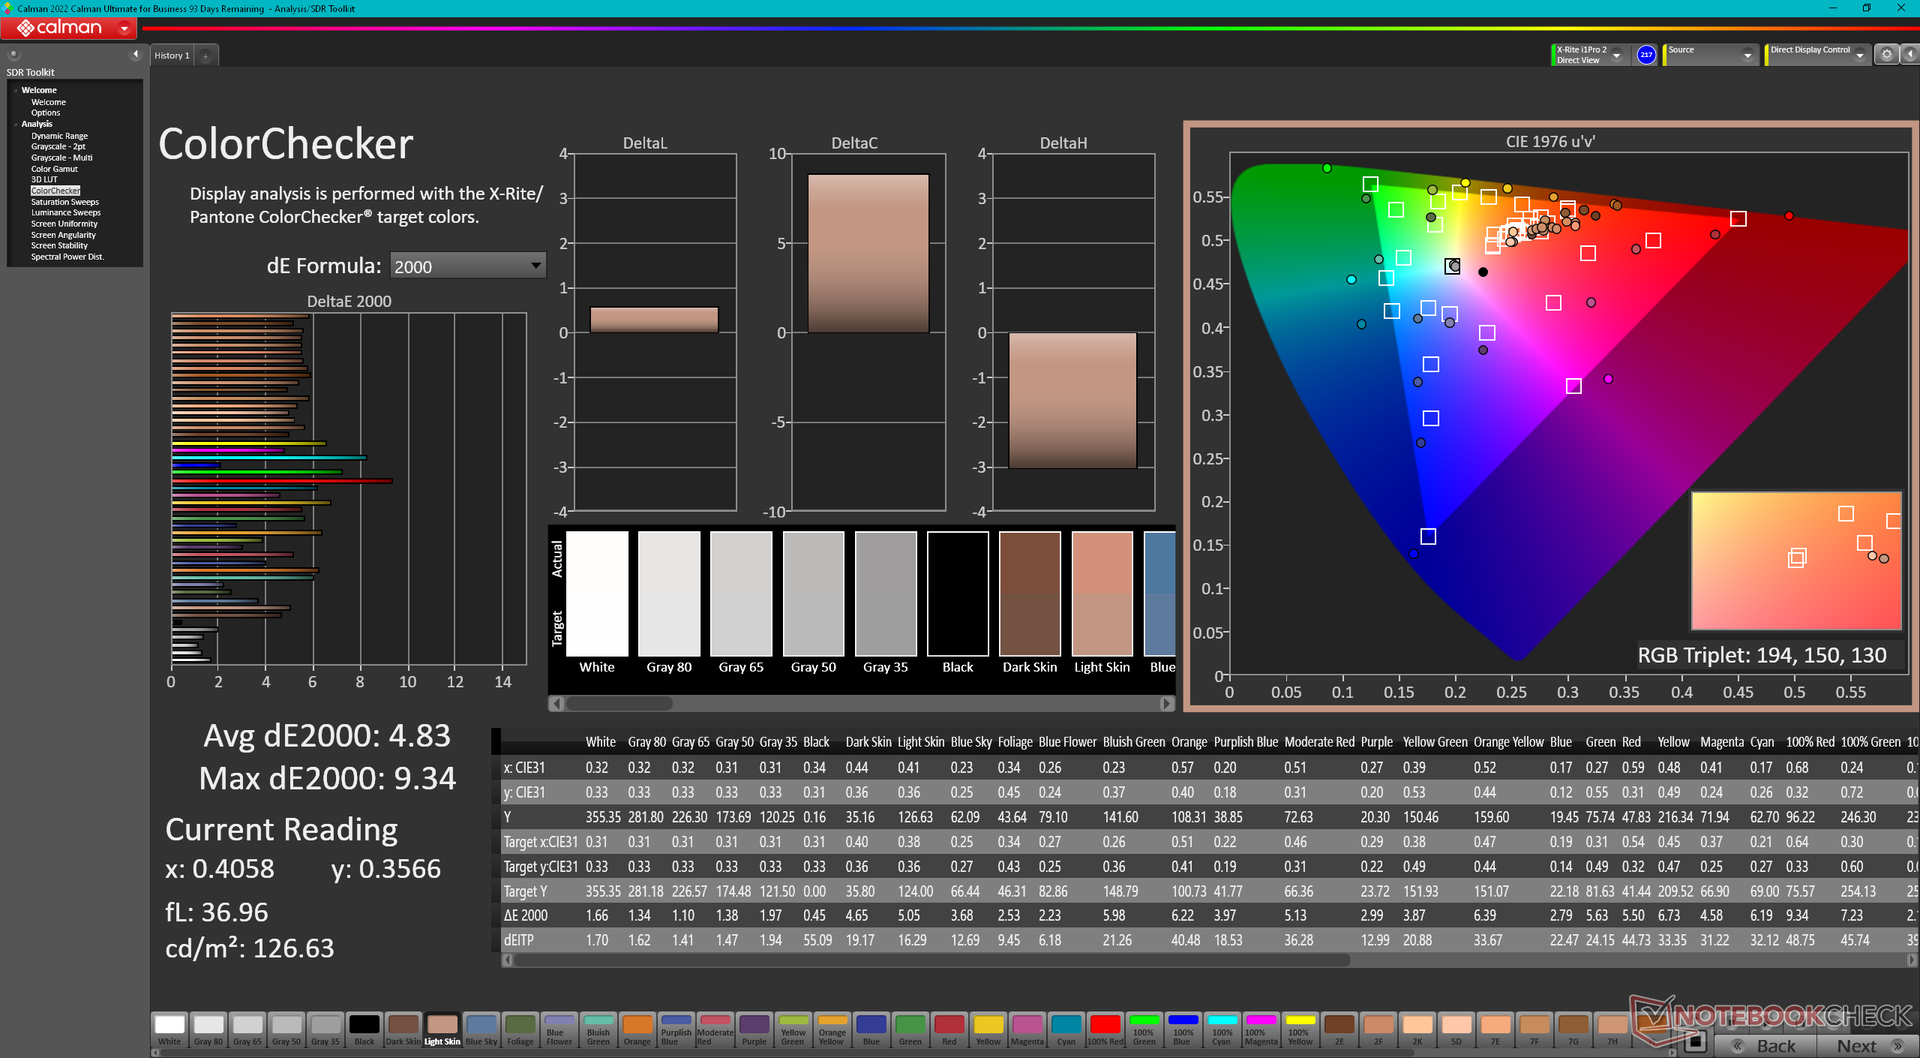
Nossa configuração OLED utiliza o mesmo painel Samsung 134XK04 encontrado no sKU OLED do ano passado do ano passado e, portanto, a experiência de visualização permanece idêntica. Os proprietários estão obtendo, no mínimo, 99% de cobertura sRGB, independentemente da opção selecionada, com base em nossas experiências com todos os três resolução opções.

| |||||||||||||||||||||||||
iluminação: 96 %
iluminação com acumulador: 361.7 cd/m²
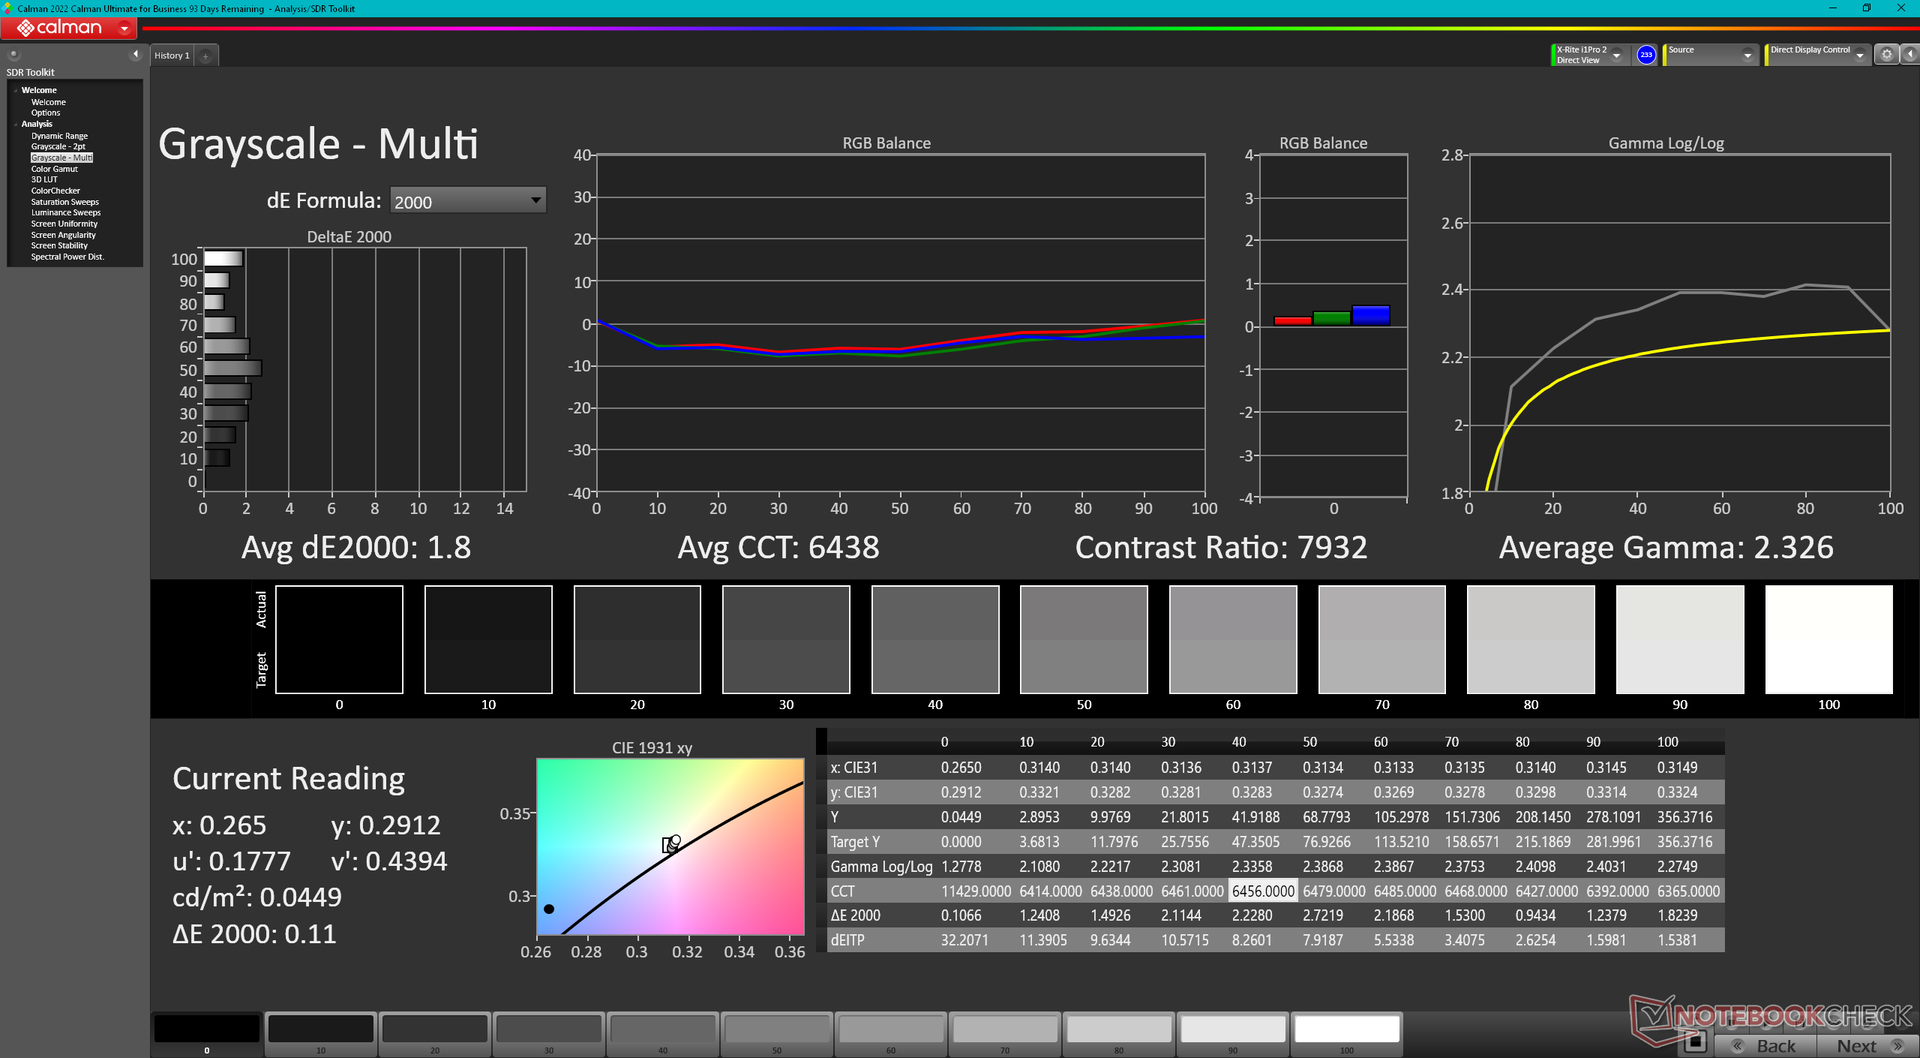
Contraste: ∞:1 (Preto: 0 cd/m²)
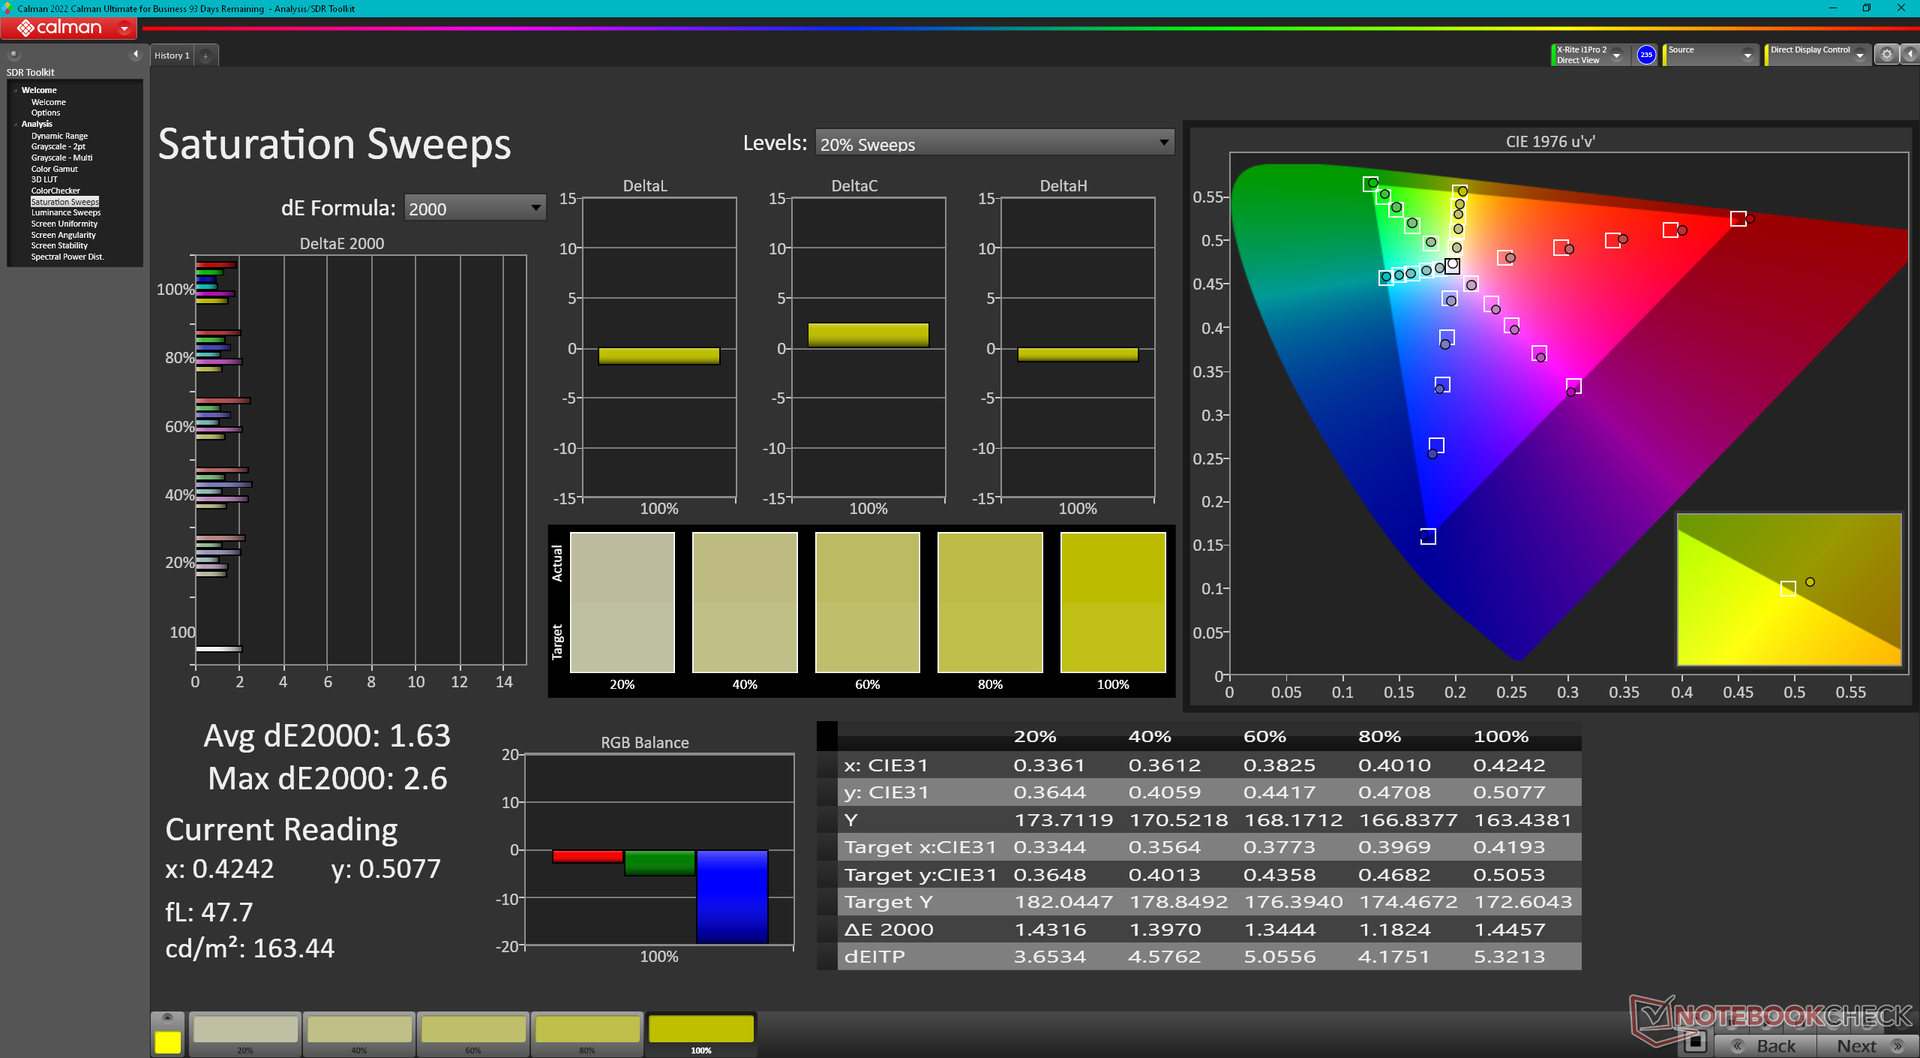
ΔE ColorChecker Calman: 4.83 | ∀{0.5-29.43 Ø4.71}
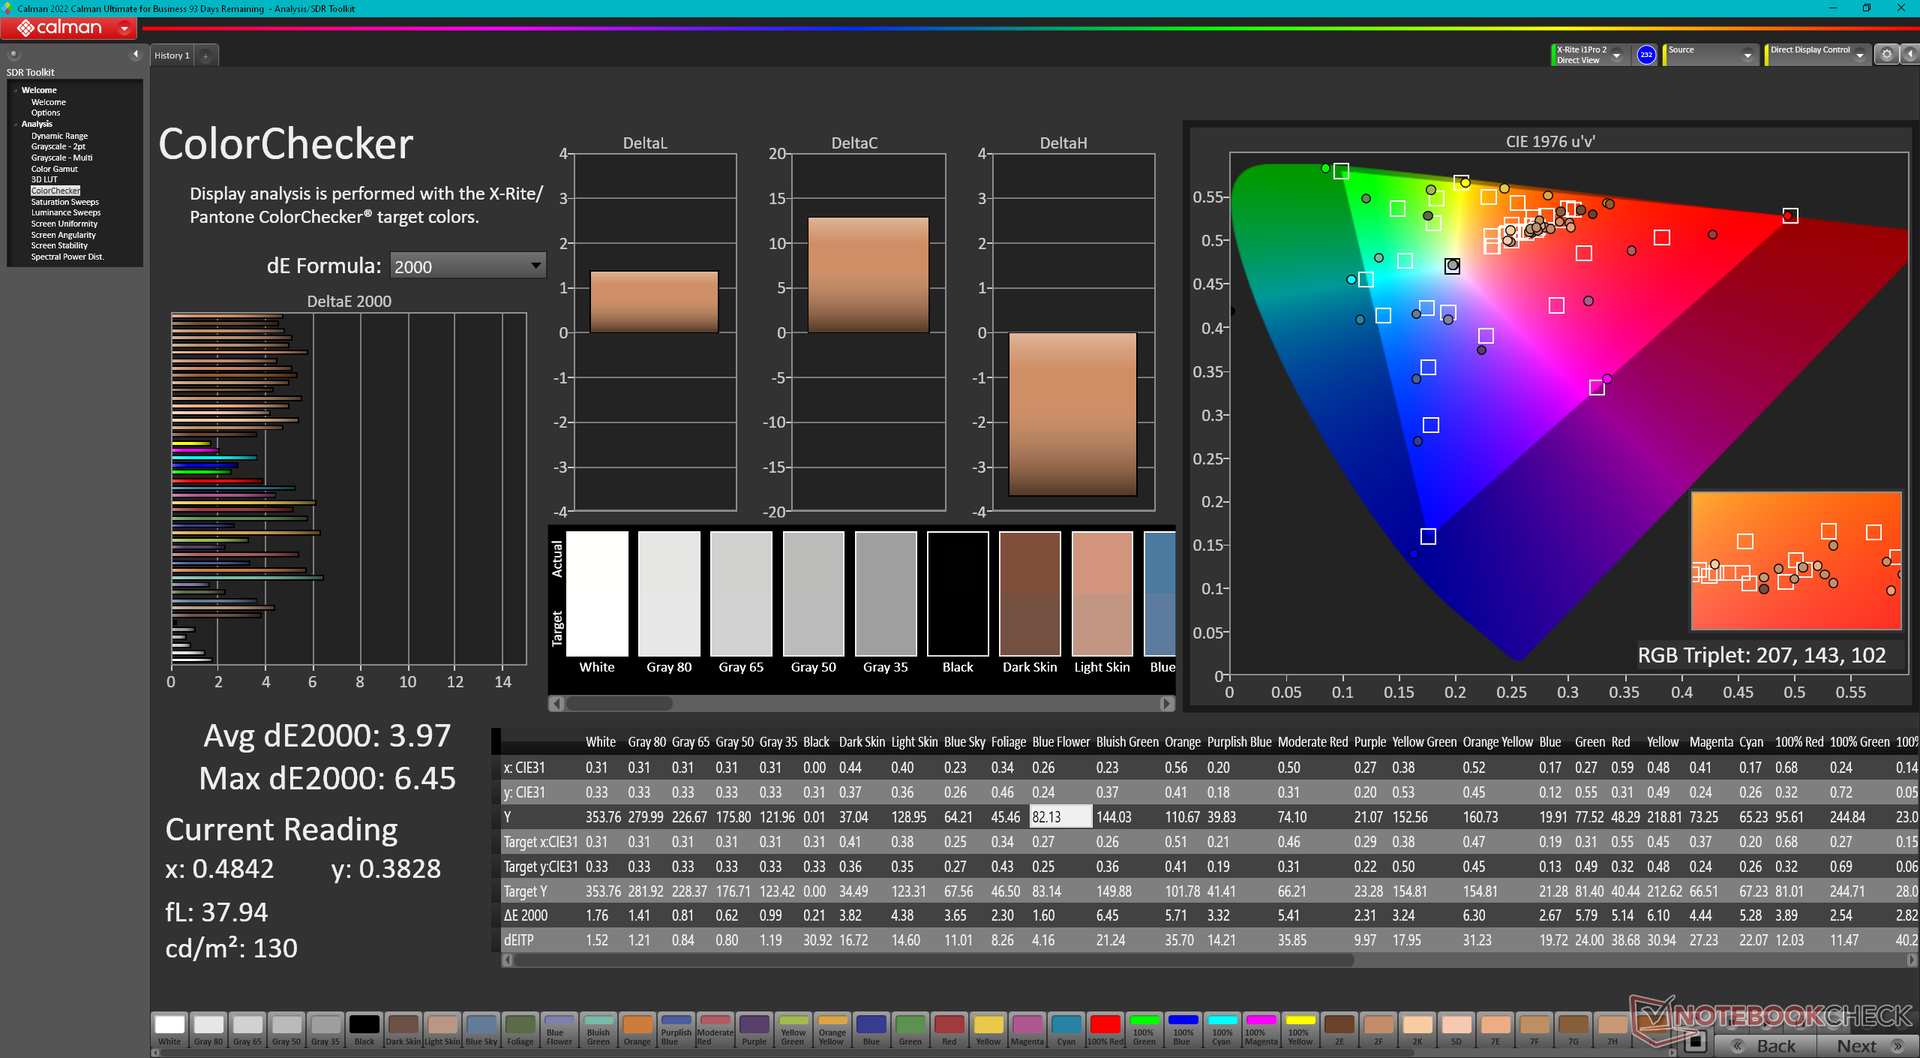
calibrated: 3.97
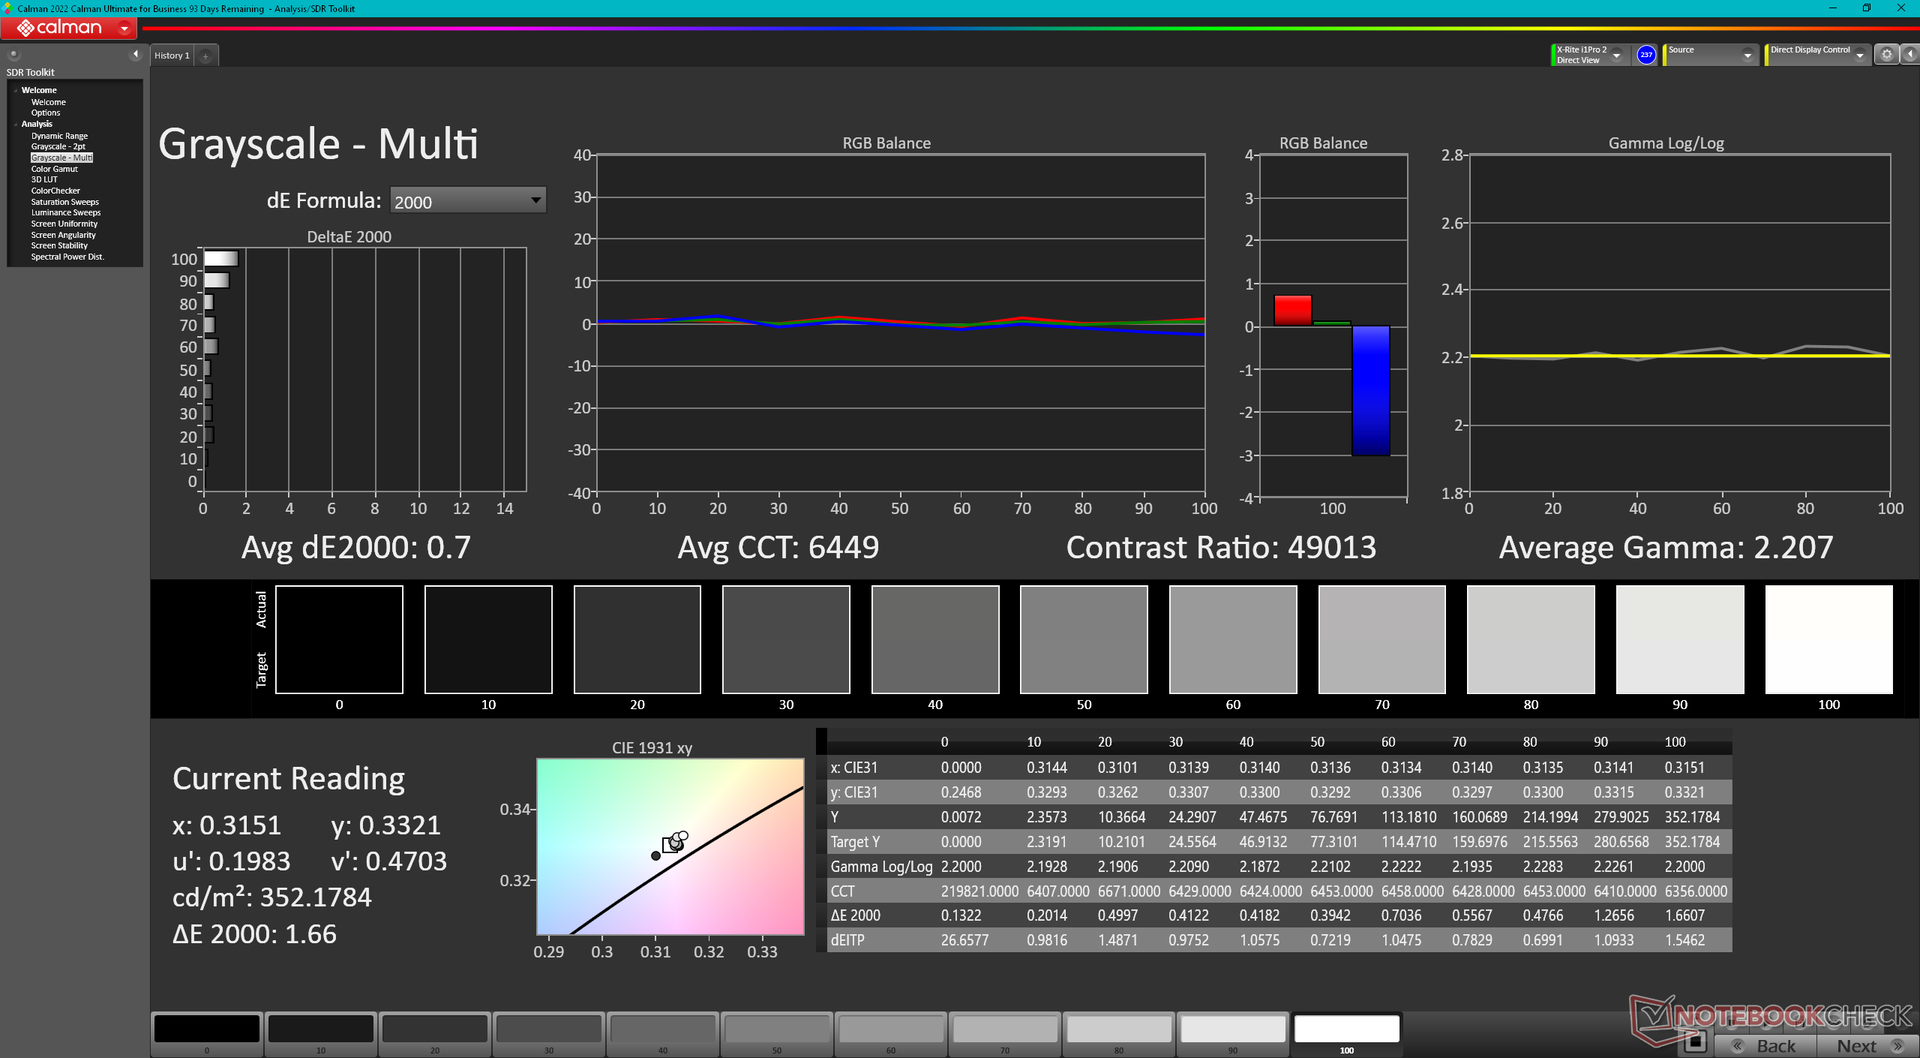
ΔE Greyscale Calman: 1.8 | ∀{0.09-98 Ø4.96}
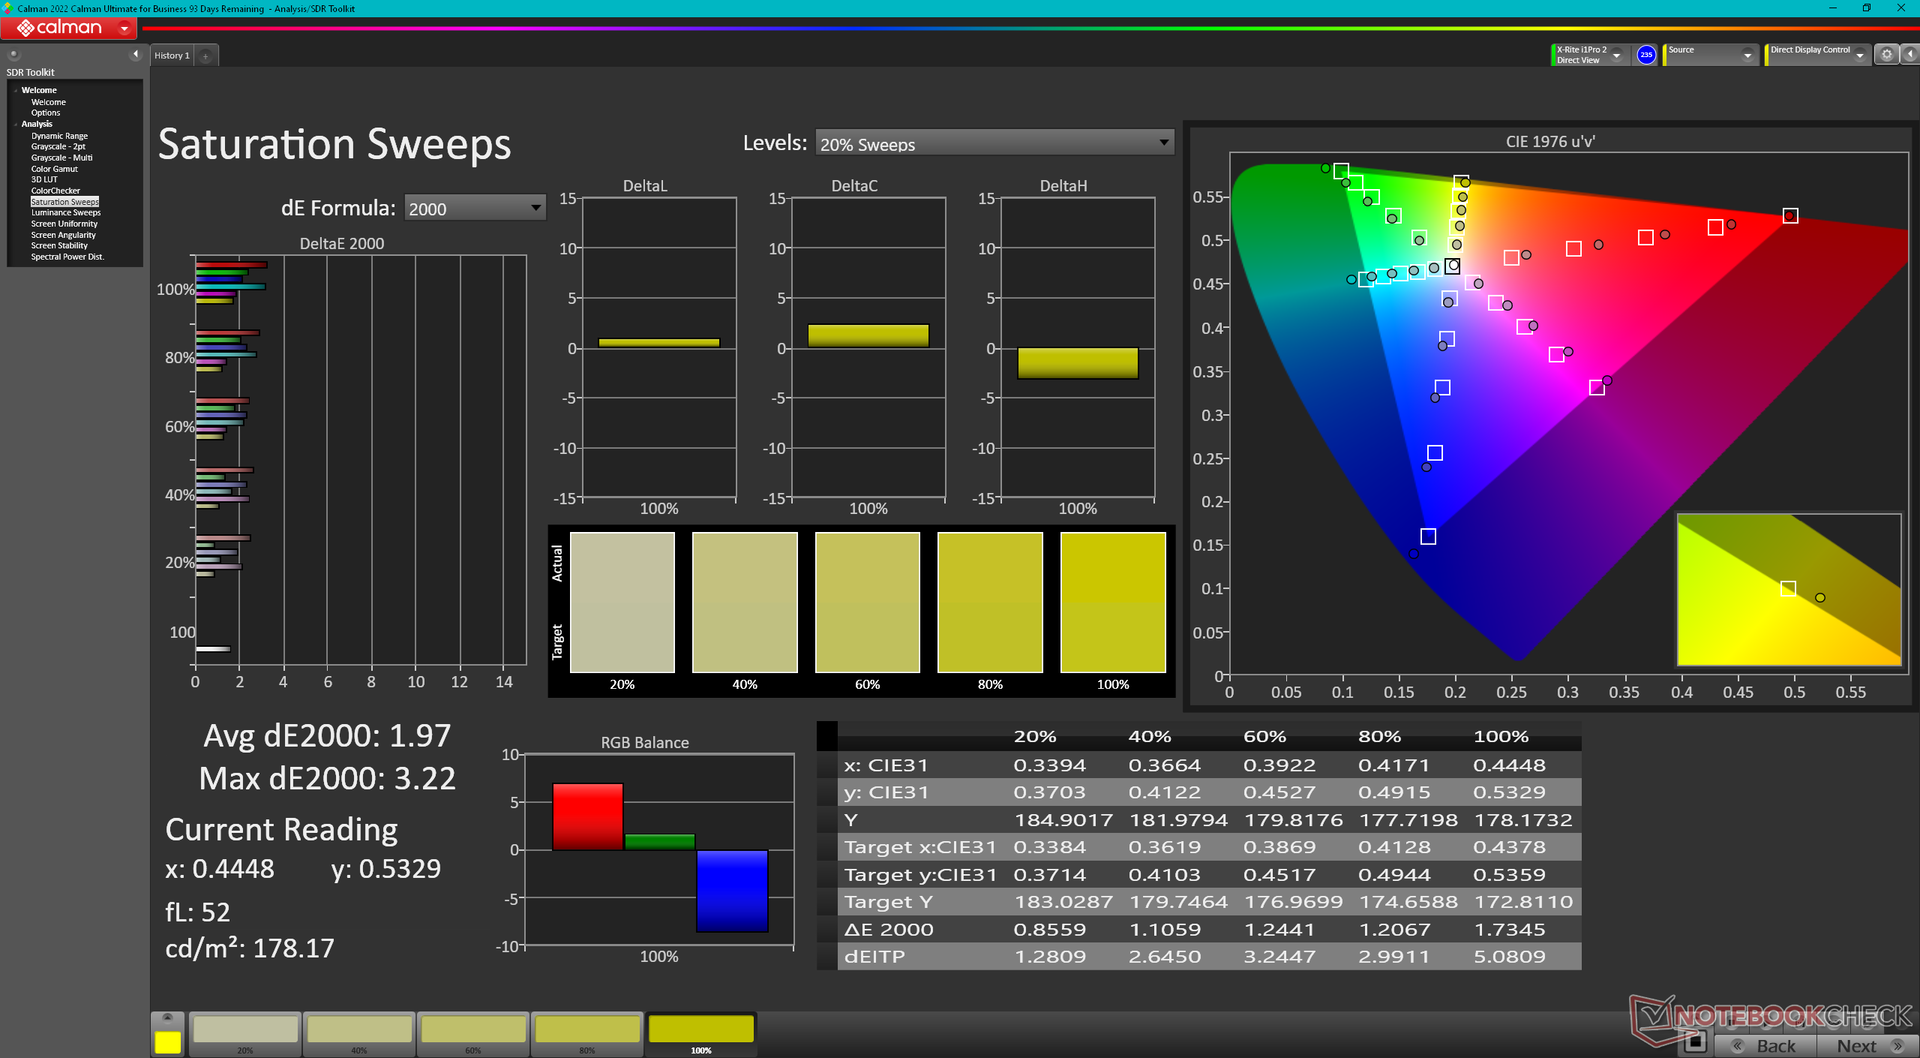
96.8% AdobeRGB 1998 (Argyll 3D)
100% sRGB (Argyll 3D)
99.7% Display P3 (Argyll 3D)
Gamma: 2.33
CCT: 6438 K
| Dell XPS 13 Plus 9320 Core i7-1360P Samsung 134XK04, OLED, 3456x2160, 13.4" | Dell XPS 13 Plus 9320 i7-1280P OLED Samsung 134XK04, OLED, 3456x2160, 13.4" | Dell XPS 13 7390 Core i7-10710U AU Optronics B133ZAN, Dell P/N: 90NTH, IPS, 3840x2160, 13.3" | Framework Laptop 13.5 13th Gen Intel BOE CQ NE135FBM-N41, IPS, 2256x1504, 13.5" | Lenovo ThinkPad X13 Yoga G3 21AW003UGE LP133WQ1-SPF2, IPS LED, 2560x1600, 13.3" | HP Spectre x360 13.5 14t-ef000 SDC4160, OLED, 3000x2000, 13.5" | |
|---|---|---|---|---|---|---|
| Display | 1% | -25% | -20% | -20% | -2% | |
| Display P3 Coverage (%) | 99.7 | 99.5 0% | 63.4 -36% | 68.9 -31% | 68 -32% | 99.9 0% |
| sRGB Coverage (%) | 100 | 100 0% | 93.7 -6% | 97.5 -2% | 98.6 -1% | 100 0% |
| AdobeRGB 1998 Coverage (%) | 96.8 | 98.4 2% | 64.3 -34% | 71.1 -27% | 69.5 -28% | 90.8 -6% |
| Response Times | -10% | -1891% | -1965% | -1617% | 5% | |
| Response Time Grey 50% / Grey 80% * (ms) | 2.18 ? | 2.6 ? -19% | 51.6 ? -2267% | 54.9 ? -2418% | 45.9 ? -2006% | 1.9 ? 13% |
| Response Time Black / White * (ms) | 2.08 ? | 2.1 ? -1% | 33.6 ? -1515% | 33.5 ? -1511% | 27.6 ? -1227% | 2.16 ? -4% |
| PWM Frequency (Hz) | 238.6 ? | 59.5 | 60.2 ? | |||
| Screen | 14% | -39% | 2% | 23% | 9% | |
| Brightness middle (cd/m²) | 361.7 | 371.8 3% | 408.2 13% | 503 39% | 438 21% | 351.7 -3% |
| Brightness (cd/m²) | 367 | 374 2% | 399 9% | 472 29% | 399 9% | 351 -4% |
| Brightness Distribution (%) | 96 | 98 2% | 89 -7% | 87 -9% | 84 -12% | 87 -9% |
| Black Level * (cd/m²) | 0.39 | 0.36 | 0.29 | |||
| Colorchecker dE 2000 * | 4.83 | 2.37 51% | 4.6 5% | 3.38 30% | 1.8 63% | 1.78 63% |
| Colorchecker dE 2000 max. * | 9.34 | 6.1 35% | 11.84 -27% | 7.08 24% | 4 57% | 6.14 34% |
| Colorchecker dE 2000 calibrated * | 3.97 | 2.03 49% | 1.21 70% | 0.8 80% | ||
| Greyscale dE 2000 * | 1.8 | 2 -11% | 7.5 -317% | 4.8 -167% | 2.8 -56% | 2.3 -28% |
| Gamma | 2.33 94% | 2.29 96% | 2.12 104% | 2.13 103% | 2.24 98% | 2.11 104% |
| CCT | 6438 101% | 6261 104% | 7966 82% | 6235 104% | 6785 96% | 6683 97% |
| Contrast (:1) | 1047 | 1397 | 1510 | |||
| Color Space (Percent of AdobeRGB 1998) (%) | 59.5 | |||||
| Color Space (Percent of sRGB) (%) | 93.5 | |||||
| Média Total (Programa/Configurações) | 2% /
6% | -652% /
-344% | -661% /
-331% | -538% /
-261% | 4% /
5% |
* ... menor é melhor
Exibir tempos de resposta
| ↔ Tempo de resposta preto para branco | ||
|---|---|---|
| 2.08 ms ... ascensão ↗ e queda ↘ combinadas | ↗ 0.98 ms ascensão | 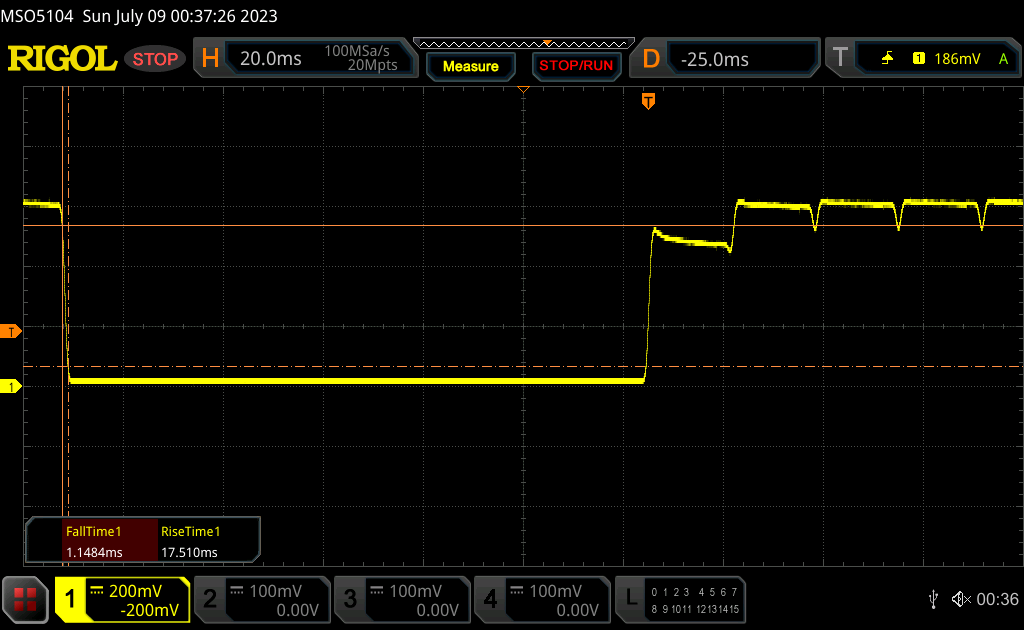 |
| ↘ 1.1 ms queda | ||
| A tela mostra taxas de resposta muito rápidas em nossos testes e deve ser muito adequada para jogos em ritmo acelerado. Em comparação, todos os dispositivos testados variam de 0.1 (mínimo) a 240 (máximo) ms. » 12 % de todos os dispositivos são melhores. Isso significa que o tempo de resposta medido é melhor que a média de todos os dispositivos testados (19.8 ms). | ||
| ↔ Tempo de resposta 50% cinza a 80% cinza | ||
| 2.18 ms ... ascensão ↗ e queda ↘ combinadas | ↗ 1.2 ms ascensão | 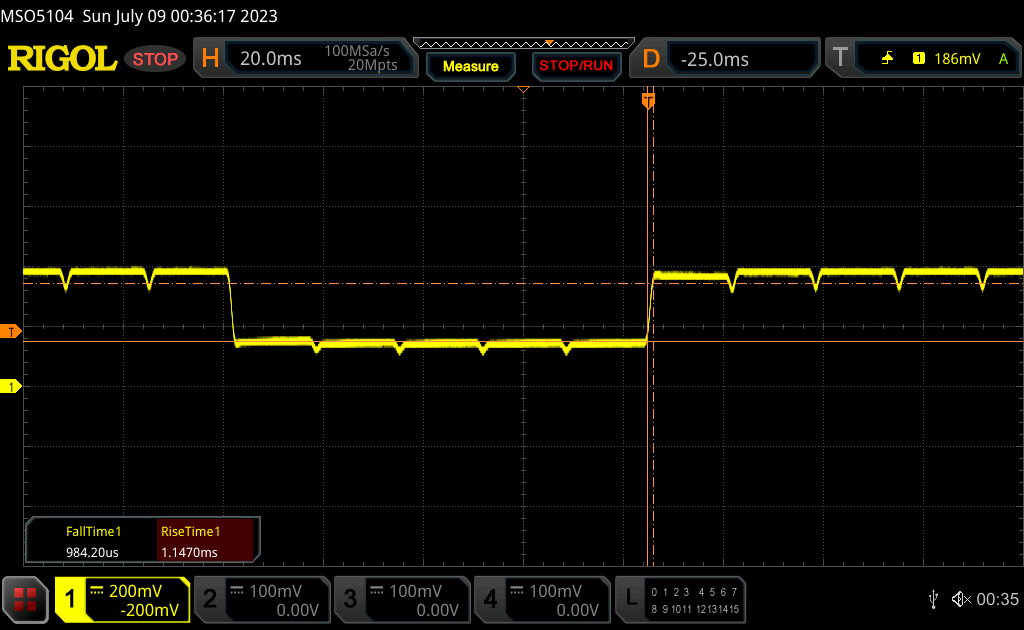 |
| ↘ 0.98 ms queda | ||
| A tela mostra taxas de resposta muito rápidas em nossos testes e deve ser muito adequada para jogos em ritmo acelerado. Em comparação, todos os dispositivos testados variam de 0.165 (mínimo) a 636 (máximo) ms. » 11 % de todos os dispositivos são melhores. Isso significa que o tempo de resposta medido é melhor que a média de todos os dispositivos testados (31 ms). | ||
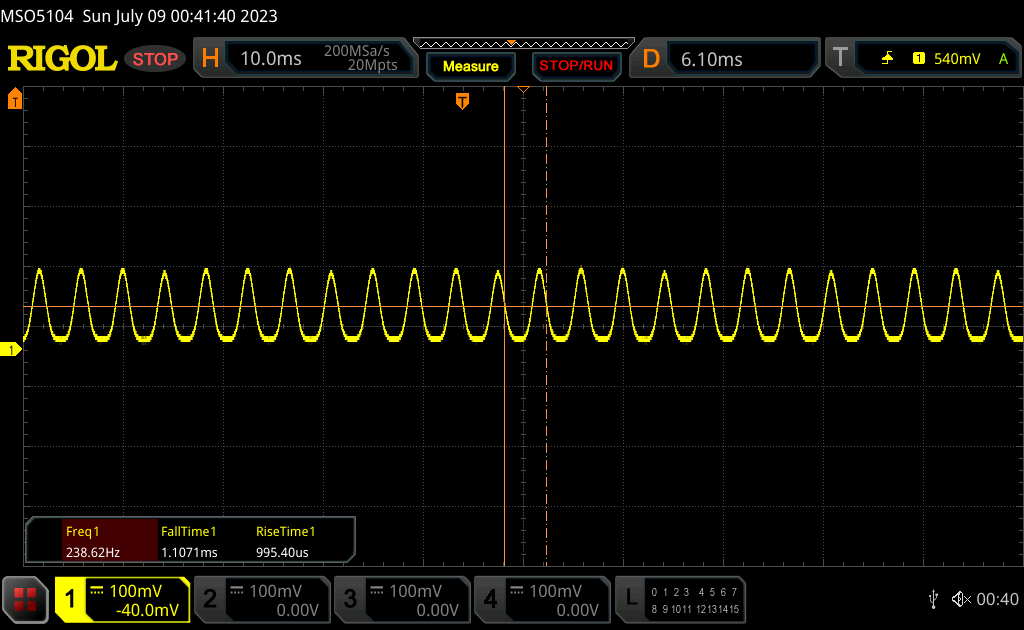
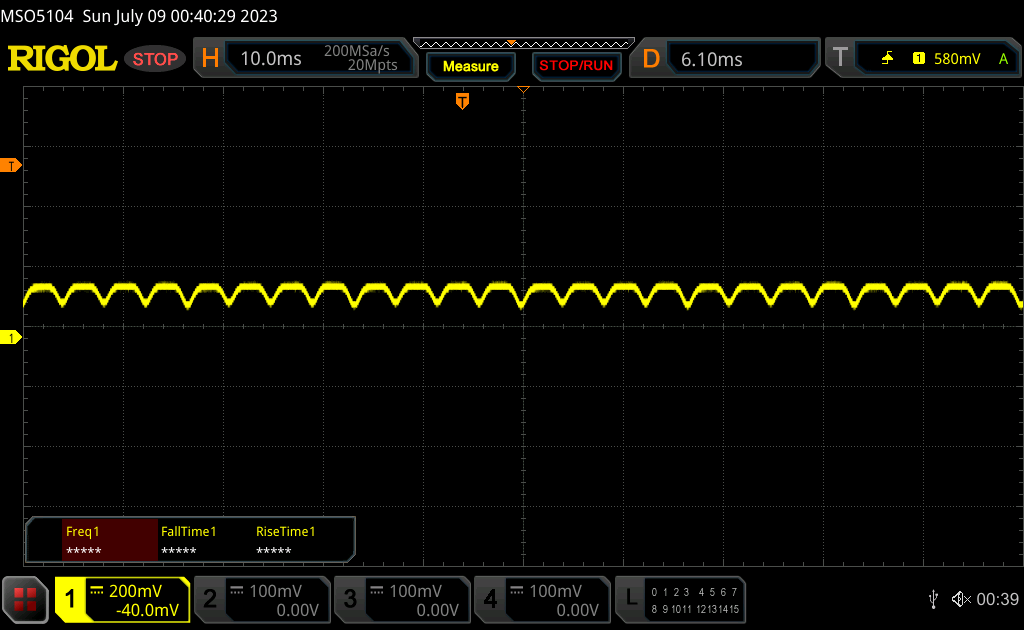
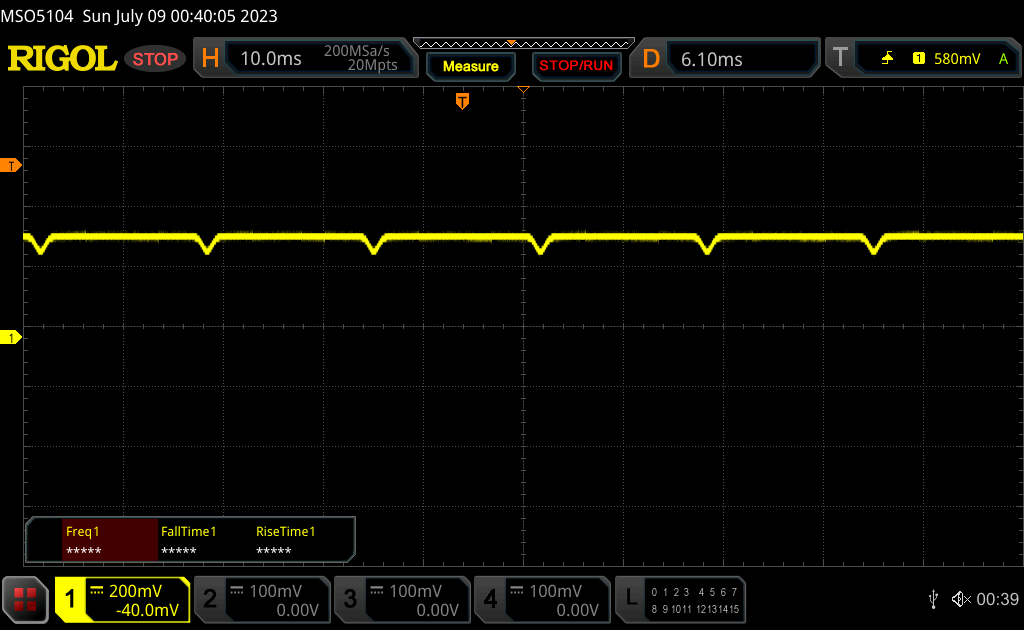
Cintilação da tela / PWM (modulação por largura de pulso)
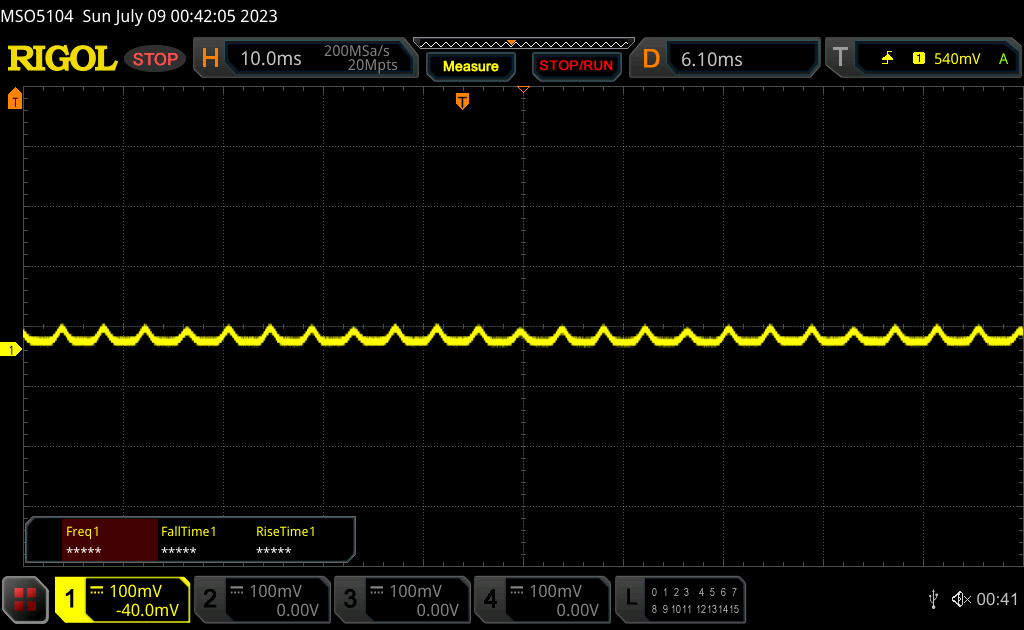
| Tela tremeluzindo/PWM detectado | 238.6 Hz | ≤ 100 % configuração de brilho | 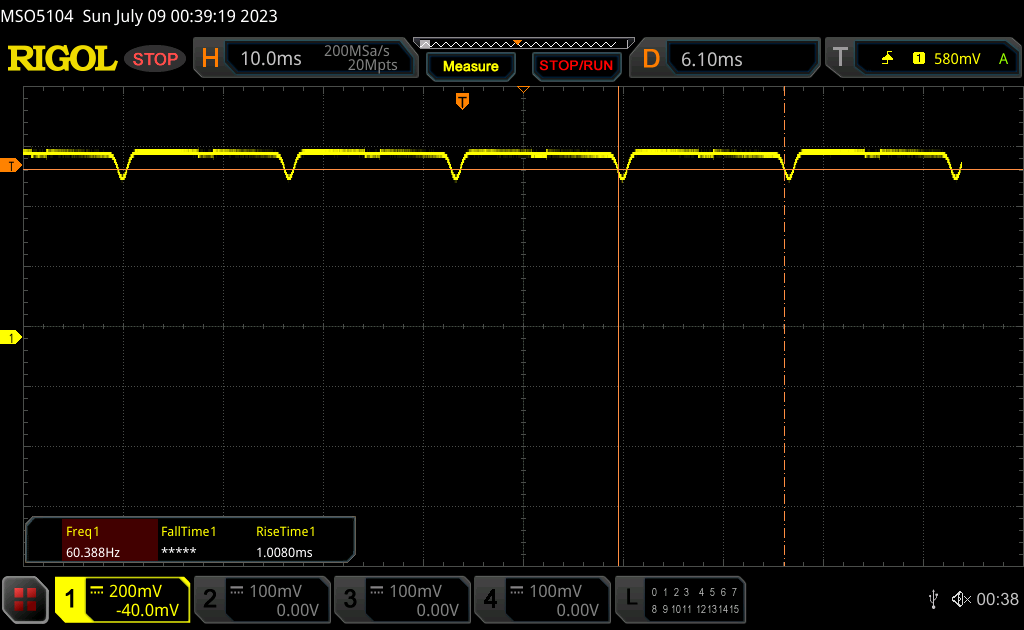 |
A luz de fundo da tela pisca em 238.6 Hz (pior caso, por exemplo, utilizando PWM) Cintilação detectada em uma configuração de brilho de 100 % e abaixo. Não deve haver cintilação ou PWM acima desta configuração de brilho. A frequência de 238.6 Hz é relativamente baixa, portanto, usuários sensíveis provavelmente notarão cintilação e sentirão fadiga ocular na configuração de brilho indicada e abaixo. [pwm_comparison] Em comparação: 52 % de todos os dispositivos testados não usam PWM para escurecer a tela. Se PWM foi detectado, uma média de 7757 (mínimo: 5 - máximo: 343500) Hz foi medida. | |||
A modulação de largura de pulso ou cintilação ainda está presente na maioria dos níveis de brilho. Conseguimos detectar uma frequência de 238,6 Hz de 0% a 52% de brilho e 60 Hz de 53% de brilho ao máximo. Não se espera que as opções alternativas de IPS apresentem cintilação ou PWM.

Desempenho
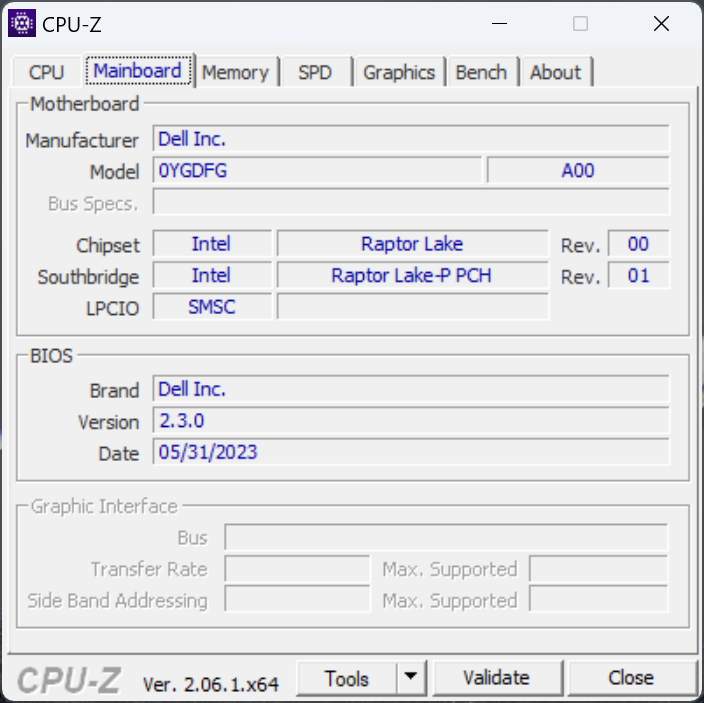
Condições de teste
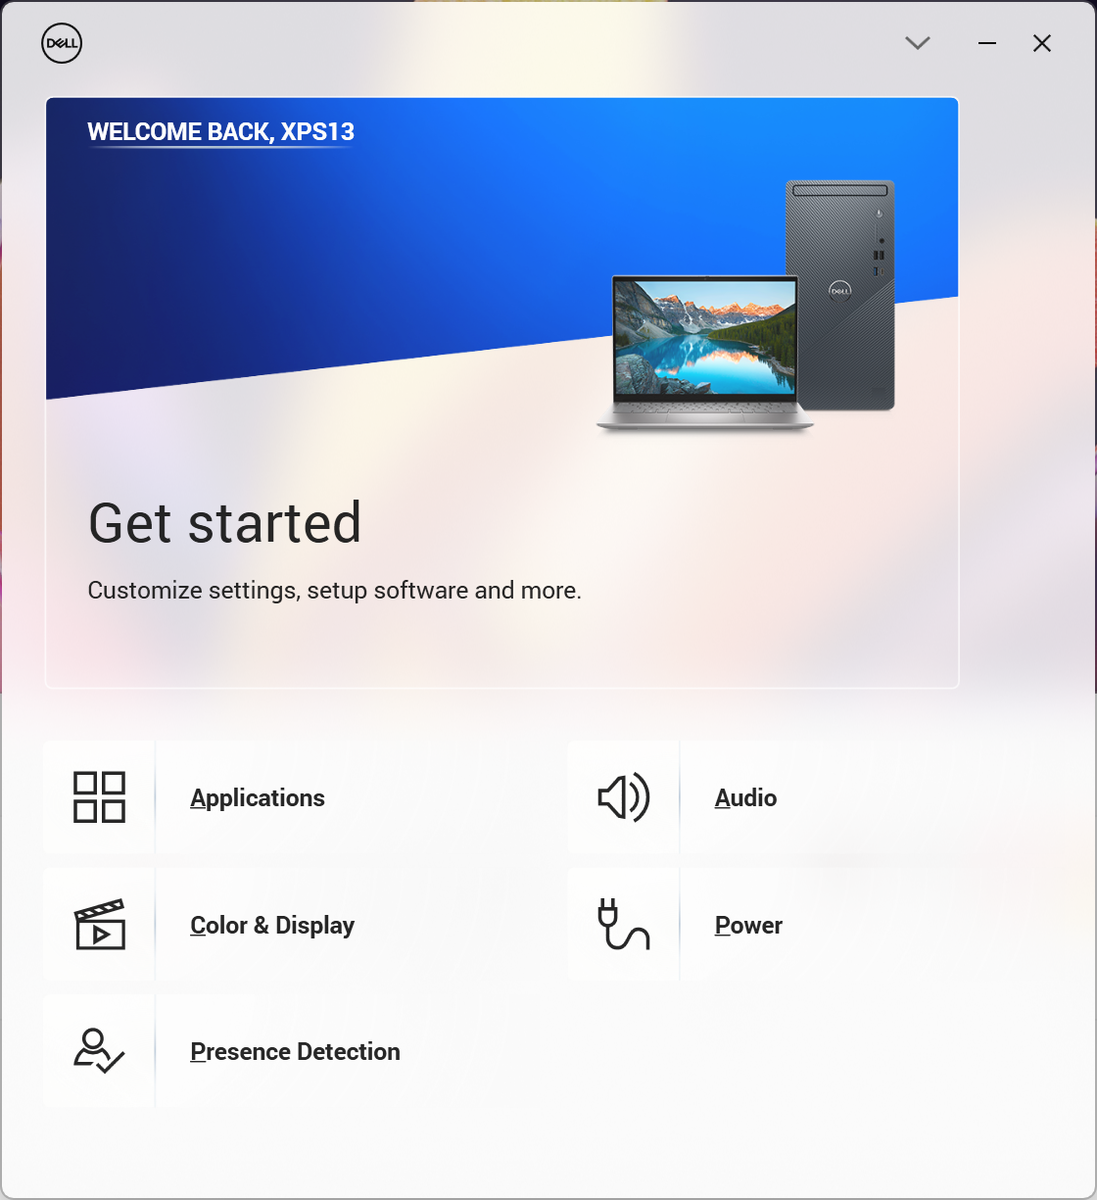
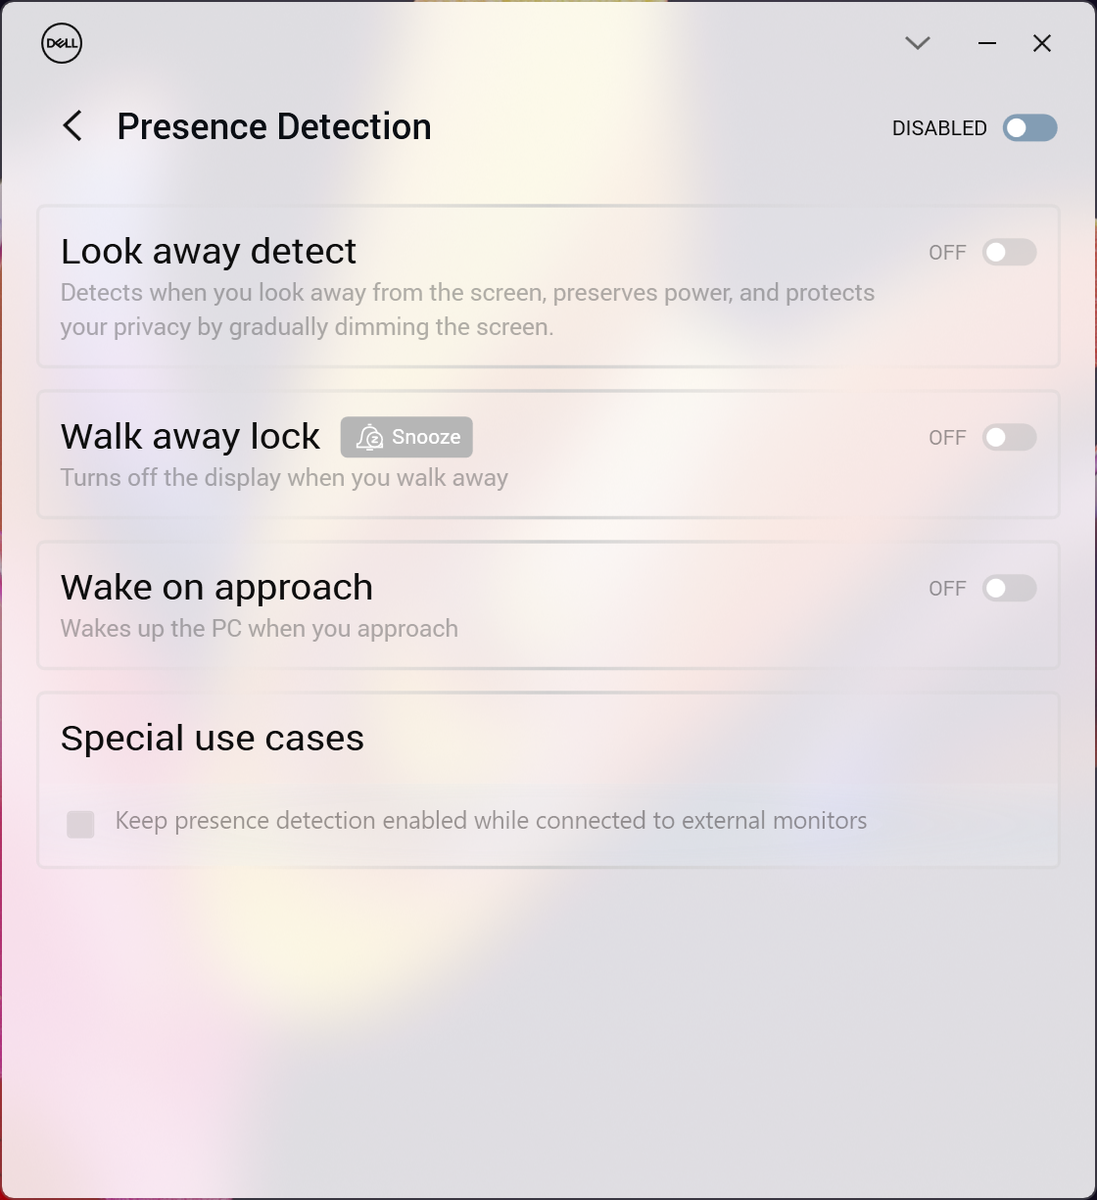
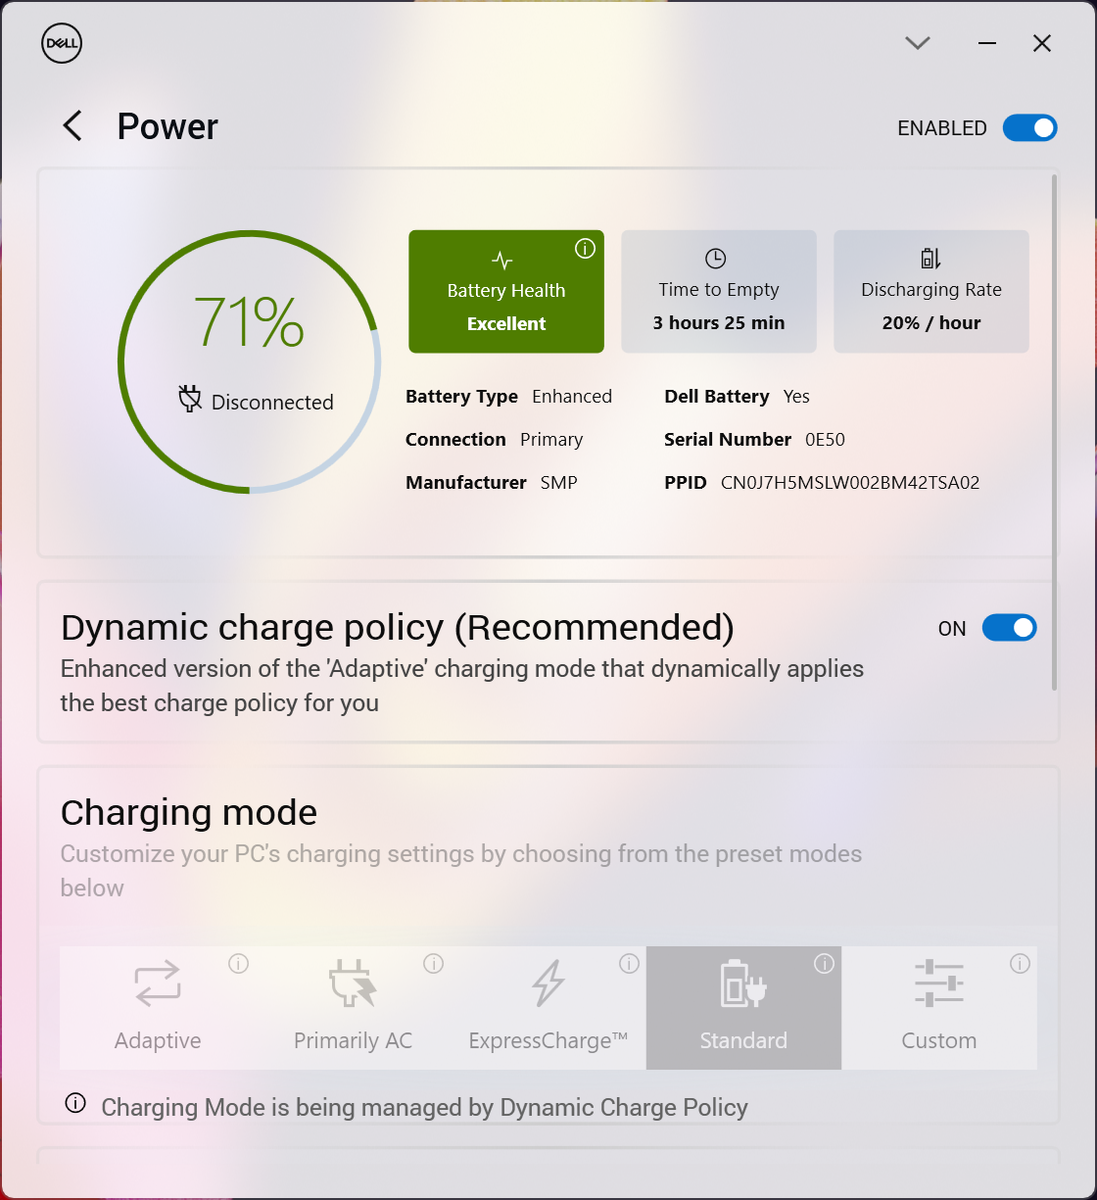
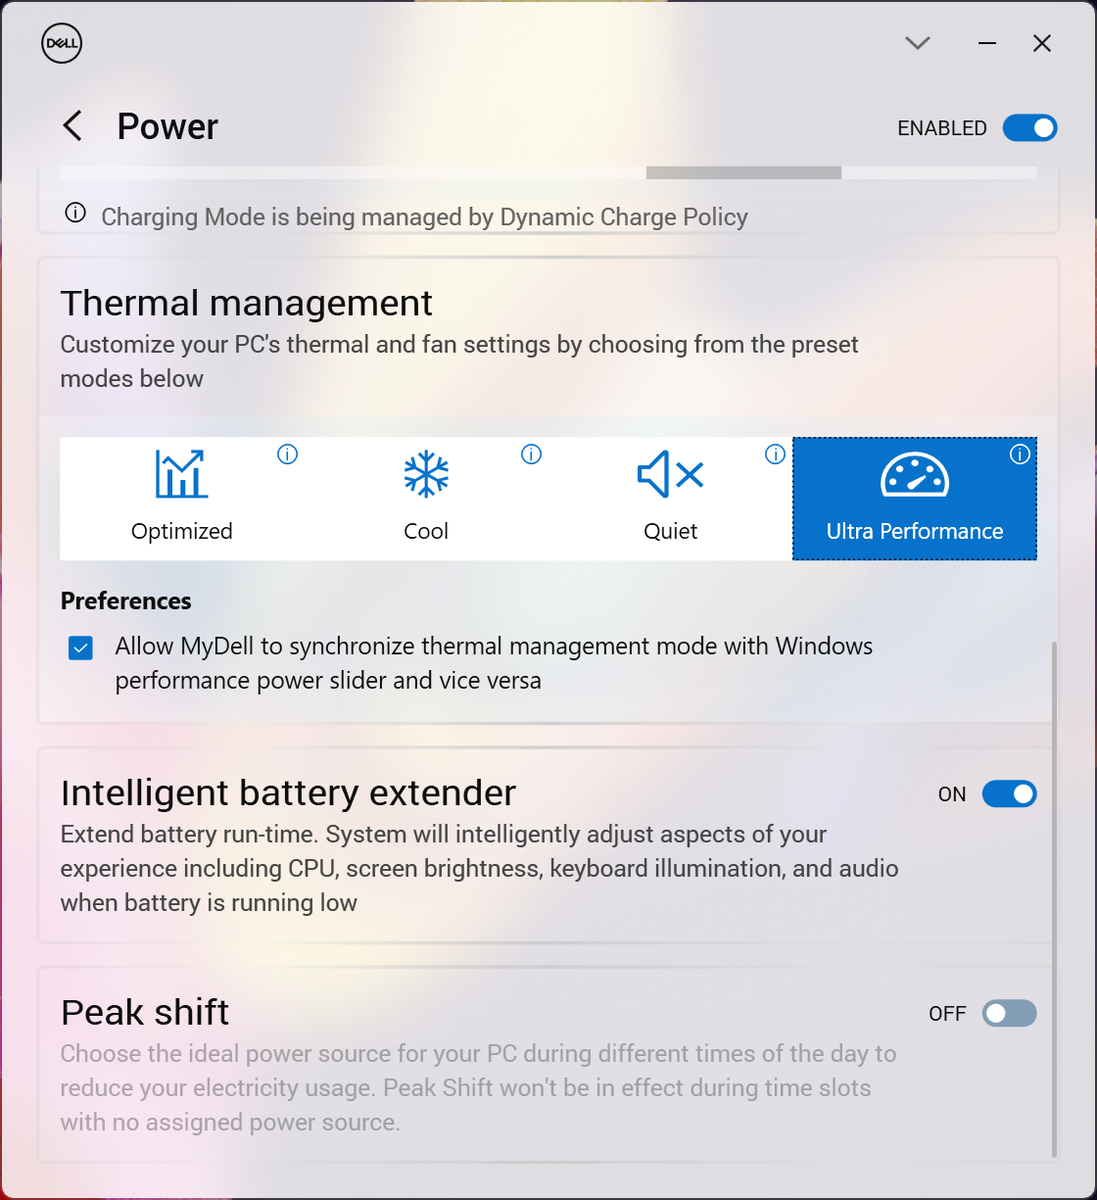
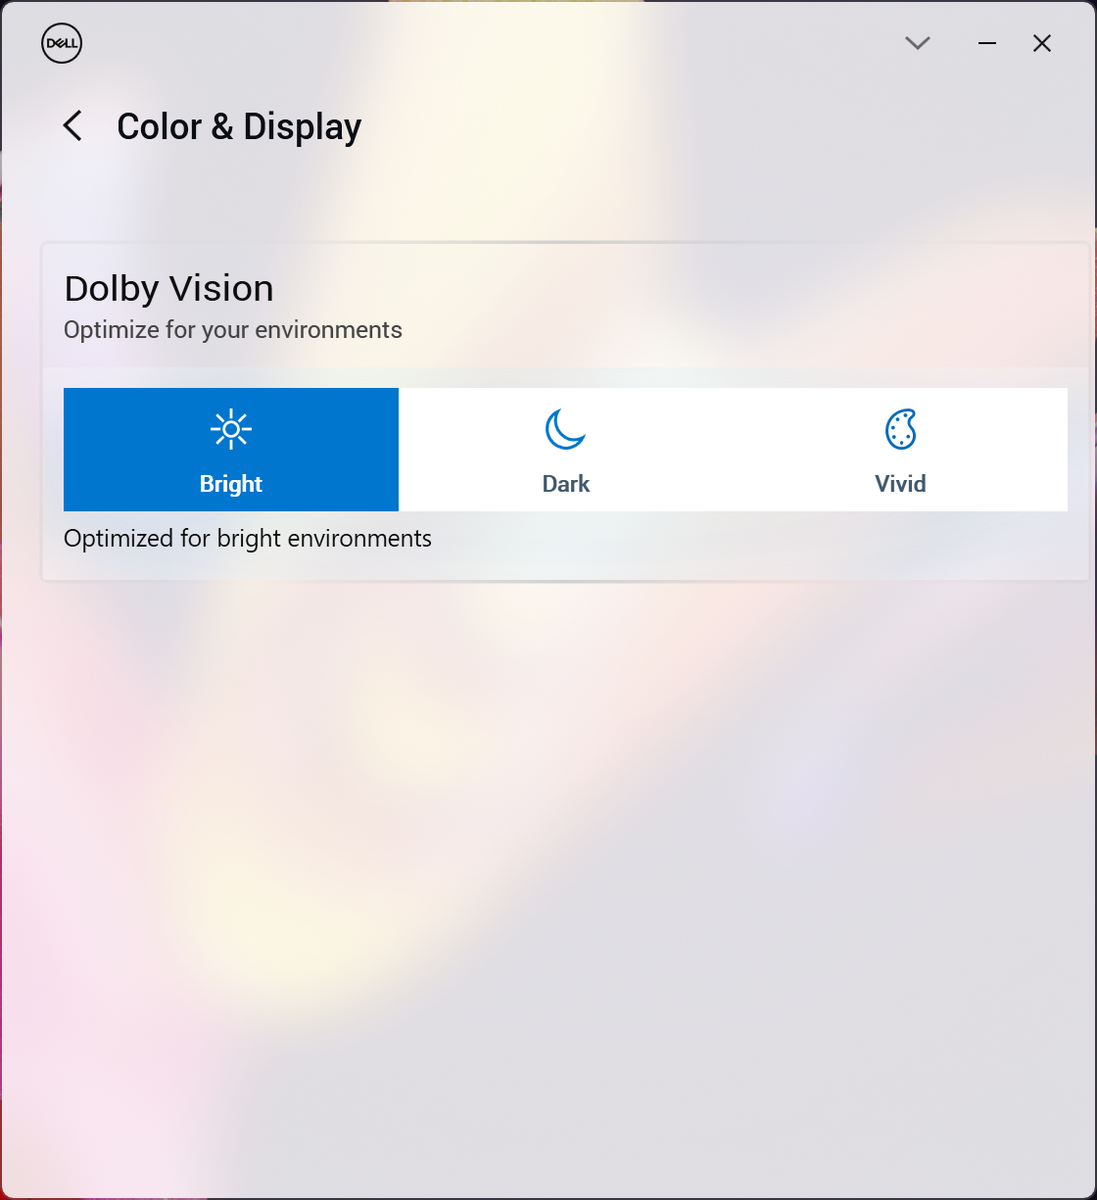
Configuramos nossa unidade para o modo Ultra Performance por meio do software MyDell redesenhado antes de executar os benchmarks abaixo. O MyDell é o equivalente do XPS ao software Optimizer que vem com muitos modelos Latitude e, portanto, integra recursos semelhantes, como perfis de desempenho, hábitos de carregamento e detecção de presença. Os perfis de energia da Dell podem ser convenientemente sincronizados com os perfis padrão do Windows, ao contrário da maioria dos outros laptops.
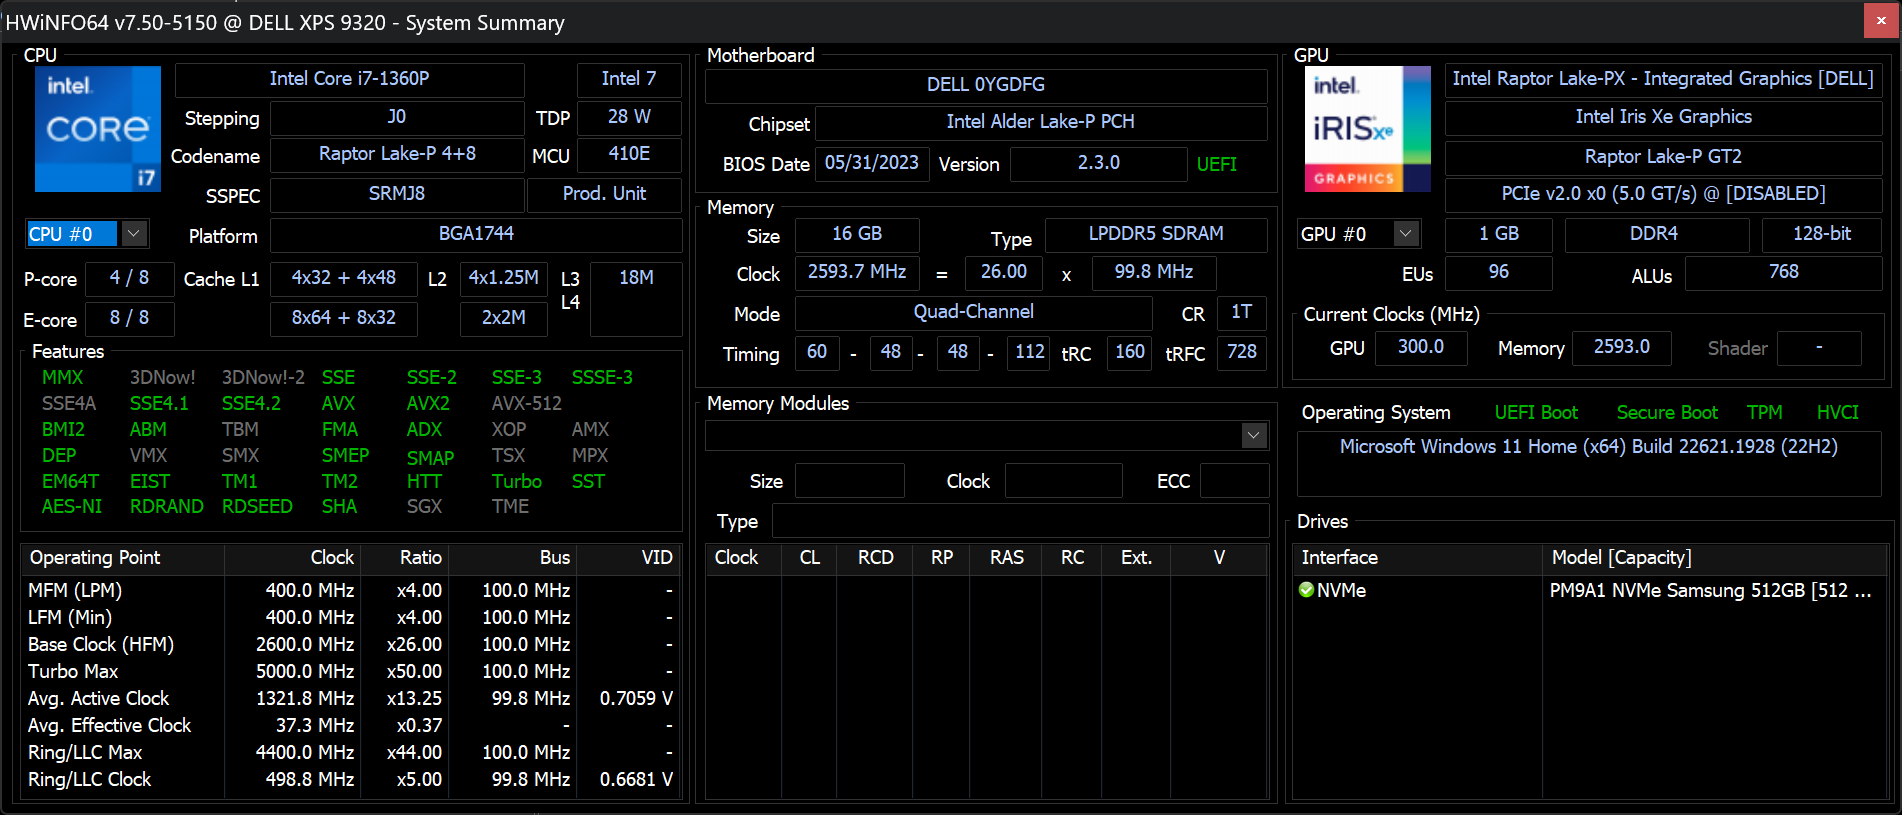
Processador
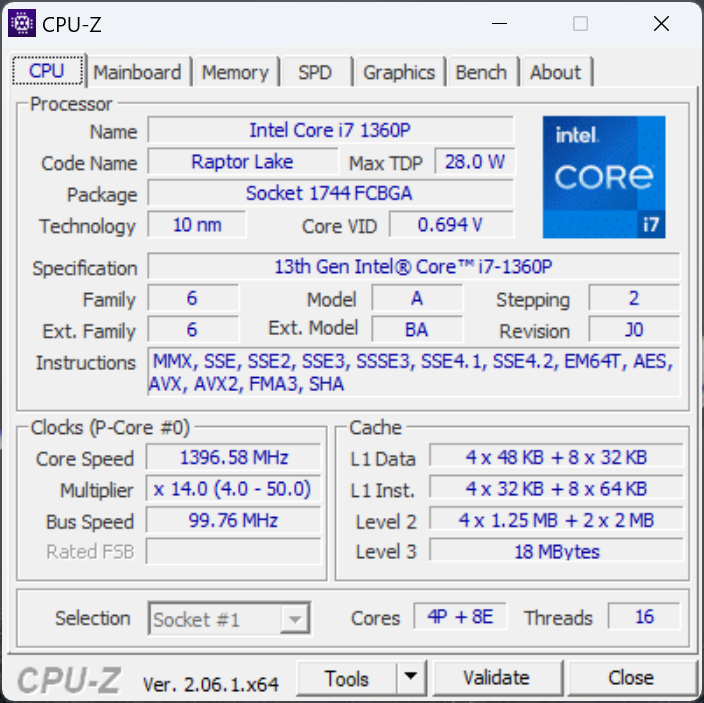
Desempenho multithread do nosso processador de 13ª geração Core i7-1360P de 13ª geração é quase idêntico ao do Core i7-1280P do XPS 13 Plus de 2022. Até mesmo o comportamento do Turbo Boost é o mesmo, conforme exemplificado pelos resultados do teste de loop CineBench R15 xT abaixo. OLenovo Yoga 9 14IRP G8que vem com o mesmo Core i7-1360P, consegue manter taxas de clock do Turbo Boost um pouco mais rápidas por mais tempo no mesmo teste.
Embora o desempenho multi-thread não tenha realmente mudado ano a ano, o desempenho single-thread aumentou cerca de 10 a 15% em relação ao Core i7-1280P. No entanto, não se espera que isso tenha muito impacto sobre as cargas de trabalho diárias, pois a maioria dos aplicativos modernos é multithread.
Cinebench R15 Multi Loop
Cinebench R20: CPU (Multi Core) | CPU (Single Core)
Cinebench R23: Multi Core | Single Core
Cinebench R15: CPU Multi 64Bit | CPU Single 64Bit
Blender: v2.79 BMW27 CPU
7-Zip 18.03: 7z b 4 | 7z b 4 -mmt1
Geekbench 5.5: Multi-Core | Single-Core
HWBOT x265 Benchmark v2.2: 4k Preset
LibreOffice : 20 Documents To PDF
R Benchmark 2.5: Overall mean
* ... menor é melhor
AIDA64: FP32 Ray-Trace | FPU Julia | CPU SHA3 | CPU Queen | FPU SinJulia | FPU Mandel | CPU AES | CPU ZLib | FP64 Ray-Trace | CPU PhotoWorxx
| Performance rating | |
| Framework Laptop 13.5 13th Gen Intel | |
| Dell XPS 13 Plus 9320 i7-1280P OLED | |
| Dell XPS 13 Plus 9320 Core i7-1360P | |
| HP Spectre x360 13.5 14t-ef000 | |
| Lenovo ThinkPad X13 Yoga G3 21AW003UGE | |
| AIDA64 / FP32 Ray-Trace | |
| Framework Laptop 13.5 13th Gen Intel | |
| Dell XPS 13 Plus 9320 i7-1280P OLED | |
| Dell XPS 13 Plus 9320 Core i7-1360P | |
| Lenovo ThinkPad X13 Yoga G3 21AW003UGE | |
| HP Spectre x360 13.5 14t-ef000 | |
| AIDA64 / FPU Julia | |
| Framework Laptop 13.5 13th Gen Intel | |
| Dell XPS 13 Plus 9320 i7-1280P OLED | |
| Dell XPS 13 Plus 9320 Core i7-1360P | |
| Lenovo ThinkPad X13 Yoga G3 21AW003UGE | |
| HP Spectre x360 13.5 14t-ef000 | |
| AIDA64 / CPU SHA3 | |
| Framework Laptop 13.5 13th Gen Intel | |
| Dell XPS 13 Plus 9320 i7-1280P OLED | |
| Dell XPS 13 Plus 9320 Core i7-1360P | |
| Lenovo ThinkPad X13 Yoga G3 21AW003UGE | |
| HP Spectre x360 13.5 14t-ef000 | |
| AIDA64 / CPU Queen | |
| Framework Laptop 13.5 13th Gen Intel | |
| Dell XPS 13 Plus 9320 i7-1280P OLED | |
| Dell XPS 13 Plus 9320 Core i7-1360P | |
| Lenovo ThinkPad X13 Yoga G3 21AW003UGE | |
| HP Spectre x360 13.5 14t-ef000 | |
| AIDA64 / FPU SinJulia | |
| Framework Laptop 13.5 13th Gen Intel | |
| Dell XPS 13 Plus 9320 i7-1280P OLED | |
| Dell XPS 13 Plus 9320 Core i7-1360P | |
| Lenovo ThinkPad X13 Yoga G3 21AW003UGE | |
| HP Spectre x360 13.5 14t-ef000 | |
| AIDA64 / FPU Mandel | |
| Framework Laptop 13.5 13th Gen Intel | |
| Dell XPS 13 Plus 9320 i7-1280P OLED | |
| Dell XPS 13 Plus 9320 Core i7-1360P | |
| Lenovo ThinkPad X13 Yoga G3 21AW003UGE | |
| HP Spectre x360 13.5 14t-ef000 | |
| AIDA64 / CPU AES | |
| Framework Laptop 13.5 13th Gen Intel | |
| HP Spectre x360 13.5 14t-ef000 | |
| Dell XPS 13 Plus 9320 i7-1280P OLED | |
| Dell XPS 13 Plus 9320 Core i7-1360P | |
| Lenovo ThinkPad X13 Yoga G3 21AW003UGE | |
| AIDA64 / CPU ZLib | |
| Framework Laptop 13.5 13th Gen Intel | |
| Dell XPS 13 Plus 9320 Core i7-1360P | |
| Dell XPS 13 Plus 9320 i7-1280P OLED | |
| Lenovo ThinkPad X13 Yoga G3 21AW003UGE | |
| HP Spectre x360 13.5 14t-ef000 | |
| AIDA64 / FP64 Ray-Trace | |
| Framework Laptop 13.5 13th Gen Intel | |
| Dell XPS 13 Plus 9320 i7-1280P OLED | |
| Dell XPS 13 Plus 9320 Core i7-1360P | |
| HP Spectre x360 13.5 14t-ef000 | |
| Lenovo ThinkPad X13 Yoga G3 21AW003UGE | |
| AIDA64 / CPU PhotoWorxx | |
| Dell XPS 13 Plus 9320 Core i7-1360P | |
| Dell XPS 13 Plus 9320 i7-1280P OLED | |
| HP Spectre x360 13.5 14t-ef000 | |
| Lenovo ThinkPad X13 Yoga G3 21AW003UGE | |
| Framework Laptop 13.5 13th Gen Intel | |
Desempenho do sistema
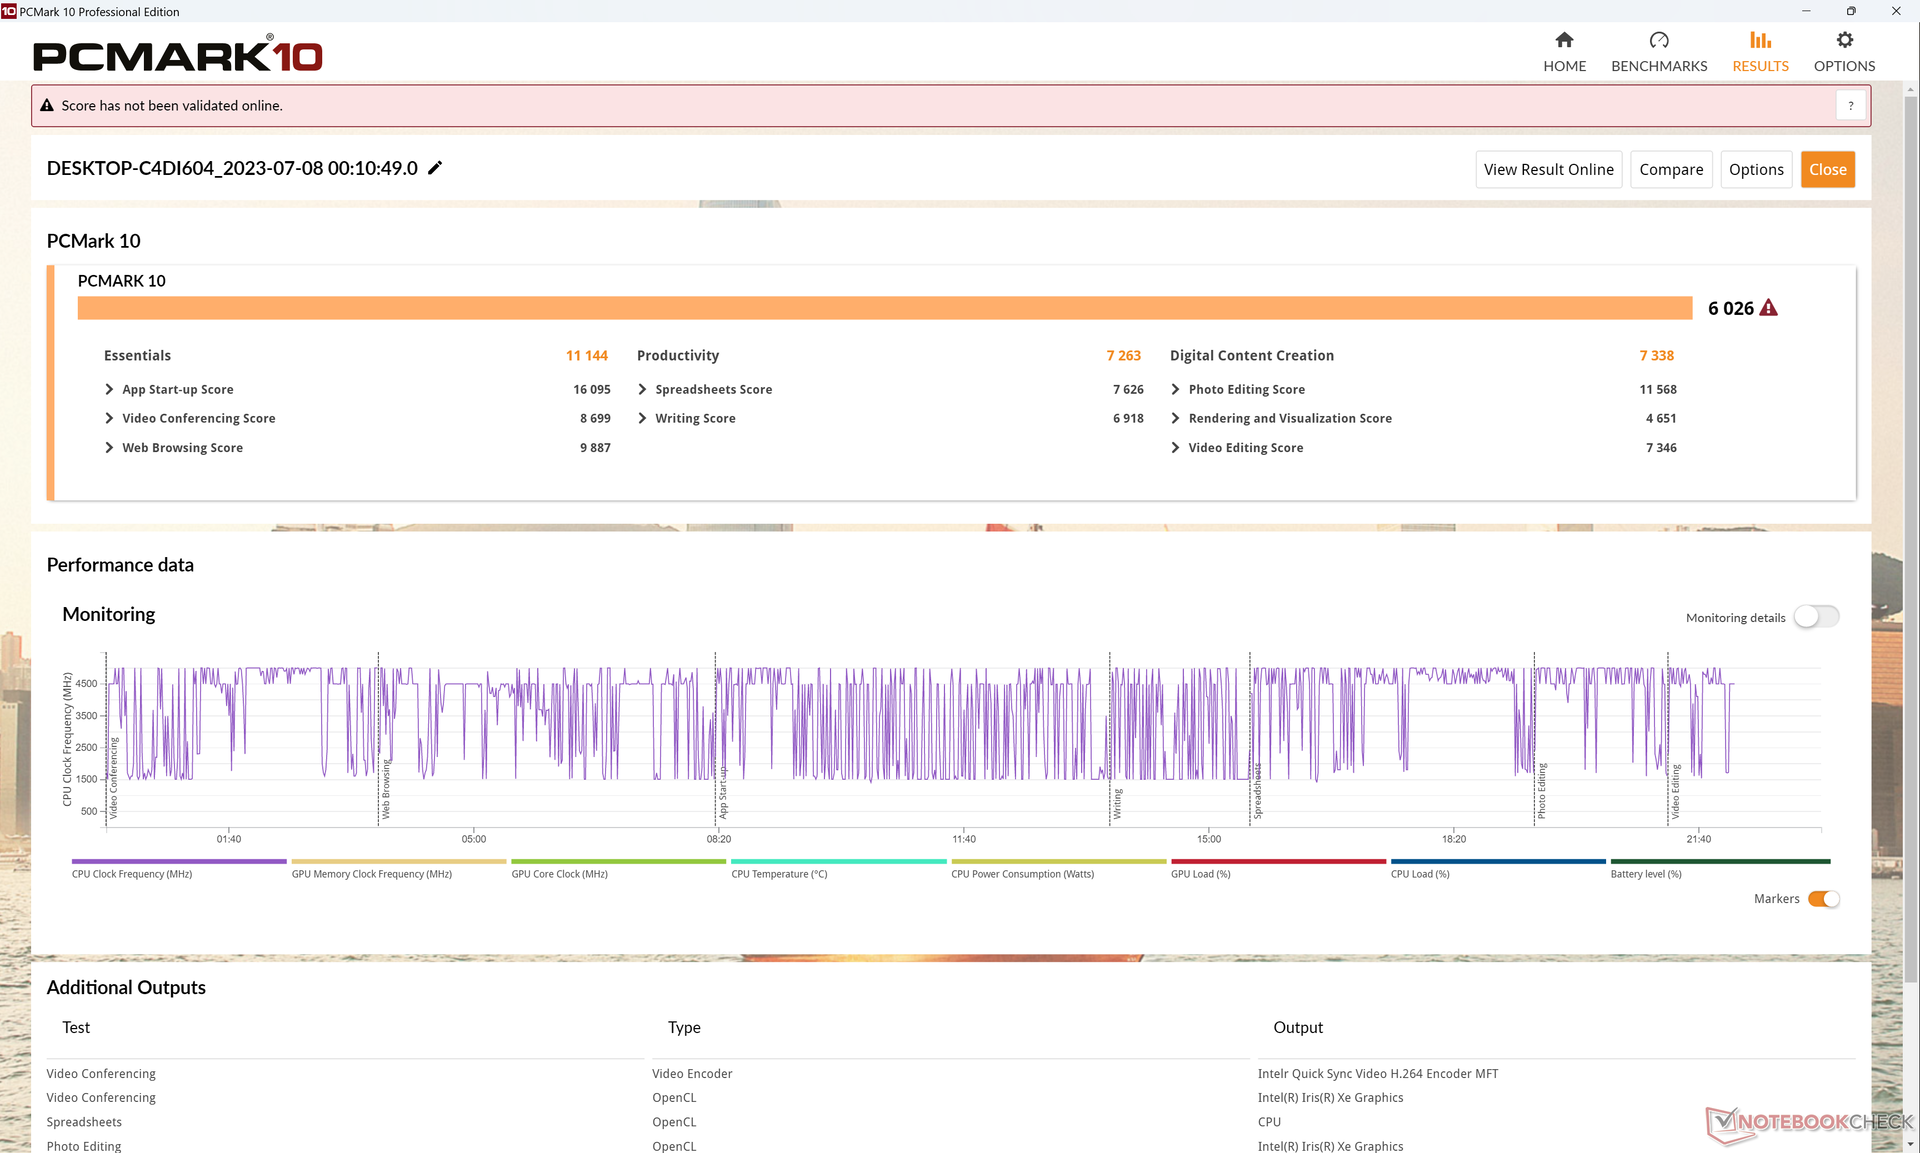
Os resultados do PCMark estão ligeiramente, mas de forma consistente, à frente do XPS 13 Plus do ano passado em pontos percentuais de um dígito, provavelmente devido à RAM mais rápida e ao desempenho um pouco mais rápido de thread único.
CrossMark: Overall | Productivity | Creativity | Responsiveness
| PCMark 10 / Digital Content Creation | |
| Framework Laptop 13.5 13th Gen Intel | |
| Dell XPS 13 Plus 9320 Core i7-1360P | |
| Média Intel Core i7-1360P (5723 - 9597, n=16) | |
| Dell XPS 13 Plus 9320 i7-1280P OLED | |
| HP Spectre x360 13.5 14t-ef000 | |
| Lenovo ThinkPad X13 Yoga G3 21AW003UGE | |
| Dell XPS 13 7390 Core i7-10710U | |
| CrossMark / Overall | |
| Dell XPS 13 Plus 9320 Core i7-1360P | |
| Dell XPS 13 Plus 9320 i7-1280P OLED | |
| Framework Laptop 13.5 13th Gen Intel | |
| Média Intel Core i7-1360P (1527 - 1891, n=15) | |
| HP Spectre x360 13.5 14t-ef000 | |
| Lenovo ThinkPad X13 Yoga G3 21AW003UGE | |
| CrossMark / Productivity | |
| Framework Laptop 13.5 13th Gen Intel | |
| Dell XPS 13 Plus 9320 Core i7-1360P | |
| Dell XPS 13 Plus 9320 i7-1280P OLED | |
| Média Intel Core i7-1360P (1503 - 1842, n=15) | |
| HP Spectre x360 13.5 14t-ef000 | |
| Lenovo ThinkPad X13 Yoga G3 21AW003UGE | |
| CrossMark / Creativity | |
| Dell XPS 13 Plus 9320 Core i7-1360P | |
| Dell XPS 13 Plus 9320 i7-1280P OLED | |
| Framework Laptop 13.5 13th Gen Intel | |
| Média Intel Core i7-1360P (1558 - 2003, n=15) | |
| HP Spectre x360 13.5 14t-ef000 | |
| Lenovo ThinkPad X13 Yoga G3 21AW003UGE | |
| CrossMark / Responsiveness | |
| Média Intel Core i7-1360P (1311 - 1899, n=15) | |
| Dell XPS 13 Plus 9320 i7-1280P OLED | |
| Dell XPS 13 Plus 9320 Core i7-1360P | |
| Framework Laptop 13.5 13th Gen Intel | |
| HP Spectre x360 13.5 14t-ef000 | |
| Lenovo ThinkPad X13 Yoga G3 21AW003UGE | |
| PCMark 10 Score | 6026 pontos | |
Ajuda | ||
| AIDA64 / Memory Copy | |
| Dell XPS 13 Plus 9320 Core i7-1360P | |
| Dell XPS 13 Plus 9320 i7-1280P OLED | |
| Média Intel Core i7-1360P (44299 - 72748, n=16) | |
| HP Spectre x360 13.5 14t-ef000 | |
| Lenovo ThinkPad X13 Yoga G3 21AW003UGE | |
| Framework Laptop 13.5 13th Gen Intel | |
| AIDA64 / Memory Read | |
| Dell XPS 13 Plus 9320 i7-1280P OLED | |
| Dell XPS 13 Plus 9320 Core i7-1360P | |
| HP Spectre x360 13.5 14t-ef000 | |
| Média Intel Core i7-1360P (44751 - 68945, n=16) | |
| Lenovo ThinkPad X13 Yoga G3 21AW003UGE | |
| Framework Laptop 13.5 13th Gen Intel | |
| AIDA64 / Memory Write | |
| Dell XPS 13 Plus 9320 Core i7-1360P | |
| Média Intel Core i7-1360P (45887 - 93331, n=16) | |
| HP Spectre x360 13.5 14t-ef000 | |
| Dell XPS 13 Plus 9320 i7-1280P OLED | |
| Framework Laptop 13.5 13th Gen Intel | |
| Lenovo ThinkPad X13 Yoga G3 21AW003UGE | |
| AIDA64 / Memory Latency | |
| Dell XPS 13 Plus 9320 i7-1280P OLED | |
| Lenovo ThinkPad X13 Yoga G3 21AW003UGE | |
| Dell XPS 13 Plus 9320 Core i7-1360P | |
| Média Intel Core i7-1360P (85 - 110.5, n=16) | |
| HP Spectre x360 13.5 14t-ef000 | |
| Framework Laptop 13.5 13th Gen Intel | |
* ... menor é melhor
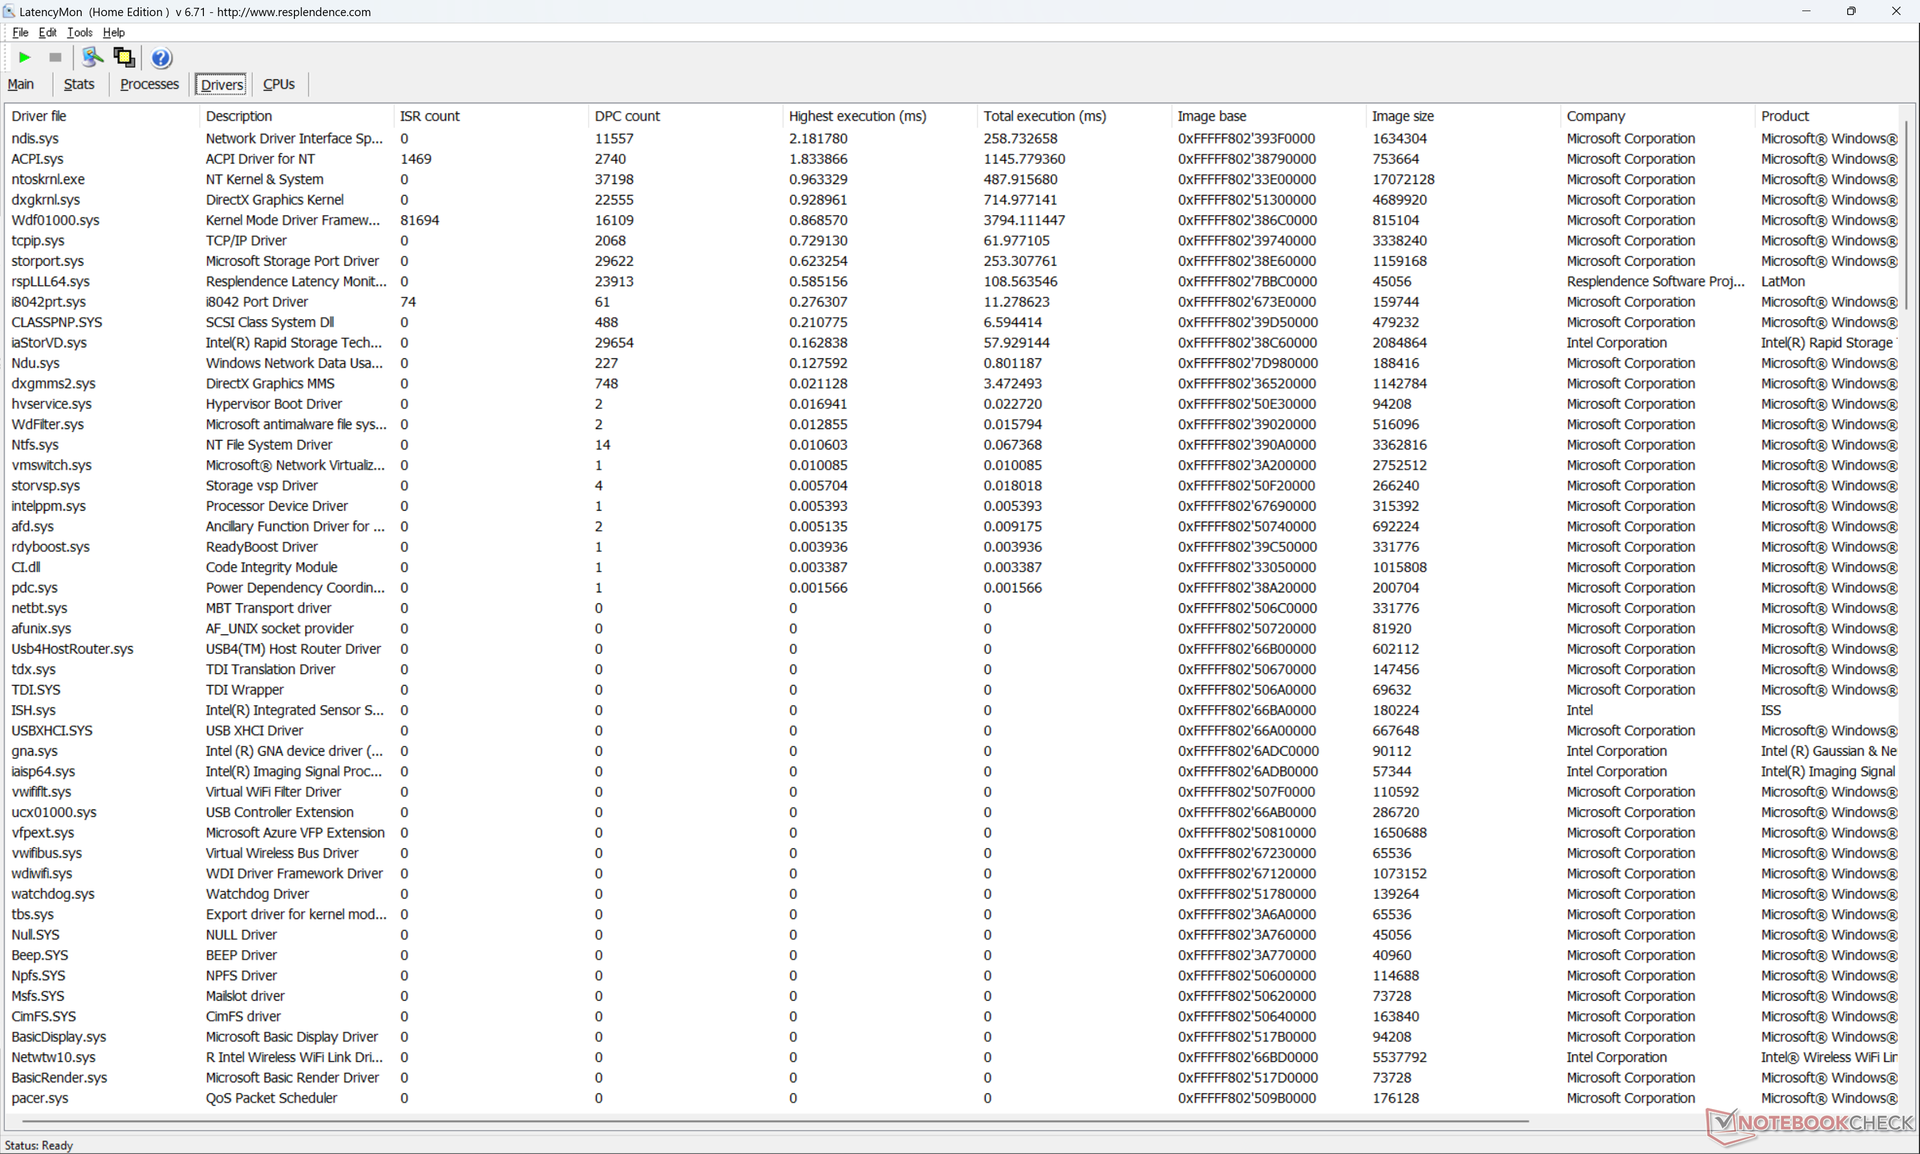
Latência DPC
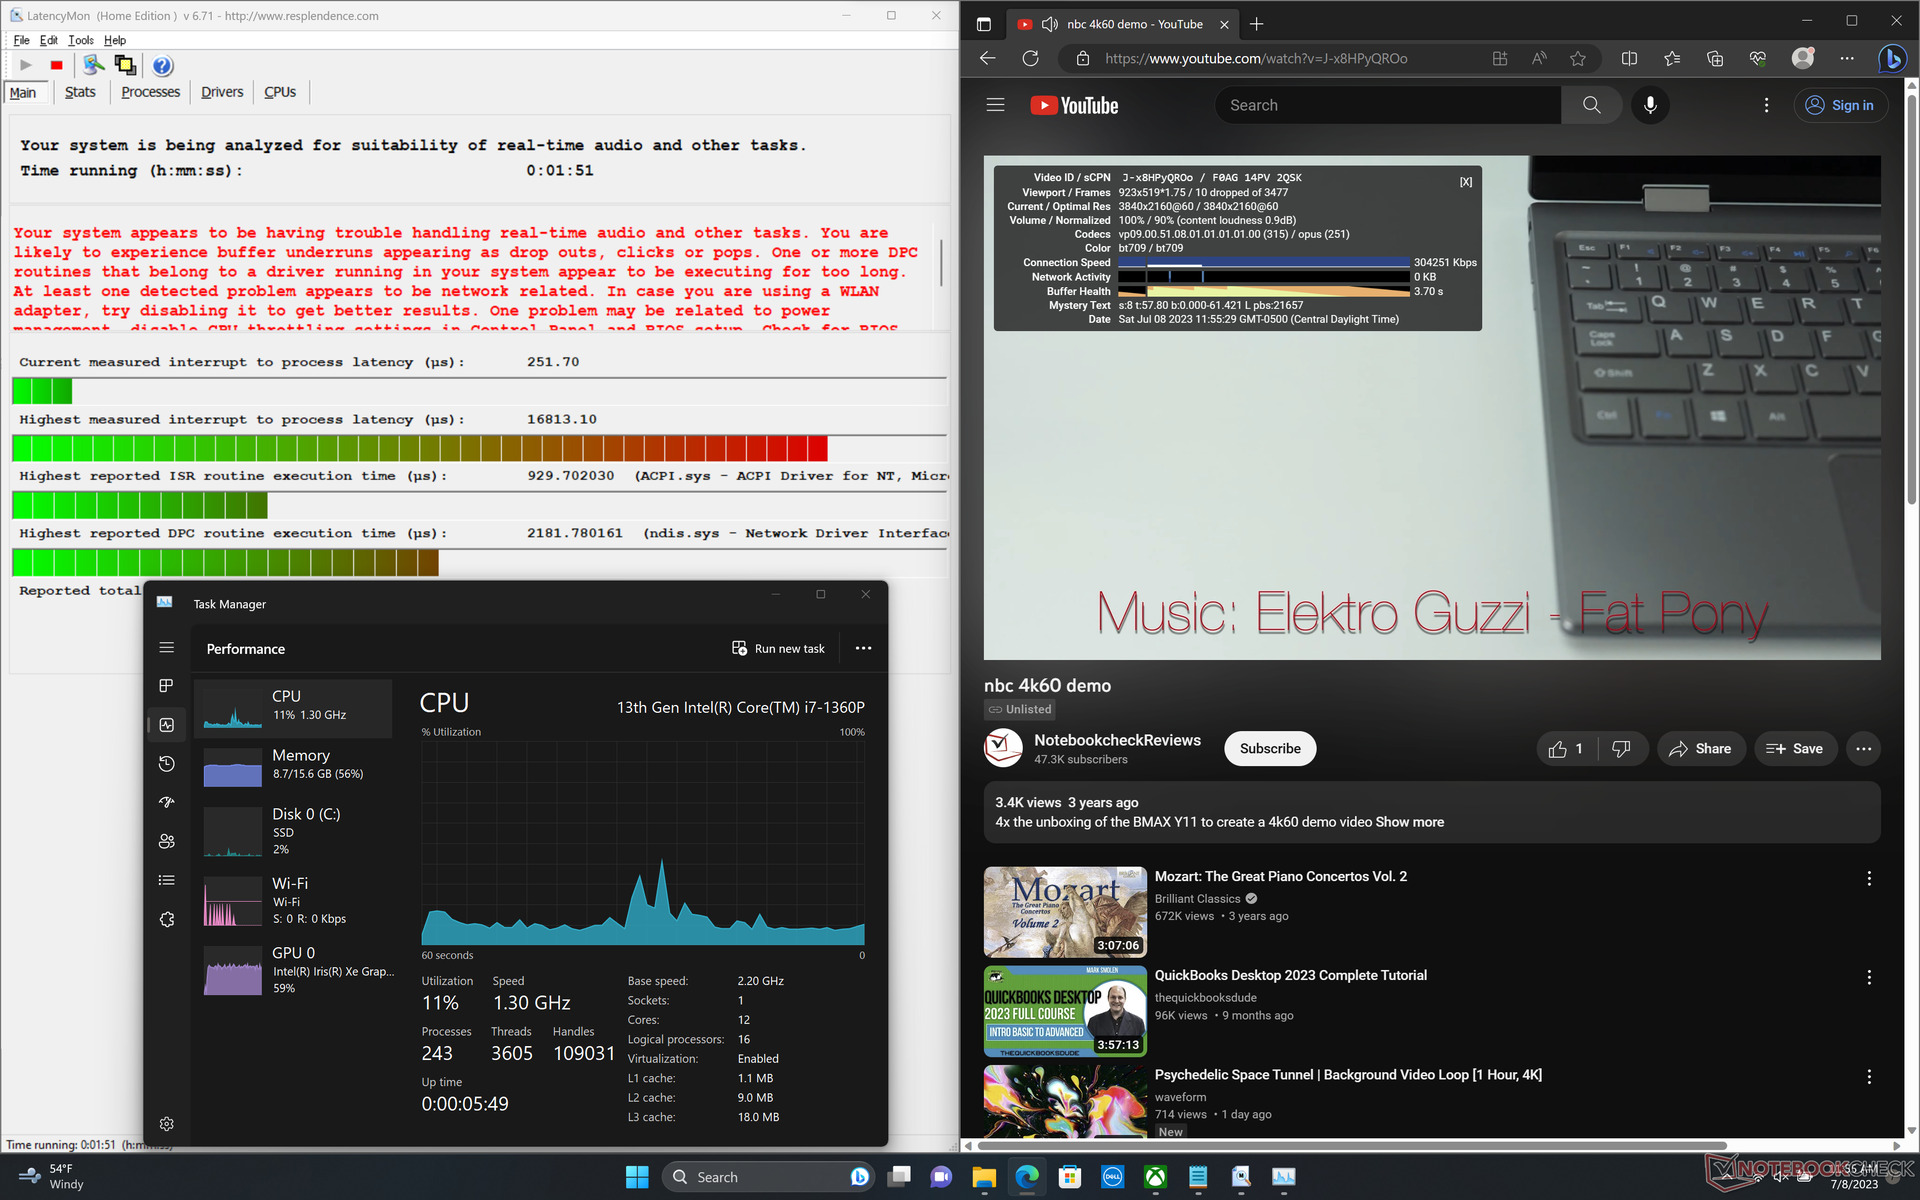
Nossa unidade apresentava problemas de latência ao abrir várias guias do navegador ou a página inicial, mesmo após várias tentativas. a reprodução de vídeo 4K a 60 FPS também não era perfeita, com 10 quadros perdidos durante nosso vídeo de teste de um minuto. Isso pode ser um bug do novo modelo 2023, pois nenhuma de nossas três unidades de teste 2022 apresentou esses problemas.
| DPC Latencies / LatencyMon - interrupt to process latency (max), Web, Youtube, Prime95 | |
| Dell XPS 13 Plus 9320 Core i7-1360P | |
| Lenovo ThinkPad X13 Yoga G3 21AW003UGE | |
| Dell XPS 13 Plus 9320 i5-1240p | |
| Dell XPS 13 Plus 9320 4K | |
| HP Spectre x360 13.5 14t-ef000 | |
| Dell XPS 13 Plus 9320 i7-1280P OLED | |
| Framework Laptop 13.5 13th Gen Intel | |
* ... menor é melhor
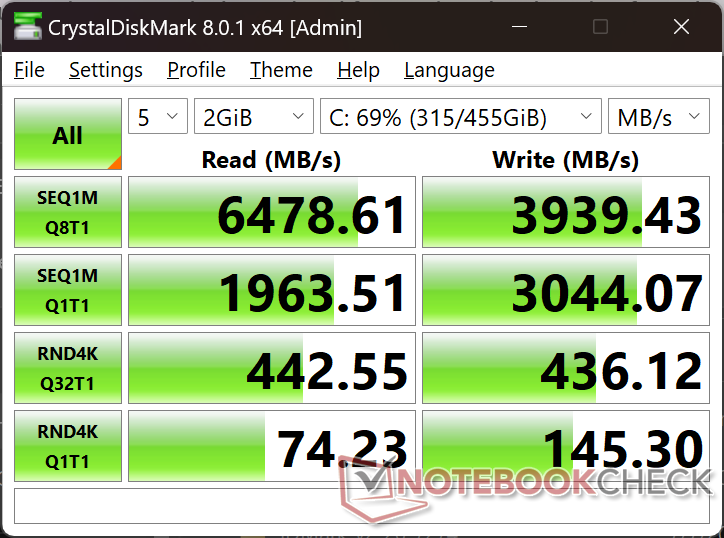
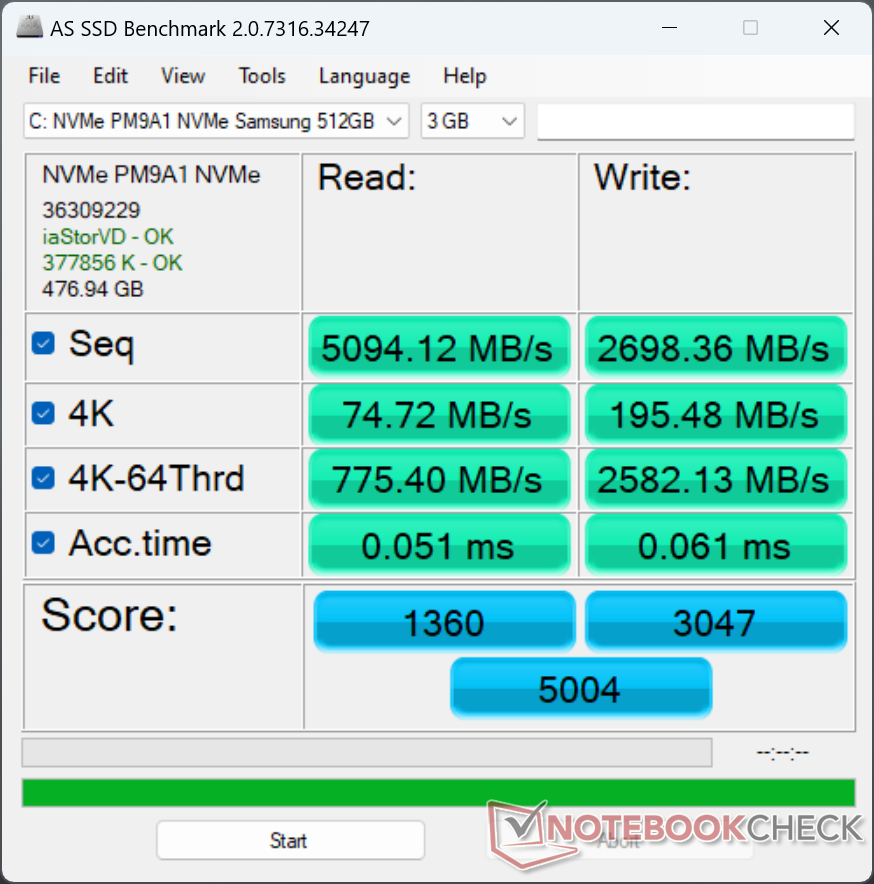
Dispositivos de armazenamento
As SSDs da série XPS 13 Plus podem ser fornecidas pela Samsung, Micron ou Western Digital. Para essa unidade específica, nosso SSD é o Samsung PM9A1 PCIe4 x4 que oferece taxas de leitura e gravação sequenciais de quase 7.000 MB/s e 4.000 MB/s, respectivamente. Infelizmente, o desempenho da nossa unidade foi reduzido para até 2.000 MB/s quando estressada, conforme mostrado pelos resultados do teste de loop do DiskSpd abaixo. A repetição do teste não resultaria em nenhuma melhoria. Em contrapartida, a mesma unidade em nosso XPS 13 Plus 2022 não apresentava nenhuma limitação de desempenho. Não temos certeza de nenhuma causa específica, pois, até onde sabemos, não houve alterações no dissipador de calor do SSD.

* ... menor é melhor
Disk Throttling: DiskSpd Read Loop, Queue Depth 8
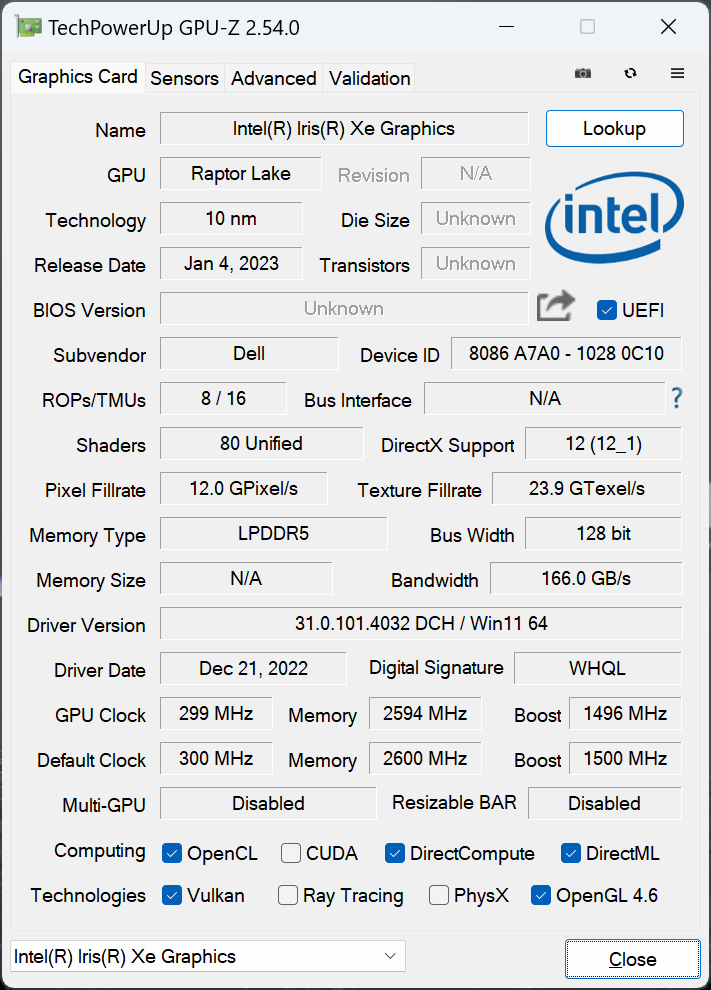
Desempenho da GPU
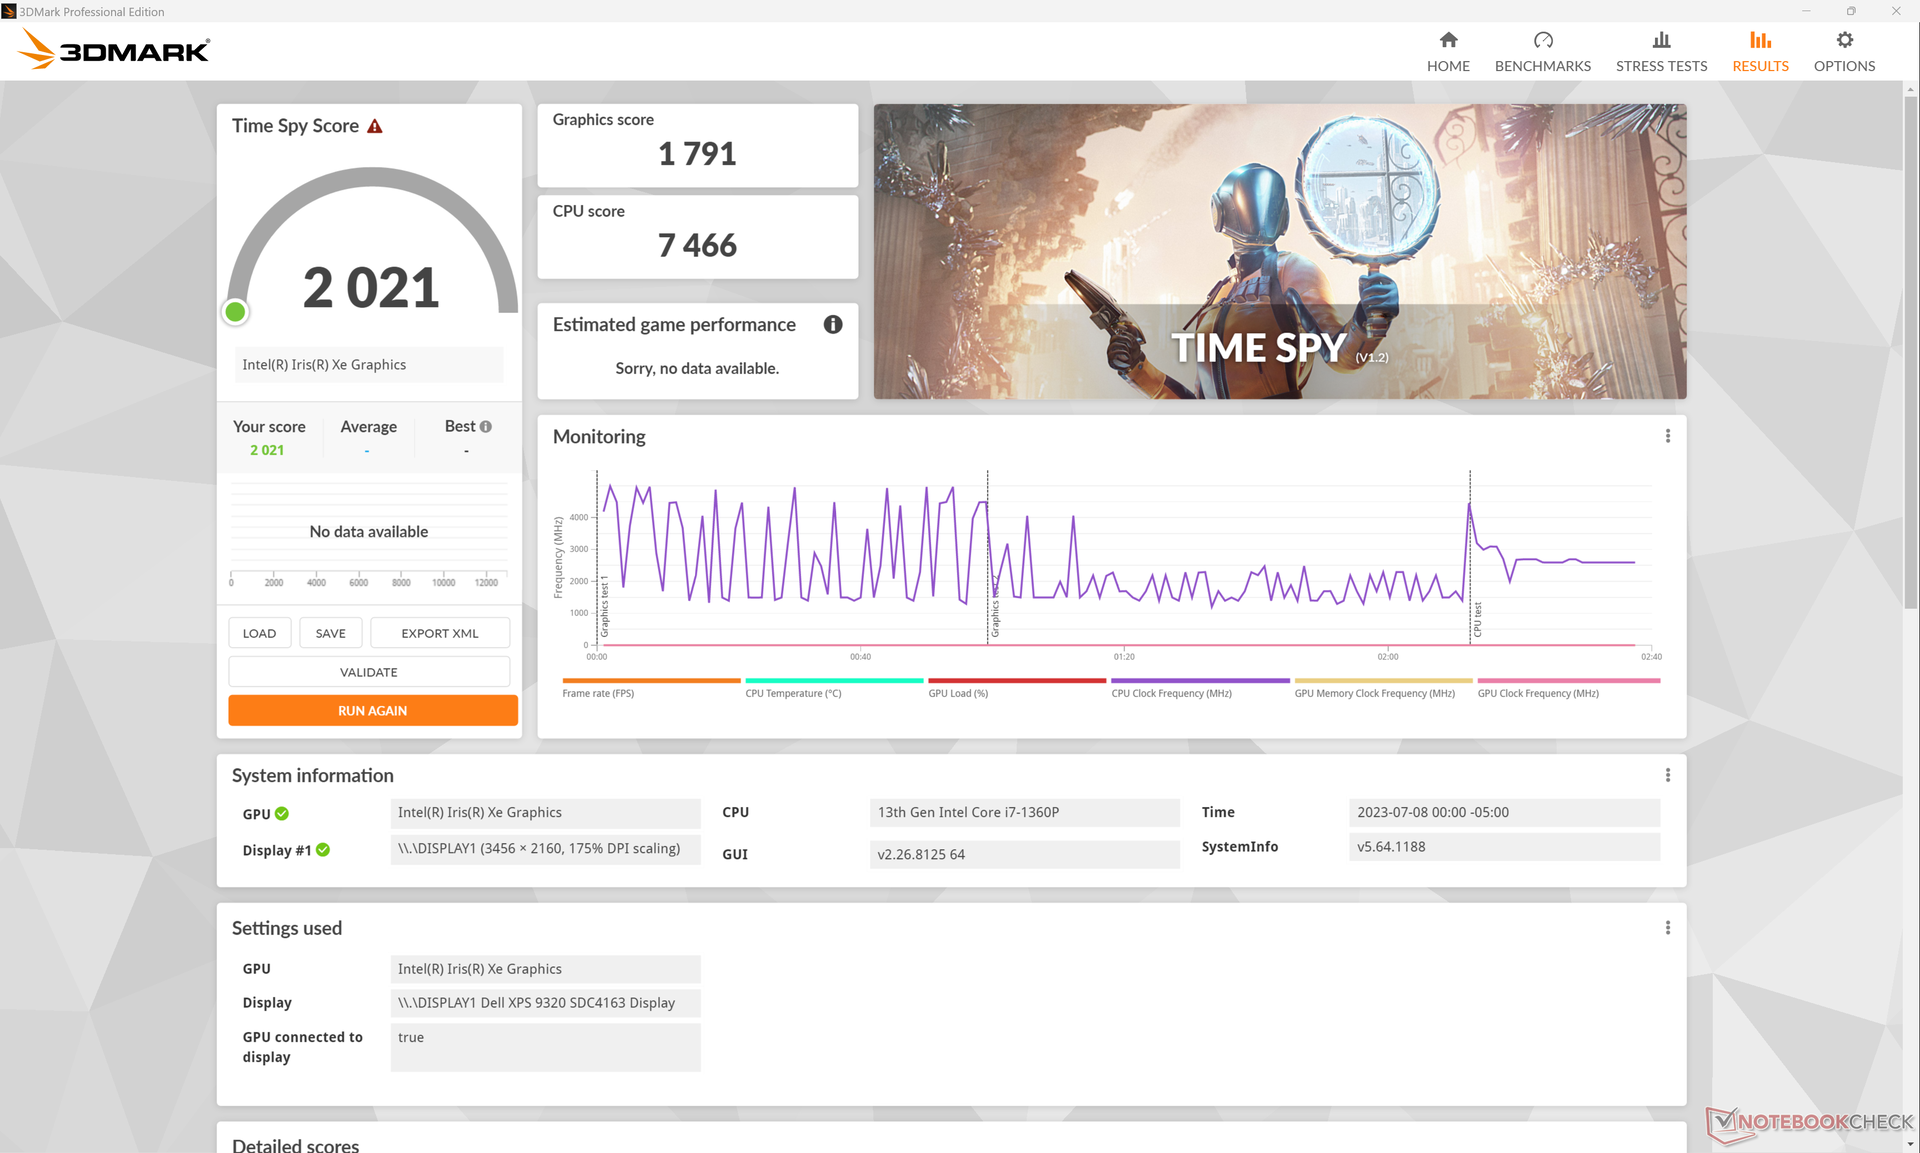
A Iris Xe 96 EUs continua sendo a solução gráfica integrada mais rápida da Intel, apesar de já ter alguns anos de idade. A versão deste ano é um pouco mais rápida do que a do ano passado em alguns pontos percentuais devido ao pequeno aumento na taxa de clock da memória, mas ainda assim é insignificante em comparação com a concorrente Radeon 680M ou 780M.
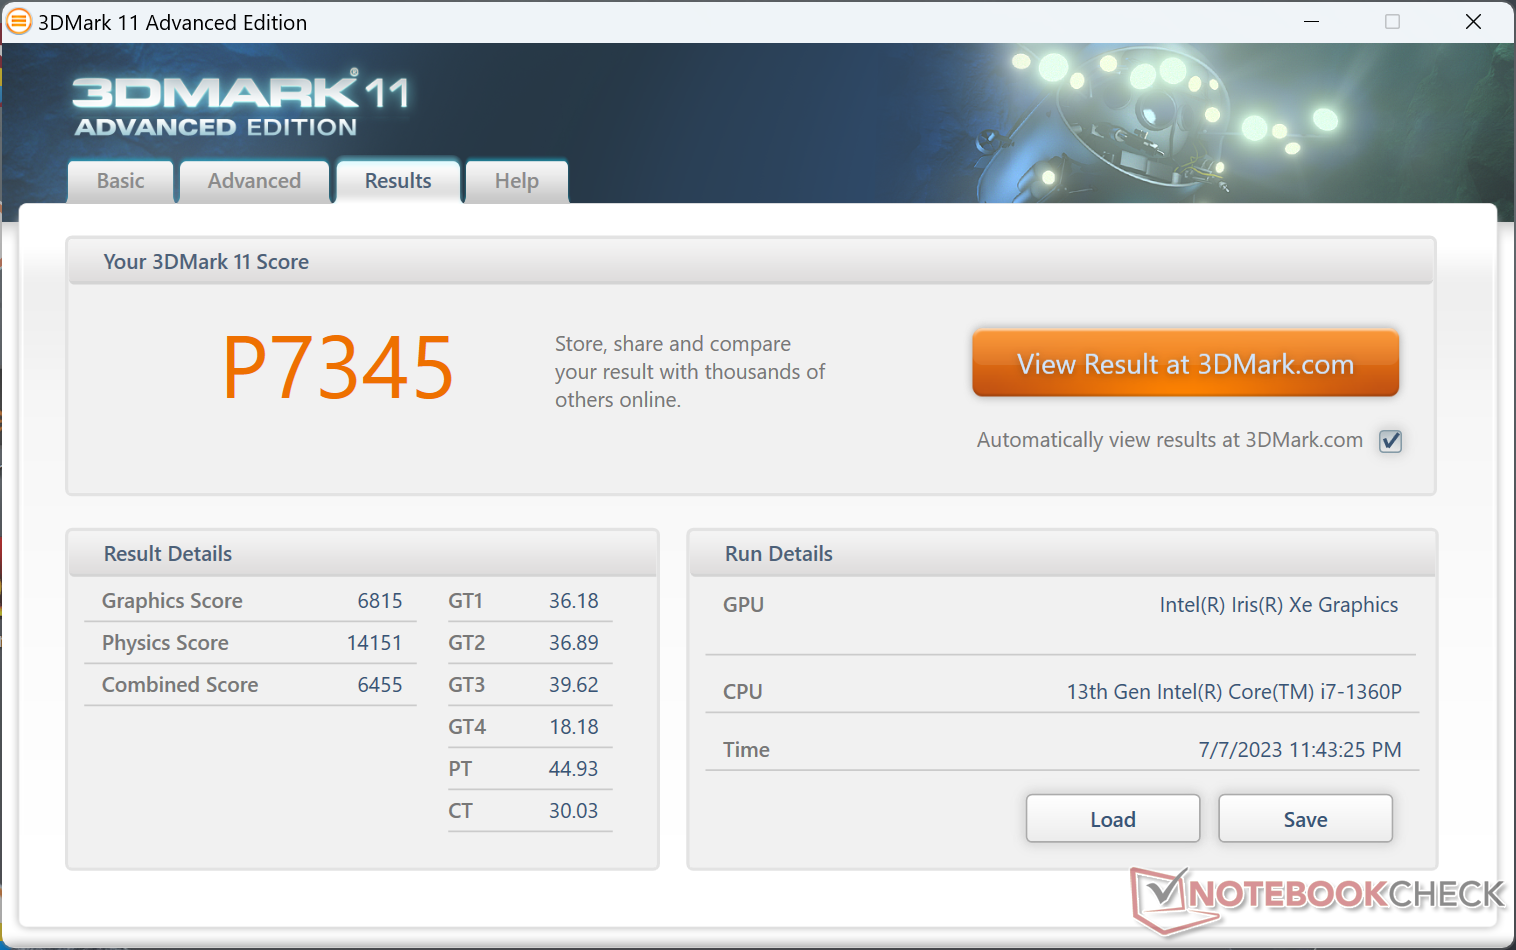
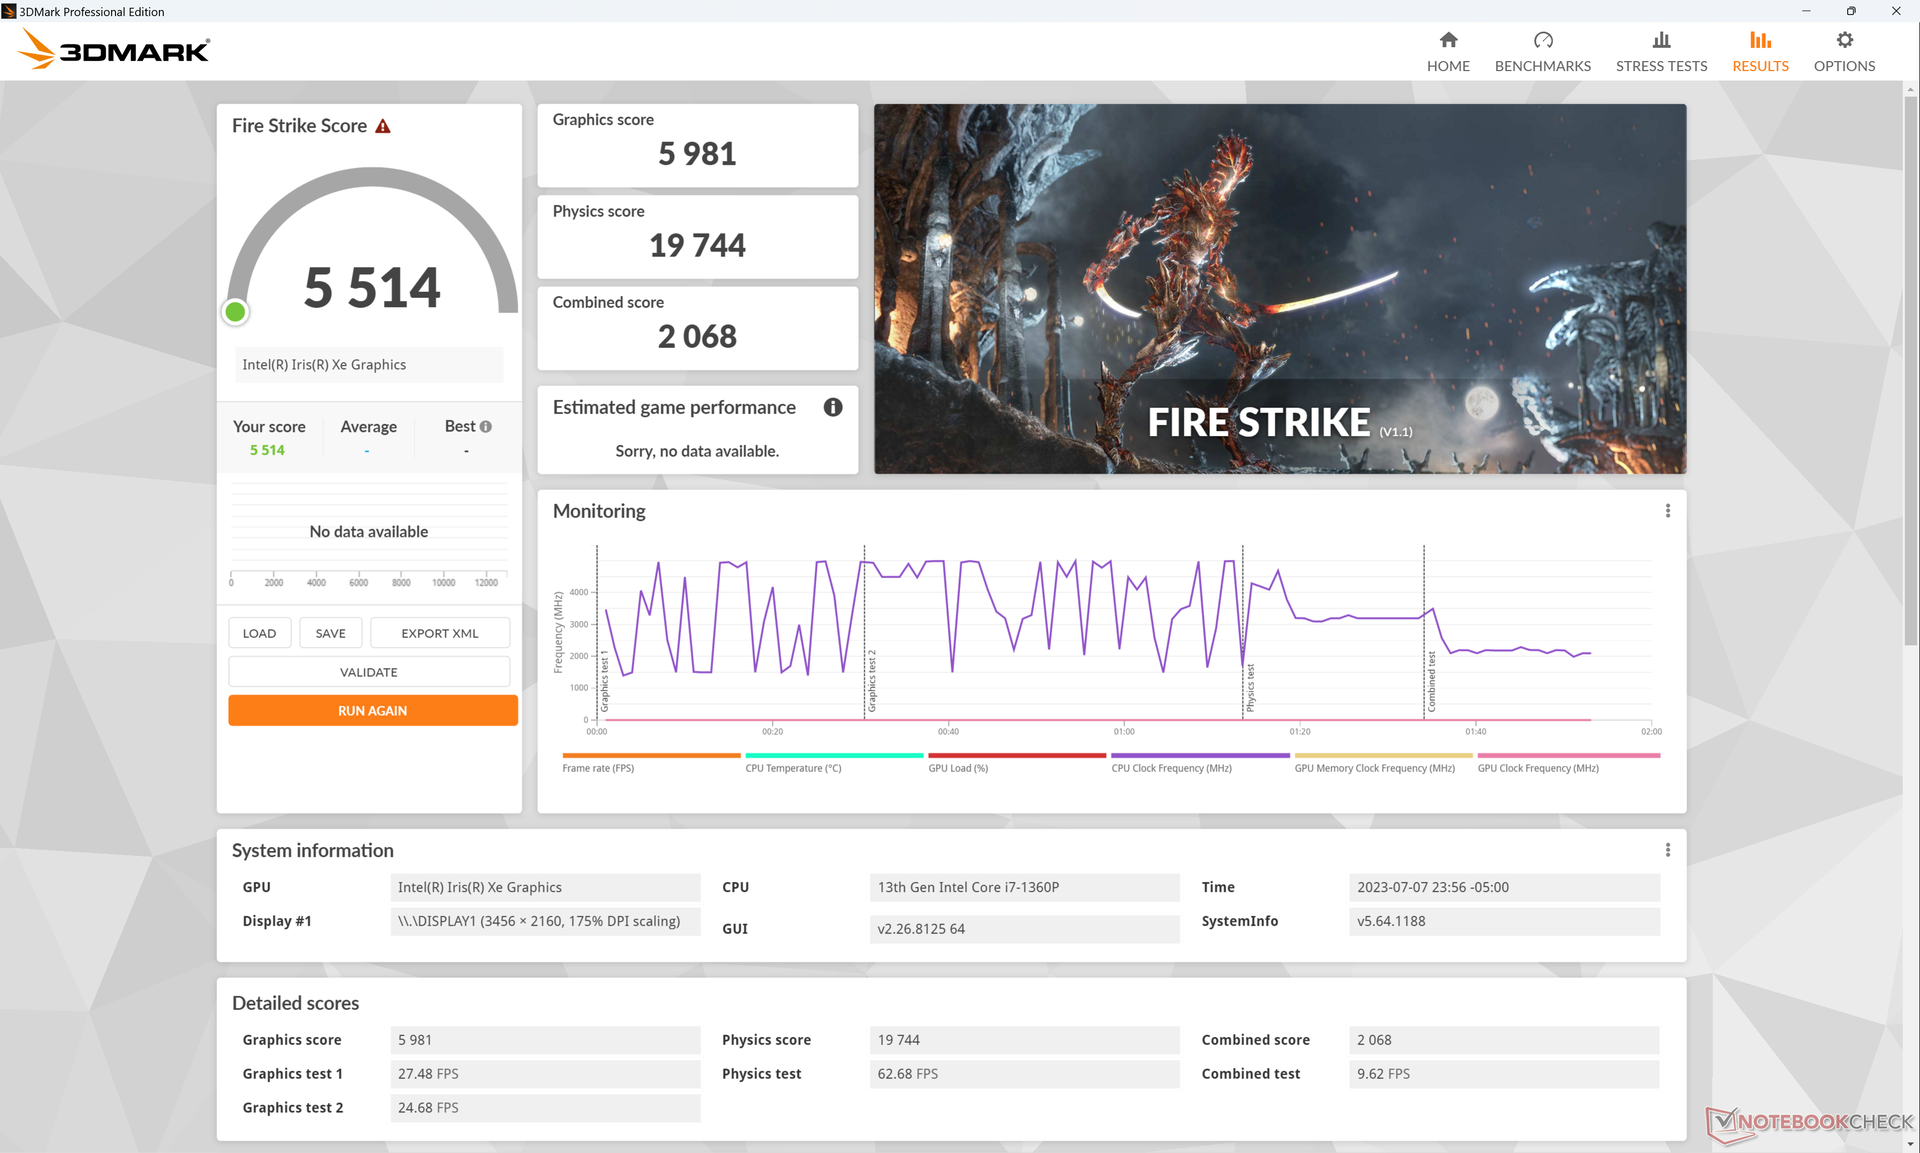
| 3DMark 11 Performance | 7345 pontos | |
| 3DMark Fire Strike Score | 5514 pontos | |
| 3DMark Time Spy Score | 2021 pontos | |
Ajuda | ||
* ... menor é melhor
| Tiny Tina's Wonderlands | |
| 1920x1080 Low Preset (DX12) | |
| Framework Laptop 13.5 13th Gen Intel | |
| Média Intel Iris Xe Graphics G7 96EUs (22.3 - 53, n=32) | |
| Dell XPS 13 Plus 9320 Core i7-1360P | |
| 1920x1080 Medium Preset (DX12) | |
| Framework Laptop 13.5 13th Gen Intel | |
| Dell XPS 13 Plus 9320 Core i7-1360P | |
| Média Intel Iris Xe Graphics G7 96EUs (17 - 40.1, n=30) | |
| 1920x1080 High Preset (DX12) | |
| Framework Laptop 13.5 13th Gen Intel | |
| Dell XPS 13 Plus 9320 Core i7-1360P | |
| Média Intel Iris Xe Graphics G7 96EUs (10.6 - 24.1, n=29) | |
| 1920x1080 Badass Preset (DX12) | |
| Framework Laptop 13.5 13th Gen Intel | |
| Dell XPS 13 Plus 9320 Core i7-1360P | |
| Média Intel Iris Xe Graphics G7 96EUs (8.4 - 18.4, n=26) | |
| 1280x720 Lowest Preset (DX12) | |
| Dell XPS 13 Plus 9320 Core i7-1360P | |
| Média Intel Iris Xe Graphics G7 96EUs (25.9 - 67.3, n=32) | |
Witcher 3 FPS Chart
| baixo | média | alto | ultra | QHD | |
|---|---|---|---|---|---|
| GTA V (2015) | 130.6 | 105.3 | 26.6 | 11.6 | 7.35 |
| The Witcher 3 (2015) | 86.7 | 56.1 | 33.9 | 15.4 | |
| Dota 2 Reborn (2015) | 125.6 | 97.7 | 68.7 | 61.6 | |
| Final Fantasy XV Benchmark (2018) | 44.5 | 25.2 | 17.5 | ||
| X-Plane 11.11 (2018) | 42.7 | 36.2 | 33.2 | ||
| Strange Brigade (2018) | 93.9 | 43.8 | 35.4 | 27.5 | |
| Cyberpunk 2077 1.6 (2022) | 20.8 | 17.3 | 13.6 | 11 | |
| Tiny Tina's Wonderlands (2022) | 29.6 | 23.7 | 15.2 | 12.2 | |
| F1 22 (2022) | 47.5 | 42.8 | 31.9 | 24.1 |
Emissões
Ruído do sistema
Embora não haja alterações na solução de resfriamento ou nos níveis de ruído da ventoinha, conseguimos notar um leve zumbido da bobina em nossa unidade de teste ao colocar um ouvido próximo às teclas do teclado. Por outro lado, os ventiladores ficam inativos ou quase inaudíveis na maioria das cargas leves, como navegação na Web ou processamento de texto.
Barulho
| Ocioso |
| 24 / 24 / 24.4 dB |
| Carga |
| 37 / 42 dB |
 | ||
30 dB silencioso 40 dB(A) audível 50 dB(A) ruidosamente alto |
||
min: | ||
| Dell XPS 13 Plus 9320 Core i7-1360P Iris Xe G7 96EUs, i7-1360P, Samsung PM9A1 MZVL2512HCJQ | Dell XPS 13 Plus 9320 i7-1280P OLED Iris Xe G7 96EUs, i7-1280P, WDC PC SN810 512GB | Dell XPS 13 7390 Core i7-10710U UHD Graphics 620, i7-10710U, SK Hynix PC601 NVMe 512 GB | Framework Laptop 13.5 13th Gen Intel Iris Xe G7 96EUs, i7-1370P, WD PC SN740 SDDPNQD-1T00 | Lenovo ThinkPad X13 Yoga G3 21AW003UGE Iris Xe G7 96EUs, i7-1265U, Samsung PM9A1 MZVL2512HCJQ | HP Spectre x360 13.5 14t-ef000 Iris Xe G7 96EUs, i7-1255U, Micron 3400 1TB MTFDKBA1T0TFH | |
|---|---|---|---|---|---|---|
| Noise | 3% | -12% | -6% | -2% | 7% | |
| desligado / ambiente * (dB) | 23.7 | 23.4 1% | 28 -18% | 23.2 2% | 23.22 2% | 23.5 1% |
| Idle Minimum * (dB) | 24 | 23.4 2% | 28 -17% | 23.2 3% | 23.2 3% | 23.5 2% |
| Idle Average * (dB) | 24 | 23.4 2% | 28 -17% | 23.2 3% | 23.2 3% | 23.5 2% |
| Idle Maximum * (dB) | 24.4 | 23.4 4% | 28 -15% | 23.2 5% | 28.6 -17% | 23.5 4% |
| Load Average * (dB) | 37 | 35 5% | 33.7 9% | 45.3 -22% | 39.8 -8% | 27 27% |
| Witcher 3 ultra * (dB) | 42.1 | 41.6 1% | 47.9 -14% | 41.8 1% | 36.2 14% | |
| Load Maximum * (dB) | 42 | 39.9 5% | 46.5 -11% | 49.2 -17% | 40.6 3% | 42.4 -1% |
* ... menor é melhor
Temperatura
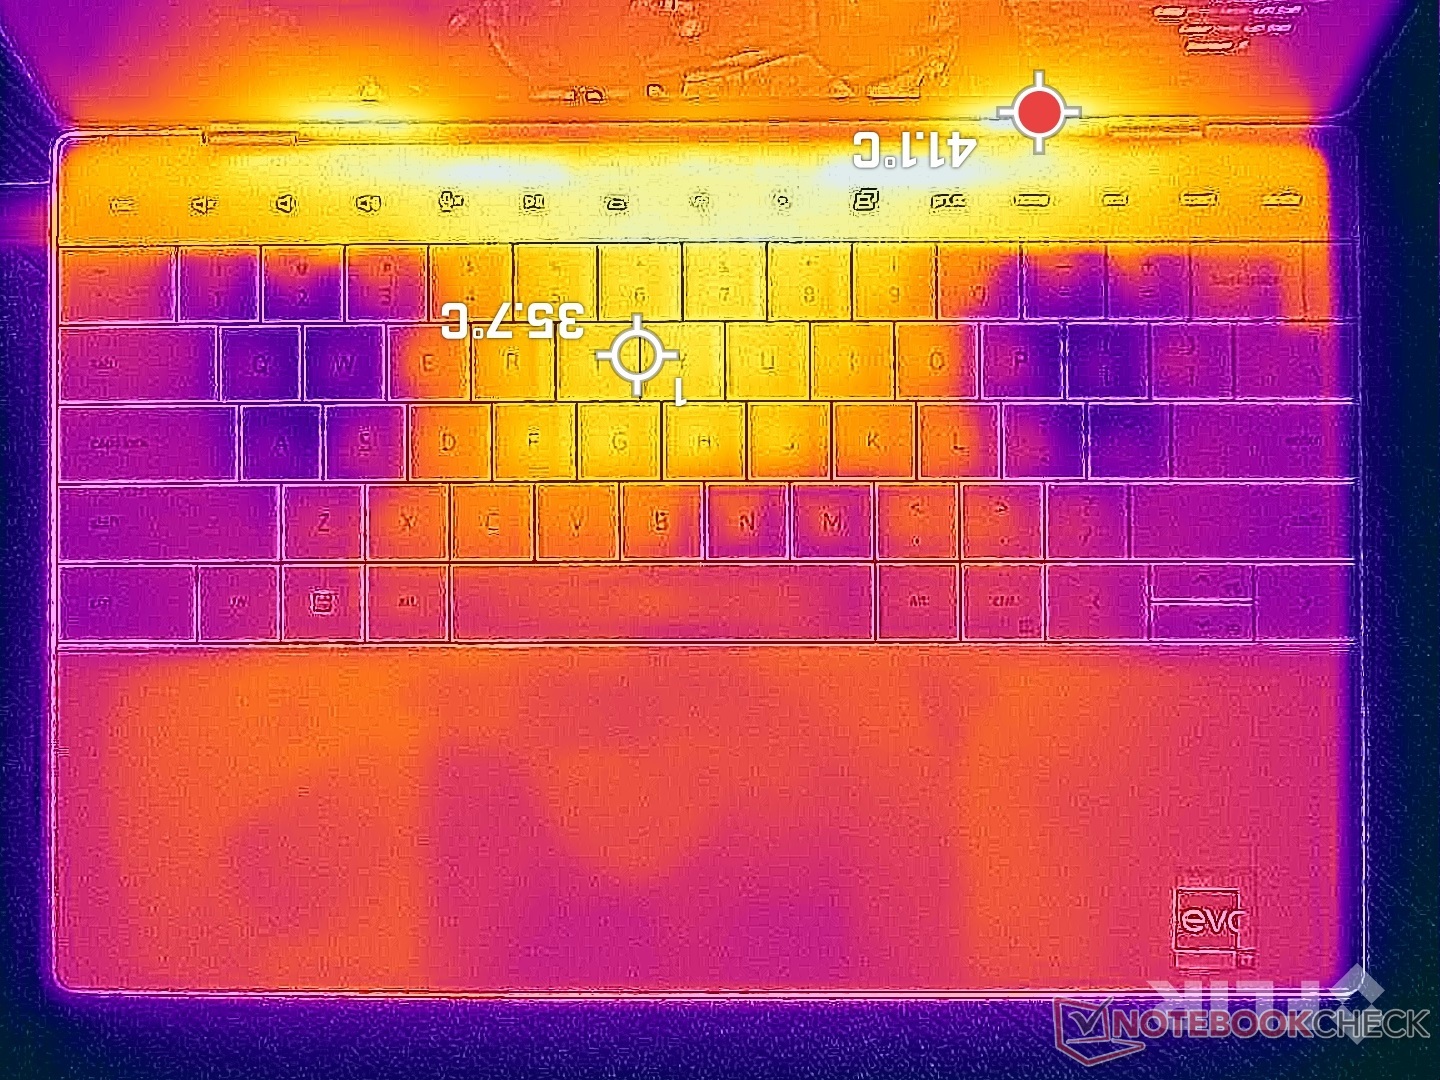
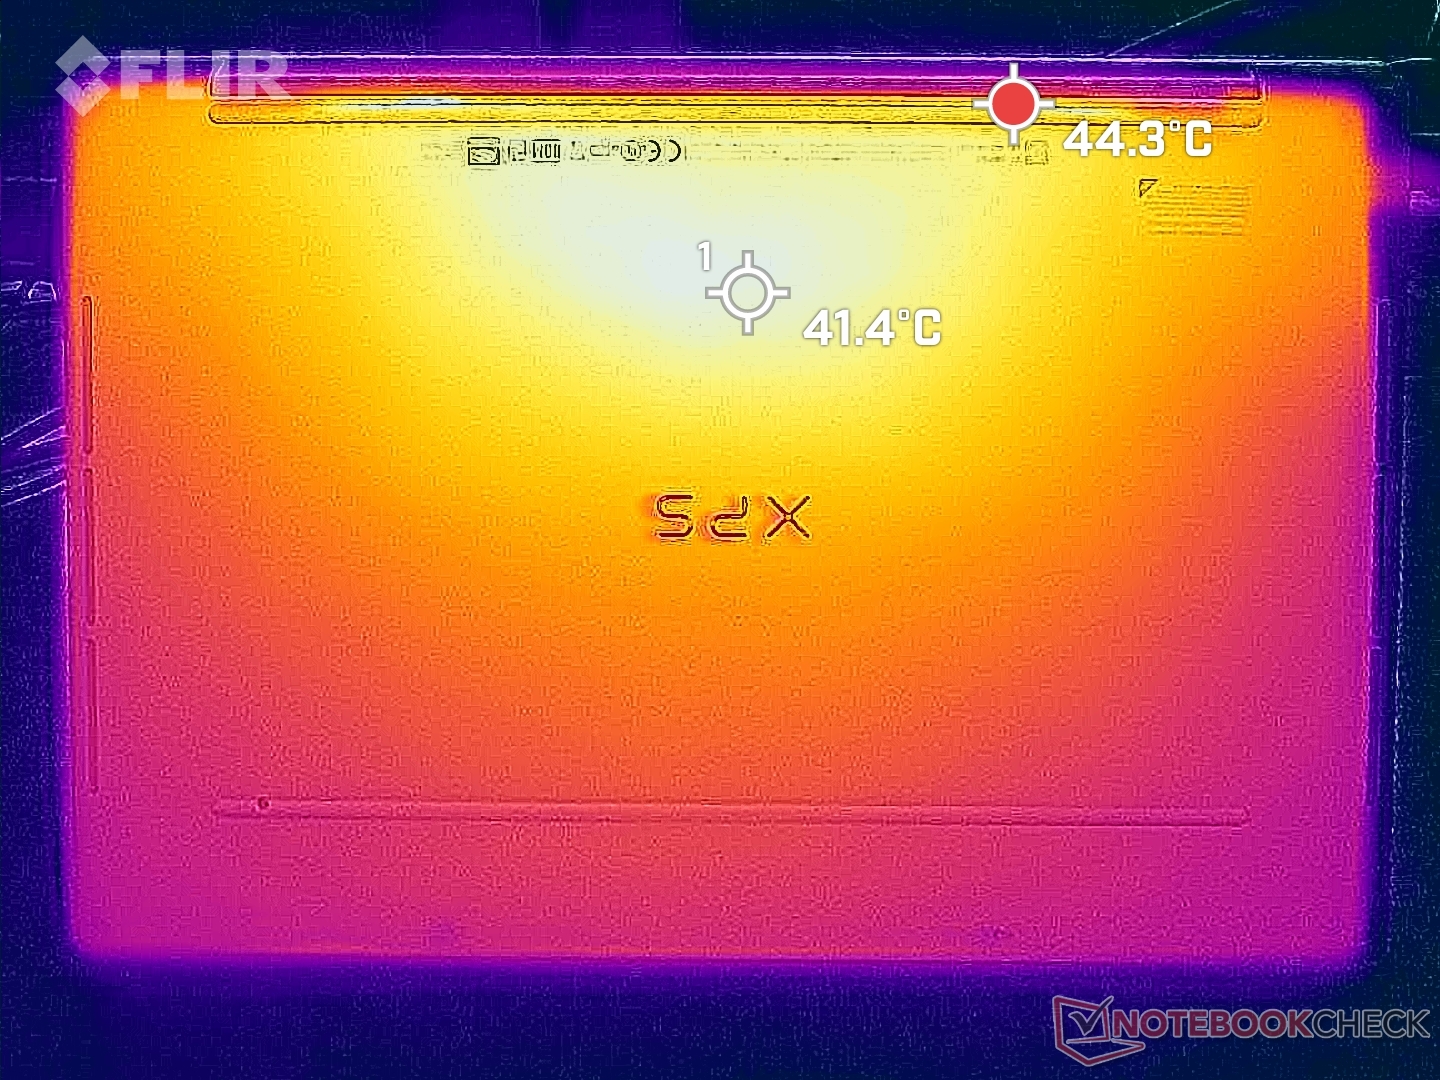
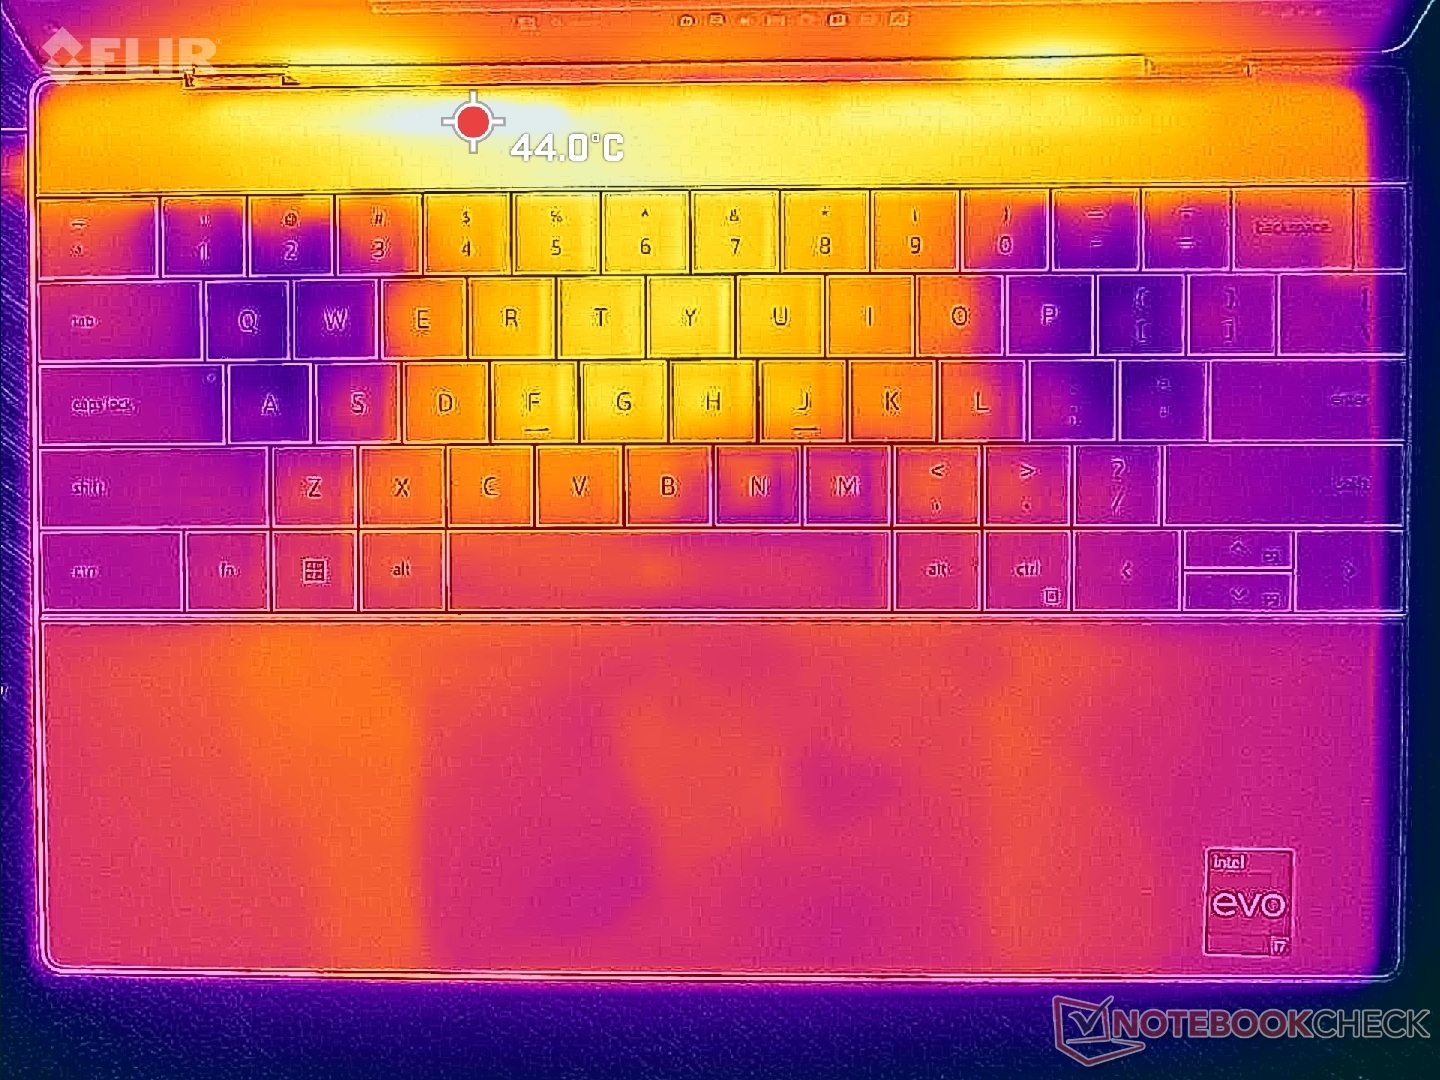
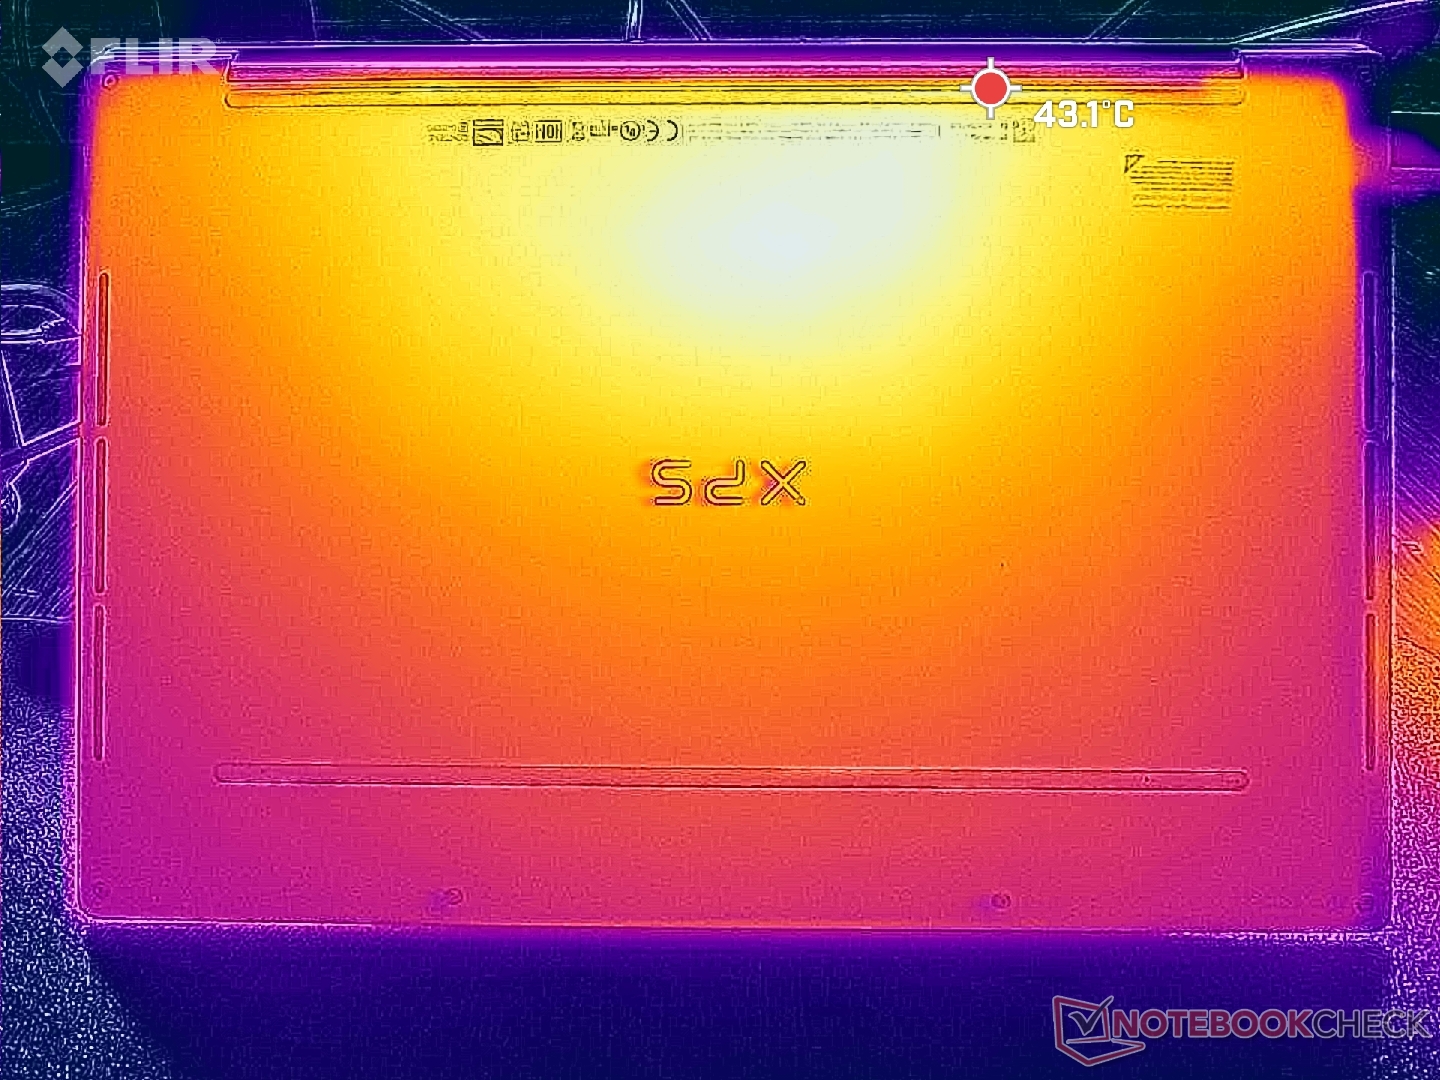
As temperaturas da superfície podem ser muito altas devido ao perfil fino, à CPU Core-P e à falta de grades de ventilação no painel inferior. Os pontos quentes podem chegar a até 45 °C, em comparação com apenas 35 °C no HP Dragonfly Folio 13.5 G3 mais lento HP Dragonfly Folio 13.5 G3.
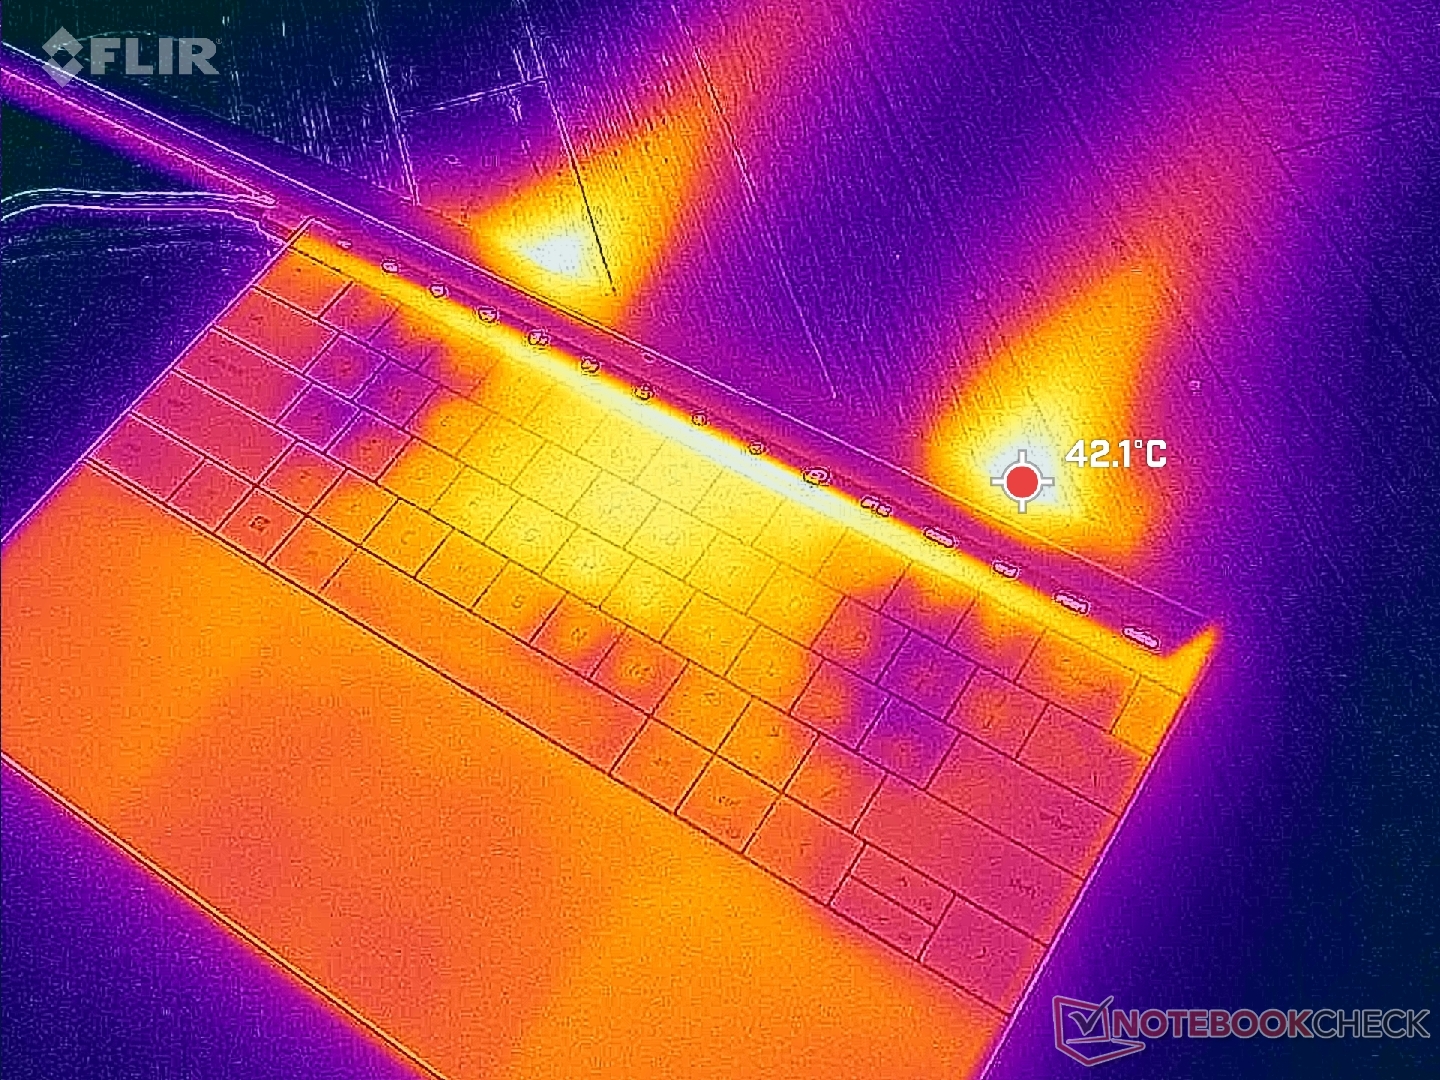
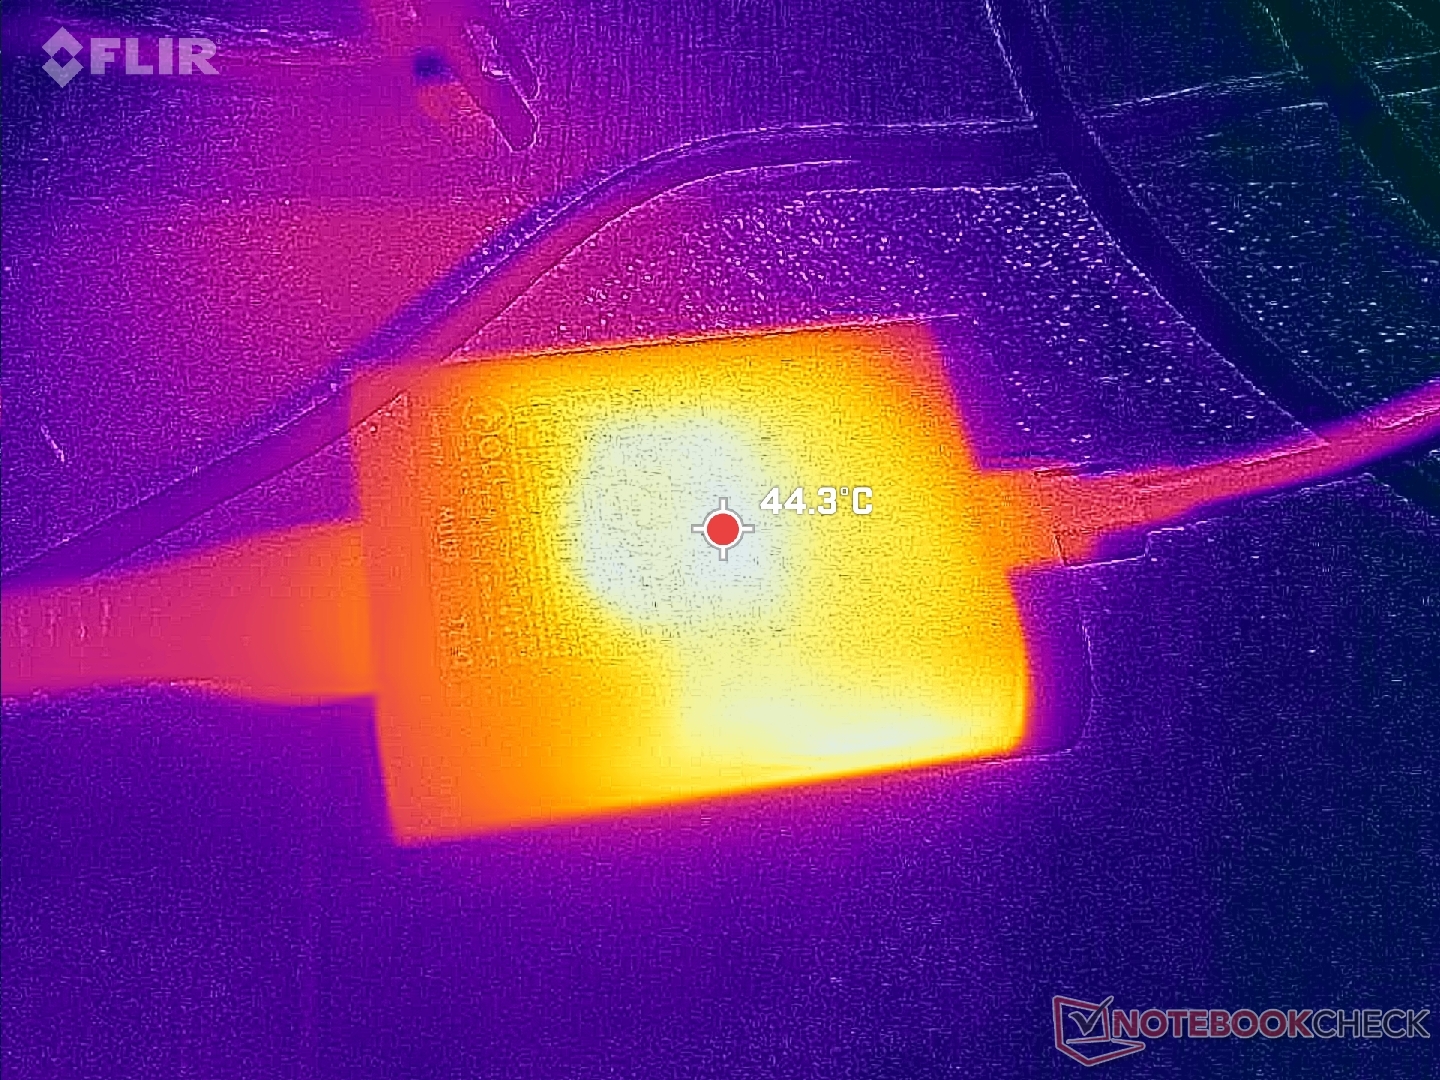
(±) A temperatura máxima no lado superior é 43.8 °C / 111 F, em comparação com a média de 35.9 °C / 97 F , variando de 21.4 a 59 °C para a classe Subnotebook.
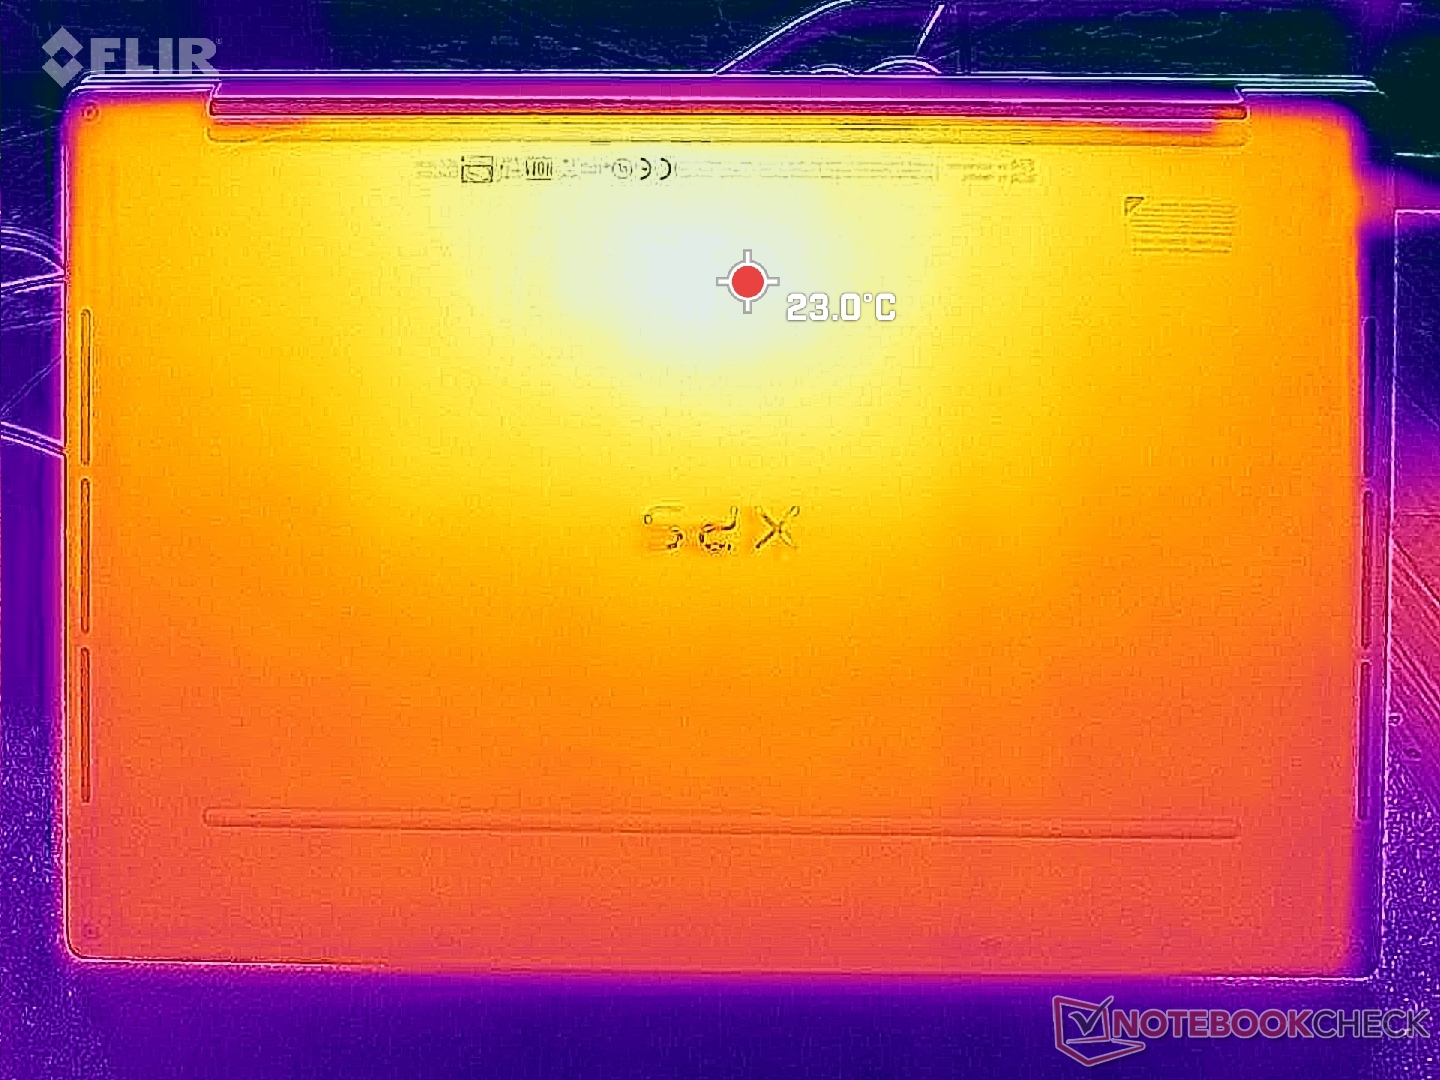
(±) A parte inferior aquece até um máximo de 44.4 °C / 112 F, em comparação com a média de 39.2 °C / 103 F
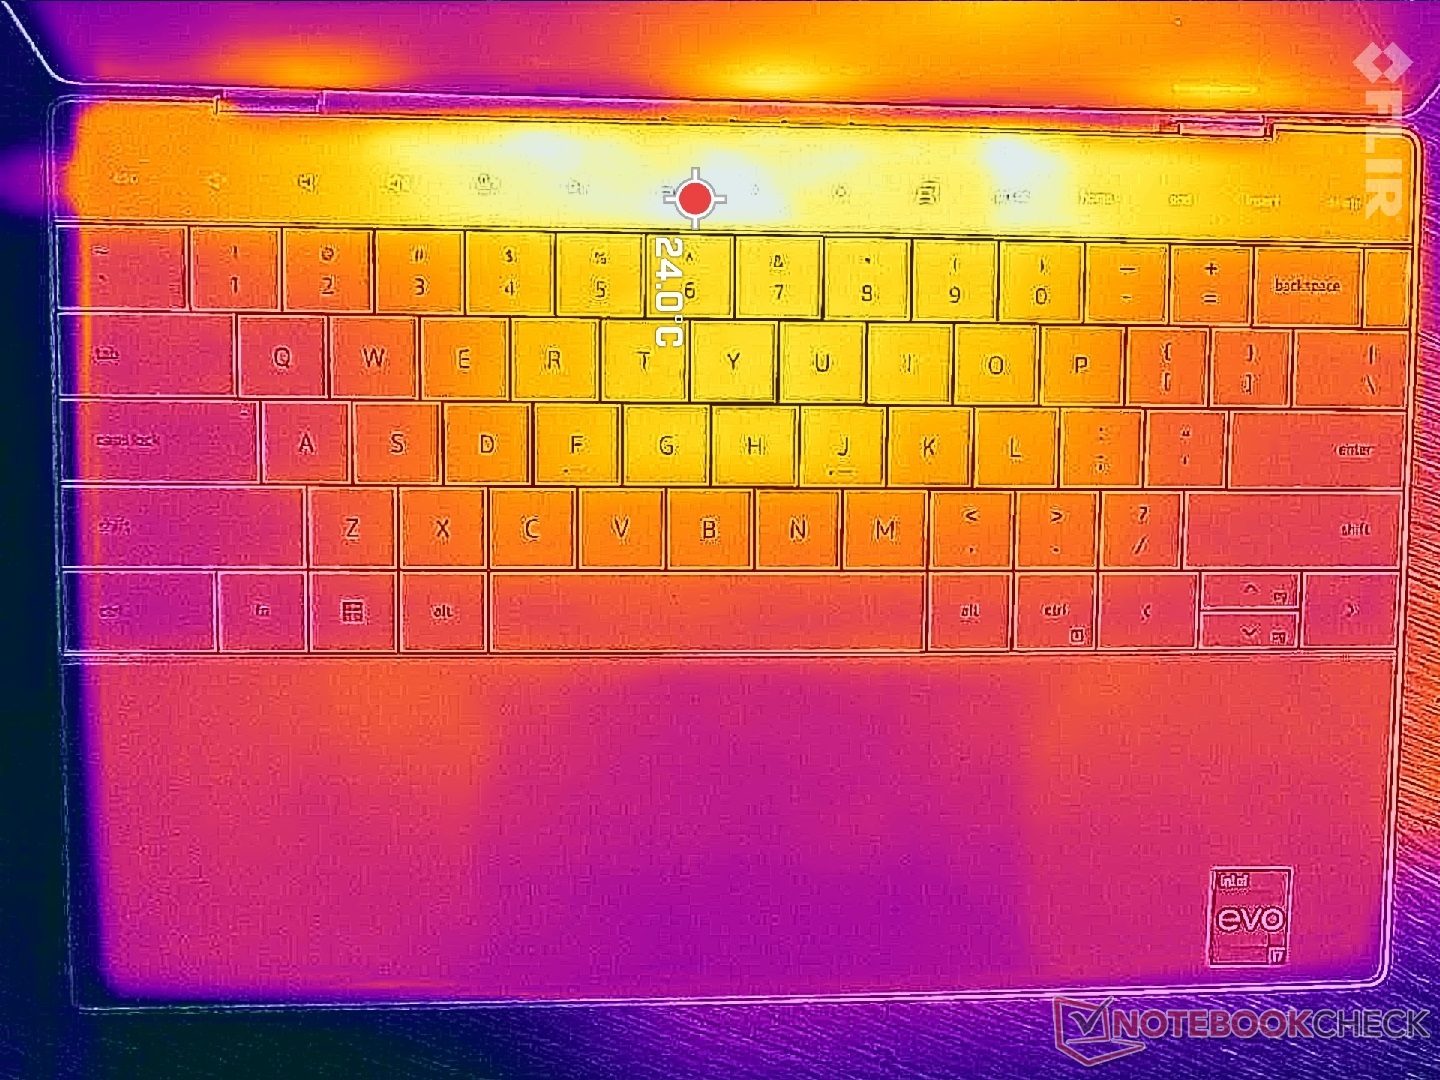
(+) Em uso inativo, a temperatura média para o lado superior é 22.4 °C / 72 F, em comparação com a média do dispositivo de 30.8 °C / ### class_avg_f### F.
(±) Jogando The Witcher 3, a temperatura média para o lado superior é 32.9 °C / 91 F, em comparação com a média do dispositivo de 30.8 °C / ## #class_avg_f### F.
(+) Os apoios para as mãos e o touchpad estão atingindo a temperatura máxima da pele (32.6 °C / 90.7 F) e, portanto, não estão quentes.
(-) A temperatura média da área do apoio para as mãos de dispositivos semelhantes foi 28.2 °C / 82.8 F (-4.4 °C / -7.9 F).
| Dell XPS 13 Plus 9320 Core i7-1360P Intel Core i7-1360P, Intel Iris Xe Graphics G7 96EUs | Dell XPS 13 Plus 9320 i5-1240p Intel Core i5-1240P, Intel Iris Xe Graphics G7 80EUs | Dell XPS 13 7390 Core i7-10710U Intel Core i7-10710U, Intel UHD Graphics 620 | Framework Laptop 13.5 13th Gen Intel Intel Core i7-1370P, Intel Iris Xe Graphics G7 96EUs | Lenovo ThinkPad X13 Yoga G3 21AW003UGE Intel Core i7-1265U, Intel Iris Xe Graphics G7 96EUs | HP Spectre x360 13.5 14t-ef000 Intel Core i7-1255U, Intel Iris Xe Graphics G7 96EUs | |
|---|---|---|---|---|---|---|
| Heat | -41% | -13% | 1% | -25% | 14% | |
| Maximum Upper Side * (°C) | 43.8 | 47.6 -9% | 44.6 -2% | 38.2 13% | 52.2 -19% | 36.4 17% |
| Maximum Bottom * (°C) | 44.4 | 57 -28% | 49.2 -11% | 41.4 7% | 50.2 -13% | 37 17% |
| Idle Upper Side * (°C) | 24 | 38.8 -62% | 28.2 -18% | 25.8 -8% | 32 -33% | 20.8 13% |
| Idle Bottom * (°C) | 25.2 | 41 -63% | 30.2 -20% | 27.6 -10% | 33.6 -33% | 22.6 10% |
* ... menor é melhor
Teste de estresse
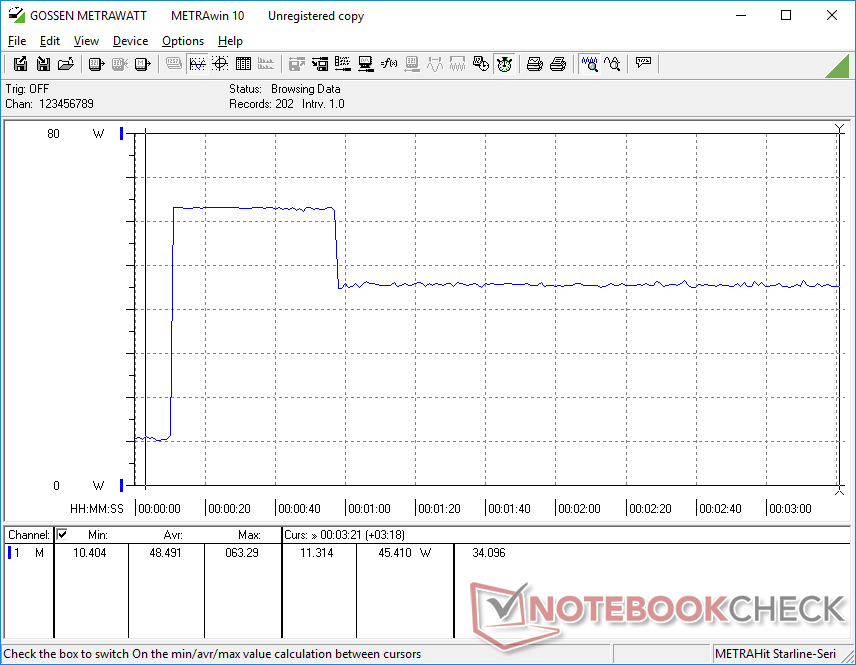
Quando estressado no Prime95, os limites PL2 e PL1 do Core i7-1360P são exatamente os mesmos que observamos no XPS 13 Plus com Core i7-1280P do ano passado, com 64 W e 34 W, respectivamente. As taxas de clock aumentavam até 3,6 GHz durante o primeiro segundo, mais ou menos, antes de cair e finalmente se estabilizar em 2,3 GHz e 90 C. A temperatura muito quente da CPU é parcialmente responsável pelas altas temperaturas de superfície mencionadas acima.
A execução com baterias não afeta o desempenho. Um teste 3DMark 11 com a bateria resultaria essencialmente nas mesmas pontuações que com a rede elétrica.
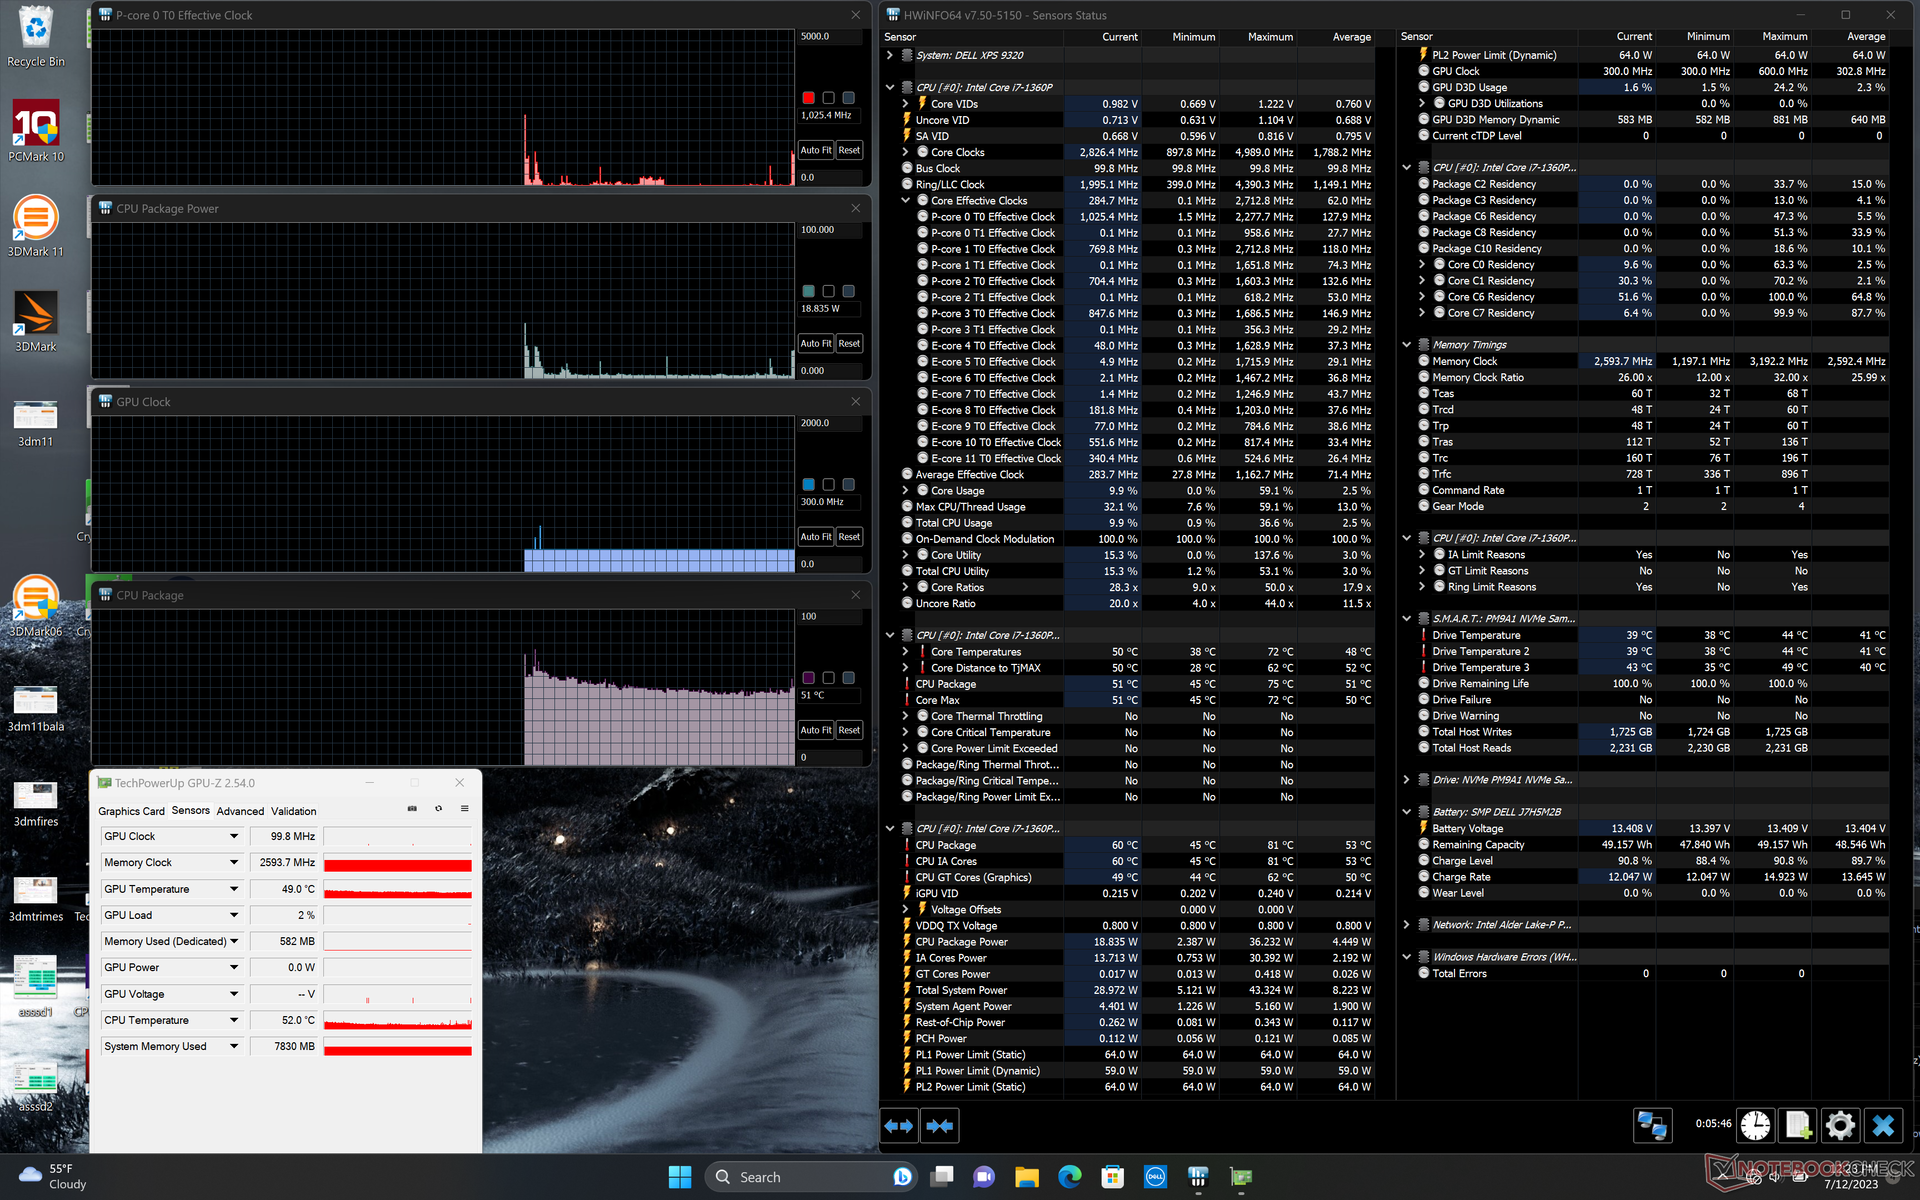
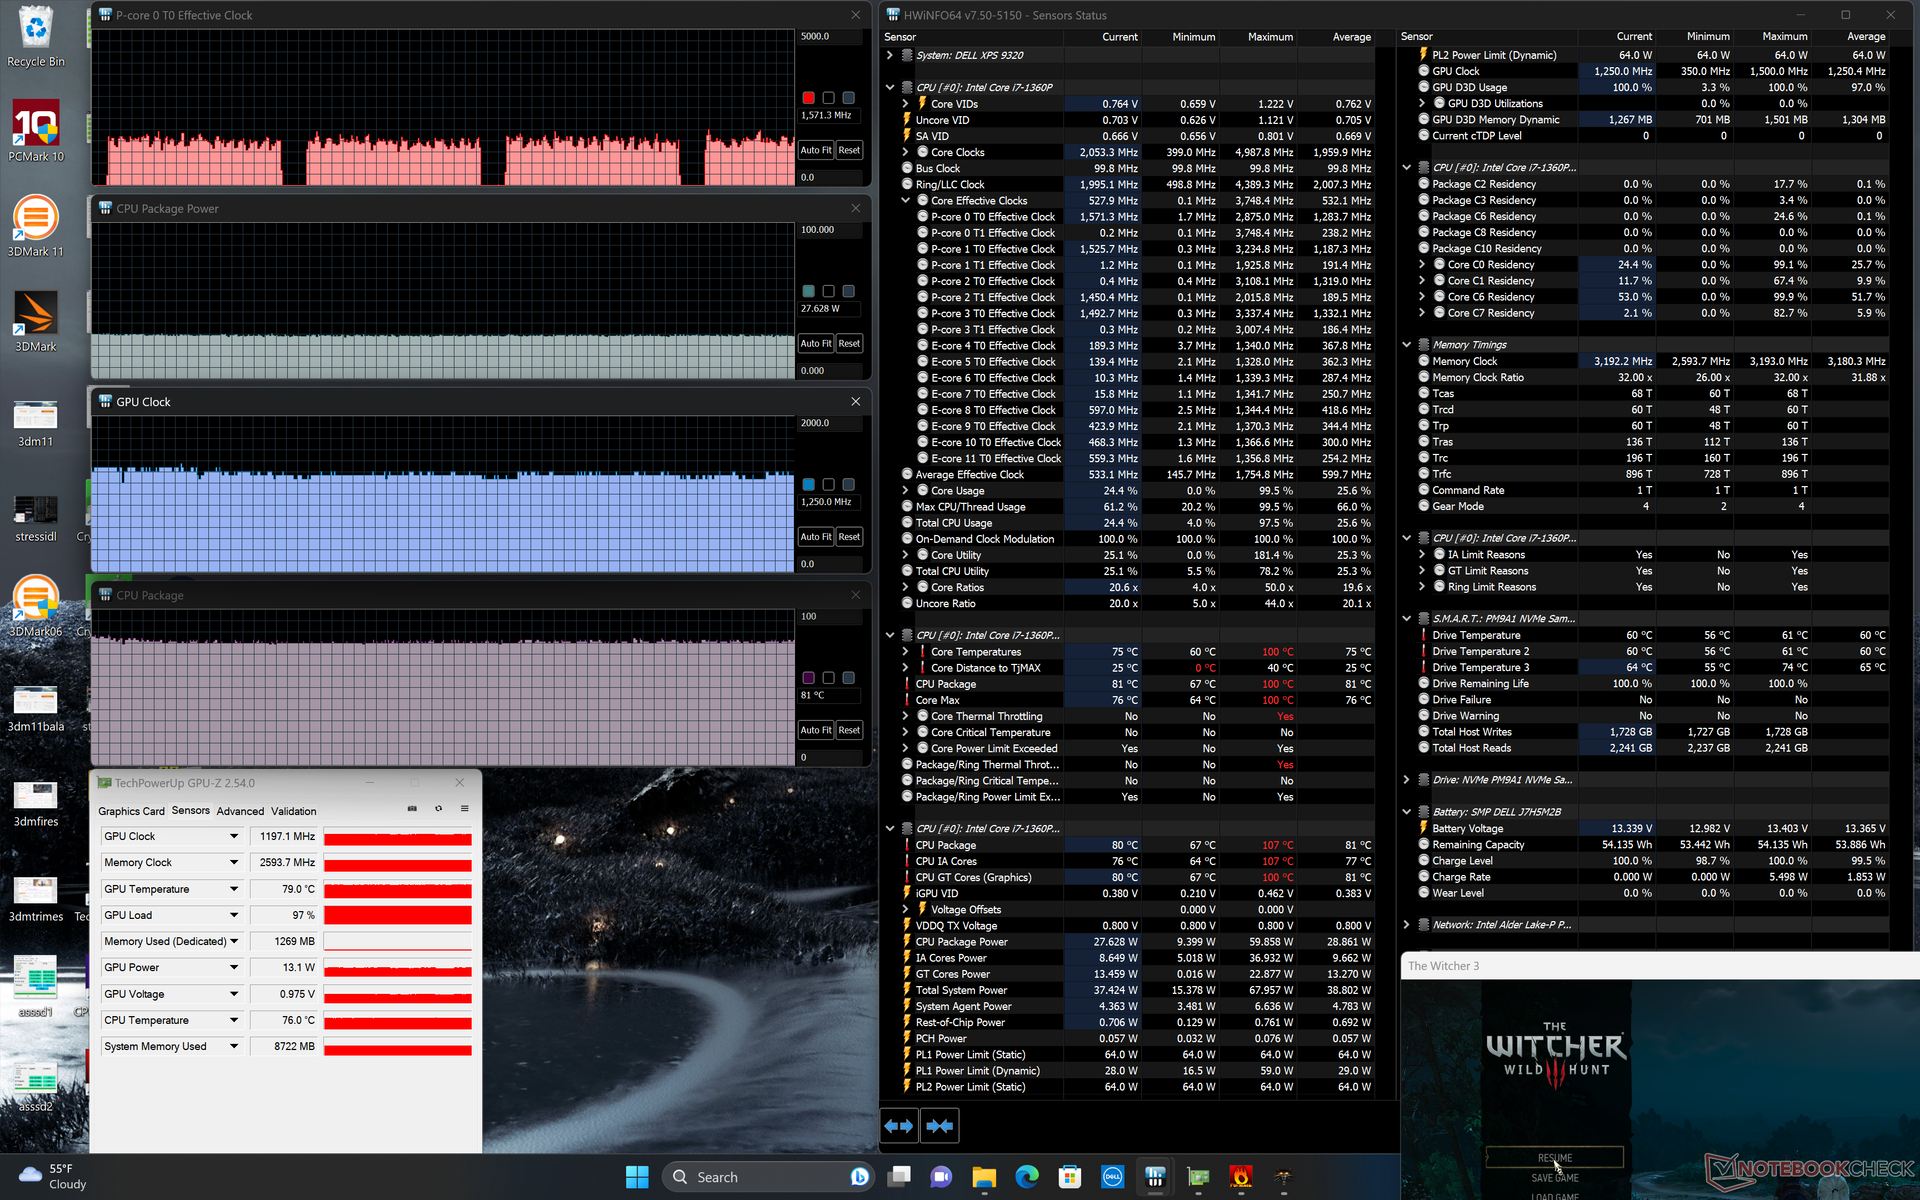
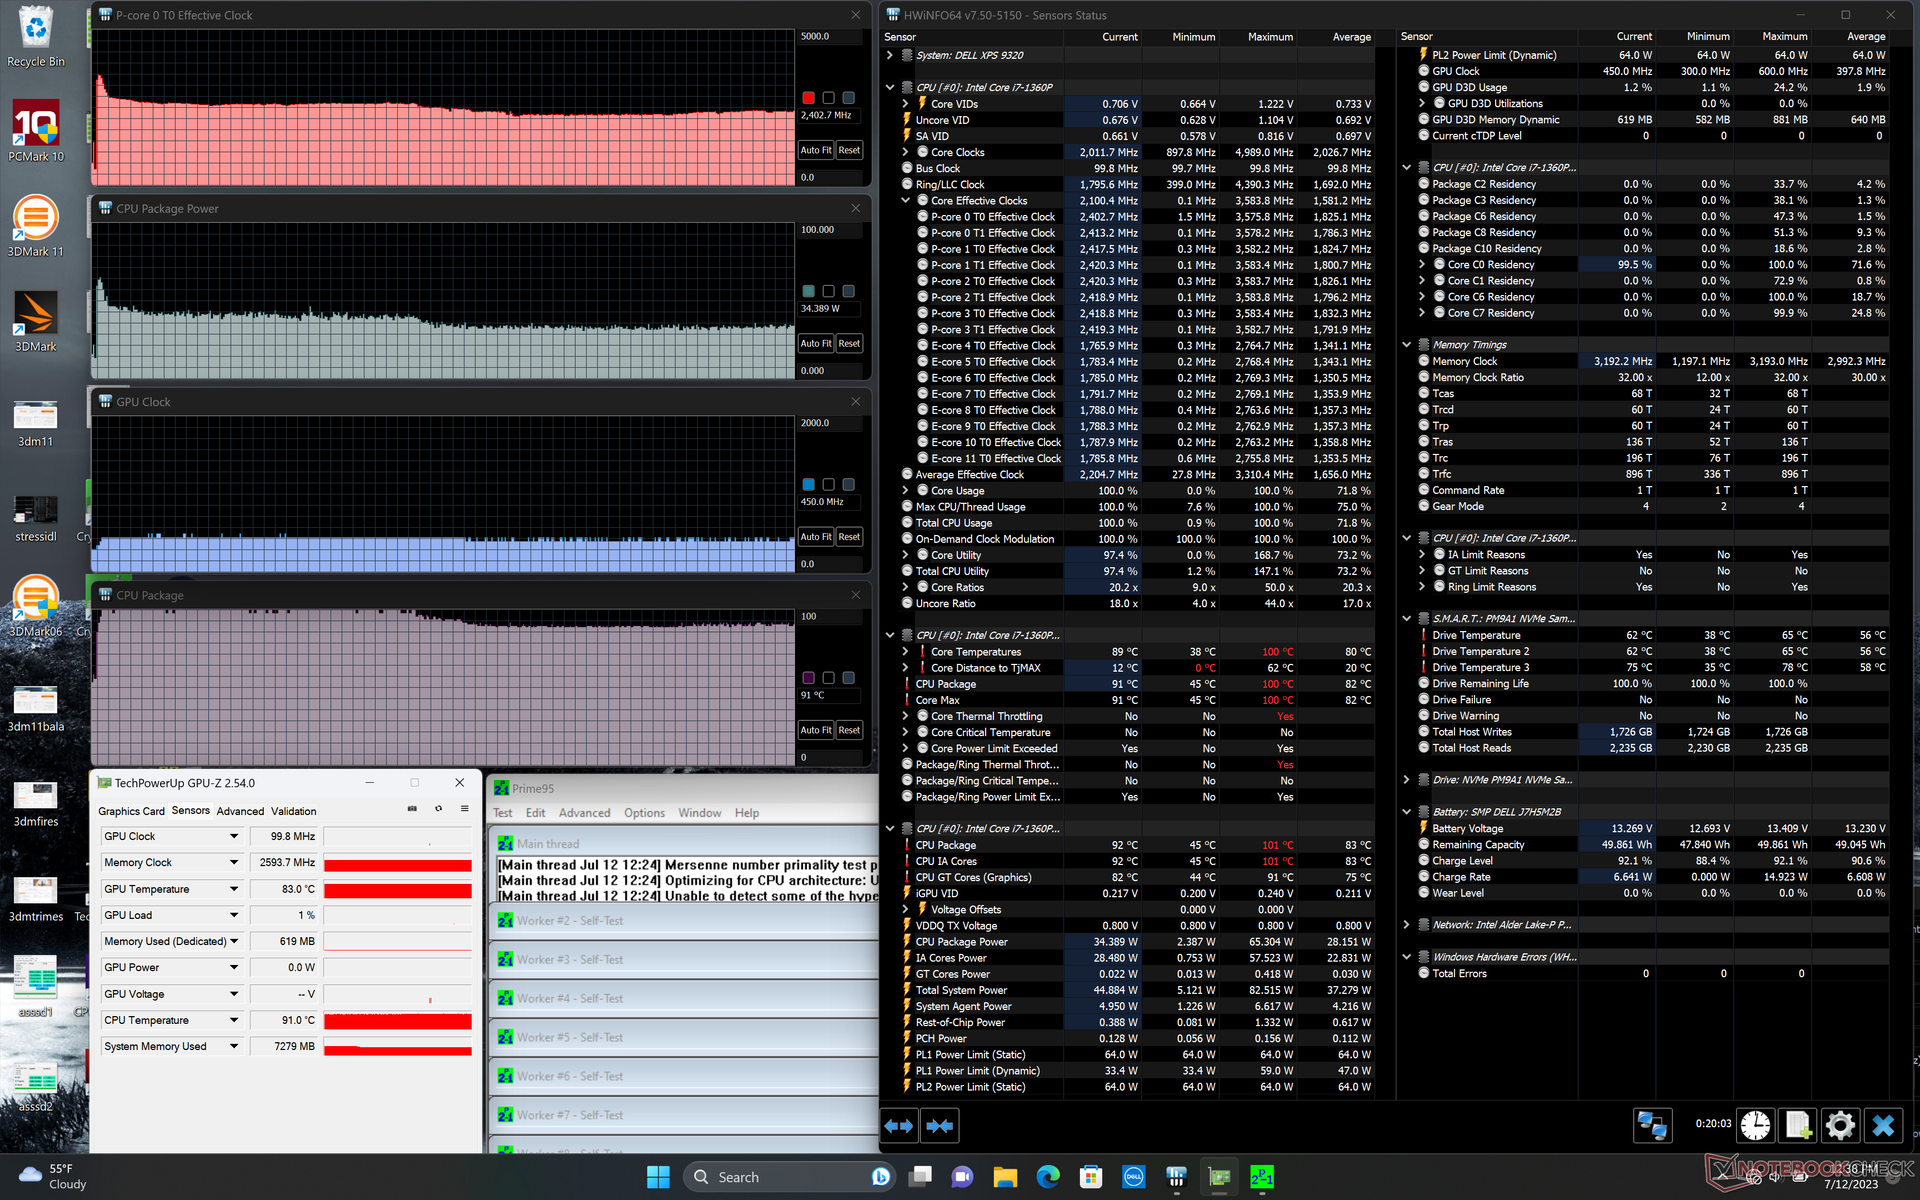
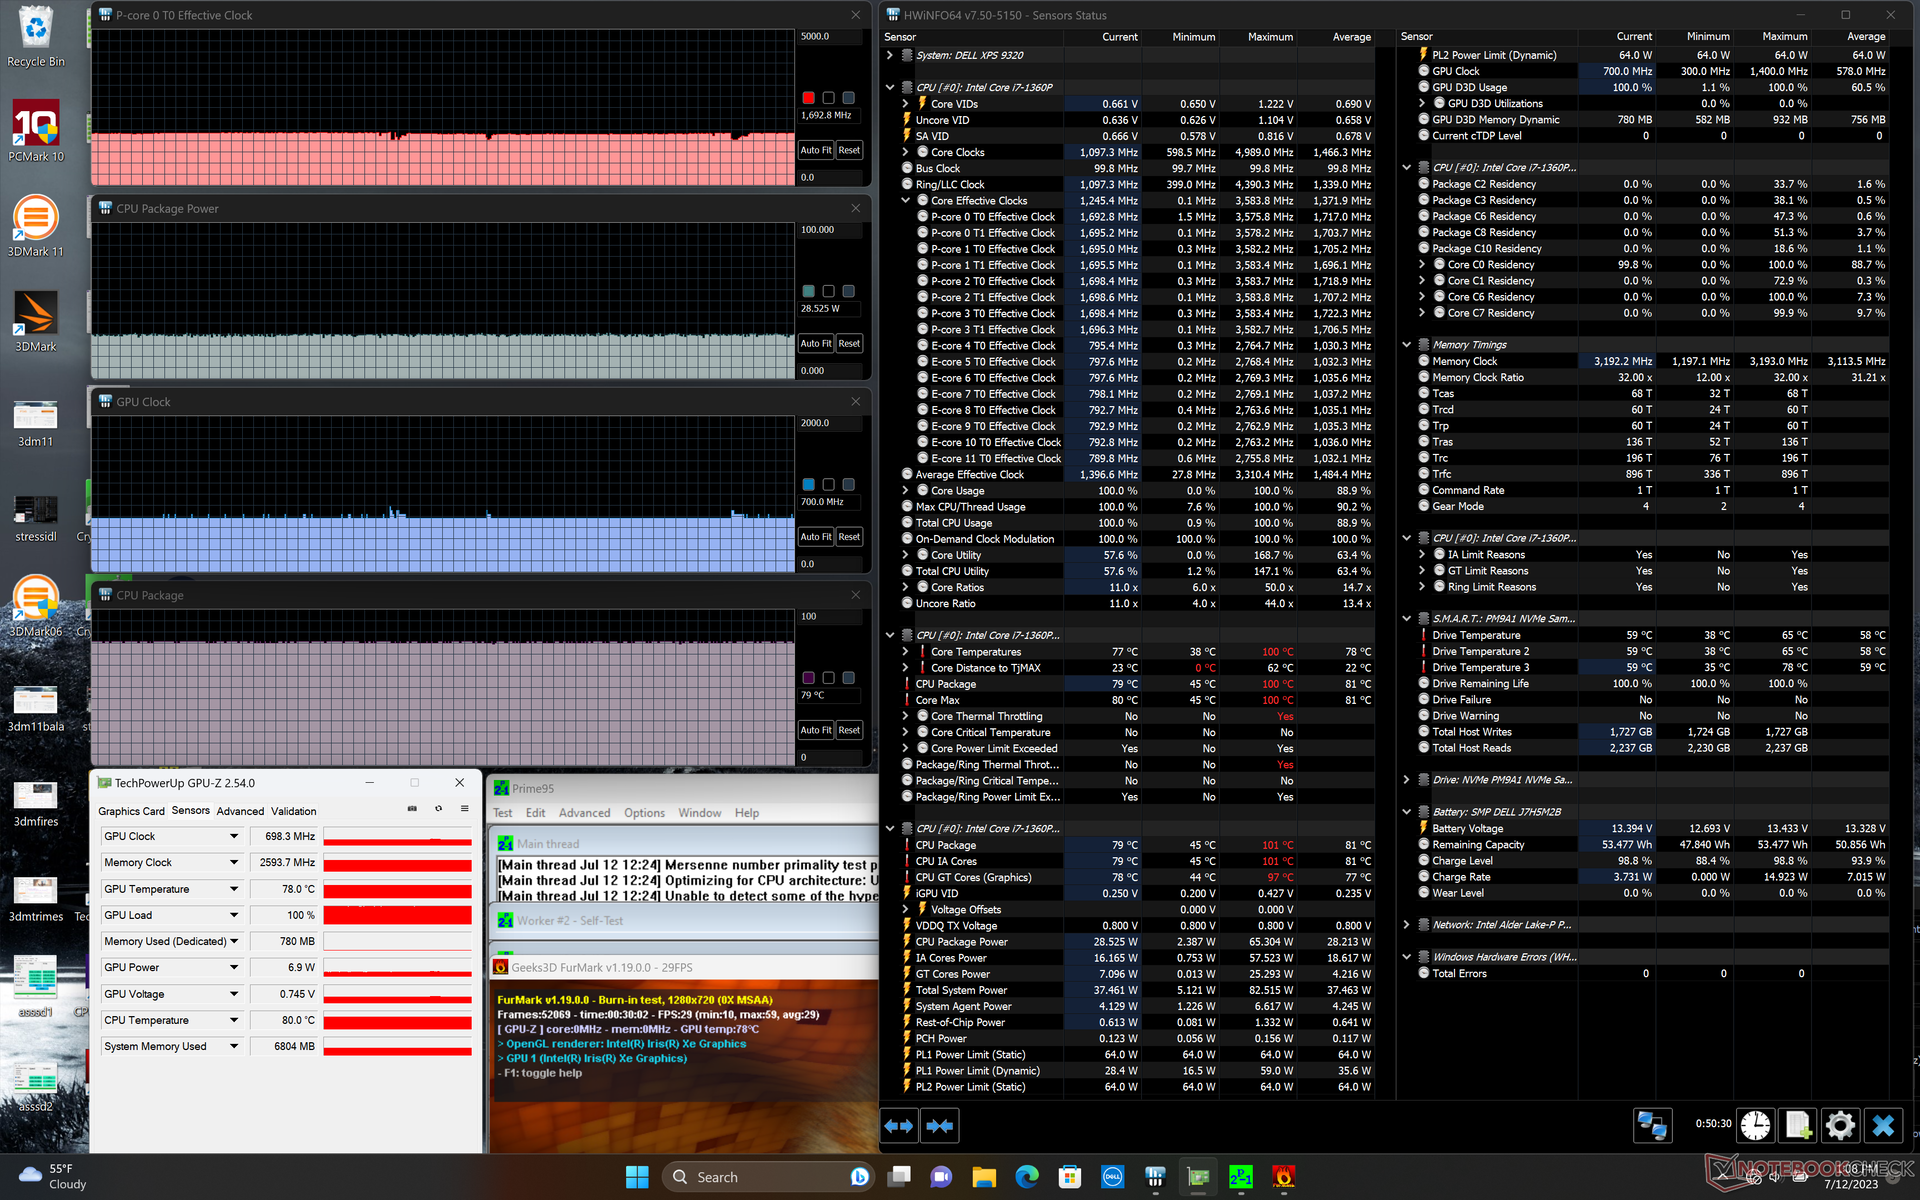
| Clock da CPU (GHz) | Clock da GPU (MHz) | Temperatura média da CPU (°C) | |
| Sistema ocioso | -- | -- | 51 |
| Estresse doPrime95 | 2.4 | -- | 91 |
| Estresse doPrime95 + FurMark | 1.7 | 700 | 79 |
| Witcher 3 Estresse | ~1,6 | 1250 | 81 |
Alto-falantes
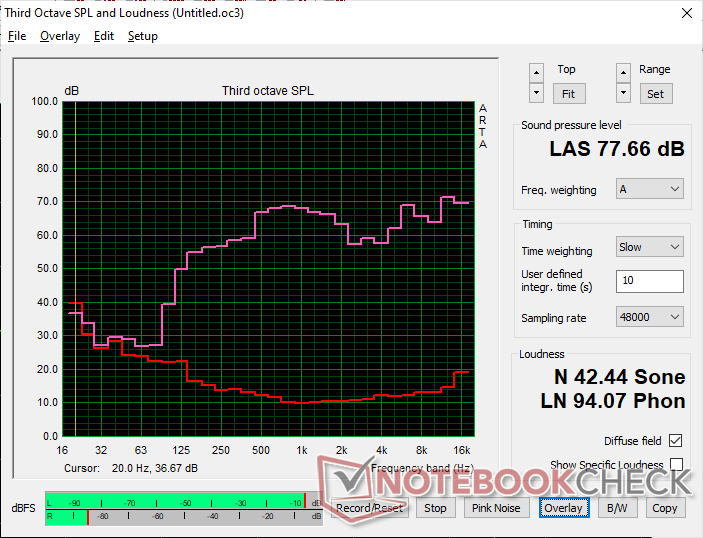
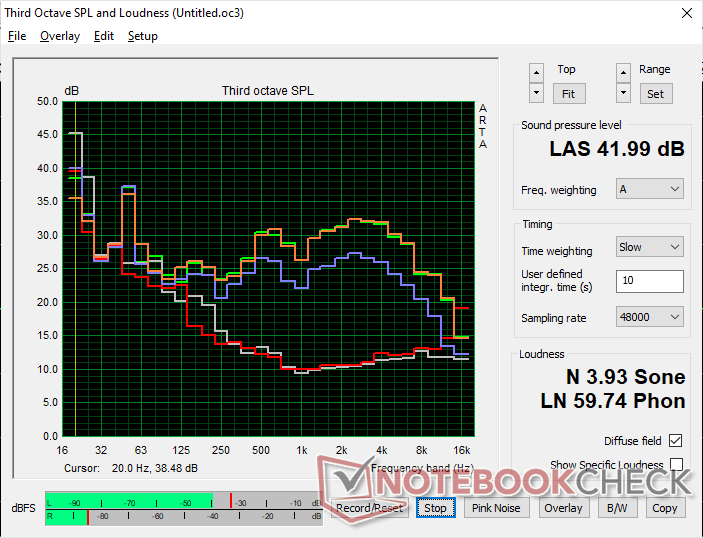
Dell XPS 13 Plus 9320 Core i7-1360P análise de áudio
(±) | o volume do alto-falante é médio, mas bom (###valor### dB)
Graves 100 - 315Hz
(±) | graves reduzidos - em média 10.8% menor que a mediana
(±) | a linearidade dos graves é média (10.2% delta para a frequência anterior)
Médios 400 - 2.000 Hz
(+) | médios equilibrados - apenas 3.6% longe da mediana
(+) | médios são lineares (3.8% delta para frequência anterior)
Altos 2 - 16 kHz
(+) | agudos equilibrados - apenas 3.6% longe da mediana
(±) | a linearidade dos máximos é média (7.4% delta para frequência anterior)
Geral 100 - 16.000 Hz
(+) | o som geral é linear (13.2% diferença em relação à mediana)
Comparado com a mesma classe
» 22% de todos os dispositivos testados nesta classe foram melhores, 5% semelhantes, 74% piores
» O melhor teve um delta de 5%, a média foi 18%, o pior foi 53%
Comparado com todos os dispositivos testados
» 13% de todos os dispositivos testados foram melhores, 3% semelhantes, 84% piores
» O melhor teve um delta de 4%, a média foi 23%, o pior foi 134%
Apple MacBook Pro 16 2021 M1 Pro análise de áudio
(+) | os alto-falantes podem tocar relativamente alto (###valor### dB)
Graves 100 - 315Hz
(+) | bons graves - apenas 3.8% longe da mediana
(+) | o baixo é linear (5.2% delta para a frequência anterior)
Médios 400 - 2.000 Hz
(+) | médios equilibrados - apenas 1.3% longe da mediana
(+) | médios são lineares (2.1% delta para frequência anterior)
Altos 2 - 16 kHz
(+) | agudos equilibrados - apenas 1.9% longe da mediana
(+) | os máximos são lineares (2.7% delta da frequência anterior)
Geral 100 - 16.000 Hz
(+) | o som geral é linear (4.6% diferença em relação à mediana)
Comparado com a mesma classe
» 0% de todos os dispositivos testados nesta classe foram melhores, 0% semelhantes, 100% piores
» O melhor teve um delta de 5%, a média foi 17%, o pior foi 45%
Comparado com todos os dispositivos testados
» 0% de todos os dispositivos testados foram melhores, 0% semelhantes, 100% piores
» O melhor teve um delta de 4%, a média foi 23%, o pior foi 134%
Gerenciamento de energia
Consumo de energia
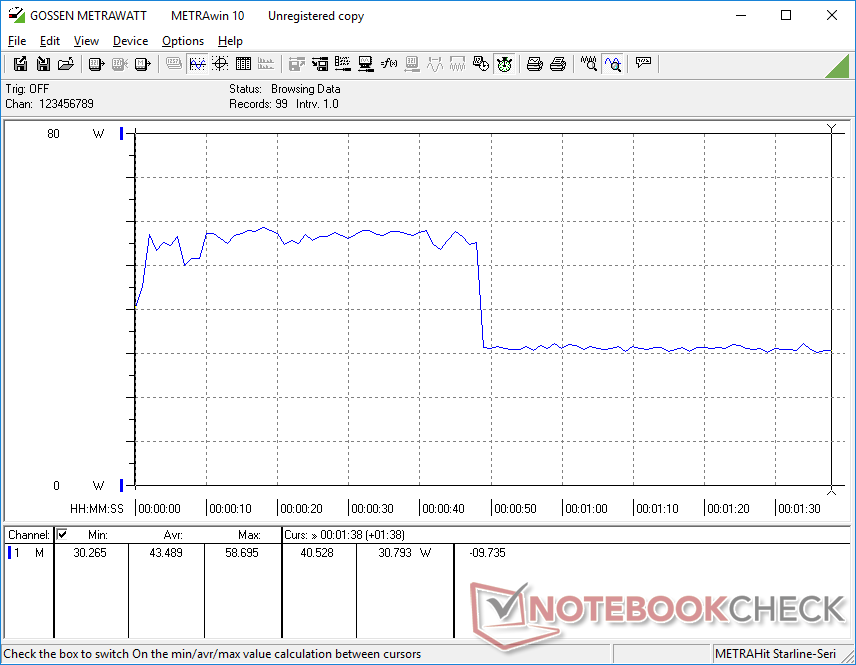
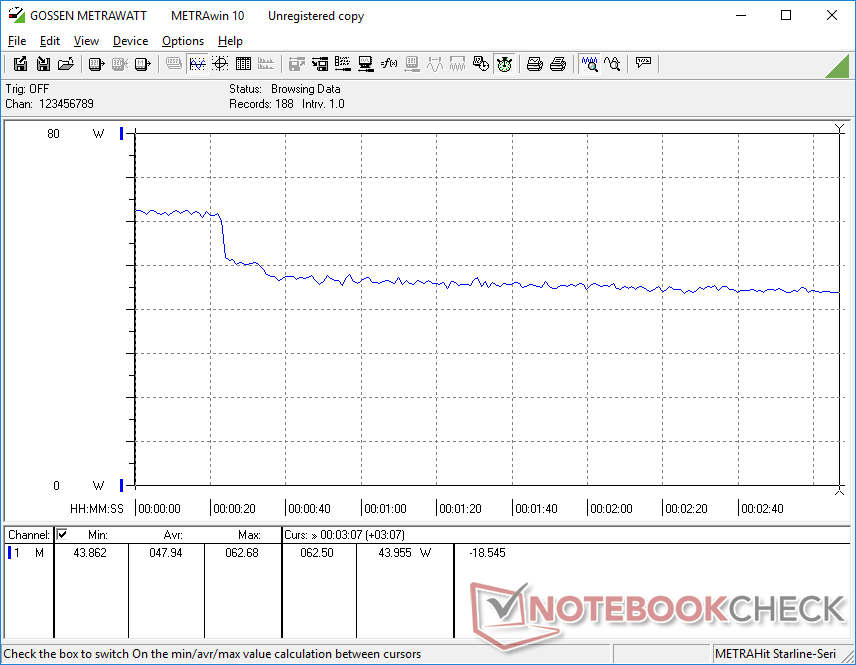
A marcha lenta no desktop pode consumir entre 6 W e 14 W, o que é uma faixa mais ampla do que na maioria dos outros subnotebooks, devido à tela OLED mais exigente. Conforme detalhado em nosso artigo aquideterminadas cores exigirão mais energia em um painel OLED, enquanto o consumo de energia é independente da cor no IPS.
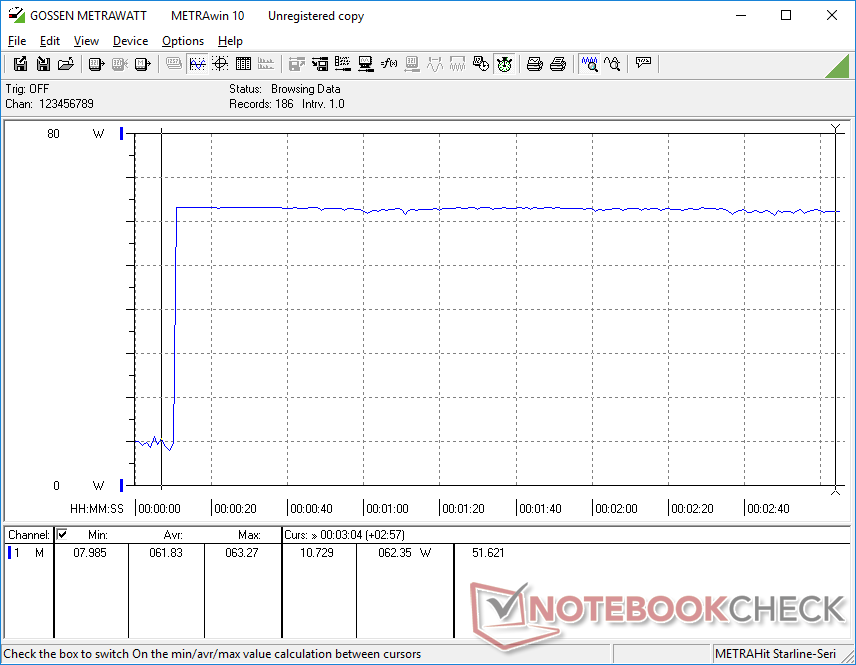
O consumo geral de energia é semelhante ao modelo do ano passado, apesar da nova geração da CPU. A execução do Prime95, por exemplo, exigiria cerca de 63 W de cada sistema, o que significa que os benefícios de desempenho por watt do Core i7-1360P de 13ª geração não são melhores do que os do Core i7-1280P de 12ª geração.
| desligado | |
| Ocioso | |
| Carga |
|
Key:
min: | |
| Dell XPS 13 Plus 9320 Core i7-1360P i7-1360P, Iris Xe G7 96EUs, Samsung PM9A1 MZVL2512HCJQ, OLED, 3456x2160, 13.4" | Dell XPS 13 Plus 9320 i7-1280P OLED i7-1280P, Iris Xe G7 96EUs, WDC PC SN810 512GB, OLED, 3456x2160, 13.4" | Dell XPS 13 7390 Core i7-10710U i7-10710U, UHD Graphics 620, SK Hynix PC601 NVMe 512 GB, IPS, 3840x2160, 13.3" | Framework Laptop 13.5 13th Gen Intel i7-1370P, Iris Xe G7 96EUs, WD PC SN740 SDDPNQD-1T00, IPS, 2256x1504, 13.5" | Lenovo ThinkPad X13 Yoga G3 21AW003UGE i7-1265U, Iris Xe G7 96EUs, Samsung PM9A1 MZVL2512HCJQ, IPS LED, 2560x1600, 13.3" | HP Spectre x360 13.5 14t-ef000 i7-1255U, Iris Xe G7 96EUs, Micron 3400 1TB MTFDKBA1T0TFH, OLED, 3000x2000, 13.5" | |
|---|---|---|---|---|---|---|
| Power Consumption | -5% | 16% | 10% | 7% | 16% | |
| Idle Minimum * (Watt) | 6.9 | 6.5 6% | 4.7 32% | 2.9 58% | 4.6 33% | 4 42% |
| Idle Average * (Watt) | 7.4 | 7.8 -5% | 8.3 -12% | 6.3 15% | 7.9 -7% | 4.9 34% |
| Idle Maximum * (Watt) | 13.6 | 13 4% | 9 34% | 9.9 27% | 8.9 35% | 12.5 8% |
| Load Average * (Watt) | 43.5 | 56.6 -30% | 42 3% | 56.2 -29% | 56.1 -29% | 48.1 -11% |
| Witcher 3 ultra * (Watt) | 48 | 49.2 -3% | 56.6 -18% | 40.4 16% | 35.8 25% | |
| Load Maximum * (Watt) | 63.3 | 63 -0% | 49 23% | 60.8 4% | 66.1 -4% | 65.2 -3% |
* ... menor é melhor
Power Consumption Witcher 3 / Stresstest
Power Consumption external Monitor
Duração da bateria
Os tempos de execução são praticamente idênticos aos da configuração do Core i7-1260P do ano passado, com cerca de 7,5 horas de uso de navegação no mundo real.
O carregamento da capacidade vazia até a capacidade total com o adaptador incluído leva um pouco mais de 2 horas.
| Dell XPS 13 Plus 9320 Core i7-1360P i7-1360P, Iris Xe G7 96EUs, 55 Wh | Dell XPS 13 Plus 9320 i7-1280P OLED i7-1280P, Iris Xe G7 96EUs, 55 Wh | Dell XPS 13 7390 Core i7-10710U i7-10710U, UHD Graphics 620, 52 Wh | Framework Laptop 13.5 13th Gen Intel i7-1370P, Iris Xe G7 96EUs, 61 Wh | Lenovo ThinkPad X13 Yoga G3 21AW003UGE i7-1265U, Iris Xe G7 96EUs, 52.8 Wh | HP Spectre x360 13.5 14t-ef000 i7-1255U, Iris Xe G7 96EUs, 66 Wh | |
|---|---|---|---|---|---|---|
| Duração da bateria | -21% | 15% | 21% | 11% | 10% | |
| WiFi v1.3 (h) | 7.3 | 5.8 -21% | 8.4 15% | 8.8 21% | 8.1 11% | 8 10% |
| Load (h) | 1.9 | 2.2 | ||||
| Reader / Idle (h) | 20.4 |
Pro
Contra
Veredicto - Pule a versão 2023 e compre a versão 2022
O design do XPS 13 Plus foi lançado no ano passado e, portanto, a atualização deste ano deve ser pequena. Não seria realista supor que houvesse atualizações drásticas no chassi ou nos componentes internos neste momento, mas a atualização de 2023 é infelizmente esquecível, considerando que ela quase não oferece vantagens em termos de desempenho do processador ou desempenho por watt em relação ao ano anterior. Além disso, outros aspectos parecem inconsistentes, como os saltos de quadros durante a reprodução de vídeo e o SSD de estrangulamento. Todas as principais vantagens e desvantagens do XPS 13 Plus 9320 original ainda se aplicam à versão 2023.
O 13º Core i7-1360P parece uma reformulação da 12ª geração do Core i7-1280P. Como resultado, os compradores interessados talvez queiram considerar o XPS 13 Plus 9320 original de 2022 em vez da versão mais recente de 2023.
Se você estiver procurando o XPS 13 Plus 9320, recomendamos o modelo original de 2022, pois ele é mais barato e tem essencialmente o mesmo desempenho que a versão de 2023. Em vez disso, os compradores podem investir o dinheiro economizado em recursos mais tangíveis, como mais RAM, mais armazenamento ou uma tela de resolução mais alta.
Preço e disponibilidade
A Dell agora está enviando o XPS 13 Plus 9320 a partir de US$ 1150 para a configuração básica FHD até US$ 1750 para a configuração 4K UHD.
Dell XPS 13 Plus 9320 Core i7-1360P
- 07/16/2023 v7 (old)
Allen Ngo
Transparência
A seleção dos dispositivos a serem analisados é feita pela nossa equipe editorial. A amostra de teste foi fornecida ao autor como empréstimo pelo fabricante ou varejista para fins desta revisão. O credor não teve influência nesta revisão, nem o fabricante recebeu uma cópia desta revisão antes da publicação. Não houve obrigação de publicar esta revisão. Como empresa de mídia independente, a Notebookcheck não está sujeita à autoridade de fabricantes, varejistas ou editores.
É assim que o Notebookcheck está testando
Todos os anos, o Notebookcheck analisa de forma independente centenas de laptops e smartphones usando procedimentos padronizados para garantir que todos os resultados sejam comparáveis. Desenvolvemos continuamente nossos métodos de teste há cerca de 20 anos e definimos padrões da indústria no processo. Em nossos laboratórios de teste, equipamentos de medição de alta qualidade são utilizados por técnicos e editores experientes. Esses testes envolvem um processo de validação em vários estágios. Nosso complexo sistema de classificação é baseado em centenas de medições e benchmarks bem fundamentados, o que mantém a objetividade.Price comparison

