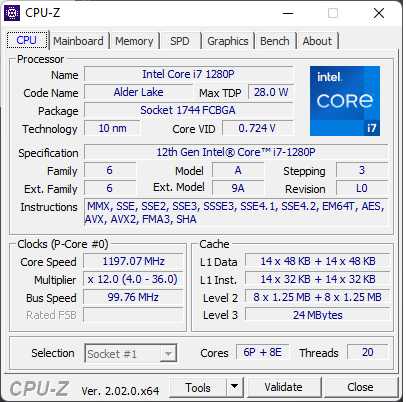
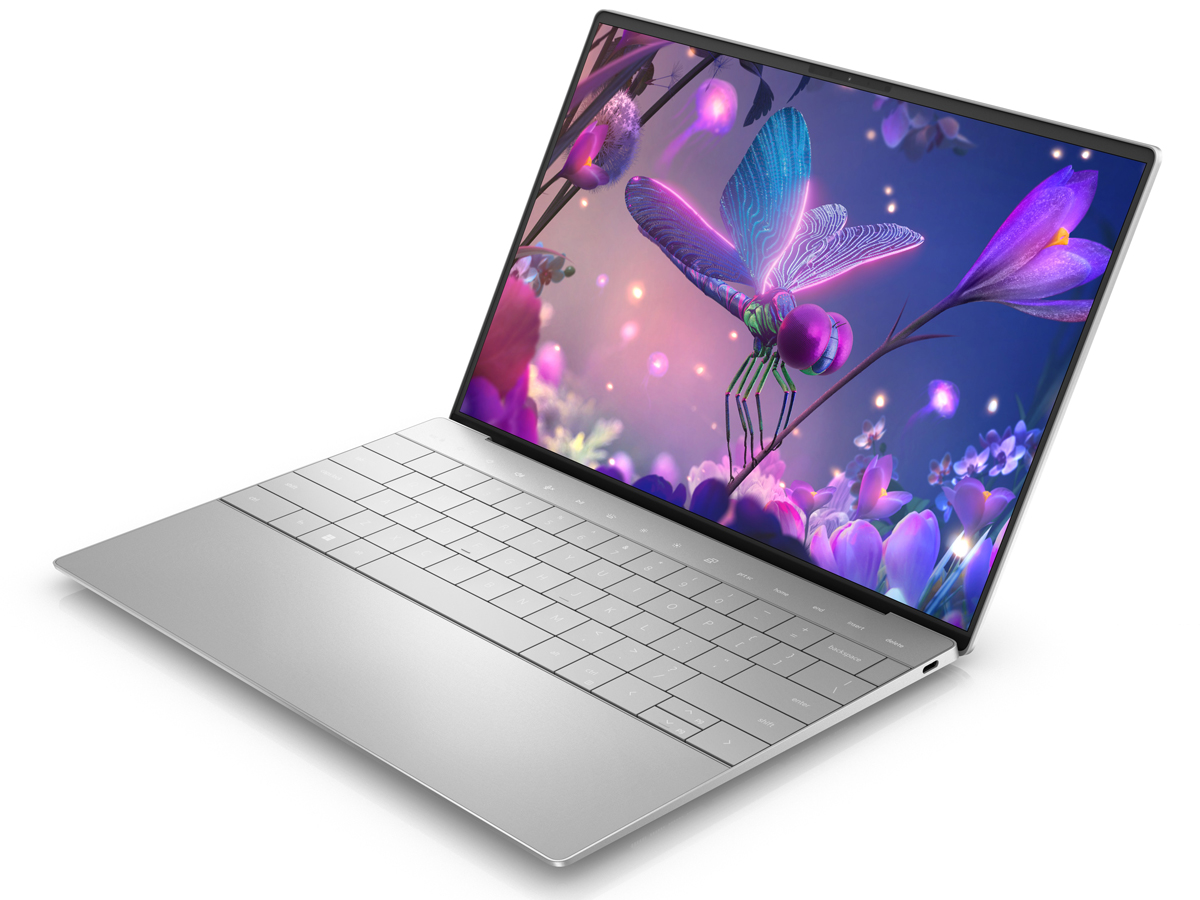
Todos os três SKUs Dell XPS 13 Plus 9320 em revisão: Core i5-1240P, i7-1260P, ou i7-1280P OLED?
Após sua revelação inicial no CES 2022, o 2022 XPS 13 Plus é agora enviado com três opções de processador à escolha (Core i5-1240P, Core i7-1260P e Core i7-1280P), juntamente com três resoluções de exibição diferentes (1920 x 1200 IPS, 3456 x 2160 OLED e 3840 x 2400 IPS). Já testamos as configurações i5-1240P, i7-1260P, IPS 1200p e IPS 2400p, deixando apenas a SKU OLED i7-1280P 2160p
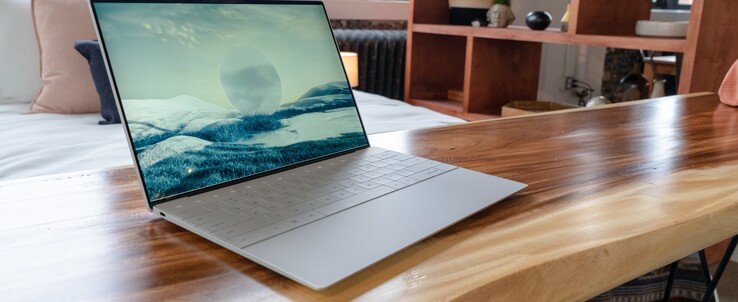
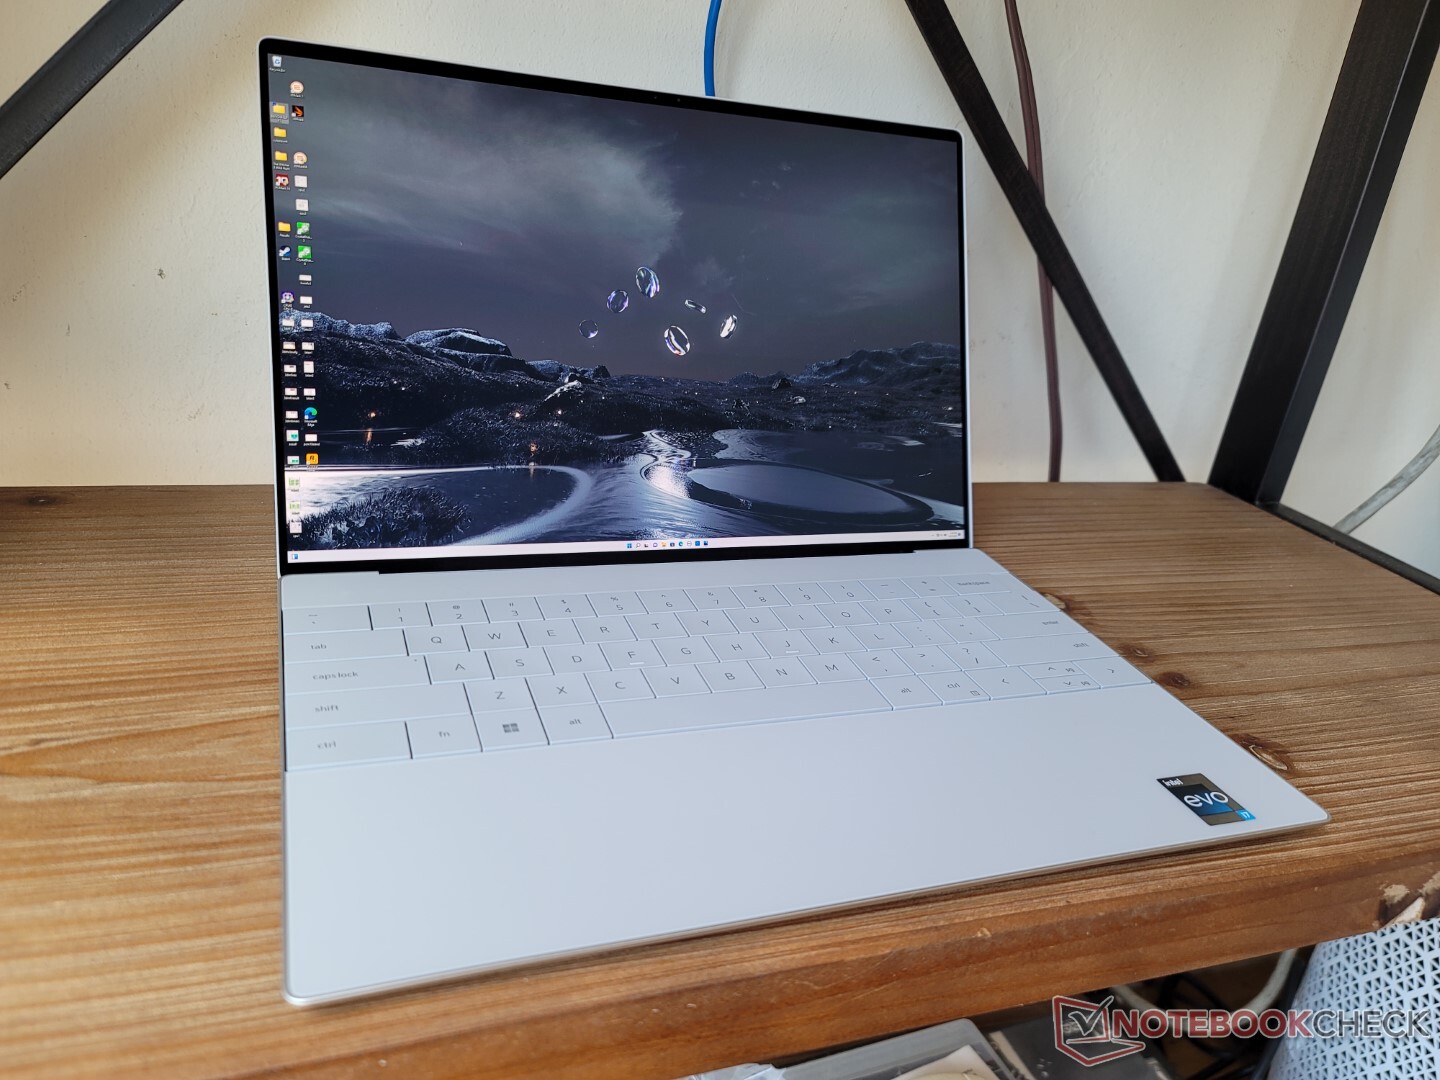
Esta revisão se concentra na configuração OLED i7-1280P e 2160p e nas diferenças que os usuários podem esperar entre ela e as outras opções do XPS 13 Plus. Conforme configurado, a unidade atualmente varredura por $1750 USD. Recomendamos verificar nossa existente duas revisões no XPS 13 Plus para saber mais sobre as características físicas do modelo
Mais análises da Dell
Possíveis concorrentes em comparação
Avaliação | Data | Modelo | Peso | Altura | Size | Resolução | Preço |
|---|---|---|---|---|---|---|---|
| 87.3 % v7 (old) | 09/2022 | Dell XPS 13 Plus 9320 i7-1280P OLED i7-1280P, Iris Xe G7 96EUs | 1.3 kg | 15.28 mm | 13.40" | 3456x2160 | |
| 86.1 % v7 (old) | 08/2022 | Dell XPS 13 Plus 9320 i5-1240p i5-1240P, Iris Xe G7 80EUs | 1.2 kg | 15.3 mm | 13.40" | 1920x1200 | |
| 88.2 % v7 (old) | 08/2022 | Dell XPS 13 9315, i5-1230U i5-1230U, Iris Xe G7 80EUs | 1.2 kg | 14 mm | 13.40" | 1920x1200 | |
| 86.9 % v7 (old) | 07/2022 | Dell XPS 13 Plus 9320 4K i7-1260P, Iris Xe G7 96EUs | 1.2 kg | 15.3 mm | 13.40" | 3840x2400 | |
| 86.7 % v7 (old) | 10/2021 | Dell XPS 13 9310 2-in-1 i7-1165G7, Iris Xe G7 96EUs | 1.3 kg | 14.35 mm | 13.40" | 1920x1200 | |
| 88.3 % v7 (old) | 06/2021 | Dell XPS 13 9310 OLED i7-1185G7, Iris Xe G7 96EUs | 1.2 kg | 14.8 mm | 13.40" | 3456x2160 |
Caso
Mostrar
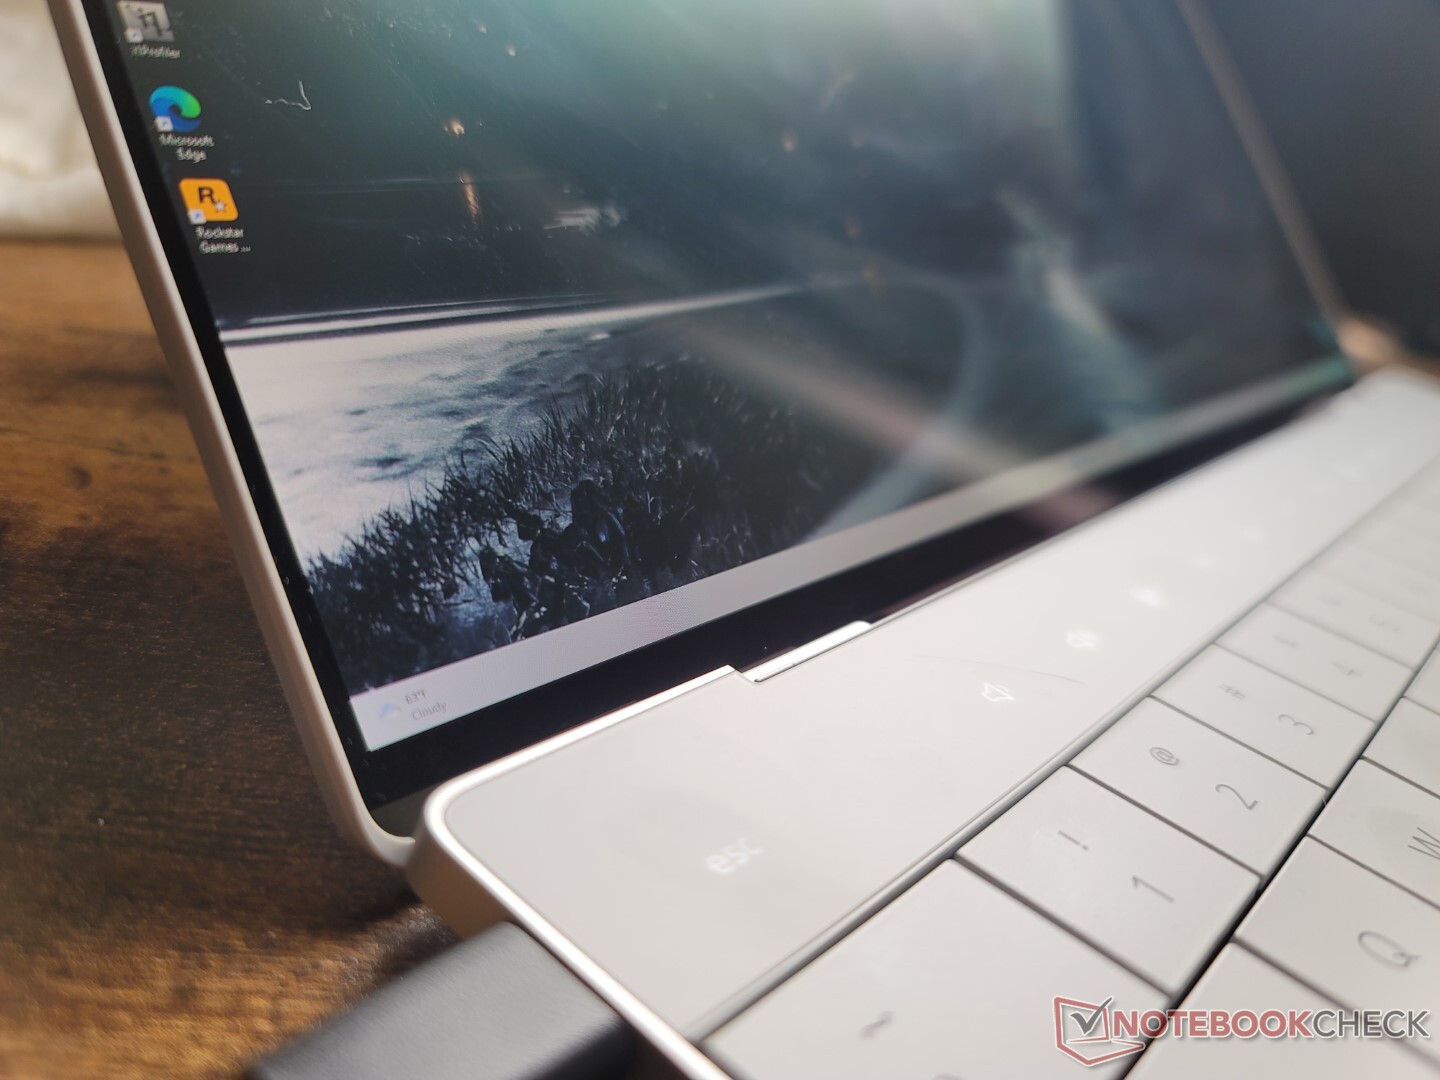
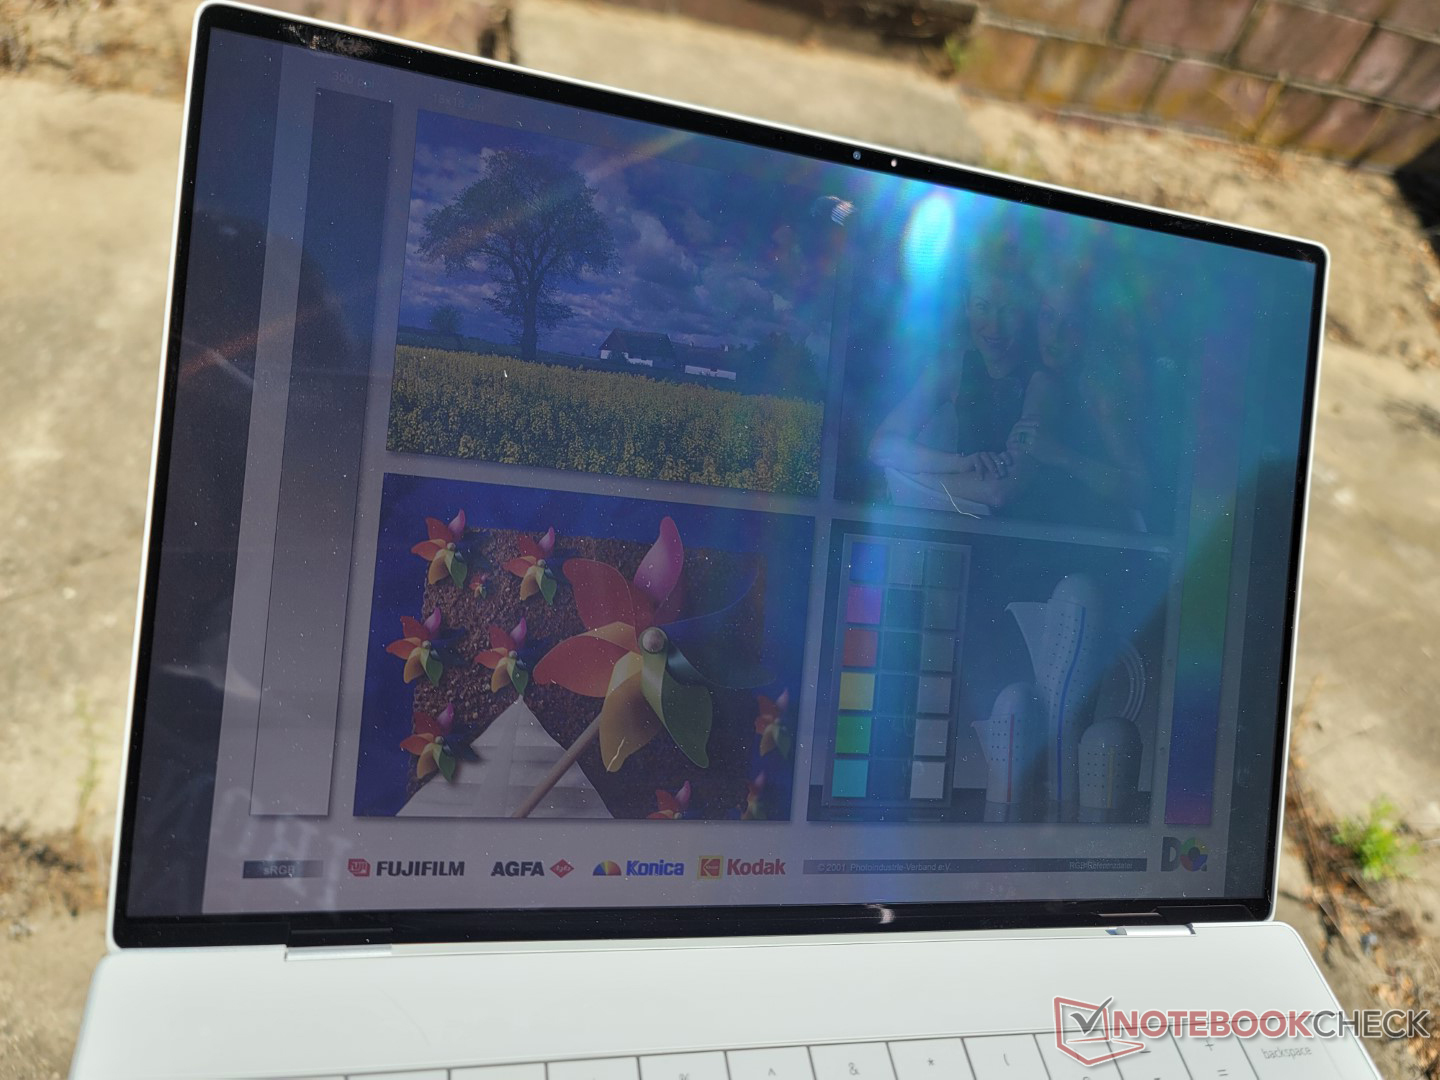
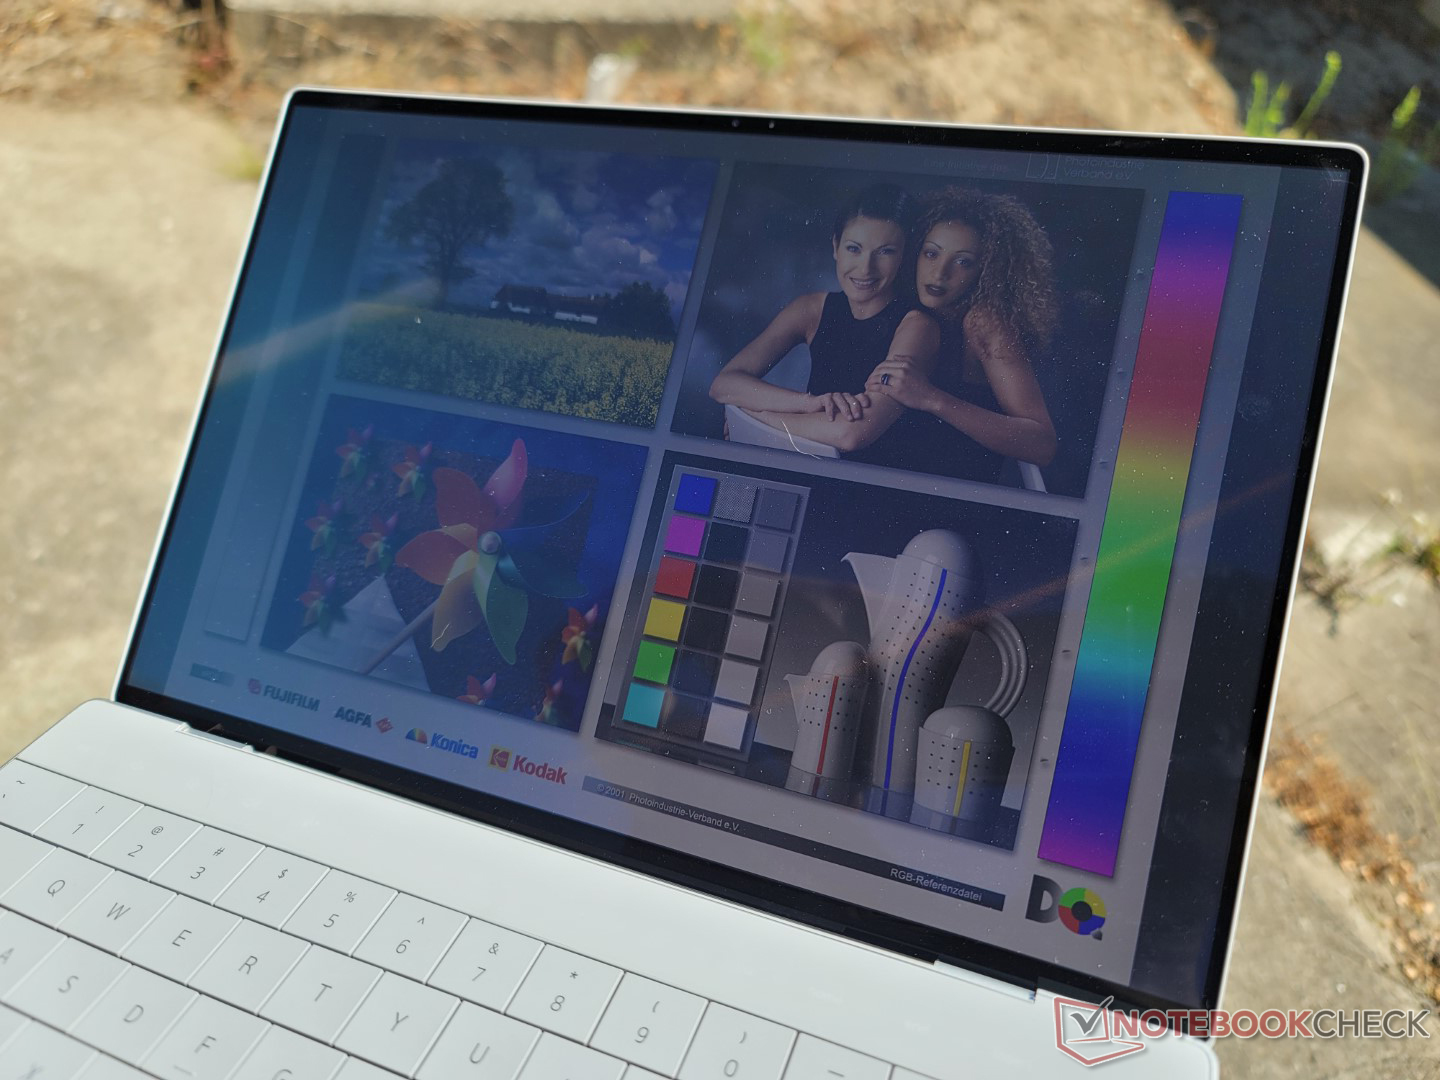
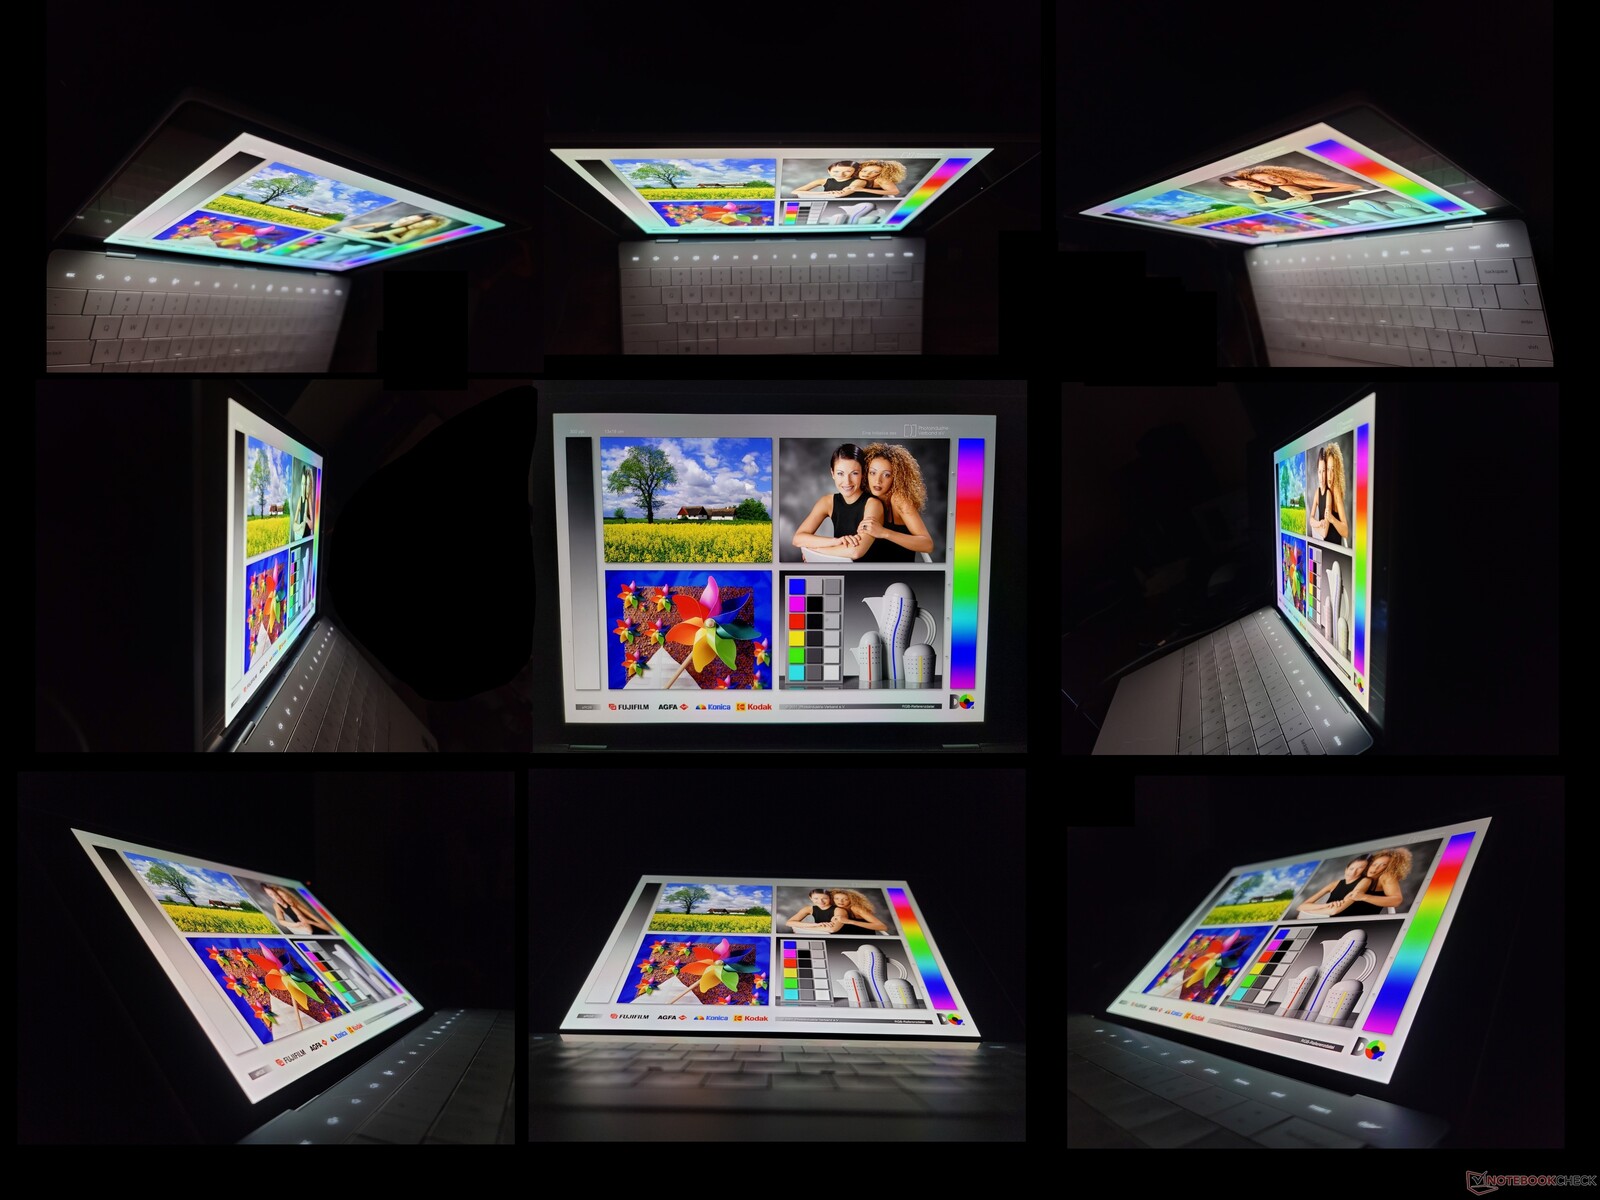
O painel OLED não é a opção final, pois traz vantagens e desvantagens em relação ao IPS. As vantagens incluem melhor uniformidade de brilho, níveis mais profundos de preto, cobertura total de P3 e tempos de resposta significativamente mais rápidos de preto-branco e cinza cinza. As desvantagens incluem a cintilação da tela e uma luminosidade máxima de 100-nit mais fraca. A diferença de brilho não deve ser um problema se trabalhar em ambientes internos, mas os painéis IPS são ligeiramente mais fáceis nos olhos se trabalhar ao ar livre.
Note que o painel OLED aqui é quase exatamente o mesmo que o utilizado para a última geração XPS 13 9310 (Samsung 134XK04 vs. Samsung 134XK01). Se você já viu o XPS 13 9310 OLED antes, então você saberá exatamente o que esperar do XPS 13 Plus 9320 OLED.
| |||||||||||||||||||||||||
iluminação: 98 %
iluminação com acumulador: 371.8 cd/m²
Contraste: ∞:1 (Preto: 0 cd/m²)
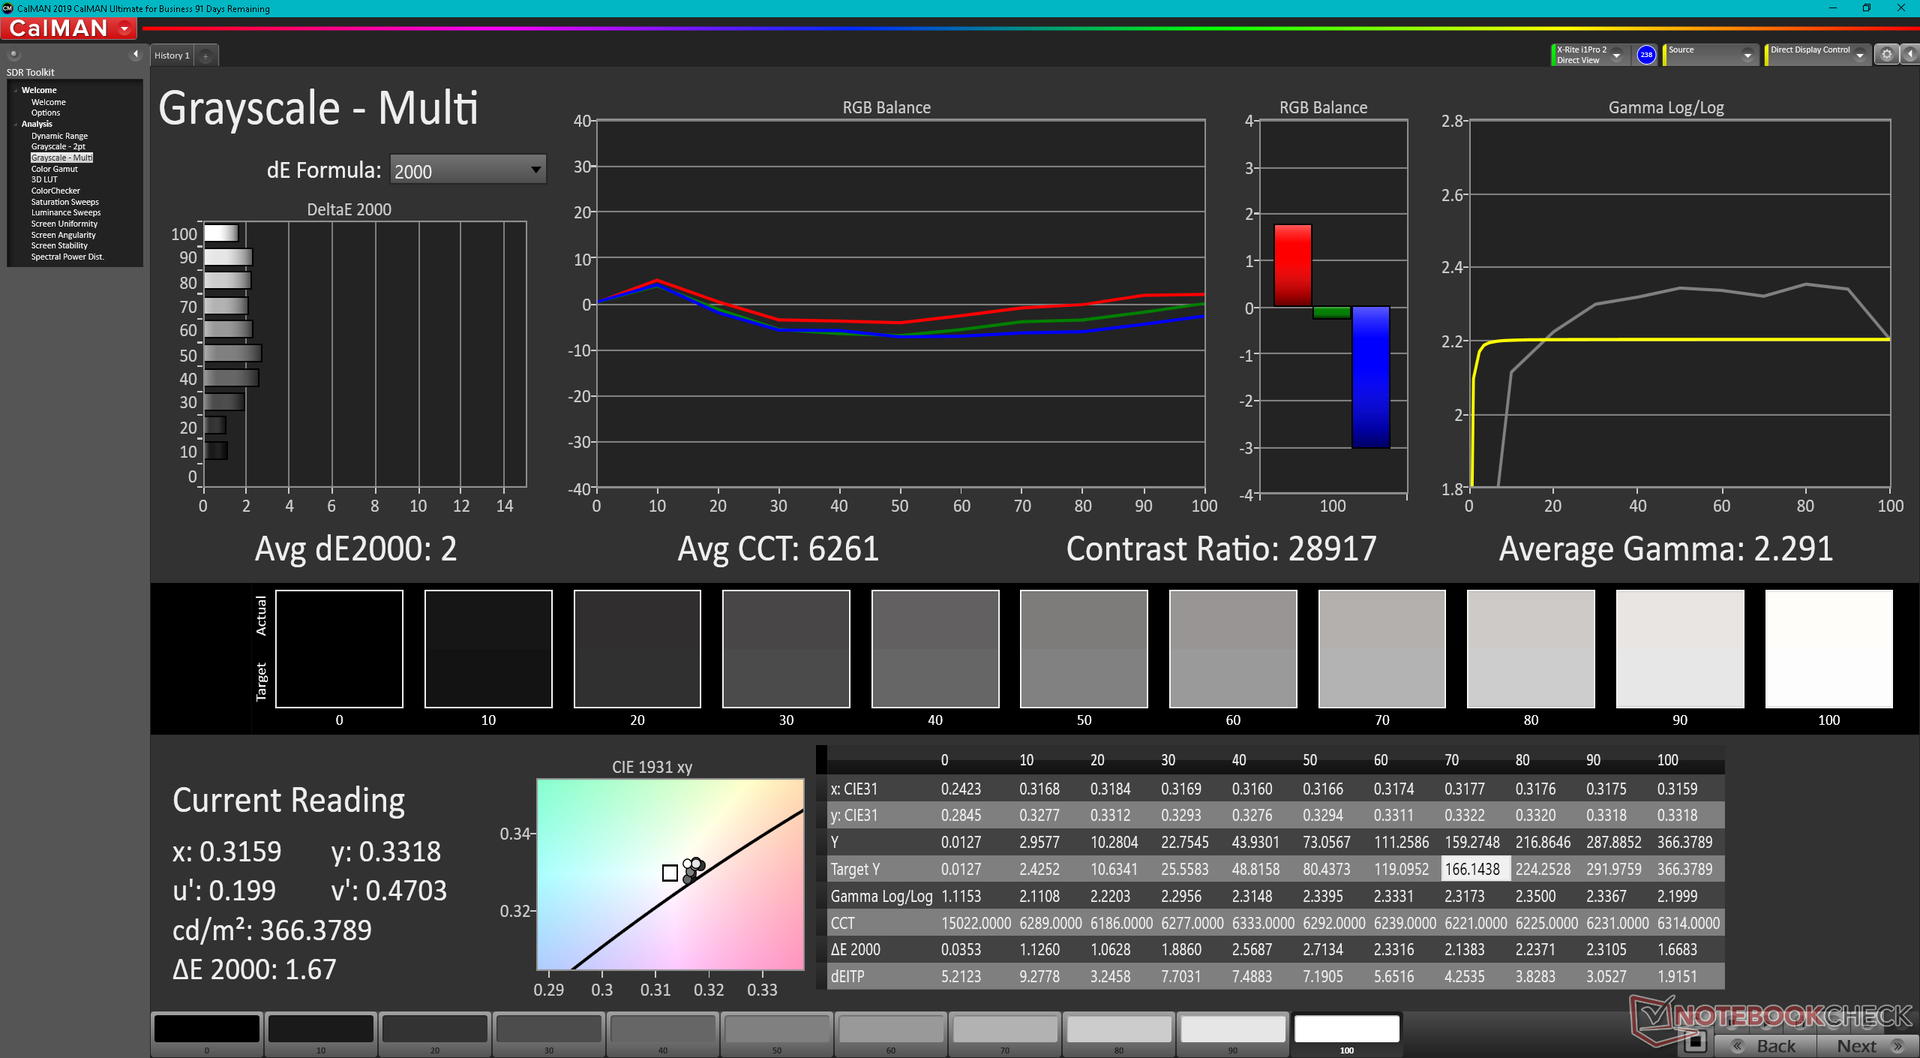
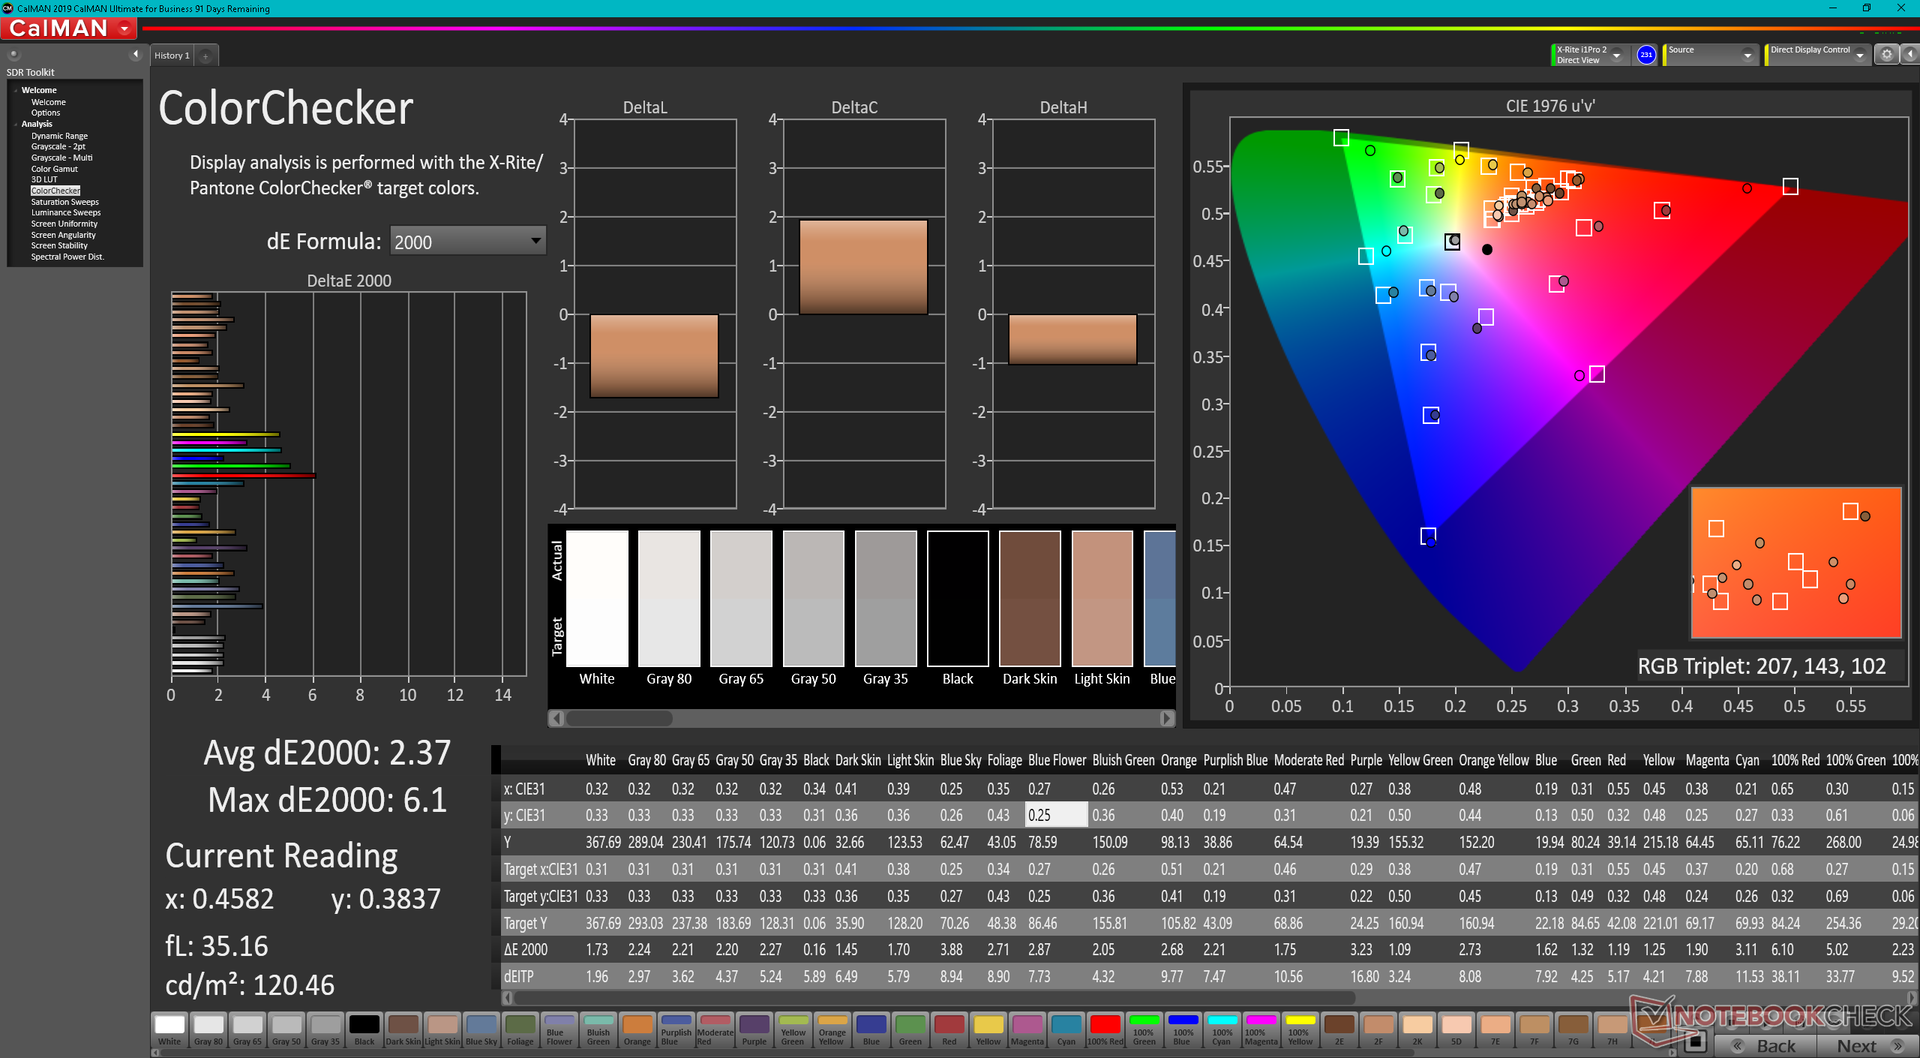
ΔE ColorChecker Calman: 2.37 | ∀{0.5-29.43 Ø4.73}
ΔE Greyscale Calman: 2 | ∀{0.09-98 Ø4.97}
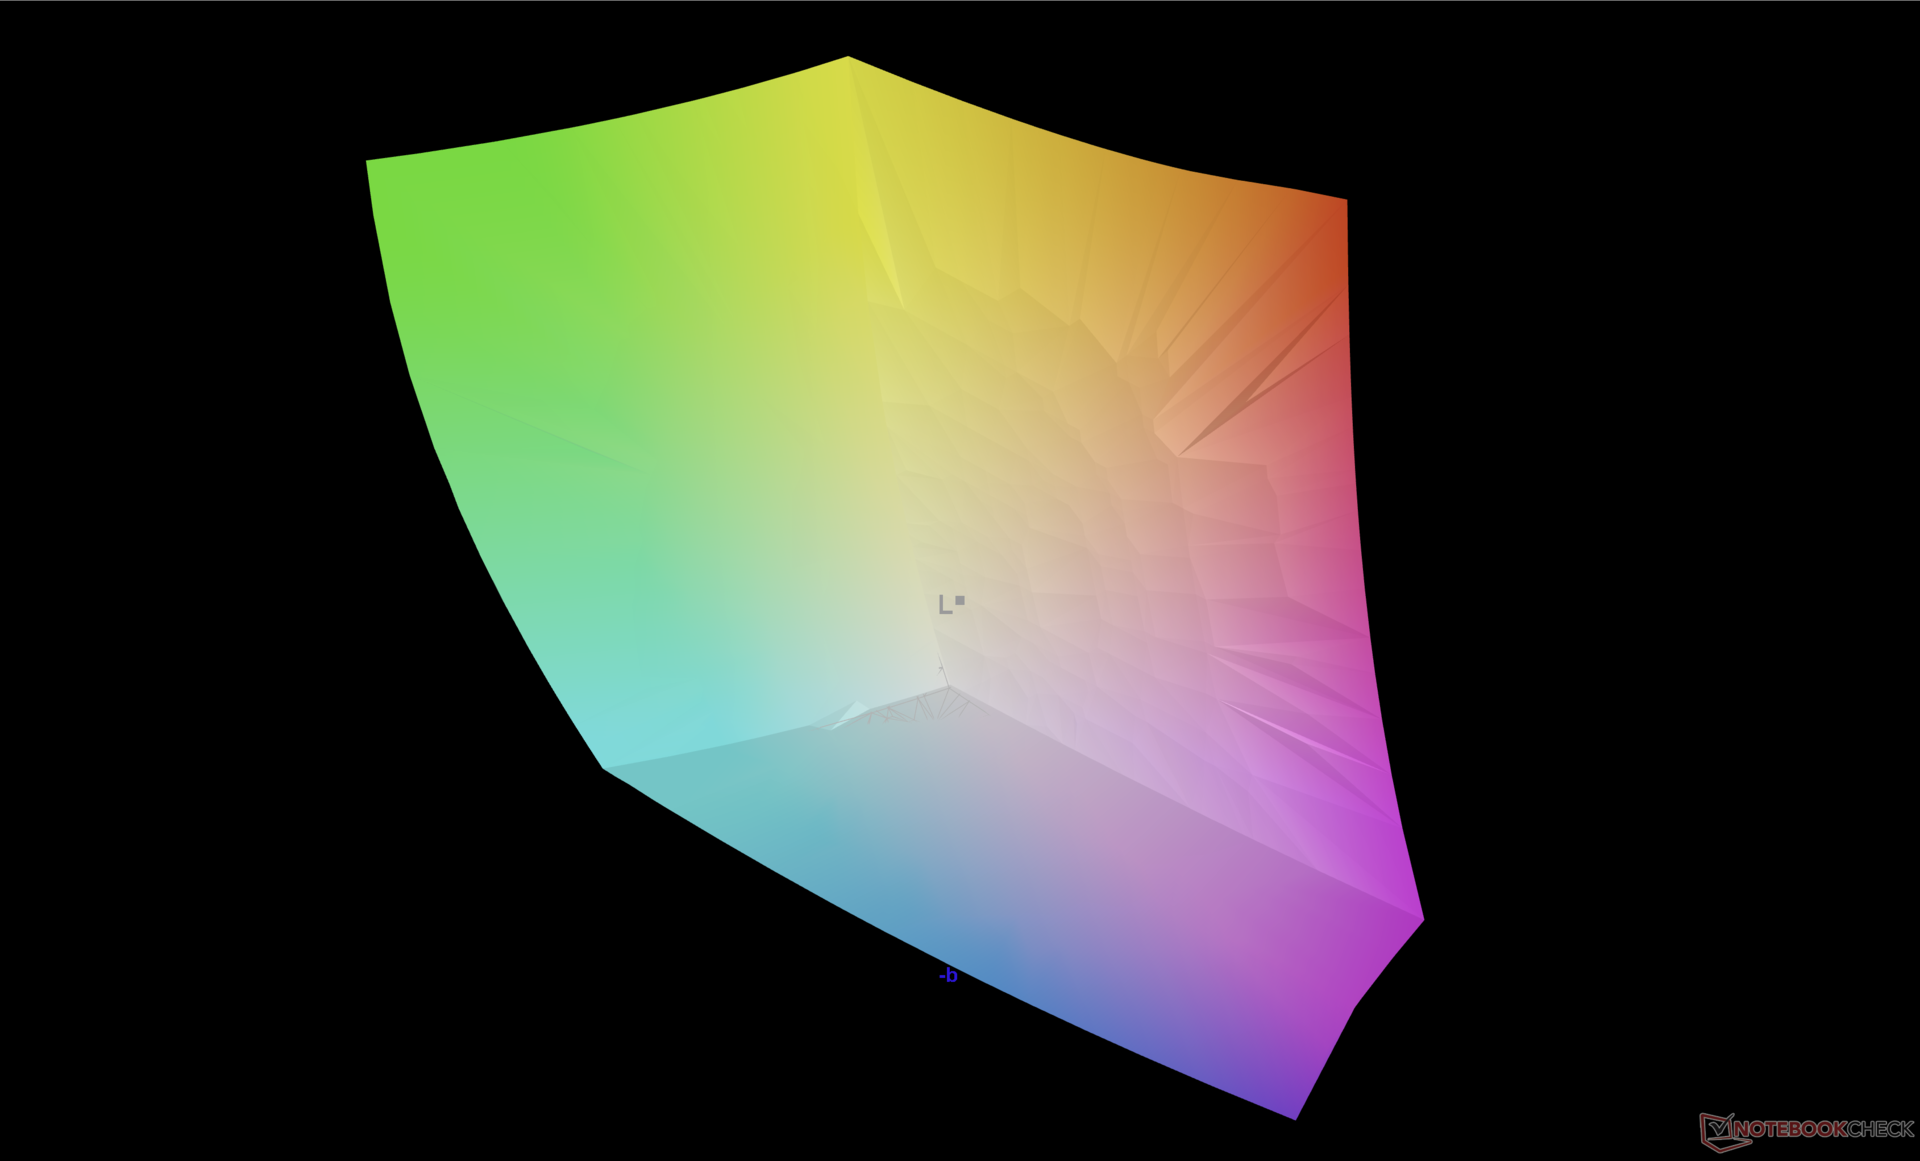
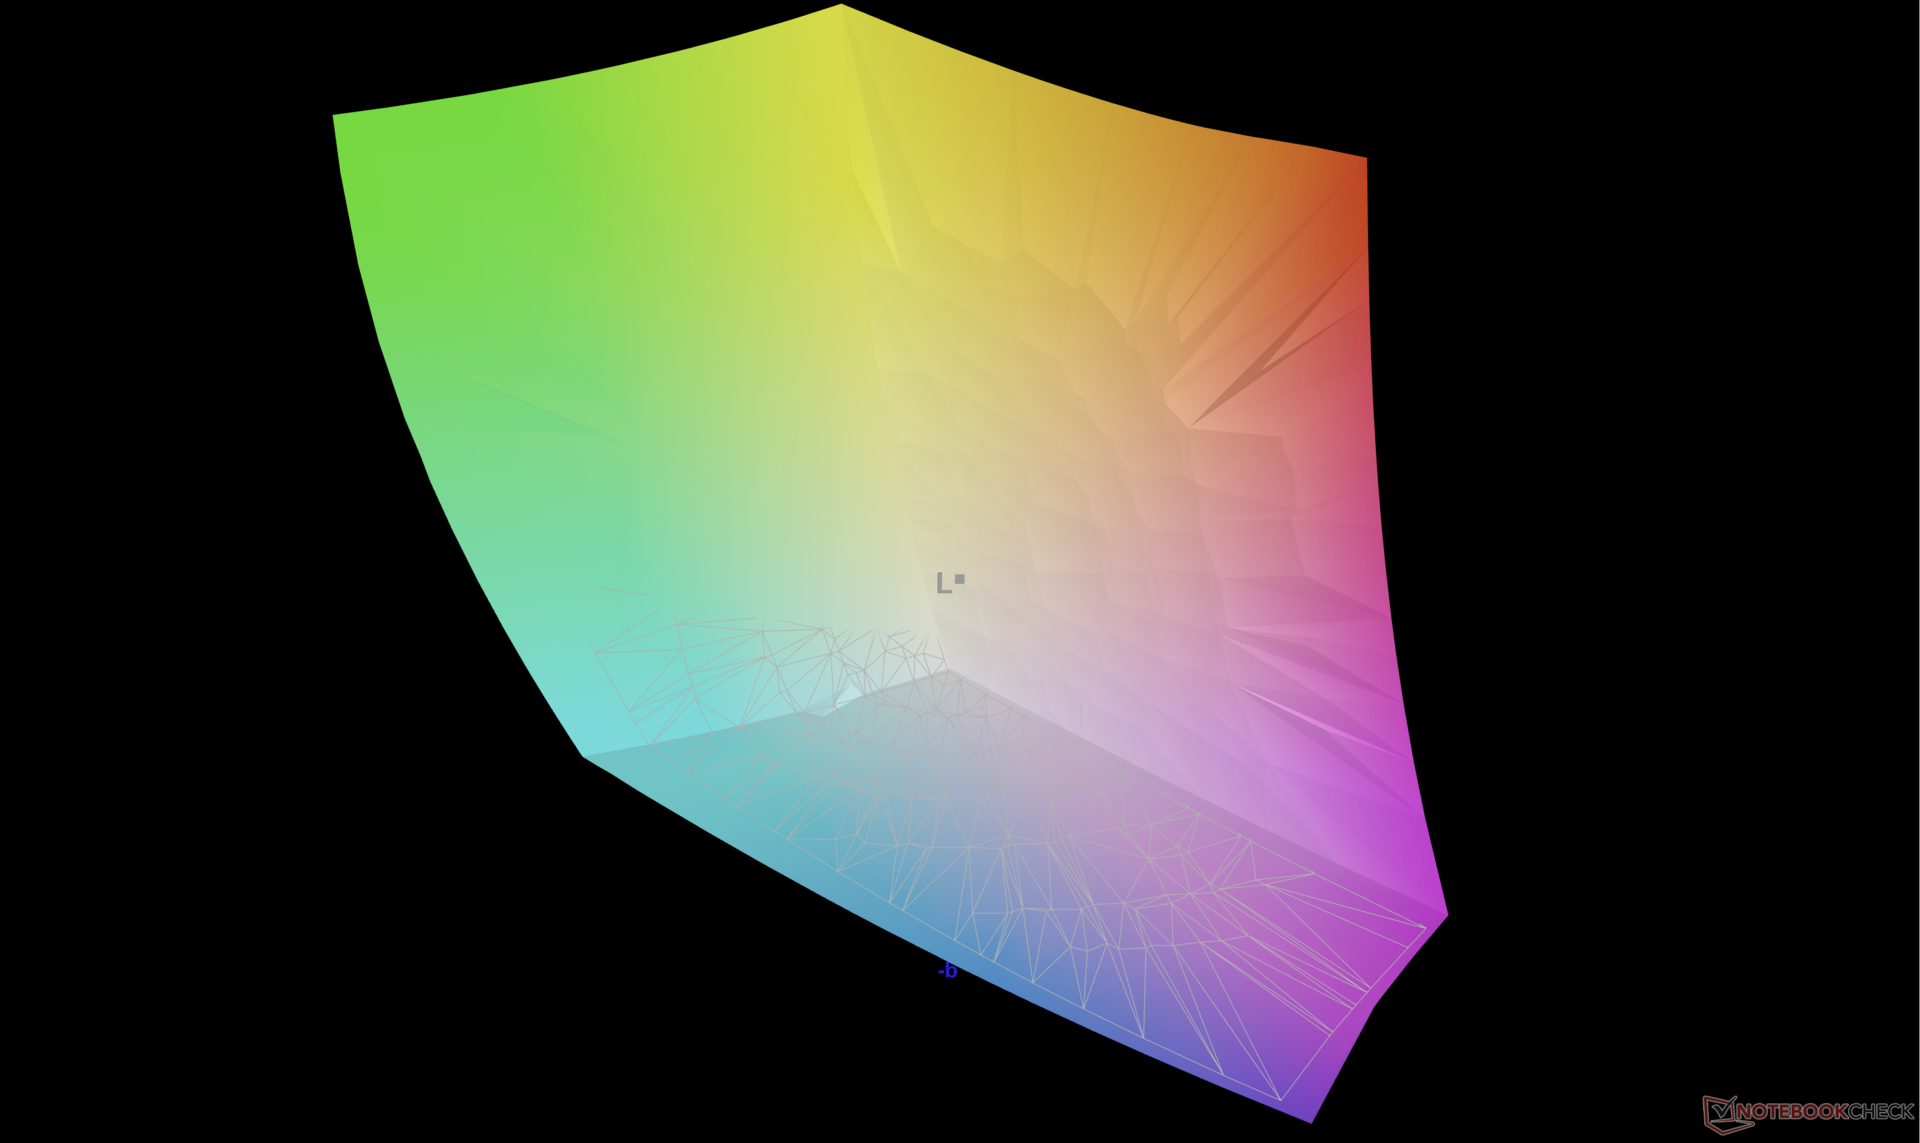
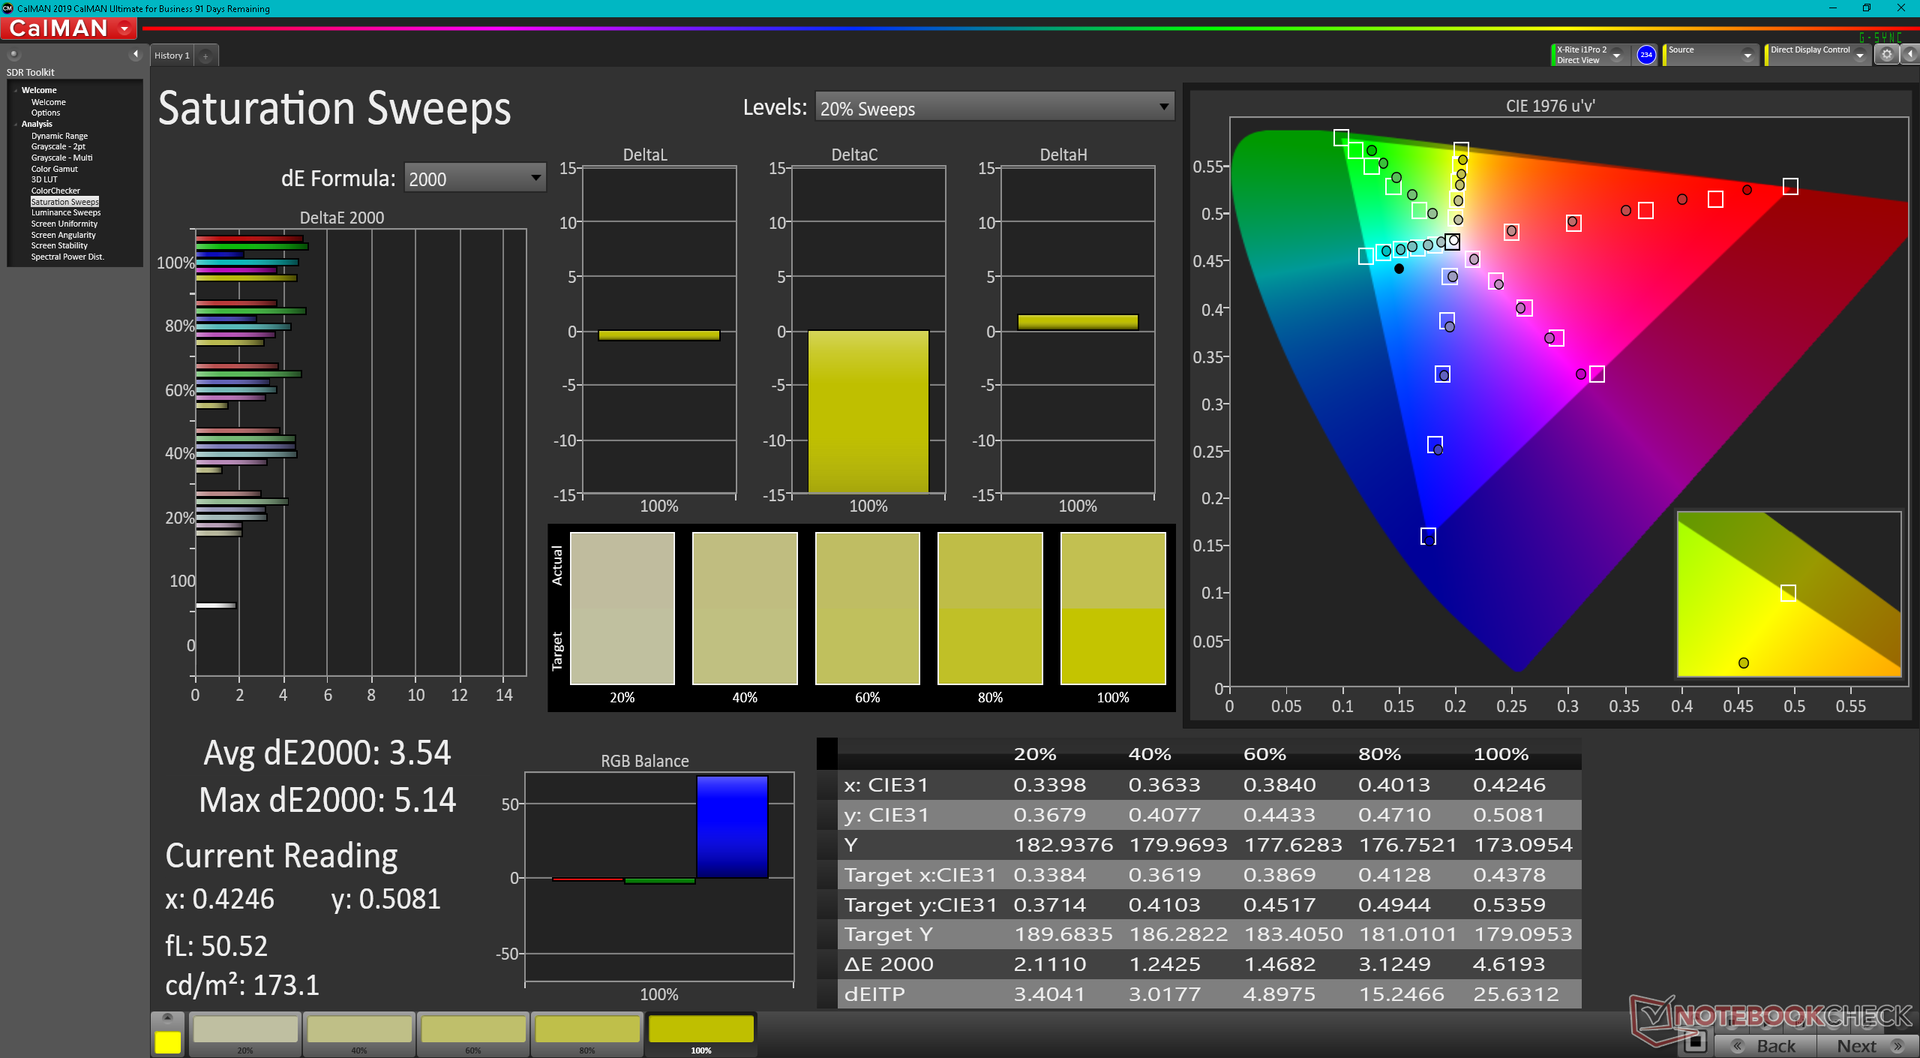
98.4% AdobeRGB 1998 (Argyll 3D)
100% sRGB (Argyll 3D)
99.5% Display P3 (Argyll 3D)
Gamma: 2.29
CCT: 6261 K
| Dell XPS 13 Plus 9320 i7-1280P OLED Samsung 134XK04, OLED, 3456x2160, 13.4" | Dell XPS 13 Plus 9320 i5-1240p Sharp SHP1548 LQ134N1, IPS, 1920x1200, 13.4" | Dell XPS 13 9315, i5-1230U Sharp SHP1548 LQ134N1, IPS, 1920x1200, 13.4" | Dell XPS 13 Plus 9320 4K LQ134R1, IPS, 3840x2400, 13.4" | Dell XPS 13 9310 2-in-1 Sharp LQ134N1, IPS, 1920x1200, 13.4" | Dell XPS 13 9310 OLED Samsung 134XK01, OLED, 3456x2160, 13.4" | |
|---|---|---|---|---|---|---|
| Display | -20% | -20% | -15% | -19% | -0% | |
| Display P3 Coverage (%) | 99.5 | 69 -31% | 69 -31% | 76.5 -23% | 69.7 -30% | 99.7 0% |
| sRGB Coverage (%) | 100 | 99 -1% | 100 0% | 100 0% | 99 -1% | 100 0% |
| AdobeRGB 1998 Coverage (%) | 98.4 | 71 -28% | 71 -28% | 76 -23% | 71.7 -27% | 97.7 -1% |
| Response Times | -1266% | -1193% | -1170% | -1931% | 5% | |
| Response Time Grey 50% / Grey 80% * (ms) | 2.6 ? | 45 ? -1631% | 40 ? -1438% | 38.9 ? -1396% | 55.6 ? -2038% | 2.2 ? 15% |
| Response Time Black / White * (ms) | 2.1 ? | 21 ? -900% | 22 ? -948% | 21.9 ? -943% | 40.4 ? -1824% | 2.2 ? -5% |
| PWM Frequency (Hz) | 59.5 | 2500 ? | 240.4 ? | |||
| Screen | -23% | -10% | -2% | -44% | -14% | |
| Brightness middle (cd/m²) | 371.8 | 498 34% | 466 25% | 494 33% | 555.7 49% | 384 3% |
| Brightness (cd/m²) | 374 | 460 23% | 442 18% | 474 27% | 528 41% | 387 3% |
| Brightness Distribution (%) | 98 | 85 -13% | 89 -9% | 89 -9% | 90 -8% | 97 -1% |
| Black Level * (cd/m²) | 0.53 | 0.4 | 0.28 | 0.35 | ||
| Colorchecker dE 2000 * | 2.37 | 3.65 -54% | 3.03 -28% | 3.1 -31% | 4.83 -104% | 4.56 -92% |
| Colorchecker dE 2000 max. * | 6.1 | 7.11 -17% | 6.68 -10% | 4.2 31% | 8.46 -39% | 7.27 -19% |
| Greyscale dE 2000 * | 2 | 4.25 -113% | 3.12 -56% | 3.2 -60% | 6.1 -205% | 1.5 25% |
| Gamma | 2.29 96% | 2.45 90% | 2.41 91% | 2.41 91% | 1.98 111% | 2.26 97% |
| CCT | 6261 104% | 6690 97% | 6418 101% | 6189 105% | 6686 97% | 6219 105% |
| Contrast (:1) | 940 | 1165 | 1764 | 1588 | ||
| Colorchecker dE 2000 calibrated * | 2.16 | 2.34 | 1.5 | 0.76 | 4.52 | |
| Color Space (Percent of AdobeRGB 1998) (%) | 87.1 | |||||
| Color Space (Percent of sRGB) (%) | 100 | |||||
| Média Total (Programa/Configurações) | -436% /
-248% | -408% /
-228% | -396% /
-218% | -665% /
-381% | -3% /
-7% |
* ... menor é melhor
Exibir tempos de resposta
| ↔ Tempo de resposta preto para branco | ||
|---|---|---|
| 2.1 ms ... ascensão ↗ e queda ↘ combinadas | ↗ 0.8 ms ascensão | 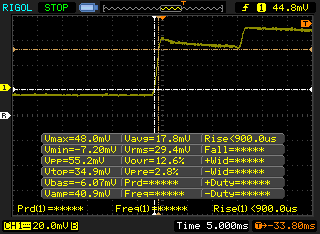 |
| ↘ 1.3 ms queda | ||
| A tela mostra taxas de resposta muito rápidas em nossos testes e deve ser muito adequada para jogos em ritmo acelerado. Em comparação, todos os dispositivos testados variam de 0.1 (mínimo) a 240 (máximo) ms. » 12 % de todos os dispositivos são melhores. Isso significa que o tempo de resposta medido é melhor que a média de todos os dispositivos testados (19.9 ms). | ||
| ↔ Tempo de resposta 50% cinza a 80% cinza | ||
| 2.6 ms ... ascensão ↗ e queda ↘ combinadas | ↗ 1.3 ms ascensão | 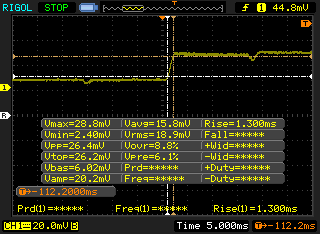 |
| ↘ 1.3 ms queda | ||
| A tela mostra taxas de resposta muito rápidas em nossos testes e deve ser muito adequada para jogos em ritmo acelerado. Em comparação, todos os dispositivos testados variam de 0.165 (mínimo) a 636 (máximo) ms. » 12 % de todos os dispositivos são melhores. Isso significa que o tempo de resposta medido é melhor que a média de todos os dispositivos testados (31.1 ms). | ||
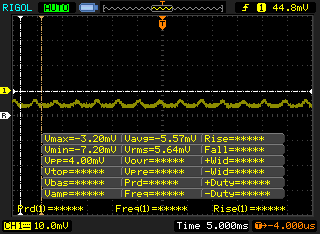
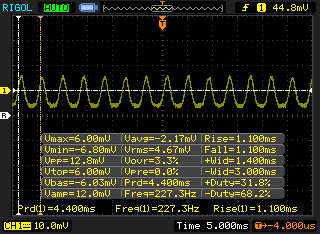
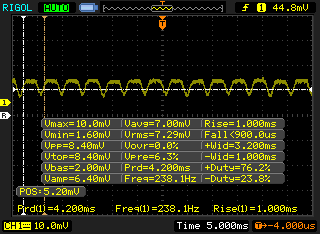
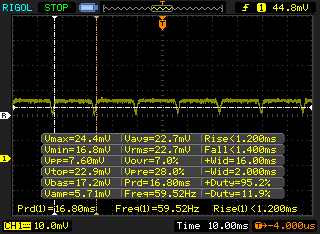
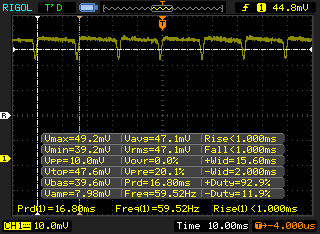
Cintilação da tela / PWM (modulação por largura de pulso)
| Tela tremeluzindo/PWM detectado | 59.5 Hz |  | |
A luz de fundo da tela pisca em 59.5 Hz (pior caso, por exemplo, utilizando PWM) . A frequência de 59.5 Hz é muito baixa, portanto a oscilação pode causar fadiga ocular e dores de cabeça após uso prolongado. [pwm_comparison] Em comparação: 52 % de todos os dispositivos testados não usam PWM para escurecer a tela. Se PWM foi detectado, uma média de 7798 (mínimo: 5 - máximo: 343500) Hz foi medida. | |||
Como quase todos os outros portáteis com um painel OLED, o painel aqui apresenta uma modulação cintilante ou de largura de pulso. A freqüência é definida em 227,3 Hz de 0 a 52% de brilho antes de mudar para 59,5 Hz de 53 a 100% de brilho. Se seus olhos são sensíveis à cintilação, então talvez você queira considerar as SKUs IPS.

Desempenho
Condições de teste
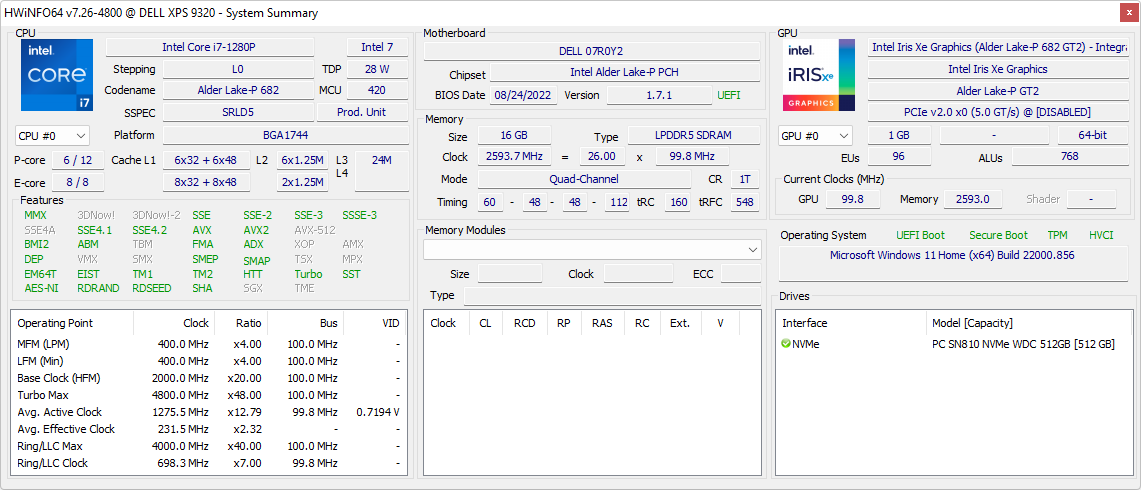
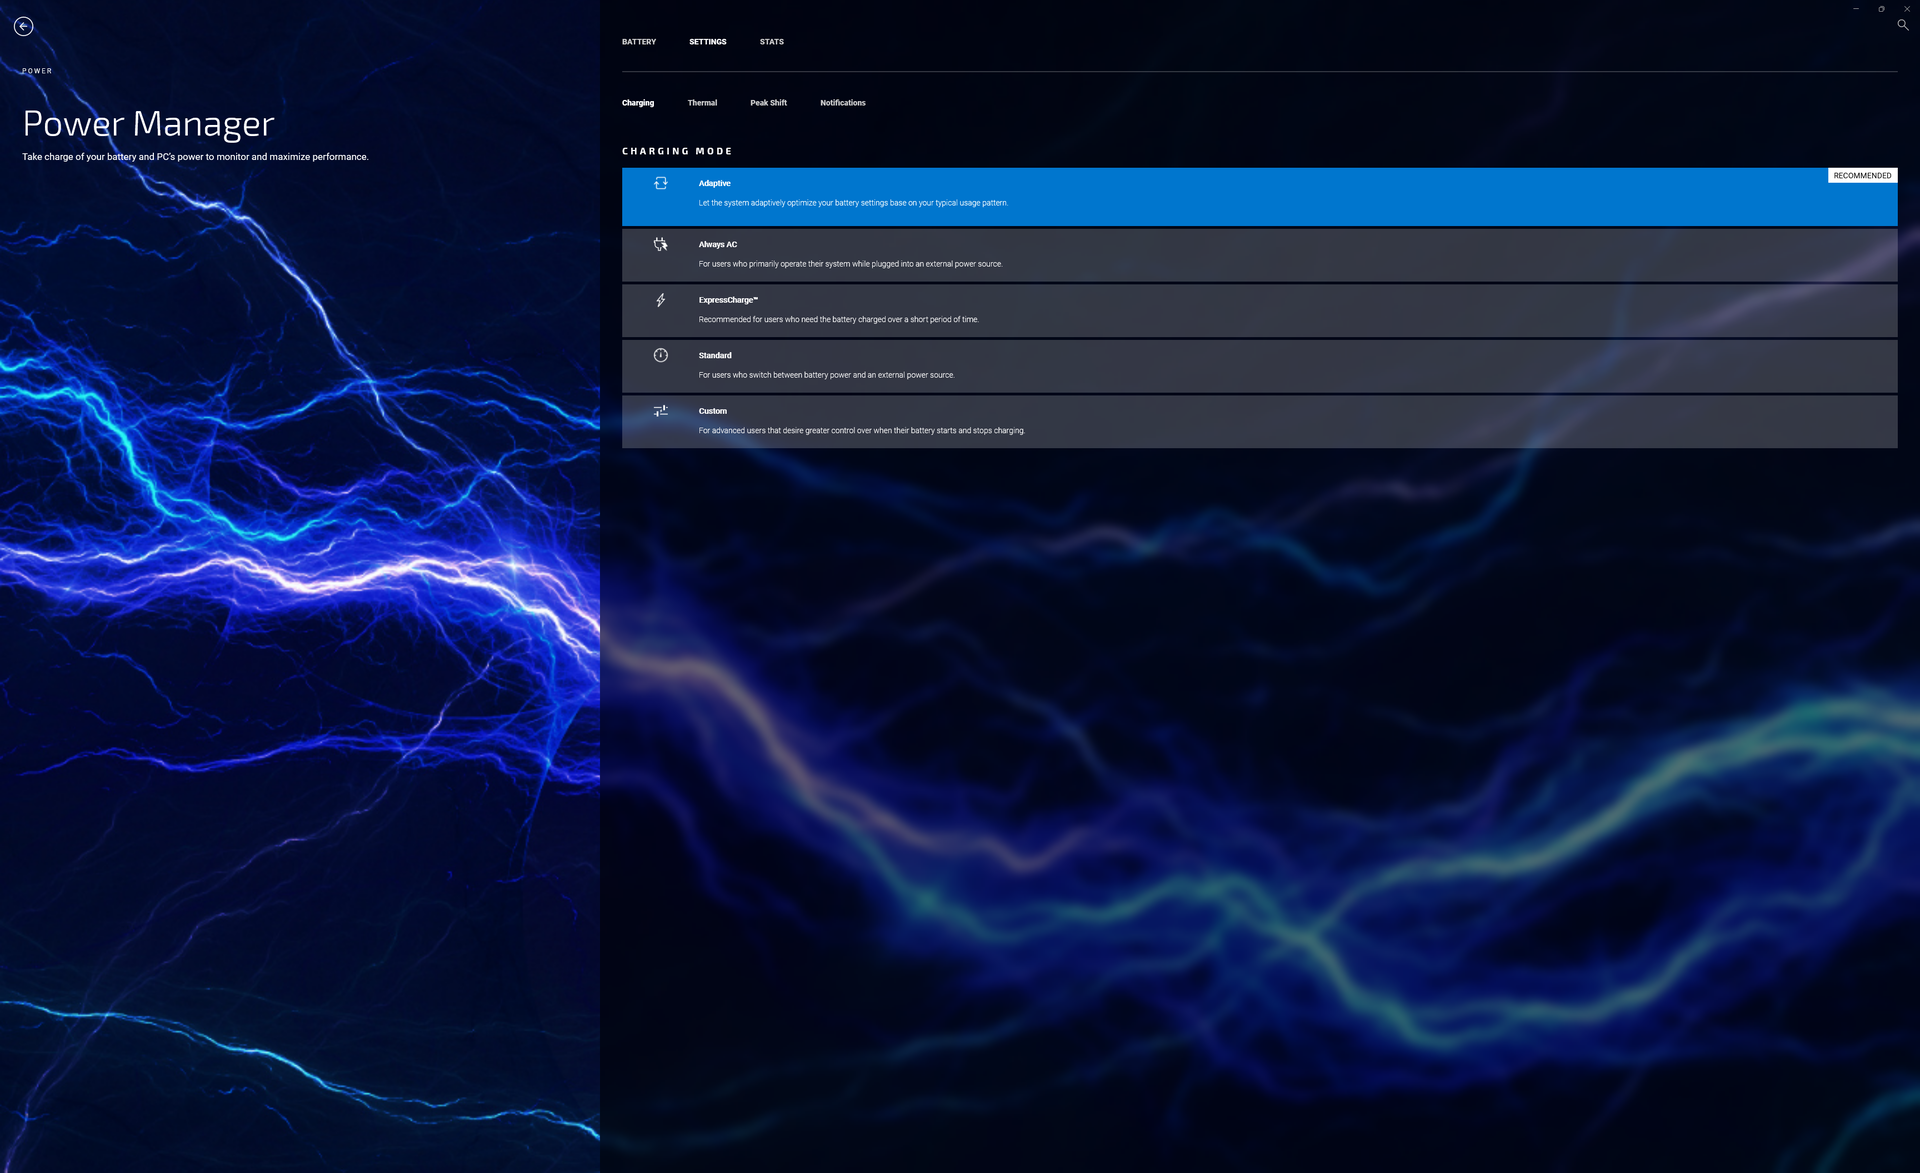
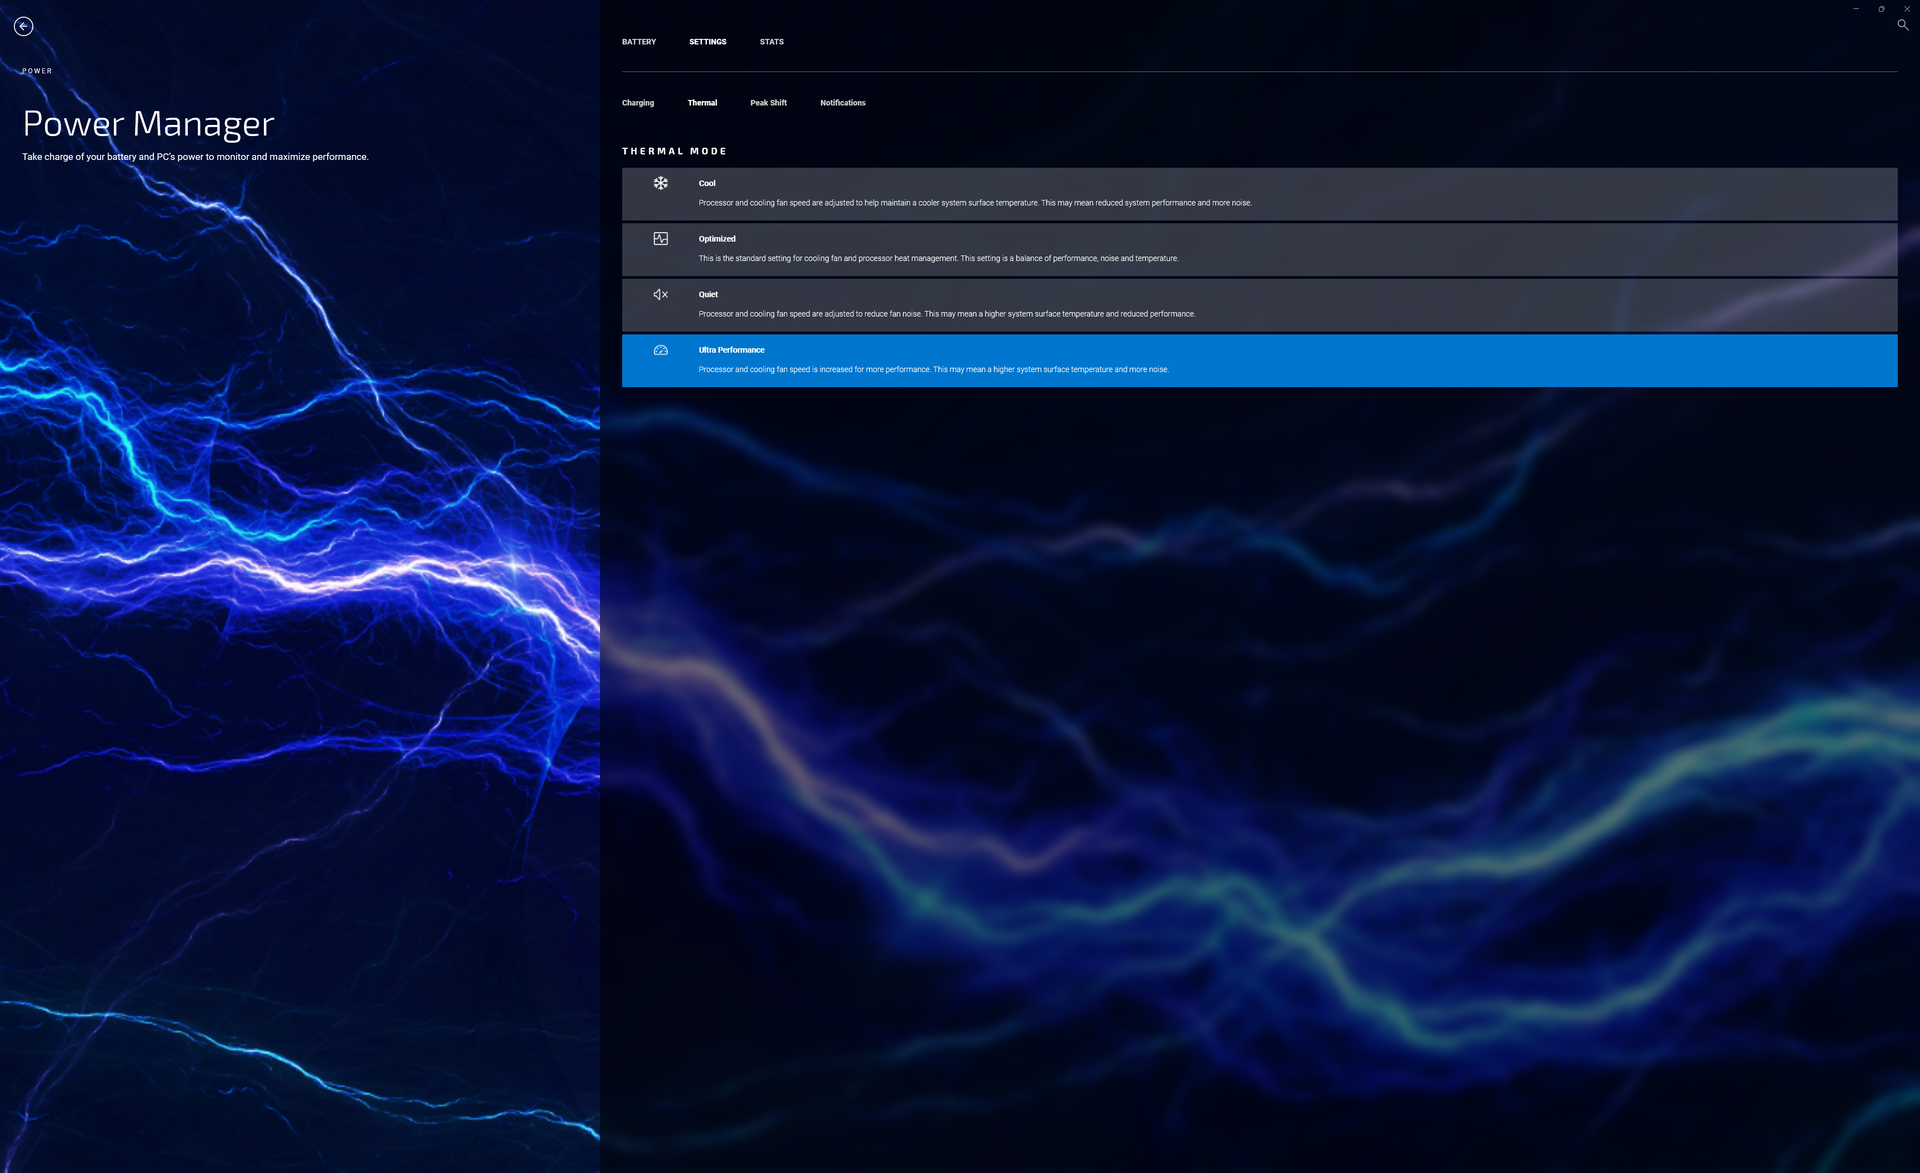
Ajustamos nossa unidade para o modo Performance via Windows e Ultra Performance via o software My Dell antes de executar quaisquer benchmarks abaixo. É recomendável que os usuários se familiarizem com o My Dell, pois ele é o centro de controle do laptop.
Processador
O desempenho de várias roscas é cerca de 15% mais rápido do que o Núcleo i7-1260P ou cerca de 25 a 30 por cento mais rápido do que o Núcleo i5-1240P configuração. Entretanto, é interessante notar que nosso Core i7-1280P pode mergulhar abaixo do Core i7-1260P quando submetido a testes de estresse prolongado. Nossos resultados do loop test do CineBench R15 xT abaixo mostram o desempenho do i7-1280P em relação ao i7-1260P para as primeiras várias corridas, antes de eventualmente correr mais lentamente em quase 8%.
Cinebench R15 Multi Loop
Cinebench R23: Multi Core | Single Core
Cinebench R15: CPU Multi 64Bit | CPU Single 64Bit
Blender: v2.79 BMW27 CPU
7-Zip 18.03: 7z b 4 | 7z b 4 -mmt1
Geekbench 5.5: Multi-Core | Single-Core
HWBOT x265 Benchmark v2.2: 4k Preset
LibreOffice : 20 Documents To PDF
R Benchmark 2.5: Overall mean
| Cinebench R20 / CPU (Multi Core) | |
| Média Intel Core i7-1280P (3283 - 5415, n=8) | |
| Dell XPS 13 Plus 9320 i7-1280P OLED | |
| Dell XPS 13 Plus 9320 4K | |
| Dell XPS 13 Plus 9320 i5-1240p | |
| Dell XPS 13 9310 OLED | |
| Dell XPS 13 9315, i5-1230U | |
| Dell XPS 13 9310 2-in-1 | |
| Cinebench R20 / CPU (Single Core) | |
| Dell XPS 13 Plus 9320 4K | |
| Média Intel Core i7-1280P (615 - 701, n=8) | |
| Dell XPS 13 Plus 9320 i7-1280P OLED | |
| Dell XPS 13 Plus 9320 i5-1240p | |
| Dell XPS 13 9310 OLED | |
| Dell XPS 13 9310 2-in-1 | |
| Dell XPS 13 9315, i5-1230U | |
| Cinebench R23 / Multi Core | |
| Dell XPS 13 Plus 9320 i7-1280P OLED | |
| Média Intel Core i7-1280P (8632 - 14803, n=8) | |
| Dell XPS 13 Plus 9320 4K | |
| Dell XPS 13 Plus 9320 i5-1240p | |
| Dell XPS 13 9310 OLED | |
| Dell XPS 13 9310 2-in-1 | |
| Dell XPS 13 9315, i5-1230U | |
| Cinebench R23 / Single Core | |
| Dell XPS 13 Plus 9320 4K | |
| Média Intel Core i7-1280P (1609 - 1787, n=7) | |
| Dell XPS 13 Plus 9320 i5-1240p | |
| Dell XPS 13 Plus 9320 i7-1280P OLED | |
| Dell XPS 13 9310 OLED | |
| Dell XPS 13 9310 2-in-1 | |
| Dell XPS 13 9315, i5-1230U | |
| Cinebench R15 / CPU Multi 64Bit | |
| Média Intel Core i7-1280P (1905 - 2332, n=7) | |
| Dell XPS 13 Plus 9320 i7-1280P OLED | |
| Dell XPS 13 Plus 9320 4K | |
| Dell XPS 13 Plus 9320 4K | |
| Dell XPS 13 Plus 9320 i5-1240p | |
| Dell XPS 13 9310 OLED | |
| Dell XPS 13 9310 2-in-1 | |
| Dell XPS 13 9315, i5-1230U | |
| Cinebench R15 / CPU Single 64Bit | |
| Dell XPS 13 Plus 9320 4K | |
| Média Intel Core i7-1280P (203 - 258, n=7) | |
| Dell XPS 13 Plus 9320 i7-1280P OLED | |
| Dell XPS 13 Plus 9320 i5-1240p | |
| Dell XPS 13 9310 OLED | |
| Dell XPS 13 9315, i5-1230U | |
| Dell XPS 13 9310 2-in-1 | |
| Blender / v2.79 BMW27 CPU | |
| Dell XPS 13 9310 2-in-1 | |
| Dell XPS 13 9310 OLED | |
| Dell XPS 13 Plus 9320 i5-1240p | |
| Dell XPS 13 Plus 9320 4K | |
| Média Intel Core i7-1280P (259 - 309, n=7) | |
| Dell XPS 13 Plus 9320 i7-1280P OLED | |
| 7-Zip 18.03 / 7z b 4 | |
| Média Intel Core i7-1280P (45292 - 53710, n=7) | |
| Dell XPS 13 Plus 9320 i7-1280P OLED | |
| Dell XPS 13 Plus 9320 4K | |
| Dell XPS 13 Plus 9320 i5-1240p | |
| Dell XPS 13 9310 2-in-1 | |
| Dell XPS 13 9315, i5-1230U | |
| Dell XPS 13 9310 OLED | |
| 7-Zip 18.03 / 7z b 4 -mmt1 | |
| Média Intel Core i7-1280P (4995 - 5874, n=7) | |
| Dell XPS 13 Plus 9320 4K | |
| Dell XPS 13 9310 2-in-1 | |
| Dell XPS 13 Plus 9320 i7-1280P OLED | |
| Dell XPS 13 Plus 9320 i5-1240p | |
| Dell XPS 13 9315, i5-1230U | |
| Dell XPS 13 9310 OLED | |
| Geekbench 5.5 / Multi-Core | |
| Dell XPS 13 Plus 9320 i7-1280P OLED | |
| Média Intel Core i7-1280P (9623 - 11811, n=7) | |
| Dell XPS 13 Plus 9320 4K | |
| Dell XPS 13 9315, i5-1230U | |
| Dell XPS 13 9310 OLED | |
| Dell XPS 13 Plus 9320 i5-1240p | |
| Geekbench 5.5 / Single-Core | |
| Dell XPS 13 Plus 9320 i7-1280P OLED | |
| Dell XPS 13 Plus 9320 4K | |
| Média Intel Core i7-1280P (1571 - 1802, n=7) | |
| Dell XPS 13 9315, i5-1230U | |
| Dell XPS 13 Plus 9320 i5-1240p | |
| Dell XPS 13 9310 OLED | |
| HWBOT x265 Benchmark v2.2 / 4k Preset | |
| Dell XPS 13 Plus 9320 i7-1280P OLED | |
| Média Intel Core i7-1280P (9.62 - 14.5, n=5) | |
| Dell XPS 13 Plus 9320 4K | |
| Dell XPS 13 Plus 9320 i5-1240p | |
| Dell XPS 13 9310 OLED | |
| Dell XPS 13 9310 2-in-1 | |
| LibreOffice / 20 Documents To PDF | |
| Dell XPS 13 Plus 9320 i5-1240p | |
| Média Intel Core i7-1280P (41 - 61.6, n=8) | |
| Dell XPS 13 Plus 9320 i7-1280P OLED | |
| Dell XPS 13 Plus 9320 4K | |
| Dell XPS 13 9310 OLED | |
| R Benchmark 2.5 / Overall mean | |
| Dell XPS 13 9310 2-in-1 | |
| Dell XPS 13 9310 OLED | |
| Dell XPS 13 Plus 9320 i5-1240p | |
| Dell XPS 13 Plus 9320 i7-1280P OLED | |
| Dell XPS 13 Plus 9320 4K | |
| Média Intel Core i7-1280P (0.4505 - 0.512, n=7) | |
* ... menor é melhor
AIDA64: FP32 Ray-Trace | FPU Julia | CPU SHA3 | CPU Queen | FPU SinJulia | FPU Mandel | CPU AES | CPU ZLib | FP64 Ray-Trace | CPU PhotoWorxx
| Performance rating | |
| Dell XPS 13 Plus 9320 i7-1280P OLED | |
| Média Intel Core i7-1280P | |
| Dell XPS 13 Plus 9320 4K | |
| Dell XPS 13 Plus 9320 i5-1240p | |
| Dell XPS 13 9310 2-in-1 | |
| Dell XPS 13 9310 OLED | |
| Dell XPS 13 9315, i5-1230U | |
| AIDA64 / FP32 Ray-Trace | |
| Dell XPS 13 Plus 9320 i7-1280P OLED | |
| Média Intel Core i7-1280P (7466 - 13068, n=6) | |
| Dell XPS 13 9310 2-in-1 | |
| Dell XPS 13 9310 OLED | |
| Dell XPS 13 Plus 9320 4K | |
| Dell XPS 13 Plus 9320 i5-1240p | |
| Dell XPS 13 9315, i5-1230U | |
| AIDA64 / FPU Julia | |
| Dell XPS 13 Plus 9320 i7-1280P OLED | |
| Média Intel Core i7-1280P (38904 - 66081, n=6) | |
| Dell XPS 13 9310 2-in-1 | |
| Dell XPS 13 Plus 9320 4K | |
| Dell XPS 13 Plus 9320 i5-1240p | |
| Dell XPS 13 9310 OLED | |
| Dell XPS 13 9315, i5-1230U | |
| AIDA64 / CPU SHA3 | |
| Dell XPS 13 Plus 9320 i7-1280P OLED | |
| Média Intel Core i7-1280P (1826 - 2992, n=6) | |
| Dell XPS 13 9310 2-in-1 | |
| Dell XPS 13 Plus 9320 4K | |
| Dell XPS 13 Plus 9320 i5-1240p | |
| Dell XPS 13 9310 OLED | |
| Dell XPS 13 9315, i5-1230U | |
| AIDA64 / CPU Queen | |
| Média Intel Core i7-1280P (80180 - 100358, n=6) | |
| Dell XPS 13 Plus 9320 i7-1280P OLED | |
| Dell XPS 13 Plus 9320 4K | |
| Dell XPS 13 Plus 9320 i5-1240p | |
| Dell XPS 13 9315, i5-1230U | |
| Dell XPS 13 9310 2-in-1 | |
| Dell XPS 13 9310 OLED | |
| AIDA64 / FPU SinJulia | |
| Dell XPS 13 Plus 9320 i7-1280P OLED | |
| Média Intel Core i7-1280P (5880 - 8571, n=6) | |
| Dell XPS 13 Plus 9320 4K | |
| Dell XPS 13 Plus 9320 i5-1240p | |
| Dell XPS 13 9310 2-in-1 | |
| Dell XPS 13 9310 OLED | |
| Dell XPS 13 9315, i5-1230U | |
| AIDA64 / FPU Mandel | |
| Dell XPS 13 Plus 9320 i7-1280P OLED | |
| Média Intel Core i7-1280P (18907 - 32766, n=6) | |
| Dell XPS 13 9310 2-in-1 | |
| Dell XPS 13 Plus 9320 i5-1240p | |
| Dell XPS 13 Plus 9320 4K | |
| Dell XPS 13 9310 OLED | |
| Dell XPS 13 9315, i5-1230U | |
| AIDA64 / CPU AES | |
| Dell XPS 13 9310 2-in-1 | |
| Média Intel Core i7-1280P (40691 - 99367, n=6) | |
| Dell XPS 13 Plus 9320 i7-1280P OLED | |
| Dell XPS 13 9310 OLED | |
| Dell XPS 13 Plus 9320 i5-1240p | |
| Dell XPS 13 Plus 9320 4K | |
| Dell XPS 13 9315, i5-1230U | |
| AIDA64 / CPU ZLib | |
| Média Intel Core i7-1280P (540 - 880, n=6) | |
| Dell XPS 13 Plus 9320 i7-1280P OLED | |
| Dell XPS 13 Plus 9320 4K | |
| Dell XPS 13 Plus 9320 i5-1240p | |
| Dell XPS 13 9310 2-in-1 | |
| Dell XPS 13 9315, i5-1230U | |
| Dell XPS 13 9310 OLED | |
| AIDA64 / FP64 Ray-Trace | |
| Dell XPS 13 Plus 9320 i7-1280P OLED | |
| Média Intel Core i7-1280P (4006 - 7184, n=6) | |
| Dell XPS 13 9310 2-in-1 | |
| Dell XPS 13 9310 OLED | |
| Dell XPS 13 Plus 9320 4K | |
| Dell XPS 13 Plus 9320 i5-1240p | |
| Dell XPS 13 9315, i5-1230U | |
| AIDA64 / CPU PhotoWorxx | |
| Dell XPS 13 Plus 9320 i7-1280P OLED | |
| Média Intel Core i7-1280P (36663 - 48416, n=6) | |
| Dell XPS 13 Plus 9320 4K | |
| Dell XPS 13 9310 2-in-1 | |
| Dell XPS 13 Plus 9320 i5-1240p | |
| Dell XPS 13 9310 OLED | |
| Dell XPS 13 9315, i5-1230U | |
Desempenho do sistema
CrossMark: Overall | Productivity | Creativity | Responsiveness
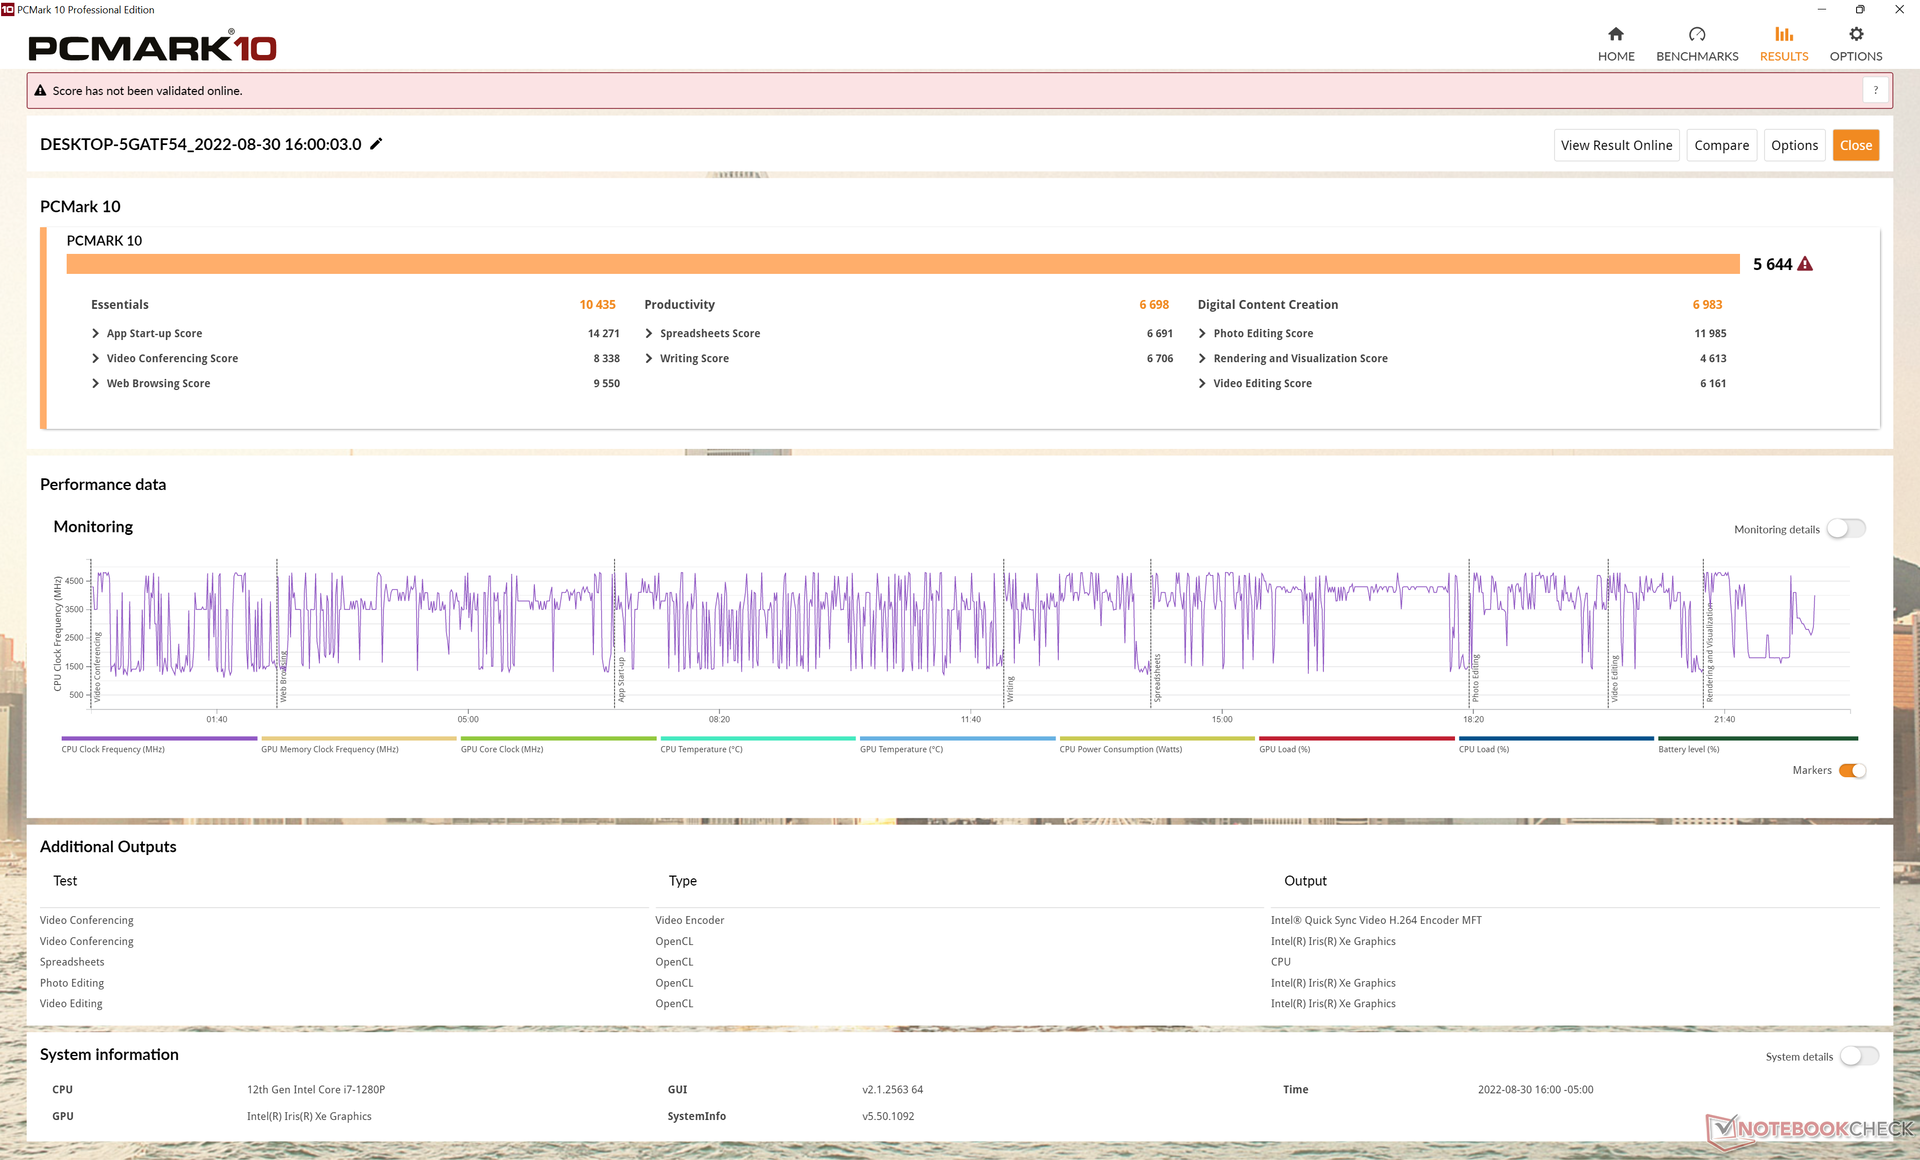
| PCMark 10 / Score | |
| Média da turma Subnotebook (4920 - 9939, n=44, últimos 2 anos) | |
| Dell XPS 13 Plus 9320 i7-1280P OLED | |
| Média Intel Core i7-1280P, Intel Iris Xe Graphics G7 96EUs (5410 - 5994, n=4) | |
| Dell XPS 13 Plus 9320 4K | |
| Dell XPS 13 9310 OLED | |
| Dell XPS 13 9310 2-in-1 | |
| Dell XPS 13 Plus 9320 i5-1240p | |
| Dell XPS 13 9315, i5-1230U | |
| PCMark 10 / Essentials | |
| Dell XPS 13 9310 OLED | |
| Dell XPS 13 9310 2-in-1 | |
| Dell XPS 13 Plus 9320 i7-1280P OLED | |
| Dell XPS 13 Plus 9320 4K | |
| Média da turma Subnotebook (8552 - 11646, n=44, últimos 2 anos) | |
| Média Intel Core i7-1280P, Intel Iris Xe Graphics G7 96EUs (9719 - 10920, n=4) | |
| Dell XPS 13 9315, i5-1230U | |
| Dell XPS 13 Plus 9320 i5-1240p | |
| PCMark 10 / Productivity | |
| Média da turma Subnotebook (5435 - 16606, n=44, últimos 2 anos) | |
| Dell XPS 13 9310 OLED | |
| Dell XPS 13 Plus 9320 4K | |
| Dell XPS 13 9310 2-in-1 | |
| Média Intel Core i7-1280P, Intel Iris Xe Graphics G7 96EUs (6301 - 7453, n=4) | |
| Dell XPS 13 Plus 9320 i7-1280P OLED | |
| Dell XPS 13 Plus 9320 i5-1240p | |
| Dell XPS 13 9315, i5-1230U | |
| PCMark 10 / Digital Content Creation | |
| Média da turma Subnotebook (5722 - 13779, n=44, últimos 2 anos) | |
| Dell XPS 13 Plus 9320 i7-1280P OLED | |
| Média Intel Core i7-1280P, Intel Iris Xe Graphics G7 96EUs (6450 - 7180, n=4) | |
| Dell XPS 13 Plus 9320 4K | |
| Dell XPS 13 Plus 9320 i5-1240p | |
| Dell XPS 13 9310 OLED | |
| Dell XPS 13 9310 2-in-1 | |
| Dell XPS 13 9315, i5-1230U | |
| CrossMark / Overall | |
| Dell XPS 13 Plus 9320 i7-1280P OLED | |
| Média Intel Core i7-1280P, Intel Iris Xe Graphics G7 96EUs (1677 - 1773, n=4) | |
| Dell XPS 13 Plus 9320 4K | |
| Média da turma Subnotebook (365 - 2356, n=60, últimos 2 anos) | |
| Dell XPS 13 Plus 9320 i5-1240p | |
| Dell XPS 13 9315, i5-1230U | |
| CrossMark / Productivity | |
| Dell XPS 13 Plus 9320 i7-1280P OLED | |
| Média Intel Core i7-1280P, Intel Iris Xe Graphics G7 96EUs (1585 - 1709, n=4) | |
| Dell XPS 13 Plus 9320 4K | |
| Média da turma Subnotebook (364 - 2277, n=60, últimos 2 anos) | |
| Dell XPS 13 Plus 9320 i5-1240p | |
| Dell XPS 13 9315, i5-1230U | |
| CrossMark / Creativity | |
| Dell XPS 13 Plus 9320 i7-1280P OLED | |
| Média Intel Core i7-1280P, Intel Iris Xe Graphics G7 96EUs (1849 - 1928, n=4) | |
| Dell XPS 13 Plus 9320 4K | |
| Média da turma Subnotebook (372 - 2743, n=60, últimos 2 anos) | |
| Dell XPS 13 Plus 9320 i5-1240p | |
| Dell XPS 13 9315, i5-1230U | |
| CrossMark / Responsiveness | |
| Média Intel Core i7-1280P, Intel Iris Xe Graphics G7 96EUs (1394 - 1746, n=4) | |
| Dell XPS 13 Plus 9320 i7-1280P OLED | |
| Dell XPS 13 Plus 9320 4K | |
| Média da turma Subnotebook (312 - 1854, n=60, últimos 2 anos) | |
| Dell XPS 13 Plus 9320 i5-1240p | |
| Dell XPS 13 9315, i5-1230U | |
| PCMark 10 Score | 5644 pontos | |
Ajuda | ||
| AIDA64 / Memory Copy | |
| Dell XPS 13 Plus 9320 i7-1280P OLED | |
| Dell XPS 13 Plus 9320 4K | |
| Média Intel Core i7-1280P (56337 - 73486, n=6) | |
| Dell XPS 13 Plus 9320 i5-1240p | |
| Dell XPS 13 9310 2-in-1 | |
| Dell XPS 13 9310 OLED | |
| Dell XPS 13 9315, i5-1230U | |
| AIDA64 / Memory Read | |
| Dell XPS 13 Plus 9320 i7-1280P OLED | |
| Dell XPS 13 Plus 9320 i5-1240p | |
| Média Intel Core i7-1280P (63221 - 73719, n=6) | |
| Dell XPS 13 Plus 9320 4K | |
| Dell XPS 13 9315, i5-1230U | |
| Dell XPS 13 9310 2-in-1 | |
| Dell XPS 13 9310 OLED | |
| AIDA64 / Memory Write | |
| Dell XPS 13 9310 OLED | |
| Dell XPS 13 9310 2-in-1 | |
| Dell XPS 13 Plus 9320 i7-1280P OLED | |
| Média Intel Core i7-1280P (58729 - 68247, n=6) | |
| Dell XPS 13 Plus 9320 4K | |
| Dell XPS 13 9315, i5-1230U | |
| Dell XPS 13 Plus 9320 i5-1240p | |
| AIDA64 / Memory Latency | |
| Dell XPS 13 9310 OLED | |
| Média Intel Core i7-1280P (93.1 - 153.3, n=6) | |
| Dell XPS 13 Plus 9320 i7-1280P OLED | |
| Dell XPS 13 9310 2-in-1 | |
| Dell XPS 13 9315, i5-1230U | |
* ... menor é melhor
Latência do DPC
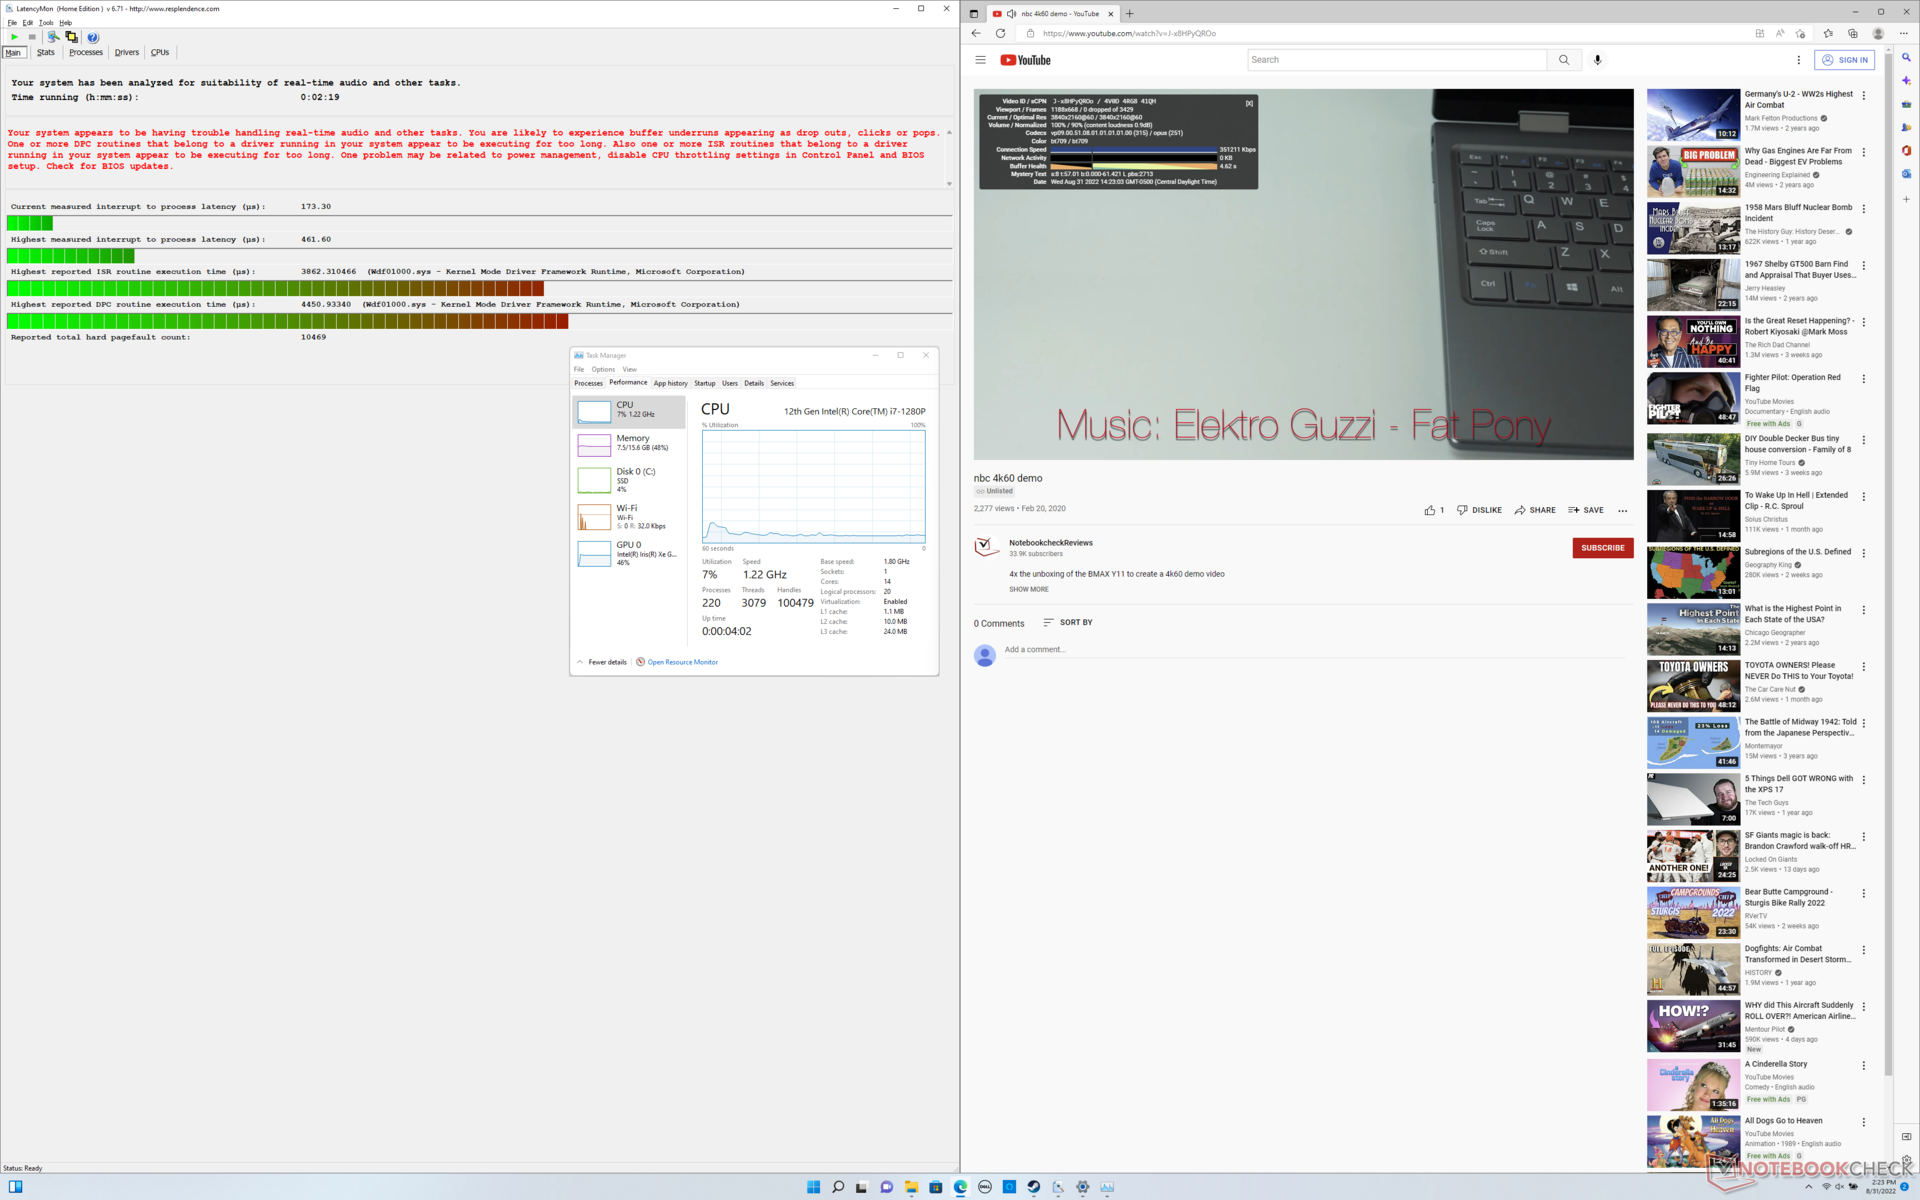
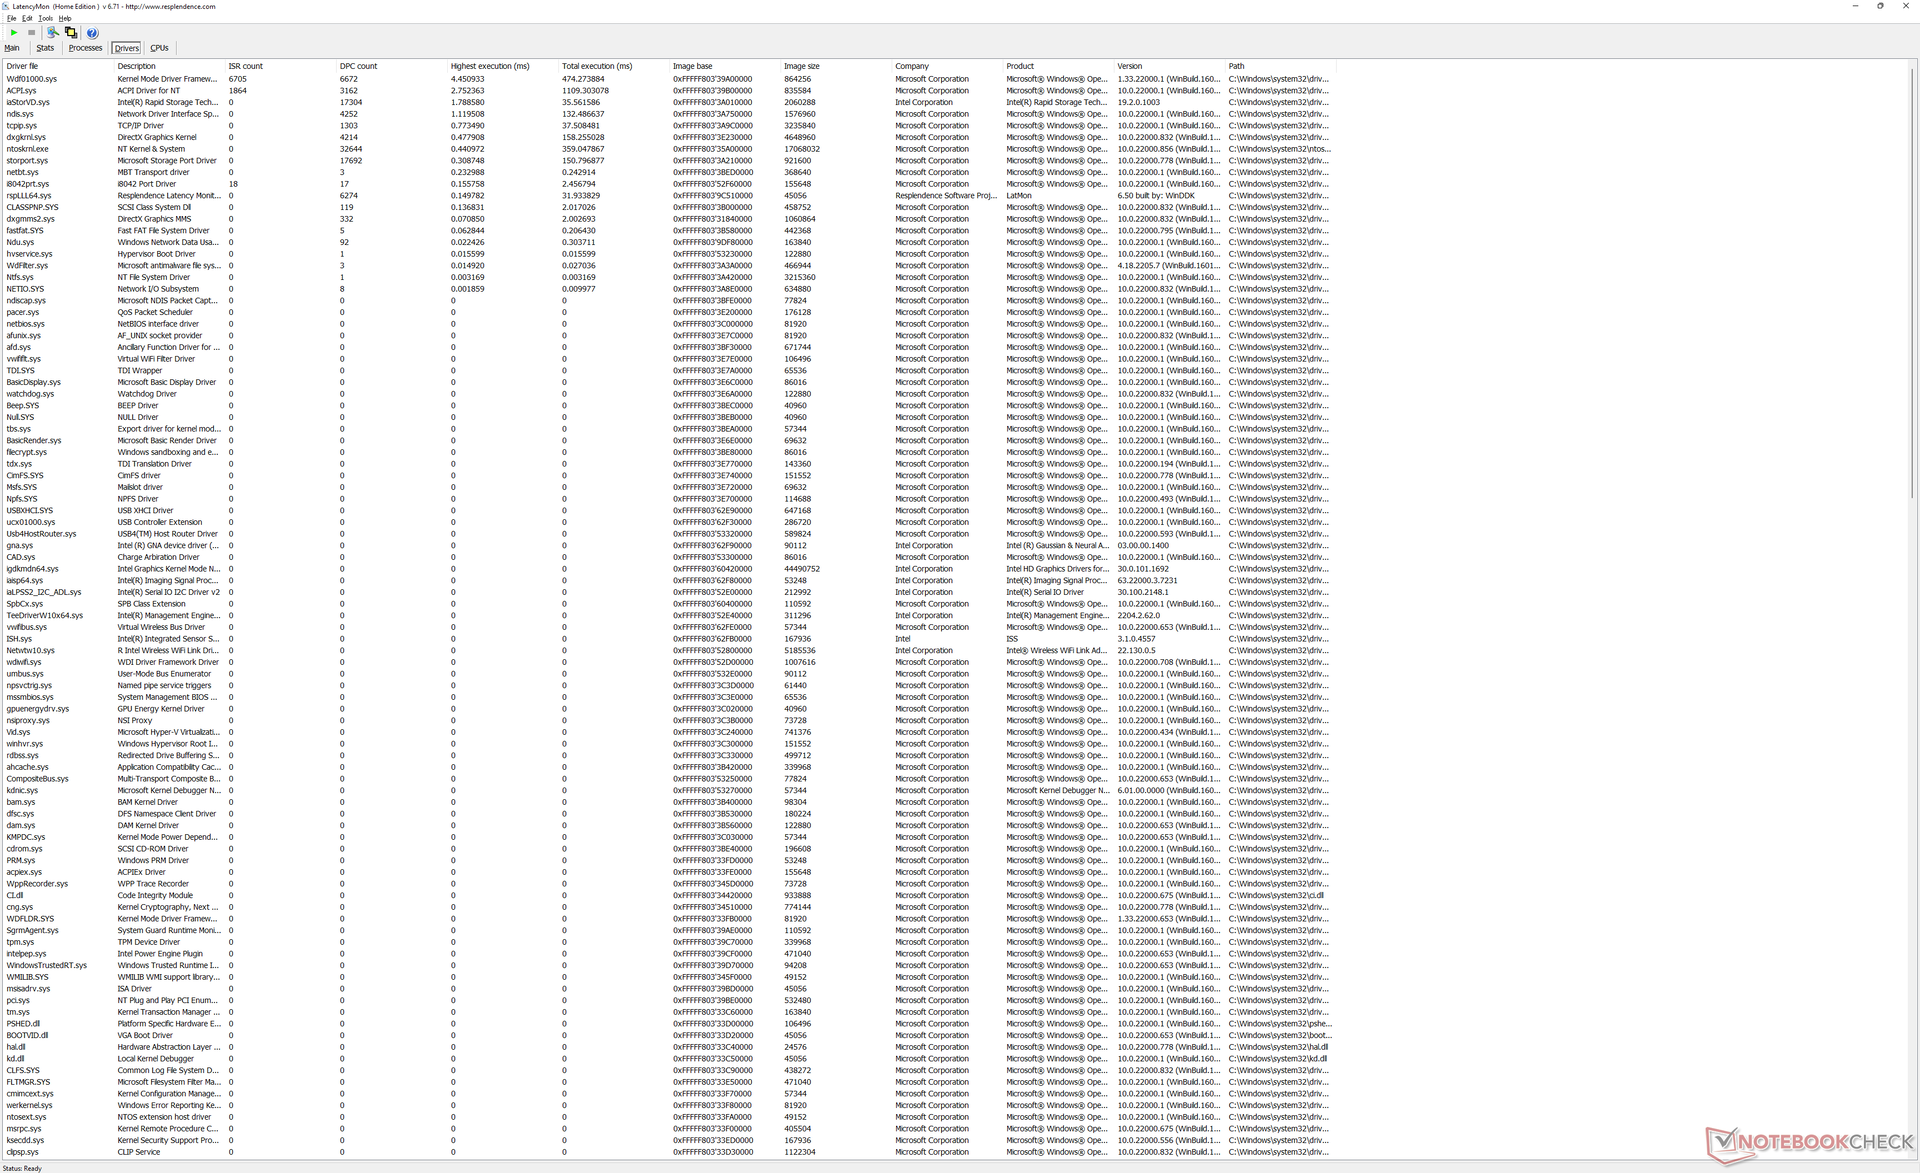
| DPC Latencies / LatencyMon - interrupt to process latency (max), Web, Youtube, Prime95 | |
| Dell XPS 13 9315, i5-1230U | |
| Dell XPS 13 Plus 9320 i5-1240p | |
| Dell XPS 13 9310 OLED | |
| Dell XPS 13 Plus 9320 4K | |
| Dell XPS 13 9310 2-in-1 | |
| Dell XPS 13 Plus 9320 i7-1280P OLED | |
* ... menor é melhor
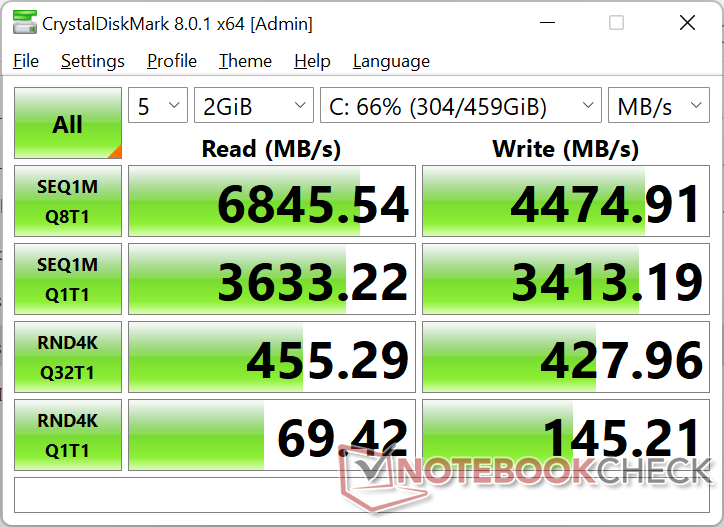
Dispositivos de armazenamento
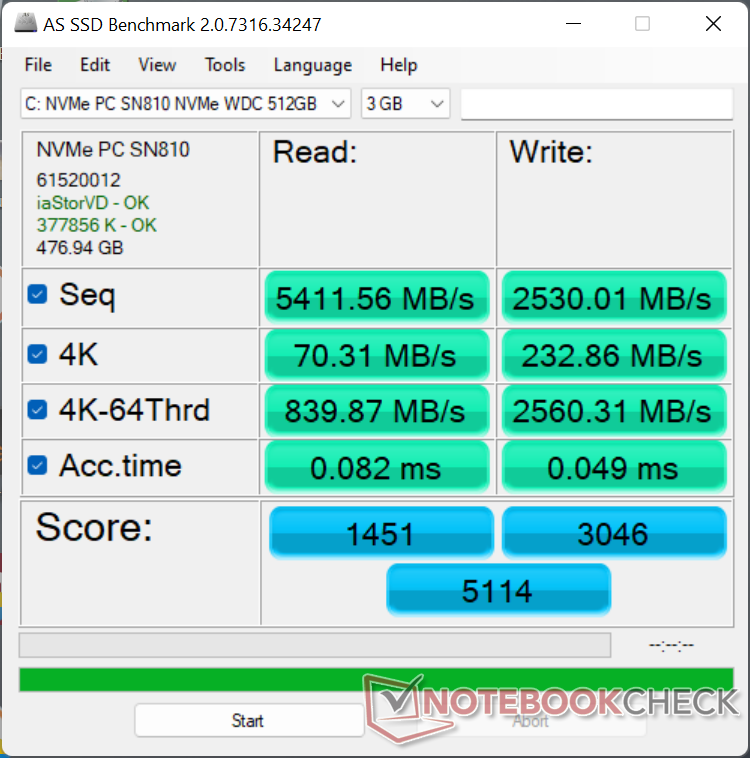
A Dell parece estar adquirindo seus SSDs de vários fabricantes para sua série XPS 13 Plus. Enquanto nossas duas unidades de teste anteriores seriam enviadas com o Micron 3400 ou Samsung PM9A1 PCIe4 x4 NVMe SSDs, nossa unidade de teste i7-1280P seria enviada com o Western Digital SN810 ao invés disso. Infelizmente, este drive WD parece ser inferior ao Samsung ou Micron, já que o desempenho aceleraria para apenas 3000 MB/s ao executar o DiskSpd em loop, como mostra nosso gráfico abaixo. Em comparação, os drives Samsung ou Micron exibiriam taxas de transferência estáveis quando submetidos ao mesmo teste de estresse.

| Drive Performance rating - Percent | |
| Dell XPS 13 Plus 9320 i7-1280P OLED | |
| Dell XPS 13 Plus 9320 4K | |
| Dell XPS 13 9310 OLED | |
| Dell XPS 13 Plus 9320 i5-1240p | |
| Dell XPS 13 9315, i5-1230U | |
| Dell XPS 13 9310 2-in-1 | |
* ... menor é melhor
Disk Throttling: DiskSpd Read Loop, Queue Depth 8
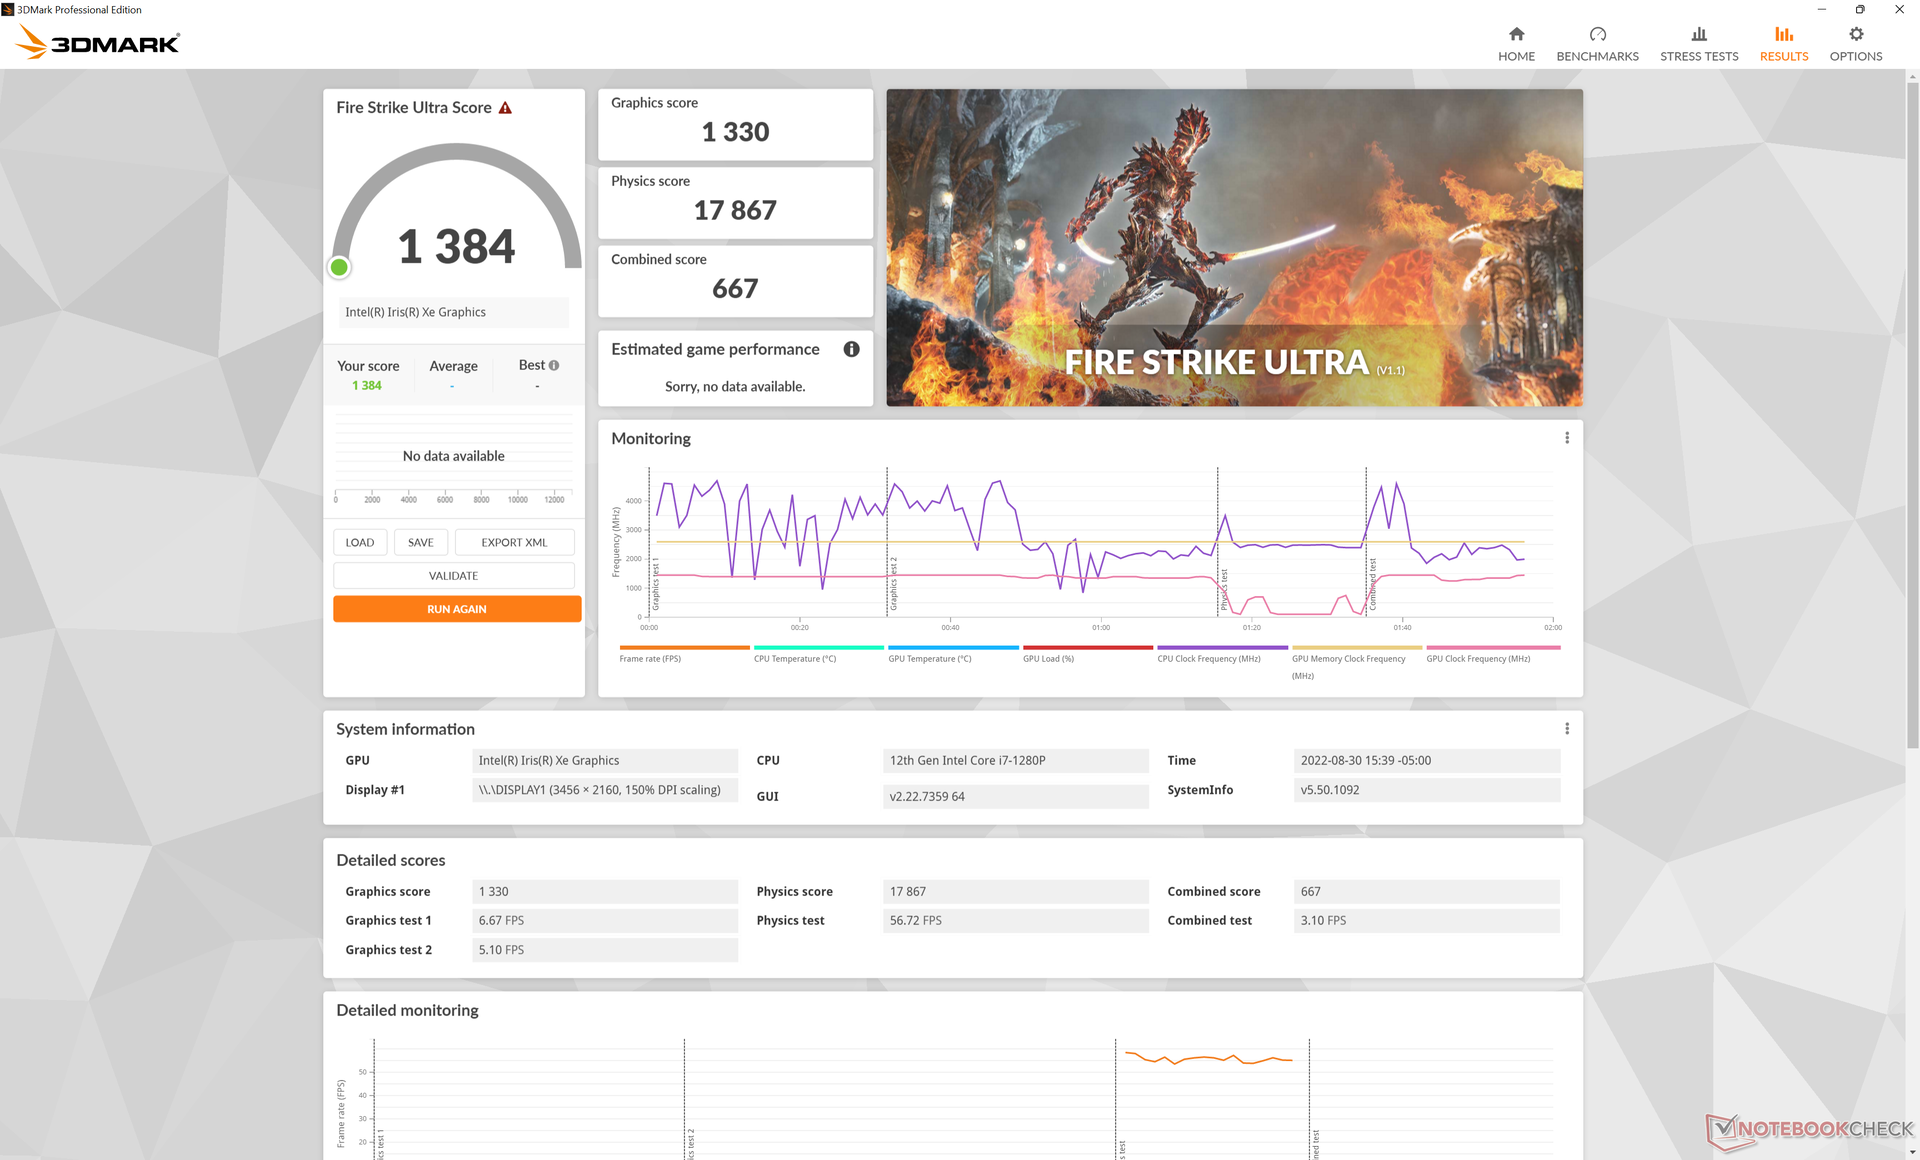
Desempenho da GPU
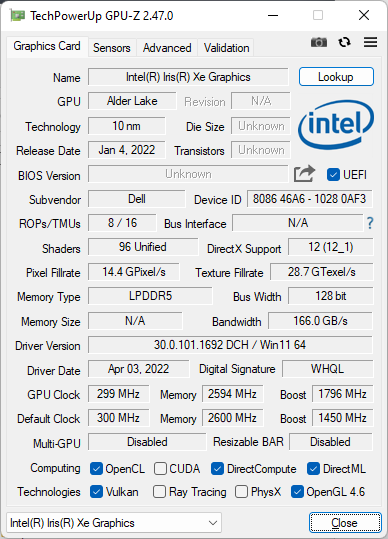
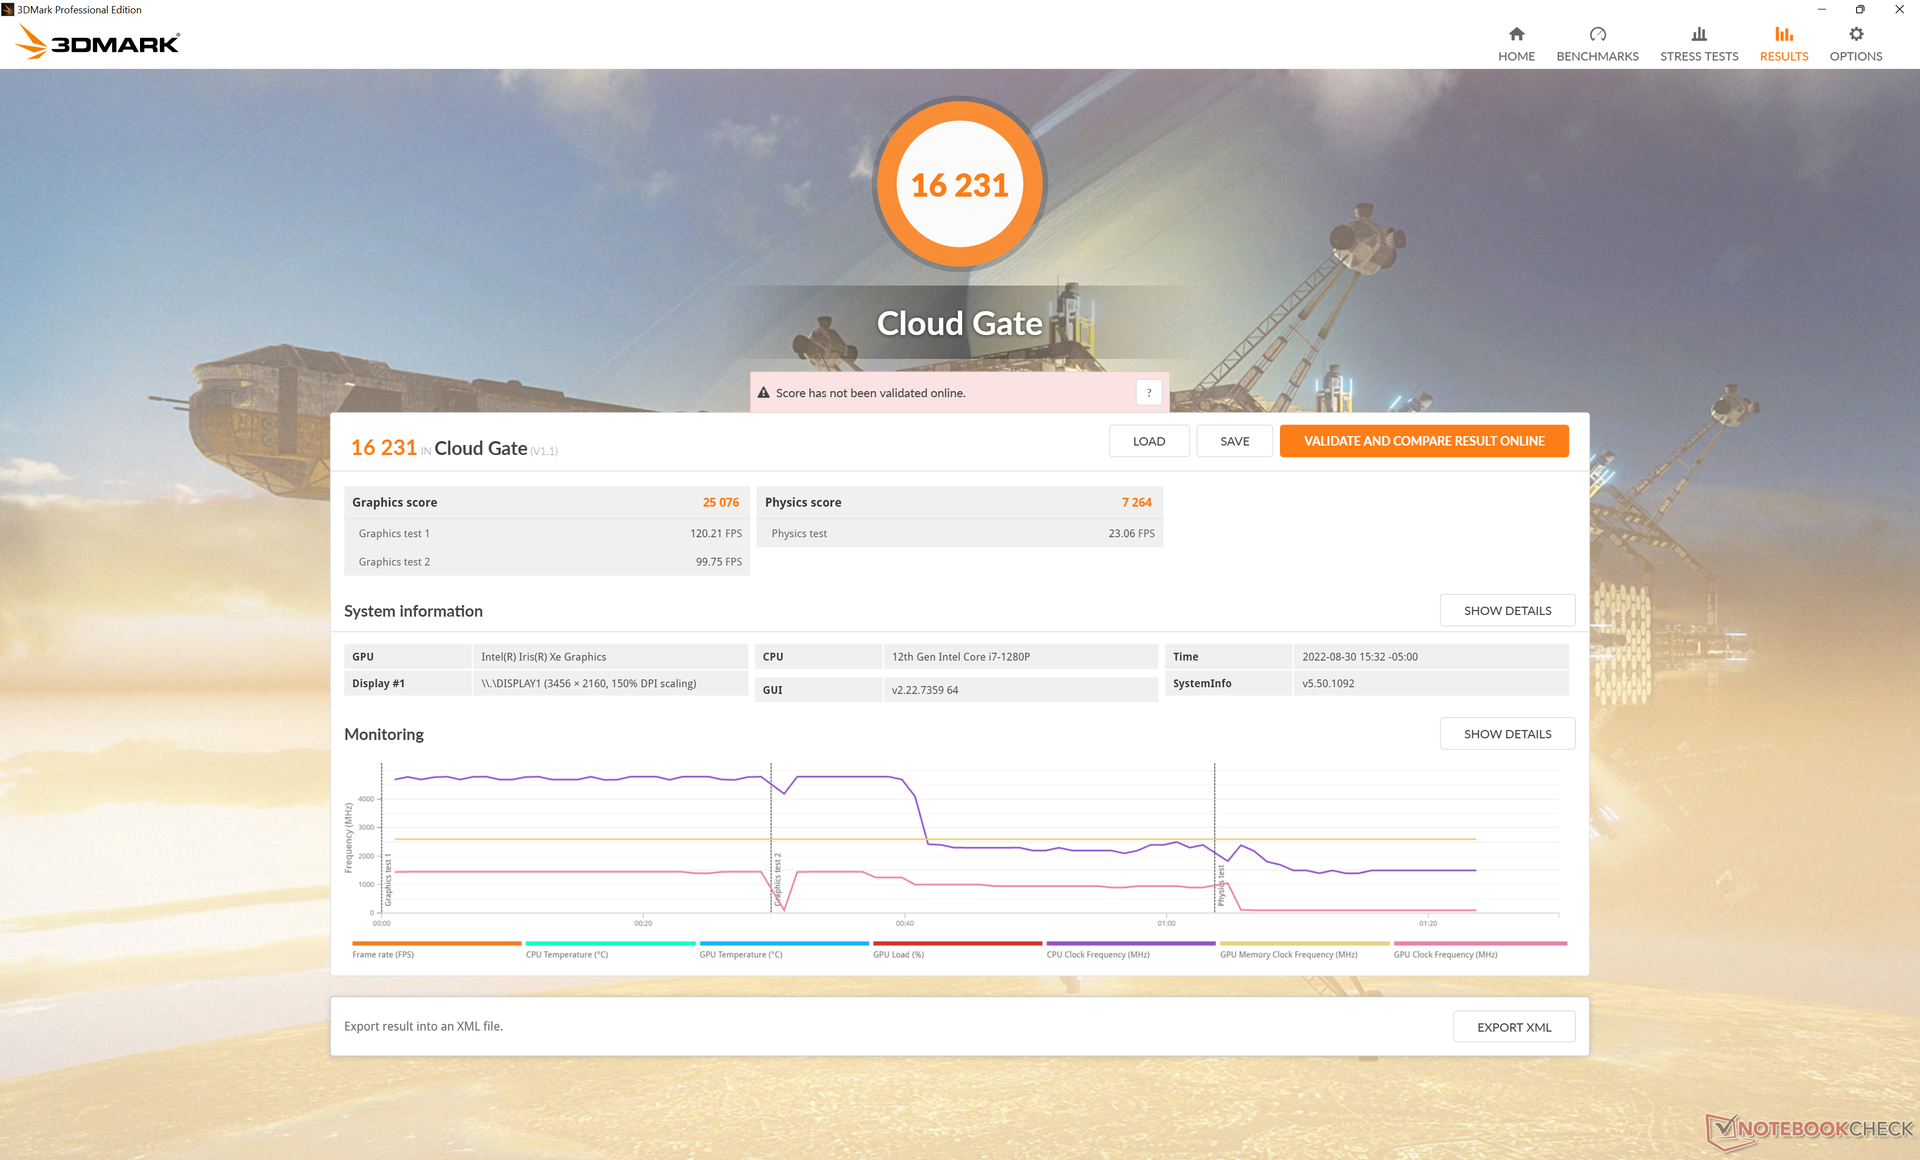
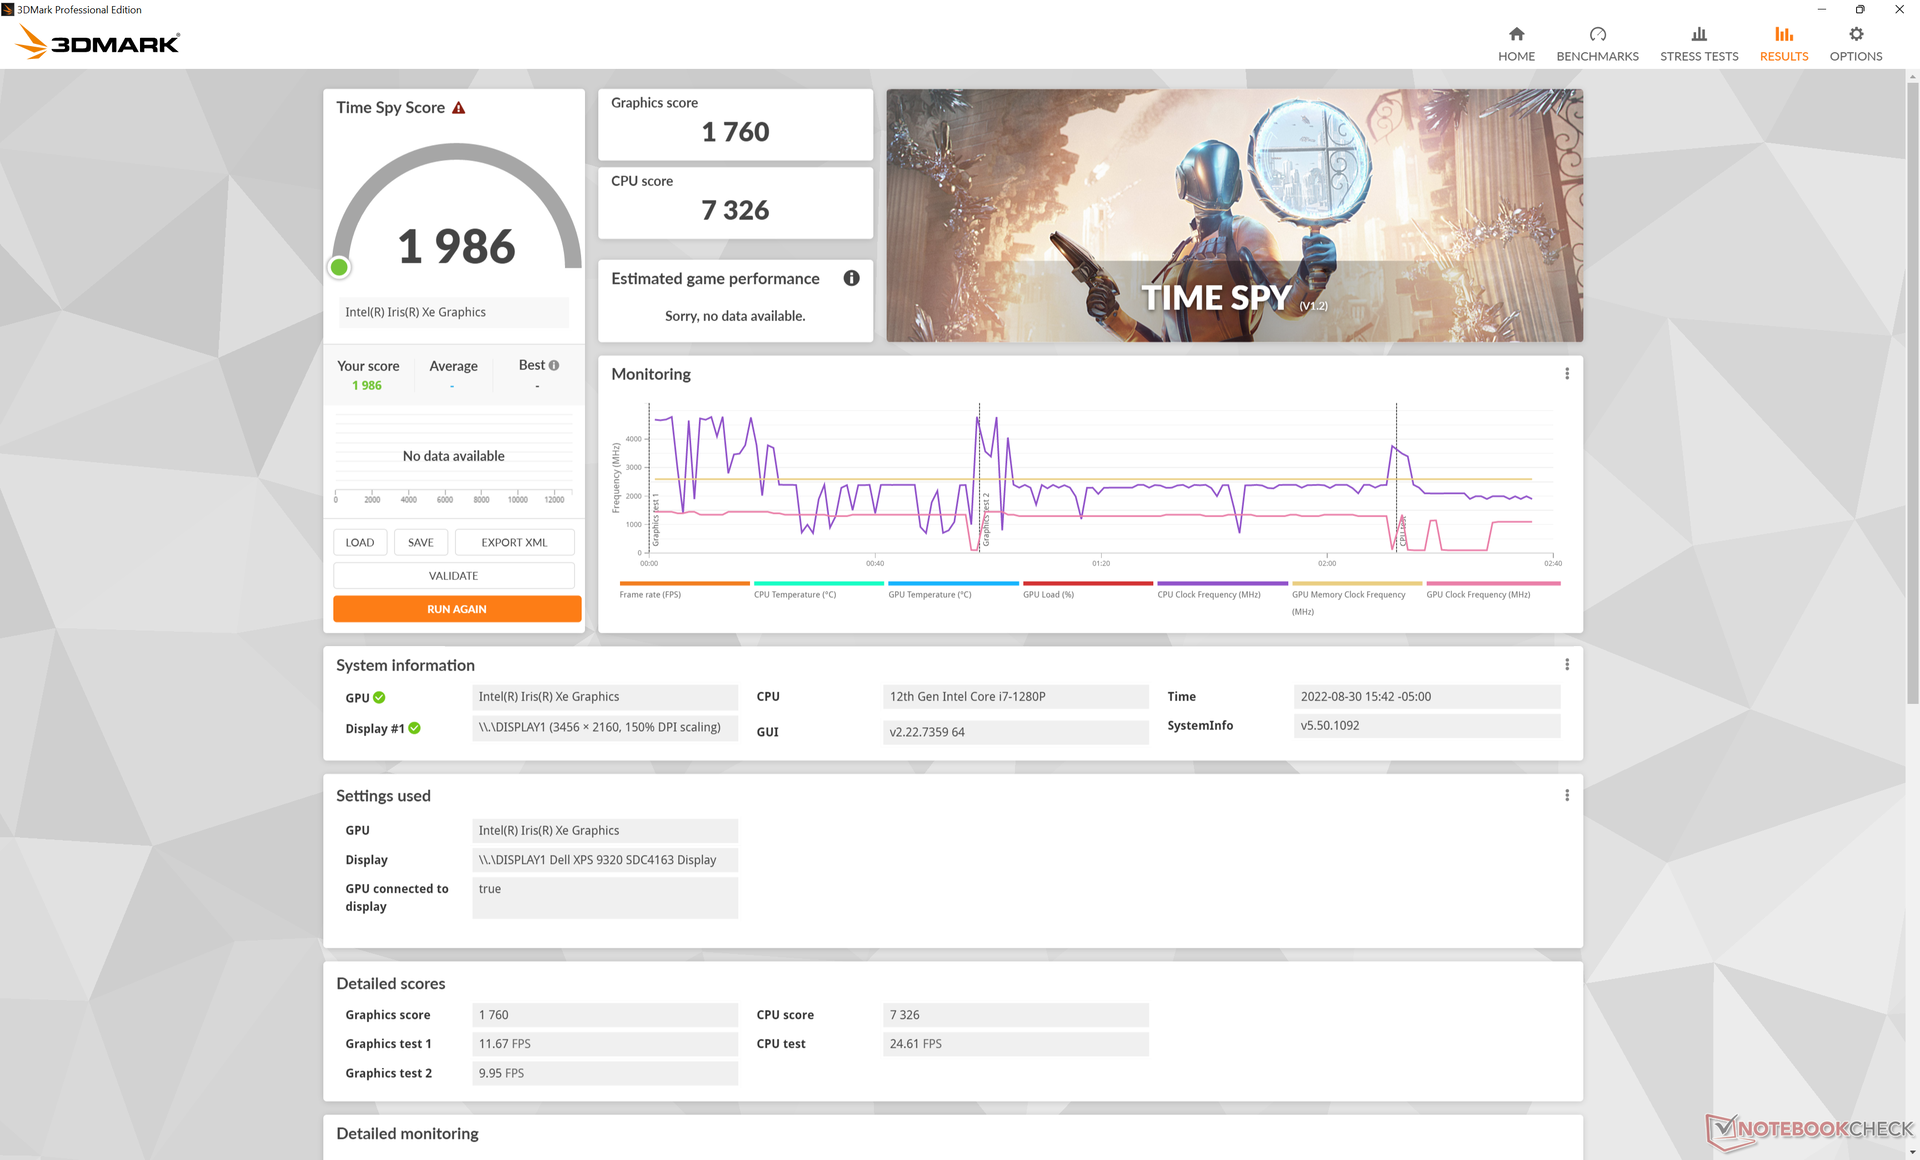
O desempenho gráfico é essencialmente idêntico ao da configuração do Core i7-1260P. Quando comparado com a opção Core i5-1240P com 8 GB de RAM e Iris Xe 80 EUsno entanto, nosso Iris Xe 96 EUs é aproximadamente 30 a 65 por cento mais rápido. Você vai querer configurar com pelo menos 16 GB de RAM e uma CPU Core i7 se desejar maximizar o desempenho da GPU.
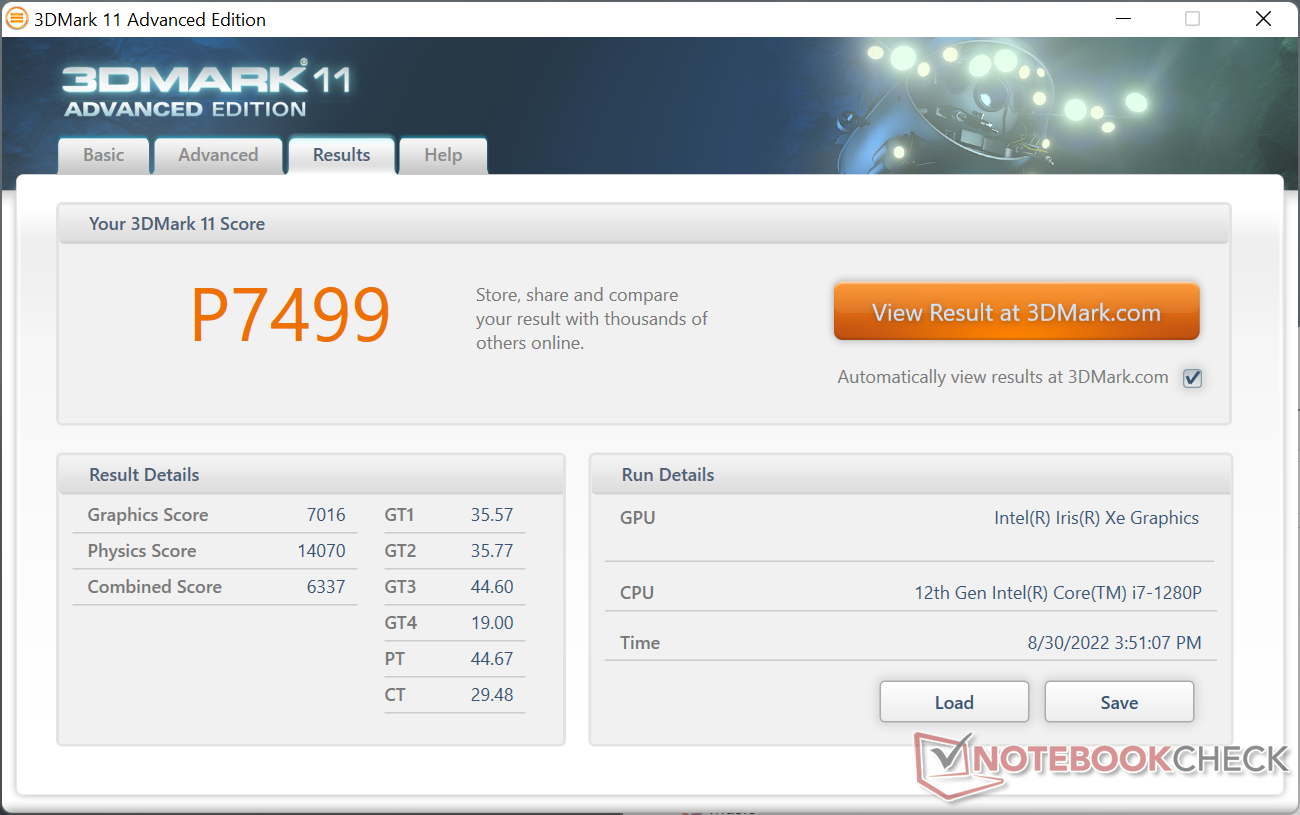
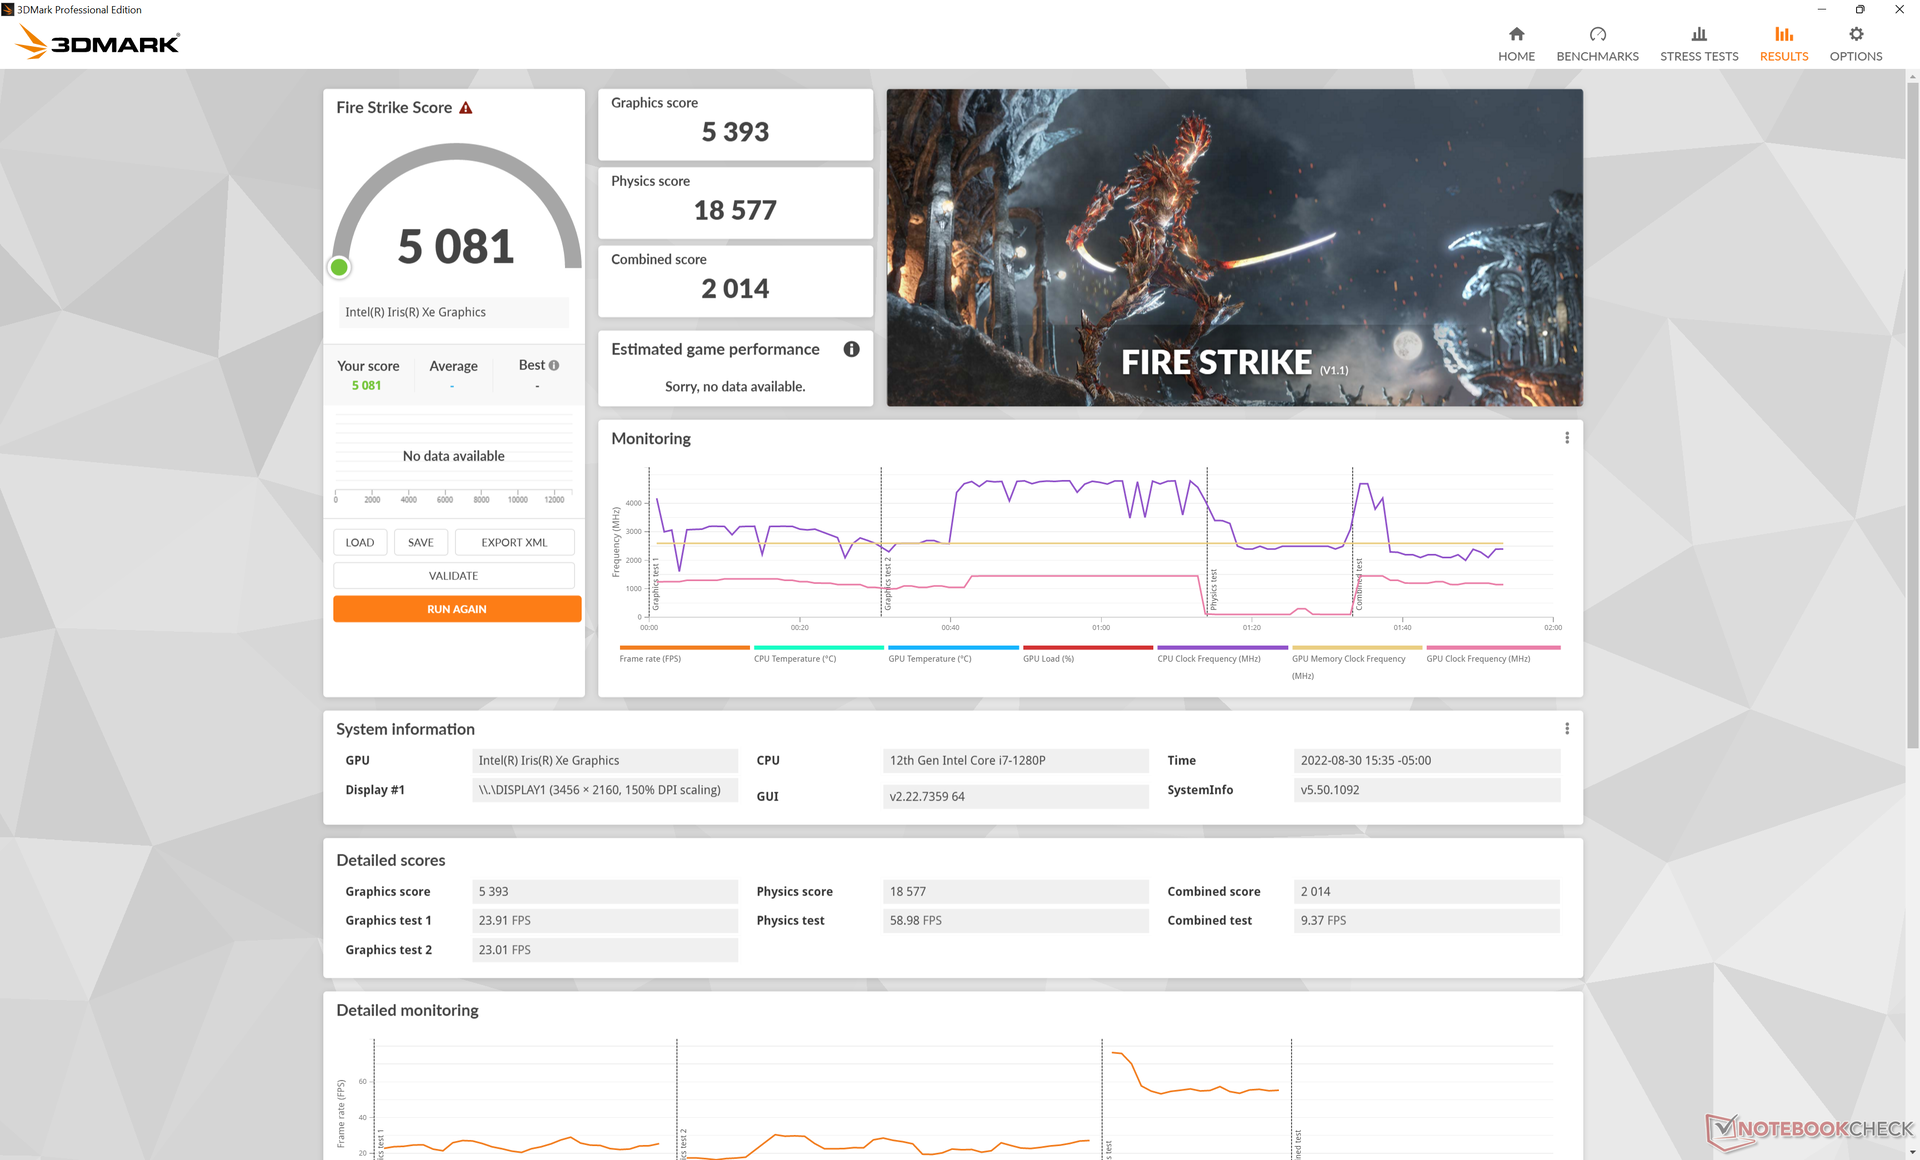
| 3DMark 11 Performance | 7499 pontos | |
| 3DMark Cloud Gate Standard Score | 16231 pontos | |
| 3DMark Fire Strike Score | 5081 pontos | |
| 3DMark Time Spy Score | 1986 pontos | |
Ajuda | ||
| Cyberpunk 2077 1.6 | |
| 1920x1080 Low Preset | |
| Dell XPS 13 Plus 9320 i7-1280P OLED | |
| Média Intel Iris Xe Graphics G7 96EUs (13 - 25.9, n=42) | |
| 1920x1080 Medium Preset | |
| Dell XPS 13 Plus 9320 i7-1280P OLED | |
| Média Intel Iris Xe Graphics G7 96EUs (10.8 - 21.7, n=37) | |
| 1920x1080 High Preset | |
| Dell XPS 13 Plus 9320 i7-1280P OLED | |
| Média Intel Iris Xe Graphics G7 96EUs (9.8 - 16.9, n=34) | |
| 1920x1080 Ultra Preset | |
| Dell XPS 13 Plus 9320 i7-1280P OLED | |
| Média Intel Iris Xe Graphics G7 96EUs (7.4 - 16.8, n=32) | |
Witcher 3 FPS Chart
| baixo | média | alto | ultra | |
|---|---|---|---|---|
| GTA V (2015) | 123.7 | 108.7 | 27.6 | 11.5 |
| The Witcher 3 (2015) | 104.8 | 65.7 | 36.9 | 16.4 |
| Dota 2 Reborn (2015) | 110.3 | 86.8 | 68.1 | 58.7 |
| Final Fantasy XV Benchmark (2018) | 46.1 | 25.3 | 17.6 | |
| X-Plane 11.11 (2018) | 55.2 | 40.7 | 37.6 | |
| Strange Brigade (2018) | 100.2 | 45.4 | 36.5 | 29.6 |
| Cyberpunk 2077 1.6 (2022) | 20.9 | 17.9 | 13.9 | 11.2 |
Emissões
Ruído do sistema
Os ventiladores internos gêmeos são excelentes para manter o silêncio durante cargas baixas a baixas-médias, pois só somos capazes de medir um ruído de apenas 25,4 dB(A) ao navegar ou transmitir vídeo contra um fundo silencioso de 23,4 dB(A). Cargas mais elevadas como jogos induzirão um ruído do ventilador entre a faixa de 35 a 42 dB(A). Estranhamente, não conseguimos alcançar o teto de 45,5 dB(A) que gravamos na configuração i7-1260P, mesmo quando configurado para o modo Ultra Performance. Em vez disso, os resultados gerais estão mais próximos ao que gravamos no antigo XPS 13 9310 2 em 1.
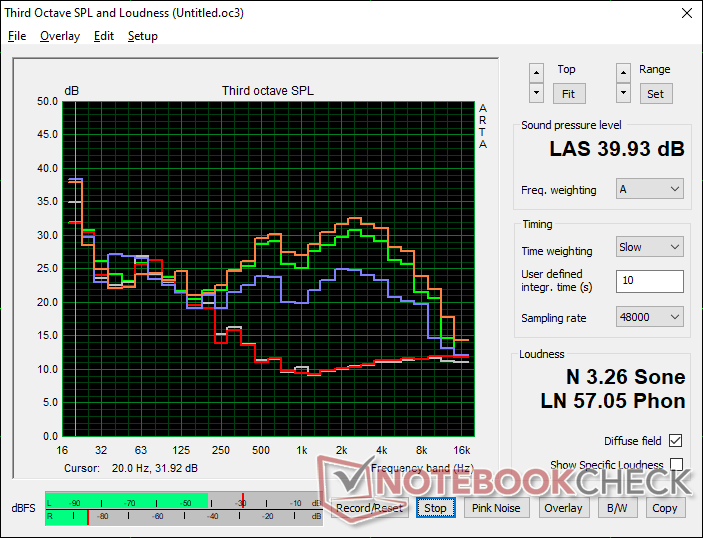
Barulho
| Ocioso |
| 23.4 / 23.4 / 23.4 dB |
| Carga |
| 35 / 39.9 dB |
 | ||
30 dB silencioso 40 dB(A) audível 50 dB(A) ruidosamente alto |
||
min: | ||
| Dell XPS 13 Plus 9320 i7-1280P OLED Iris Xe G7 96EUs, i7-1280P, WDC PC SN810 512GB | Dell XPS 13 Plus 9320 i5-1240p Iris Xe G7 80EUs, i5-1240P, Micron 3400 MTFDKBA512TFH 512GB | Dell XPS 13 9315, i5-1230U Iris Xe G7 80EUs, i5-1230U, Micron 3460 256 GB Soldered | Dell XPS 13 Plus 9320 4K Iris Xe G7 96EUs, i7-1260P, Samsung PM9A1 MZVL21T0HCLR | Dell XPS 13 9310 2-in-1 Iris Xe G7 96EUs, i7-1165G7, Toshiba BG4 KBG40ZPZ512G | Dell XPS 13 9310 OLED Iris Xe G7 96EUs, i7-1185G7, Toshiba XG6 KXG60ZNV512G | |
|---|---|---|---|---|---|---|
| Noise | -13% | -8% | -8% | -4% | 4% | |
| desligado / ambiente * (dB) | 23.4 | 26 -11% | 26 -11% | 24.4 -4% | 24.3 -4% | 24.8 -6% |
| Idle Minimum * (dB) | 23.4 | 26.2 -12% | 26 -11% | 24.4 -4% | 24.8 -6% | 25 -7% |
| Idle Average * (dB) | 23.4 | 26.2 -12% | 26 -11% | 24.4 -4% | 24.8 -6% | 25 -7% |
| Idle Maximum * (dB) | 23.4 | 26.2 -12% | 27.5 -18% | 25.5 -9% | 24.8 -6% | 25 -7% |
| Load Average * (dB) | 35 | 38.4 -10% | 39.5 -13% | 40.4 -15% | 38 -9% | 25.3 28% |
| Witcher 3 ultra * (dB) | 41.6 | 39.6 5% | 45.5 -9% | 38 9% | 35.8 14% | |
| Load Maximum * (dB) | 39.9 | 47.1 -18% | 39.6 1% | 45.5 -14% | 41.5 -4% | 35.8 10% |
* ... menor é melhor
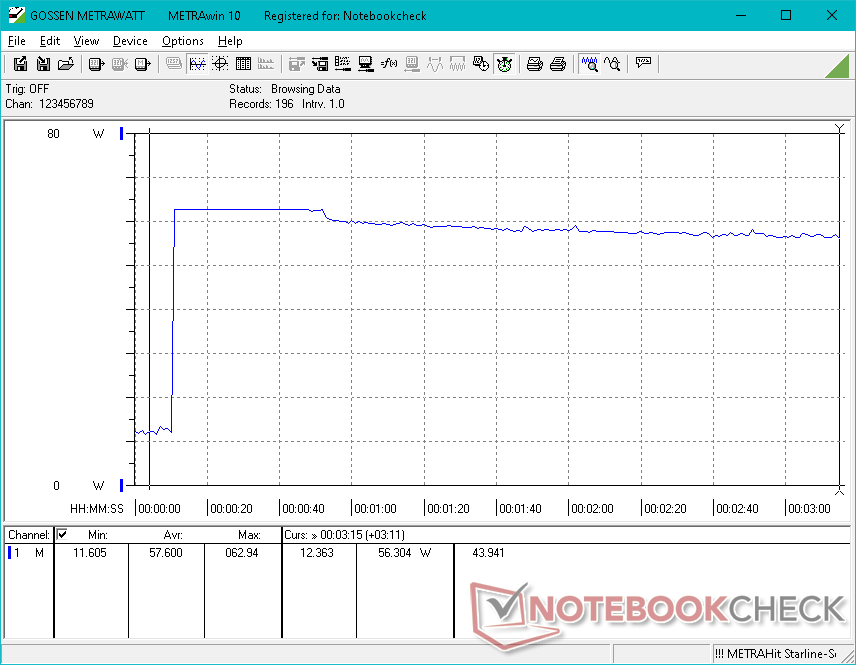
Teste de estresse
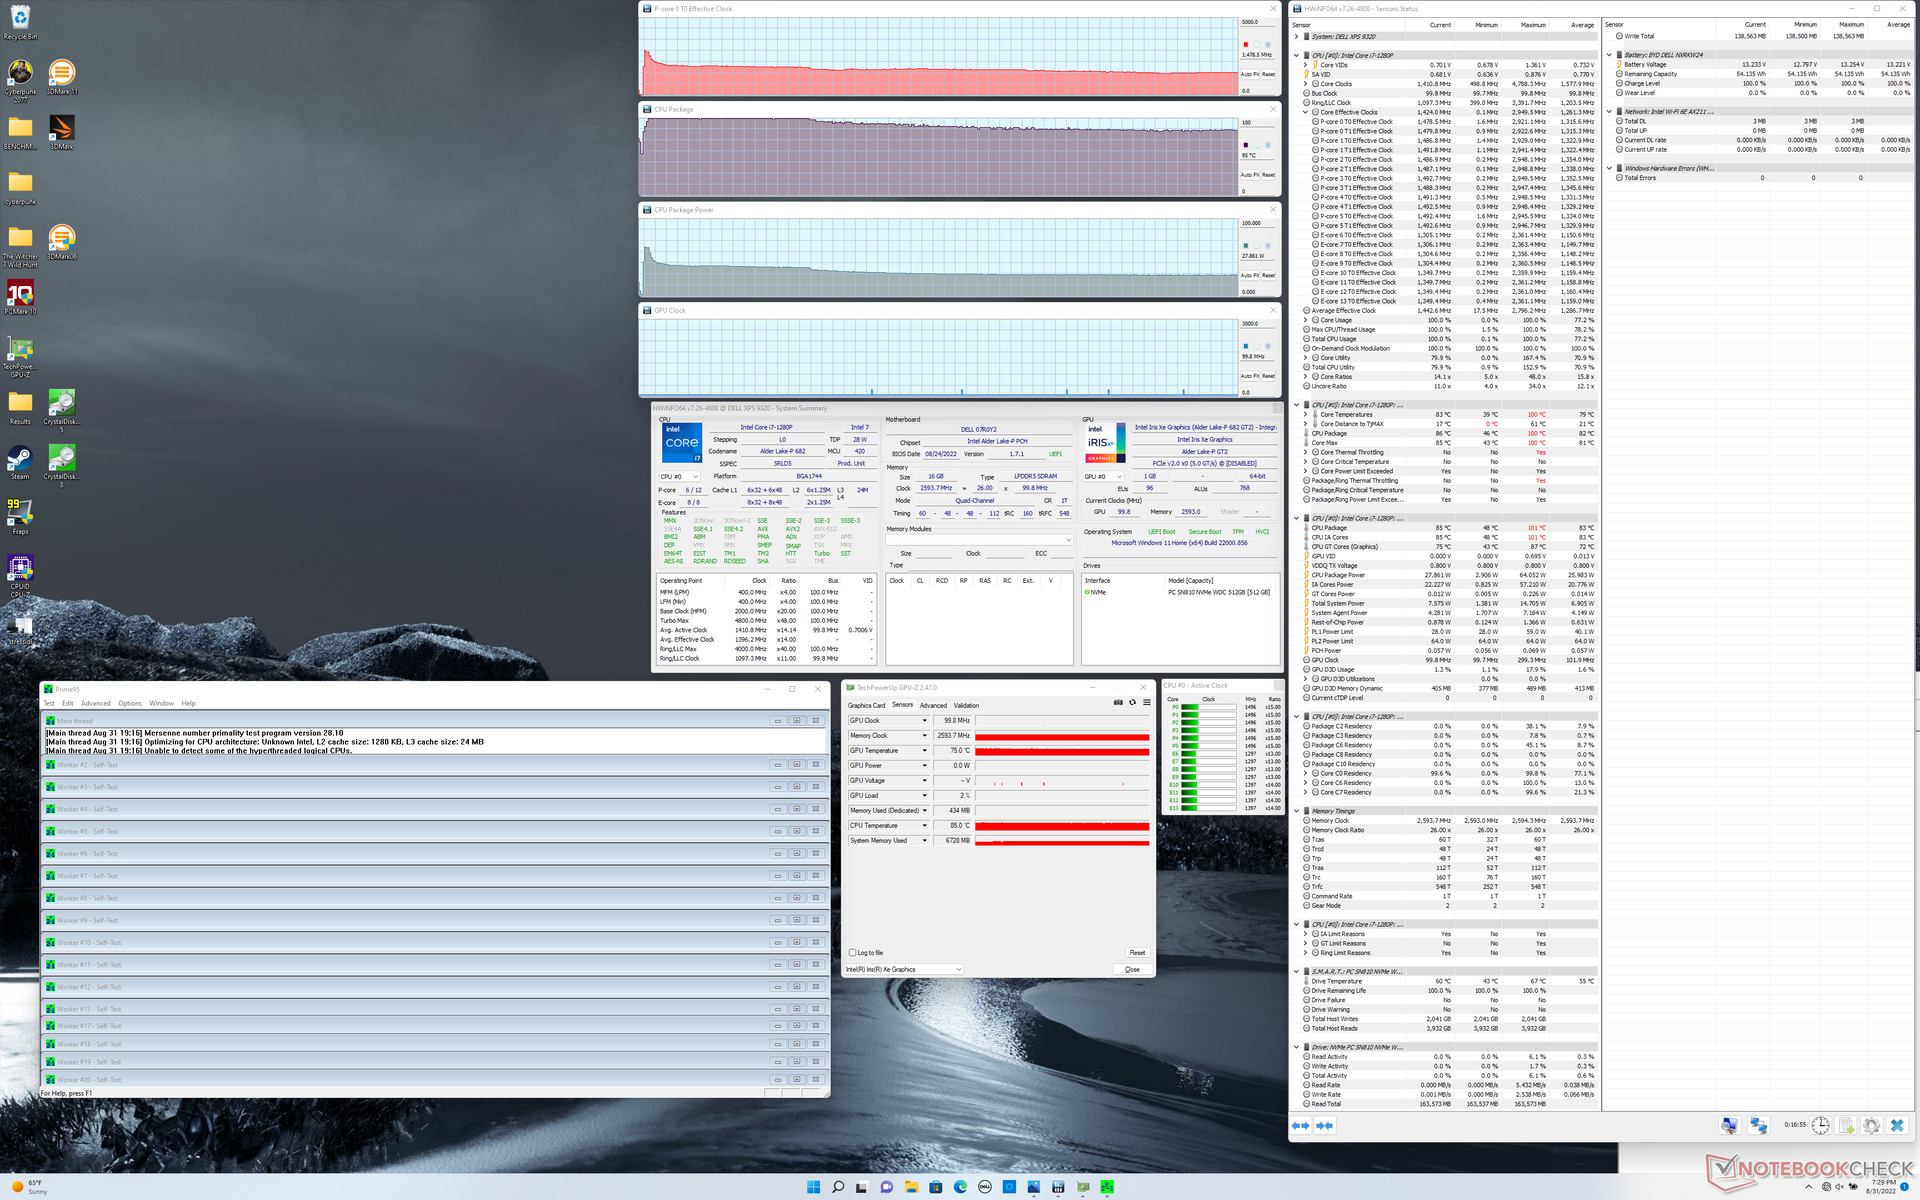
Iniciando Prime95, o stress provoca o aumento da taxa de clock da CPU, da temperatura e da potência da placa para 2,9 GHz, 100 C e 64 W, respectivamente, com duração de quase 3 minutos. Depois disso, as taxas de clock, temperatura e consumo de energia da placa cairiam e estabilizariam para 1,5 GHz, 85 C e 28 W, respectivamente, como mostra a captura de tela abaixo. Estes resultados se alinham com o teste de estresse CineBench R15 xT acima onde a alta pontuação inicial não foi sustentável por longos períodos devido ao Turbo Boost limitado do laptop. Curiosamente, o alvo estável de 28 W é na verdade inferior ao alvo estável de 34 W da configuração i7-1260P, o que pode explicar os resultados ligeiramente melhores do CineBench R15 xT de nossa unidade de teste i7-1260P.
O relógio GPU e a temperatura se estabilizariam em 1147 MHz e 81 C, respectivamente, quando em funcionamento Witcher 3 para representar cargas gráficas exigentes.
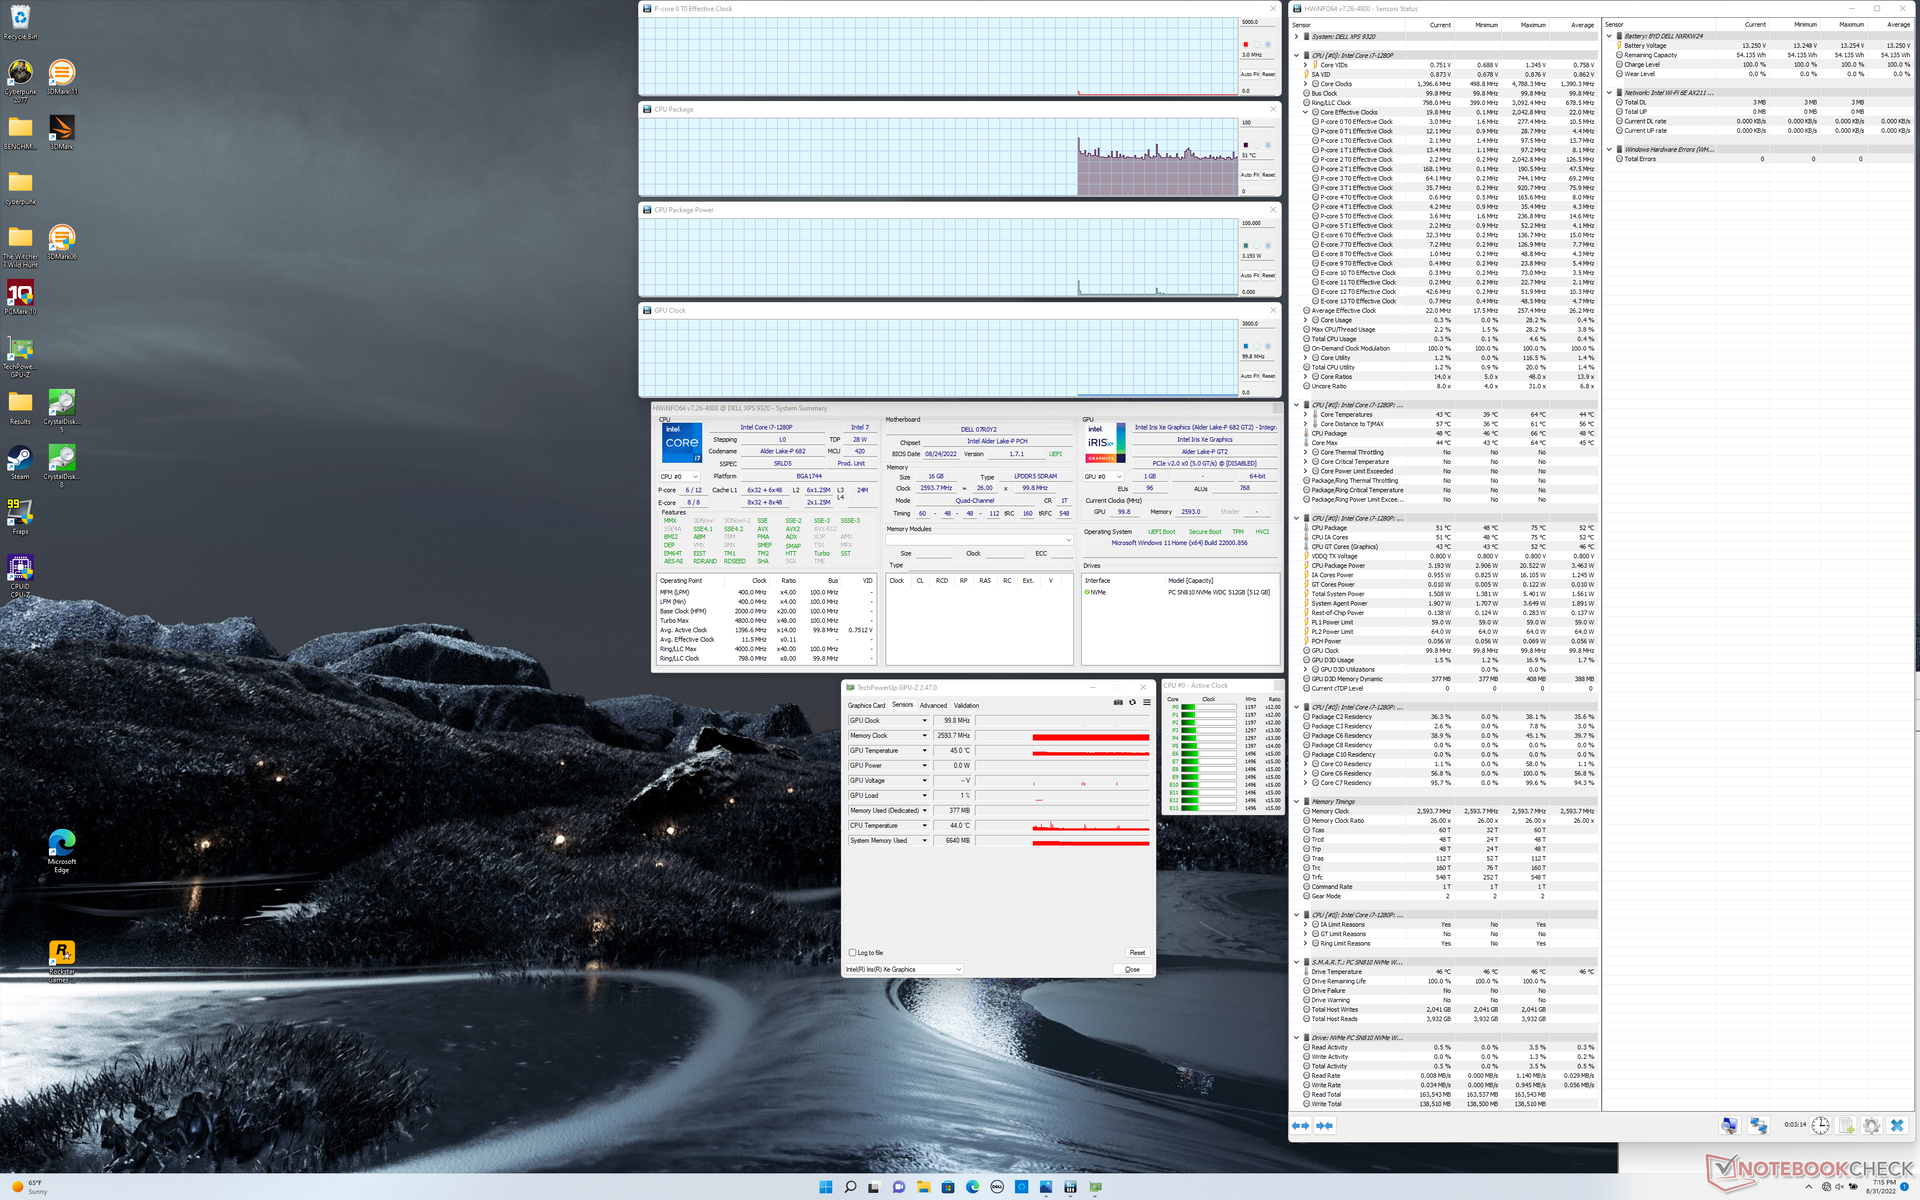
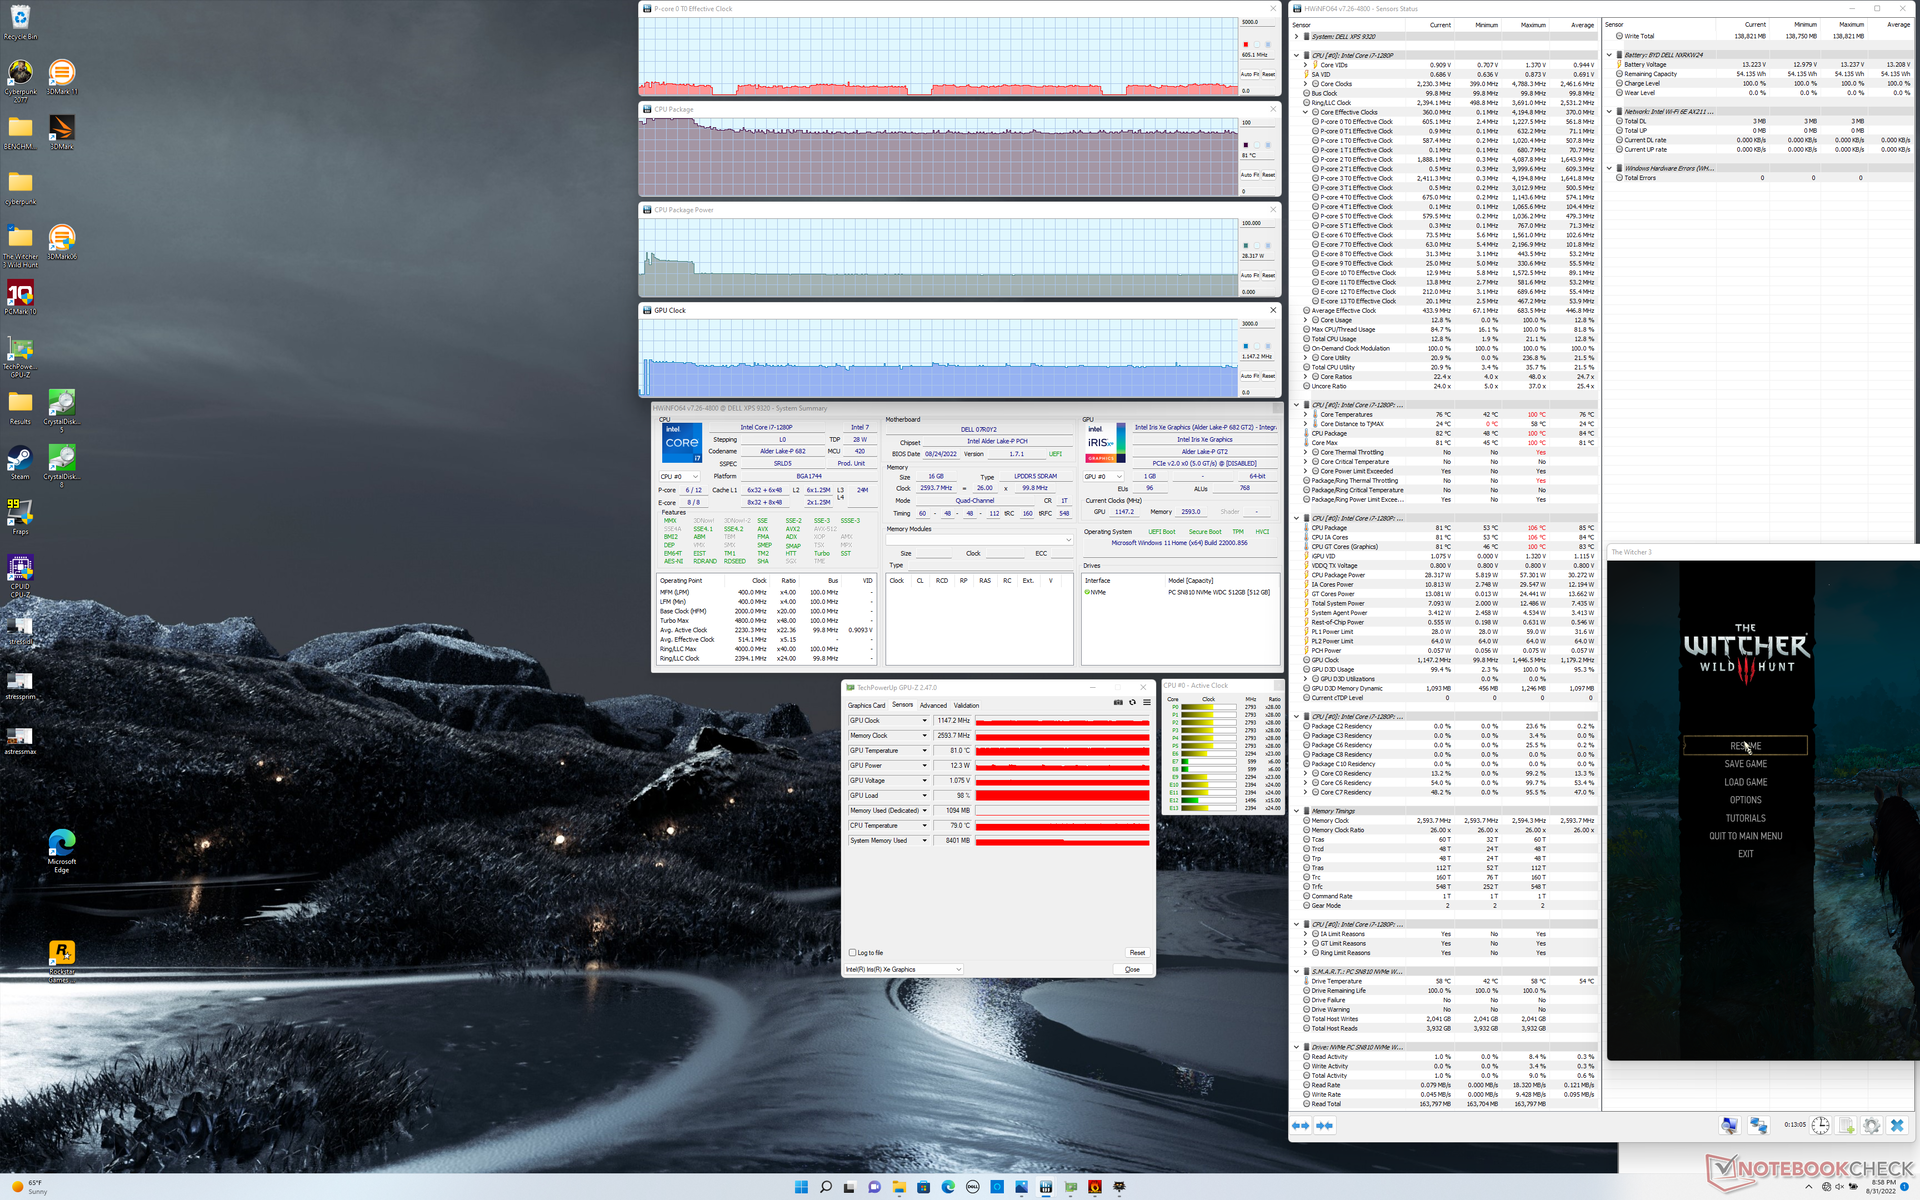
| Relógio CPU (GHz) | Relógio GPU (MHz) | Temperatura média da CPU (°C) | |
| System Idle | -- | -- | 51 |
| Prime95 Stress | 1.5 | -- | 85 |
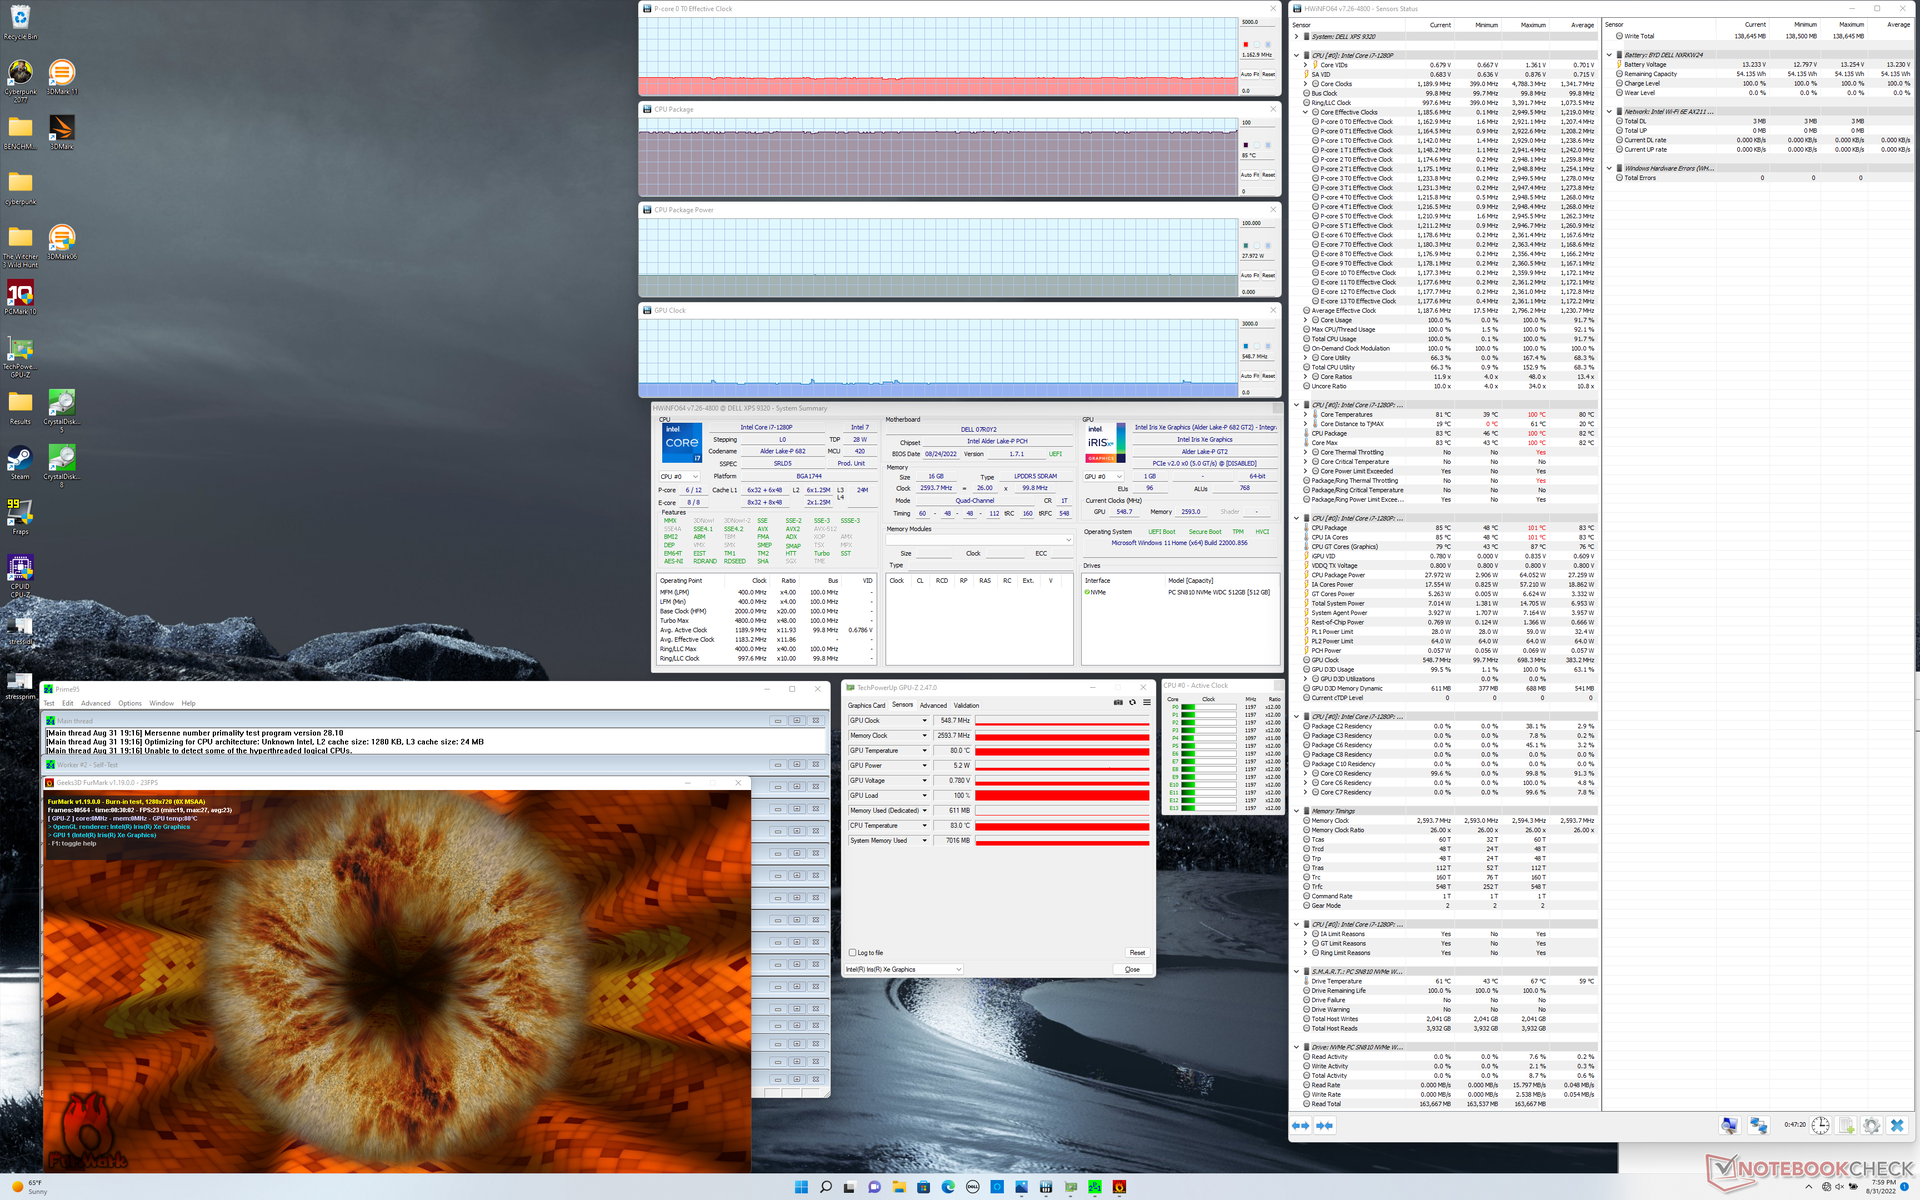
| Prime95 + FurMark Stress | 1.2 | 549 | 85 |
| Witcher 3 Estresse | ~0.6 | 1147 | 81 |
Gestão de energia
Consumo de energia
O consumo de energia pode ser tão baixo quanto 6 W quando se exibe uma imagem em preto como pitch ou até 13 W quando se exibe uma imagem totalmente branca na configuração de brilho máximo. Em comparação, os painéis IPS nos outros XPS 13 Plus SKUs só aumentariam de 2 a 4 W entre suas configurações de brilho mínimo e máximo. Exploramos como o consumo de energia se relaciona com os painéis OLED no passado e a tendência continua nestas configurações do XPS 13 Plus. Em resumo, as opções de IPS serão mais eficientes na maioria dos cenários, especialmente porque websites, planilhas e programas de processamento de texto tendem a ser predominantemente brancos em cores.
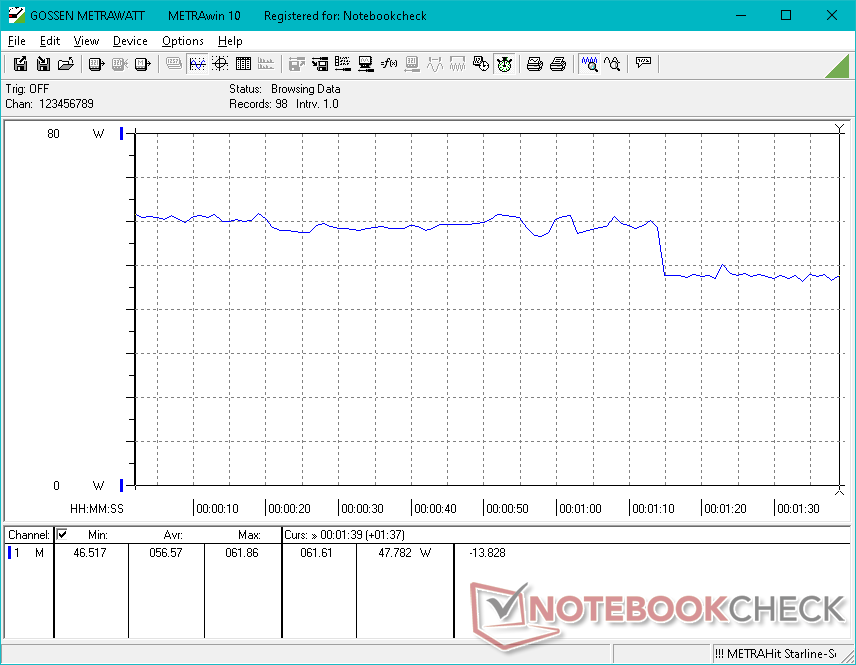
A execução de cargas mais altas como jogos mostra um consumo de energia maior do que a configuração de 8 GB Core i5-1240P em cerca de 15 a 55%, o que se correlaciona aproximadamente com o maior desempenho gráfico de nossa configuração de 16 GB i7-1280P. Os resultados são muito próximos da configuração do Core i7-1260P, exceto quando executando cargas intensivas de CPU como Prime95 durante os primeiros minutos, como mostra nosso gráfico abaixo.
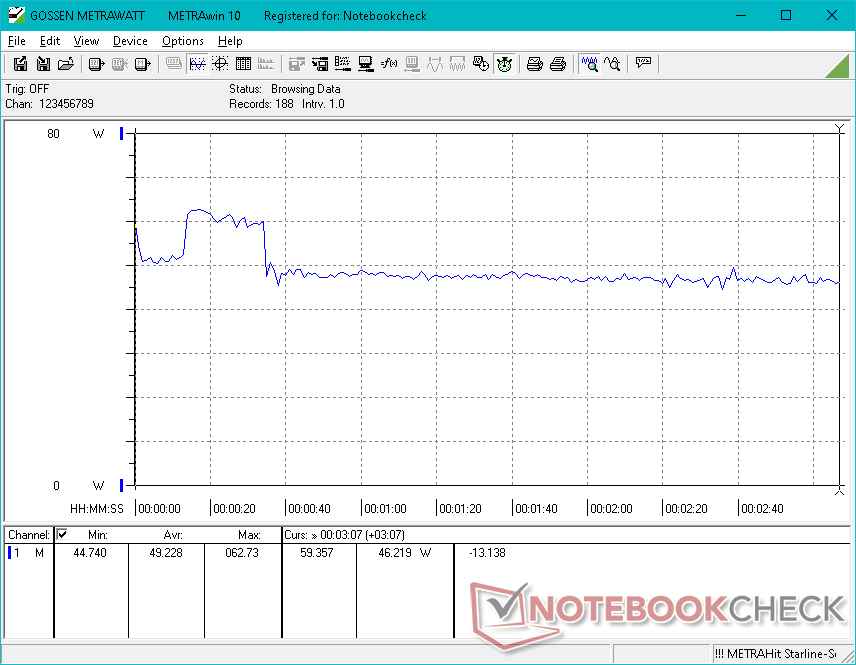
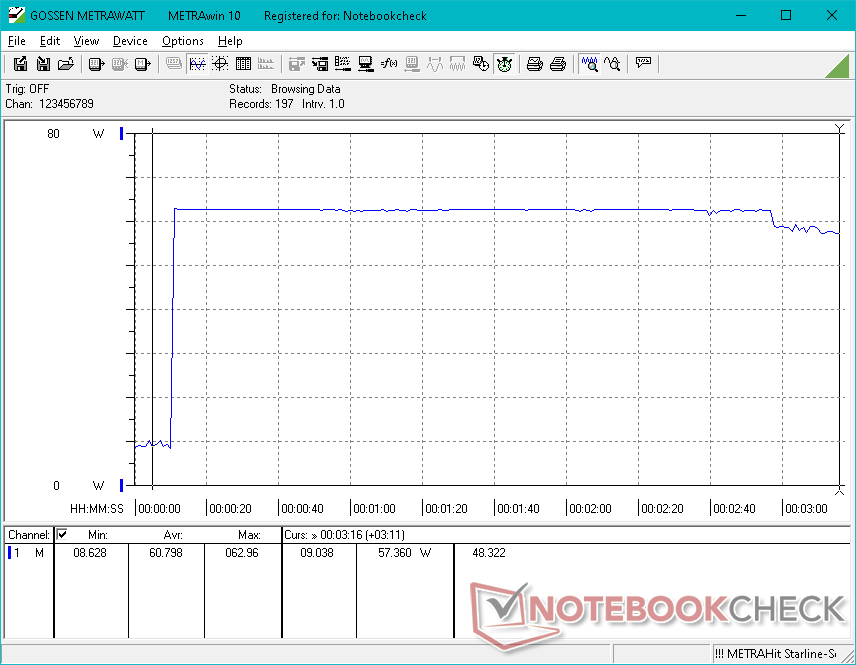
| desligado | |
| Ocioso | |
| Carga |
|
Key:
min: | |
| Dell XPS 13 Plus 9320 i7-1280P OLED i7-1280P, Iris Xe G7 96EUs, WDC PC SN810 512GB, OLED, 3456x2160, 13.4" | Dell XPS 13 Plus 9320 i5-1240p i5-1240P, Iris Xe G7 80EUs, Micron 3400 MTFDKBA512TFH 512GB, IPS, 1920x1200, 13.4" | Dell XPS 13 9315, i5-1230U i5-1230U, Iris Xe G7 80EUs, Micron 3460 256 GB Soldered, IPS, 1920x1200, 13.4" | Dell XPS 13 Plus 9320 4K i7-1260P, Iris Xe G7 96EUs, Samsung PM9A1 MZVL21T0HCLR, IPS, 3840x2400, 13.4" | Dell XPS 13 9310 2-in-1 i7-1165G7, Iris Xe G7 96EUs, Toshiba BG4 KBG40ZPZ512G, IPS, 1920x1200, 13.4" | Dell XPS 13 9310 OLED i7-1185G7, Iris Xe G7 96EUs, Toshiba XG6 KXG60ZNV512G, OLED, 3456x2160, 13.4" | |
|---|---|---|---|---|---|---|
| Power Consumption | -16% | 40% | -7% | 38% | 19% | |
| Idle Minimum * (Watt) | 6.5 | 10 -54% | 3.6 45% | 7 -8% | 2.6 60% | 5.7 12% |
| Idle Average * (Watt) | 7.8 | 12.3 -58% | 6.8 13% | 11 -41% | 6.4 18% | 6 23% |
| Idle Maximum * (Watt) | 13 | 15.5 -19% | 6.8 48% | 11.4 12% | 7.7 41% | 12.3 5% |
| Load Average * (Watt) | 56.6 | 43 24% | 24 58% | 59.7 -5% | 29.9 47% | 44.4 22% |
| Witcher 3 ultra * (Watt) | 49.2 | 43.1 12% | 23.6 52% | 49.4 -0% | 32.2 35% | 36.5 26% |
| Load Maximum * (Watt) | 63 | 62.8 -0% | 47 25% | 63 -0% | 47.5 25% | 47.8 24% |
* ... menor é melhor
Power Consumption Witcher 3 / Stresstest
Power Consumption external Monitor
Vida útil da bateria
Com apenas 5,5 horas de uso da WLAN no mundo real no perfil de potência Balanceado, os tempos de execução são mais curtos do que qualquer outra configuração do XPS 13 Plus devido em grande parte ao painel OLED. As outras SKUs IPS duram cerca de 1 a 2 horas a mais.
| Dell XPS 13 Plus 9320 i7-1280P OLED i7-1280P, Iris Xe G7 96EUs, 55 Wh | Dell XPS 13 Plus 9320 i5-1240p i5-1240P, Iris Xe G7 80EUs, 55 Wh | Dell XPS 13 9315, i5-1230U i5-1230U, Iris Xe G7 80EUs, 51 Wh | Dell XPS 13 Plus 9320 4K i7-1260P, Iris Xe G7 96EUs, 55 Wh | Dell XPS 13 9310 2-in-1 i7-1165G7, Iris Xe G7 96EUs, 51 Wh | Dell XPS 13 9310 OLED i7-1185G7, Iris Xe G7 96EUs, 52 Wh | |
|---|---|---|---|---|---|---|
| Duração da bateria | 38% | 155% | 19% | 84% | 12% | |
| WiFi v1.3 (h) | 5.8 | 8 38% | 14.8 155% | 6.9 19% | 10.7 84% | 6.5 12% |
| Load (h) | 1.6 | 2.6 | 1.3 | 3.4 | ||
| H.264 (h) | 11 | |||||
| Reader / Idle (h) | 25.4 |
Pro
Contra
Veredicto - Mais rápido, mas não exatamente melhor
A configuração mais alta com o Núcleo i7-1280P CPU e visor OLED é projetado para um subconjunto muito específico de usuários. Se suas cargas de trabalho requerem cores P3 e multi-tarefas pesadas entre aplicações, então o Turbo Boost inicial mais rápido da CPU e do painel OLED pode valer o investimento sobre o menos caro Núcleo i7-1260P e IPS opções. Caso contrário, as desvantagens que elas acarretam não necessariamente superam seus benefícios. OLED introduz a cintilação que de outra forma não está presente nos painéis IPS, além de um brilho máximo mais baixo e uma menor duração da bateria. A CPU i7-1280P também não tem garantia de ser mais rápida do que a i7-1260P quando o pico inicial de desempenho do Turbo Boost inevitavelmente se afina.
Outro resultado inesperado está relacionado ao desempenho do SSD WD SN810 que aceleraria em nossa unidade de teste quando sob tensão. Se você puder encontrar SKUs com o Micron 3400 ou Samsung PM9A1 em seu lugar, então esses drives podem oferecer um desempenho mais estável.
Para a maioria dos usuários, a configuração Core i7-1260P e IPS consegue um melhor equilíbrio entre desempenho e preço do que a configuração i7-1280P e OLED. Ele oferece tanto uma maior duração da bateria quanto uma tela mais brilhante, apesar do menor ponto de preço.
As diferenças entre os SKUs i7-1260P e i7-1280P são mais estreitas do que as diferenças entre os i5-1240P e i7-1260P SKUs quando se trata de desempenho gráfico integrado. Recomendamos a configuração com pelo menos 16 GB de RAM, não importando a opção de CPU ou então o desempenho gráfico nosedives.
Preço e Disponibilidade
As configurações com o Core i7-1280P ainda não estão amplamente disponíveis através de revendedores como Newegg, Amazon ou Best Buy como SKUs com o i7-1260P são significativamente mais comuns. Entretanto, as opções OLED estão amplamente disponíveis, embora com a i7-1260P em seu lugar. Os usuários podem comprar diretamente da Dell para nossa configuração exata i7-1280P OLED por $1750 USD.
Dell XPS 13 Plus 9320 i7-1280P OLED
- 09/02/2022 v7 (old)
Allen Ngo
Price comparison

