Breve Análise do Portátil Gigabyte P57X v6

| SD Card Reader | |
| average JPG Copy Test (av. of 3 runs) | |
| MSI GT72VR 6RD-063US | |
| Acer Predator 17 G9-793-77LG | |
| Gigabyte P57X v6 | |
| Asus G752VS-XB78K | |
| Lenovo IdeaPad Y900 | |
| maximum AS SSD Seq Read Test (1GB) | |
| MSI GT72VR 6RD-063US | |
| Lenovo IdeaPad Y900 | |
| Gigabyte P57X v6 | |
| Acer Predator 17 G9-793-77LG | |
| Asus G752VS-XB78K | |
| Networking | |
| iperf Server (receive) TCP 1 m 512KB | |
| Lenovo IdeaPad Y900 | |
| Gigabyte P57X v6 | |
| iperf Client (transmit) TCP 1 m 512KB | |
| Lenovo IdeaPad Y900 | |
| Gigabyte P57X v6 | |
| |||||||||||||||||||||||||
iluminação: 93 %
iluminação com acumulador: 329.2 cd/m²
Contraste: 1233:1 (Preto: 0.267 cd/m²)
ΔE ColorChecker Calman: 5.93 | ∀{0.5-29.43 Ø4.71}
ΔE Greyscale Calman: 6.72 | ∀{0.09-98 Ø4.96}
87% sRGB (Argyll 1.6.3 3D)
57% AdobeRGB 1998 (Argyll 1.6.3 3D)
64% AdobeRGB 1998 (Argyll 3D)
87.5% sRGB (Argyll 3D)
68% Display P3 (Argyll 3D)
Gamma: 2.12
CCT: 7611 K
| Gigabyte P57X v6 LGD0469, IPS, 17.3", 1920x1080 | Lenovo IdeaPad Y900 17.3", 1920x1080 | MSI GT72VR 6RD-063US LG Philips LGD046E, IPS, 17.3", 1920x1080 | Acer Predator 17 G9-793-77LG AU Optronics B173ZAN01.0 (AUO109B), IPS, 17.3", 3840x2160 | EVGA SC17 IPS, 17.3", 3840x2160 | Asus G752VS-XB78K LG Philips LP173WF4-SPF3 (LGD04E8), IPS, 17.3", 1920x1080 | Gigabyte P57W LG Philips LP173WF4-SPF1 (LGD0469), IPS, 17.3", 1920x1080 | |
|---|---|---|---|---|---|---|---|
| Display | -1% | -1% | 32% | 33% | -3% | -3% | |
| Display P3 Coverage (%) | 68 | 67.4 -1% | 67.6 -1% | 86.9 28% | 87.6 29% | 66.9 -2% | 66.5 -2% |
| sRGB Coverage (%) | 87.5 | 86.3 -1% | 86.2 -1% | 100 14% | 100 14% | 85.2 -3% | 84.4 -4% |
| AdobeRGB 1998 Coverage (%) | 64 | 63.2 -1% | 63 -2% | 99.4 55% | 99 55% | 62.3 -3% | 61.7 -4% |
| Response Times | -2% | -3% | -2% | -82% | 1% | -2% | |
| Response Time Grey 50% / Grey 80% * (ms) | 33.6 ? | 34.8 ? -4% | 34.4 ? -2% | 37 ? -10% | 69.6 ? -107% | 38 ? -13% | 37 ? -10% |
| Response Time Black / White * (ms) | 25.6 ? | 25.6 ? -0% | 26.4 ? -3% | 24 ? 6% | 40 ? -56% | 22 ? 14% | 24 ? 6% |
| PWM Frequency (Hz) | 1000 ? | ||||||
| Screen | 2% | 7% | 20% | 6% | 8% | 0% | |
| Brightness middle (cd/m²) | 329.2 | 344.9 5% | 351.7 7% | 336 2% | 394.1 20% | 328 0% | 286 -13% |
| Brightness (cd/m²) | 321 | 329 2% | 339 6% | 320 0% | 367 14% | 317 -1% | 274 -15% |
| Brightness Distribution (%) | 93 | 86 -8% | 91 -2% | 88 -5% | 83 -11% | 88 -5% | 87 -6% |
| Black Level * (cd/m²) | 0.267 | 0.349 -31% | 0.37 -39% | 0.25 6% | 0.439 -64% | 0.3 -12% | 0.31 -16% |
| Contrast (:1) | 1233 | 988 -20% | 951 -23% | 1344 9% | 898 -27% | 1093 -11% | 923 -25% |
| Colorchecker dE 2000 * | 5.93 | 4.49 24% | 3.71 37% | 3.61 39% | 5.79 2% | 3.74 37% | 4.49 24% |
| Colorchecker dE 2000 max. * | 11.07 | 8.72 21% | 8.48 23% | 6.02 46% | 8.44 24% | 8.97 19% | 7.83 29% |
| Greyscale dE 2000 * | 6.72 | 4.63 31% | 2.46 63% | 4.78 29% | 4.23 37% | 2.67 60% | 4.76 29% |
| Gamma | 2.12 104% | 2.11 104% | 2.29 96% | 2.32 95% | 2.11 104% | 2.41 91% | 2.47 89% |
| CCT | 7611 85% | 6905 94% | 6849 95% | 6185 105% | 7479 87% | 6861 95% | 6843 95% |
| Color Space (Percent of AdobeRGB 1998) (%) | 57 | 56.7 -1% | 56.6 -1% | 88 54% | 86.6 52% | 56 -2% | 55 -4% |
| Color Space (Percent of sRGB) (%) | 87 | 86.4 -1% | 86.1 -1% | 100 15% | 100 15% | 85 -2% | 84 -3% |
| Média Total (Programa/Configurações) | -0% /
1% | 1% /
4% | 17% /
19% | -14% /
-0% | 2% /
5% | -2% /
-1% |
* ... menor é melhor
Exibir tempos de resposta
| ↔ Tempo de resposta preto para branco | ||
|---|---|---|
| 25.6 ms ... ascensão ↗ e queda ↘ combinadas | ↗ 5.2 ms ascensão | 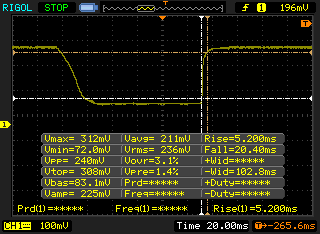 |
| ↘ 20.4 ms queda | ||
| A tela mostra taxas de resposta relativamente lentas em nossos testes e pode ser muito lenta para os jogadores. Em comparação, todos os dispositivos testados variam de 0.1 (mínimo) a 240 (máximo) ms. » 61 % de todos os dispositivos são melhores. Isso significa que o tempo de resposta medido é pior que a média de todos os dispositivos testados (19.8 ms). | ||
| ↔ Tempo de resposta 50% cinza a 80% cinza | ||
| 33.6 ms ... ascensão ↗ e queda ↘ combinadas | ↗ 14 ms ascensão | 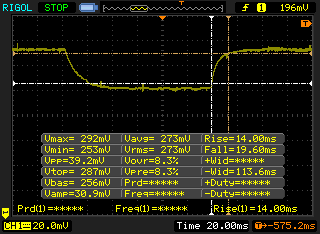 |
| ↘ 19.6 ms queda | ||
| A tela mostra taxas de resposta lentas em nossos testes e será insatisfatória para os jogadores. Em comparação, todos os dispositivos testados variam de 0.165 (mínimo) a 636 (máximo) ms. » 46 % de todos os dispositivos são melhores. Isso significa que o tempo de resposta medido é semelhante à média de todos os dispositivos testados (31 ms). | ||
Cintilação da tela / PWM (modulação por largura de pulso)
| Tela tremeluzindo / PWM não detectado | 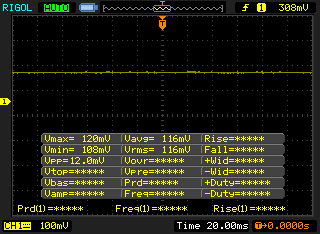 | ||
[pwm_comparison] Em comparação: 52 % de todos os dispositivos testados não usam PWM para escurecer a tela. Se PWM foi detectado, uma média de 7754 (mínimo: 5 - máximo: 343500) Hz foi medida. | |||
| Cinebench R11.5 | |
| CPU Single 64Bit | |
| Asus G752VS-XB78K | |
| EVGA SC17 | |
| Lenovo IdeaPad Y900 | |
| Gigabyte P57W | |
| MSI GT72VR 6RD-063US | |
| Gigabyte P57X v6 | |
| CPU Multi 64Bit | |
| Asus G752VS-XB78K | |
| Lenovo IdeaPad Y900 | |
| EVGA SC17 | |
| Gigabyte P57W | |
| Gigabyte P57X v6 | |
| MSI GT72VR 6RD-063US | |
| wPrime 2.10 - 1024m | |
| Gigabyte P57X v6 | |
| MSI GT72VR 6RD-063US | |
| Lenovo IdeaPad Y900 | |
| EVGA SC17 | |
| Super Pi Mod 1.5 XS 32M - 32M | |
| MSI GT72VR 6RD-063US | |
| EVGA SC17 | |
| Lenovo IdeaPad Y900 | |
| Gigabyte P57X v6 | |
* ... menor é melhor
| PCMark 8 | |
| Home Score Accelerated v2 | |
| Asus G752VS-XB78K | |
| Lenovo IdeaPad Y900 | |
| MSI GT72VR 6RD-063US | |
| Gigabyte P57X v6 | |
| Acer Predator 17 G9-793-77LG | |
| Gigabyte P57W | |
| EVGA SC17 | |
| Work Score Accelerated v2 | |
| Asus G752VS-XB78K | |
| Lenovo IdeaPad Y900 | |
| Gigabyte P57X v6 | |
| Gigabyte P57W | |
| MSI GT72VR 6RD-063US | |
| EVGA SC17 | |
| Creative Score Accelerated v2 | |
| Asus G752VS-XB78K | |
| MSI GT72VR 6RD-063US | |
| Lenovo IdeaPad Y900 | |
| Gigabyte P57X v6 | |
| Gigabyte P57W | |
| EVGA SC17 | |
| Acer Predator 17 G9-793-77LG | |
| PCMark 8 Home Score Accelerated v2 | 4206 pontos | |
| PCMark 8 Creative Score Accelerated v2 | 5192 pontos | |
| PCMark 8 Work Score Accelerated v2 | 5014 pontos | |
Ajuda | ||
| Gigabyte P57X v6 Transcend MTS800 256GB M.2 (TS256GMTS800) | Lenovo IdeaPad Y900 Samsung SM951 MZVPV256 m.2 | EVGA SC17 Samsung SSD 950 Pro 512GB m.2 NVMe | Asus G752VS-XB78K Toshiba NVMe THNSN5512GPU7 | Gigabyte P57W Lite-On IT L8T-256L9G | |
|---|---|---|---|---|---|
| CrystalDiskMark 3.0 | 159% | 220% | 210% | 6% | |
| Read Seq (MB/s) | 481.7 | 1559 224% | 2247 366% | 1718 257% | 491.6 2% |
| Write Seq (MB/s) | 315.4 | 1254 298% | 1534 386% | 1305 314% | 391.1 24% |
| Read 512 (MB/s) | 303.1 | 850 180% | 1113 267% | 1250 312% | 352.8 16% |
| Write 512 (MB/s) | 314.4 | 1228 291% | 1490 374% | 1438 357% | 371.7 18% |
| Read 4k (MB/s) | 25.93 | 49.32 90% | 52.1 101% | 44.42 71% | 29.89 15% |
| Write 4k (MB/s) | 84.6 | 140.3 66% | 149.2 76% | 154.4 83% | 37.75 -55% |
| Read 4k QD32 (MB/s) | 273.9 | 539 97% | 635 132% | 744 172% | 338.7 24% |
| Write 4k QD32 (MB/s) | 274.9 | 345.3 26% | 422 54% | 578 110% | 278 1% |

| 3DMark | |
| Fire Strike Extreme Graphics | |
| Gigabyte P57X v6 | |
| Asus G752VS-XB78K | |
| MSI GT72VR 6RD-063US | |
| EVGA SC17 | |
| Lenovo IdeaPad Y900 | |
| 1920x1080 Fire Strike Graphics | |
| Asus G752VS-XB78K | |
| Acer Predator 17 G9-793-77LG | |
| MSI GT72VR 6RD-063US | |
| Lenovo IdeaPad Y900 | |
| EVGA SC17 | |
| Gigabyte P57W | |
| 3DMark 11 | |
| 1280x720 Performance GPU | |
| Gigabyte P57X v6 | |
| Asus G752VS-XB78K | |
| Acer Predator 17 G9-793-77LG | |
| Lenovo IdeaPad Y900 | |
| EVGA SC17 | |
| MSI GT72VR 6RD-063US | |
| Gigabyte P57W | |
| 1280x720 Performance Combined | |
| Asus G752VS-XB78K | |
| Lenovo IdeaPad Y900 | |
| EVGA SC17 | |
| Gigabyte P57X v6 | |
| MSI GT72VR 6RD-063US | |
| Gigabyte P57W | |
| Acer Predator 17 G9-793-77LG | |
| 3DMark 06 Standard Score | 25589 pontos | |
| 3DMark 11 Performance | 16231 pontos | |
| 3DMark Ice Storm Standard Score | 85198 pontos | |
| 3DMark Cloud Gate Standard Score | 23781 pontos | |
| 3DMark Fire Strike Extreme Score | 7559 pontos | |
Ajuda | ||
| BioShock Infinite - 1920x1080 Ultra Preset, DX11 (DDOF) (classificar por valor) | |
| Gigabyte P57X v6 | |
| Lenovo IdeaPad Y900 | |
| MSI GT72VR 6RD-063US | |
| EVGA SC17 | |
| Asus G752VS-XB78K | |
| Metro: Last Light - 1920x1080 Very High (DX11) AF:16x (classificar por valor) | |
| Gigabyte P57X v6 | |
| Lenovo IdeaPad Y900 | |
| MSI GT72VR 6RD-063US | |
| EVGA SC17 | |
| Thief - 1920x1080 Very High Preset AA:FXAA & High SS AF:8x (classificar por valor) | |
| Gigabyte P57X v6 | |
| Lenovo IdeaPad Y900 | |
| MSI GT72VR 6RD-063US | |
| EVGA SC17 | |
| Asus G752VS-XB78K | |
| Batman: Arkham Knight - 1920x1080 High / On AA:SM AF:16x (classificar por valor) | |
| Gigabyte P57X v6 | |
| Lenovo IdeaPad Y900 | |
| MSI GT72VR 6RD-063US | |
| EVGA SC17 | |
| Asus G752VS-XB78K | |
| Fallout 4 - 1920x1080 Ultra Preset AA:T AF:16x (classificar por valor) | |
| Gigabyte P57X v6 | |
| Lenovo IdeaPad Y900 | |
| MSI GT72VR 6RD-063US | |
| EVGA SC17 | |
| Rise of the Tomb Raider - 1920x1080 Very High Preset AA:FX AF:16x (classificar por valor) | |
| Gigabyte P57X v6 | |
| Lenovo IdeaPad Y900 | |
| MSI GT72VR 6RD-063US | |
| Acer Predator 17 G9-793-77LG | |
| EVGA SC17 | |
| Asus G752VS-XB78K | |
| Gigabyte P57W | |
| Doom - 1920x1080 Ultra Preset AA:SM (classificar por valor) | |
| Gigabyte P57X v6 | |
| Lenovo IdeaPad Y900 | |
| MSI GT72VR 6RD-063US | |
| baixo | média | alto | ultra | |
|---|---|---|---|---|
| BioShock Infinite (2013) | 123.8 | |||
| Metro: Last Light (2013) | 99 | |||
| Thief (2014) | 88.5 | |||
| Batman: Arkham Knight (2015) | 78 | |||
| Fallout 4 (2015) | 96 | |||
| Rise of the Tomb Raider (2016) | 90 | |||
| Doom (2016) | 104 |
Barulho
| Ocioso |
| 33.2 / 33.2 / 33.2 dB |
| Carga |
| 47.5 / 52.5 dB |
 | ||
30 dB silencioso 40 dB(A) audível 50 dB(A) ruidosamente alto |
||
min: | ||
| Gigabyte P57X v6 GeForce GTX 1070 Mobile, 6700HQ, Transcend MTS800 256GB M.2 (TS256GMTS800) | Lenovo IdeaPad Y900 GeForce GTX 980M, 6820HK, Samsung SM951 MZVPV256 m.2 | Acer Predator 17 G9-793-77LG GeForce GTX 1070 Mobile, 6700HQ, Toshiba NVMe THNSN5256GPU7 | Asus G752VS-XB78K GeForce GTX 1070 Mobile, 6820HK, Toshiba NVMe THNSN5512GPU7 | Gigabyte P57W GeForce GTX 970M, 6700HQ, Lite-On IT L8T-256L9G | |
|---|---|---|---|---|---|
| Noise | -2% | -2% | 6% | 4% | |
| desligado / ambiente * (dB) | 29.7 | 28.8 3% | 31 -4% | 30 -1% | 30 -1% |
| Idle Minimum * (dB) | 33.2 | 29.4 11% | 33 1% | 31 7% | 32 4% |
| Idle Average * (dB) | 33.2 | 32.4 2% | 34 -2% | 32 4% | 33 1% |
| Idle Maximum * (dB) | 33.2 | 48 -45% | 40 -20% | 33 1% | 37 -11% |
| Load Average * (dB) | 47.5 | 42.5 11% | 44 7% | 40 16% | 37 22% |
| Load Maximum * (dB) | 52.5 | 48.5 8% | 50 5% | 47 10% | 47 10% |
* ... menor é melhor
(-) A temperatura máxima no lado superior é 59 °C / 138 F, em comparação com a média de 40.4 °C / 105 F , variando de 21.2 a 68.8 °C para a classe Gaming.
(-) A parte inferior aquece até um máximo de 66 °C / 151 F, em comparação com a média de 43.2 °C / 110 F
(+) Em uso inativo, a temperatura média para o lado superior é 28 °C / 82 F, em comparação com a média do dispositivo de 33.9 °C / ### class_avg_f### F.
(+) Os apoios para as mãos e o touchpad são mais frios que a temperatura da pele, com um máximo de 27.2 °C / 81 F e, portanto, são frios ao toque.
(±) A temperatura média da área do apoio para as mãos de dispositivos semelhantes foi 28.8 °C / 83.8 F (+1.6 °C / 2.8 F).
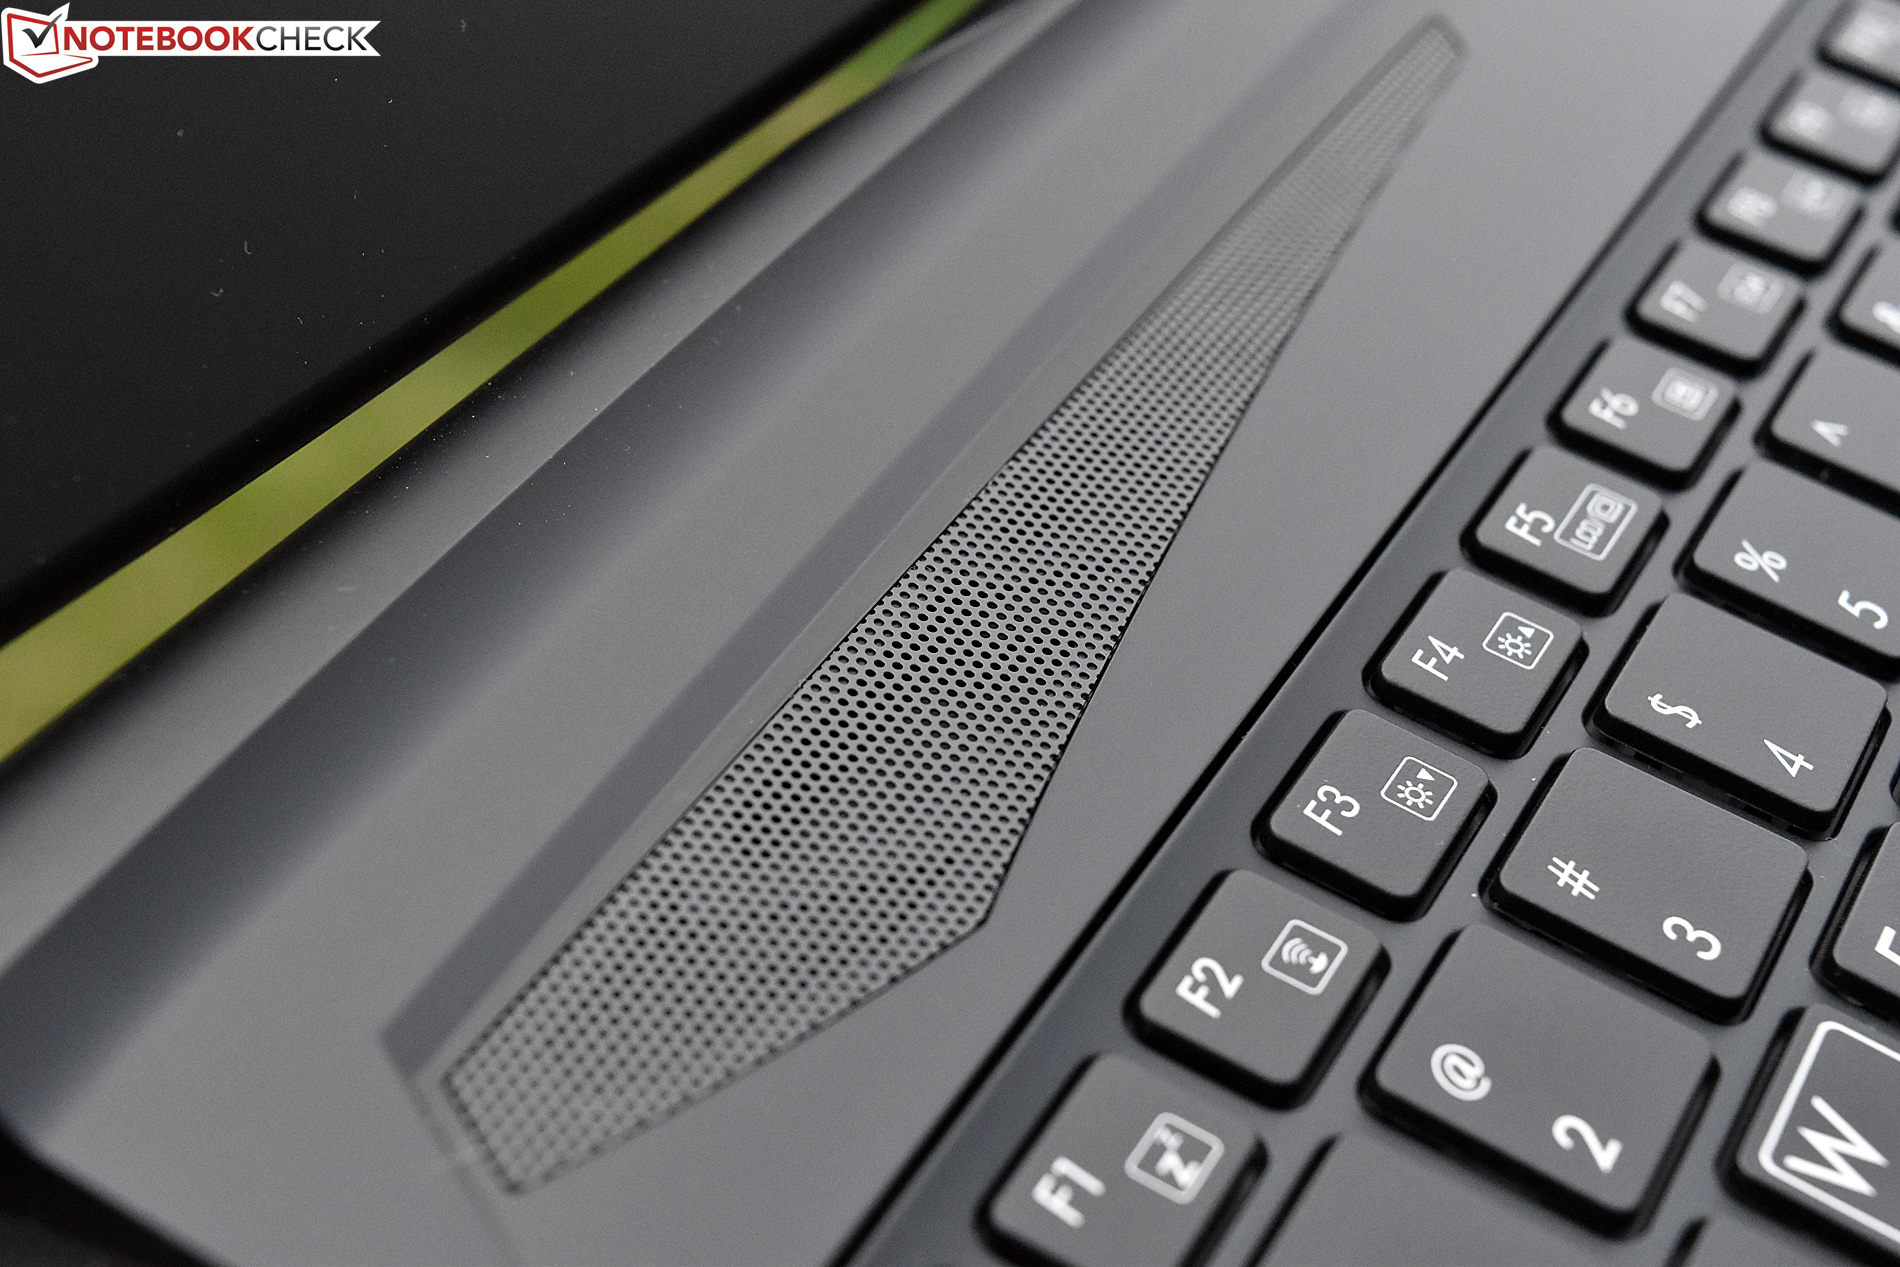
Gigabyte P57X v6 análise de áudio
(±) | o volume do alto-falante é médio, mas bom (###valor### dB)
Graves 100 - 315Hz
(-) | quase nenhum baixo - em média 15.5% menor que a mediana
(±) | a linearidade dos graves é média (9.2% delta para a frequência anterior)
Médios 400 - 2.000 Hz
(+) | médios equilibrados - apenas 1.9% longe da mediana
(+) | médios são lineares (5.2% delta para frequência anterior)
Altos 2 - 16 kHz
(±) | máximos mais altos - em média 7.1% maior que a mediana
(±) | a linearidade dos máximos é média (8.9% delta para frequência anterior)
Geral 100 - 16.000 Hz
(±) | a linearidade do som geral é média (27.4% diferença em relação à mediana)
Comparado com a mesma classe
» 93% de todos os dispositivos testados nesta classe foram melhores, 1% semelhantes, 5% piores
» O melhor teve um delta de 6%, a média foi 18%, o pior foi 132%
Comparado com todos os dispositivos testados
» 83% de todos os dispositivos testados foram melhores, 4% semelhantes, 13% piores
» O melhor teve um delta de 4%, a média foi 23%, o pior foi 134%
Apple MacBook 12 (Early 2016) 1.1 GHz análise de áudio
(+) | os alto-falantes podem tocar relativamente alto (###valor### dB)
Graves 100 - 315Hz
(±) | graves reduzidos - em média 11.3% menor que a mediana
(±) | a linearidade dos graves é média (14.2% delta para a frequência anterior)
Médios 400 - 2.000 Hz
(+) | médios equilibrados - apenas 2.4% longe da mediana
(+) | médios são lineares (5.5% delta para frequência anterior)
Altos 2 - 16 kHz
(+) | agudos equilibrados - apenas 2% longe da mediana
(+) | os máximos são lineares (4.5% delta da frequência anterior)
Geral 100 - 16.000 Hz
(+) | o som geral é linear (10.2% diferença em relação à mediana)
Comparado com a mesma classe
» 7% de todos os dispositivos testados nesta classe foram melhores, 2% semelhantes, 90% piores
» O melhor teve um delta de 5%, a média foi 18%, o pior foi 53%
Comparado com todos os dispositivos testados
» 5% de todos os dispositivos testados foram melhores, 1% semelhantes, 94% piores
» O melhor teve um delta de 4%, a média foi 23%, o pior foi 134%
| desligado | |
| Ocioso | |
| Carga |
|
Key:
min: | |
| Gigabyte P57X v6 6700HQ, GeForce GTX 1070 Mobile, Transcend MTS800 256GB M.2 (TS256GMTS800), IPS, 1920x1080, 17.3" | Lenovo IdeaPad Y900 6820HK, GeForce GTX 980M, Samsung SM951 MZVPV256 m.2, , 1920x1080, 17.3" | Acer Predator 17 G9-793-77LG 6700HQ, GeForce GTX 1070 Mobile, Toshiba NVMe THNSN5256GPU7, IPS, 3840x2160, 17.3" | Asus G752VS-XB78K 6820HK, GeForce GTX 1070 Mobile, Toshiba NVMe THNSN5512GPU7, IPS, 1920x1080, 17.3" | Gigabyte P57W 6700HQ, GeForce GTX 970M, Lite-On IT L8T-256L9G, IPS, 1920x1080, 17.3" | |
|---|---|---|---|---|---|
| Power Consumption | -5% | -28% | -12% | 29% | |
| Idle Minimum * (Watt) | 18.4 | 24.3 -32% | 25 -36% | 24 -30% | 11 40% |
| Idle Average * (Watt) | 22.8 | 29.6 -30% | 35 -54% | 31 -36% | 17 25% |
| Idle Maximum * (Watt) | 24 | 29.9 -25% | 46 -92% | 36 -50% | 22 8% |
| Load Average * (Watt) | 175.5 | 110.1 37% | 103 41% | 94 46% | 85 52% |
| Load Maximum * (Watt) | 229.5 | 171.4 25% | 223 3% | 204 11% | 178 22% |
* ... menor é melhor
| Gigabyte P57X v6 6700HQ, GeForce GTX 1070 Mobile, 75.81 Wh | Lenovo IdeaPad Y900 6820HK, GeForce GTX 980M, 90 Wh | MSI GT72VR 6RD-063US 6700HQ, GeForce GTX 1060 Mobile, 83 Wh | Acer Predator 17 G9-793-77LG 6700HQ, GeForce GTX 1070 Mobile, 88 Wh | EVGA SC17 6820HK, GeForce GTX 980M, 74.48 Wh | Asus G752VS-XB78K 6820HK, GeForce GTX 1070 Mobile, 90 Wh | Gigabyte P57W 6700HQ, GeForce GTX 970M, 75.81 Wh | |
|---|---|---|---|---|---|---|---|
| Duração da bateria | 13% | -7% | -16% | -17% | -14% | 25% | |
| Reader / Idle (h) | 7 | 5.8 -17% | 5.4 -23% | 4.6 -34% | 5.2 -26% | 5.2 -26% | 7.7 10% |
| WiFi v1.3 (h) | 3.4 | 4.1 21% | 3.7 9% | 3.3 -3% | 3.4 0% | 3.5 3% | 5.6 65% |
| Load (h) | 1.7 | 2.3 35% | 1.6 -6% | 1.5 -12% | 1.3 -24% | 1.4 -18% | 1.7 0% |
Pro
Contra
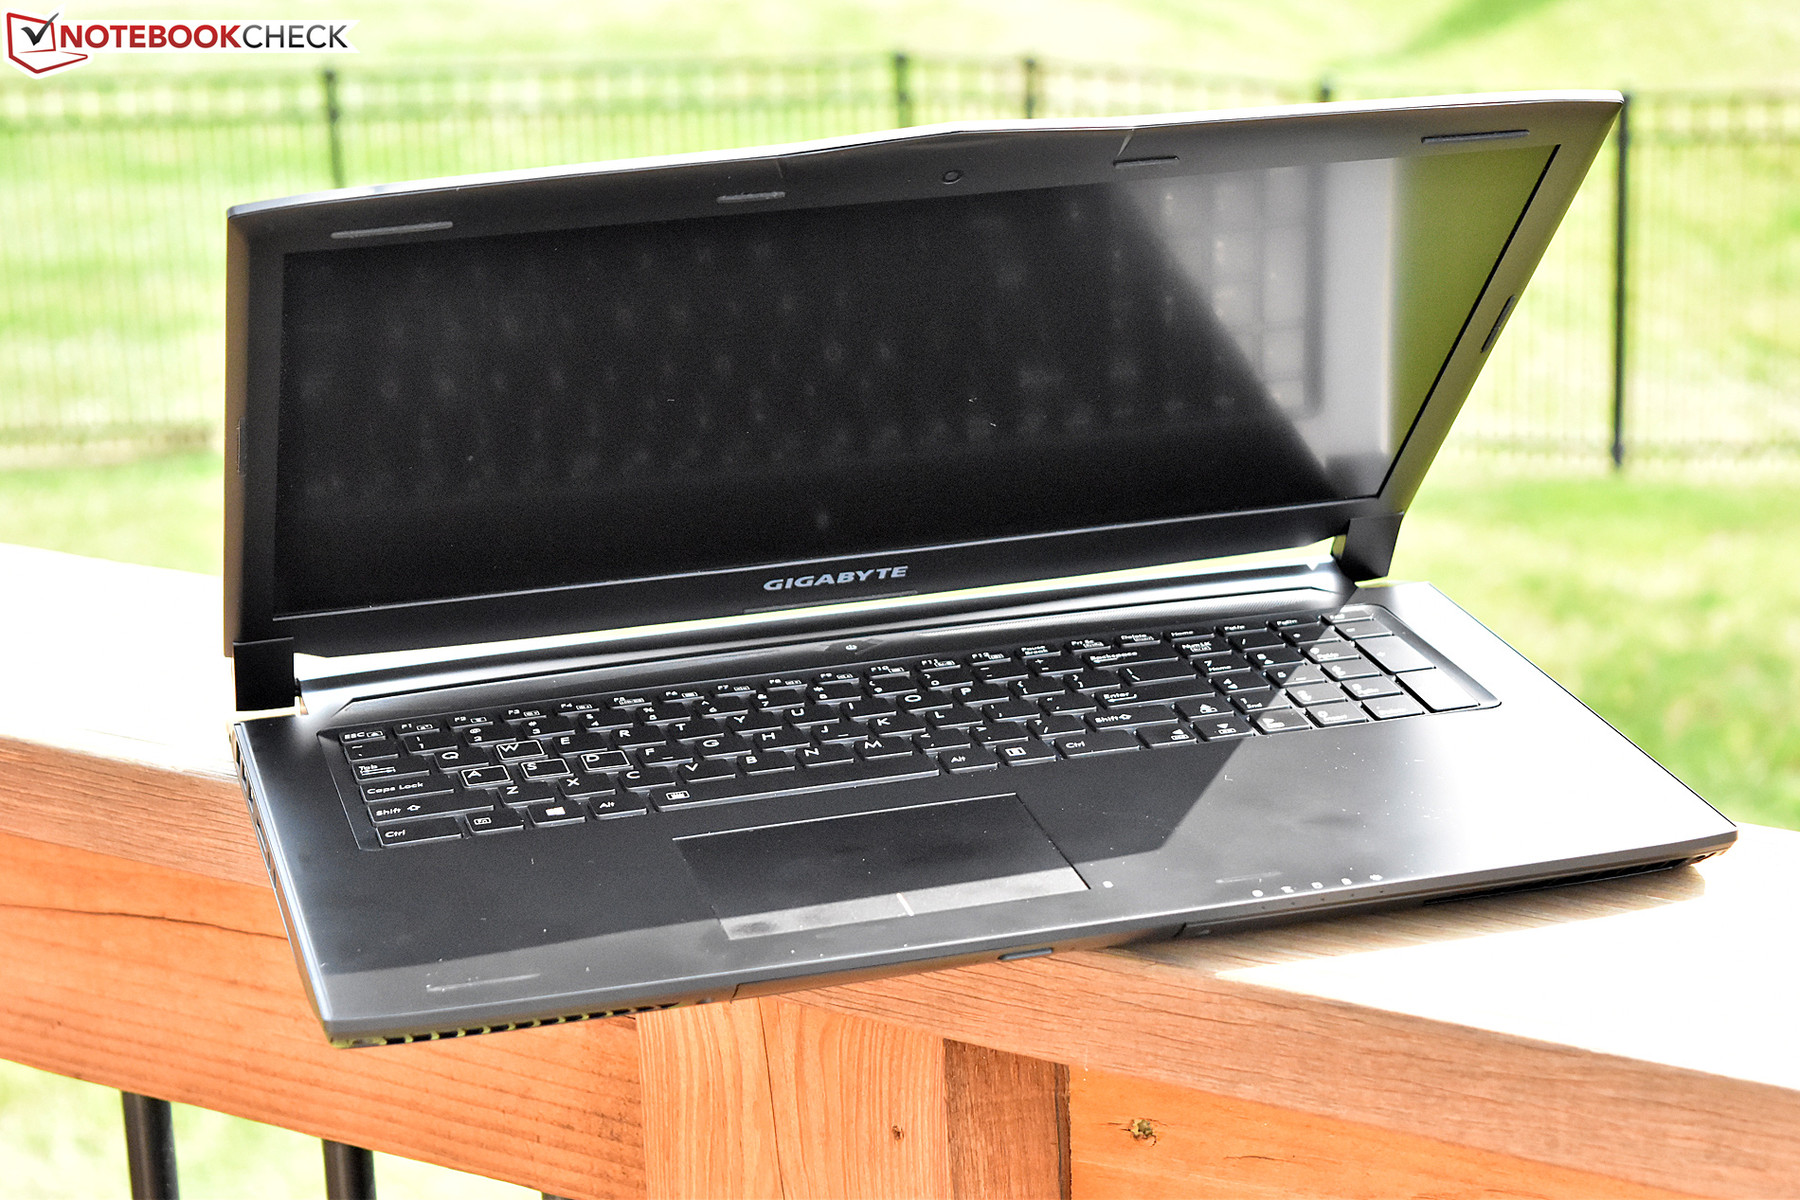
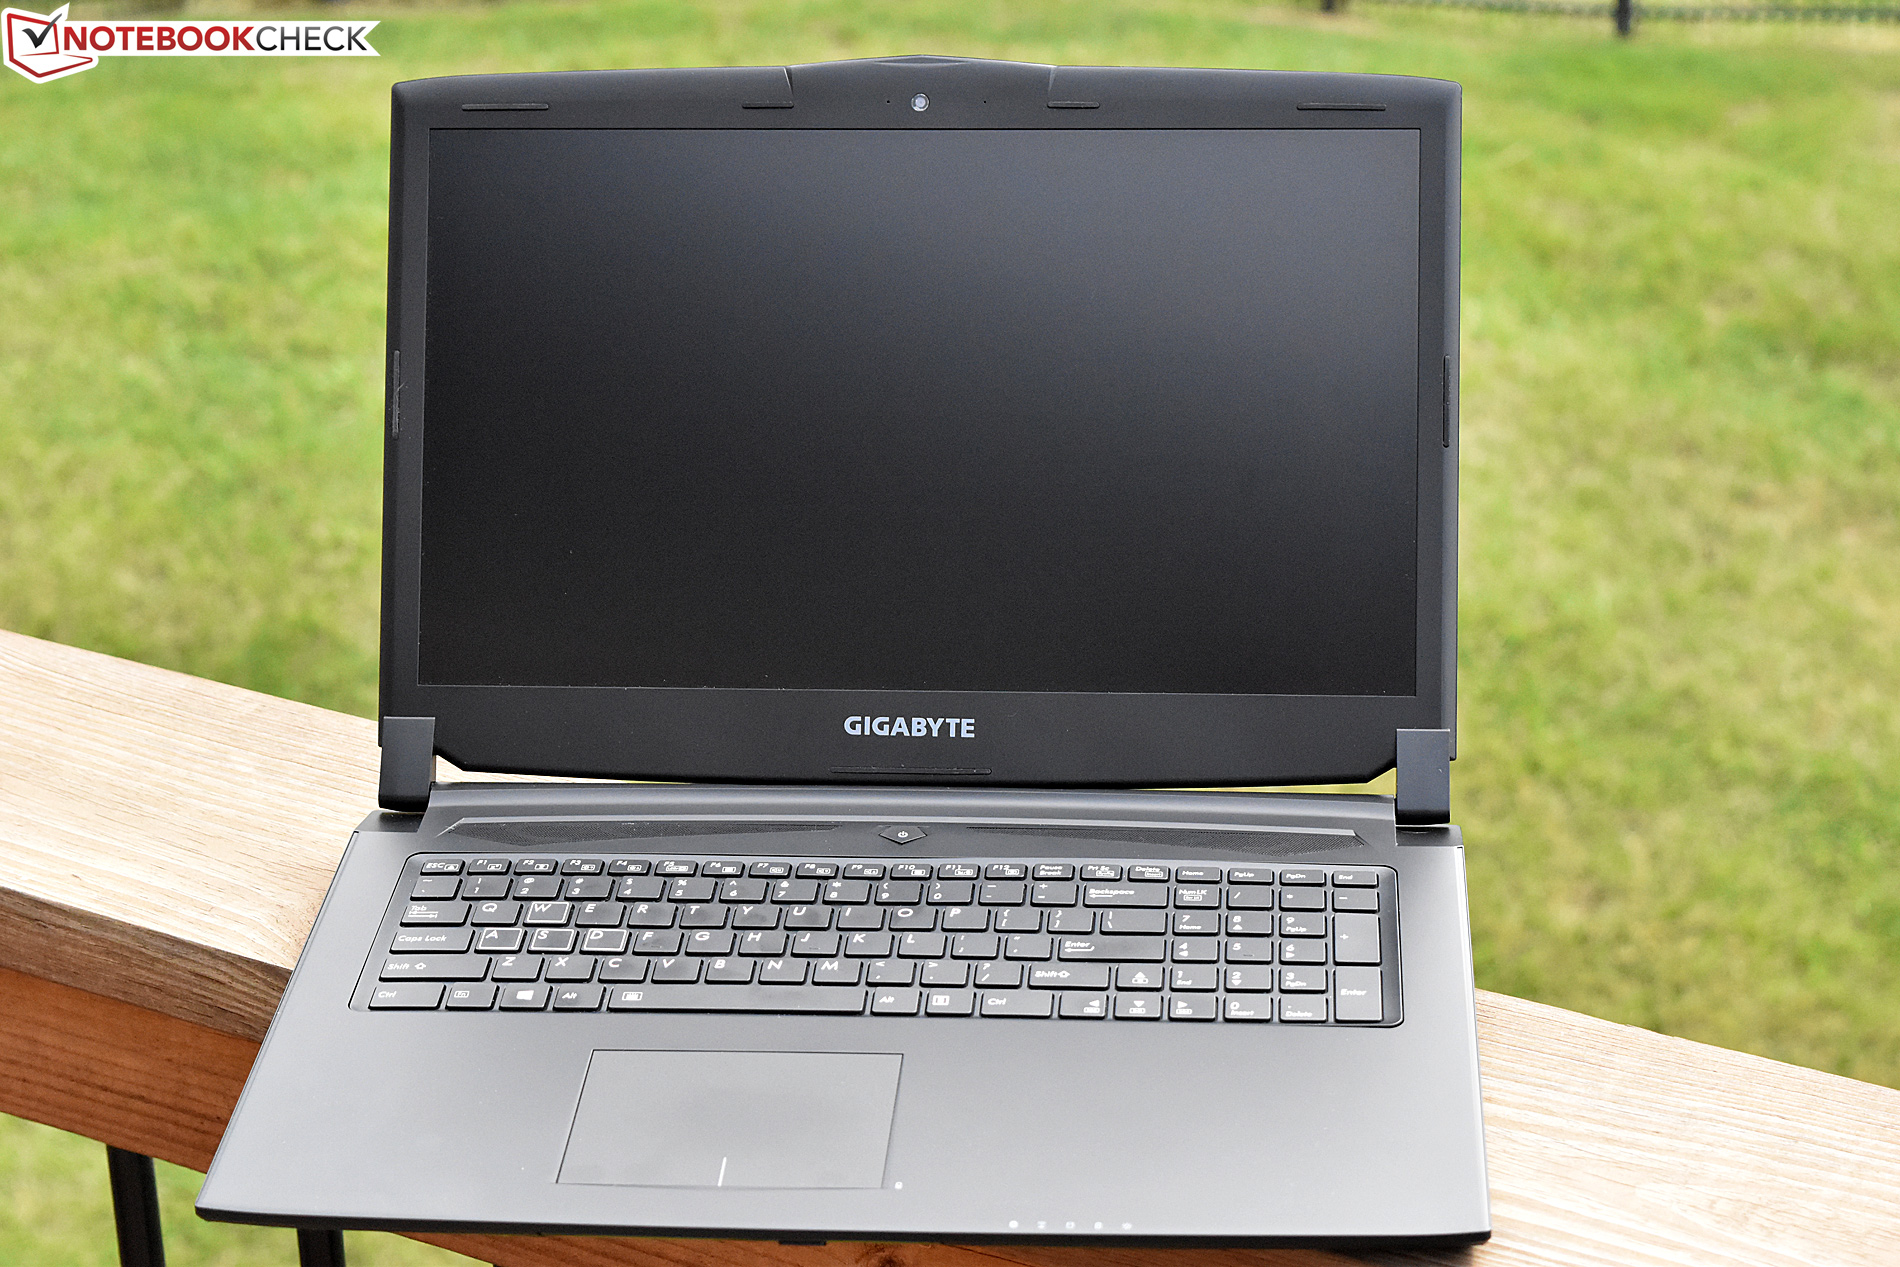
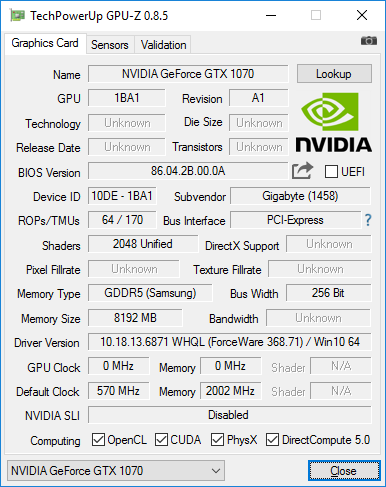
Embora seja quase igual ao seu predecessor P57W, o Gigabyte P57X v6 sai como um foguete para o topo das listas de jogos com a ajuda da excelente GPU NVIDIA GeForce GTX 1070. Por relativamente acessíveis $1.999, temos um dos portáteis de jogos mais veloz do planeta (pelo menos quando se trata de exigência nos jogos), capaz de lidar com jogos modernos a 1080p com as configurações mais altas com taxas de fotogramas fluentes, e via sua conectividade HDMI 2.0, capaz de impulsionar jogos em 4K em um monitor externo compatível, zm muita dificuldade.
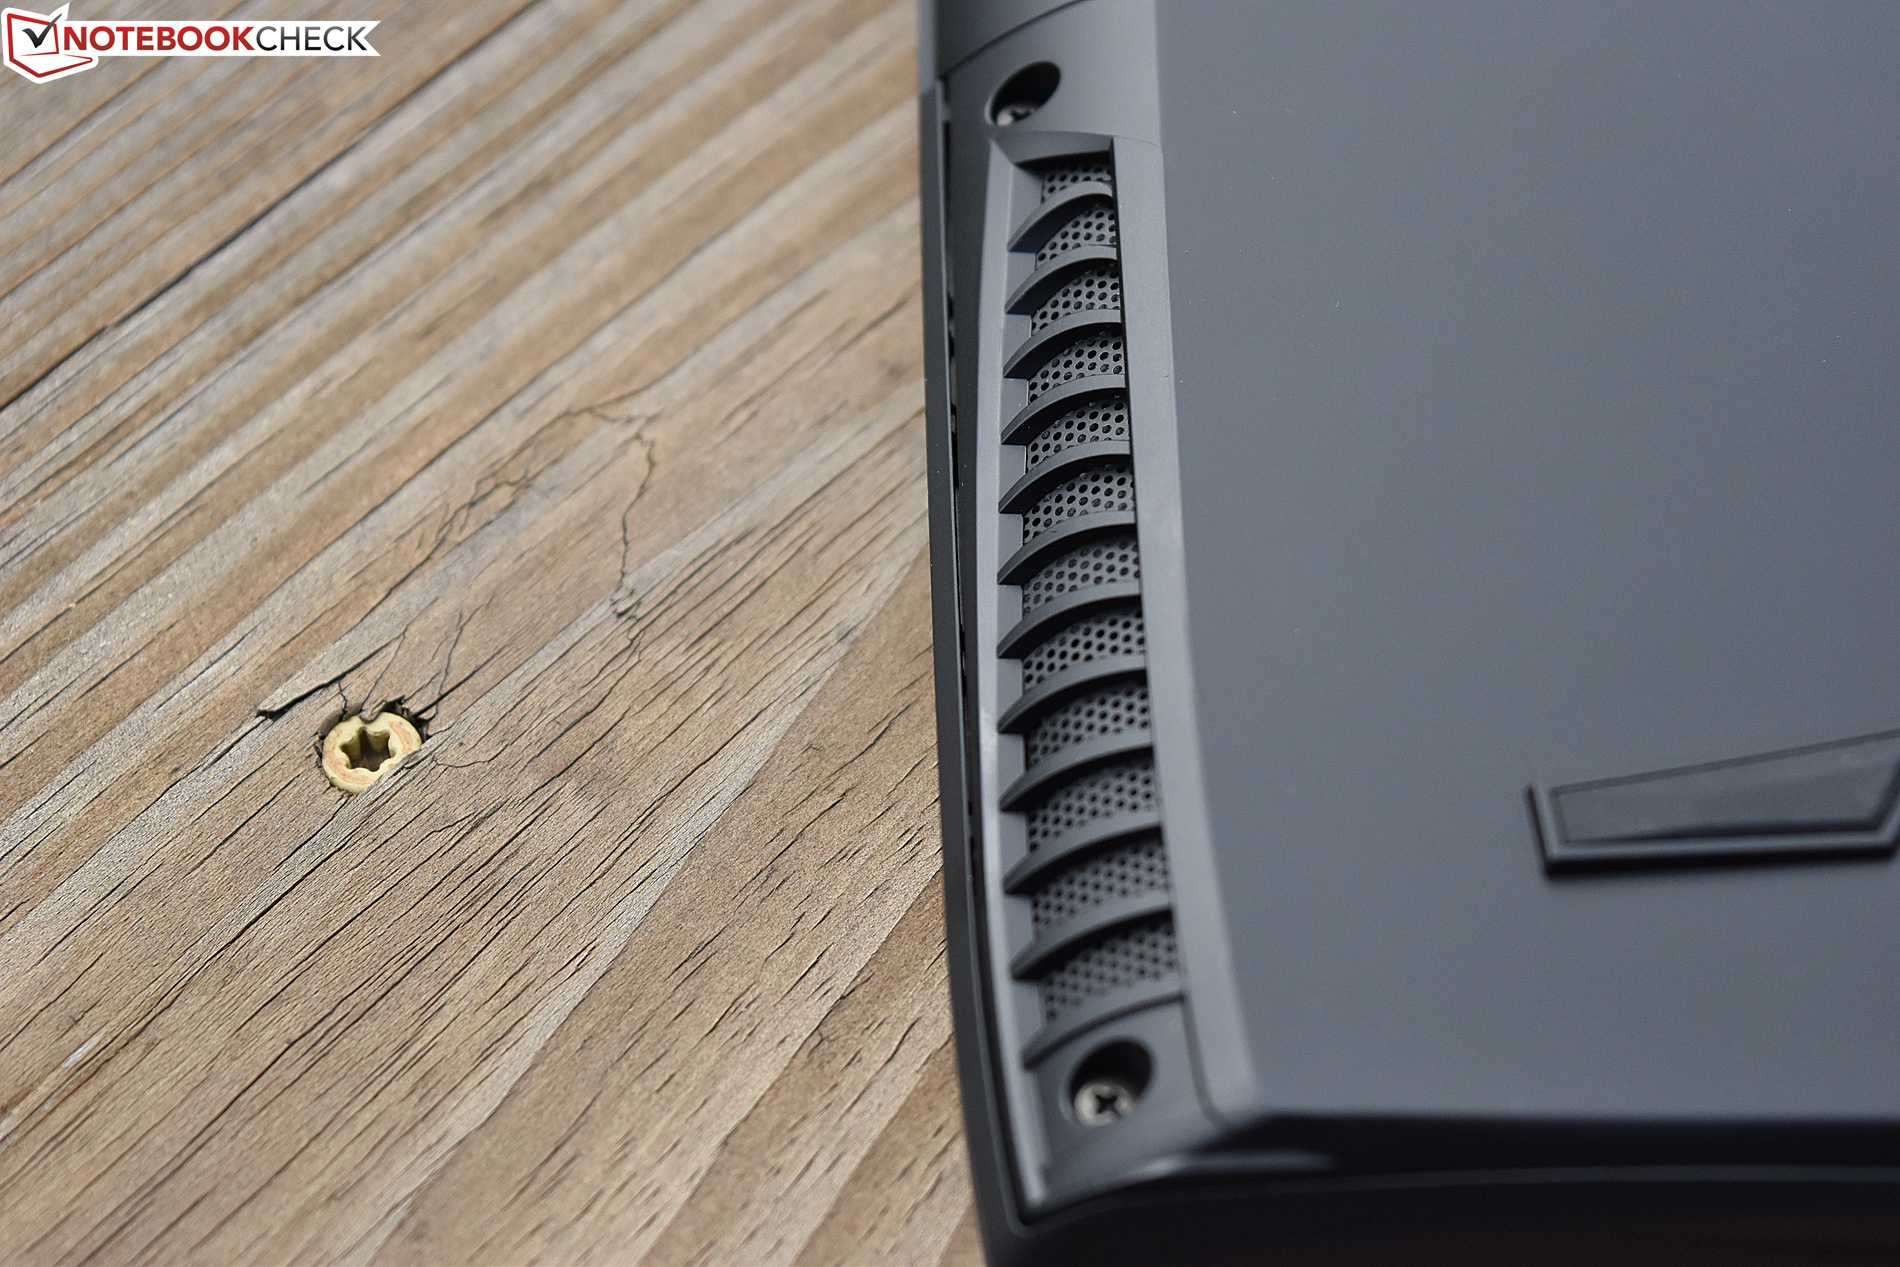
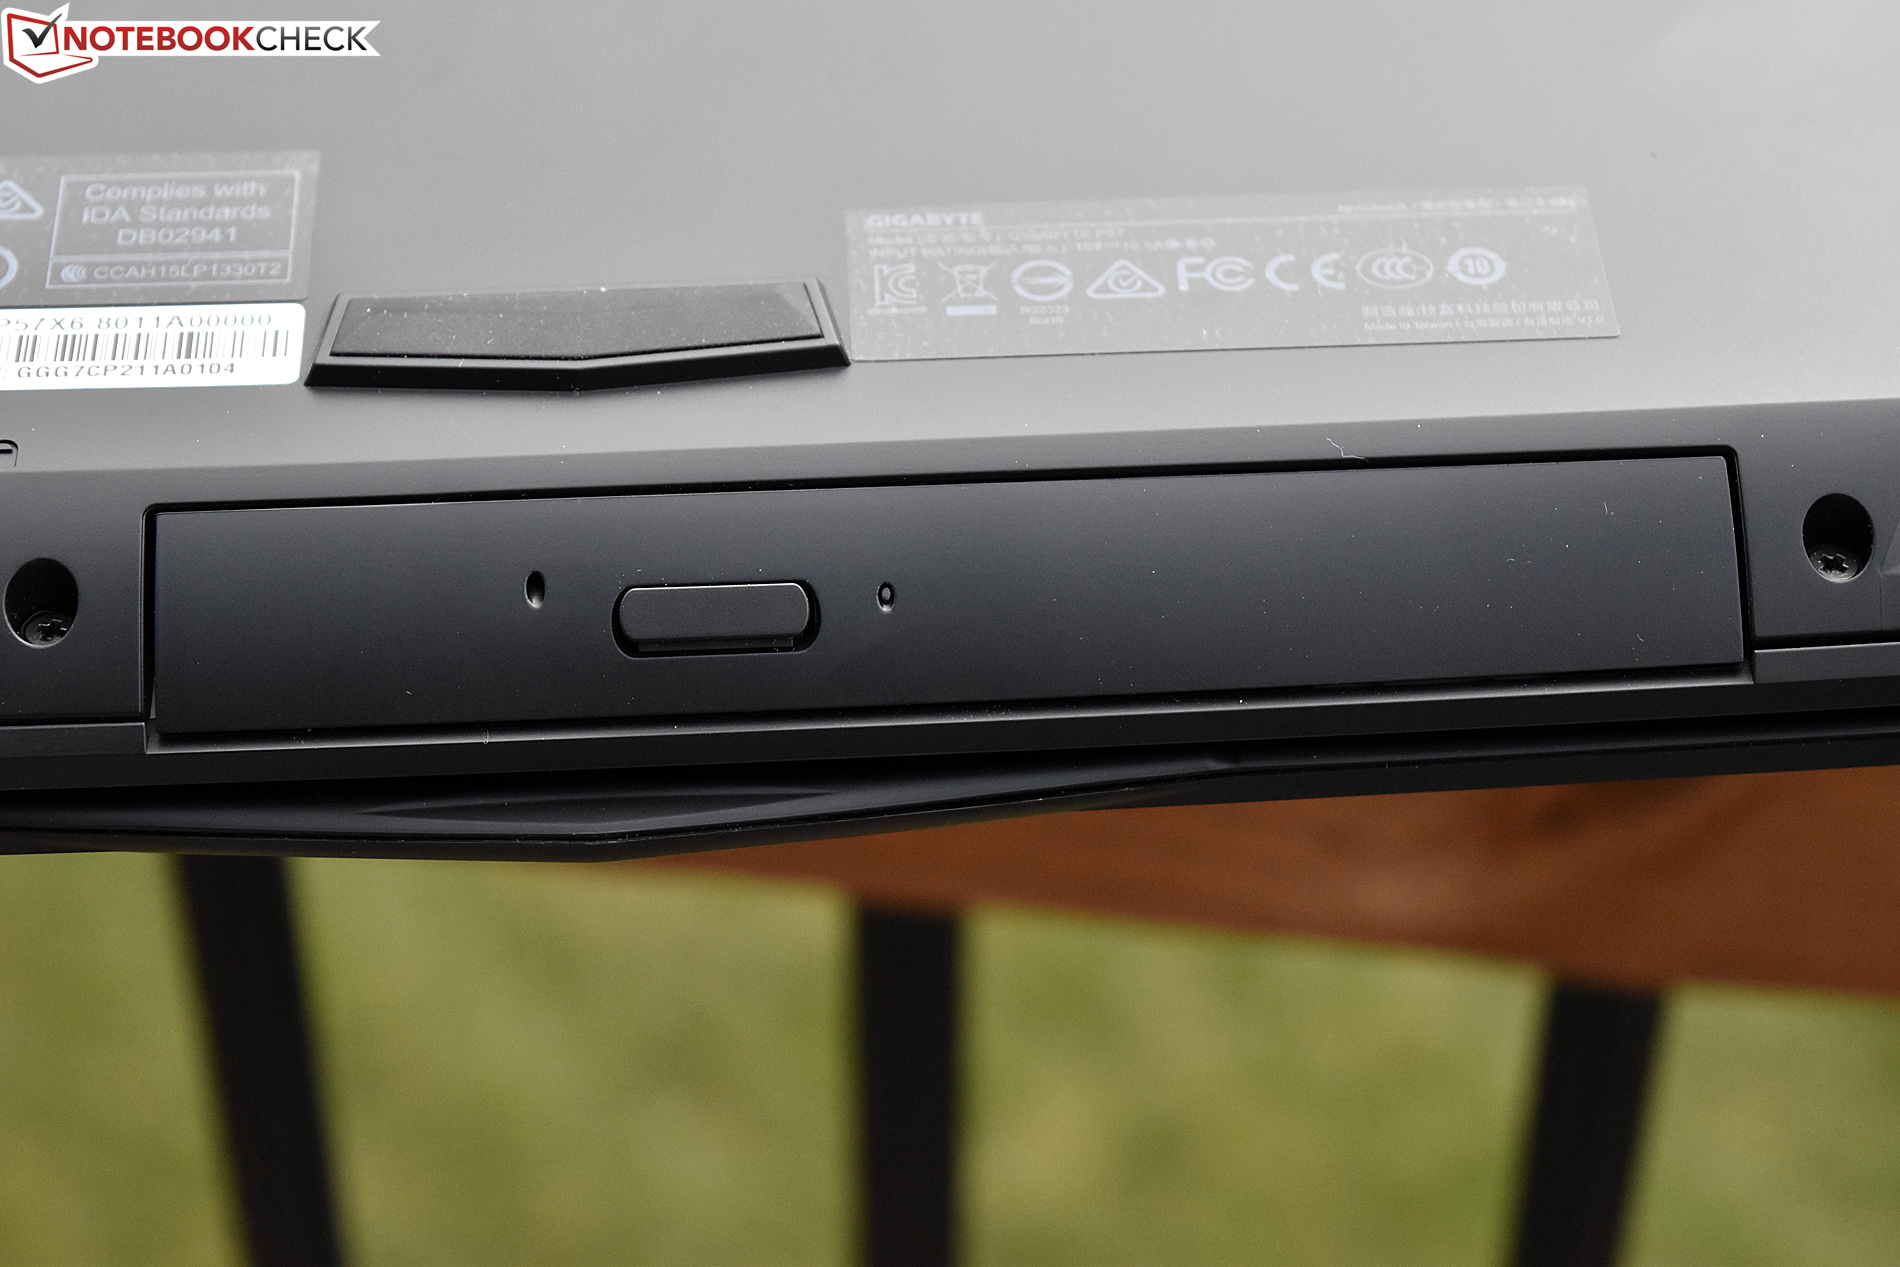
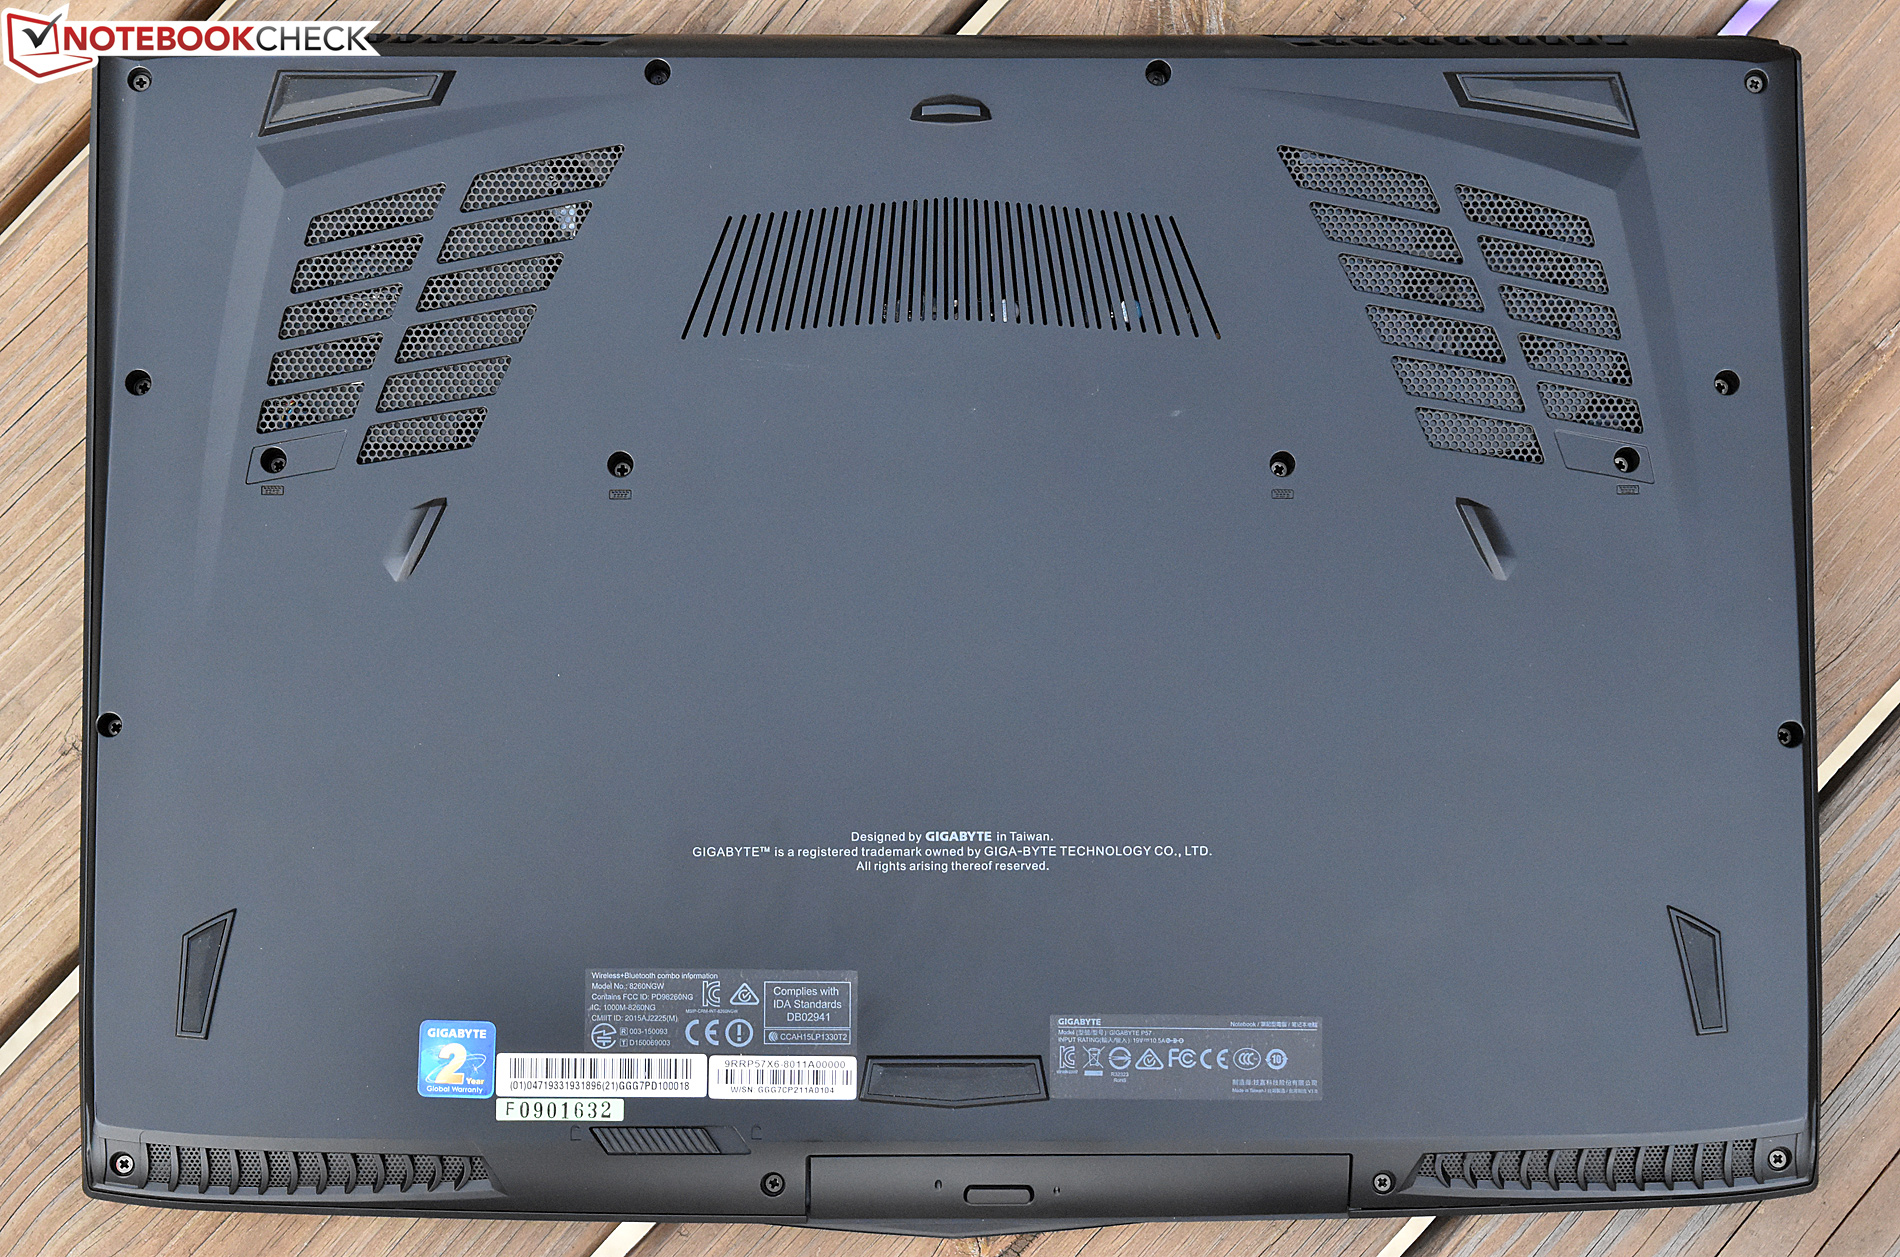
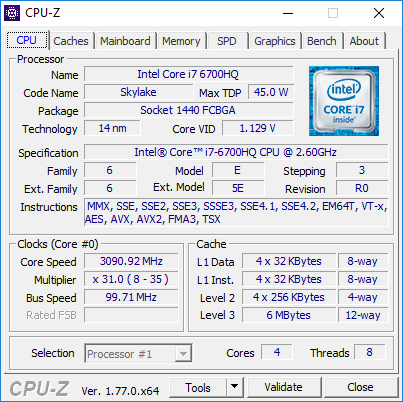
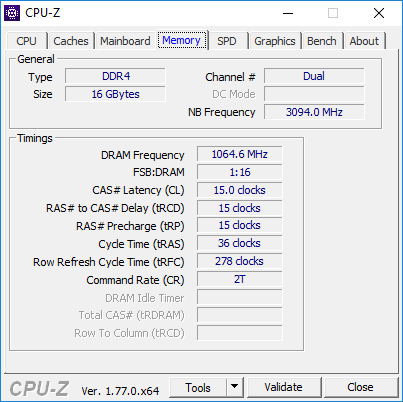
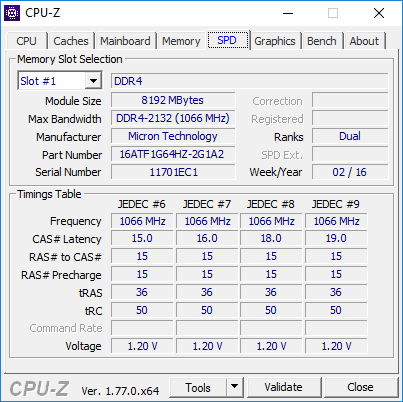
Além de tudo isso, ainda temos a mesma configuração poderosa rodeando a a nova GPU, incluindo uma CPU Intel Core i7-6700HQquad-core , 16 GB de RAM DDR4-2133, uma configuração de dois armazenamentos com um SSD M.2 de 256 GB e uma unidade de armazenamento de 1 TB a 7200 RPM, e finalmente, uma tela IPS 1080p anti-refletiva. A Gigabyte também tornou as manutenções e atualizações mais fáceis, com quase todos os componentes substituíveis desde o lado inferior. Os usuários que precisem de ainda mais velocidade podem optar por um SSD NVMe para substituir o M.2 convencional com o qual a máquina é entregue, e eles inclusive podem adicionar uma terceira unidade de armazenamento com o adaptador de HD incluso, que pode ser trocado para a baia de expansão montada na frente, de forma rápida e fácil, substituindo a unidade pré-instalada DVD-RAM.
O P57X também faz um ótimo trabalho ao incluir útil software para facilitar o controle sobre o sistema de resfriamento da máquina e do overclock da GPU, junto com o prático software de atualização e alguns outros bônus (controles da temperatura da LCD, criação de recuperação de mídia USB, etc.).
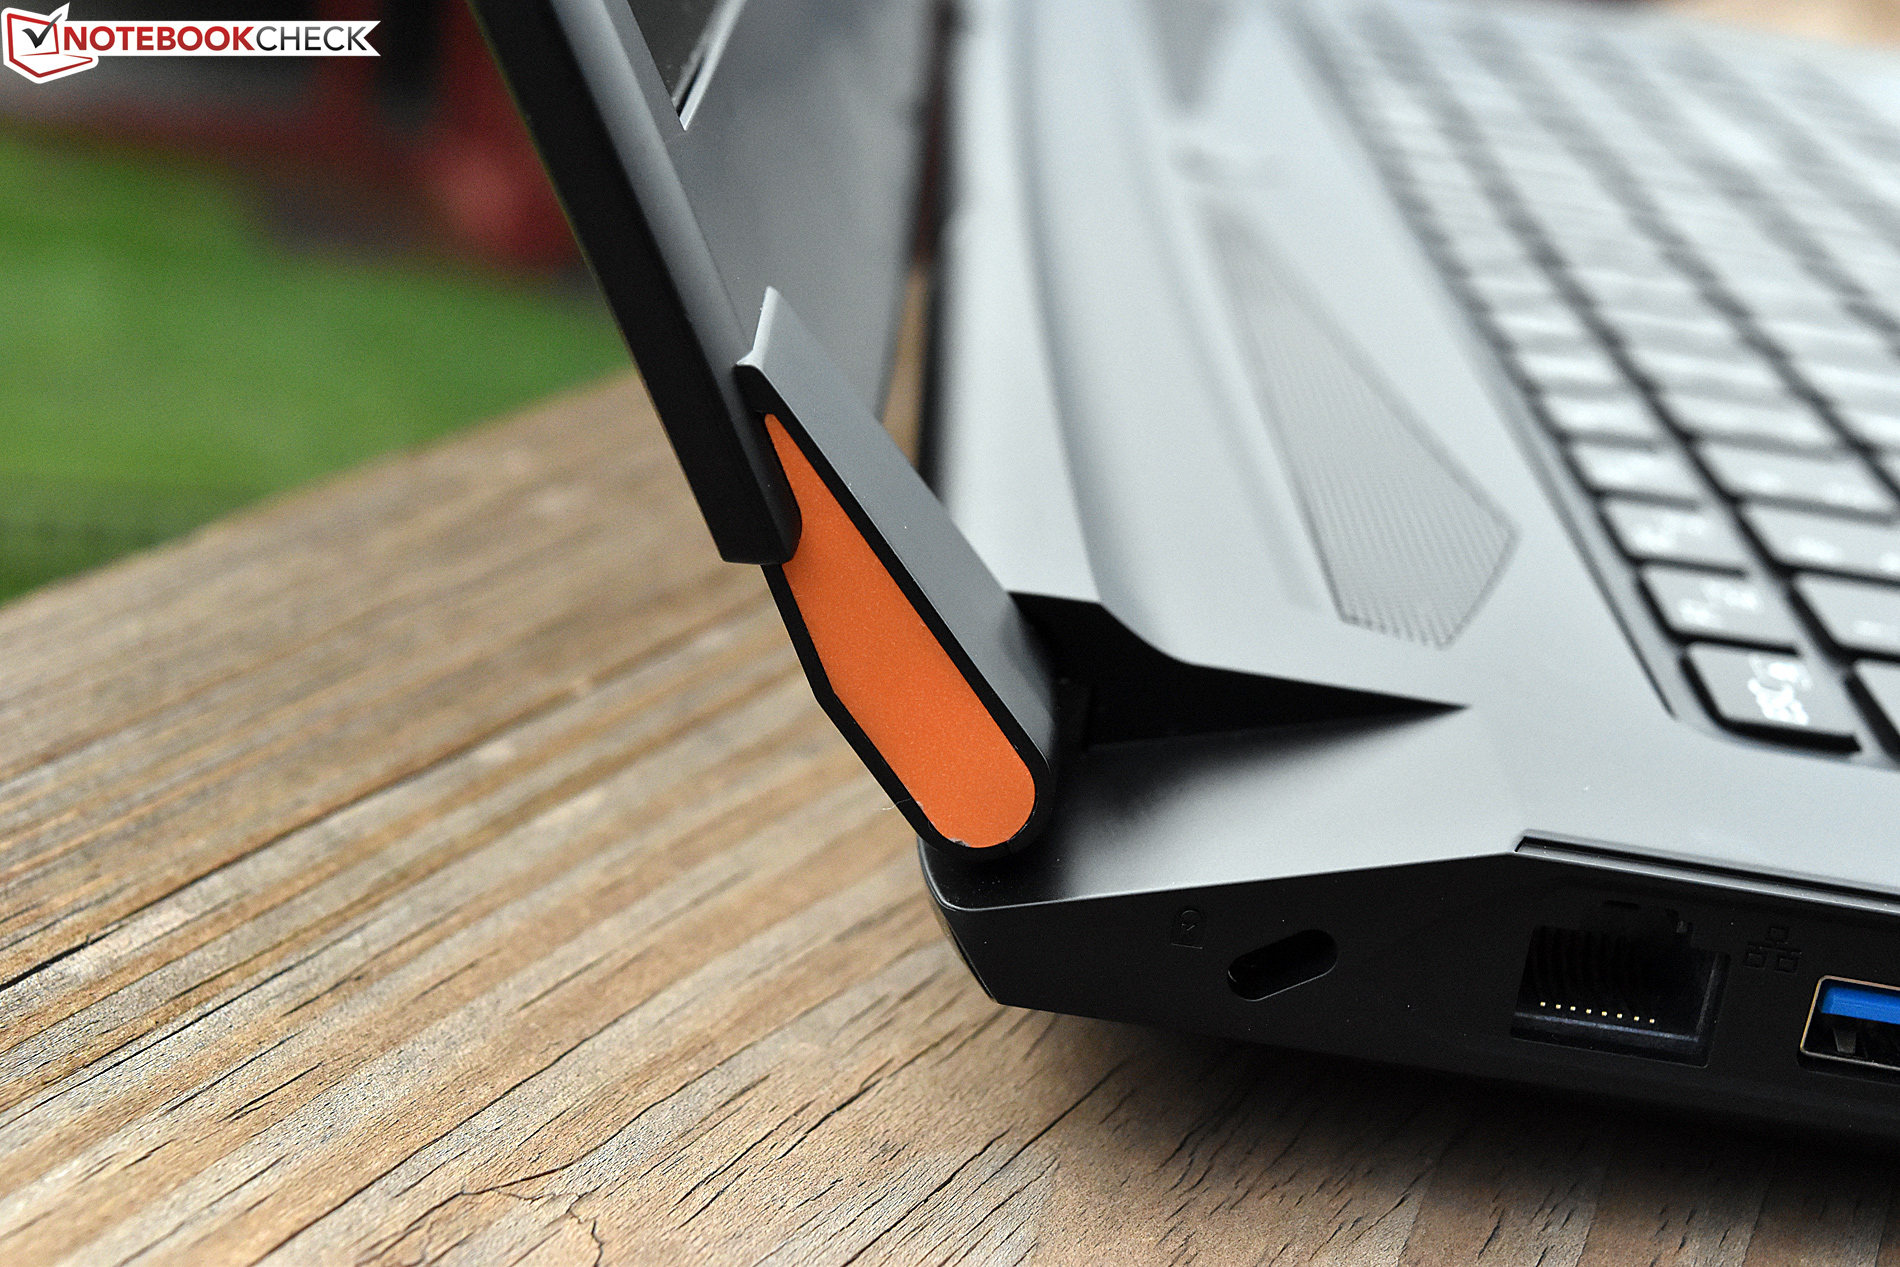
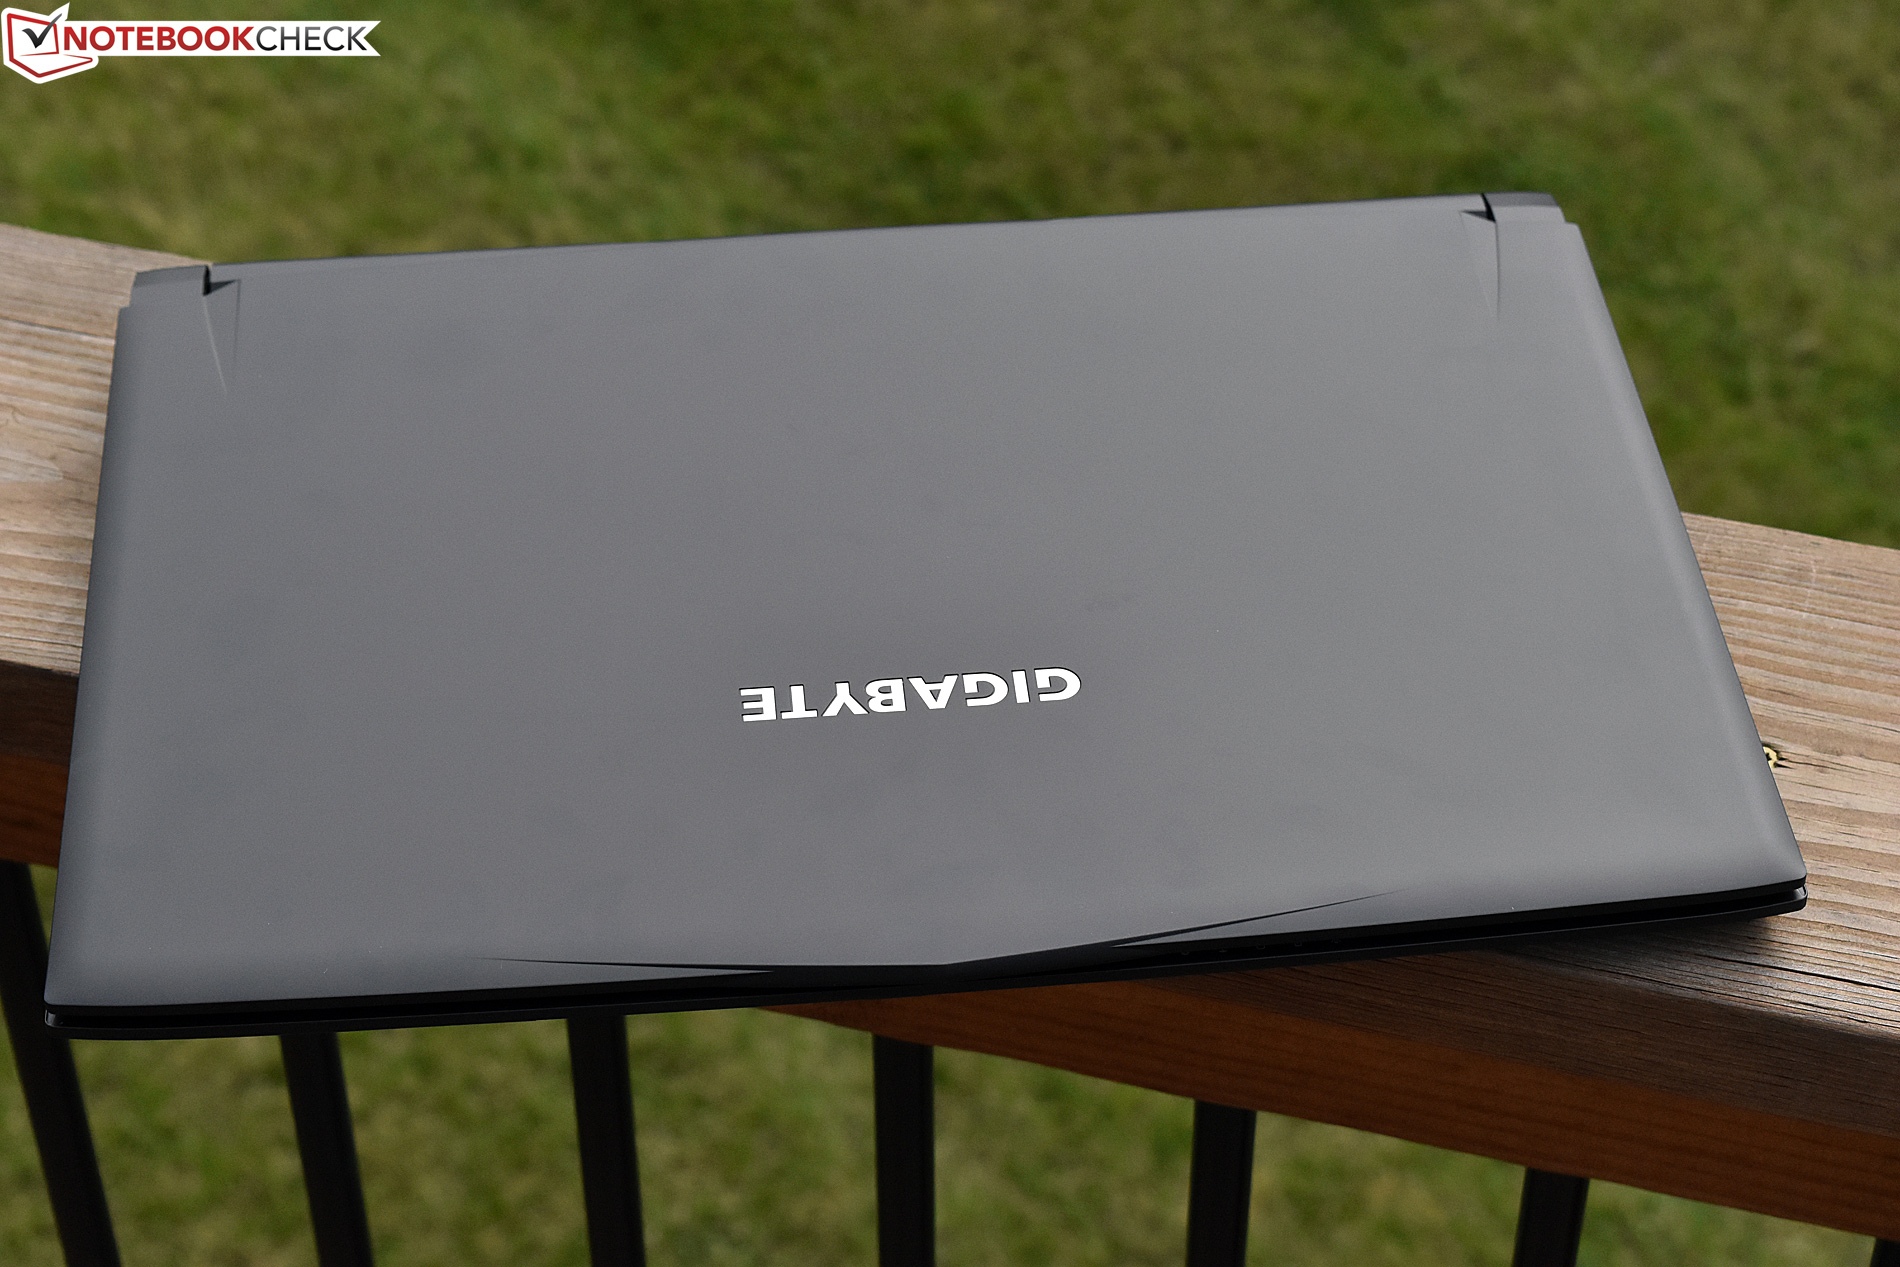
Obviamente, quando você comprime um portátil de jogos tão poderosos — e trabalha para manter o preço abaixo dos $2.000, para começar — haverá alguns compromissos. Estes se manifestam na forma da predominância do plástico do P57Xe no desafortunado aquecimento, que surge rapidamente na metade direita do teclado durante sessões de jogos inclusive moderadas e independentemente da configuração da velocidade da ventoinha. Também é um aparelho bastante barulhento, embora ambas as ventoinhas estejam montadas na traseira (o que ajuda um pouco). O consumo de energia é previsivelmente muito mais elevado do que o do P57W, e a duração da bateria (tão marginal seja sua importância em um portátil de jogos) sofre consequentemente.
Finalmente, o touchpad é positivamente ruim para tudo, menos para as tarefas mais triviais, por isso sempre tenha à mão o seu mouse externo.
Alguns também poderão chorar pela exclusão de uma opção de tela 4K, mas finalmente, não será um fato muito decisivo para a compra. É bom ter um portátil que lidará bem com quaisquer tarefas que você precise fazer, com uma resolução nativa, e baseado em nossos benchmarks, isso provavelmente não mude muito em breve. Os jogos em 4K ainda são possíveis através de monitores externos (como mencionamos antes).
Finalmente, o P57X é um portátil para jogos que faz muito sentido que foca seus esforços principalmente na funcionalidade, portabilidade e acessibilidade (relativamente). Se o preço não for um problema e se o peso não o incomoda, não encontrará algo melhor. De outra forma, apesar de seus dispositivos de entrada deficientes, o desenvolvimento térmico abaixo do ideal, e a omissão de uma tela 4K, o P57X é uma besta absoluta, que vai ser capaz de rodar os jogos nas mais altas configurações e resolução nativa por um bom tempo.
Gigabyte P57X v6
- 10/03/2016 v5.1 (old)
Steve Schardein
Price comparison
