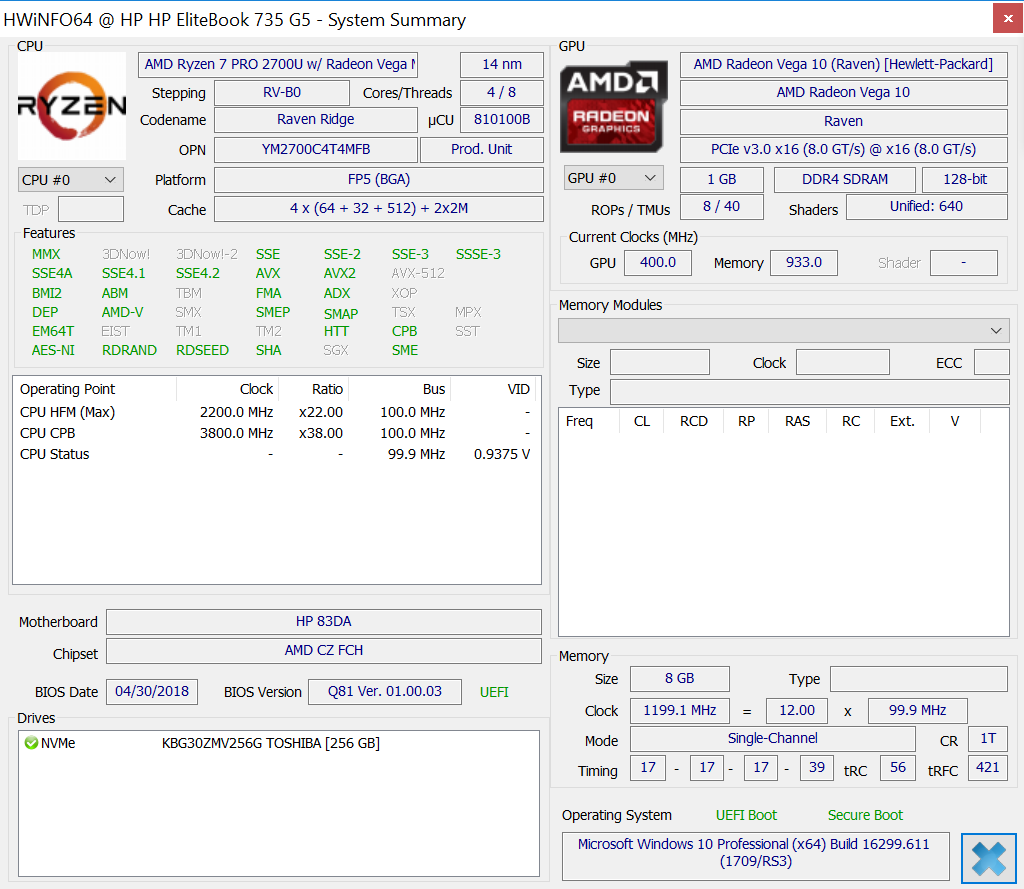
Breve Análise do Portátil HP EliteBook 735 G5 (7 2700U, Vega 10)
| |||||||||||||||||||||||||
iluminação: 85 %
iluminação com acumulador: 461 cd/m²
Contraste: 1105:1 (Preto: 0.42 cd/m²)
ΔE ColorChecker Calman: 4.49 | ∀{0.5-29.43 Ø4.71}
calibrated: 1.27
ΔE Greyscale Calman: 6.44 | ∀{0.09-98 Ø4.96}
96% sRGB (Argyll 1.6.3 3D)
63% AdobeRGB 1998 (Argyll 1.6.3 3D)
71.4% AdobeRGB 1998 (Argyll 3D)
96.3% sRGB (Argyll 3D)
71.1% Display P3 (Argyll 3D)
Gamma: 2.41
CCT: 6922 K
| HP EliteBook 735 G5 3UN62EA BOE074A, , 1920x1080, 13.3" | Lenovo ThinkPad T580-20L9001AUS B156HAK02.0, , 1920x1080, 15.6" | HP EliteBook 755 G5 3UN79EA BOE074E, , 1920x1080, 15.6" | Huawei MateBook X Pro, i7 JDI LPM139M422A, , 3000x2000, 13.9" | Fujitsu Lifebook U938 Sharp LQ133M1JW28, , 1920x1080, 13.3" | Dell Latitude 7390 LGD059B, , 1920x1080, 13.3" | |
|---|---|---|---|---|---|---|
| Display | -46% | -6% | -4% | -4% | -4% | |
| Display P3 Coverage (%) | 71.1 | 36.94 -48% | 66.9 -6% | 65.8 -7% | 67.5 -5% | 67.8 -5% |
| sRGB Coverage (%) | 96.3 | 55.3 -43% | 90.2 -6% | 97.7 1% | 94.5 -2% | 95.1 -1% |
| AdobeRGB 1998 Coverage (%) | 71.4 | 38.16 -47% | 66.1 -7% | 67.5 -5% | 68.7 -4% | 67.8 -5% |
| Response Times | 11% | -4% | 6% | -3% | 2% | |
| Response Time Grey 50% / Grey 80% * (ms) | 42 ? | 33.2 ? 21% | 39 ? 7% | 42 ? -0% | 43 ? -2% | 36.8 ? 12% |
| Response Time Black / White * (ms) | 28 ? | 27.6 ? 1% | 32 ? -14% | 25 ? 11% | 29 ? -4% | 30.4 ? -9% |
| PWM Frequency (Hz) | 20500 ? | 21000 ? | 217 ? | |||
| Screen | -41% | -24% | 28% | 9% | 2% | |
| Brightness middle (cd/m²) | 464 | 254.5 -45% | 456 -2% | 550 19% | 344 -26% | 303.8 -35% |
| Brightness (cd/m²) | 426 | 238 -44% | 410 -4% | 512 20% | 320 -25% | 289 -32% |
| Brightness Distribution (%) | 85 | 87 2% | 84 -1% | 88 4% | 77 -9% | 86 1% |
| Black Level * (cd/m²) | 0.42 | 0.27 36% | 0.62 -48% | 0.32 24% | 0.31 26% | 0.31 26% |
| Contrast (:1) | 1105 | 943 -15% | 735 -33% | 1719 56% | 1110 0% | 980 -11% |
| Colorchecker dE 2000 * | 4.49 | 4.58 -2% | 7.09 -58% | 2.28 49% | 2.72 39% | 2.9 35% |
| Colorchecker dE 2000 max. * | 8.77 | 17.99 -105% | 12.64 -44% | 4.36 50% | 5.92 32% | 5.79 34% |
| Colorchecker dE 2000 calibrated * | 1.27 | 4.34 -242% | 0.8 37% | 1.72 -35% | ||
| Greyscale dE 2000 * | 6.44 | 3.3 49% | 9.15 -42% | 3.27 49% | 2.74 57% | 3.7 43% |
| Gamma | 2.41 91% | 2.403 92% | 2.31 95% | 2.35 94% | 2.38 92% | 2.118 104% |
| CCT | 6922 94% | 6355 102% | 7195 90% | 6819 95% | 6794 96% | 6323 103% |
| Color Space (Percent of AdobeRGB 1998) (%) | 63 | 35 -44% | 59 -6% | 62 -2% | 61 -3% | 63 0% |
| Color Space (Percent of sRGB) (%) | 96 | 55 -43% | 90 -6% | 98 2% | 94 -2% | 95 -1% |
| Média Total (Programa/Configurações) | -25% /
-36% | -11% /
-18% | 10% /
19% | 1% /
5% | 0% /
1% |
* ... menor é melhor
Exibir tempos de resposta
| ↔ Tempo de resposta preto para branco | ||
|---|---|---|
| 28 ms ... ascensão ↗ e queda ↘ combinadas | ↗ 14 ms ascensão | 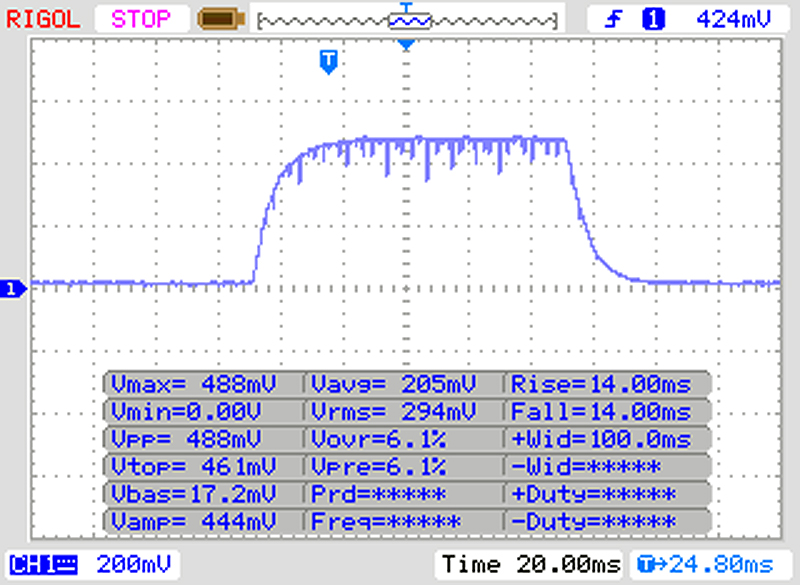 |
| ↘ 14 ms queda | ||
| A tela mostra taxas de resposta relativamente lentas em nossos testes e pode ser muito lenta para os jogadores. Em comparação, todos os dispositivos testados variam de 0.1 (mínimo) a 240 (máximo) ms. » 71 % de todos os dispositivos são melhores. Isso significa que o tempo de resposta medido é pior que a média de todos os dispositivos testados (19.8 ms). | ||
| ↔ Tempo de resposta 50% cinza a 80% cinza | ||
| 42 ms ... ascensão ↗ e queda ↘ combinadas | ↗ 24 ms ascensão | 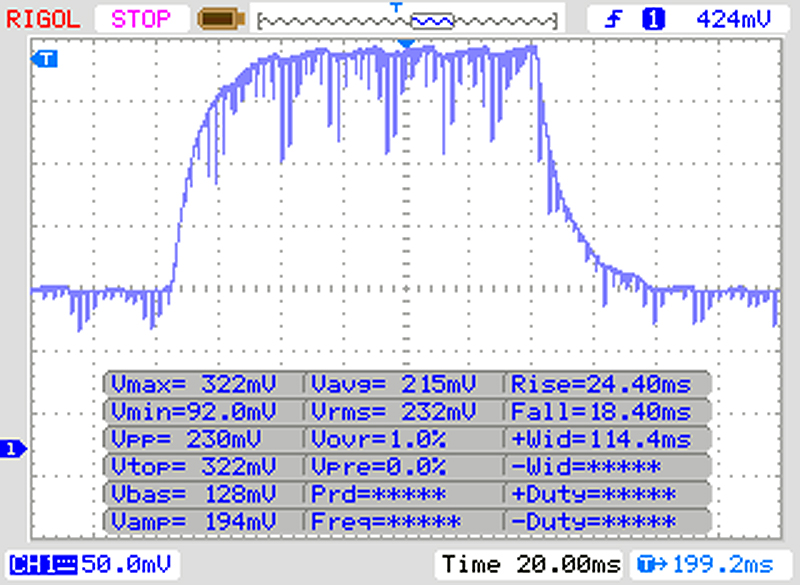 |
| ↘ 18 ms queda | ||
| A tela mostra taxas de resposta lentas em nossos testes e será insatisfatória para os jogadores. Em comparação, todos os dispositivos testados variam de 0.165 (mínimo) a 636 (máximo) ms. » 67 % de todos os dispositivos são melhores. Isso significa que o tempo de resposta medido é pior que a média de todos os dispositivos testados (30.9 ms). | ||
Cintilação da tela / PWM (modulação por largura de pulso)
| Tela tremeluzindo/PWM detectado | 20500 Hz | ≤ 90 % configuração de brilho | 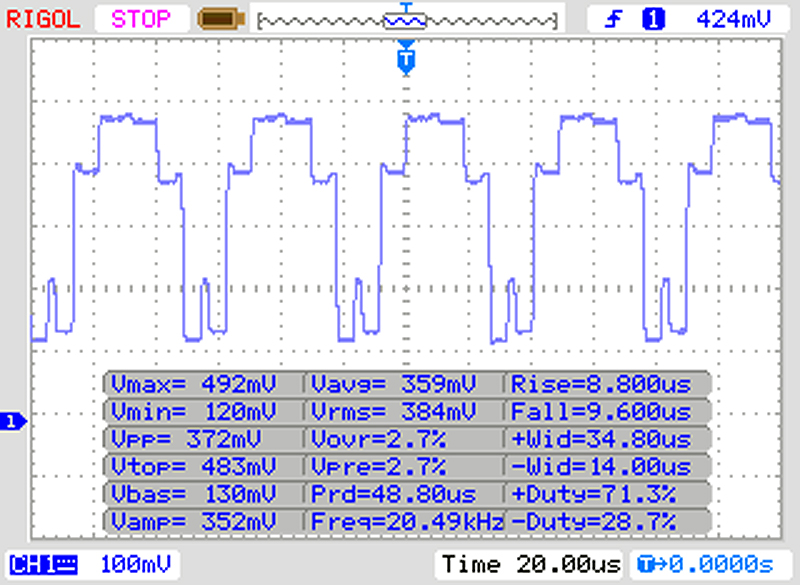 |
A luz de fundo da tela pisca em 20500 Hz (pior caso, por exemplo, utilizando PWM) Cintilação detectada em uma configuração de brilho de 90 % e abaixo. Não deve haver cintilação ou PWM acima desta configuração de brilho. A frequência de 20500 Hz é bastante alta, então a maioria dos usuários sensíveis ao PWM não deve notar nenhuma oscilação. [pwm_comparison] Em comparação: 52 % de todos os dispositivos testados não usam PWM para escurecer a tela. Se PWM foi detectado, uma média de 7744 (mínimo: 5 - máximo: 343500) Hz foi medida. | |||
| PCMark 8 Home Score Accelerated v2 | 3402 pontos | |
| PCMark 8 Work Score Accelerated v2 | 4666 pontos | |
| PCMark 10 Score | 3354 pontos | |
Ajuda | ||
| HP EliteBook 735 G5 3UN62EA Toshiba KBG30ZMV256G | HP EliteBook 755 G5 3UN79EA Toshiba XG5 KXG50ZNV512G | Huawei MateBook X Pro, i7 Toshiba XG5 KXG50ZNV512G | Fujitsu Lifebook U938 Micron 1100 MTFDDAV256TBN | Média Toshiba KBG30ZMV256G | |
|---|---|---|---|---|---|
| CrystalDiskMark 3.0 | -2% | 6% | -25% | -0% | |
| Read Seq (MB/s) | 1052 | 1701 62% | 1317 25% | 464.9 -56% | 947 ? -10% |
| Write Seq (MB/s) | 719 | 523 -27% | 459.9 -36% | 401 -44% | 728 ? 1% |
| Read 512 (MB/s) | 859 | 859 0% | 628 -27% | 320.2 -63% | 680 ? -21% |
| Write 512 (MB/s) | 643 | 550 -14% | 461.4 -28% | 335.2 -48% | 607 ? -6% |
| Read 4k (MB/s) | 42.83 | 20.23 -53% | 33.79 -21% | 26.45 -38% | 42.9 ? 0% |
| Write 4k (MB/s) | 79.6 | 63.2 -21% | 117.5 48% | 79.8 0% | 90.2 ? 13% |
| Read 4k QD32 (MB/s) | 318.8 | 306 -4% | 360 13% | 246.5 -23% | 291 ? -9% |
| Write 4k QD32 (MB/s) | 158 | 220.3 39% | 273.6 73% | 277.2 75% | 204 ? 29% |

| 3DMark 11 Performance | 2950 pontos | |
| 3DMark Cloud Gate Standard Score | 8140 pontos | |
| 3DMark Fire Strike Score | 1581 pontos | |
Ajuda | ||
| Rise of the Tomb Raider | |
| 1024x768 Lowest Preset | |
| Huawei MateBook X Pro, i7 | |
| Média AMD Radeon RX Vega 10 (33 - 45.9, n=6) | |
| HP EliteBook 735 G5 3UN62EA | |
| HP EliteBook 755 G5 3UN79EA | |
| Fujitsu Lifebook U938 | |
| 1920x1080 High Preset AA:FX AF:4x | |
| Huawei MateBook X Pro, i7 | |
| HP EliteBook 755 G5 3UN79EA | |
| HP EliteBook 735 G5 3UN62EA | |
| Média AMD Radeon RX Vega 10 (8.3 - 16.4, n=6) | |
| Fujitsu Lifebook U938 | |
| Thief | |
| 1024x768 Very Low Preset | |
| Huawei MateBook X Pro, i7 | |
| HP EliteBook 735 G5 3UN62EA | |
| Média AMD Radeon RX Vega 10 (34 - 36, n=2) | |
| HP EliteBook 755 G5 3UN79EA | |
| 1920x1080 Very High Preset AA:FXAA & High SS AF:8x | |
| Huawei MateBook X Pro, i7 | |
| HP EliteBook 735 G5 3UN62EA | |
| Média AMD Radeon RX Vega 10 (9.7 - 10, n=2) | |
| HP EliteBook 755 G5 3UN79EA | |
| baixo | média | alto | ultra | |
|---|---|---|---|---|
| BioShock Infinite (2013) | 82 | 14 | ||
| Thief (2014) | 36 | 10 | ||
| Rise of the Tomb Raider (2016) | 37 | 12 |
Barulho
| Ocioso |
| 30.25 / 30.25 / 30.25 dB |
| Carga |
| 37.3 / 37.3 dB |
 | ||
30 dB silencioso 40 dB(A) audível 50 dB(A) ruidosamente alto |
||
min: | ||
(+) A temperatura máxima no lado superior é 36 °C / 97 F, em comparação com a média de 34.3 °C / 94 F , variando de 21.2 a 62.5 °C para a classe Office.
(+) A parte inferior aquece até um máximo de 36.5 °C / 98 F, em comparação com a média de 36.8 °C / 98 F
(+) Em uso inativo, a temperatura média para o lado superior é 27.7 °C / 82 F, em comparação com a média do dispositivo de 29.5 °C / ### class_avg_f### F.
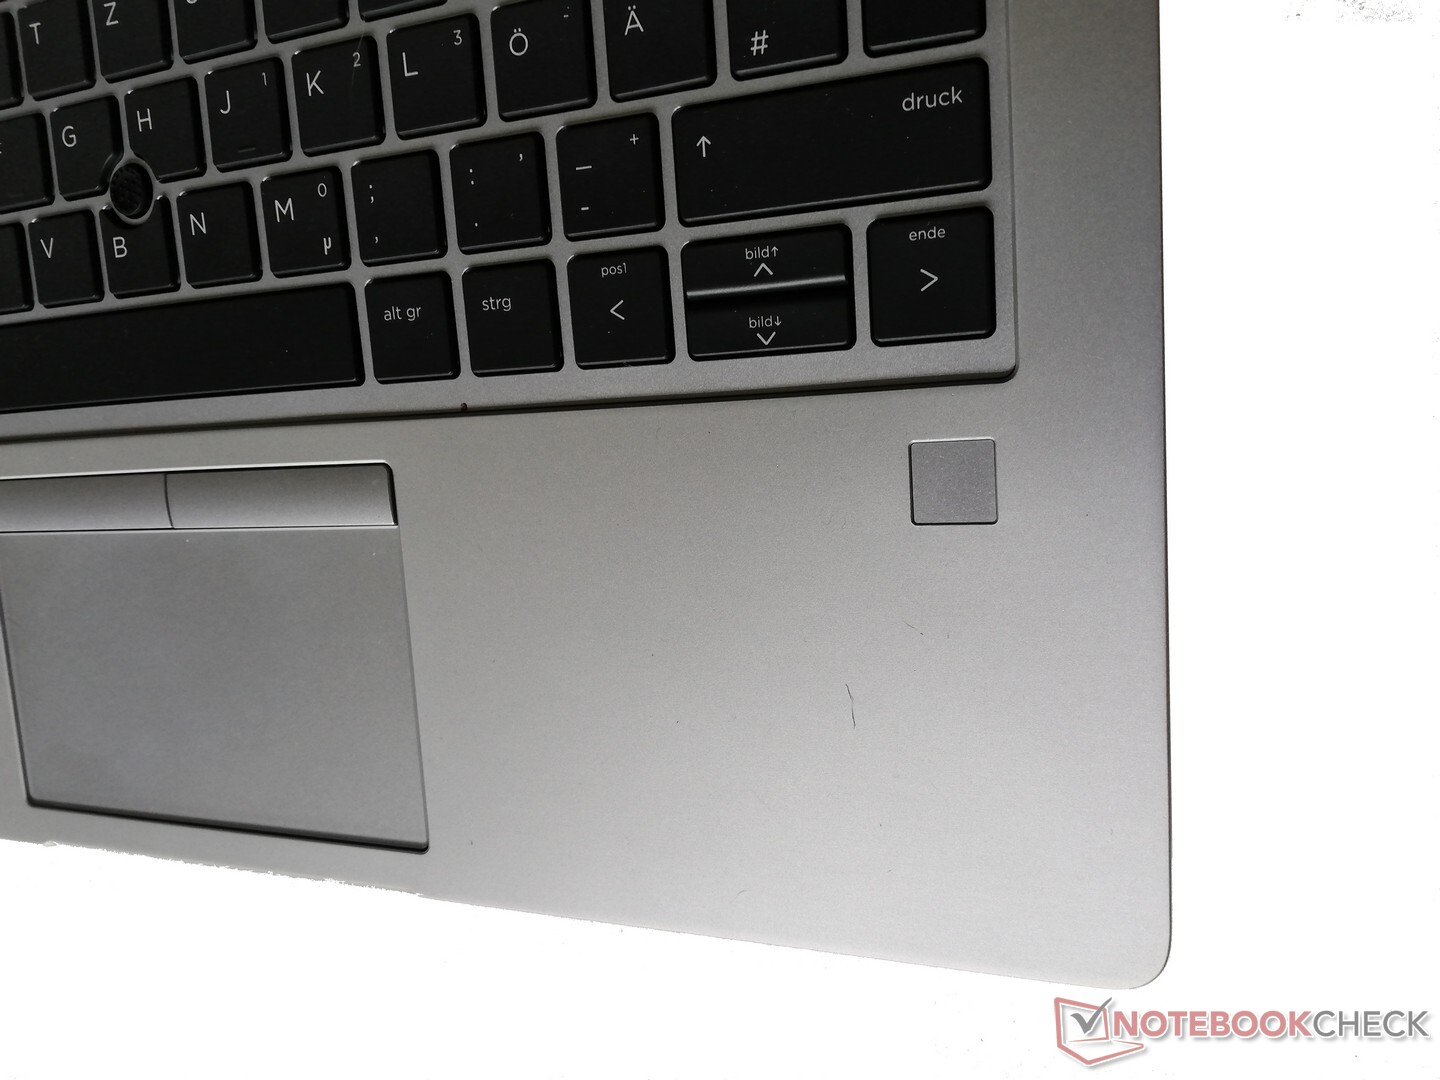
(+) Os apoios para as mãos e o touchpad são mais frios que a temperatura da pele, com um máximo de 28.2 °C / 82.8 F e, portanto, são frios ao toque.
(±) A temperatura média da área do apoio para as mãos de dispositivos semelhantes foi 27.6 °C / 81.7 F (-0.6 °C / -1.1 F).
HP EliteBook 735 G5 3UN62EA análise de áudio
(-) | alto-falantes não muito altos (###valor### dB)
Graves 100 - 315Hz
(-) | quase nenhum baixo - em média 26.5% menor que a mediana
(±) | a linearidade dos graves é média (9.7% delta para a frequência anterior)
Médios 400 - 2.000 Hz
(+) | médios equilibrados - apenas 2.2% longe da mediana
(±) | a linearidade dos médios é média (7.1% delta para frequência anterior)
Altos 2 - 16 kHz
(+) | agudos equilibrados - apenas 4.5% longe da mediana
(+) | os máximos são lineares (4% delta da frequência anterior)
Geral 100 - 16.000 Hz
(±) | a linearidade do som geral é média (22.5% diferença em relação à mediana)
Comparado com a mesma classe
» 60% de todos os dispositivos testados nesta classe foram melhores, 8% semelhantes, 32% piores
» O melhor teve um delta de 7%, a média foi 21%, o pior foi 53%
Comparado com todos os dispositivos testados
» 66% de todos os dispositivos testados foram melhores, 6% semelhantes, 28% piores
» O melhor teve um delta de 4%, a média foi 23%, o pior foi 134%
Apple MacBook 12 (Early 2016) 1.1 GHz análise de áudio
(+) | os alto-falantes podem tocar relativamente alto (###valor### dB)
Graves 100 - 315Hz
(±) | graves reduzidos - em média 11.3% menor que a mediana
(±) | a linearidade dos graves é média (14.2% delta para a frequência anterior)
Médios 400 - 2.000 Hz
(+) | médios equilibrados - apenas 2.4% longe da mediana
(+) | médios são lineares (5.5% delta para frequência anterior)
Altos 2 - 16 kHz
(+) | agudos equilibrados - apenas 2% longe da mediana
(+) | os máximos são lineares (4.5% delta da frequência anterior)
Geral 100 - 16.000 Hz
(+) | o som geral é linear (10.2% diferença em relação à mediana)
Comparado com a mesma classe
» 7% de todos os dispositivos testados nesta classe foram melhores, 2% semelhantes, 90% piores
» O melhor teve um delta de 5%, a média foi 18%, o pior foi 53%
Comparado com todos os dispositivos testados
» 5% de todos os dispositivos testados foram melhores, 1% semelhantes, 94% piores
» O melhor teve um delta de 4%, a média foi 23%, o pior foi 134%
| desligado | |
| Ocioso | |
| Carga |
|
Key:
min: | |
| HP EliteBook 735 G5 3UN62EA R7 2700U, Vega 10, Toshiba KBG30ZMV256G, IPS, 1920x1080, 13.3" | Lenovo ThinkPad T580-20L9001AUS i7-8650U, UHD Graphics 620, Samsung SSD PM981 MZVLB512HAJQ, IPS, 1920x1080, 15.6" | HP EliteBook 755 G5 3UN79EA R7 2700U, Vega 10, Toshiba XG5 KXG50ZNV512G, IPS, 1920x1080, 15.6" | Huawei MateBook X Pro, i7 i5-8550U, GeForce MX150, Toshiba XG5 KXG50ZNV512G, LTPS, 3000x2000, 13.9" | Fujitsu Lifebook U938 i5-8250U, UHD Graphics 620, Micron 1100 MTFDDAV256TBN, IPS, 1920x1080, 13.3" | Dell Latitude 7390 i7-8650U, UHD Graphics 620, Samsung PM961 MZVLW256HEHP, IPS, 1920x1080, 13.3" | Média AMD Radeon RX Vega 10 | Média da turma Office | |
|---|---|---|---|---|---|---|---|---|
| Power Consumption | 1% | -4% | 10% | 39% | 23% | 13% | 4% | |
| Idle Minimum * (Watt) | 5.5 | 4.7 15% | 5 9% | 4.7 15% | 2.4 56% | 3.3 40% | 4.73 ? 14% | 4.25 ? 23% |
| Idle Average * (Watt) | 9.4 | 7.9 16% | 10.6 -13% | 8.7 7% | 5.5 41% | 5.9 37% | 7.61 ? 19% | 7.3 ? 22% |
| Idle Maximum * (Watt) | 11.6 | 11.4 2% | 12.9 -11% | 9.8 16% | 6 48% | 6.2 47% | 9.63 ? 17% | 8.57 ? 26% |
| Load Average * (Watt) | 39 | 47.2 -21% | 40.6 -4% | 39.4 -1% | 31 21% | 43.2 -11% | 33.3 ? 15% | 43.8 ? -12% |
| Load Maximum * (Watt) | 45.6 | 48.1 -5% | 46.6 -2% | 40.4 11% | 32.6 29% | 45.2 1% | 45.1 ? 1% | 64.5 ? -41% |
* ... menor é melhor
| HP EliteBook 735 G5 3UN62EA R7 2700U, Vega 10, 50 Wh | Lenovo ThinkPad T580-20L9001AUS i7-8650U, UHD Graphics 620, 56 Wh | HP EliteBook 755 G5 3UN79EA R7 2700U, Vega 10, 56 Wh | Huawei MateBook X Pro, i7 i5-8550U, GeForce MX150, 57 Wh | Fujitsu Lifebook U938 i5-8250U, UHD Graphics 620, 50 Wh | Dell Latitude 7390 i7-8650U, UHD Graphics 620, 60 Wh | Média da turma Office | |
|---|---|---|---|---|---|---|---|
| Duração da bateria | -24% | 34% | 83% | 72% | 102% | 103% | |
| Reader / Idle (h) | 9.2 | 11.9 29% | 19.3 110% | 19.5 112% | 22.2 ? 141% | ||
| WiFi v1.3 (h) | 5.5 | 4.2 -24% | 8.3 51% | 8.4 53% | 8.4 53% | 11.1 102% | 13.2 ? 140% |
| Load (h) | 1.4 | 1.7 21% | 2.6 86% | 2.1 50% | 1.808 ? 29% | ||
| H.264 (h) | 7.2 | 15.4 ? |
Pro
Contra
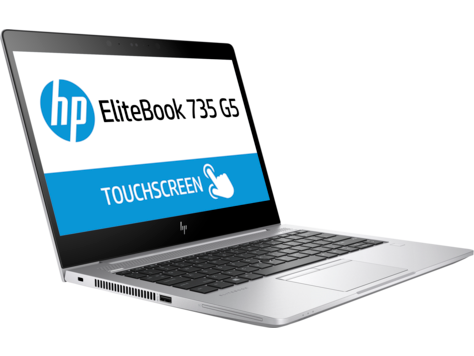
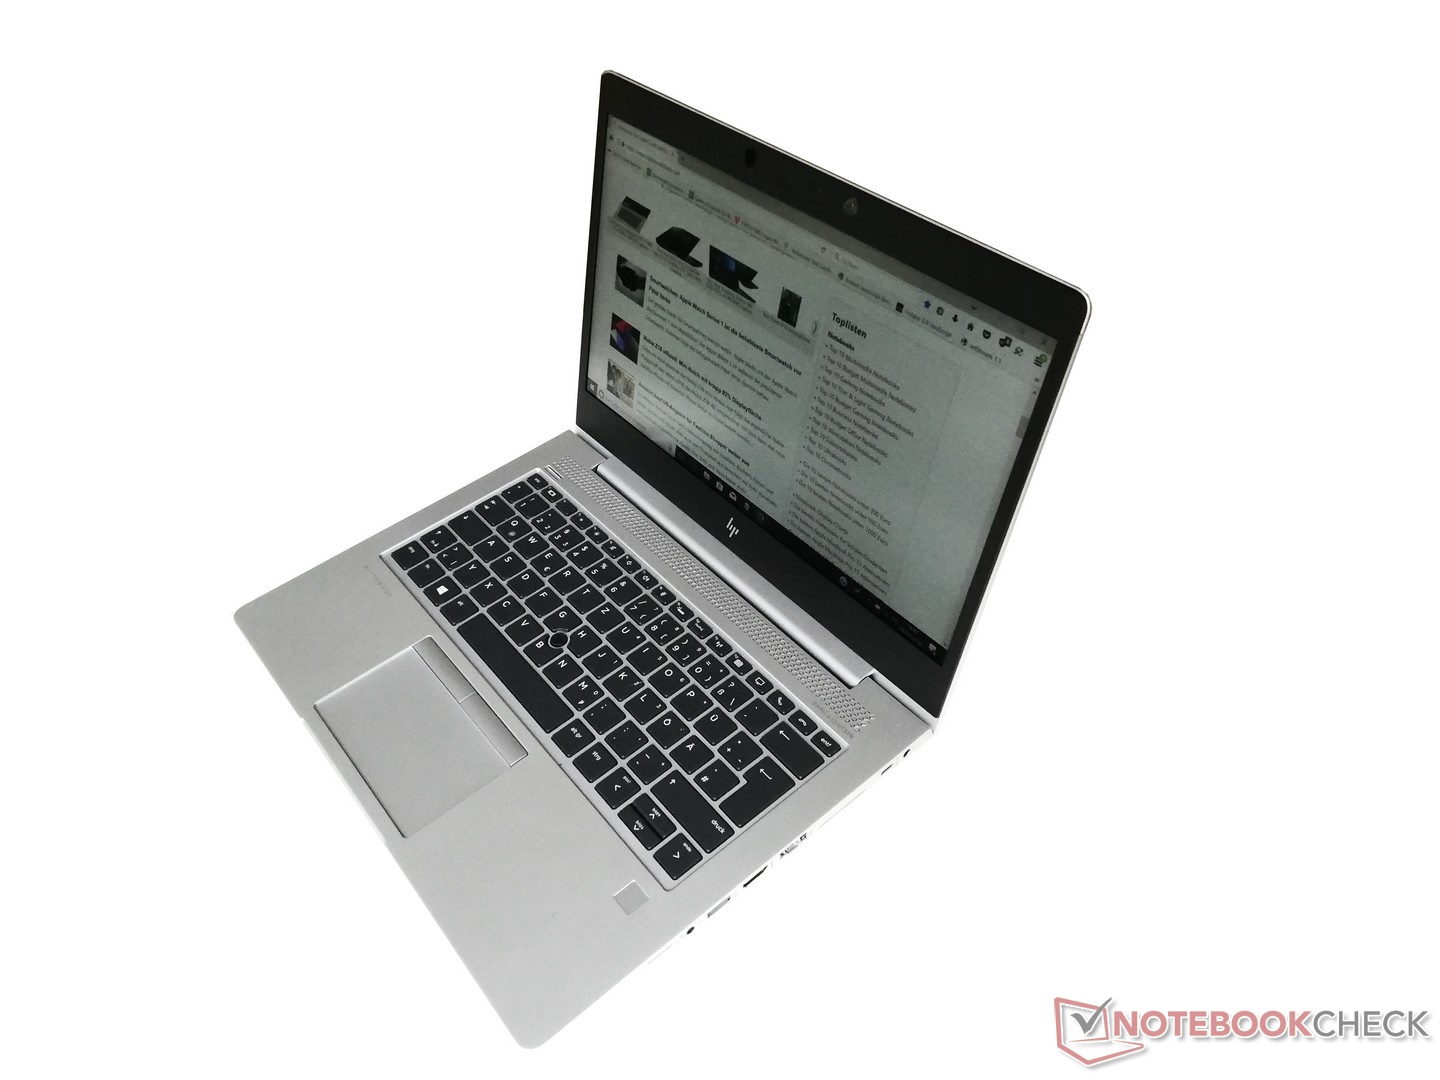
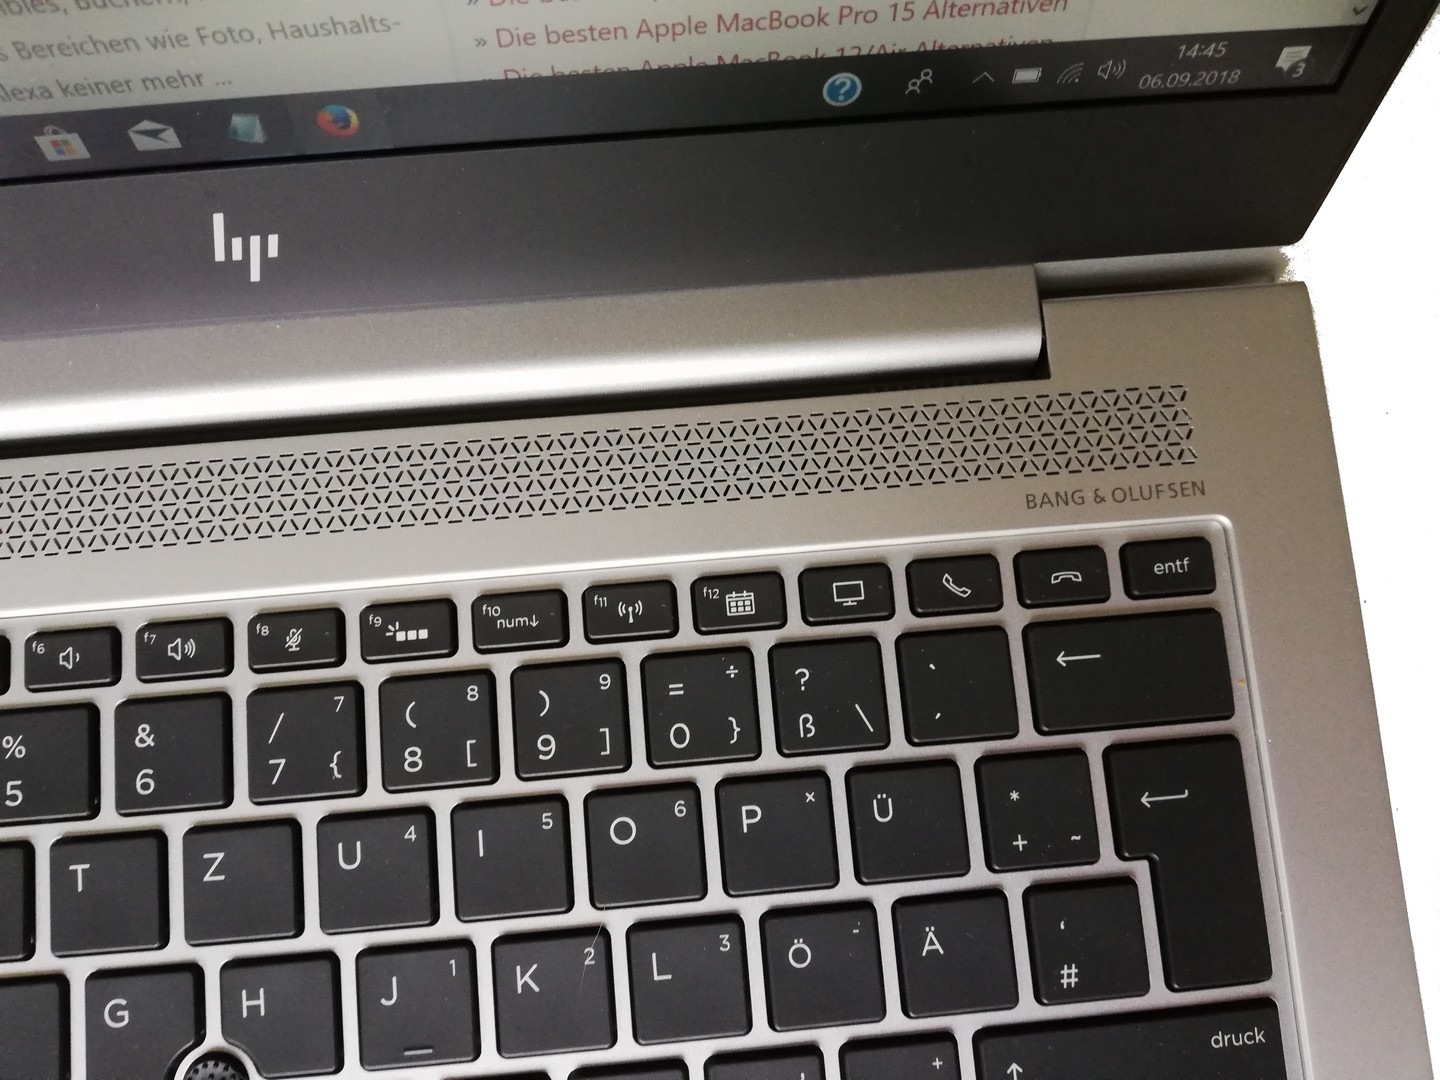
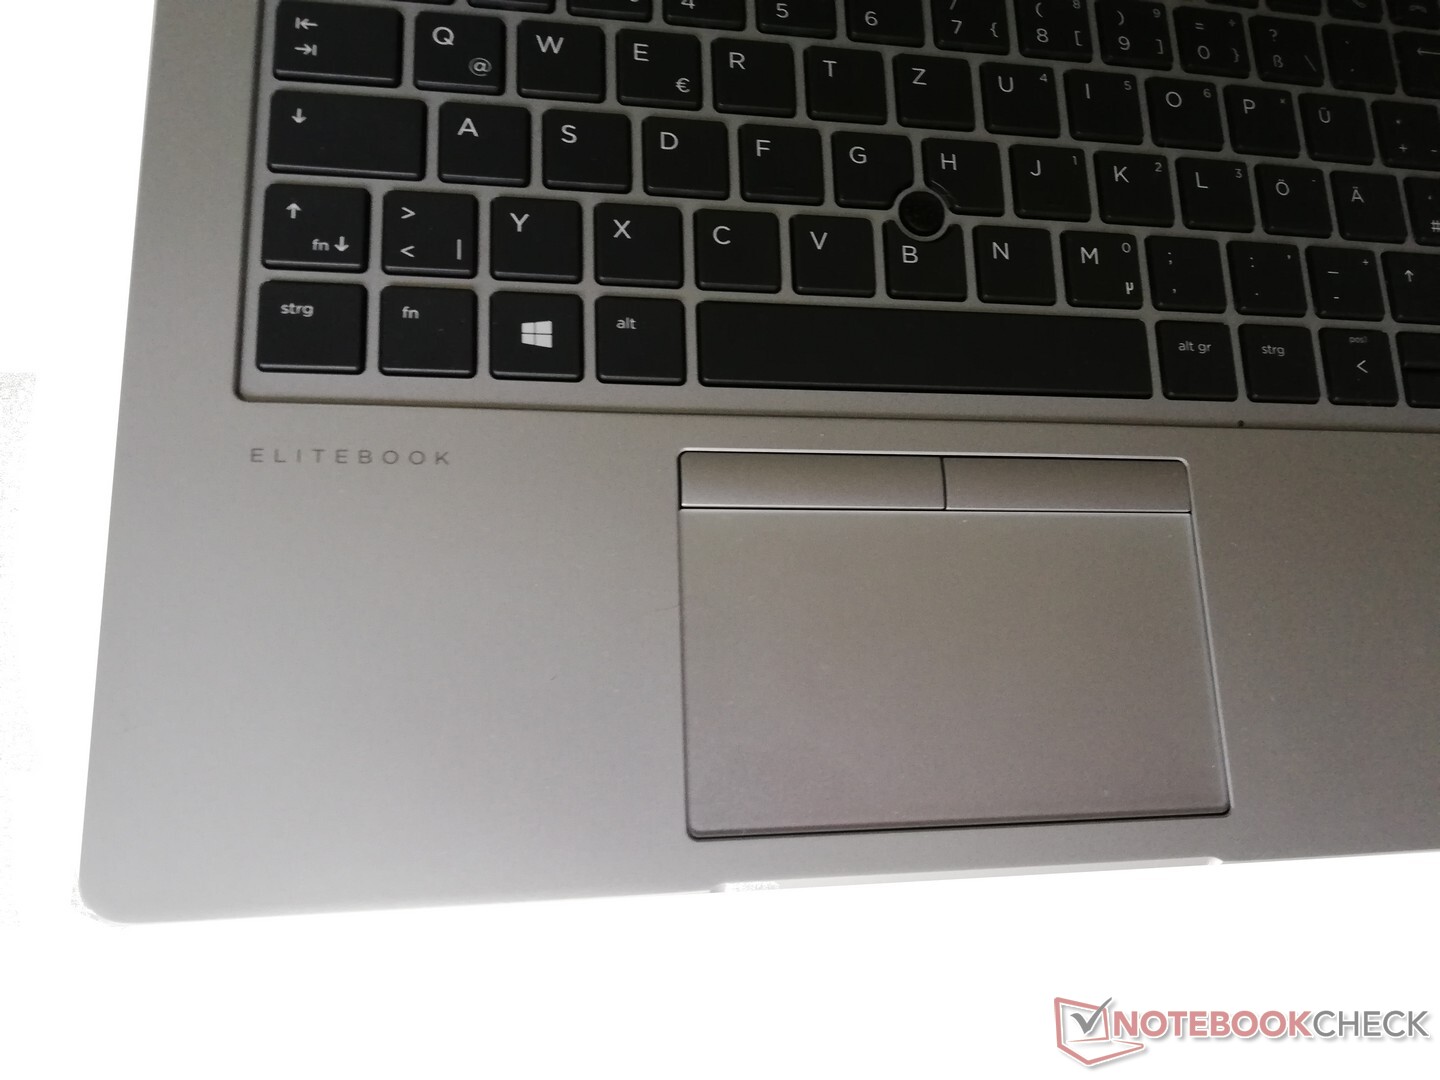
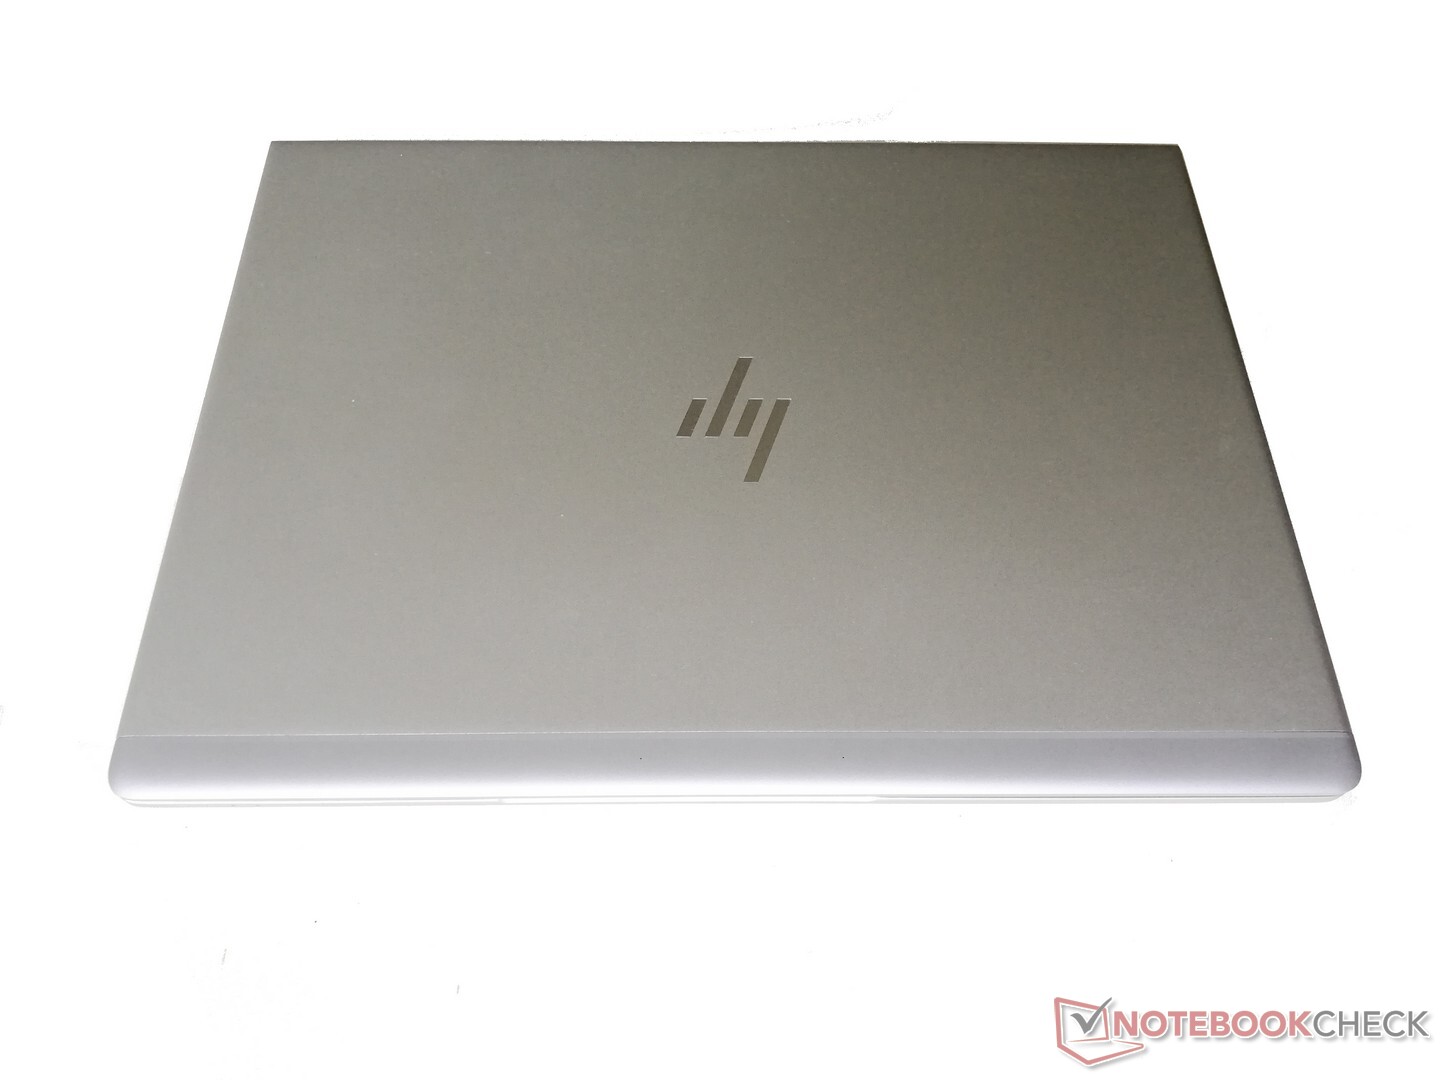
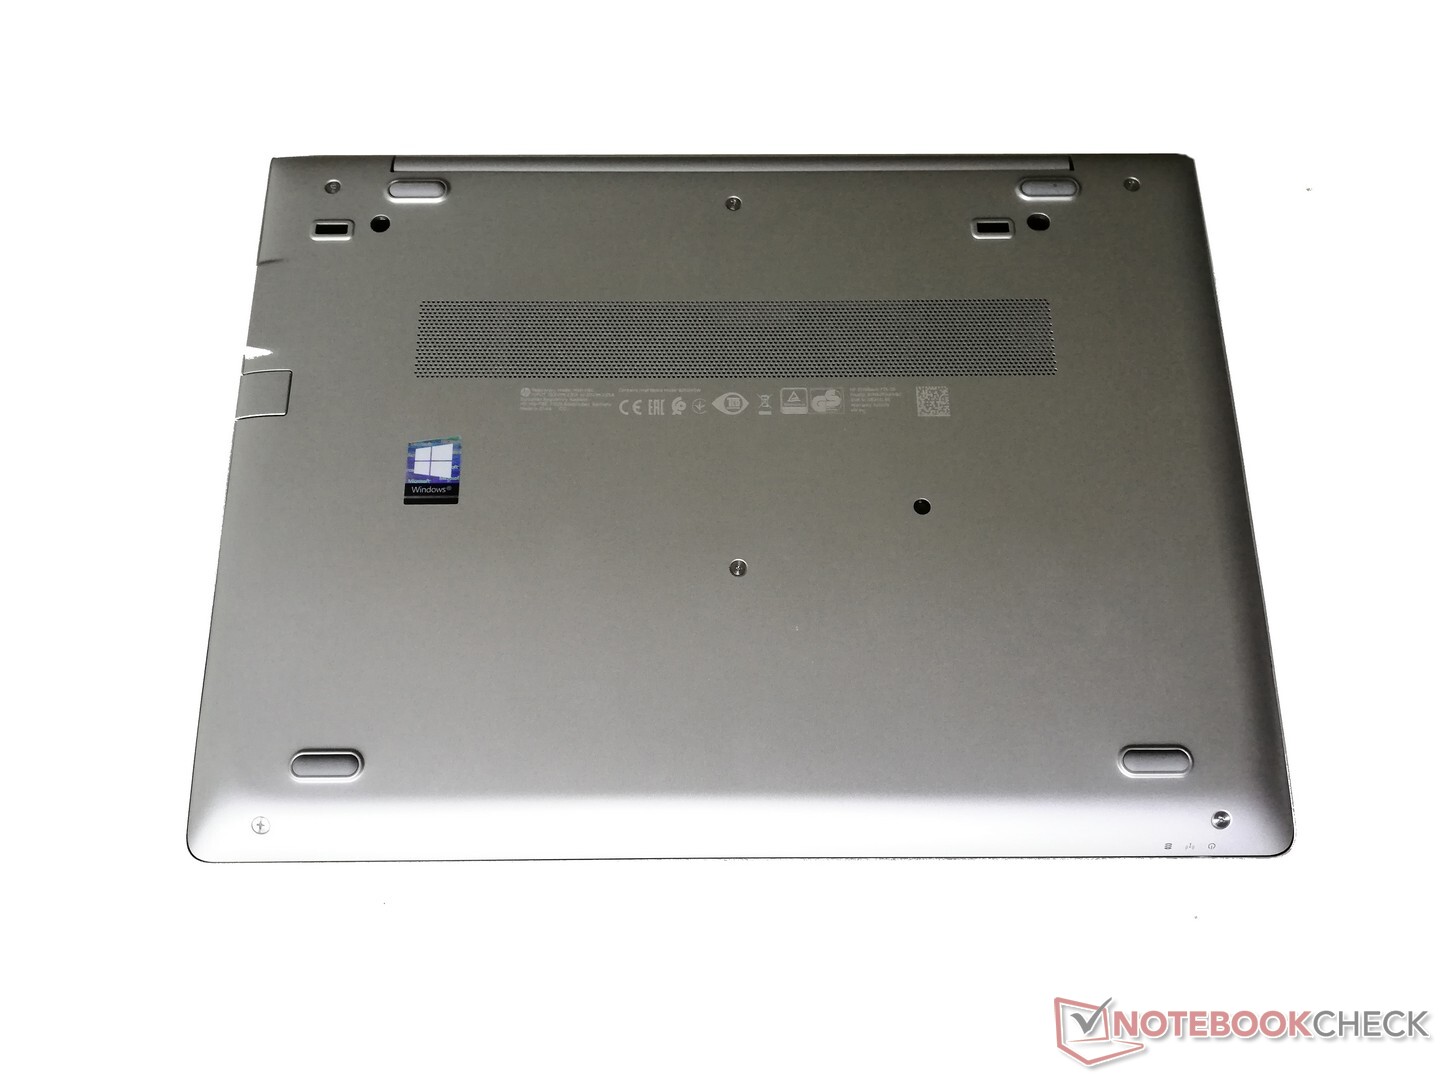
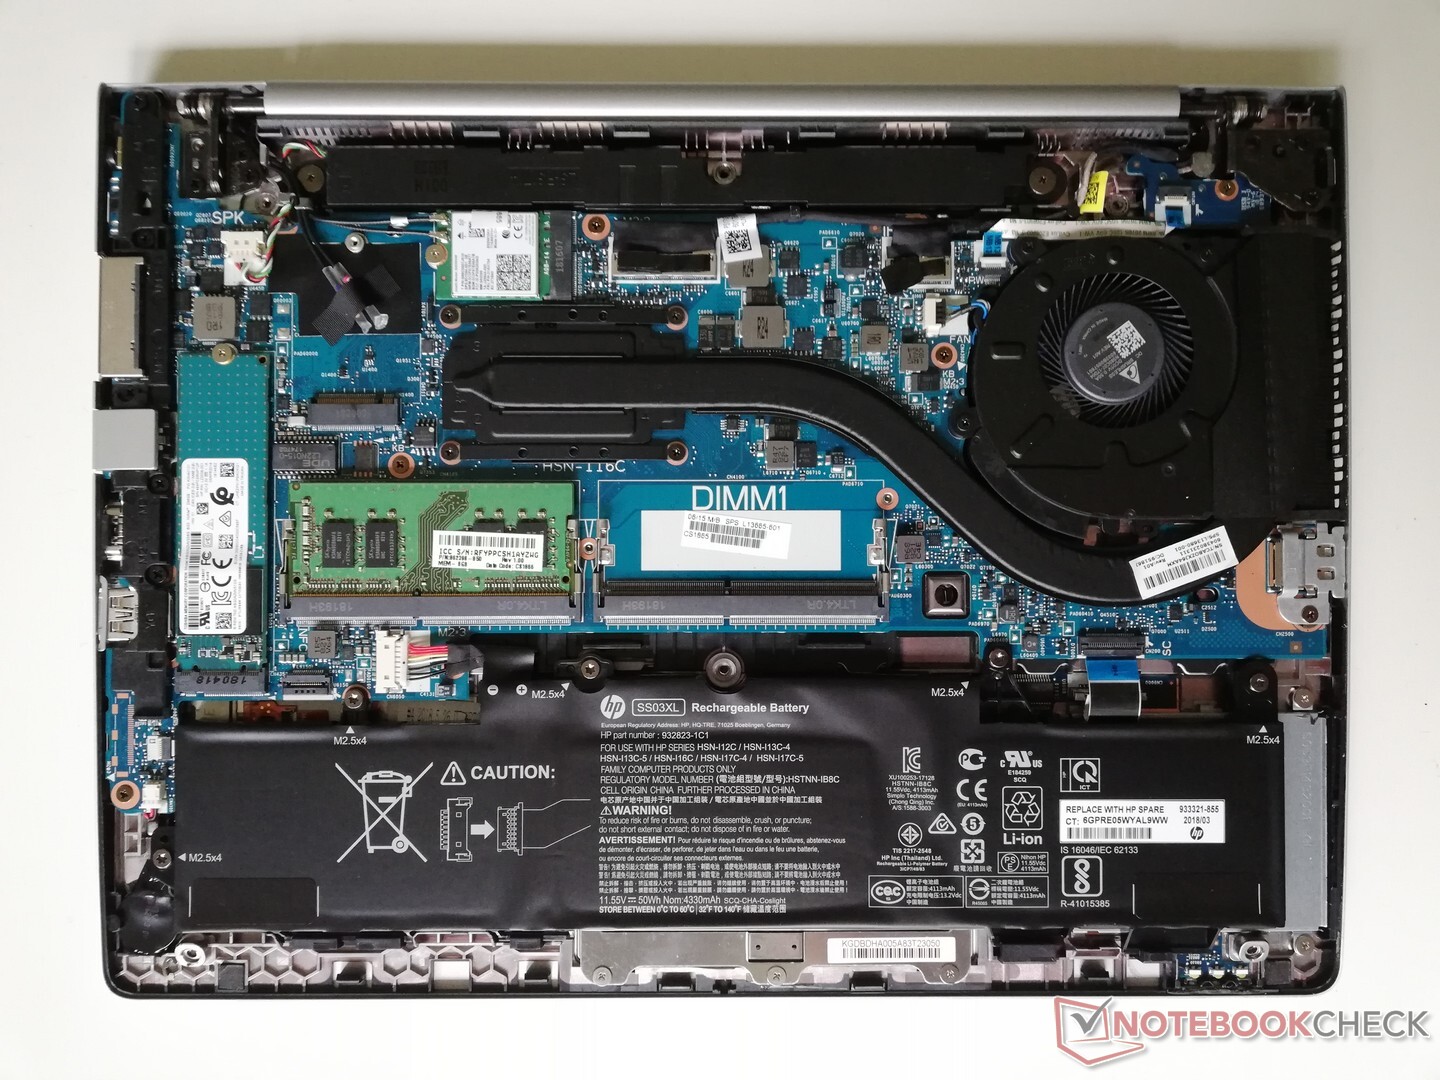
O EliteBook 735 G5 da HP impressiona particularmente com seu design atraente, que é adequado para todos os ambientes de negócios. A configuração de hardware é boa o suficiente para aplicativos de escritório não diários e os desenvolvedores podem fazer a manutenção eles mesmos no dispositivo com um pouco de esforço.
Os compradores do HP EliteBook 735 G5 podem esperar um portátil empresarial de 13 polegadas de alto desempenho. Embora a HP pudesse ter tirado mais do hardware.
Com o EliteBook 735 G5, embora a HP ofereça um dispositivo de 13 polegadas de alto desempenho, a configuração de hardware fica aquém de suas capacidades. Sob uso intenso, o desempenho cai cerca de 15% após um curto período de tempo e o portátil de negócios experimenta um afogamento considerável durante o teste de estresse. Isso não importa para o uso diário no escritório, já que o sistema executa todas as suas tarefas sem problemas. Isso ainda faz com que o EliteBook 735 G5 receba uma recomendação.
HP EliteBook 735 G5 3UN62EA
- 09/13/2018 v6 (old)
Mike Wobker