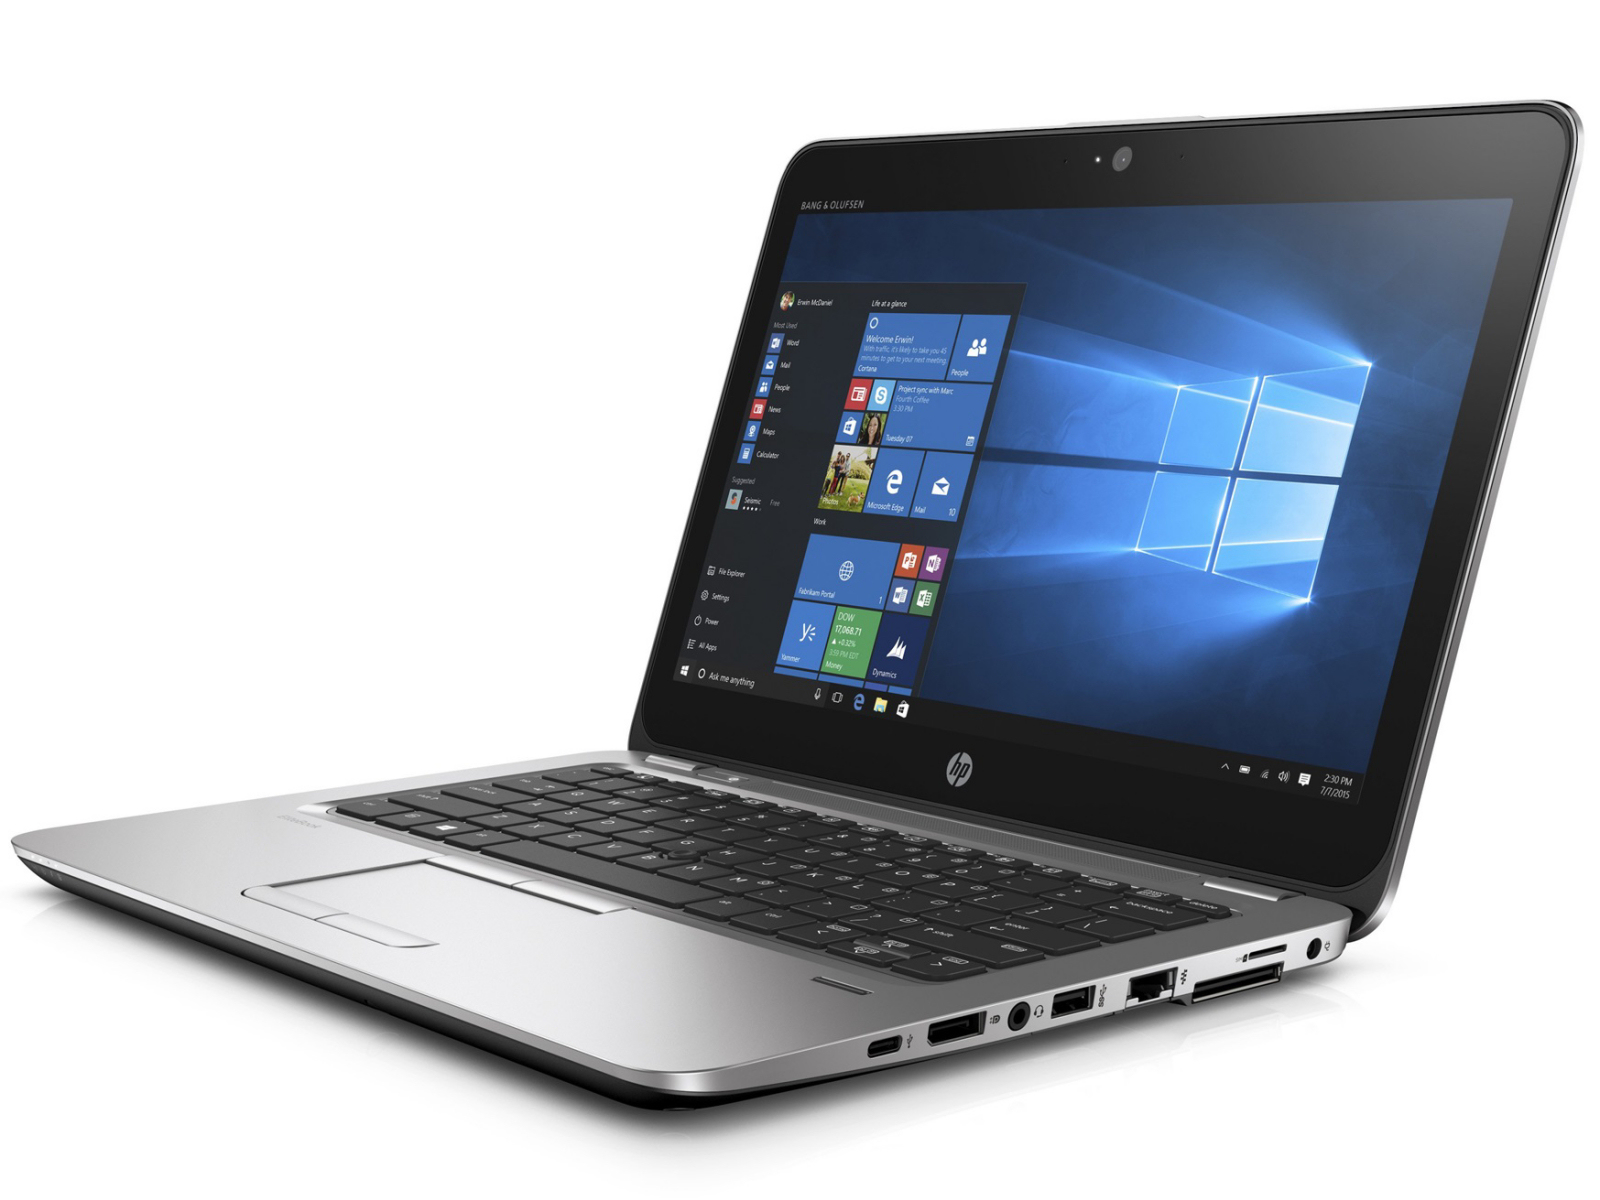
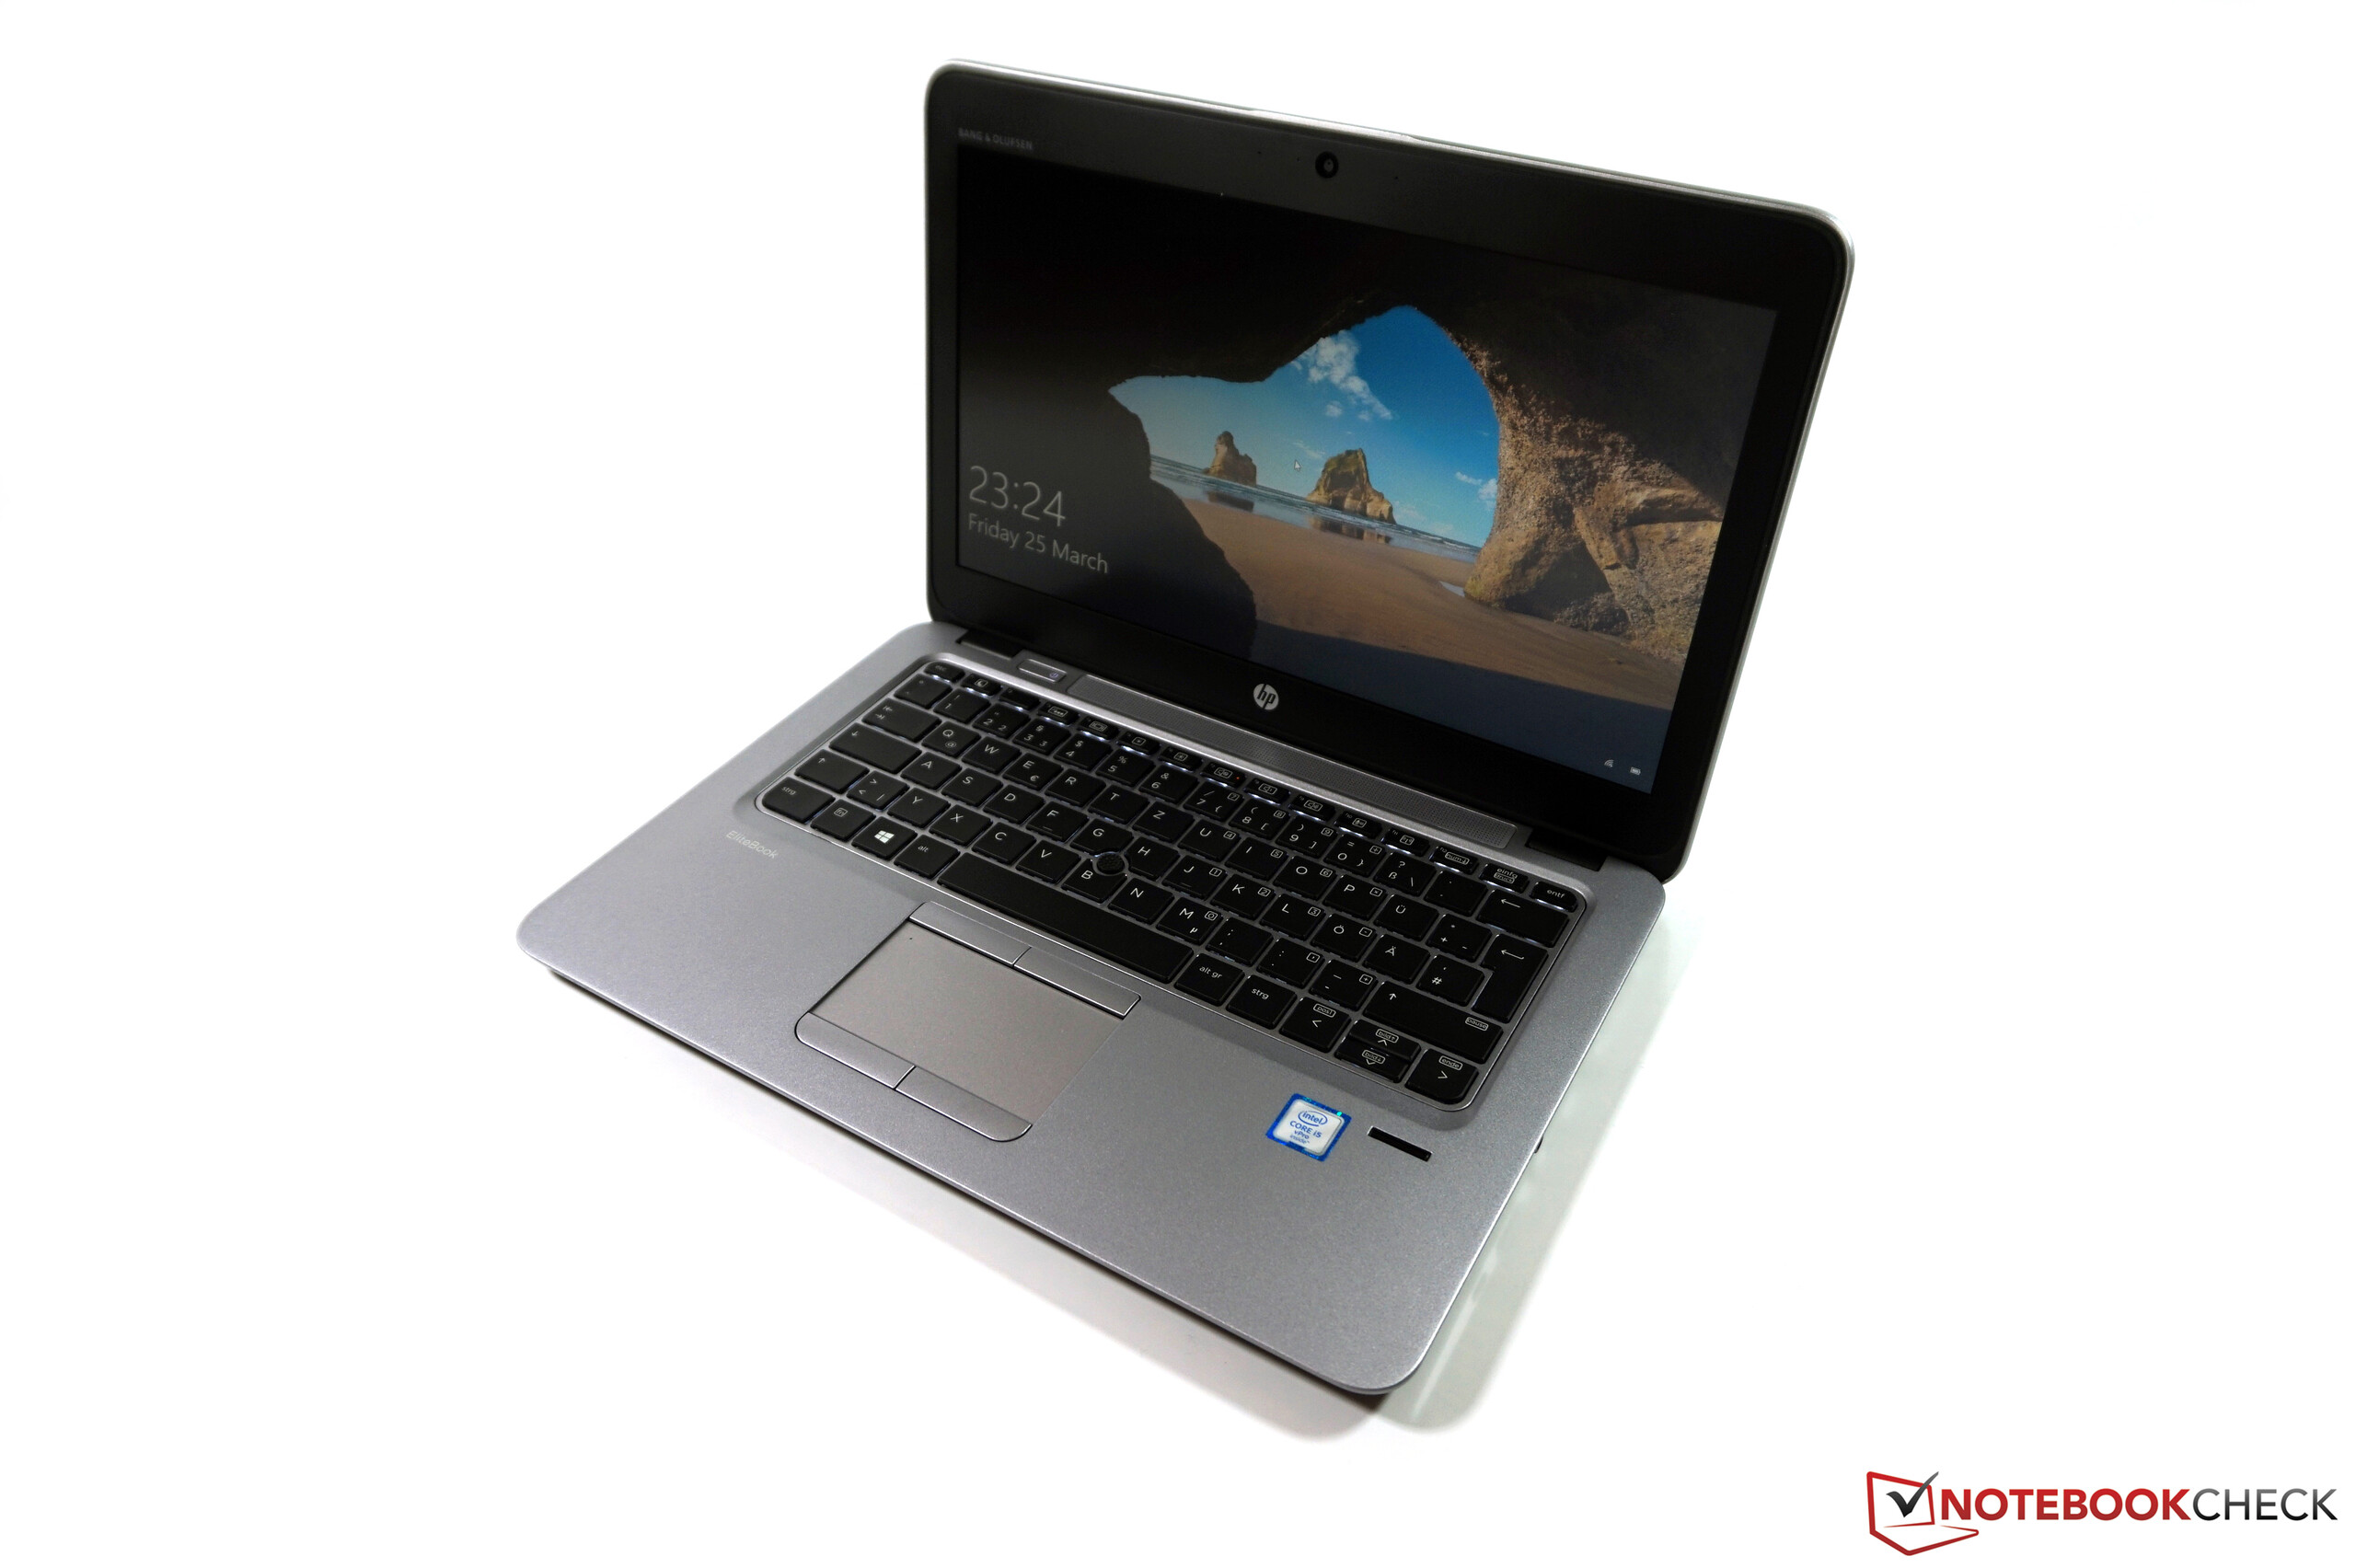
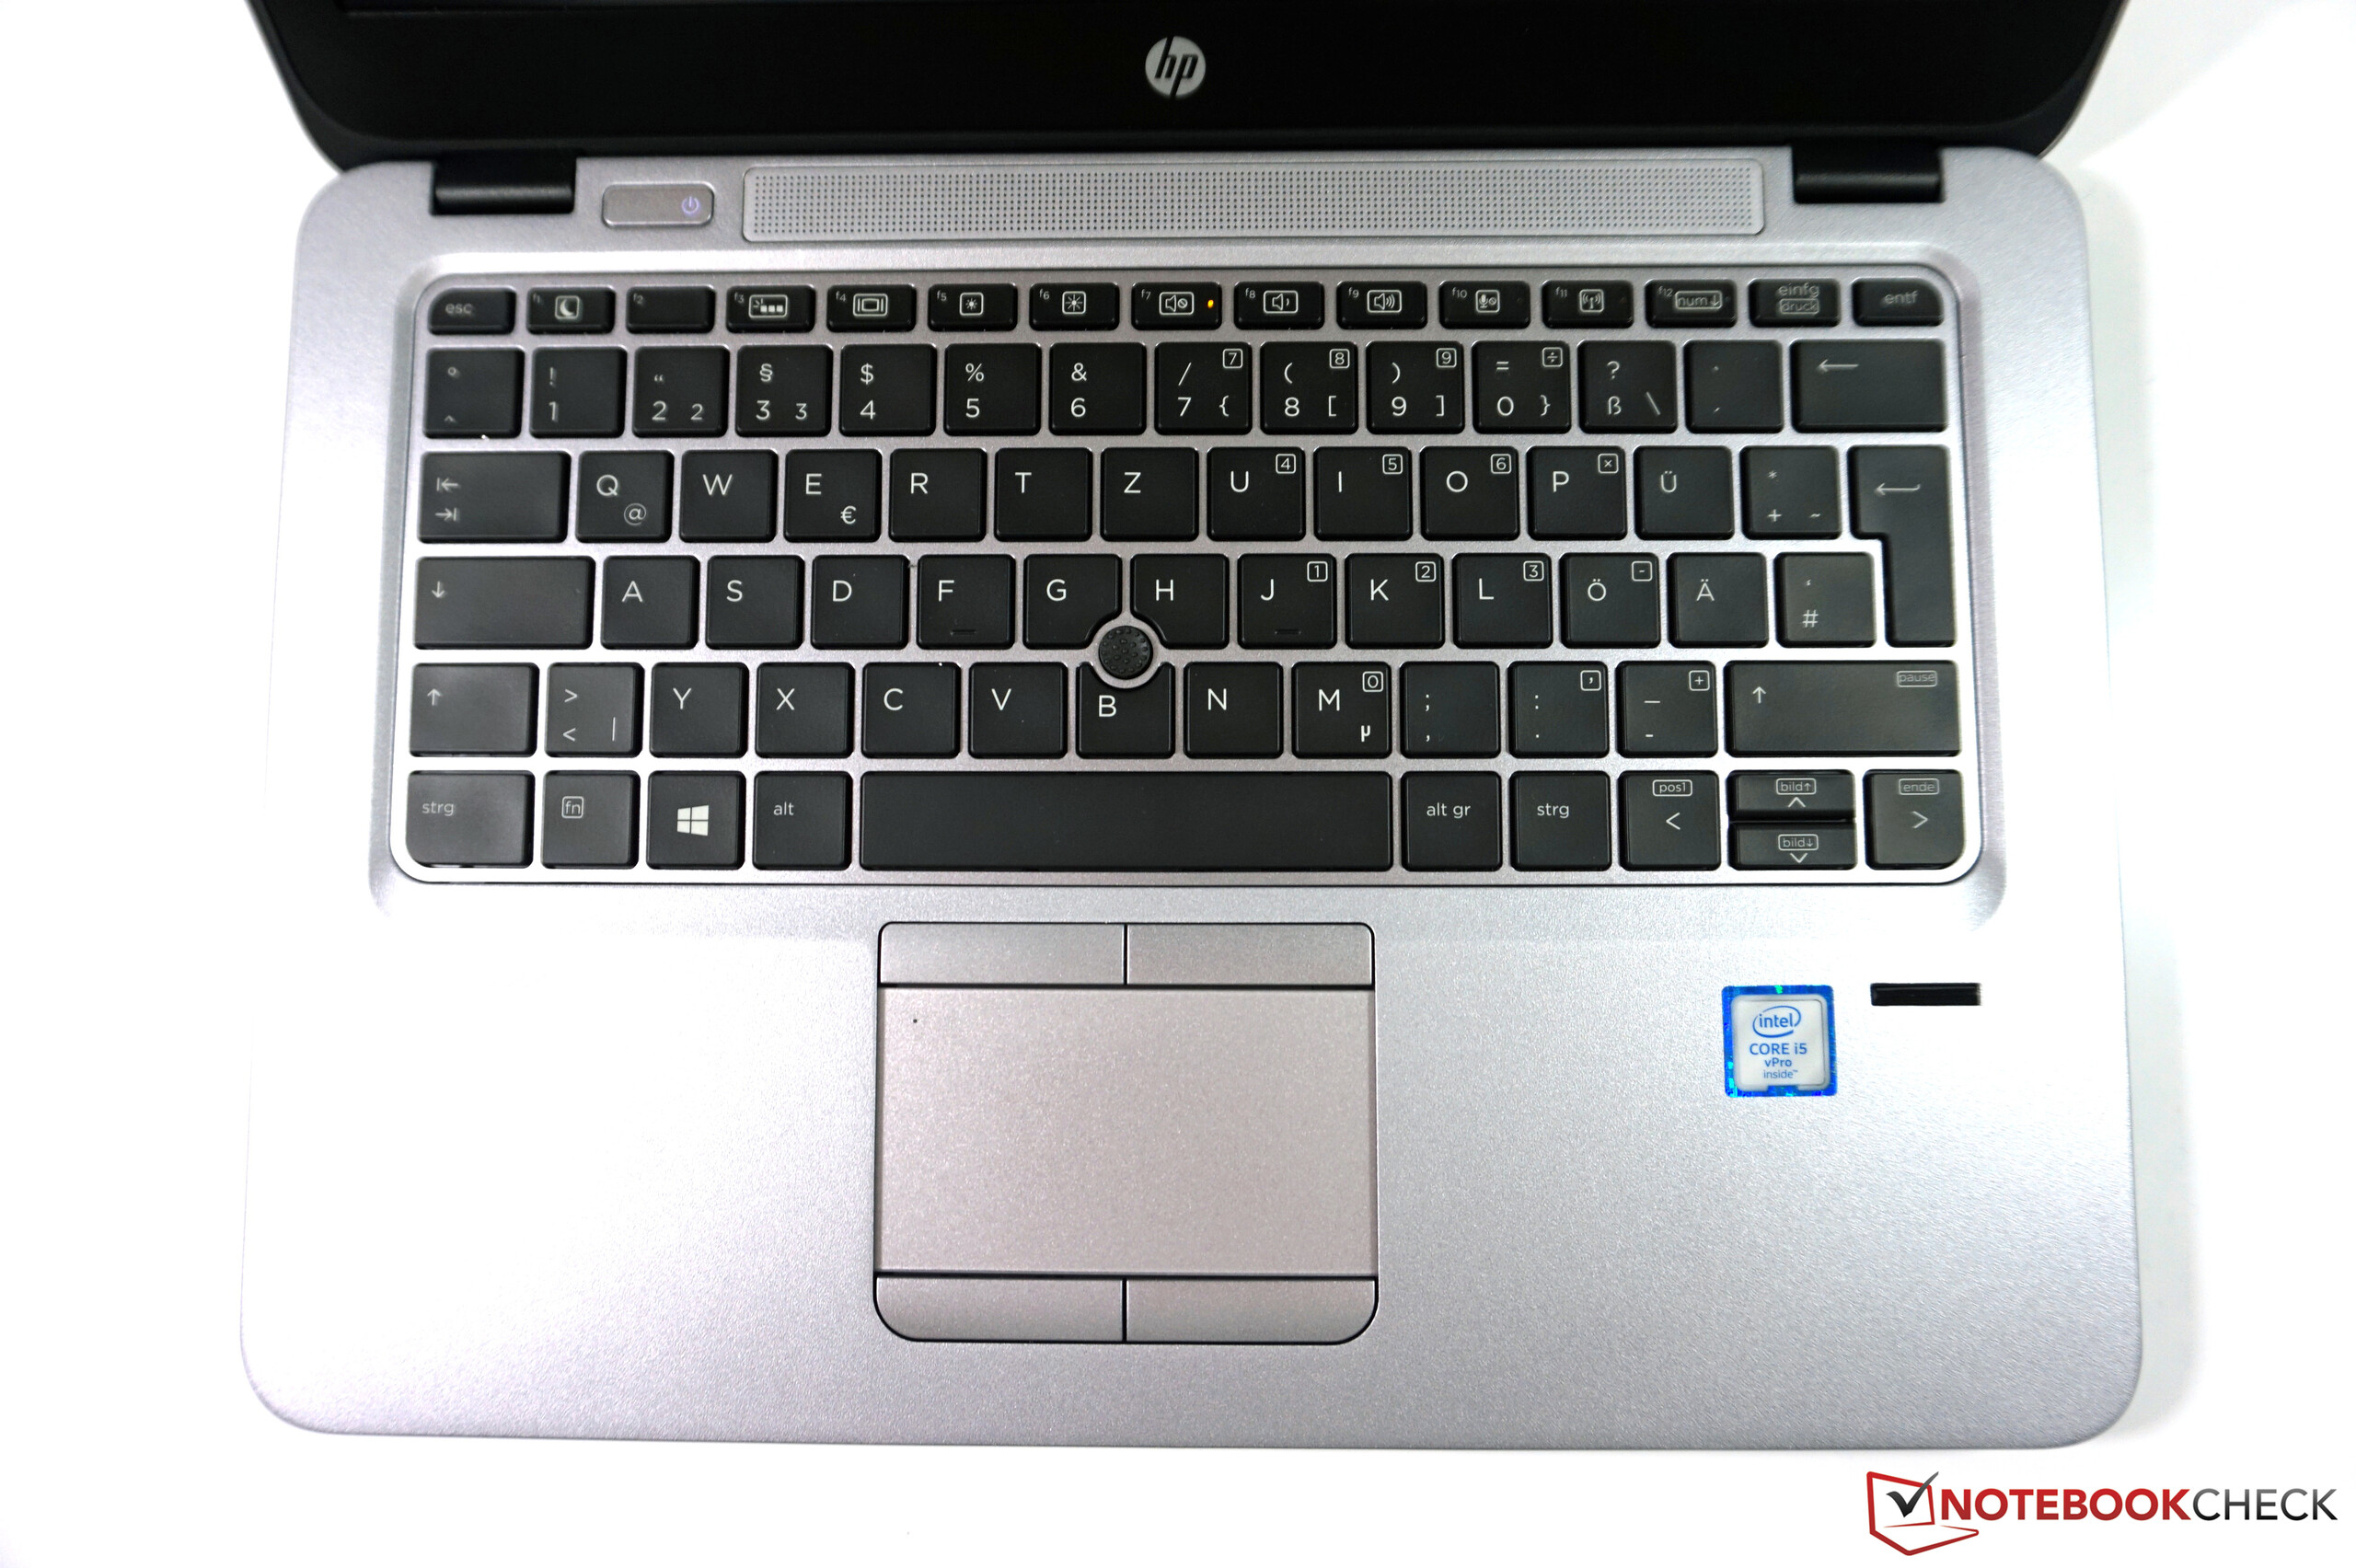
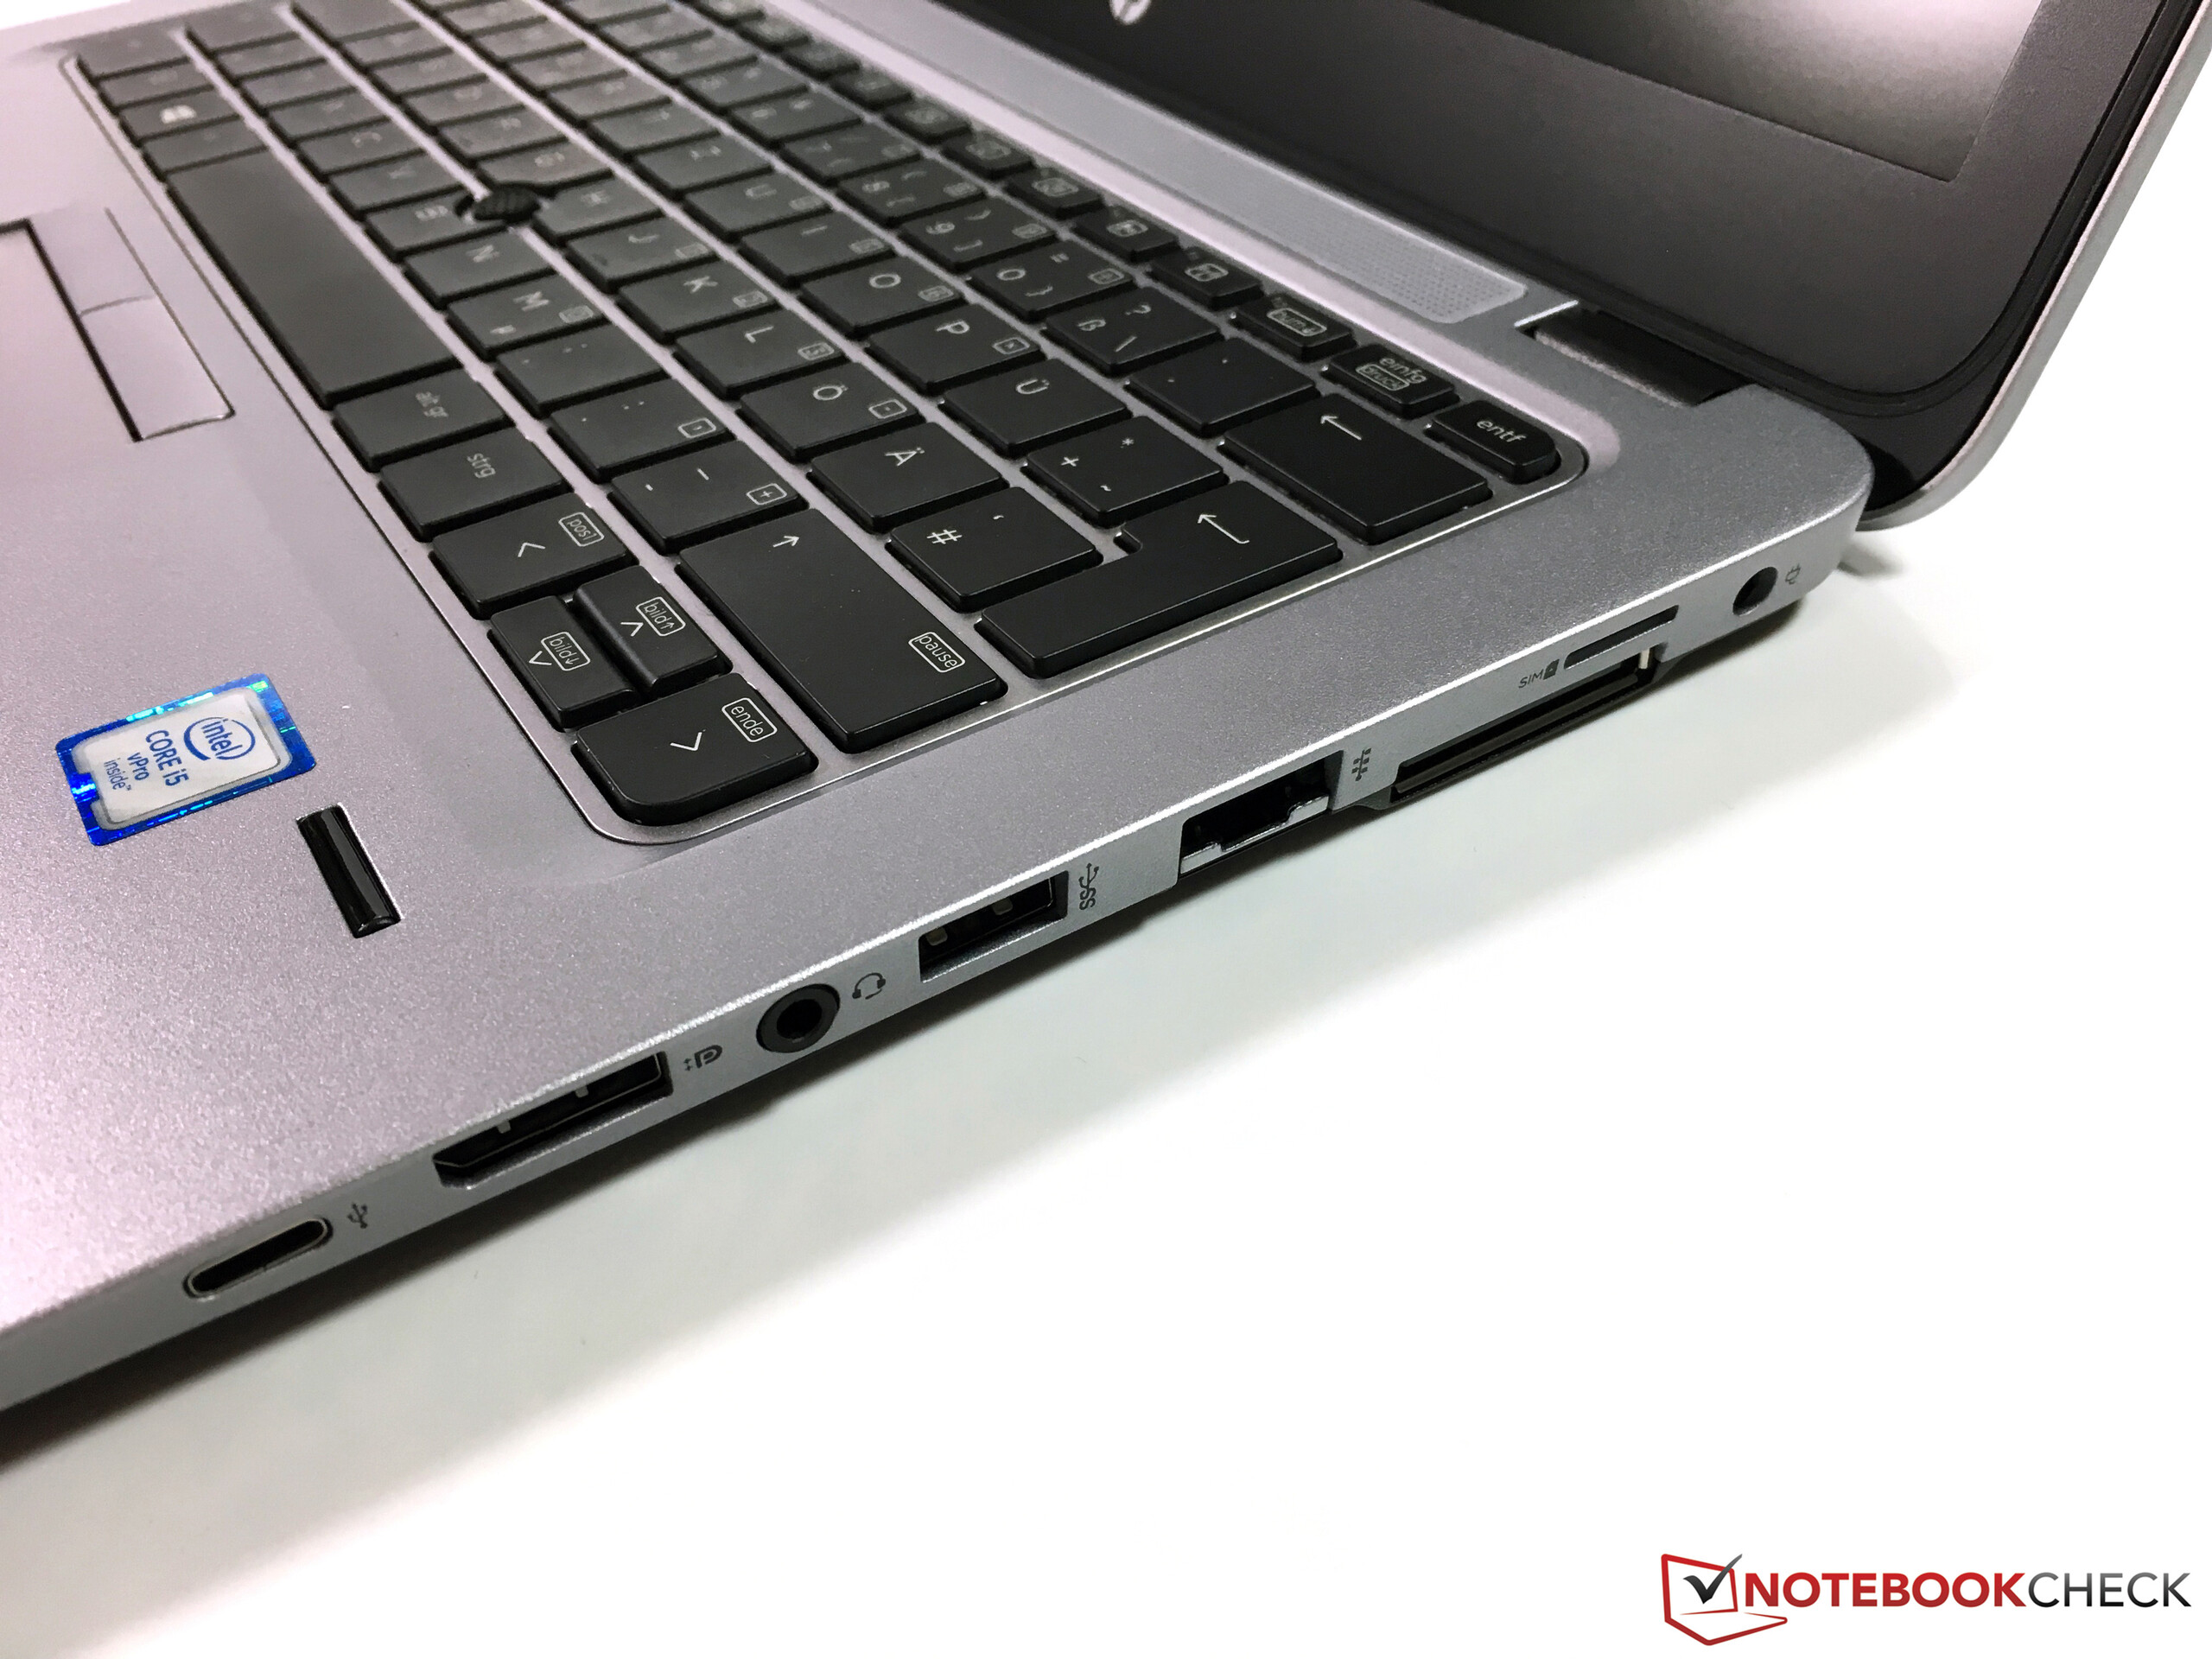
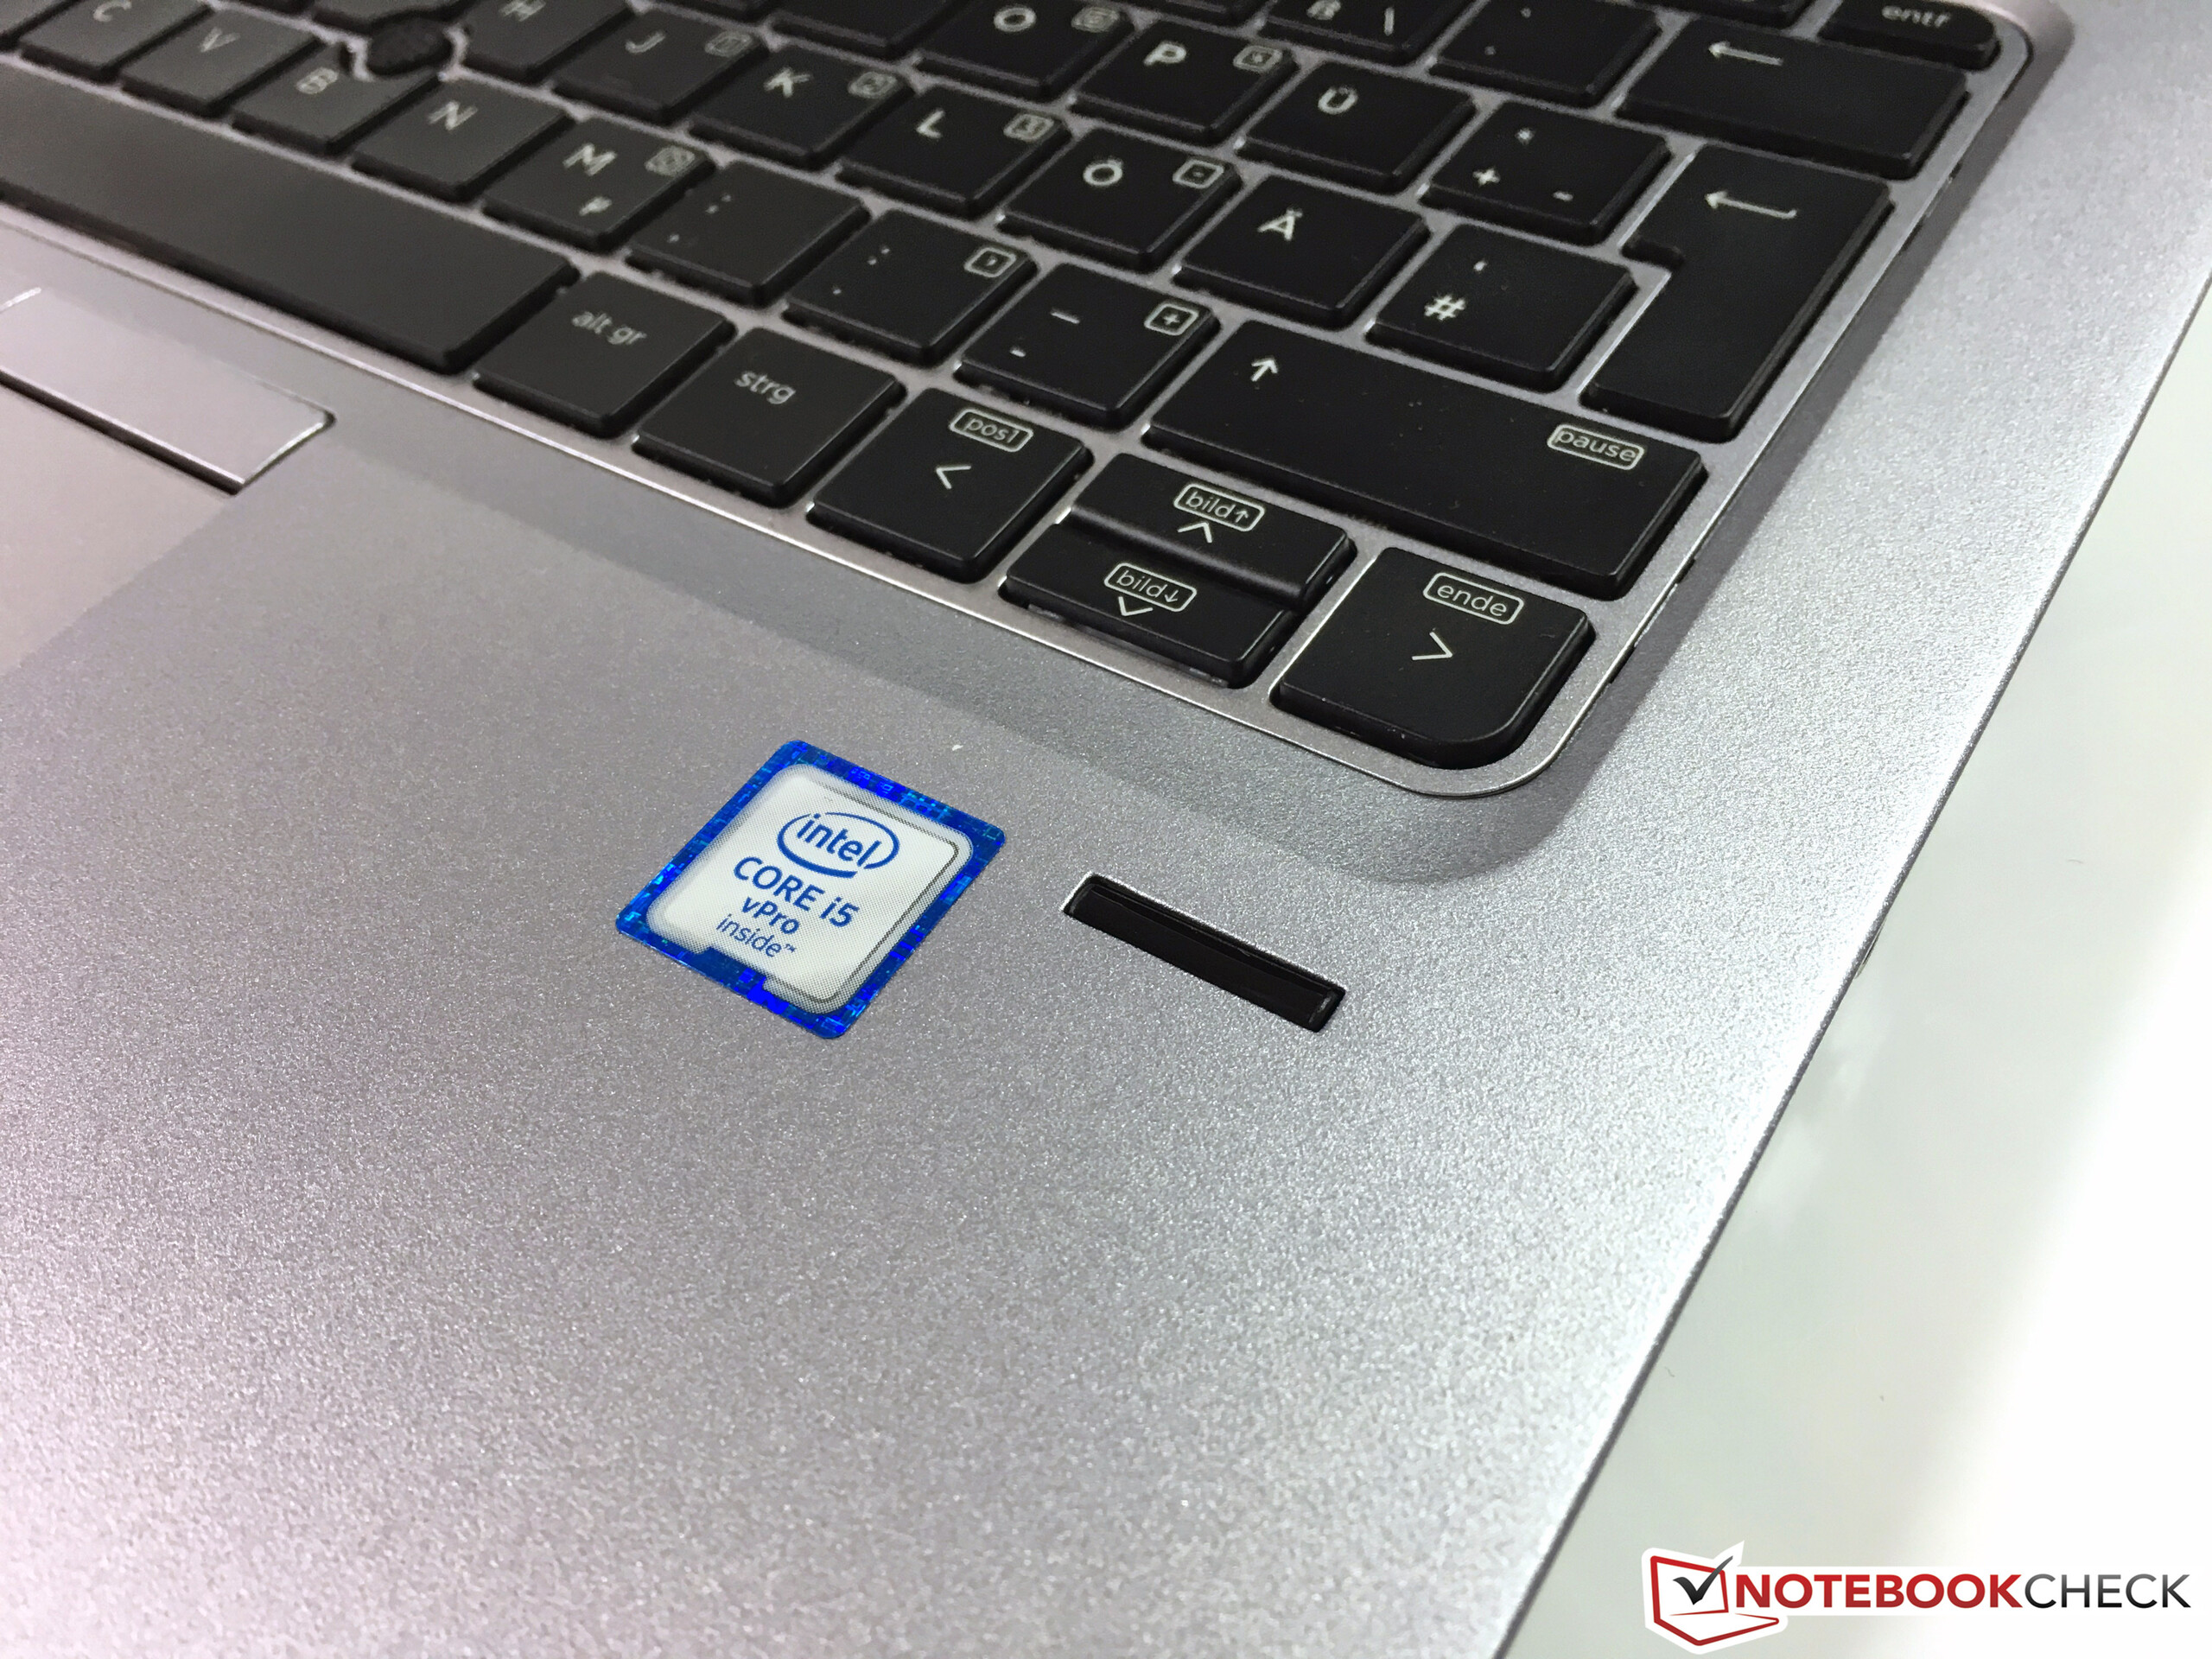
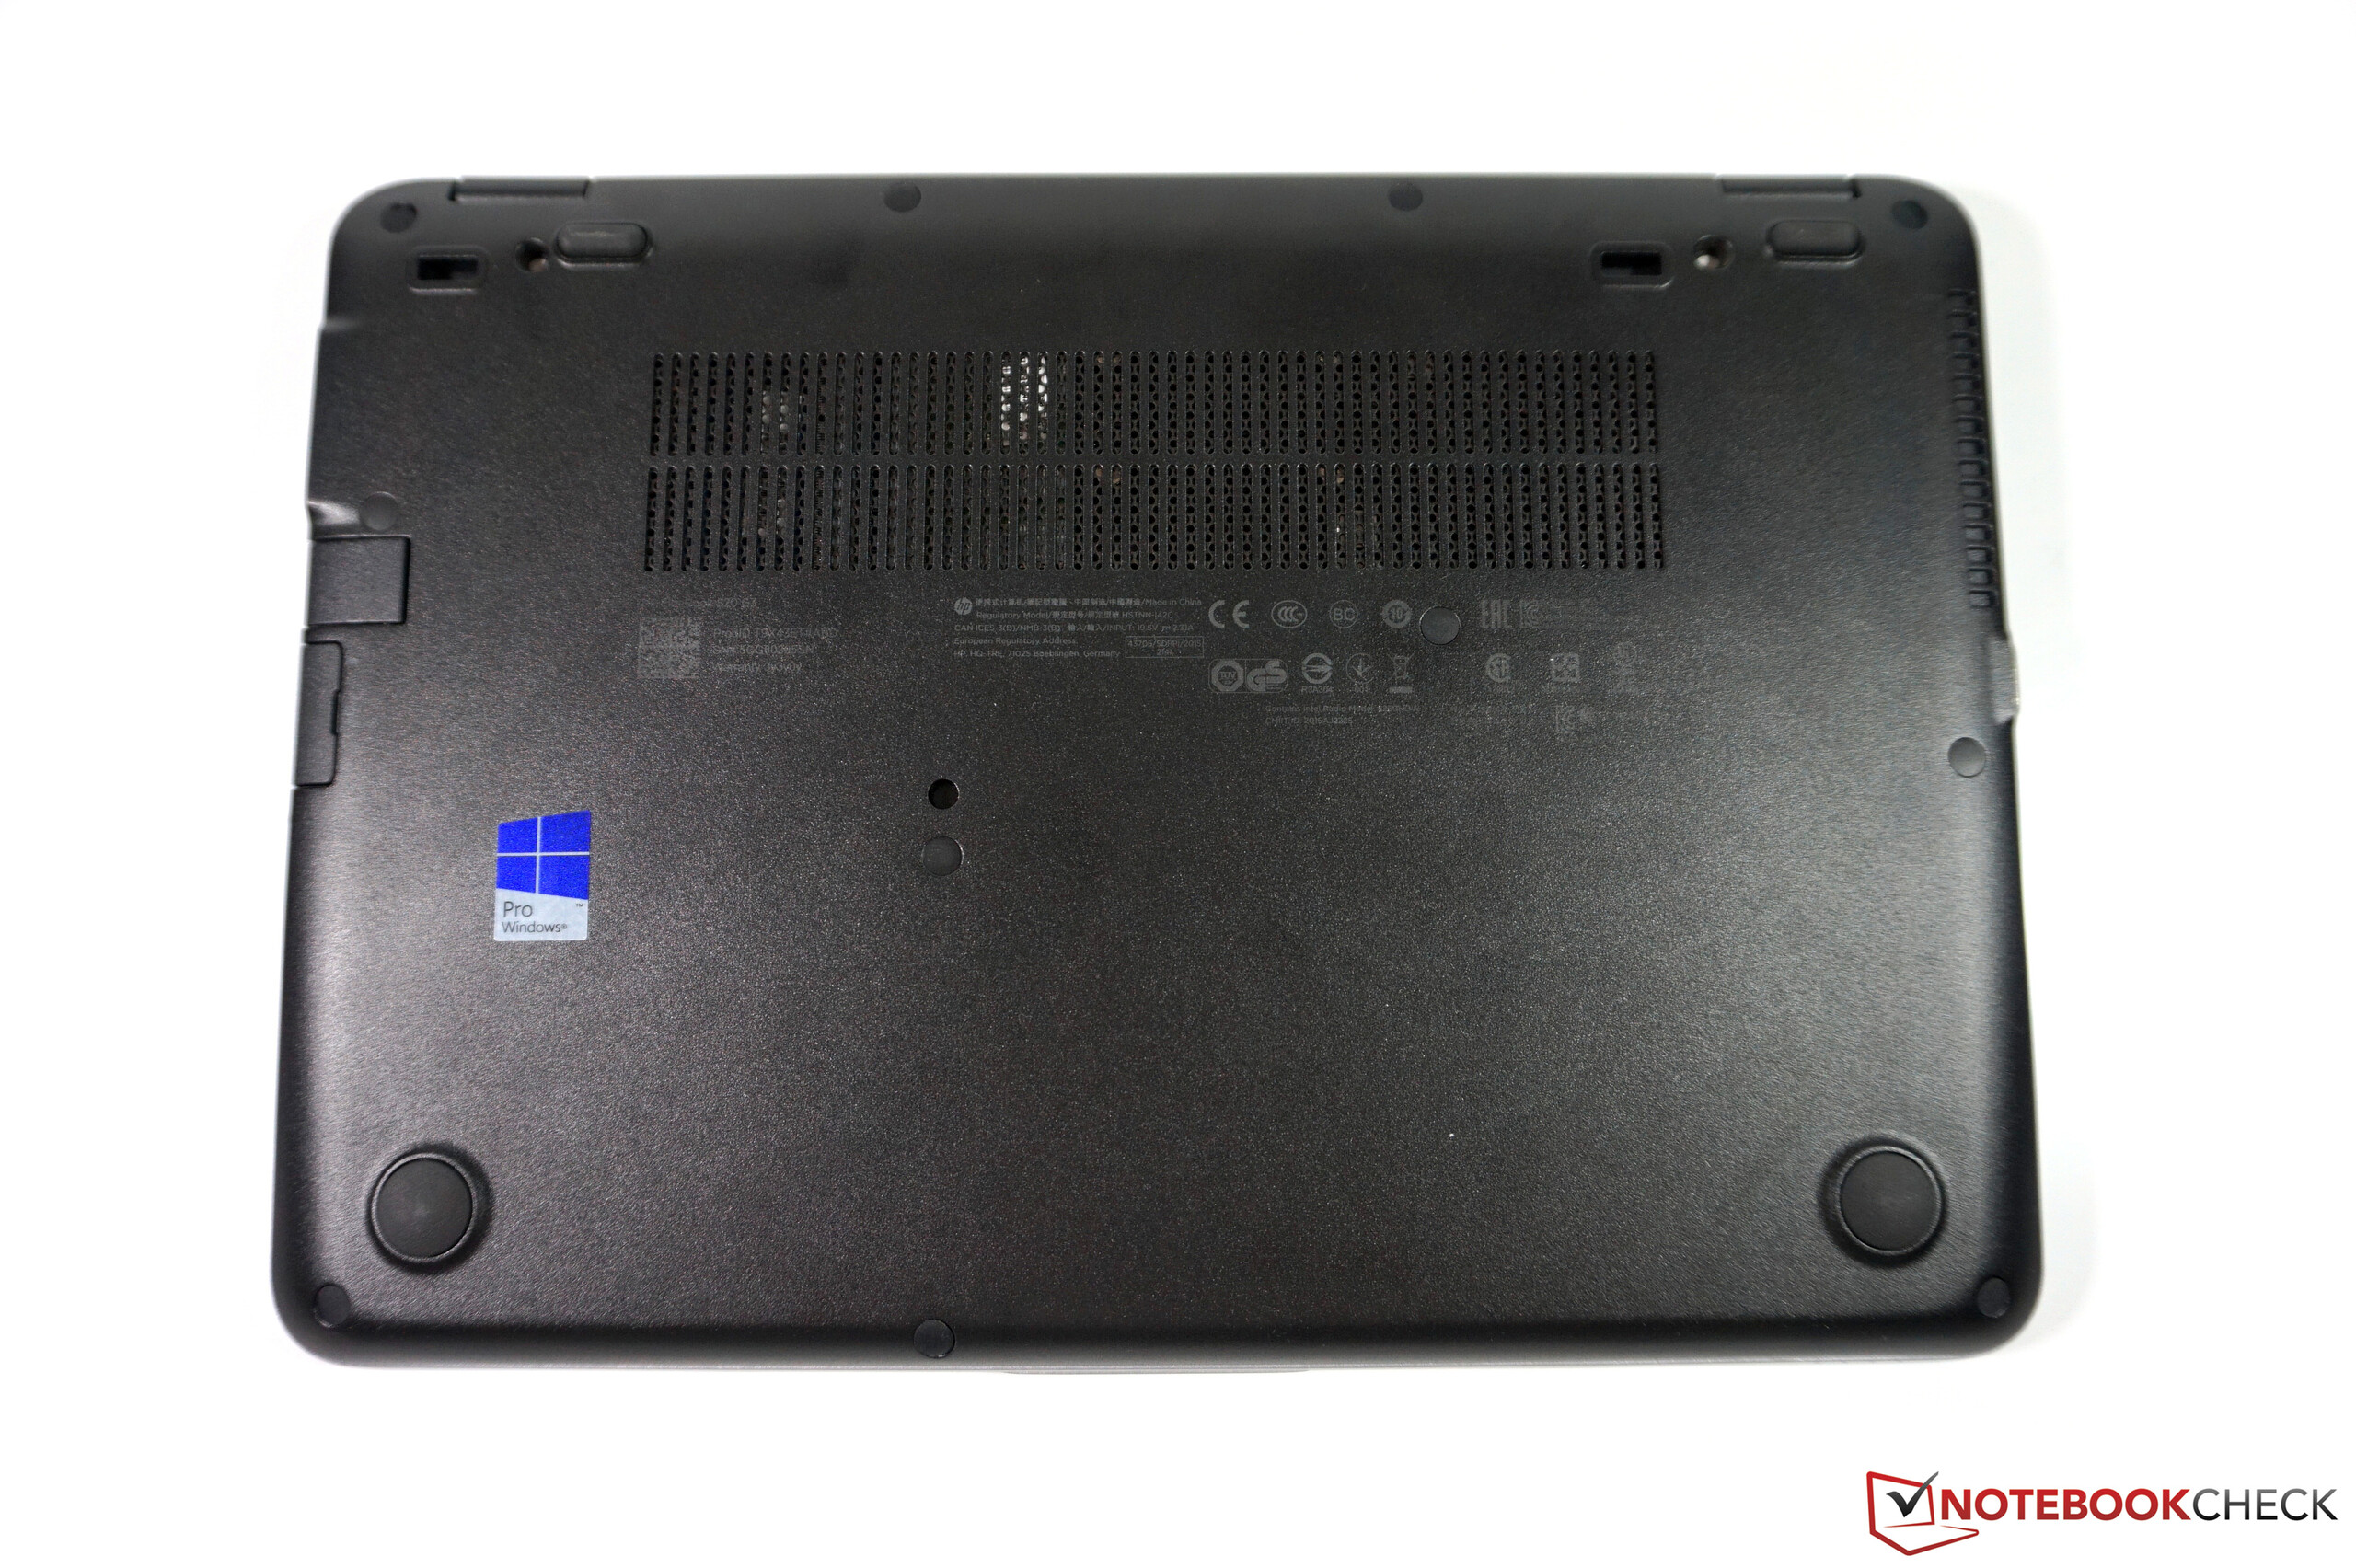
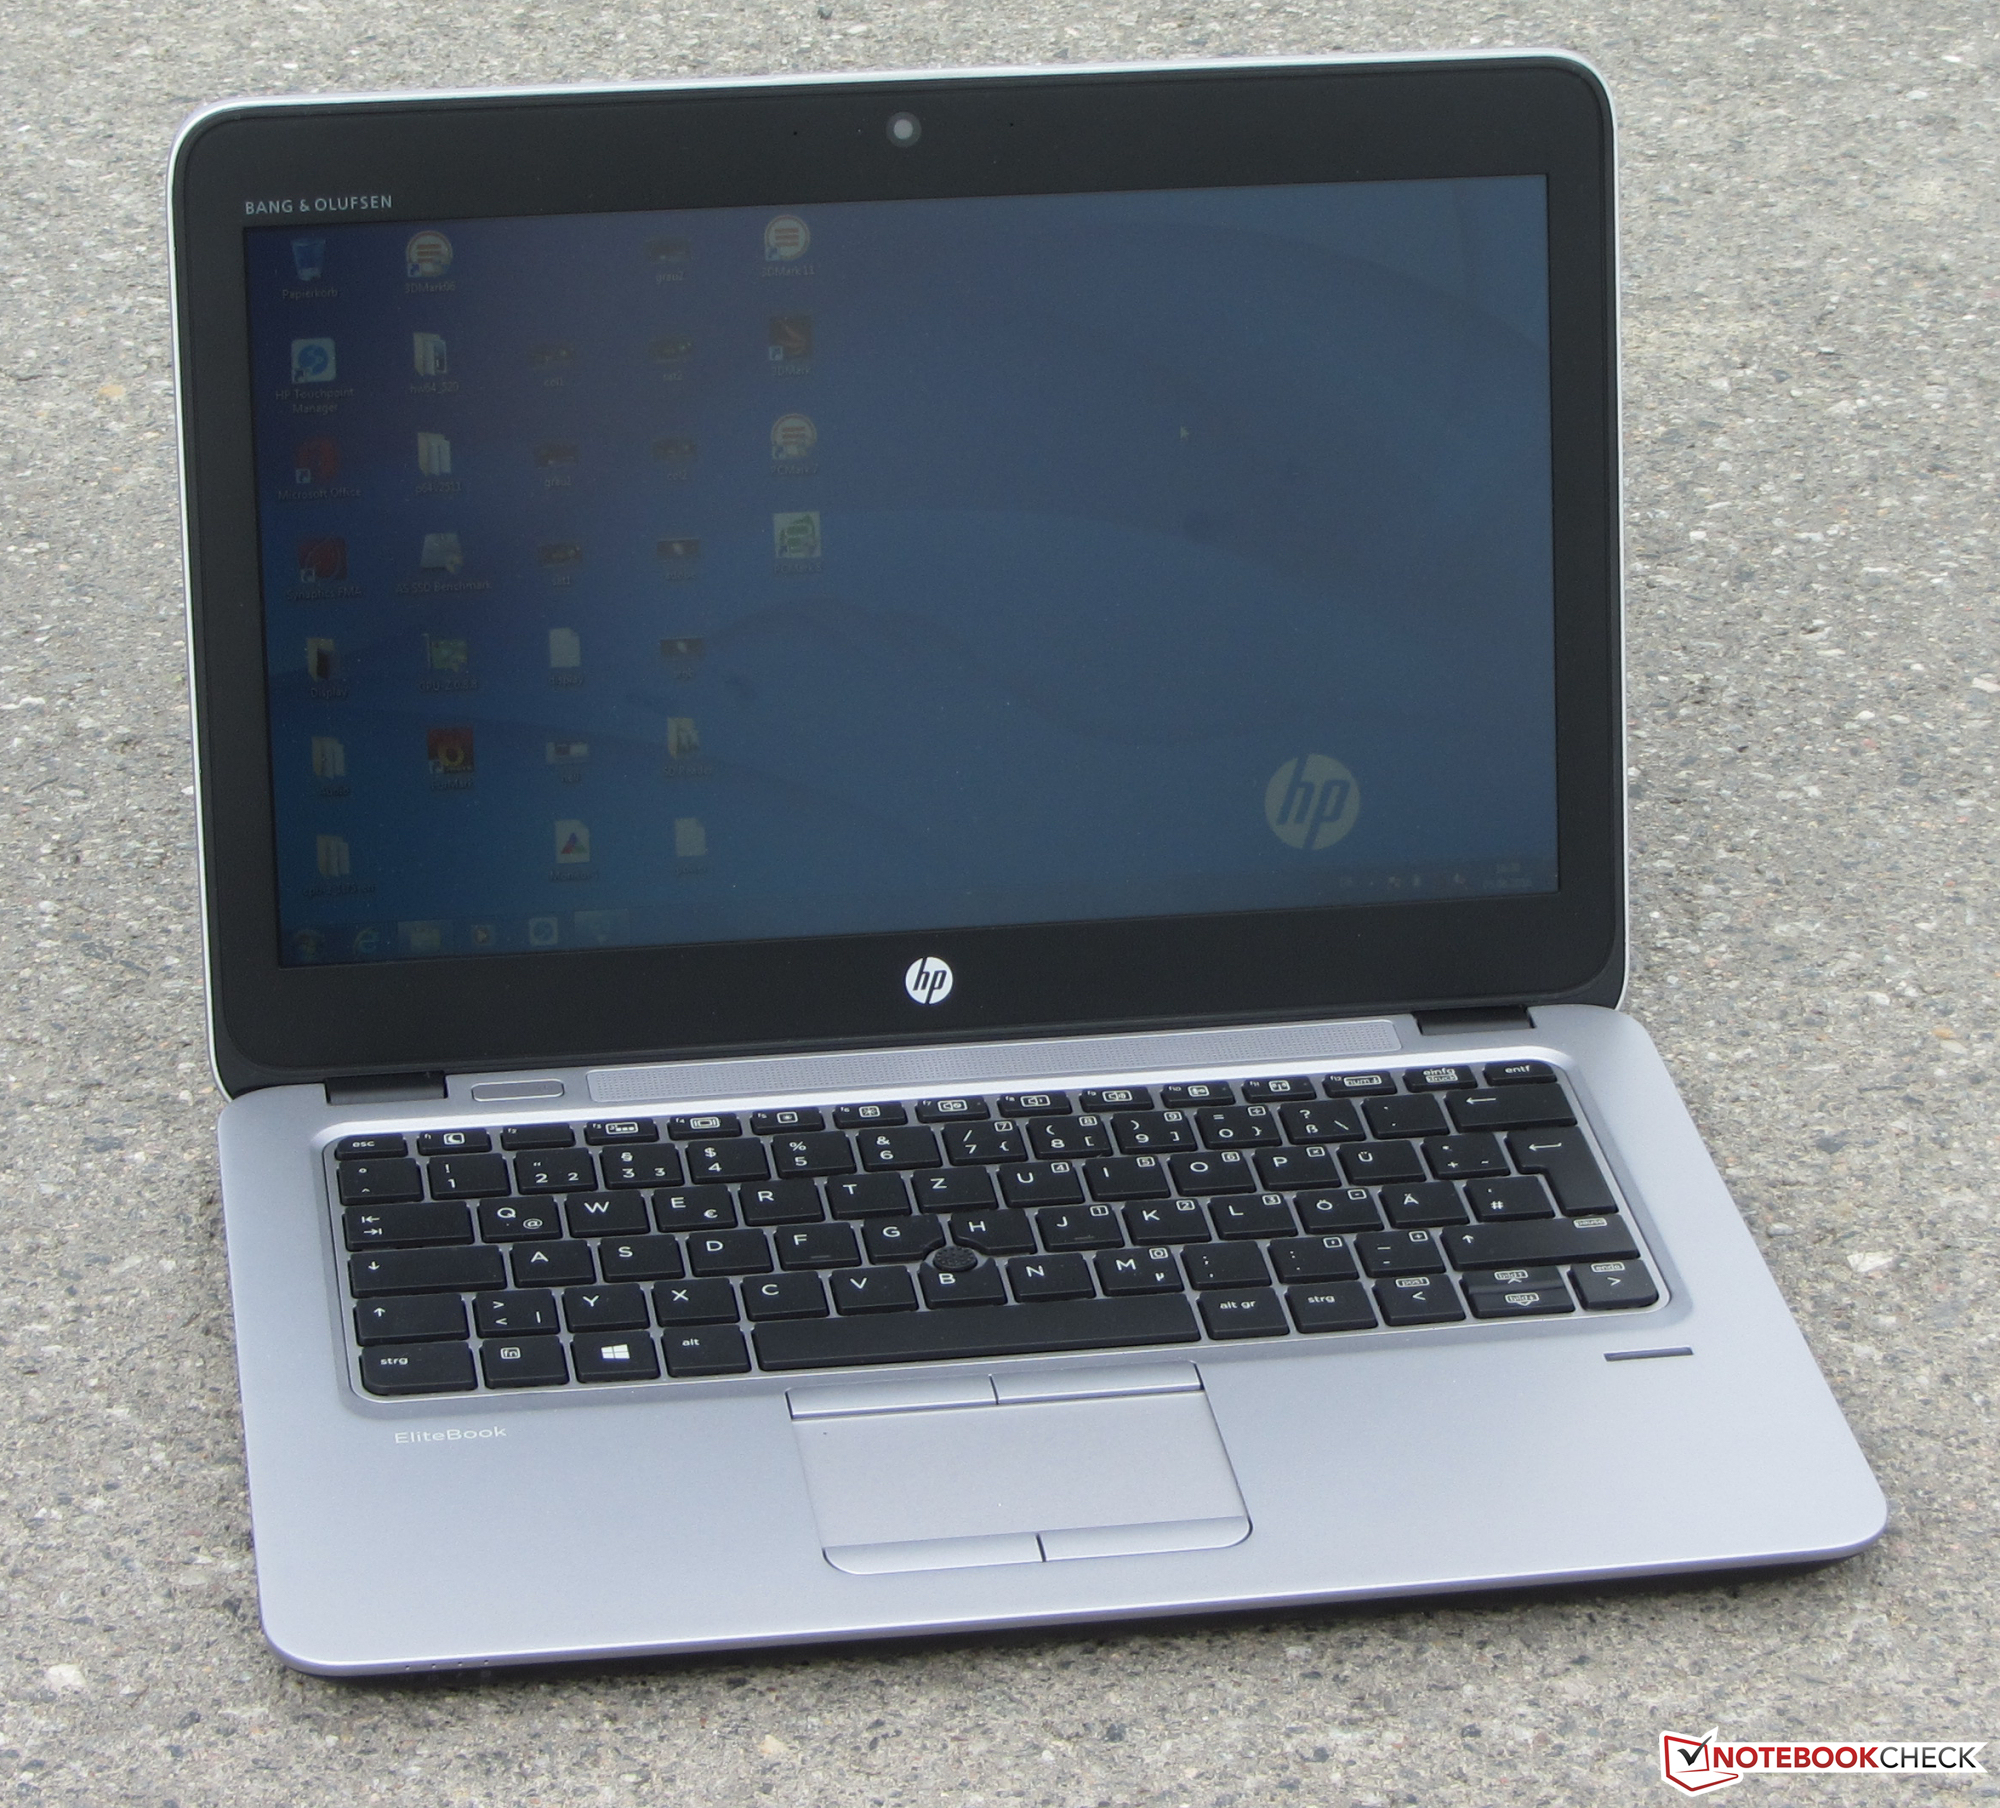
Breve Análise do Subportátil HP EliteBook 725 G3
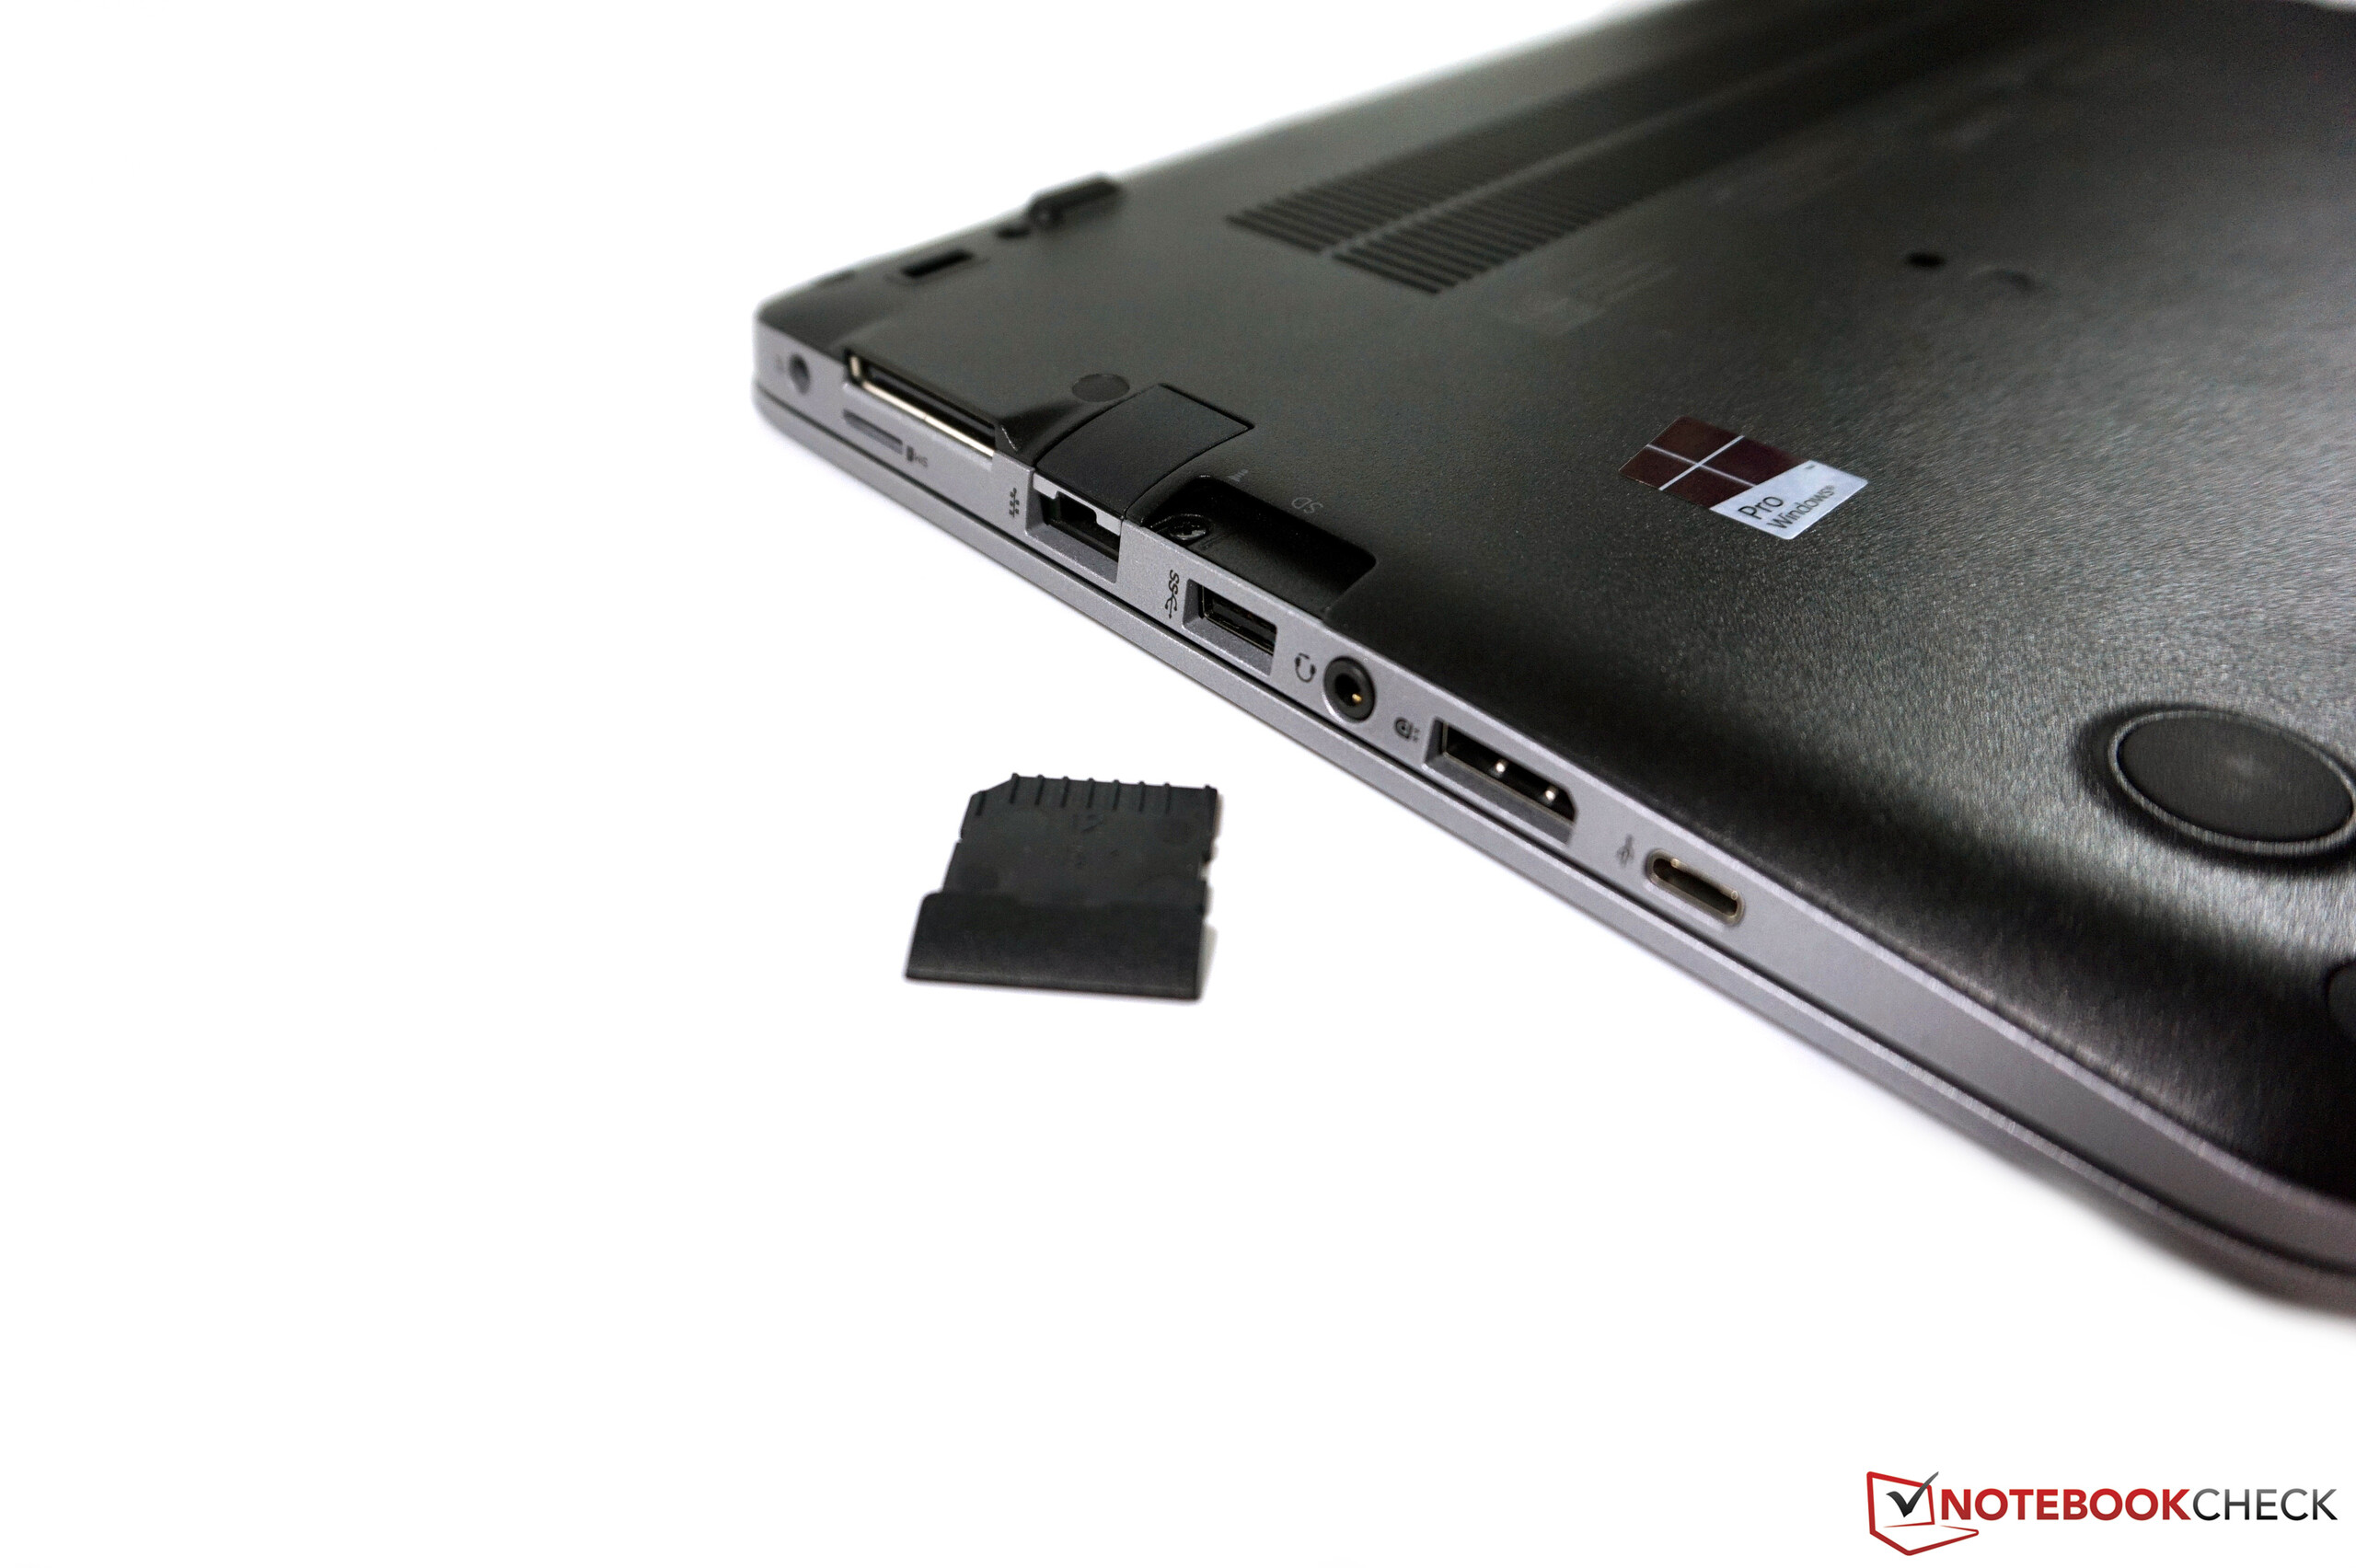
| SD Card Reader | |
| average JPG Copy Test (av. of 3 runs) | |
| HP EliteBook 820 G3 | |
| Lenovo ThinkPad X260-20F60041GE | |
| HP EliteBook 725 G3-P4T48EA | |
| maximum AS SSD Seq Read Test (1GB) | |
| Dell Latitude 12 E5270 | |
| HP EliteBook 820 G3 | |
| Lenovo ThinkPad X260-20F60041GE | |
| HP EliteBook 725 G3-P4T48EA | |
| Networking | |
| iperf Server (receive) TCP 1 m | |
| Apple MacBook 12 (Early 2016) 1.1 GHz | |
| iperf Client (transmit) TCP 1 m | |
| Apple MacBook 12 (Early 2016) 1.1 GHz | |
| |||||||||||||||||||||||||
iluminação: 83 %
iluminação com acumulador: 239 cd/m²
Contraste: 446:1 (Preto: 0.54 cd/m²)
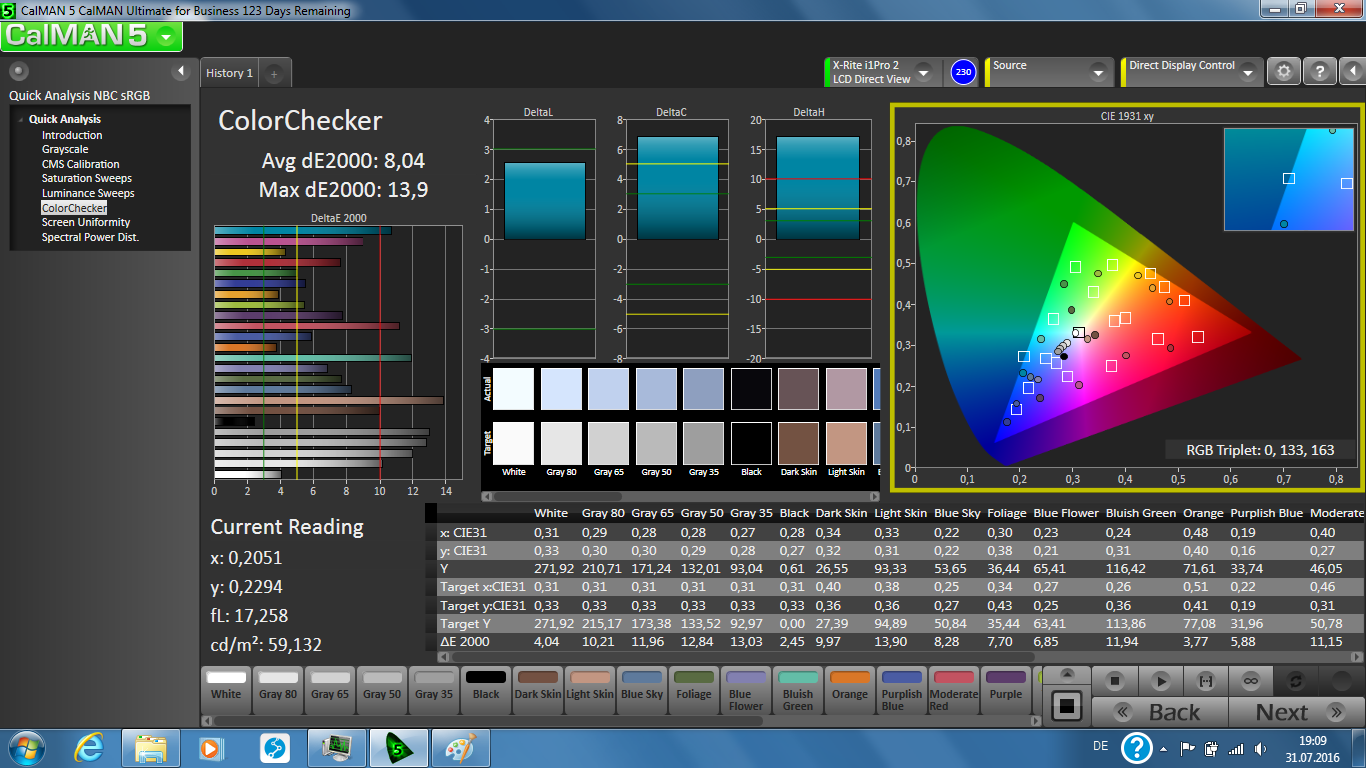
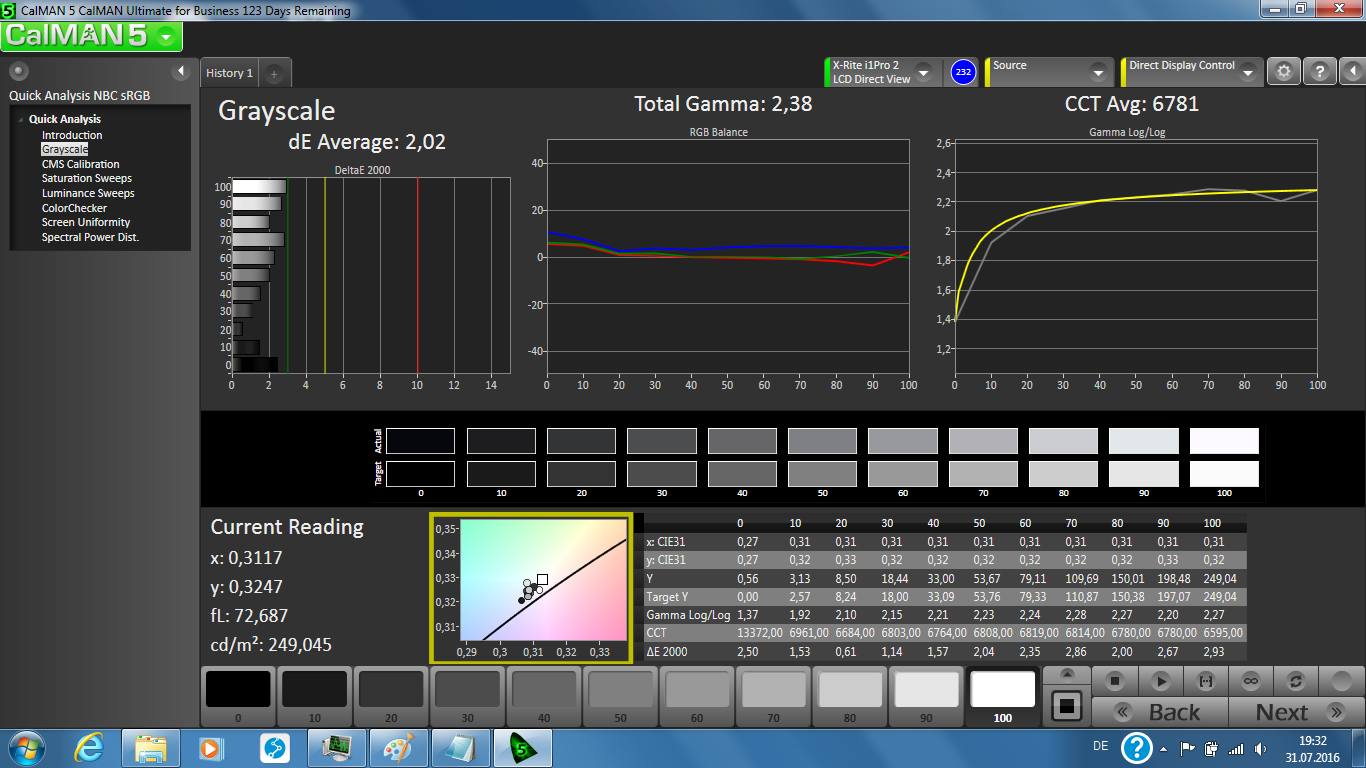
ΔE ColorChecker Calman: 8.04 | ∀{0.5-29.43 Ø4.71}
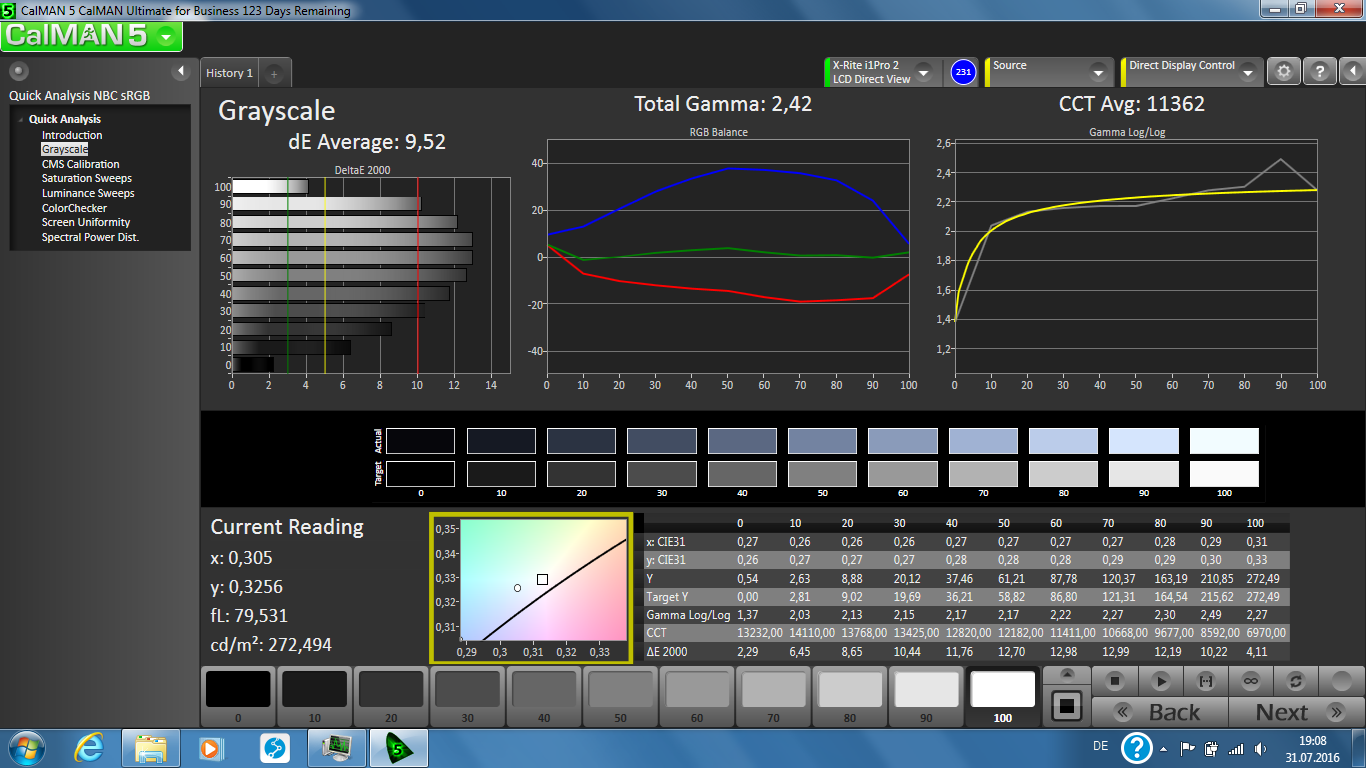
ΔE Greyscale Calman: 9.52 | ∀{0.09-98 Ø4.96}
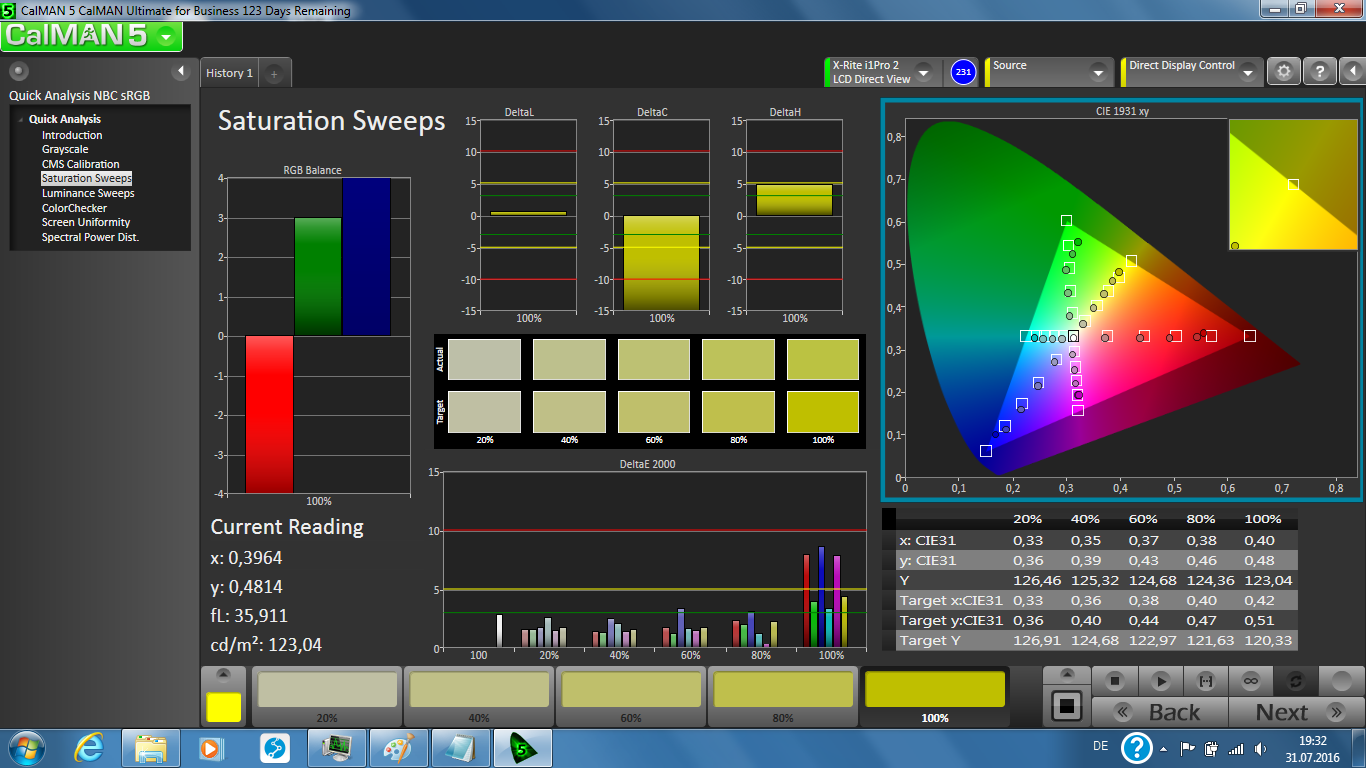
71.12% sRGB (Argyll 1.6.3 3D)
45.03% AdobeRGB 1998 (Argyll 1.6.3 3D)
48.71% AdobeRGB 1998 (Argyll 3D)
71% sRGB (Argyll 3D)
47.15% Display P3 (Argyll 3D)
Gamma: 2.42
CCT: 11362 K
| HP EliteBook 725 G3-P4T48EA TN LED, 1366x768 | HP EliteBook 725 G2 TN-Panel, 1366x768 | Dell Latitude 12 E5270 TN, 1366x768 | Lenovo ThinkPad X260-20F60041GE IPS, 1366x768 | Toshiba Portege Z30-C-125 IPS, 1920x1080 | HP EliteBook 820 G3 TN LED, 1366x768 | Apple MacBook 12 (Early 2016) 1.1 GHz IPS, 2304x1440 | |
|---|---|---|---|---|---|---|---|
| Display | -14% | -17% | 2% | 46% | -17% | 39% | |
| Display P3 Coverage (%) | 47.15 | 40.56 -14% | 39.06 -17% | 48.19 2% | 72.3 53% | 38.9 -17% | 66.8 42% |
| sRGB Coverage (%) | 71 | 61 -14% | 58.7 -17% | 72.6 2% | 93.8 32% | 58.5 -18% | 95.4 34% |
| AdobeRGB 1998 Coverage (%) | 48.71 | 41.92 -14% | 40.36 -17% | 49.79 2% | 73.8 52% | 40.2 -17% | 68 40% |
| Response Times | 5% | 1% | -19% | -5% | |||
| Response Time Grey 50% / Grey 80% * (ms) | 50 ? | 45.2 ? 10% | 42.8 ? 14% | 58 ? -16% | 41.2 ? 18% | ||
| Response Time Black / White * (ms) | 24 ? | 24 ? -0% | 27.2 ? -13% | 29.2 ? -22% | 30.4 ? -27% | ||
| PWM Frequency (Hz) | 1000 ? | 220 ? | |||||
| Screen | -30% | -11% | 42% | 63% | -8% | 51% | |
| Brightness middle (cd/m²) | 241 | 188 -22% | 161 -33% | 262 9% | 367.1 52% | 244 1% | 387 61% |
| Brightness (cd/m²) | 240 | 186 -22% | 152 -37% | 251 5% | 341 42% | 240 0% | 358 49% |
| Brightness Distribution (%) | 83 | 91 10% | 90 8% | 88 6% | 85 2% | 84 1% | 88 6% |
| Black Level * (cd/m²) | 0.54 | 0.86 -59% | 0.29 46% | 0.26 52% | 0.3 44% | 0.6 -11% | 0.47 13% |
| Contrast (:1) | 446 | 219 -51% | 555 24% | 1008 126% | 1224 174% | 407 -9% | 823 85% |
| Colorchecker dE 2000 * | 8.04 | 12.31 -53% | 10.31 -28% | 3.55 56% | 9 -12% | 1.6 80% | |
| Colorchecker dE 2000 max. * | 13.9 | 18.58 -34% | 5.85 58% | 15.73 -13% | 4 71% | ||
| Greyscale dE 2000 * | 9.52 | 12.56 -32% | 11.3 -19% | 3.36 65% | 9.48 -0% | 1 89% | |
| Gamma | 2.42 91% | 1.86 118% | 2.57 86% | 2.39 92% | 2.44 90% | 2.26 97% | |
| CCT | 11362 57% | 12047 54% | 13574 48% | 5985 109% | 11116 58% | 6680 97% | |
| Color Space (Percent of AdobeRGB 1998) (%) | 45.03 | 38.6 -14% | 37.32 -17% | 45.9 2% | 37.18 -17% | 61.6 37% | |
| Color Space (Percent of sRGB) (%) | 71.12 | 58.82 -17% | 58.63 -18% | 82.2 16% | |||
| Média Total (Programa/Configurações) | -22% /
-26% | -8% /
-10% | 15% /
28% | 55% /
56% | -15% /
-11% | 28% /
41% |
* ... menor é melhor
Cintilação da tela / PWM (modulação por largura de pulso)
| Tela tremeluzindo / PWM não detectado | ||
[pwm_comparison] Em comparação: 52 % de todos os dispositivos testados não usam PWM para escurecer a tela. Se PWM foi detectado, uma média de 7757 (mínimo: 5 - máximo: 343500) Hz foi medida. | ||
Exibir tempos de resposta
| ↔ Tempo de resposta preto para branco | ||
|---|---|---|
| 24 ms ... ascensão ↗ e queda ↘ combinadas | ↗ 20 ms ascensão | 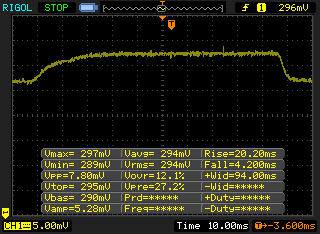 |
| ↘ 4 ms queda | ||
| A tela mostra boas taxas de resposta em nossos testes, mas pode ser muito lenta para jogadores competitivos. Em comparação, todos os dispositivos testados variam de 0.1 (mínimo) a 240 (máximo) ms. » 54 % de todos os dispositivos são melhores. Isso significa que o tempo de resposta medido é pior que a média de todos os dispositivos testados (19.8 ms). | ||
| ↔ Tempo de resposta 50% cinza a 80% cinza | ||
| 50 ms ... ascensão ↗ e queda ↘ combinadas | ↗ 27 ms ascensão | 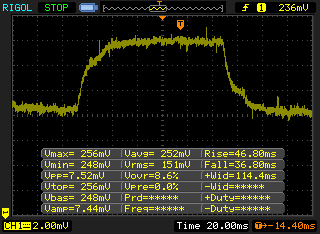 |
| ↘ 23 ms queda | ||
| A tela mostra taxas de resposta lentas em nossos testes e será insatisfatória para os jogadores. Em comparação, todos os dispositivos testados variam de 0.165 (mínimo) a 636 (máximo) ms. » 86 % de todos os dispositivos são melhores. Isso significa que o tempo de resposta medido é pior que a média de todos os dispositivos testados (31 ms). | ||

| Cinebench R15 | |
| CPU Single 64Bit | |
| Toshiba Portege Z30-C-125 | |
| HP EliteBook 820 G3 | |
| Dell Latitude 12 E5270 | |
| Lenovo ThinkPad X260-20F60041GE | |
| Apple MacBook 12 (Early 2016) 1.1 GHz | |
| Apple MacBook 12 (Early 2016) 1.1 GHz | |
| Lenovo B50-70 MCC2GGE | |
| Acer Extensa 2510-34Z4 | |
| HP EliteBook 725 G3-P4T48EA | |
| HP EliteBook 725 G2 | |
| CPU Multi 64Bit | |
| Toshiba Portege Z30-C-125 | |
| HP EliteBook 820 G3 | |
| Dell Latitude 12 E5270 | |
| Lenovo ThinkPad X260-20F60041GE | |
| Apple MacBook 12 (Early 2016) 1.1 GHz | |
| HP EliteBook 725 G3-P4T48EA | |
| Acer Extensa 2510-34Z4 | |
| Lenovo B50-70 MCC2GGE | |
| HP EliteBook 725 G2 | |
| Cinebench R10 | |
| Rendering Multiple CPUs 32Bit | |
| Dell Latitude 12 E5270 | |
| Lenovo ThinkPad X260-20F60041GE | |
| Apple MacBook 12 (Early 2016) 1.1 GHz | |
| Lenovo B50-70 MCC2GGE | |
| HP EliteBook 725 G3-P4T48EA | |
| HP EliteBook 725 G2 | |
| Rendering Single 32Bit | |
| Dell Latitude 12 E5270 | |
| Lenovo ThinkPad X260-20F60041GE | |
| Apple MacBook 12 (Early 2016) 1.1 GHz | |
| Lenovo B50-70 MCC2GGE | |
| HP EliteBook 725 G3-P4T48EA | |
| HP EliteBook 725 G2 | |
| JetStream 1.1 - 1.1 Total | |
| Dell Latitude 12 E5270 | |
| HP EliteBook 820 G3 | |
| Apple MacBook 12 (Early 2016) 1.1 GHz | |
| Apple MacBook 12 (Early 2016) 1.1 GHz | |
| Lenovo B50-70 MCC2GGE | |
| HP EliteBook 725 G3-P4T48EA | |
| HP EliteBook 725 G3-P4T48EA | |
* ... menor é melhor
| PCMark 7 Score | 2331 pontos | |
| PCMark 8 Home Score Accelerated v2 | 2706 pontos | |
| PCMark 8 Creative Score Accelerated v2 | 2710 pontos | |
| PCMark 8 Work Score Accelerated v2 | 3691 pontos | |
Ajuda | ||
| PCMark 7 - Score | |
| Lenovo ThinkPad X260-20F60041GE | |
| Dell Latitude 12 E5270 | |
| HP EliteBook 725 G3-P4T48EA | |
| HP EliteBook 725 G2 | |
| HP EliteBook 725 G3-P4T48EA Hitachi Travelstar Z7K500 HTS725050A7E630 | HP EliteBook 725 G2 Hitachi Travelstar Z7K500 HTS725050A7E630 | Dell Latitude 12 E5270 Seagate ST500LM021-1KJ15 | Lenovo ThinkPad X260-20F60041GE Seagate ST500LM000 Solid State Hybrid Drive | HP EliteBook 820 G3 Samsung SM951 MZVPV256HDGL m.2 PCI-e | Apple MacBook 12 (Early 2016) 1.1 GHz Apple SSD AP0256 | |
|---|---|---|---|---|---|---|
| CrystalDiskMark 3.0 | -11% | -26% | 18% | 13315% | 9582% | |
| Read Seq (MB/s) | 125.3 | 116.8 -7% | 113.8 -9% | 107.9 -14% | 1255 902% | 754 502% |
| Write Seq (MB/s) | 124.3 | 115.6 -7% | 108.5 -13% | 110.2 -11% | 1240 898% | 638 413% |
| Read 512 (MB/s) | 40.95 | 39.14 -4% | 24.9 -39% | 36.26 -11% | 1131 2662% | 616 1404% |
| Write 512 (MB/s) | 57.6 | 49.61 -14% | 51.9 -10% | 77.1 34% | 811 1308% | 678 1077% |
| Read 4k (MB/s) | 0.495 | 0.453 -8% | 0.398 -20% | 0.497 0% | 51 10203% | 14.6 2849% |
| Write 4k (MB/s) | 1.13 | 0.947 -16% | 0.654 -42% | 3.136 178% | 134.1 11767% | 20.5 1714% |
| Read 4k QD32 (MB/s) | 1.129 | 1.019 -10% | 0.798 -29% | 1.155 2% | 549 48527% | 464 40998% |
| Write 4k QD32 (MB/s) | 1.133 | 0.931 -18% | 0.636 -44% | 0.766 -32% | 343.9 30253% | 315 27702% |

| 3DMark 06 Standard Score | 5207 pontos | |
| 3DMark 11 Performance | 1424 pontos | |
| 3DMark Ice Storm Standard Score | 34816 pontos | |
| 3DMark Cloud Gate Standard Score | 3524 pontos | |
| 3DMark Fire Strike Score | 690 pontos | |
| 3DMark Time Spy Score | 300 pontos | |
Ajuda | ||
| 3DMark 11 - 1280x720 Performance GPU | |
| HP EliteBook 725 G3-P4T48EA | |
| HP EliteBook 725 G3-P4T48EA | |
| Dell Latitude 12 E5270 | |
| HP EliteBook 820 G3 | |
| Toshiba Portege Z30-C-125 | |
| Lenovo ThinkPad X260-20F60041GE | |
| Apple MacBook 12 (Early 2016) 1.1 GHz | |
| HP EliteBook 725 G2 | |
| 3DMark | |
| 1280x720 Cloud Gate Standard Graphics | |
| Dell Latitude 12 E5270 | |
| Toshiba Portege Z30-C-125 | |
| HP EliteBook 820 G3 | |
| Apple MacBook 12 (Early 2016) 1.1 GHz | |
| Lenovo ThinkPad X260-20F60041GE | |
| HP EliteBook 725 G3-P4T48EA | |
| HP EliteBook 725 G2 | |
| 1920x1080 Fire Strike Graphics | |
| HP EliteBook 725 G3-P4T48EA | |
| HP EliteBook 725 G3-P4T48EA | |
| Dell Latitude 12 E5270 | |
| HP EliteBook 820 G3 | |
| Apple MacBook 12 (Early 2016) 1.1 GHz | |
| Lenovo ThinkPad X260-20F60041GE | |
| Toshiba Portege Z30-C-125 | |
| HP EliteBook 725 G2 | |
| baixo | média | alto | ultra | |
|---|---|---|---|---|
| Tomb Raider (2013) | 49.5 | 25.2 | 18.5 | |
| BioShock Infinite (2013) | 42.7 | 24.1 | 19.4 | |
| Battlefield 4 (2013) | 21.7 | 14.4 | 8.4 | |
| Far Cry Primal (2016) | 10 | 7 | ||
| The Division (2016) | 12.3 | 7.5 | ||
| Hitman 2016 (2016) | 6.1 | 3.9 | ||
| Need for Speed 2016 (2016) | 11.1 | 10.4 | ||
| Mirror's Edge Catalyst (2016) | 6 | 2.3 |
Barulho
| Ocioso |
| 30.5 / 30.5 / 30.5 dB |
| HDD |
| 30.9 dB |
| Carga |
| 38.2 / 38.4 dB |
 | ||
30 dB silencioso 40 dB(A) audível 50 dB(A) ruidosamente alto |
||
min: | ||
(±) A temperatura máxima no lado superior é 42.8 °C / 109 F, em comparação com a média de 35.9 °C / 97 F , variando de 21.4 a 59 °C para a classe Subnotebook.
(-) A parte inferior aquece até um máximo de 54.3 °C / 130 F, em comparação com a média de 39.2 °C / 103 F
(+) Em uso inativo, a temperatura média para o lado superior é 31.7 °C / 89 F, em comparação com a média do dispositivo de 30.8 °C / ### class_avg_f### F.
(±) Os apoios para as mãos e o touchpad podem ficar muito quentes ao toque, com um máximo de 37.4 °C / 99.3 F.
(-) A temperatura média da área do apoio para as mãos de dispositivos semelhantes foi 28.2 °C / 82.8 F (-9.2 °C / -16.5 F).
HP EliteBook 725 G3-P4T48EA análise de áudio
(+) | os alto-falantes podem tocar relativamente alto (###valor### dB)
Graves 100 - 315Hz
(-) | quase nenhum baixo - em média 22.4% menor que a mediana
(±) | a linearidade dos graves é média (13.8% delta para a frequência anterior)
Médios 400 - 2.000 Hz
(±) | médios mais altos - em média 5.3% maior que a mediana
(+) | médios são lineares (4.9% delta para frequência anterior)
Altos 2 - 16 kHz
(+) | agudos equilibrados - apenas 3.3% longe da mediana
(+) | os máximos são lineares (4.4% delta da frequência anterior)
Geral 100 - 16.000 Hz
(±) | a linearidade do som geral é média (22.3% diferença em relação à mediana)
Comparado com a mesma classe
» 76% de todos os dispositivos testados nesta classe foram melhores, 5% semelhantes, 19% piores
» O melhor teve um delta de 5%, a média foi 18%, o pior foi 53%
Comparado com todos os dispositivos testados
» 65% de todos os dispositivos testados foram melhores, 6% semelhantes, 29% piores
» O melhor teve um delta de 4%, a média foi 23%, o pior foi 134%
Apple MacBook 12 (Early 2016) 1.1 GHz análise de áudio
(+) | os alto-falantes podem tocar relativamente alto (###valor### dB)
Graves 100 - 315Hz
(±) | graves reduzidos - em média 11.3% menor que a mediana
(±) | a linearidade dos graves é média (14.2% delta para a frequência anterior)
Médios 400 - 2.000 Hz
(+) | médios equilibrados - apenas 2.4% longe da mediana
(+) | médios são lineares (5.5% delta para frequência anterior)
Altos 2 - 16 kHz
(+) | agudos equilibrados - apenas 2% longe da mediana
(+) | os máximos são lineares (4.5% delta da frequência anterior)
Geral 100 - 16.000 Hz
(+) | o som geral é linear (10.2% diferença em relação à mediana)
Comparado com a mesma classe
» 7% de todos os dispositivos testados nesta classe foram melhores, 2% semelhantes, 90% piores
» O melhor teve um delta de 5%, a média foi 18%, o pior foi 53%
Comparado com todos os dispositivos testados
» 5% de todos os dispositivos testados foram melhores, 1% semelhantes, 94% piores
» O melhor teve um delta de 4%, a média foi 23%, o pior foi 134%
| desligado | |
| Ocioso | |
| Carga |
|
Key:
min: | |
| HP EliteBook 725 G3-P4T48EA Pro A10-8700B, Radeon R6 (Carrizo) | HP EliteBook 725 G2 A10 Pro-7350B, Radeon R6 (Kaveri) | Dell Latitude 12 E5270 6300U, HD Graphics 520 | Lenovo ThinkPad X260-20F60041GE 6200U, HD Graphics 520 | Toshiba Portege Z30-C-125 6500U, HD Graphics 520 | HP EliteBook 820 G3 6300U, HD Graphics 520 | Apple MacBook 12 (Early 2016) 1.1 GHz 6Y30, HD Graphics 515 | |
|---|---|---|---|---|---|---|---|
| Power Consumption | 9% | 27% | 30% | 19% | 32% | 52% | |
| Idle Minimum * (Watt) | 5.4 | 7 -30% | 3.9 28% | 3.6 33% | 2.7 50% | 3.5 35% | 2.7 50% |
| Idle Average * (Watt) | 7.5 | 8.6 -15% | 6 20% | 5.9 21% | 7.7 -3% | 5.4 28% | 2.7 64% |
| Idle Maximum * (Watt) | 13 | 9.9 24% | 6.6 49% | 6.6 49% | 11 15% | 6.2 52% | 7.2 45% |
| Load Average * (Watt) | 41.2 | 24.4 41% | 28.9 30% | 28.5 31% | 34.8 16% | 27.3 34% | 22 47% |
| Load Maximum * (Watt) | 44.7 | 32.5 27% | 41.7 7% | 36.8 18% | 36.6 18% | 39.5 12% | 20.5 54% |
* ... menor é melhor
| HP EliteBook 725 G3-P4T48EA 44 Wh | HP EliteBook 725 G2 46 Wh | Dell Latitude 12 E5270 47 Wh | Lenovo ThinkPad X260-20F60041GE 46 Wh | Toshiba Portege Z30-C-125 52 Wh | HP EliteBook 820 G3 44 Wh | Apple MacBook 12 (Early 2016) 1.1 GHz 41.4 Wh | |
|---|---|---|---|---|---|---|---|
| Duração da bateria | -3% | 42% | 57% | 105% | 62% | 119% | |
| Reader / Idle (h) | 9.2 | 7.6 -17% | 12.9 40% | 13.3 45% | 18.9 105% | 13.8 50% | |
| H.264 (h) | 4.3 | 3.4 -21% | 5.9 37% | 6.4 49% | 8.3 93% | 8.5 98% | |
| WiFi v1.3 (h) | 4.7 | 6.6 40% | 6.6 40% | 6.2 32% | 8.4 79% | ||
| Load (h) | 1.4 | 1.8 29% | 2.1 50% | 2.7 93% | 2.4 71% | 3.9 179% | |
| WiFi (h) | 4.3 | 6.7 |
Pro
Contra
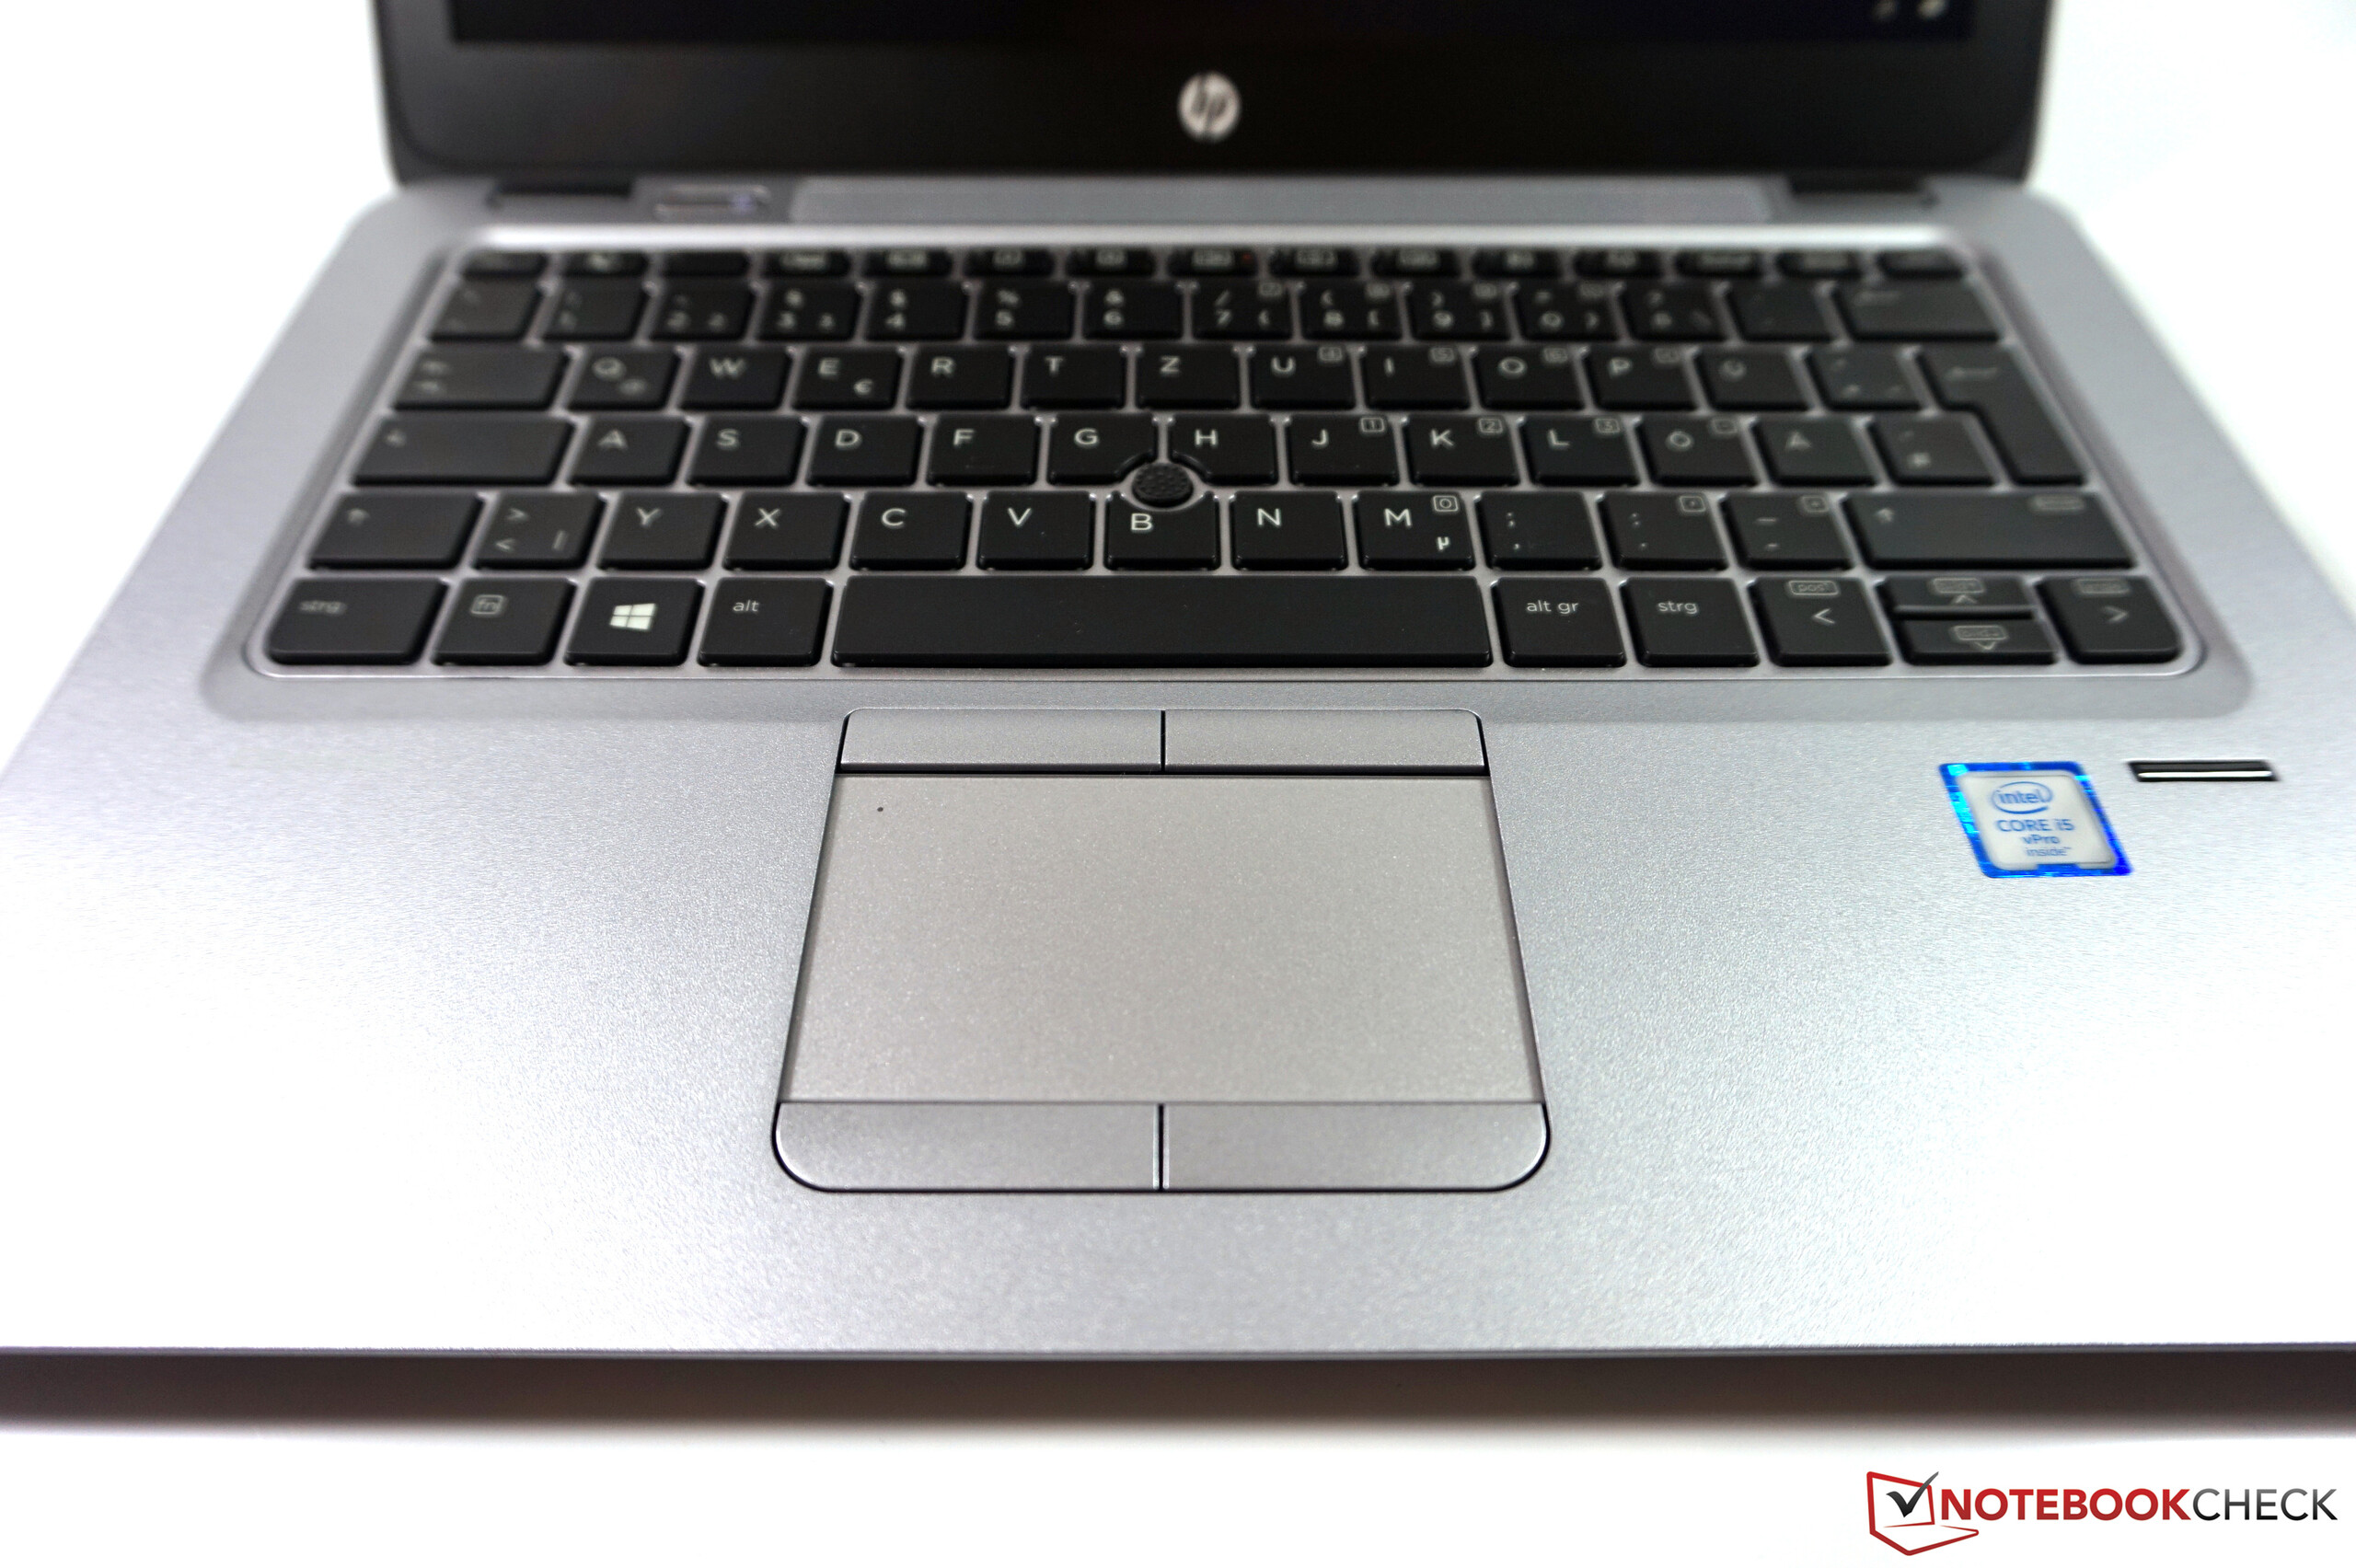
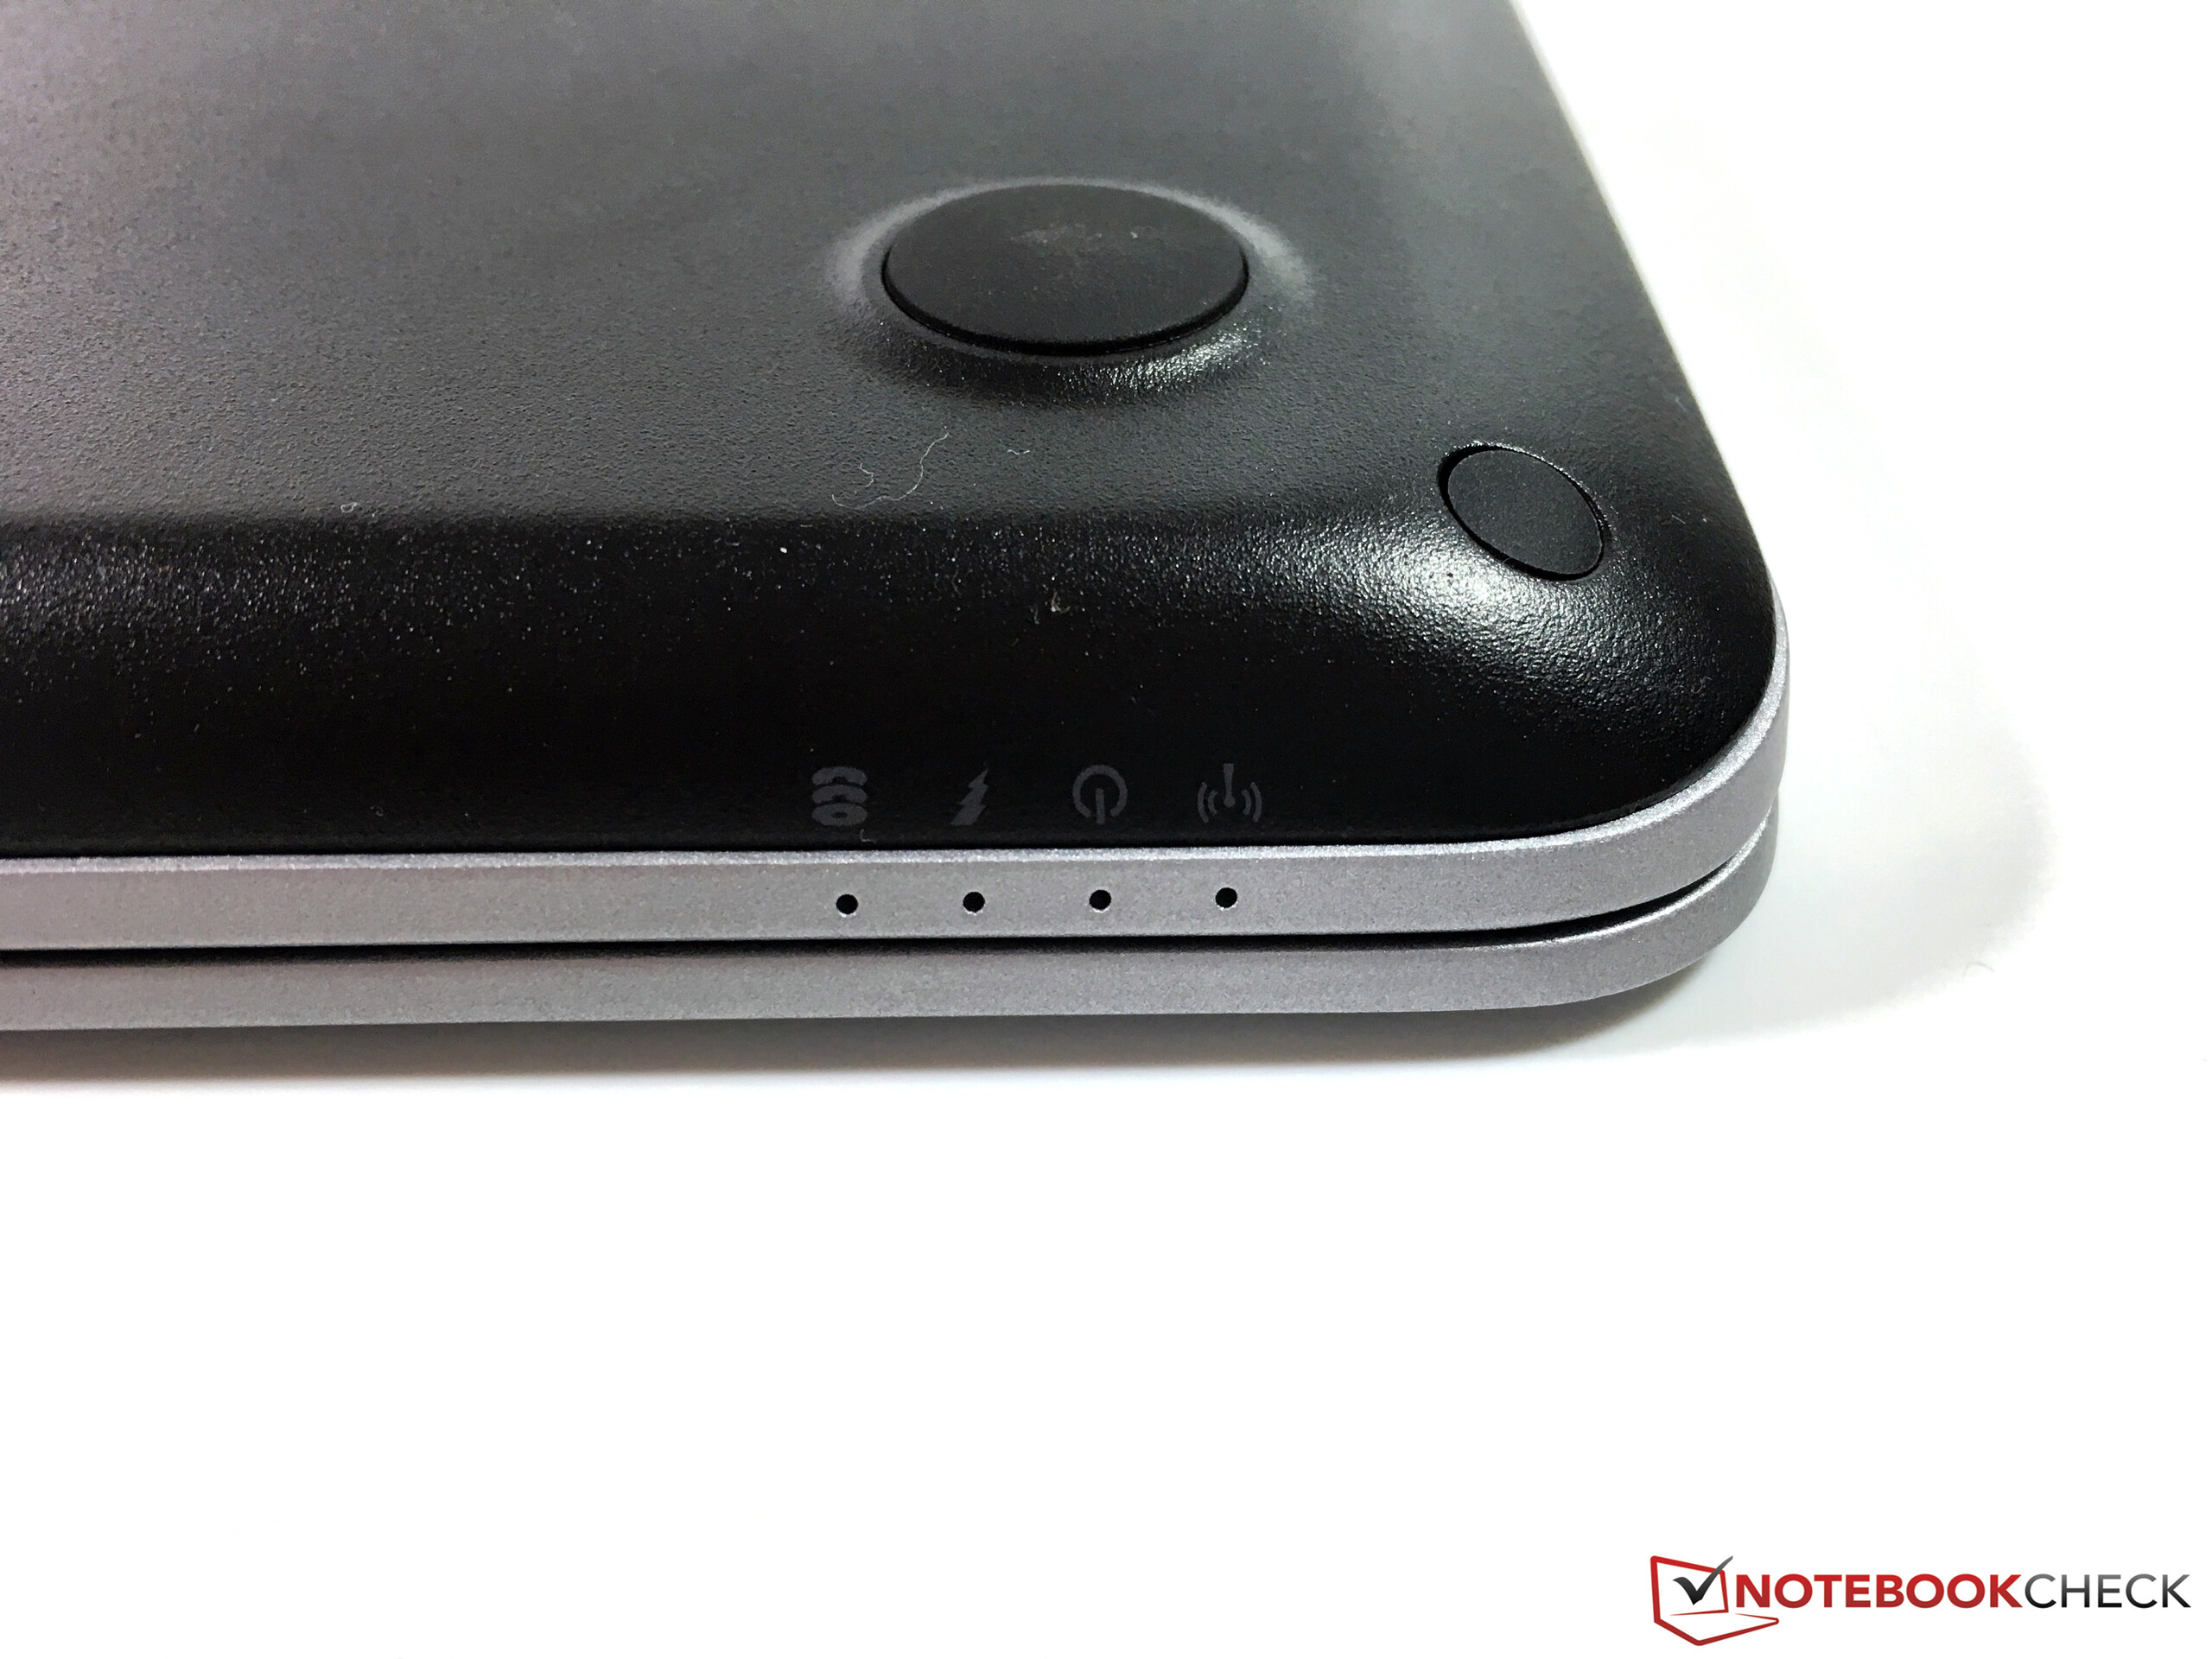
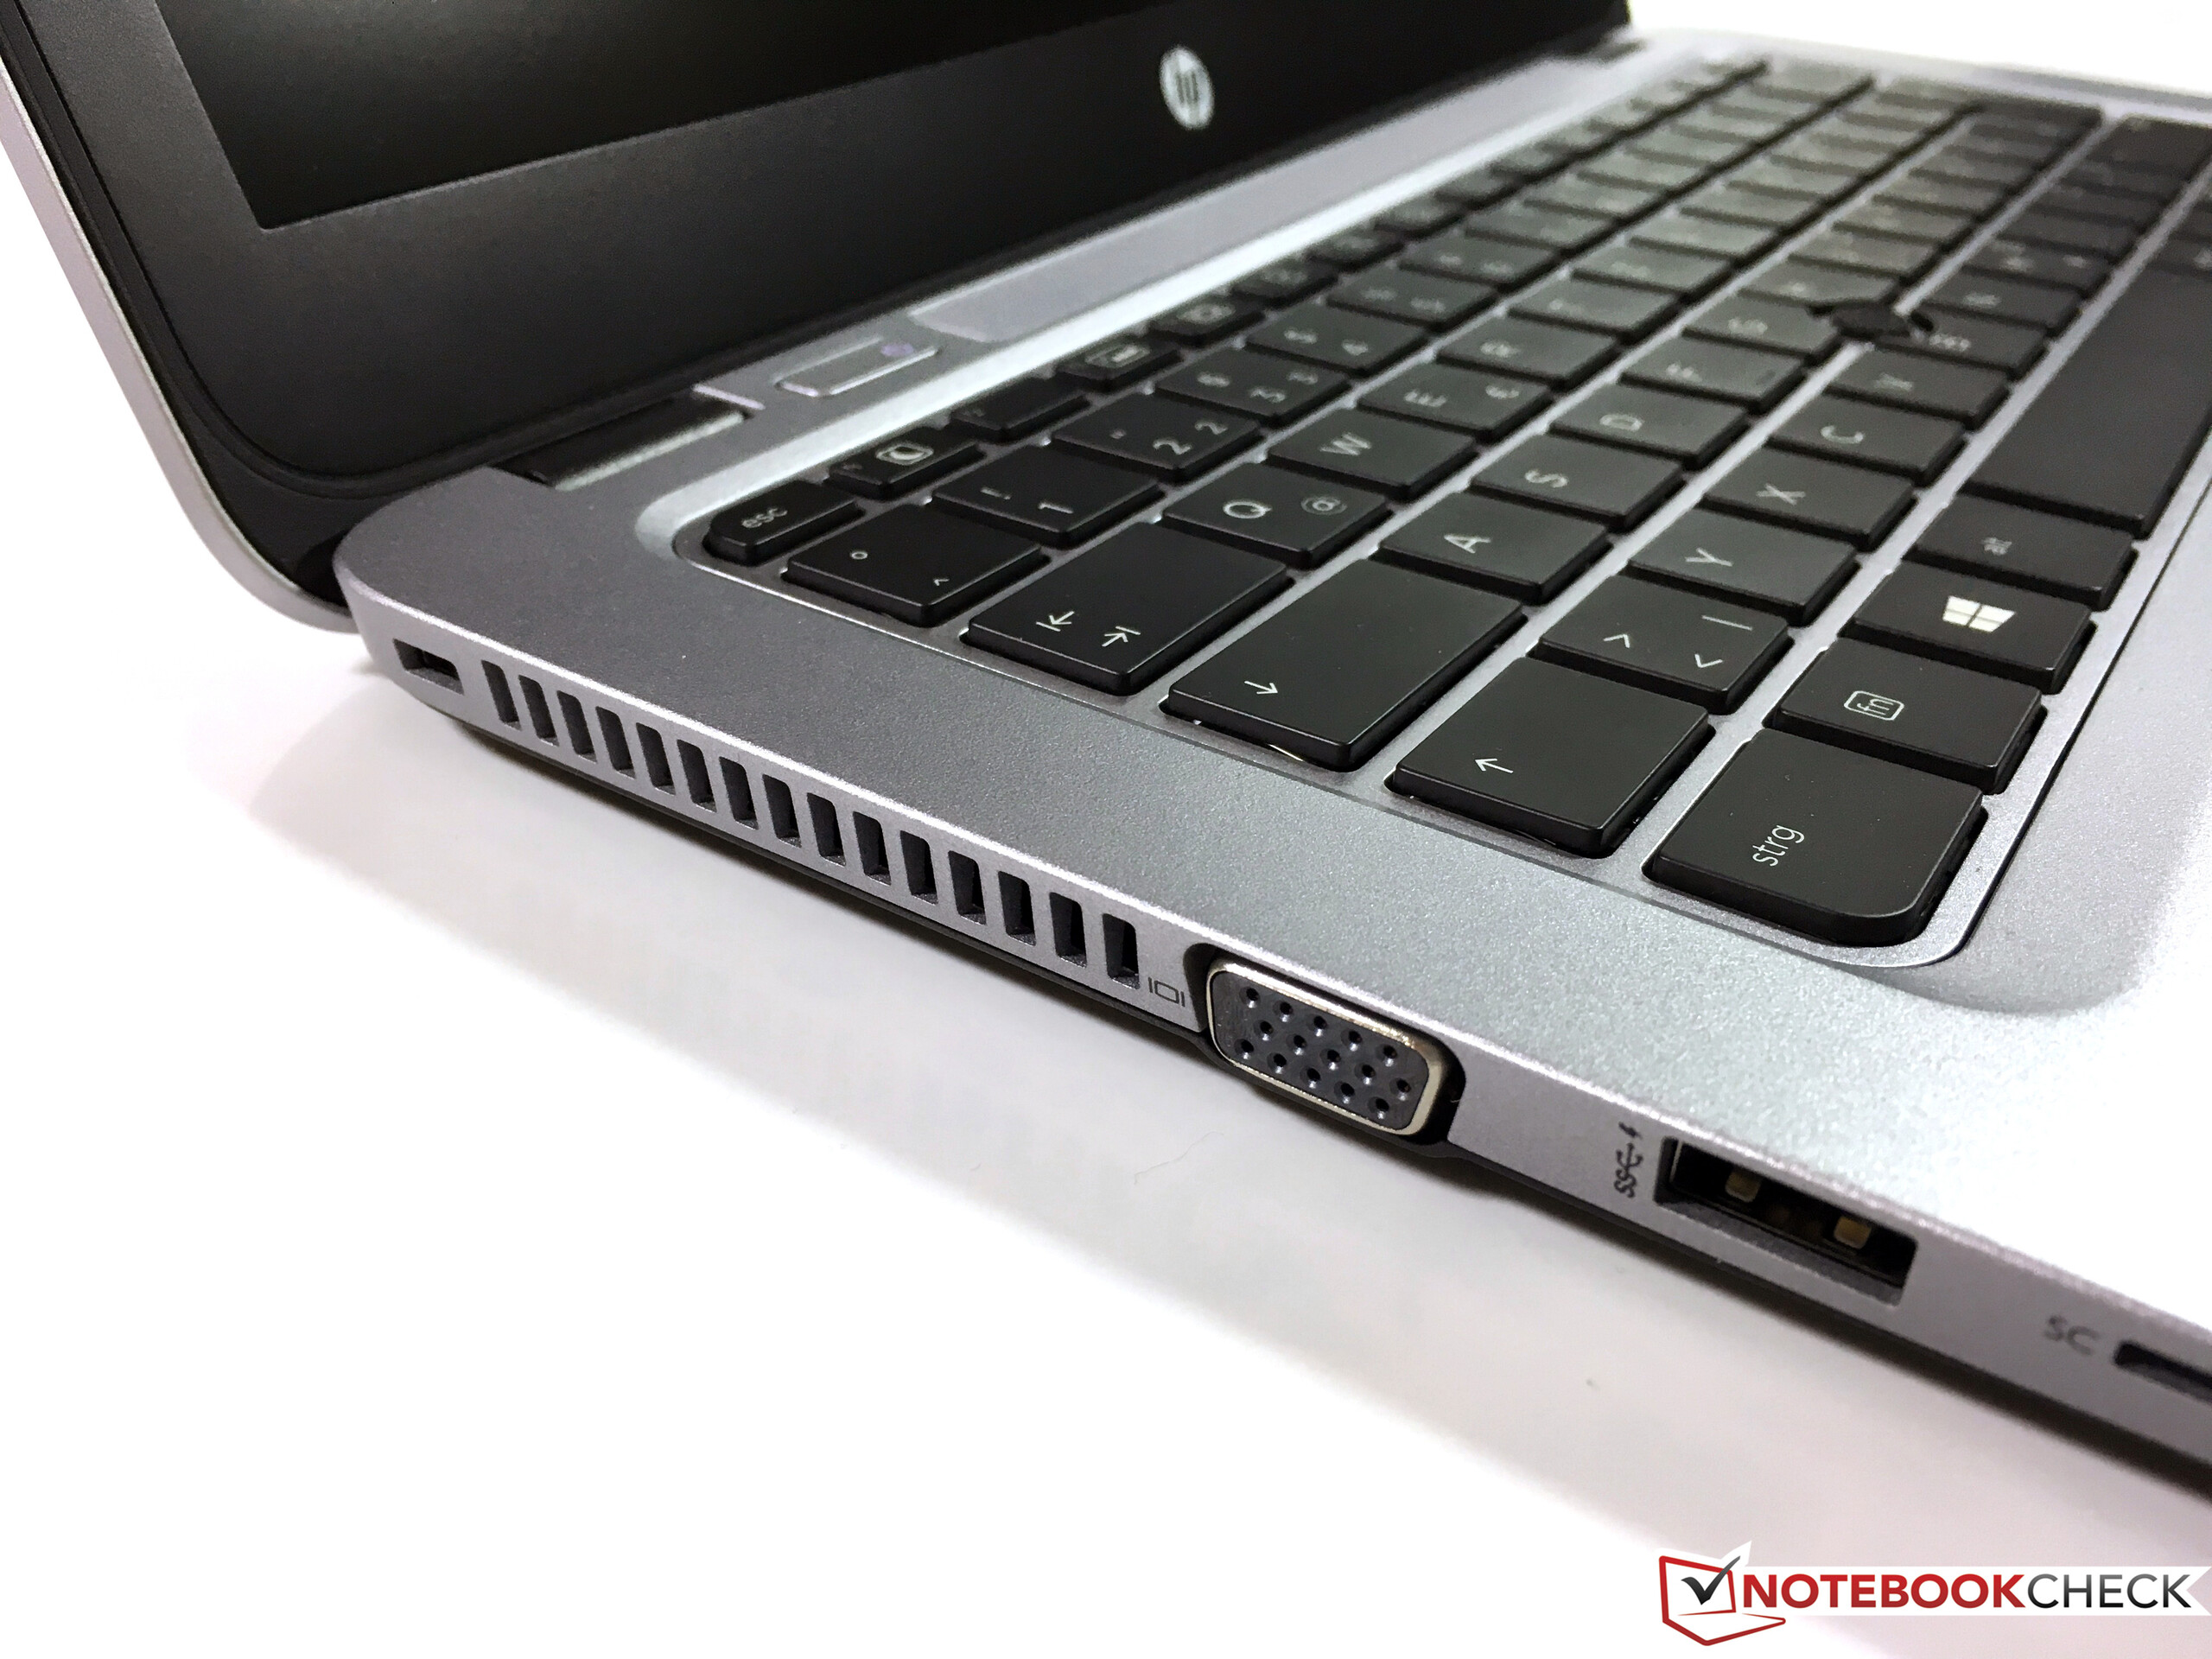
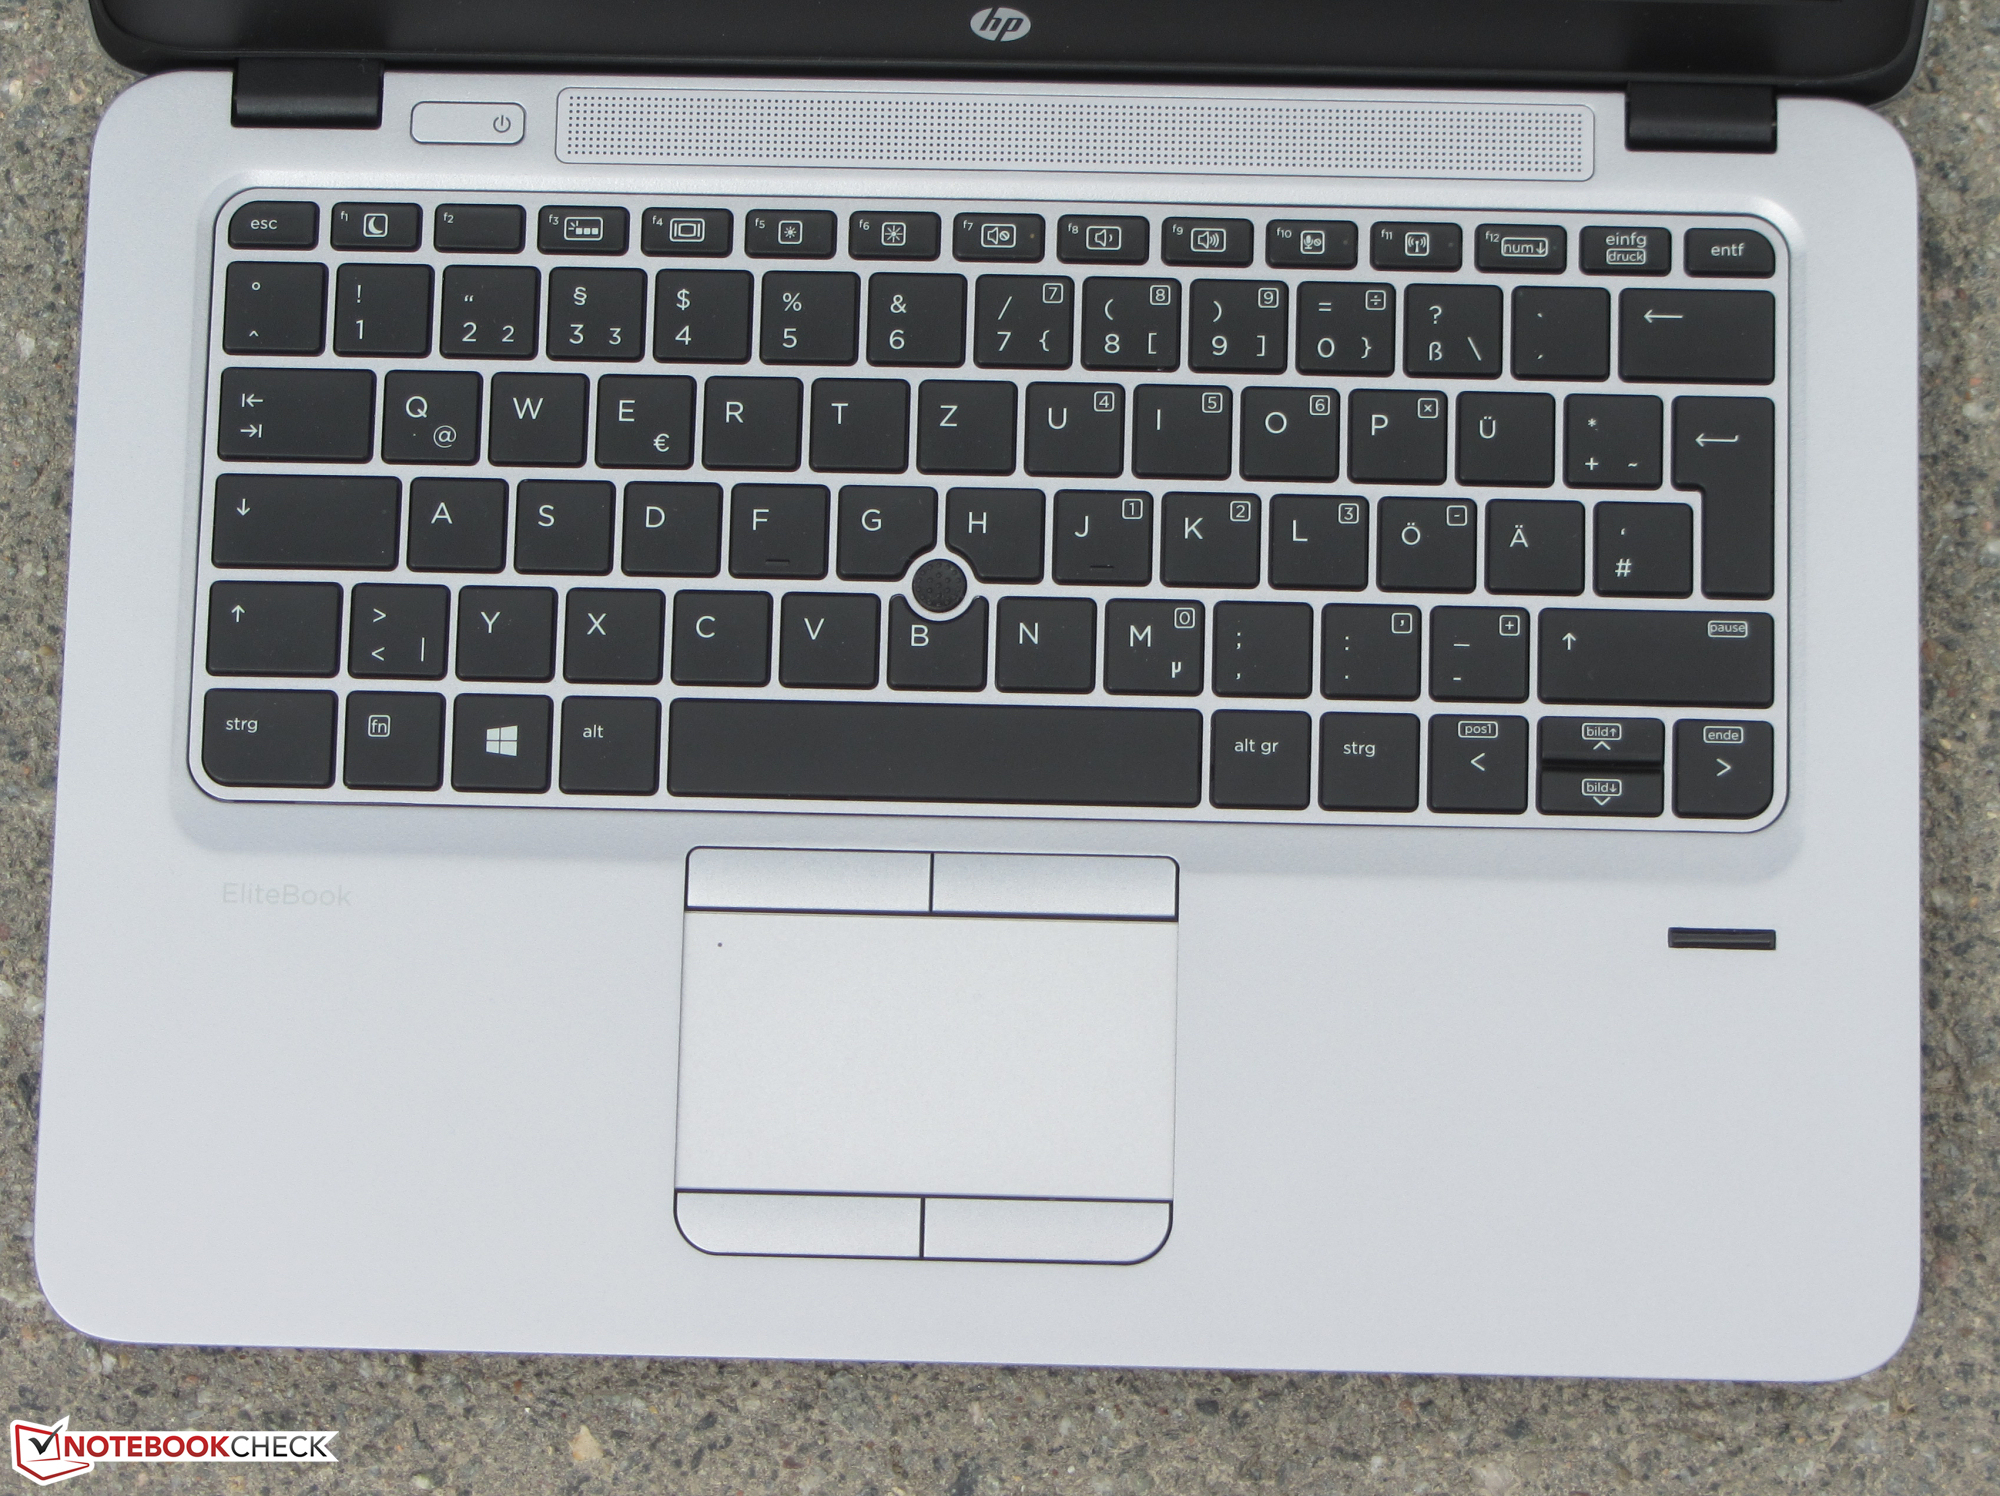
O Hewlett Packard EliteBook 725 G3 é um subportátil de 12,5-polegadas. A APU AMD deste modelo oferece suficiente desempenho para tarefas cotidianas. O portátil tem uma boa carcaça e oferece uma boa conectividade. O teclado também é bastante bom. O portátil tem uma opção de incluir um modem LTE e as antenas necessárias e slot SIM já estão disponíveis. A HP oferece uma garantia de 3-anos.
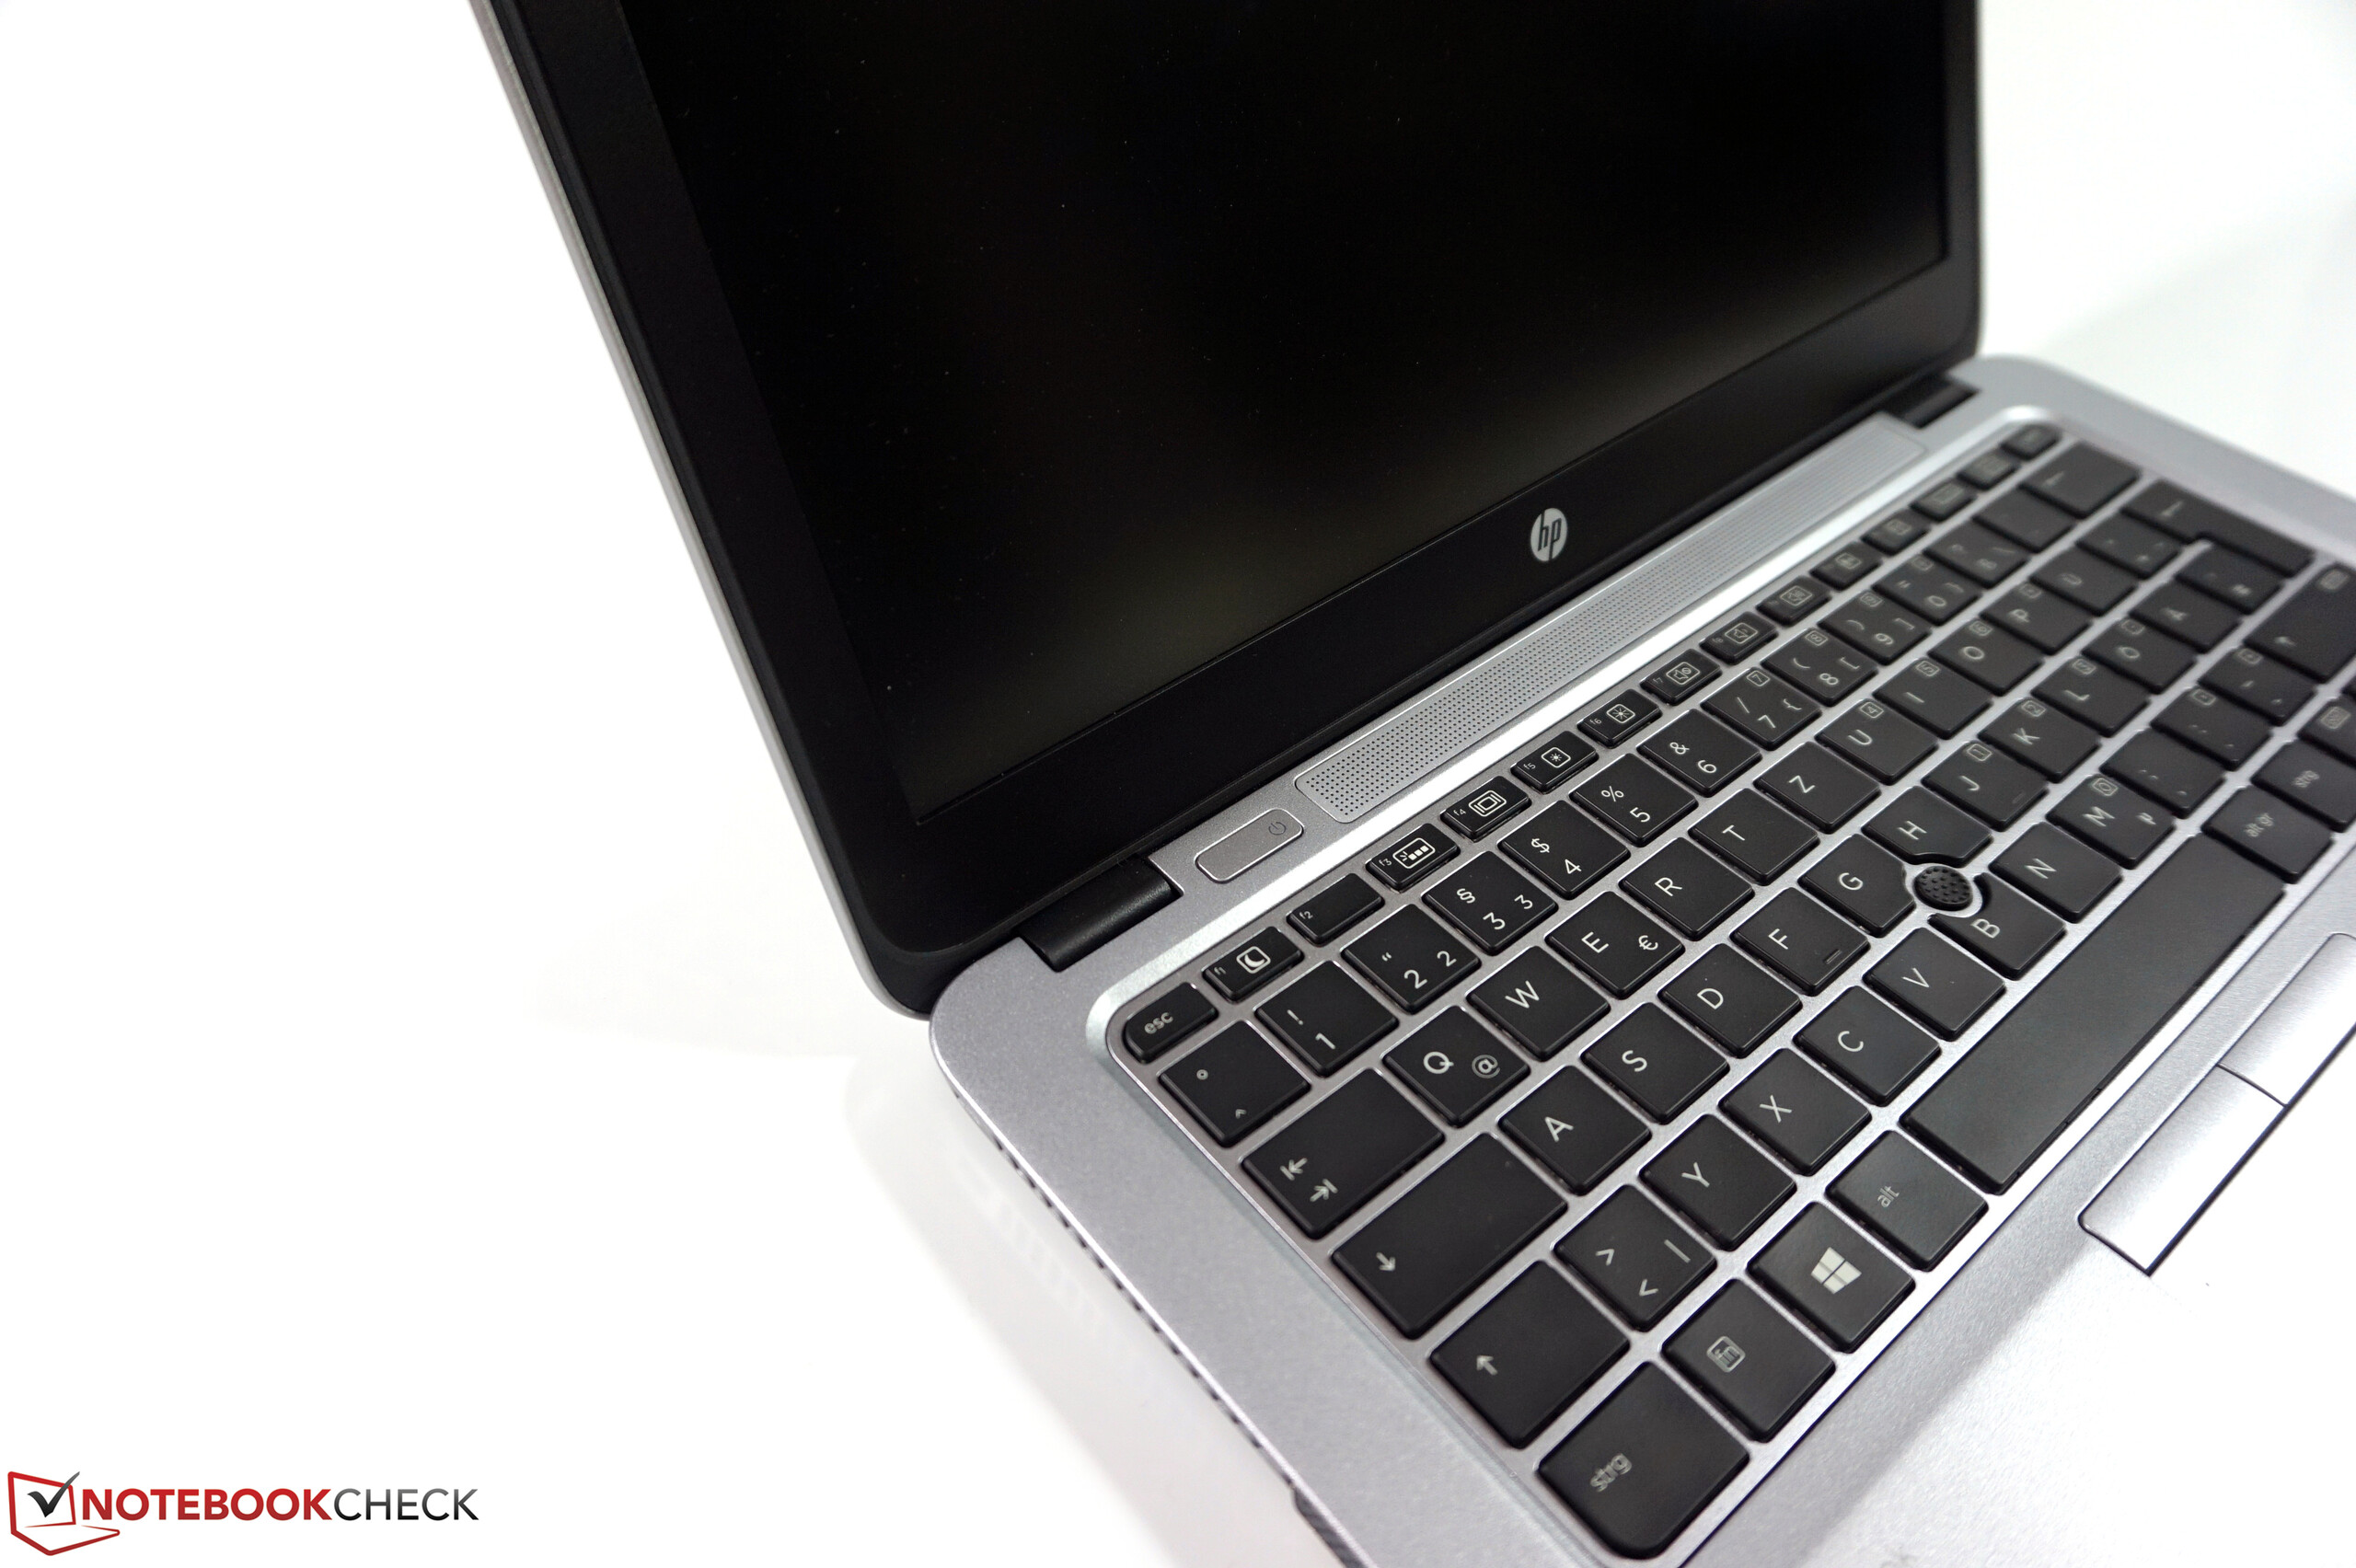
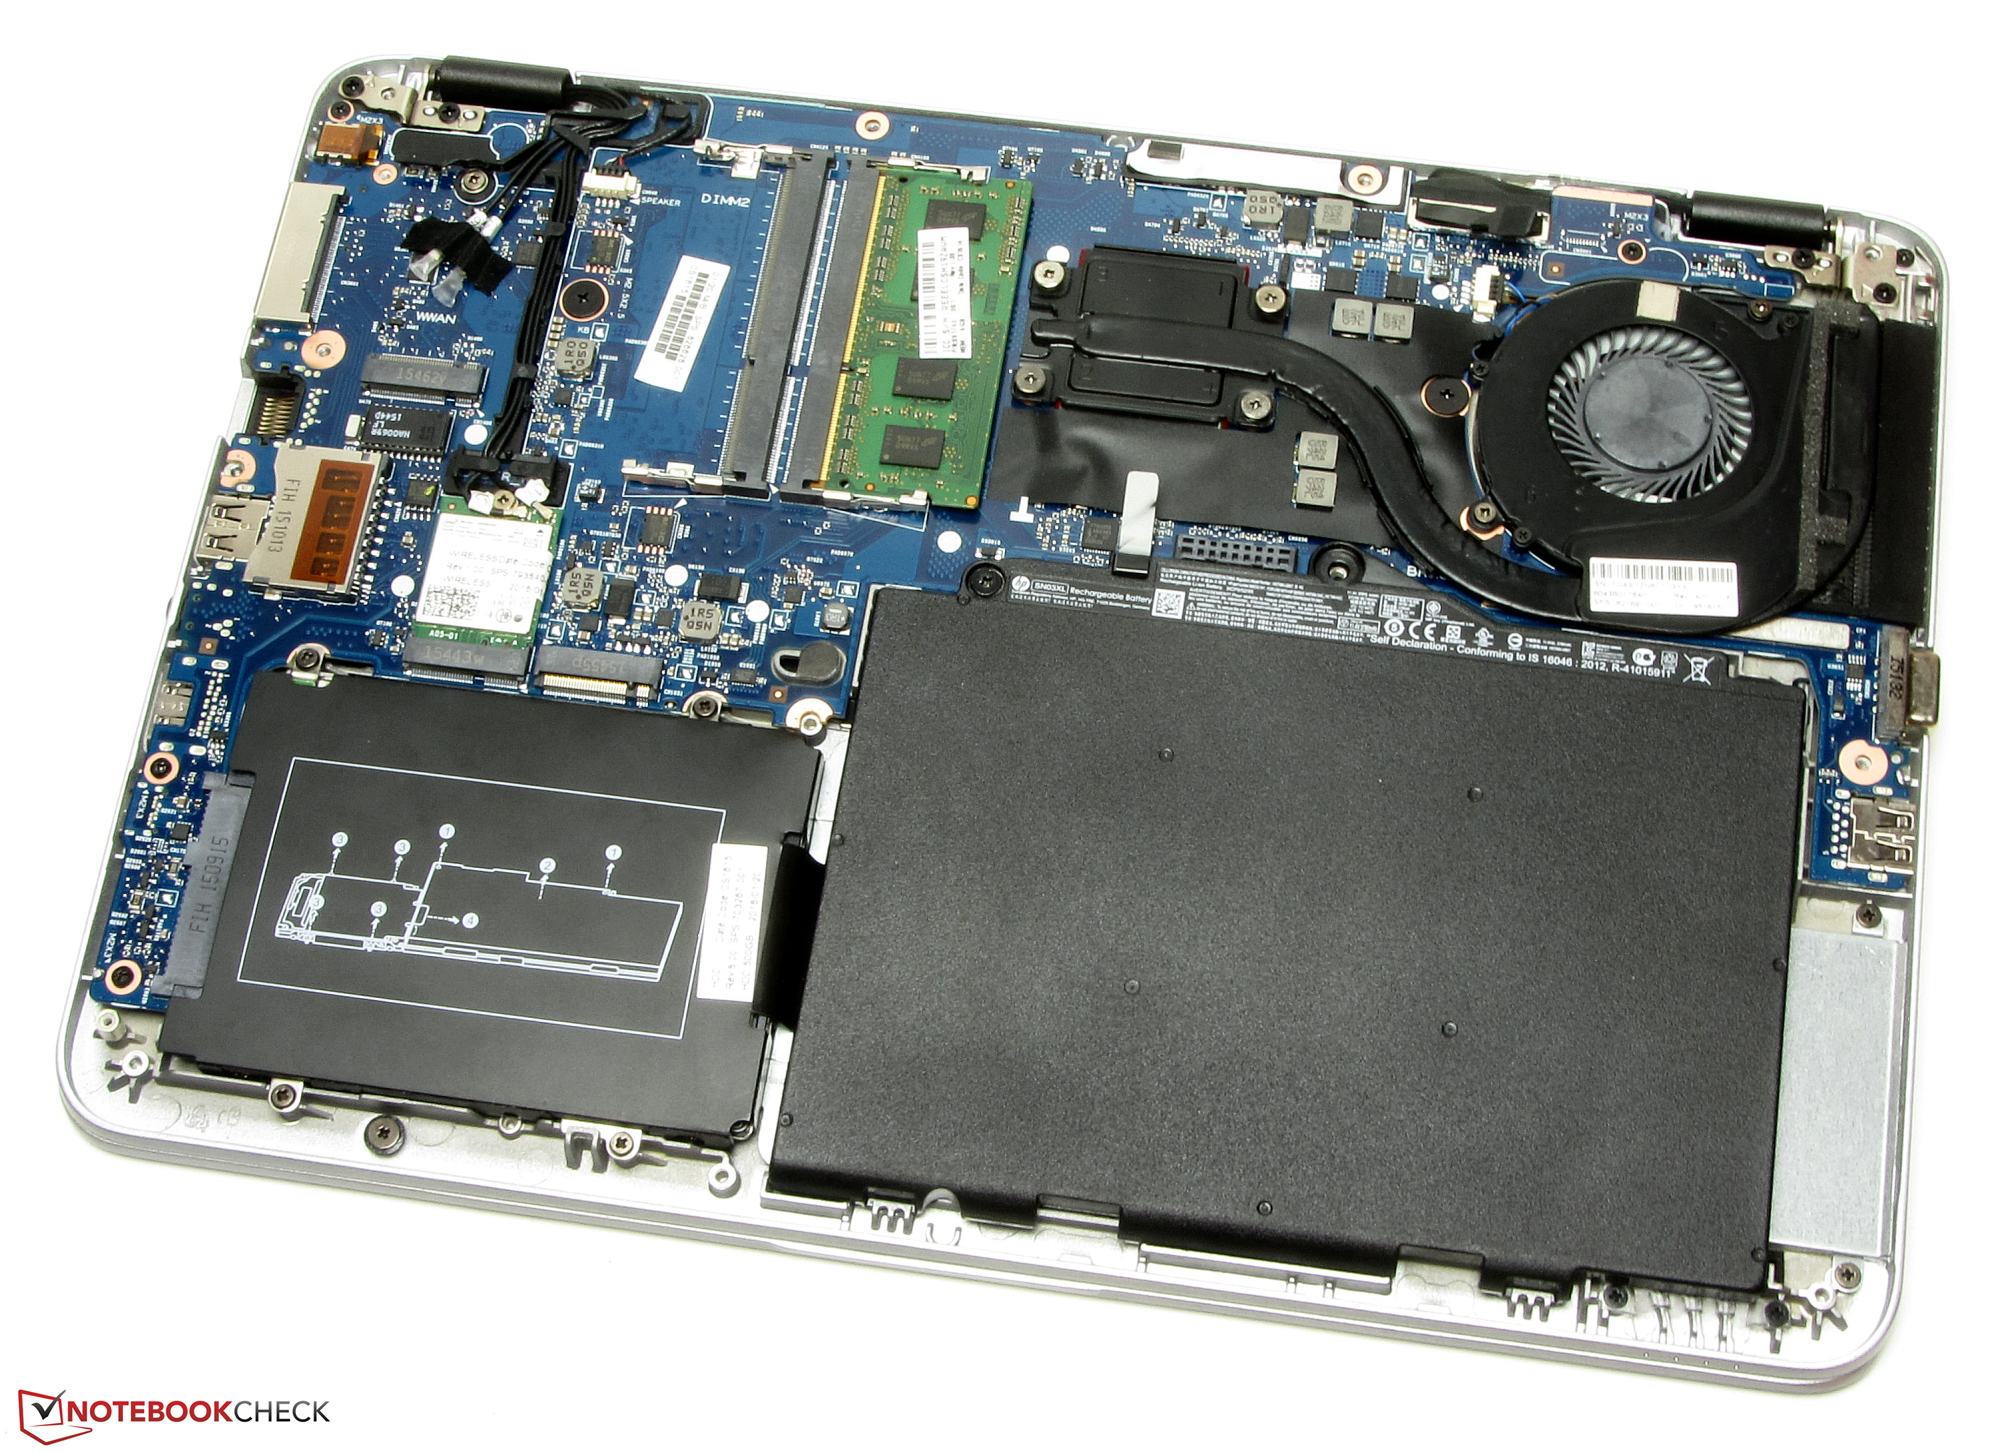
Existem muitos aspectos desde modelo de teste que podem ser criticados. O portátil funciona silenciosamente apenas quando está no modo inativo. Se a ventoinha começa a funcionar, o aparelho se tornará barulhento, devido a um perturbante zumbido que é emitido. Isto, combinado com o preço do aparelho, é suficiente para desqualifica-lo de ser um portátil empresarial viável. O EliteBook 725 G2 tinha uma escotilha de manutenção que podia ser aberta sem ferramentas. Seu sucessor, o EliteBook 725 G3, possui uma placa inferior que utiliza parafusos. Para ser justos, temos de admitir que o aparelho pode ser desmontado facilmente com uma chave de fenda, mas mesmo assim, este seria um passo para trás.
A duração da bateria não é muito boa. O portátil de 12,5-polegadas deveria oferecer durações mais longas e é ultrapassado pelo EliteBook 820 G3 e o Lenovo ThinkPad X260. A tela é pobre para o preço que o comprador está pagando. Ela tem brilho baixo, contraste e ângulos de visão pobres e uma resolução HD.
O EliteBook 725 G3 terá dificuldade sobrevivendo no catálogo empresarial da HP. Nem o hardware, nem o preço fazem com que este portátil seja algo especial.
Para resumir, não podemos encontrar um motivo válido para recomendar o EliteBook 725 G3. Inclusive se o preço fosse rebaixado, a duração da bateria simplesmente não corresponde aos padrões modernos para esta classe. Além disso, os compradores sempre tem a opção de um EliteBook 820 G3 (T9X40ET), que é mais barato que o nosso modelo de teste e tem um processador Core i5-6200U. Os recursos restantes deste modelo são similares a aqueles do nosso modelo de teste, o 725 G3. Com um preço de 920 Euros (~$1043), o modelo irmão é 80 Euros (~$91) mais barato que o nosso modelo de teste, o 725 G3.
Esta é uma versão reduzida da análise original. Você pode ler a análise completa em inglês.
HP EliteBook 725 G3-P4T48EA
- 08/11/2016 v5.1 (old)
Sascha Mölck