Breve Análise do Portátil HP EliteBook 755 G5 (Ryzen 7 2700U, Vega 10)
| |||||||||||||||||||||||||
iluminação: 84 %
iluminação com acumulador: 456 cd/m²
Contraste: 735:1 (Preto: 0.62 cd/m²)
ΔE ColorChecker Calman: 7.09 | ∀{0.5-29.43 Ø4.71}
ΔE Greyscale Calman: 9.15 | ∀{0.09-98 Ø4.96}
90% sRGB (Argyll 1.6.3 3D)
59% AdobeRGB 1998 (Argyll 1.6.3 3D)
66.1% AdobeRGB 1998 (Argyll 3D)
90.2% sRGB (Argyll 3D)
66.9% Display P3 (Argyll 3D)
Gamma: 2.31
CCT: 7195 K
| HP EliteBook 755 G5 3UN79EA BOE074E, , 1920x1080, 15.6" | HP EliteBook 745 G5 3UN74EA AUO383D, , 1920x1080, 14" | Lenovo ThinkPad T480s-20L7002AUS NV140FHM-N46, , 1920x1080, 14" | Dell Latitude 5490 AUO133D, , 1920x1080, 14" | HP EliteBook 755 G4 Chi Mei, CMN15C3, , 1920x1080, 15.6" | |
|---|---|---|---|---|---|
| Display | -6% | -38% | -43% | -12% | |
| Display P3 Coverage (%) | 66.9 | 61.3 -8% | 39.69 -41% | 36.42 -46% | 56.3 -16% |
| sRGB Coverage (%) | 90.2 | 87.6 -3% | 59.2 -34% | 54.6 -39% | 84.2 -7% |
| AdobeRGB 1998 Coverage (%) | 66.1 | 62.3 -6% | 41 -38% | 37.62 -43% | 57.7 -13% |
| Response Times | 16% | -10% | 19% | 15% | |
| Response Time Grey 50% / Grey 80% * (ms) | 39 ? | 35 ? 10% | 44 ? -13% | 30.4 ? 22% | 45 ? -15% |
| Response Time Black / White * (ms) | 32 ? | 25 ? 22% | 34 ? -6% | 27.2 ? 15% | 18 ? 44% |
| PWM Frequency (Hz) | 21000 ? | 990 | 1000 ? | ||
| Screen | 30% | 1% | -14% | -34% | |
| Brightness middle (cd/m²) | 456 | 421 -8% | 288.3 -37% | 200.6 -56% | 333 -27% |
| Brightness (cd/m²) | 410 | 398 -3% | 281 -31% | 204 -50% | 306 -25% |
| Brightness Distribution (%) | 84 | 86 2% | 86 2% | 87 4% | 82 -2% |
| Black Level * (cd/m²) | 0.62 | 0.27 56% | 0.21 66% | 0.16 74% | 0.89 -44% |
| Contrast (:1) | 735 | 1559 112% | 1373 87% | 1254 71% | 374 -49% |
| Colorchecker dE 2000 * | 7.09 | 4.08 42% | 6.16 13% | 8.36 -18% | 11.69 -65% |
| Colorchecker dE 2000 max. * | 12.64 | 7.48 41% | 18.99 -50% | 25.63 -103% | 20.57 -63% |
| Greyscale dE 2000 * | 9.15 | 2.92 68% | 6.3 31% | 7.7 16% | 13.7 -50% |
| Gamma | 2.31 95% | 2.32 95% | 2.517 87% | 2.773 79% | 2.29 96% |
| CCT | 7195 90% | 7043 92% | 6886 94% | 6397 102% | 15194 43% |
| Color Space (Percent of AdobeRGB 1998) (%) | 59 | 57 -3% | 37.67 -36% | 34.5 -42% | 54 -8% |
| Color Space (Percent of sRGB) (%) | 90 | 87 -3% | 58.9 -35% | 54.2 -40% | 84 -7% |
| Colorchecker dE 2000 calibrated * | 4.51 | 4.6 | |||
| Média Total (Programa/Configurações) | 13% /
21% | -16% /
-8% | -13% /
-16% | -10% /
-23% |
* ... menor é melhor
Exibir tempos de resposta
| ↔ Tempo de resposta preto para branco | ||
|---|---|---|
| 32 ms ... ascensão ↗ e queda ↘ combinadas | ↗ 18 ms ascensão |  |
| ↘ 14 ms queda | ||
| A tela mostra taxas de resposta lentas em nossos testes e será insatisfatória para os jogadores. Em comparação, todos os dispositivos testados variam de 0.1 (mínimo) a 240 (máximo) ms. » 86 % de todos os dispositivos são melhores. Isso significa que o tempo de resposta medido é pior que a média de todos os dispositivos testados (19.8 ms). | ||
| ↔ Tempo de resposta 50% cinza a 80% cinza | ||
| 39 ms ... ascensão ↗ e queda ↘ combinadas | ↗ 20 ms ascensão | 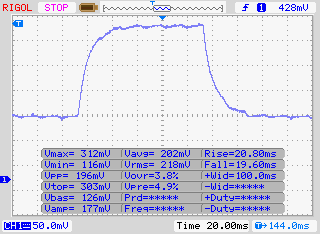 |
| ↘ 19 ms queda | ||
| A tela mostra taxas de resposta lentas em nossos testes e será insatisfatória para os jogadores. Em comparação, todos os dispositivos testados variam de 0.165 (mínimo) a 636 (máximo) ms. » 59 % de todos os dispositivos são melhores. Isso significa que o tempo de resposta medido é pior que a média de todos os dispositivos testados (31 ms). | ||
Cintilação da tela / PWM (modulação por largura de pulso)
| Tela tremeluzindo/PWM detectado | 21000 Hz | ≤ 90 % configuração de brilho | 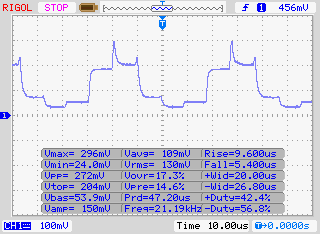 |
A luz de fundo da tela pisca em 21000 Hz (pior caso, por exemplo, utilizando PWM) Cintilação detectada em uma configuração de brilho de 90 % e abaixo. Não deve haver cintilação ou PWM acima desta configuração de brilho. A frequência de 21000 Hz é bastante alta, então a maioria dos usuários sensíveis ao PWM não deve notar nenhuma oscilação. [pwm_comparison] Em comparação: 52 % de todos os dispositivos testados não usam PWM para escurecer a tela. Se PWM foi detectado, uma média de 7754 (mínimo: 5 - máximo: 343500) Hz foi medida. | |||
| PCMark 8 Home Score Accelerated v2 | 3186 pontos | |
| PCMark 8 Work Score Accelerated v2 | 4495 pontos | |
| PCMark 10 Score | 3087 pontos | |
Ajuda | ||
| HP EliteBook 755 G5 3UN79EA Toshiba XG5 KXG50ZNV512G | HP EliteBook 745 G5 3UN74EA Toshiba XG5 KXG50ZNV256G | Lenovo ThinkPad T480s-20L7002AUS Samsung PM961 MZVLW256HEHP | Dell Latitude 5490 Samsung PM961 MZVLW256HEHP | Média Toshiba XG5 KXG50ZNV512G | |
|---|---|---|---|---|---|
| CrystalDiskMark 5.2 / 6 | -11% | 21% | -7% | 16% | |
| Write 4K (MB/s) | 119.9 | 119.5 0% | 105.8 -12% | 98.7 -18% | 114 ? -5% |
| Read 4K (MB/s) | 30.39 | 31.9 5% | 40.79 34% | 39.46 30% | 35.6 ? 17% |
| Write Seq (MB/s) | 558 | 351.1 -37% | 1204 116% | 564 1% | 684 ? 23% |
| Read Seq (MB/s) | 1689 | 1665 -1% | 1065 -37% | 764 -55% | 1612 ? -5% |
| Write 4K Q32T1 (MB/s) | 265.9 | 268.4 1% | 219.2 -18% | 443.3 67% | 401 ? 51% |
| Read 4K Q32T1 (MB/s) | 329.5 | 333.1 1% | 304.3 -8% | 268.8 -18% | 427 ? 30% |
| Write Seq Q32T1 (MB/s) | 710 | 351.8 -50% | 1267 78% | 796 12% | 830 ? 17% |
| Read Seq Q32T1 (MB/s) | 2984 | 2705 -9% | 3303 11% | 875 -71% | 2950 ? -1% |

| 3DMark 11 Performance | 2792 pontos | |
| 3DMark Cloud Gate Standard Score | 8819 pontos | |
| 3DMark Fire Strike Score | 1554 pontos | |
Ajuda | ||
| BioShock Infinite | |
| 1920x1080 Ultra Preset, DX11 (DDOF) | |
| Média AMD Radeon RX Vega 10 (8 - 58.4, n=14) | |
| HP EliteBook 745 G5 3UN74EA | |
| HP EliteBook 755 G5 3UN79EA | |
| Dell Latitude 5490 | |
| Lenovo ThinkPad T480s-20L7002AUS | |
| HP EliteBook 755 G4 | |
| 1280x720 Very Low Preset | |
| Média AMD Radeon RX Vega 10 (65.7 - 123.7, n=14) | |
| HP EliteBook 755 G5 3UN79EA | |
| HP EliteBook 745 G5 3UN74EA | |
| Dell Latitude 5490 | |
| Lenovo ThinkPad T480s-20L7002AUS | |
| HP EliteBook 755 G4 | |
| Rise of the Tomb Raider | |
| 1024x768 Lowest Preset | |
| Média AMD Radeon RX Vega 10 (33 - 45.9, n=6) | |
| HP EliteBook 745 G5 3UN74EA | |
| HP EliteBook 755 G5 3UN79EA | |
| HP EliteBook 755 G4 | |
| 1920x1080 High Preset AA:FX AF:4x | |
| HP EliteBook 755 G5 3UN79EA | |
| Média AMD Radeon RX Vega 10 (8.3 - 16.4, n=6) | |
| HP EliteBook 745 G5 3UN74EA | |
| HP EliteBook 755 G4 | |
| Thief | |
| 1024x768 Very Low Preset | |
| Média AMD Radeon RX Vega 10 (34 - 36, n=2) | |
| HP EliteBook 755 G5 3UN79EA | |
| 1920x1080 Very High Preset AA:FXAA & High SS AF:8x | |
| Média AMD Radeon RX Vega 10 (9.7 - 10, n=2) | |
| HP EliteBook 755 G5 3UN79EA | |
| baixo | média | alto | ultra | |
|---|---|---|---|---|
| BioShock Infinite (2013) | 86 | 0 | 0 | 14 |
| Thief (2014) | 34 | 0 | 0 | 9.7 |
| Rise of the Tomb Raider (2016) | 33 | 0 | 12 |
Barulho
| Ocioso |
| 30.5 / 30.5 / 30.5 dB |
| Carga |
| 37.5 / 35 dB |
 | ||
30 dB silencioso 40 dB(A) audível 50 dB(A) ruidosamente alto |
||
min: | ||
(+) A temperatura máxima no lado superior é 39.8 °C / 104 F, em comparação com a média de 34.3 °C / 94 F , variando de 21.2 a 62.5 °C para a classe Office.
(±) A parte inferior aquece até um máximo de 40.2 °C / 104 F, em comparação com a média de 36.8 °C / 98 F
(+) Em uso inativo, a temperatura média para o lado superior é 28.7 °C / 84 F, em comparação com a média do dispositivo de 29.5 °C / ### class_avg_f### F.
(+) Os apoios para as mãos e o touchpad são mais frios que a temperatura da pele, com um máximo de 31 °C / 87.8 F e, portanto, são frios ao toque.
(-) A temperatura média da área do apoio para as mãos de dispositivos semelhantes foi 27.5 °C / 81.5 F (-3.5 °C / -6.3 F).
HP EliteBook 755 G5 3UN79EA análise de áudio
(-) | alto-falantes não muito altos (###valor### dB)
Graves 100 - 315Hz
(-) | quase nenhum baixo - em média 27.3% menor que a mediana
(±) | a linearidade dos graves é média (12.9% delta para a frequência anterior)
Médios 400 - 2.000 Hz
(+) | médios equilibrados - apenas 2.5% longe da mediana
(±) | a linearidade dos médios é média (9.5% delta para frequência anterior)
Altos 2 - 16 kHz
(+) | agudos equilibrados - apenas 3.4% longe da mediana
(+) | os máximos são lineares (4% delta da frequência anterior)
Geral 100 - 16.000 Hz
(±) | a linearidade do som geral é média (21% diferença em relação à mediana)
Comparado com a mesma classe
» 50% de todos os dispositivos testados nesta classe foram melhores, 10% semelhantes, 41% piores
» O melhor teve um delta de 7%, a média foi 21%, o pior foi 53%
Comparado com todos os dispositivos testados
» 58% de todos os dispositivos testados foram melhores, 7% semelhantes, 35% piores
» O melhor teve um delta de 4%, a média foi 23%, o pior foi 134%
Apple MacBook 12 (Early 2016) 1.1 GHz análise de áudio
(+) | os alto-falantes podem tocar relativamente alto (###valor### dB)
Graves 100 - 315Hz
(±) | graves reduzidos - em média 11.3% menor que a mediana
(±) | a linearidade dos graves é média (14.2% delta para a frequência anterior)
Médios 400 - 2.000 Hz
(+) | médios equilibrados - apenas 2.4% longe da mediana
(+) | médios são lineares (5.5% delta para frequência anterior)
Altos 2 - 16 kHz
(+) | agudos equilibrados - apenas 2% longe da mediana
(+) | os máximos são lineares (4.5% delta da frequência anterior)
Geral 100 - 16.000 Hz
(+) | o som geral é linear (10.2% diferença em relação à mediana)
Comparado com a mesma classe
» 7% de todos os dispositivos testados nesta classe foram melhores, 2% semelhantes, 90% piores
» O melhor teve um delta de 5%, a média foi 18%, o pior foi 53%
Comparado com todos os dispositivos testados
» 5% de todos os dispositivos testados foram melhores, 1% semelhantes, 94% piores
» O melhor teve um delta de 4%, a média foi 23%, o pior foi 134%
| desligado | |
| Ocioso | |
| Carga |
|
Key:
min: | |
| HP EliteBook 755 G5 3UN79EA R7 2700U, Vega 10, Toshiba XG5 KXG50ZNV512G, IPS, 1920x1080, 15.6" | HP EliteBook 745 G5 3UN74EA R7 2700U, Vega 10, Toshiba XG5 KXG50ZNV256G, IPS LED, 1920x1080, 14" | Lenovo ThinkPad T480s-20L7002AUS i5-8250U, UHD Graphics 620, Samsung PM961 MZVLW256HEHP, TFT-LCD, 1920x1080, 14" | Dell Latitude 5490 i7-8650U, UHD Graphics 620, Samsung PM961 MZVLW256HEHP, IPS, 1920x1080, 14" | HP EliteBook 755 G4 PRO A12-9800B, Radeon R7 (Bristol Ridge), Samsung PM961 MZVLW256HEHP, TN LED, 1920x1080, 15.6" | Média AMD Radeon RX Vega 10 | Média da turma Office | |
|---|---|---|---|---|---|---|---|
| Power Consumption | 15% | 33% | 19% | 4% | 16% | 7% | |
| Idle Minimum * (Watt) | 5 | 4.9 2% | 3.1 38% | 3.9 22% | 7 -40% | 4.73 ? 5% | 4.26 ? 15% |
| Idle Average * (Watt) | 10.6 | 8.1 24% | 6.4 40% | 6.2 42% | 10.9 -3% | 7.61 ? 28% | 7.31 ? 31% |
| Idle Maximum * (Watt) | 12.9 | 10.6 18% | 9.4 27% | 7.7 40% | 11 15% | 9.63 ? 25% | 8.55 ? 34% |
| Load Average * (Watt) | 40.6 | 32.2 21% | 29.8 27% | 43.9 -8% | 30.5 25% | 33.3 ? 18% | 43.8 ? -8% |
| Load Maximum * (Watt) | 46.6 | 42.3 9% | 31.2 33% | 47.7 -2% | 36.1 23% | 45.1 ? 3% | 64.5 ? -38% |
* ... menor é melhor
| HP EliteBook 755 G5 3UN79EA R7 2700U, Vega 10, 56 Wh | HP EliteBook 745 G5 3UN74EA R7 2700U, Vega 10, 50 Wh | Lenovo ThinkPad T480s-20L7002AUS i5-8250U, UHD Graphics 620, 57 Wh | Dell Latitude 5490 i7-8650U, UHD Graphics 620, 68 Wh | HP EliteBook 755 G4 PRO A12-9800B, Radeon R7 (Bristol Ridge), 51 Wh | Média da turma Office | |
|---|---|---|---|---|---|---|
| Duração da bateria | ||||||
| WiFi v1.3 (h) | 8.3 | 6.6 -20% | 9 8% | 11.6 40% | 4.3 -48% | 13.2 ? 59% |
Pro
Contra
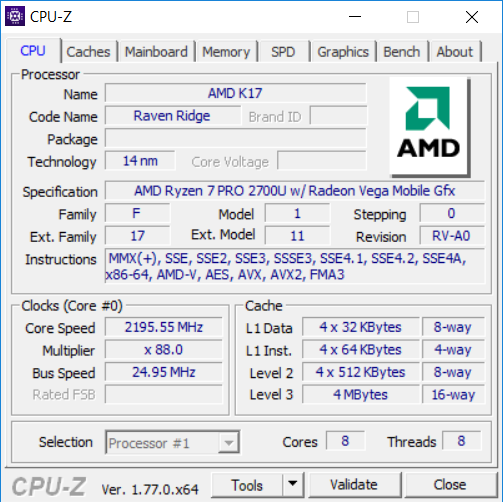
A HP oferece uma atualização de geração cultivada para os compradores do EliteBook 755 G5. O desempenho da CPU AMD Ryzen 7-2700U é bom, mas poderia ter sido ainda melhor com um resfriamento otimizado. A tampa inferior removível oferece aos usuários acesso ao interior, permitindo que eles executem tarefas de manutenção. A boa cobertura do espaço de cores é levemente diminuída pelo alto valor de preto e baixo contraste.
O HP EliteBook 755 G5 é um atraente portátil empresarial com desempenho suficiente também para tarefas mais exigentes e uma duração de bateria que dura um dia inteiro de trabalho.
Os usuários recebem um dispositivo que é apresentável com seu design atraente e oferece duração de bateria suficiente para um dia útil. O fato de que o consumo de energia é maior do que em outros dispositivos não tem consequências graves e, além disso, dificilmente há razões que falem contra a compra do HP EliteBook 755 G5.
HP EliteBook 755 G5 3UN79EA
- 07/24/2019 v6 (old)
Mike Wobker