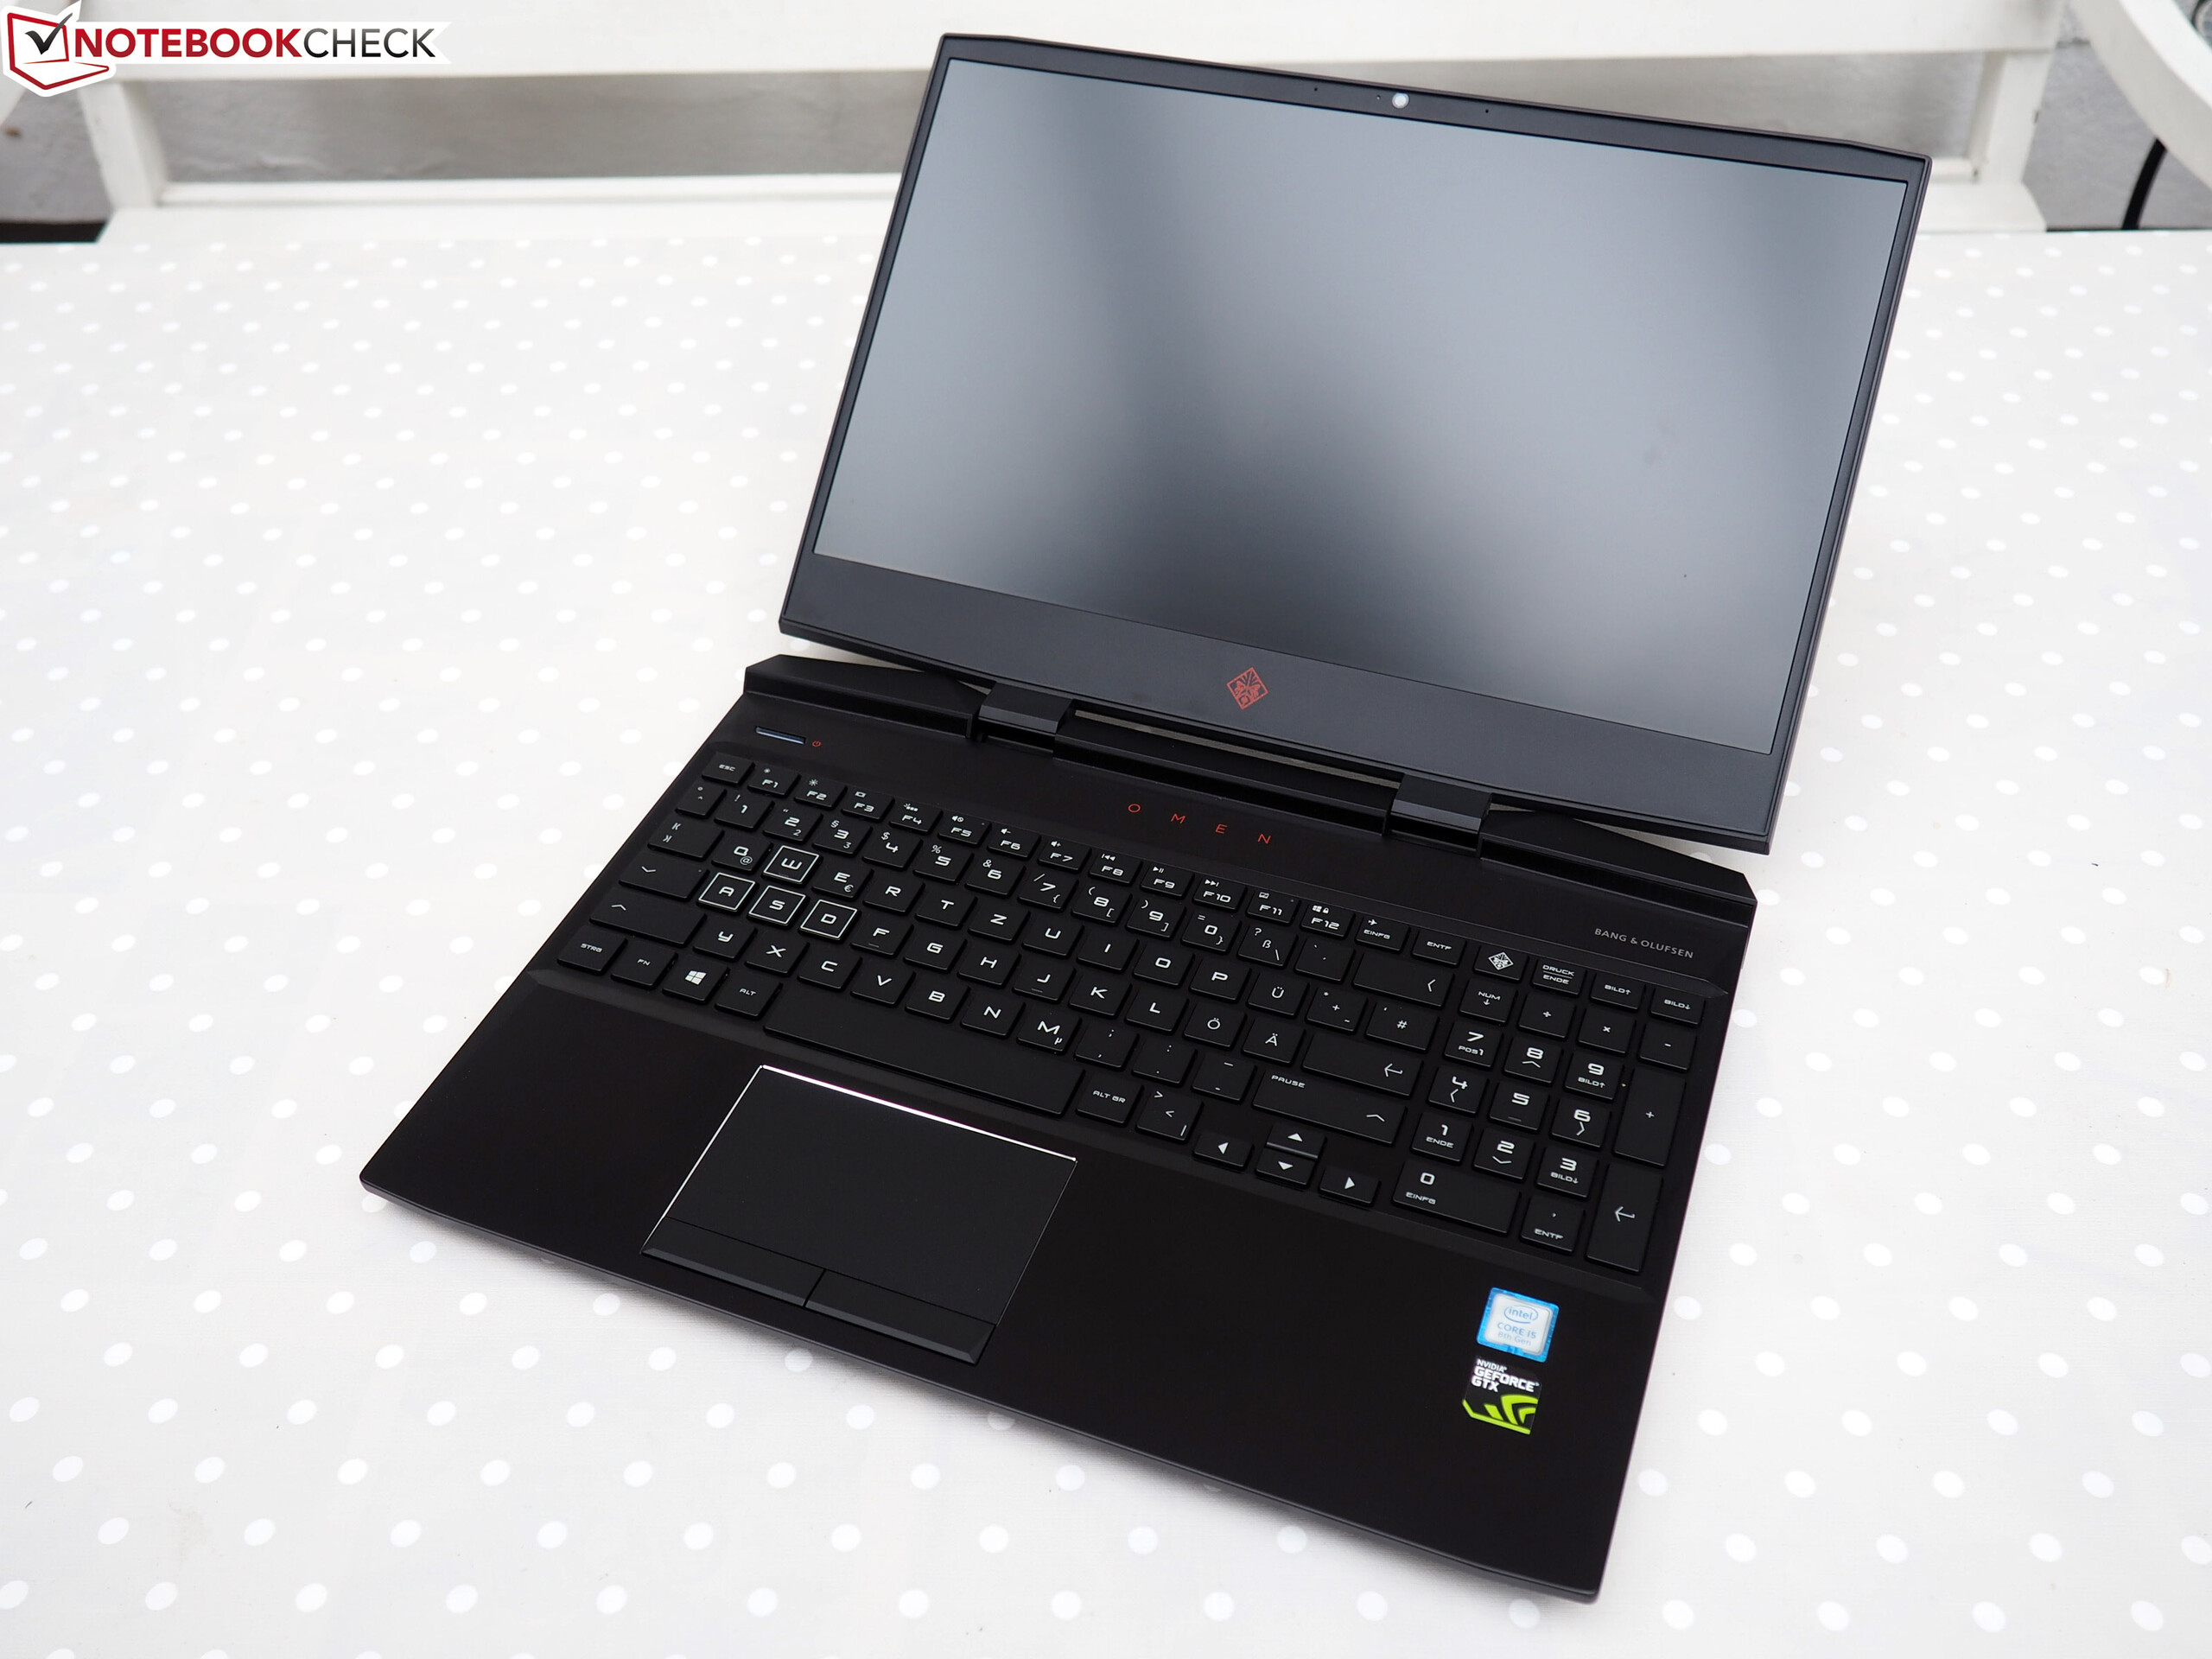
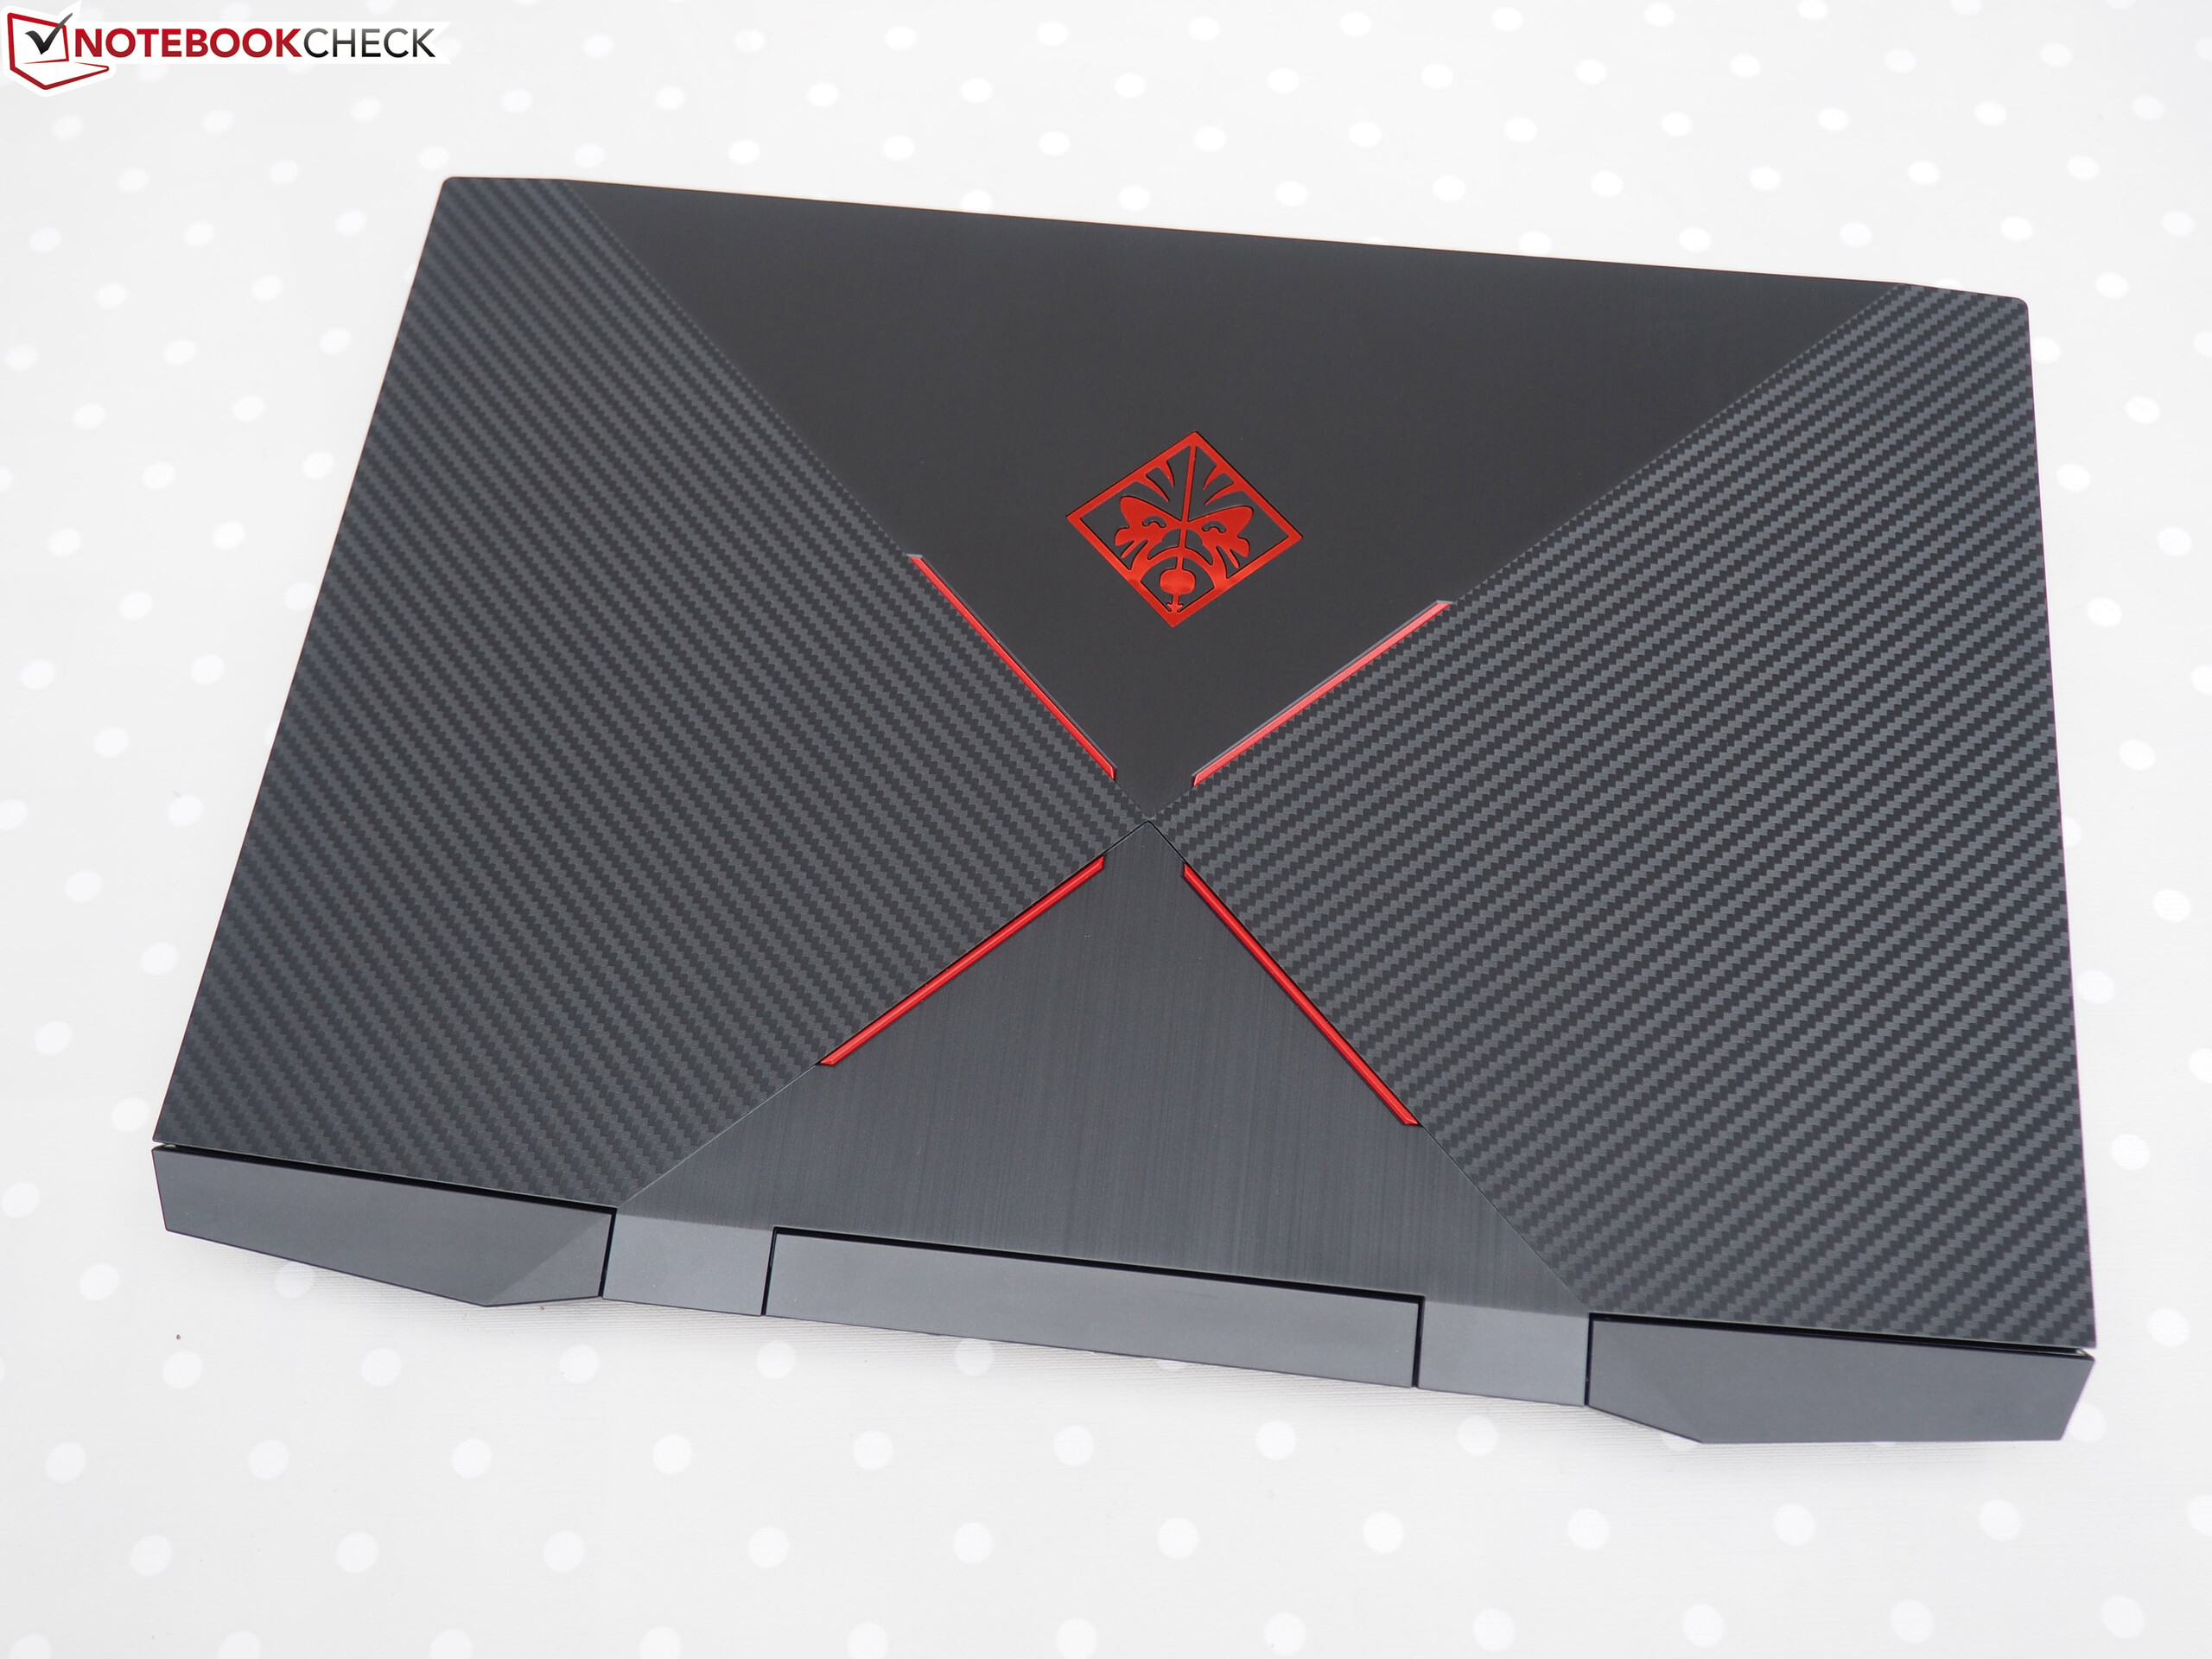
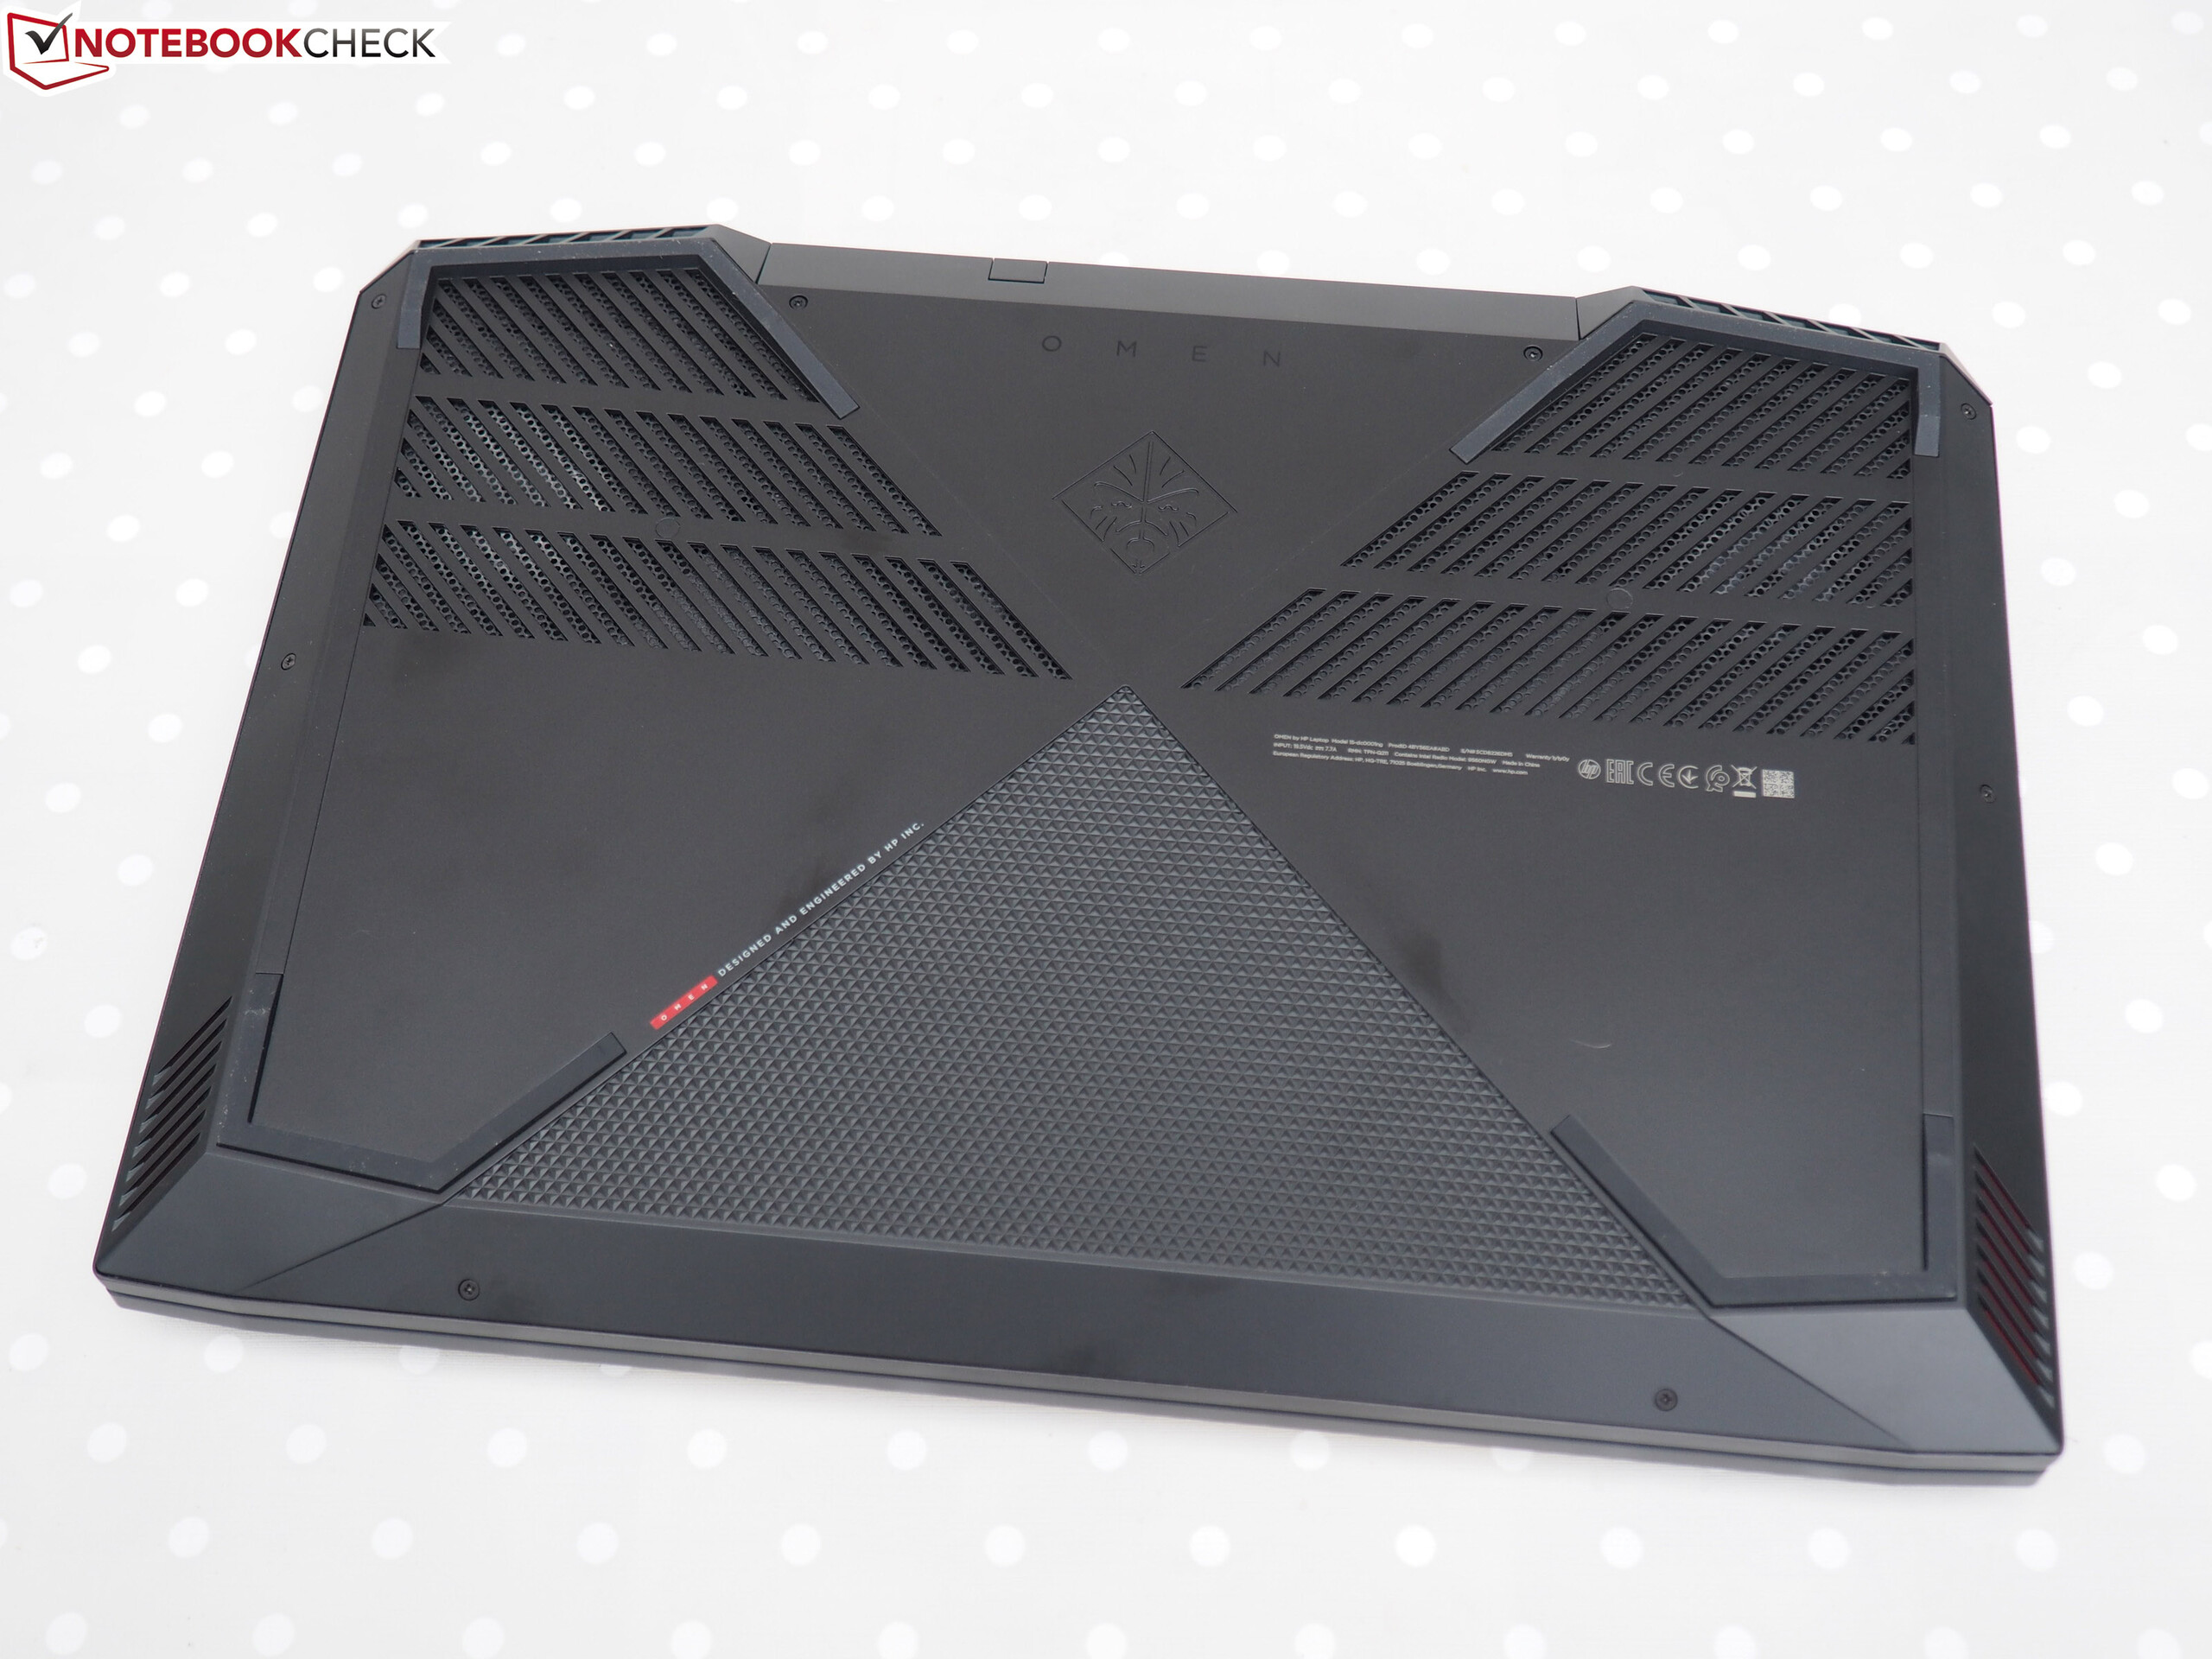
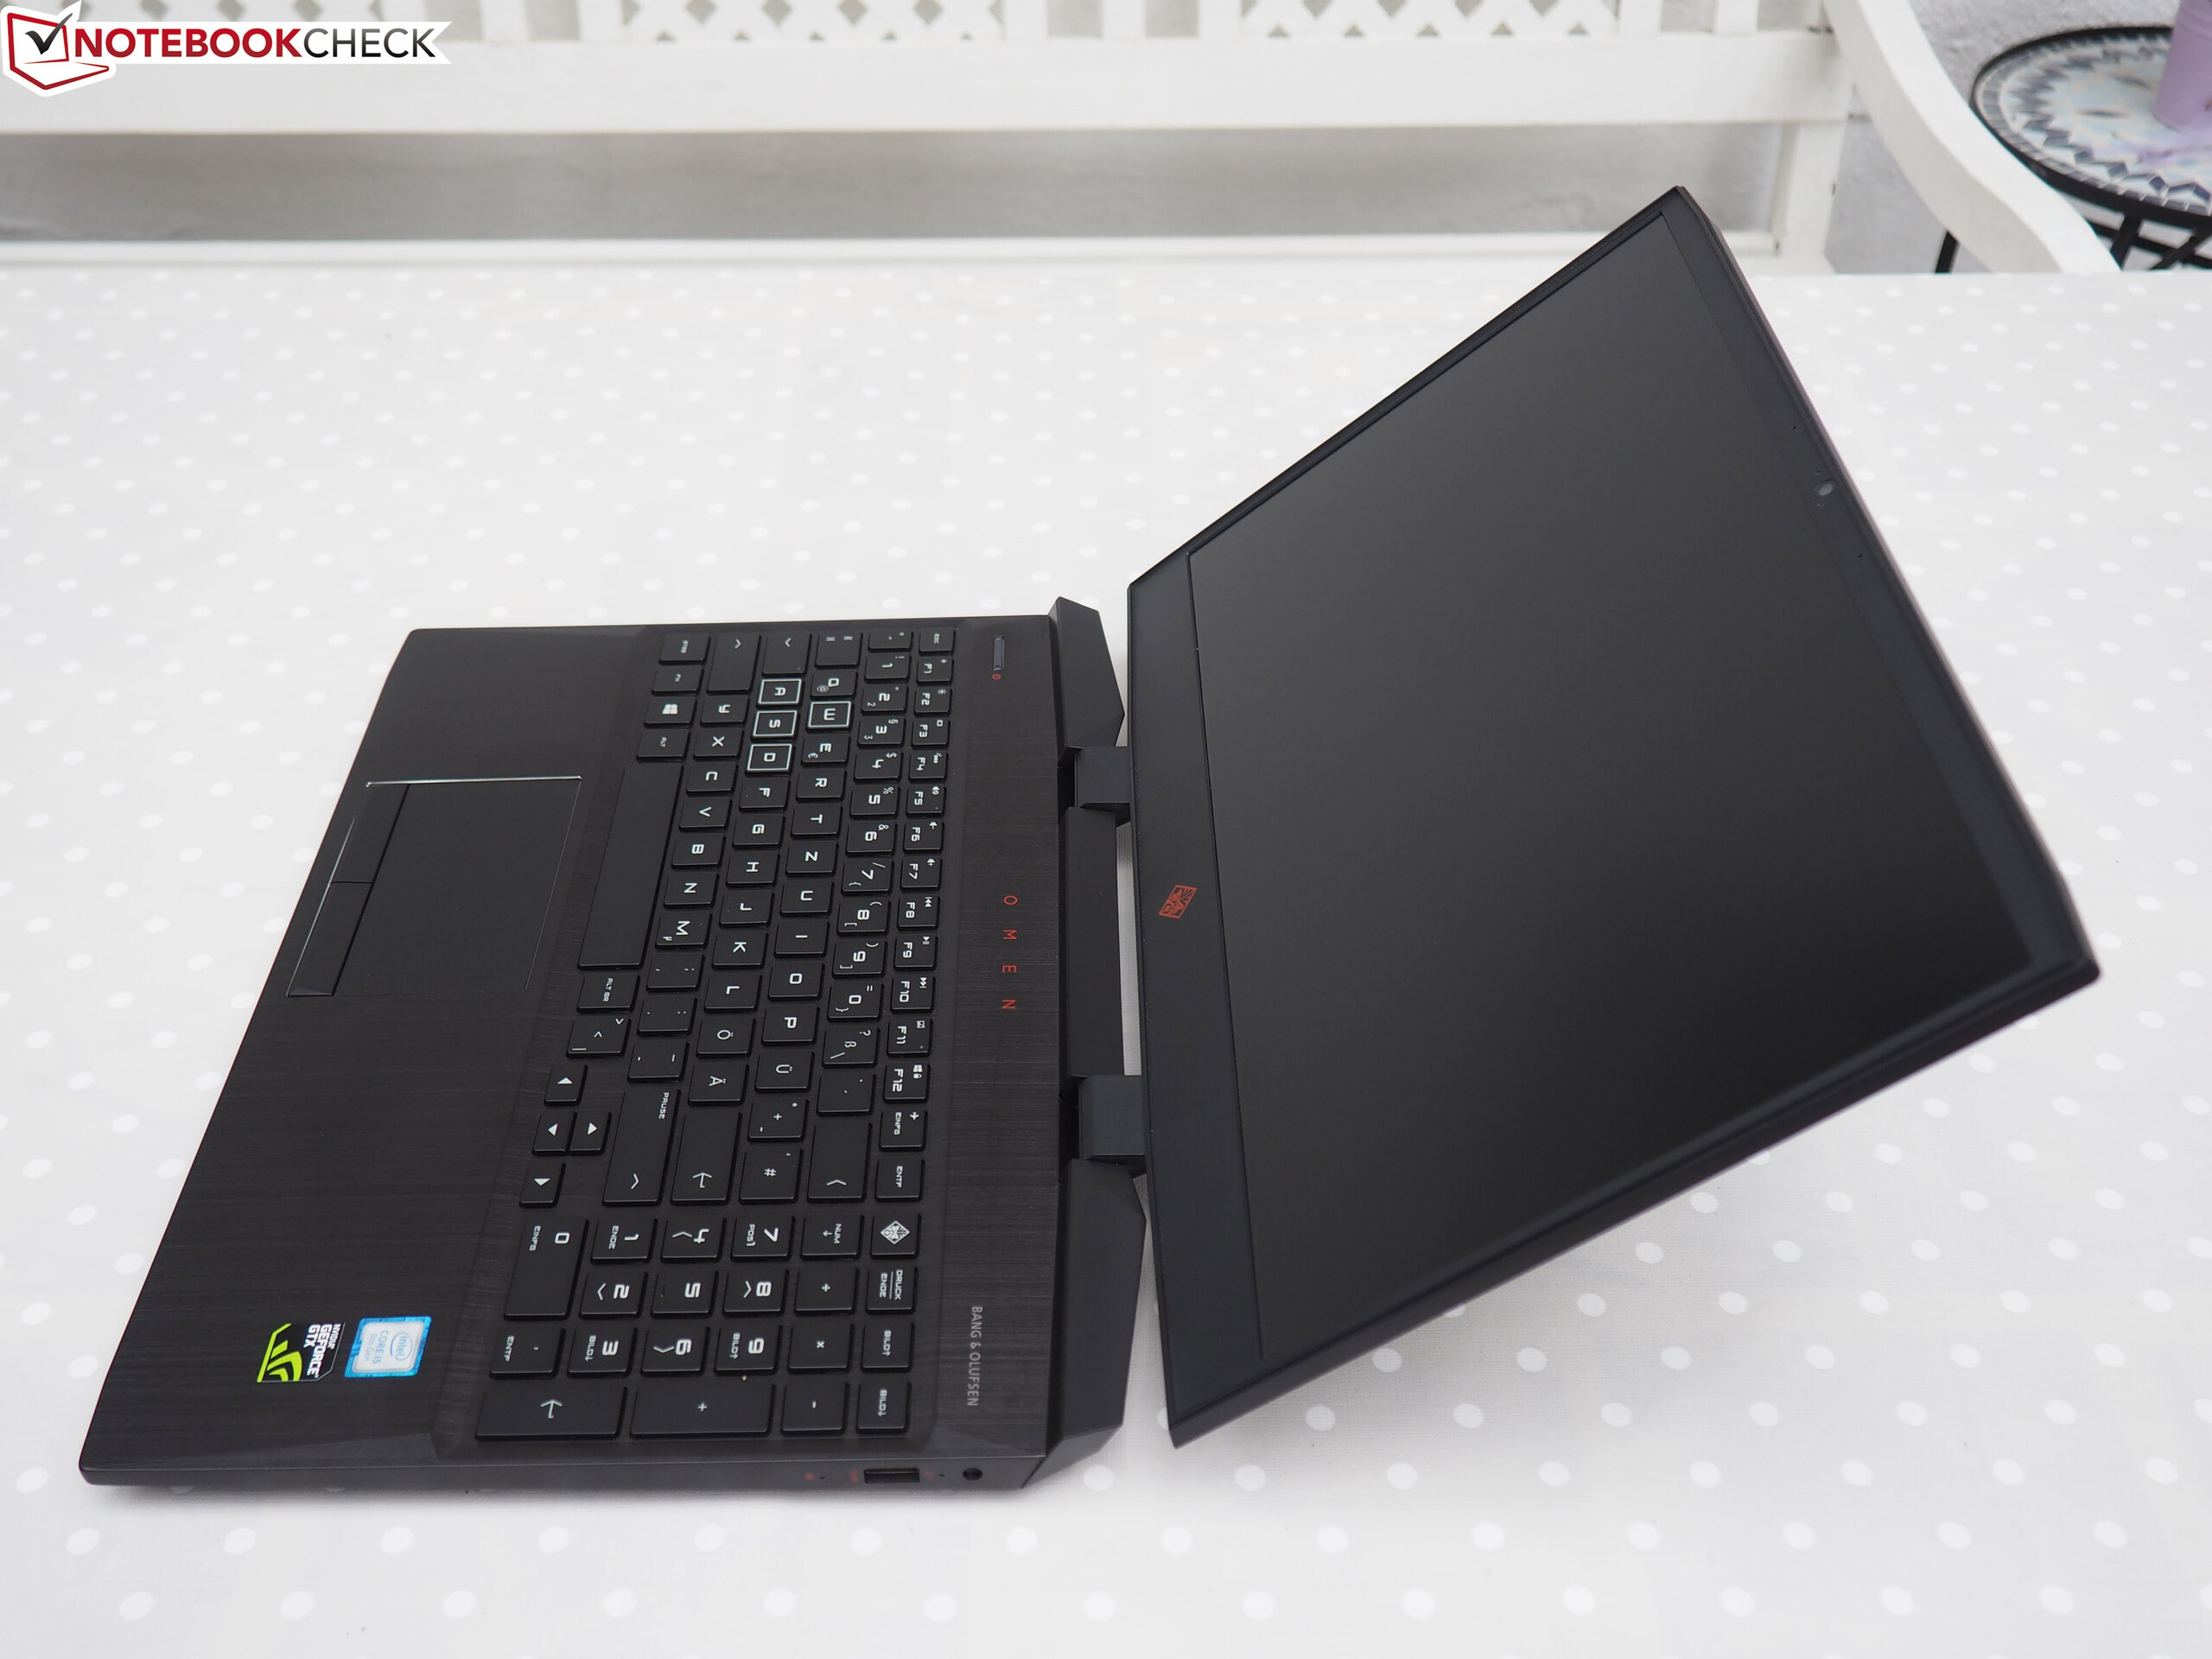
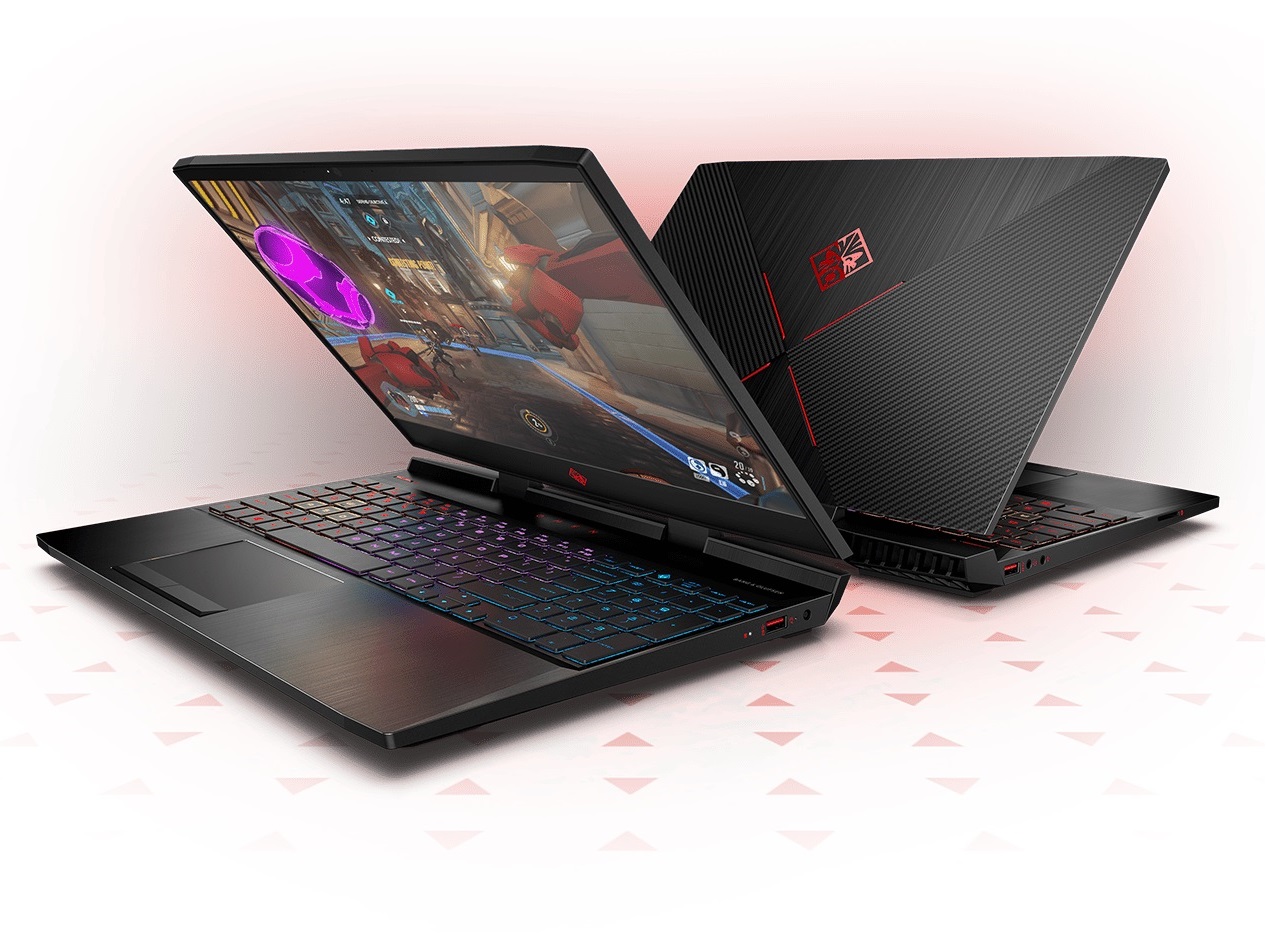
Breve Análise do Portátil HP Omen 15 (i5-8300H, GTX 1050 Ti, FHD)
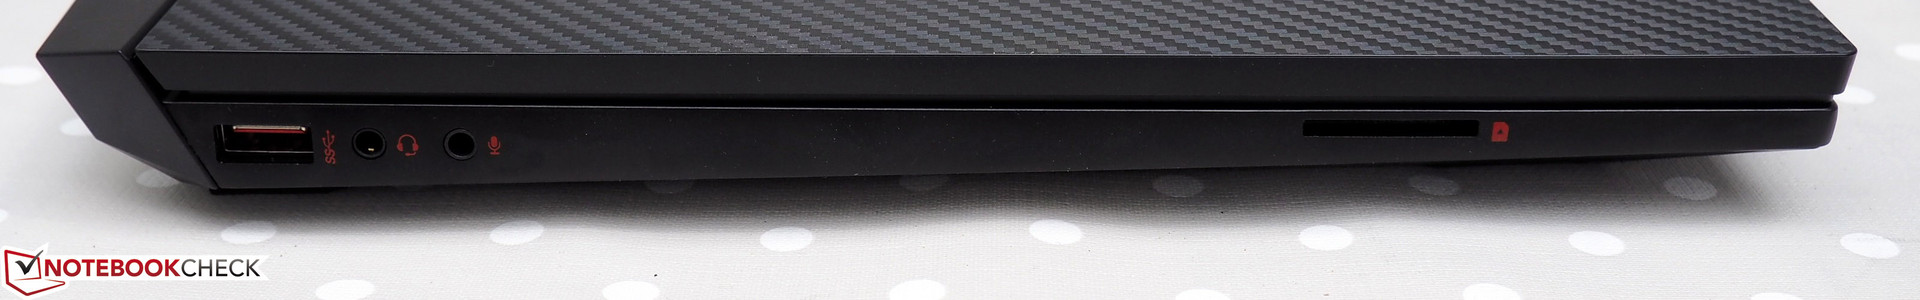
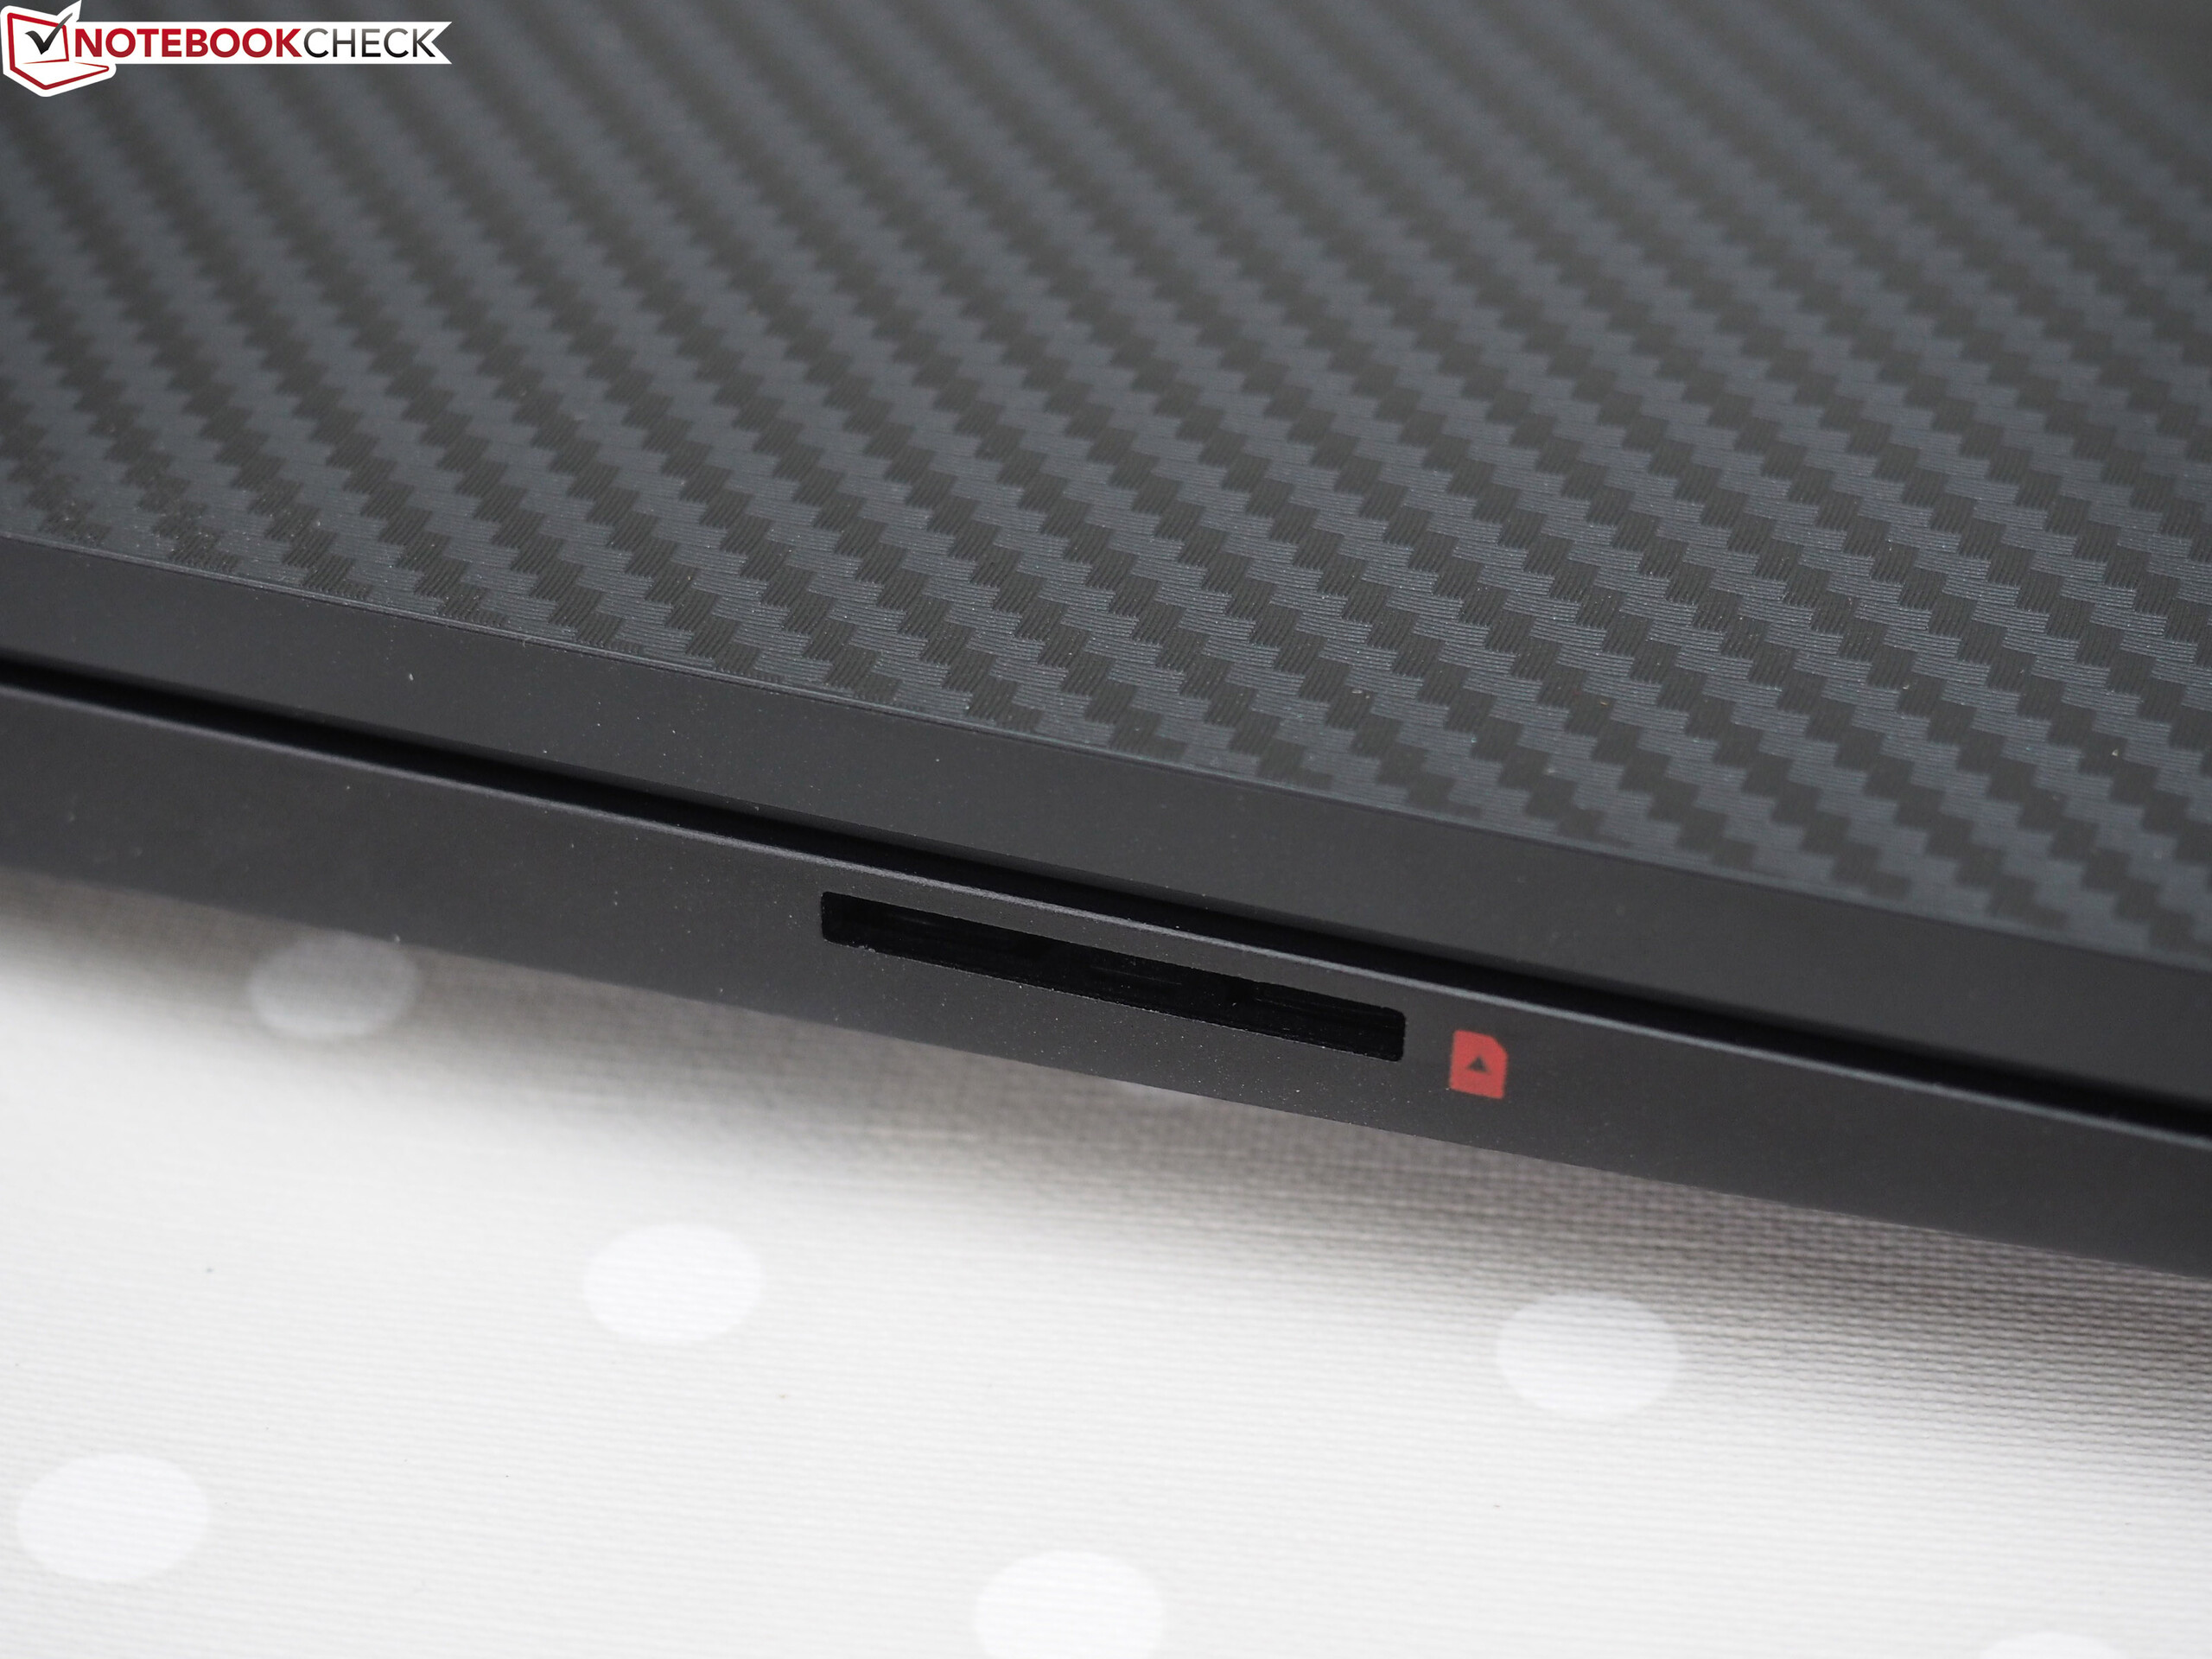
| SD Card Reader | |
| average JPG Copy Test (av. of 3 runs) | |
| HP Omen 15-dc0001ng (Toshiba Exceria Pro SDXC 64 GB UHS-II) | |
| HP Omen 15-ce002ng (Toshiba Exceria Pro SDXC 64 GB UHS-II) | |
| Acer Aspire 7 A715-71G-53TU (Toshiba Exceria Pro SDXC 64 GB UHS-II) | |
| Medion Erazer X6603 (oshiba Exceria Pro SDXC 64 GB UHS-II) | |
| Asus GL503VD-DB74 | |
| Xiaomi Mi Gaming Laptop 7300HQ 1060 (Toshiba Exceria Pro SDXC 64 GB UHS-II) | |
| Dell G5 15 5587 (Toshiba Exceria Pro SDXC 64 GB UHS-II) | |
| maximum AS SSD Seq Read Test (1GB) | |
| Asus GL503VD-DB74 | |
| HP Omen 15-ce002ng (Toshiba Exceria Pro SDXC 64 GB UHS-II) | |
| HP Omen 15-dc0001ng (Toshiba Exceria Pro SDXC 64 GB UHS-II) | |
| Acer Aspire 7 A715-71G-53TU (Toshiba Exceria Pro SDXC 64 GB UHS-II) | |
| Medion Erazer X6603 (oshiba Exceria Pro SDXC 64 GB UHS-II) | |
| Dell G5 15 5587 (Toshiba Exceria Pro SDXC 64 GB UHS-II) | |
| Xiaomi Mi Gaming Laptop 7300HQ 1060 (Toshiba Exceria Pro SDXC 64 GB UHS-II) | |
| |||||||||||||||||||||||||
iluminação: 90 %
iluminação com acumulador: 275 cd/m²
Contraste: 1019:1 (Preto: 0.27 cd/m²)
ΔE ColorChecker Calman: 4.62 | ∀{0.5-29.43 Ø4.71}
calibrated: 3.59
ΔE Greyscale Calman: 4.31 | ∀{0.09-98 Ø4.96}
59% sRGB (Argyll 1.6.3 3D)
38% AdobeRGB 1998 (Argyll 1.6.3 3D)
40.95% AdobeRGB 1998 (Argyll 3D)
59% sRGB (Argyll 3D)
39.64% Display P3 (Argyll 3D)
Gamma: 2.49
CCT: 7000 K
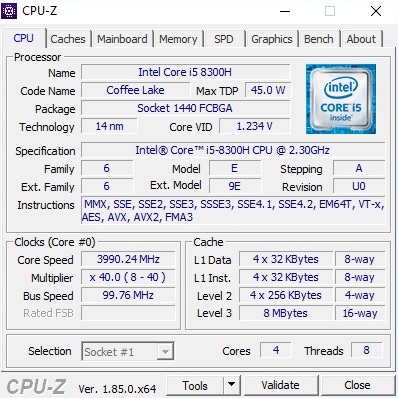
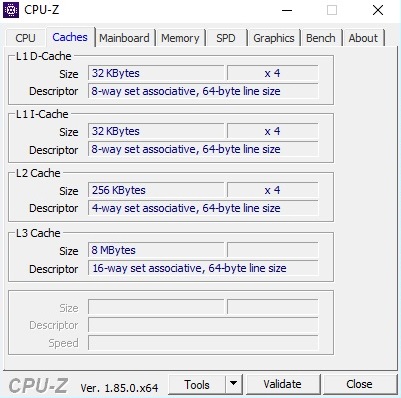
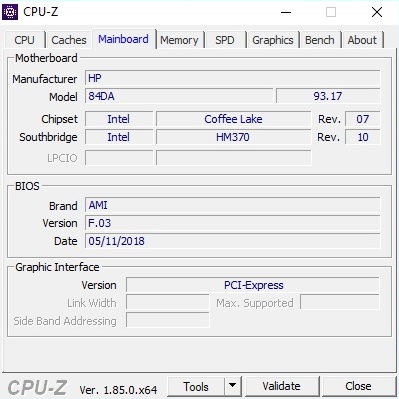
| HP Omen 15-dc0001ng BOE07A1, IPS, 1920x1080 | HP Omen 15-ce002ng AUO42ED, IPS, 1920x1080 | Dell G5 15 5587 LGD053F, 156WF6, IPS, 1920x1080 | Xiaomi Mi Gaming Laptop 7300HQ 1060 BOEhydis NV156FHM-N61 (BOE0747), IPS, 1920x1080 | Medion Erazer X6603 LP156WF6-SPK3, AH-IPS, LED, 1920x1080 | Acer Aspire 7 A715-71G-53TU BOE NV156FHM-N42 , a-Si TFT-LCD, IPS, 1920x1080 | Asus GL503VD-DB74 LG Philips LP156WF6, IPS, 1920x1080 | |
|---|---|---|---|---|---|---|---|
| Display | 61% | -4% | 57% | -7% | 2% | 52% | |
| Display P3 Coverage (%) | 39.64 | 65.8 66% | 38.13 -4% | 66.6 68% | 36.82 -7% | 40.53 2% | 64.3 62% |
| sRGB Coverage (%) | 59 | 90.9 54% | 56.8 -4% | 87.3 48% | 54.9 -7% | 59.9 2% | 84.4 43% |
| AdobeRGB 1998 Coverage (%) | 40.95 | 66.5 62% | 39.47 -4% | 63.8 56% | 38.09 -7% | 41.87 2% | 61.7 51% |
| Response Times | 6% | 28% | -21% | 7% | -8% | 21% | |
| Response Time Grey 50% / Grey 80% * (ms) | 47.2 ? | 43.2 ? 8% | 33 ? 30% | 53.2 ? -13% | 46 ? 3% | 49 ? -4% | 36.4 ? 23% |
| Response Time Black / White * (ms) | 32.4 ? | 31.2 ? 4% | 24 ? 26% | 41.6 ? -28% | 29 ? 10% | 36 ? -11% | 26.2 ? 19% |
| PWM Frequency (Hz) | 200 ? | 21550 ? | 2174 ? | 20000 ? | 21010 ? | ||
| Screen | 22% | -23% | 15% | -23% | -1% | 5% | |
| Brightness middle (cd/m²) | 275 | 304 11% | 229 -17% | 283 3% | 252 -8% | 267 -3% | 315.9 15% |
| Brightness (cd/m²) | 254 | 289 14% | 224 -12% | 269 6% | 246 -3% | 250 -2% | 304 20% |
| Brightness Distribution (%) | 90 | 86 -4% | 87 -3% | 87 -3% | 94 4% | 82 -9% | 88 -2% |
| Black Level * (cd/m²) | 0.27 | 0.26 4% | 0.28 -4% | 0.23 15% | 0.23 15% | 0.31 -15% | 0.37 -37% |
| Contrast (:1) | 1019 | 1169 15% | 818 -20% | 1230 21% | 1096 8% | 861 -16% | 854 -16% |
| Colorchecker dE 2000 * | 4.62 | 3.46 25% | 6.1 -32% | 4.68 -1% | 7.83 -69% | 4.65 -1% | 4.9 -6% |
| Colorchecker dE 2000 max. * | 8.05 | 7.72 4% | 12.2 -52% | 8 1% | 15.5 -93% | 8.2 -2% | 9.7 -20% |
| Colorchecker dE 2000 calibrated * | 3.59 | 6.12 -70% | 2.5 30% | ||||
| Greyscale dE 2000 * | 4.31 | 2.46 43% | 5.68 -32% | 4.32 -0% | 7.11 -65% | 2.65 39% | 3.8 12% |
| Gamma | 2.49 88% | 2.38 92% | 2.4 92% | 2.36 93% | 2.19 100% | 2.44 90% | 2.24 98% |
| CCT | 7000 93% | 6915 94% | 6989 93% | 7612 85% | 7930 82% | 6820 95% | 6847 95% |
| Color Space (Percent of AdobeRGB 1998) (%) | 38 | 59 55% | 36 -5% | 57 50% | 35 -8% | 38 0% | 55 45% |
| Color Space (Percent of sRGB) (%) | 59 | 91 54% | 57 -3% | 87 47% | 55 -7% | 59 0% | 84 42% |
| Média Total (Programa/Configurações) | 30% /
28% | 0% /
-13% | 17% /
19% | -8% /
-16% | -2% /
-1% | 26% /
17% |
* ... menor é melhor
Exibir tempos de resposta
| ↔ Tempo de resposta preto para branco | ||
|---|---|---|
| 32.4 ms ... ascensão ↗ e queda ↘ combinadas | ↗ 18 ms ascensão | 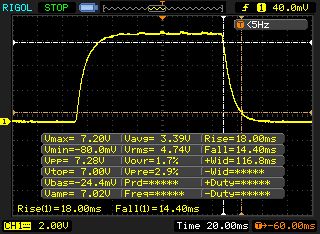 |
| ↘ 14.4 ms queda | ||
| A tela mostra taxas de resposta lentas em nossos testes e será insatisfatória para os jogadores. Em comparação, todos os dispositivos testados variam de 0.1 (mínimo) a 240 (máximo) ms. » 88 % de todos os dispositivos são melhores. Isso significa que o tempo de resposta medido é pior que a média de todos os dispositivos testados (19.8 ms). | ||
| ↔ Tempo de resposta 50% cinza a 80% cinza | ||
| 47.2 ms ... ascensão ↗ e queda ↘ combinadas | ↗ 23.6 ms ascensão | 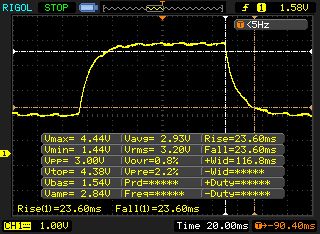 |
| ↘ 23.6 ms queda | ||
| A tela mostra taxas de resposta lentas em nossos testes e será insatisfatória para os jogadores. Em comparação, todos os dispositivos testados variam de 0.165 (mínimo) a 636 (máximo) ms. » 82 % de todos os dispositivos são melhores. Isso significa que o tempo de resposta medido é pior que a média de todos os dispositivos testados (31 ms). | ||
Cintilação da tela / PWM (modulação por largura de pulso)
| Tela tremeluzindo/PWM detectado | 200 Hz | ≤ 99 % configuração de brilho | 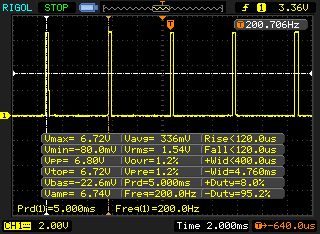 |
A luz de fundo da tela pisca em 200 Hz (pior caso, por exemplo, utilizando PWM) Cintilação detectada em uma configuração de brilho de 99 % e abaixo. Não deve haver cintilação ou PWM acima desta configuração de brilho. A frequência de 200 Hz é relativamente baixa, portanto, usuários sensíveis provavelmente notarão cintilação e sentirão fadiga ocular na configuração de brilho indicada e abaixo. [pwm_comparison] Em comparação: 52 % de todos os dispositivos testados não usam PWM para escurecer a tela. Se PWM foi detectado, uma média de 7754 (mínimo: 5 - máximo: 343500) Hz foi medida. | |||
| PCMark 10 - Score | |
| Dell G5 15 5587 | |
| HP Omen 15-ce002ng | |
| HP Omen 15-dc0001ng | |
| Medion Erazer X6603 | |
| Asus GL503VD-DB74 | |
| Xiaomi Mi Gaming Laptop 7300HQ 1060 | |
| Acer Aspire 7 A715-71G-53TU | |
| PCMark 8 Home Score Accelerated v2 | 4109 pontos | |
| PCMark 8 Work Score Accelerated v2 | 5362 pontos | |
| PCMark 10 Score | 4707 pontos | |
Ajuda | ||
| HP Omen 15-dc0001ng Toshiba KBG30ZMV128G | Dell G5 15 5587 SK hynix SC311 M.2 | Xiaomi Mi Gaming Laptop 7300HQ 1060 Samsung PM871b MZNLN128HAHQ | Medion Erazer X6603 Samsung PM961 MZVLW256HEHP | Acer Aspire 7 A715-71G-53TU Kingston RBUSNS8180DS3128GH | Asus GL503VD-DB74 ADATA SX7000NP 256 GB | |
|---|---|---|---|---|---|---|
| AS SSD | -7% | 48% | 257% | 51% | 155% | |
| Seq Read (MB/s) | 1238 | 511 -59% | 502 -59% | 2805 127% | 488.4 -61% | 1226 -1% |
| Seq Write (MB/s) | 123.5 | 243.7 97% | 450.1 264% | 1081 775% | 394.2 219% | 825 568% |
| 4K Read (MB/s) | 31.48 | 24.44 -22% | 38.11 21% | 46.58 48% | 36.25 15% | 31.4 0% |
| 4K Write (MB/s) | 79.3 | 62.2 -22% | 104.1 31% | 129.3 63% | 64.7 -18% | 110.7 40% |
| Score Read (Points) | 343 | 240 -30% | 343 0% | 1162 239% | 460 34% | 419 22% |
| Score Write (Points) | 195 | 199 2% | 302 55% | 750 285% | 395 103% | 851 336% |
| Score Total (Points) | 670 | 557 -17% | 834 24% | 2431 263% | 1099 64% | 1476 120% |

| 3DMark 11 Performance | 8908 pontos | |
| 3DMark Cloud Gate Standard Score | 22454 pontos | |
| 3DMark Fire Strike Score | 6653 pontos | |
Ajuda | ||
| 3DMark - 1920x1080 Fire Strike Graphics | |
| Xiaomi Mi Gaming Laptop 7300HQ 1060 | |
| Dell G5 15 5587 | |
| HP Omen 15-ce002ng | |
| Medion Erazer X6603 | |
| HP Omen 15-dc0001ng | |
| Acer Aspire 7 A715-71G-53TU | |
| Asus GL503VD-DB74 | |
| 3DMark 11 - 1280x720 Performance GPU | |
| Xiaomi Mi Gaming Laptop 7300HQ 1060 | |
| Dell G5 15 5587 | |
| HP Omen 15-ce002ng | |
| Medion Erazer X6603 | |
| HP Omen 15-dc0001ng | |
| Acer Aspire 7 A715-71G-53TU | |
| Asus GL503VD-DB74 | |
| The Witcher 3 | |
| 1920x1080 Ultra Graphics & Postprocessing (HBAO+) | |
| Xiaomi Mi Gaming Laptop 7300HQ 1060 | |
| Dell G5 15 5587 | |
| HP Omen 15-ce002ng | |
| HP Omen 15-dc0001ng | |
| Asus GL503VD-DB74 | |
| 1920x1080 High Graphics & Postprocessing (Nvidia HairWorks Off) | |
| Xiaomi Mi Gaming Laptop 7300HQ 1060 | |
| HP Omen 15-ce002ng | |
| Dell G5 15 5587 | |
| HP Omen 15-dc0001ng | |
| baixo | média | alto | ultra | |
|---|---|---|---|---|
| The Witcher 3 (2015) | 44.2 | 24.2 | ||
| Rainbow Six Siege (2015) | 88.3 | 66.6 | ||
| Overwatch (2016) | 117 | 71 | ||
| Mirror's Edge Catalyst (2016) | 47.5 | 43.3 | ||
| Farming Simulator 17 (2016) | 153 | 114 | ||
| Destiny 2 (2017) | 62.8 | 51.2 |
Barulho
| Ocioso |
| 29 / 33 / 41 dB |
| HDD |
| 33 dB |
| Carga |
| 44 / 49 dB |
 | ||
30 dB silencioso 40 dB(A) audível 50 dB(A) ruidosamente alto |
||
min: | ||
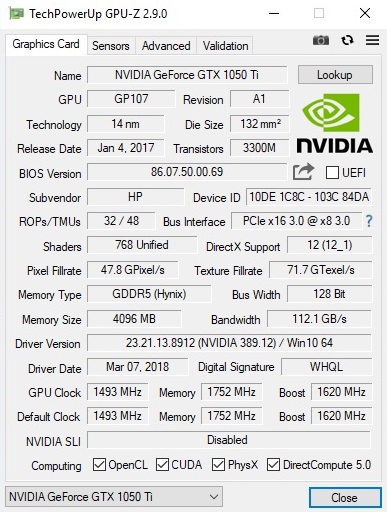
| HP Omen 15-dc0001ng GeForce GTX 1050 Ti Mobile, i5-8300H | HP Omen 15-ce002ng GeForce GTX 1060 Max-Q, i7-7700HQ | Dell G5 15 5587 GeForce GTX 1060 Max-Q, i5-8300H | Xiaomi Mi Gaming Laptop 7300HQ 1060 GeForce GTX 1060 Mobile, i5-7300HQ | Medion Erazer X6603 GeForce GTX 1050 Ti Mobile, i7-7700HQ | Acer Aspire 7 A715-71G-53TU GeForce GTX 1050 Mobile, i5-7300HQ | Asus GL503VD-DB74 GeForce GTX 1050 Mobile, i7-7700HQ | |
|---|---|---|---|---|---|---|---|
| Noise | 3% | 7% | -3% | 7% | 10% | 4% | |
| desligado / ambiente * (dB) | 29 | 30 -3% | 30.3 -4% | 30 -3% | 30.9 -7% | 30.4 -5% | 28.3 2% |
| Idle Minimum * (dB) | 29 | 30 -3% | 31.1 -7% | 30 -3% | 30.9 -7% | 30.4 -5% | 30.6 -6% |
| Idle Average * (dB) | 33 | 33 -0% | 31.1 6% | 34 -3% | 30.9 6% | 30.8 7% | 30.8 7% |
| Idle Maximum * (dB) | 41 | 37 10% | 34.2 17% | 38 7% | 31.6 23% | 30.8 25% | 32.8 20% |
| Load Average * (dB) | 44 | 41 7% | 34.9 21% | 44 -0% | 38.5 12% | 33.6 24% | 37.6 15% |
| Witcher 3 ultra * (dB) | 47 | 42 11% | 42.7 9% | 50 -6% | 47 -0% | ||
| Load Maximum * (dB) | 49 | 50 -2% | 44 10% | 55 -12% | 40.8 17% | 43.4 11% | 53.5 -9% |
* ... menor é melhor
(-) A temperatura máxima no lado superior é 51 °C / 124 F, em comparação com a média de 40.4 °C / 105 F , variando de 21.2 a 68.8 °C para a classe Gaming.
(-) A parte inferior aquece até um máximo de 58 °C / 136 F, em comparação com a média de 43.2 °C / 110 F
(±) Em uso inativo, a temperatura média para o lado superior é 32 °C / 90 F, em comparação com a média do dispositivo de 33.9 °C / ### class_avg_f### F.
(-) Jogando The Witcher 3, a temperatura média para o lado superior é 42 °C / 108 F, em comparação com a média do dispositivo de 33.9 °C / ## #class_avg_f### F.
(-) Os apoios para as mãos e o touchpad podem ficar muito quentes ao toque, com um máximo de 42 °C / 107.6 F.
(-) A temperatura média da área do apoio para as mãos de dispositivos semelhantes foi 28.8 °C / 83.8 F (-13.2 °C / -23.8 F).
| HP Omen 15-dc0001ng GeForce GTX 1050 Ti Mobile, i5-8300H | HP Omen 15-ce002ng GeForce GTX 1060 Max-Q, i7-7700HQ | Dell G5 15 5587 GeForce GTX 1060 Max-Q, i5-8300H | Xiaomi Mi Gaming Laptop 7300HQ 1060 GeForce GTX 1060 Mobile, i5-7300HQ | Medion Erazer X6603 GeForce GTX 1050 Ti Mobile, i7-7700HQ | Acer Aspire 7 A715-71G-53TU GeForce GTX 1050 Mobile, i5-7300HQ | Asus GL503VD-DB74 GeForce GTX 1050 Mobile, i7-7700HQ | |
|---|---|---|---|---|---|---|---|
| Heat | -1% | 10% | 10% | 26% | 19% | -2% | |
| Maximum Upper Side * (°C) | 51 | 47 8% | 50.2 2% | 46 10% | 44.3 13% | 41.6 18% | 60.4 -18% |
| Maximum Bottom * (°C) | 58 | 54 7% | 57 2% | 52 10% | 39.5 32% | 42.5 27% | 55.2 5% |
| Idle Upper Side * (°C) | 35 | 36 -3% | 28.6 18% | 32 9% | 24.8 29% | 29.7 15% | 32.4 7% |
| Idle Bottom * (°C) | 35 | 40 -14% | 28.9 17% | 32 9% | 24.6 30% | 29.4 16% | 36 -3% |
* ... menor é melhor
HP Omen 15-dc0001ng análise de áudio
(+) | os alto-falantes podem tocar relativamente alto (###valor### dB)
Graves 100 - 315Hz
(-) | quase nenhum baixo - em média 20.5% menor que a mediana
(±) | a linearidade dos graves é média (13.5% delta para a frequência anterior)
Médios 400 - 2.000 Hz
(+) | médios equilibrados - apenas 4.1% longe da mediana
(+) | médios são lineares (4.7% delta para frequência anterior)
Altos 2 - 16 kHz
(+) | agudos equilibrados - apenas 1.9% longe da mediana
(+) | os máximos são lineares (4.4% delta da frequência anterior)
Geral 100 - 16.000 Hz
(±) | a linearidade do som geral é média (15.9% diferença em relação à mediana)
Comparado com a mesma classe
» 38% de todos os dispositivos testados nesta classe foram melhores, 7% semelhantes, 56% piores
» O melhor teve um delta de 6%, a média foi 18%, o pior foi 132%
Comparado com todos os dispositivos testados
» 25% de todos os dispositivos testados foram melhores, 5% semelhantes, 70% piores
» O melhor teve um delta de 4%, a média foi 23%, o pior foi 134%
HP Omen 15-ce002ng análise de áudio
(±) | o volume do alto-falante é médio, mas bom (###valor### dB)
Graves 100 - 315Hz
(±) | graves reduzidos - em média 12.9% menor que a mediana
(±) | a linearidade dos graves é média (14.8% delta para a frequência anterior)
Médios 400 - 2.000 Hz
(+) | médios equilibrados - apenas 3.5% longe da mediana
(+) | médios são lineares (3.3% delta para frequência anterior)
Altos 2 - 16 kHz
(+) | agudos equilibrados - apenas 2.9% longe da mediana
(+) | os máximos são lineares (5% delta da frequência anterior)
Geral 100 - 16.000 Hz
(+) | o som geral é linear (13.6% diferença em relação à mediana)
Comparado com a mesma classe
» 20% de todos os dispositivos testados nesta classe foram melhores, 7% semelhantes, 73% piores
» O melhor teve um delta de 6%, a média foi 18%, o pior foi 132%
Comparado com todos os dispositivos testados
» 15% de todos os dispositivos testados foram melhores, 4% semelhantes, 82% piores
» O melhor teve um delta de 4%, a média foi 23%, o pior foi 134%
| desligado | |
| Ocioso | |
| Carga |
|
Key:
min: | |
| HP Omen 15-dc0001ng GeForce GTX 1050 Ti Mobile, i5-8300H | HP Omen 15-ce002ng GeForce GTX 1060 Max-Q, i7-7700HQ | Dell G5 15 5587 GeForce GTX 1060 Max-Q, i5-8300H | Xiaomi Mi Gaming Laptop 7300HQ 1060 GeForce GTX 1060 Mobile, i5-7300HQ | Medion Erazer X6603 GeForce GTX 1050 Ti Mobile, i7-7700HQ | Acer Aspire 7 A715-71G-53TU GeForce GTX 1050 Mobile, i5-7300HQ | Asus GL503VD-DB74 GeForce GTX 1050 Mobile, i7-7700HQ | |
|---|---|---|---|---|---|---|---|
| Power Consumption | -30% | 23% | 6% | 38% | 40% | 20% | |
| Idle Minimum * (Watt) | 12 | 18 -50% | 4.9 59% | 10 17% | 4.7 61% | 4 67% | 8.2 32% |
| Idle Average * (Watt) | 14 | 23 -64% | 8.5 39% | 13 7% | 7.6 46% | 6.9 51% | 11.1 21% |
| Idle Maximum * (Watt) | 18 | 30 -67% | 9.1 49% | 19 -6% | 9.2 49% | 9.4 48% | 11.8 34% |
| Load Average * (Watt) | 92 | 85 8% | 90.7 1% | 68 26% | 81 12% | 72.6 21% | 81 12% |
| Witcher 3 ultra * (Watt) | 100 | 96 4% | 110 -10% | 110 -10% | 95.1 5% | ||
| Load Maximum * (Watt) | 142 | 158 -11% | 144 -1% | 136 4% | 112 21% | 122 14% | 123.3 13% |
* ... menor é melhor
| HP Omen 15-dc0001ng GeForce GTX 1050 Ti Mobile, i5-8300H, 70 Wh | HP Omen 15-ce002ng GeForce GTX 1060 Max-Q, i7-7700HQ, 70 Wh | Dell G5 15 5587 GeForce GTX 1060 Max-Q, i5-8300H, 56 Wh | Xiaomi Mi Gaming Laptop 7300HQ 1060 GeForce GTX 1060 Mobile, i5-7300HQ, 55 Wh | Medion Erazer X6603 GeForce GTX 1050 Ti Mobile, i7-7700HQ, 45 Wh | Acer Aspire 7 A715-71G-53TU GeForce GTX 1050 Mobile, i5-7300HQ, 48 Wh | Asus GL503VD-DB74 GeForce GTX 1050 Mobile, i7-7700HQ, 64 Wh | |
|---|---|---|---|---|---|---|---|
| Duração da bateria | -51% | -6% | -40% | -52% | -23% | -21% | |
| Reader / Idle (h) | 10.4 | 4.3 -59% | 11.8 13% | 6.4 -38% | 5.7 -45% | 9.9 -5% | 10.8 4% |
| H.264 (h) | 8.4 | 3.7 -56% | 5.4 -36% | 4.4 -48% | 3.8 -55% | 5.1 -39% | |
| WiFi v1.3 (h) | 8.6 | 3.3 -62% | 6.5 -24% | 4.6 -47% | 4.3 -50% | 5.6 -35% | 5.8 -33% |
| Load (h) | 1.8 | 1.3 -28% | 2.2 22% | 1.3 -28% | 0.8 -56% | 1.6 -11% | 1.2 -33% |
Pro
Contra
O Omen 15 de nível de entrada acabou por ser um dos melhores portáteis de jogos na faixa de preço de menos de $1.000.
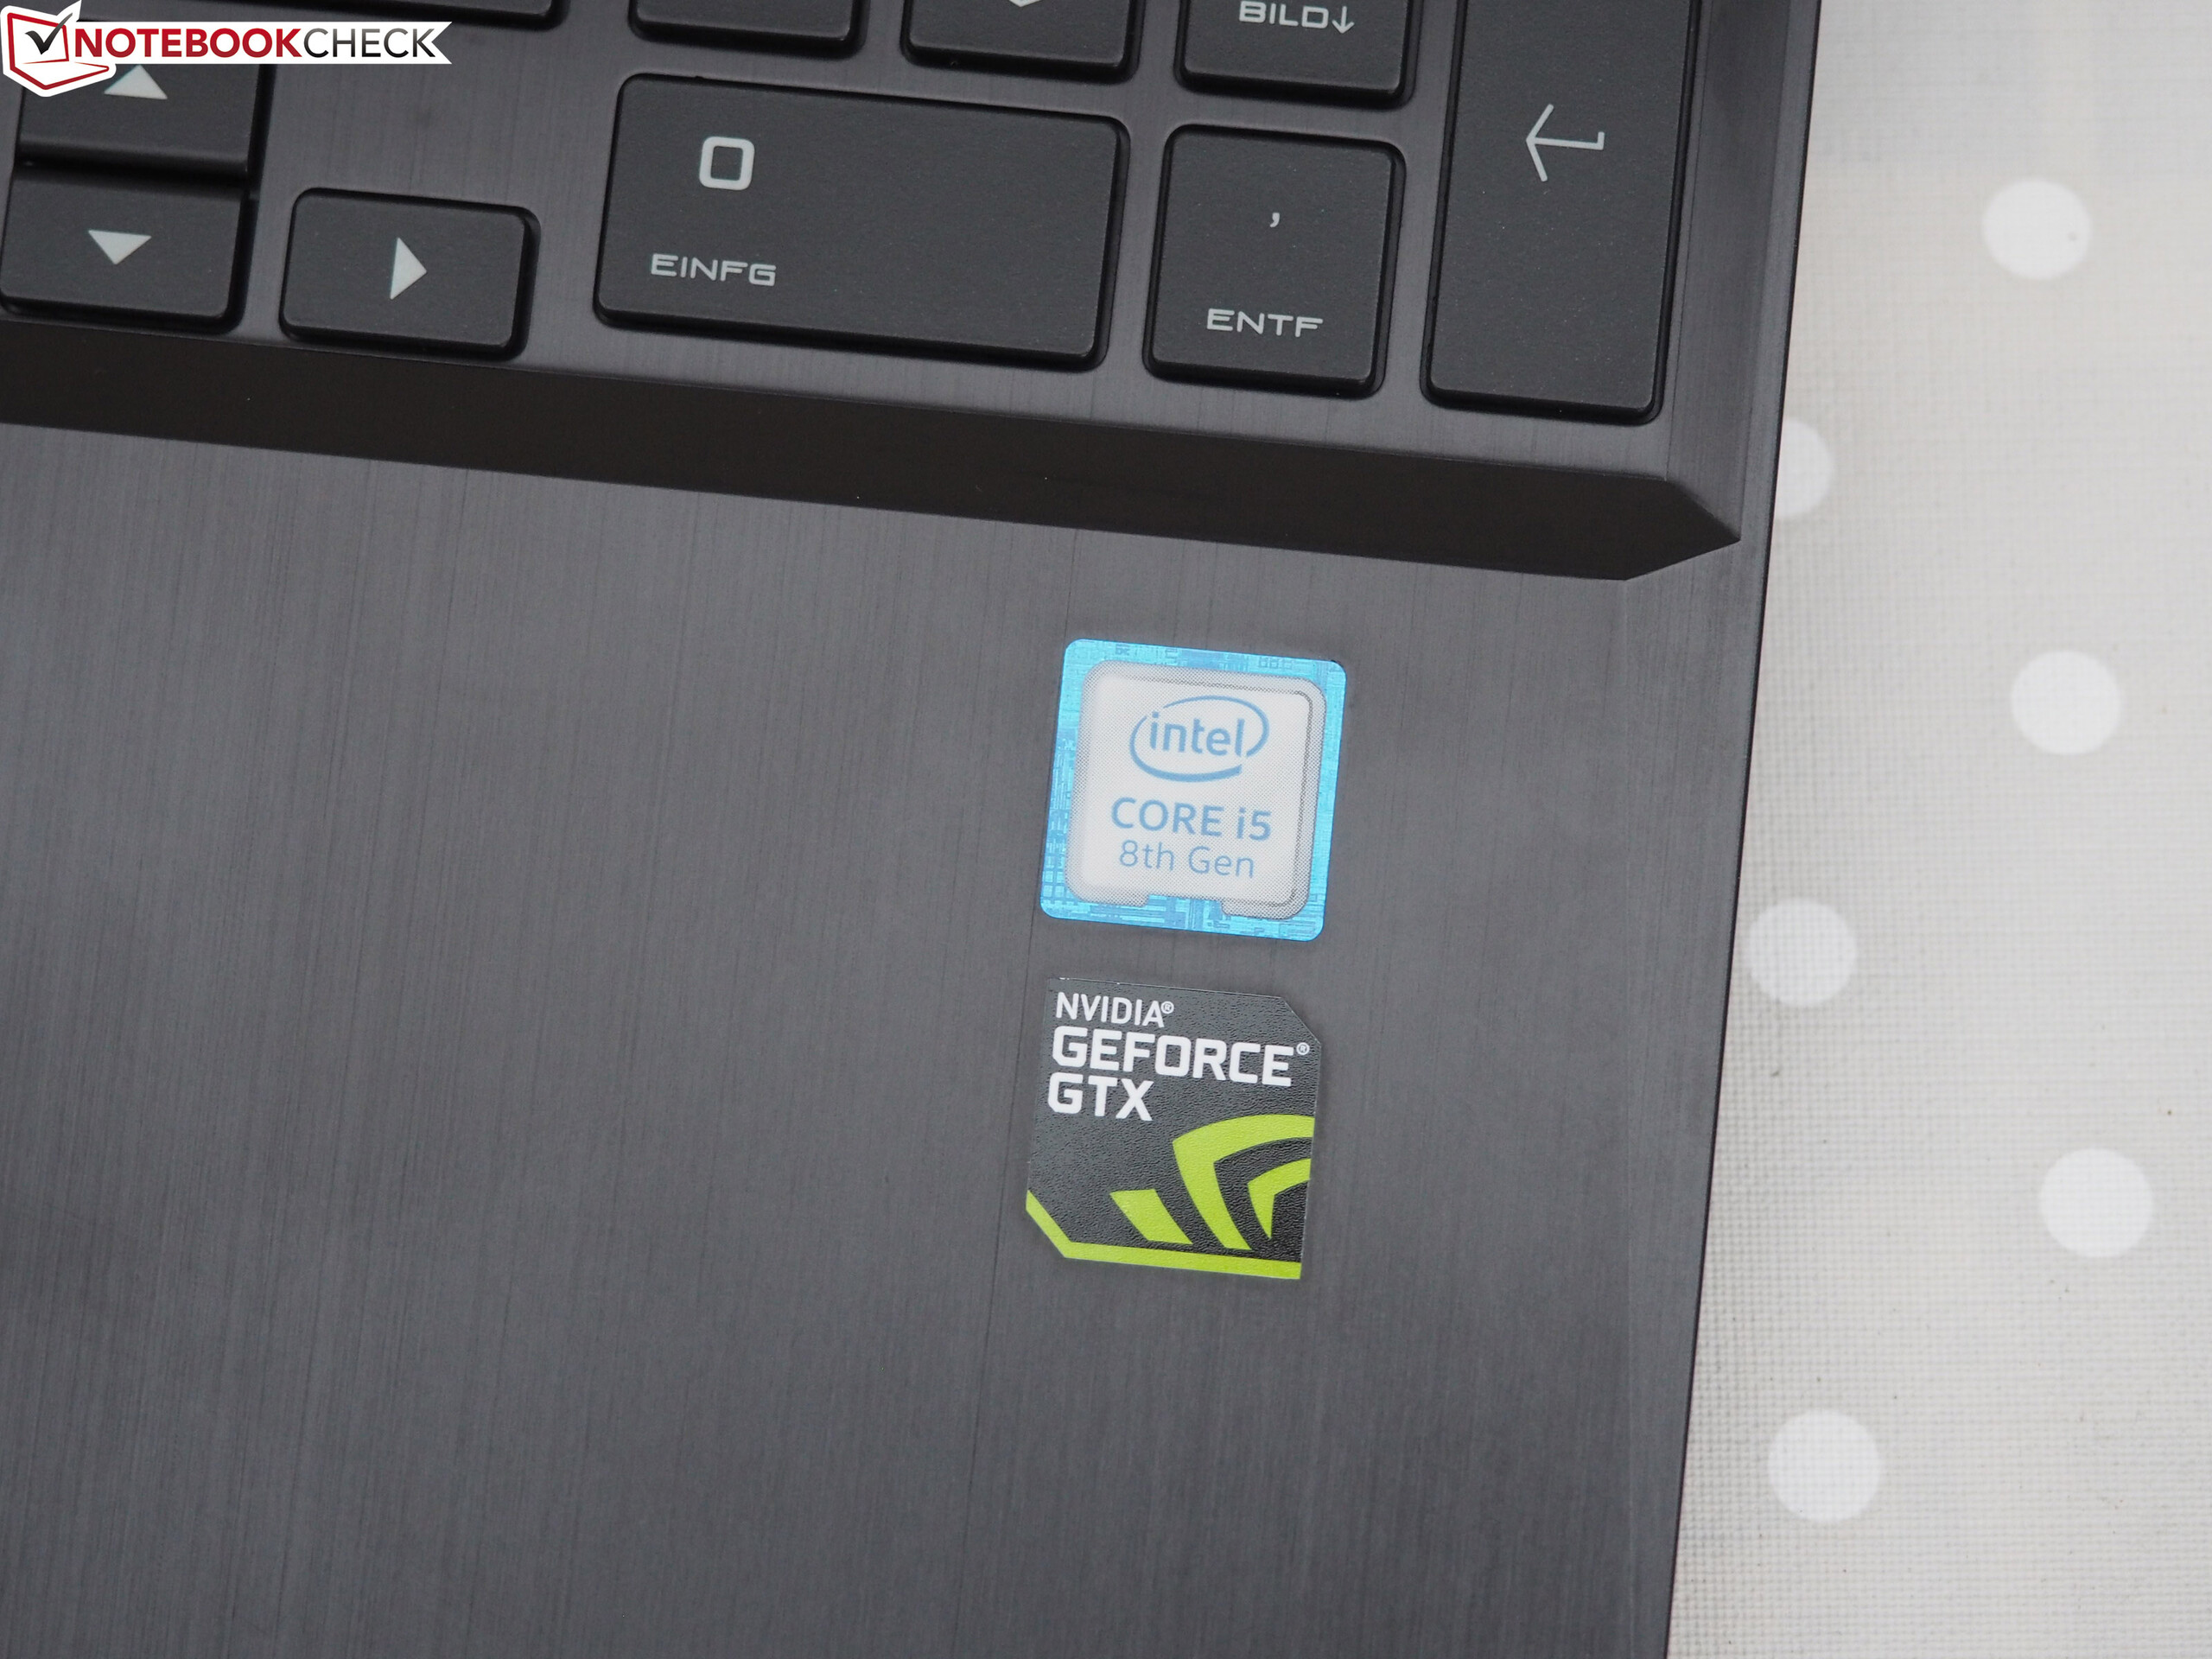
Verdade, a combinação do Core i5 2430M, GeForce GTX 1050 Ti, e 8 GB de RAM DDR4 pode não estar particularmente preparado para o futuro. No entanto, atualmente o Omen 15 de 15 polegadas pode rodar quase todos os jogos com configurações altas ou máximas e, portanto, é ideal para jogadores com orçamento limitado.
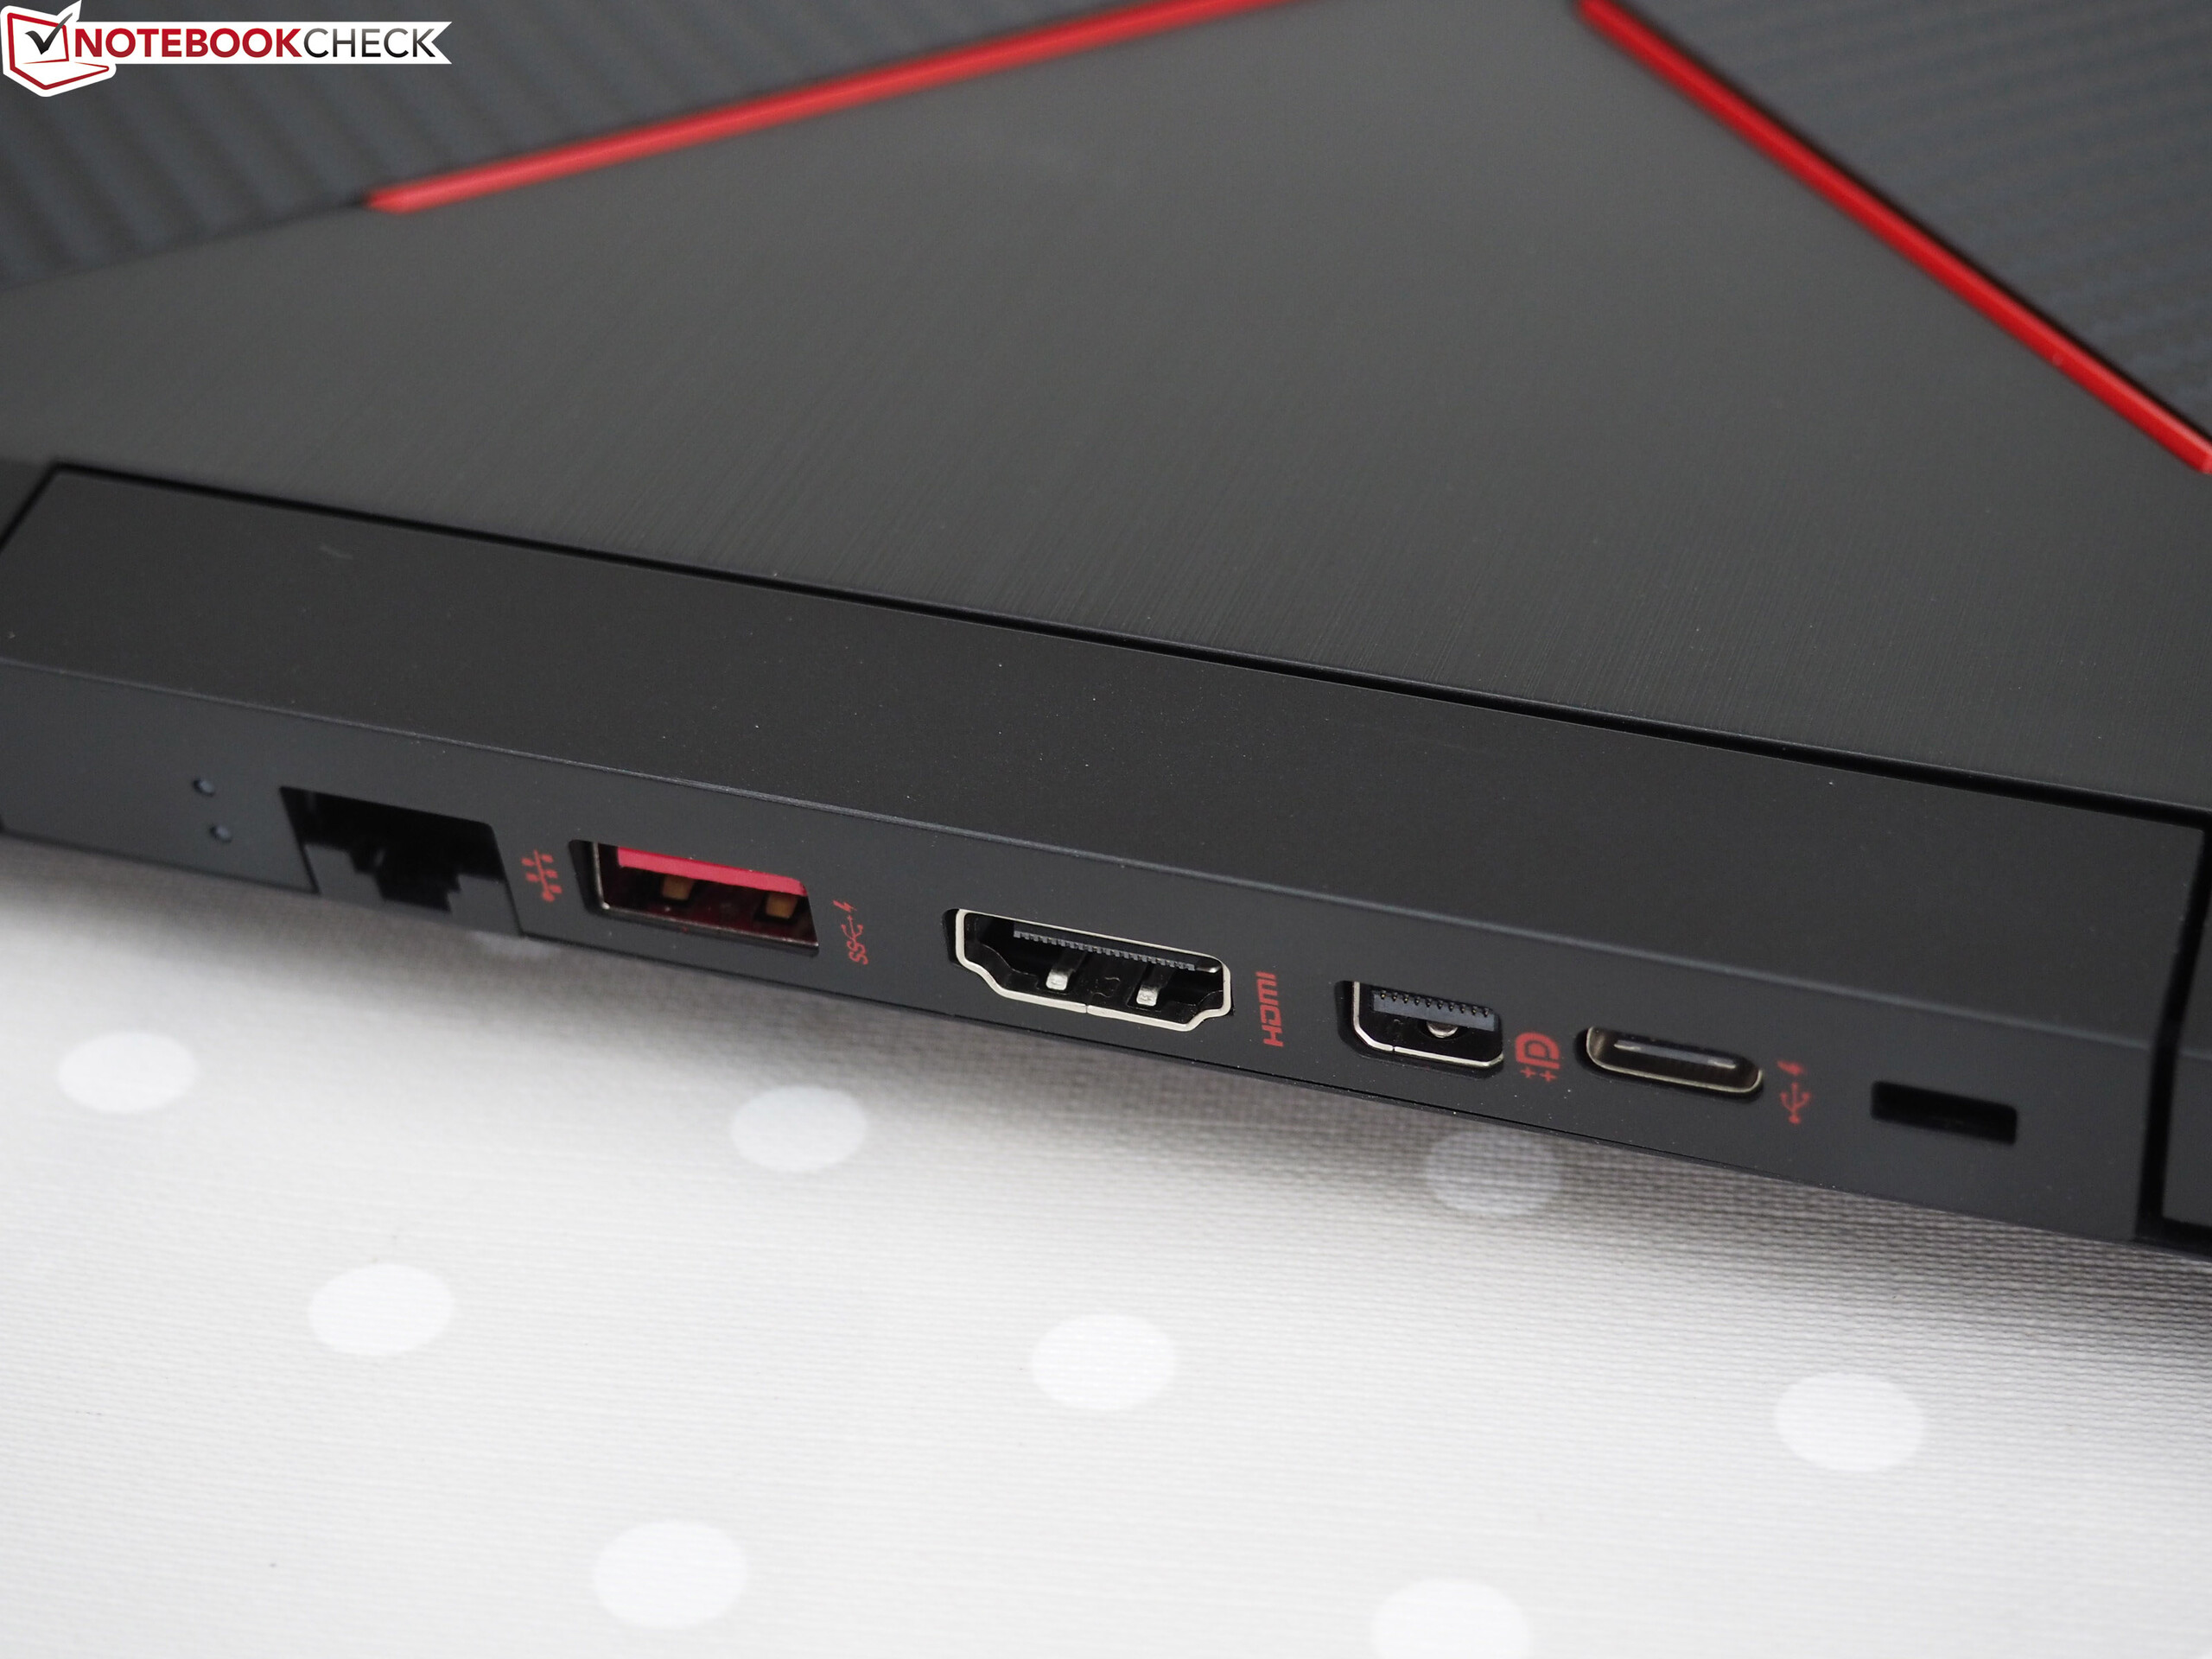
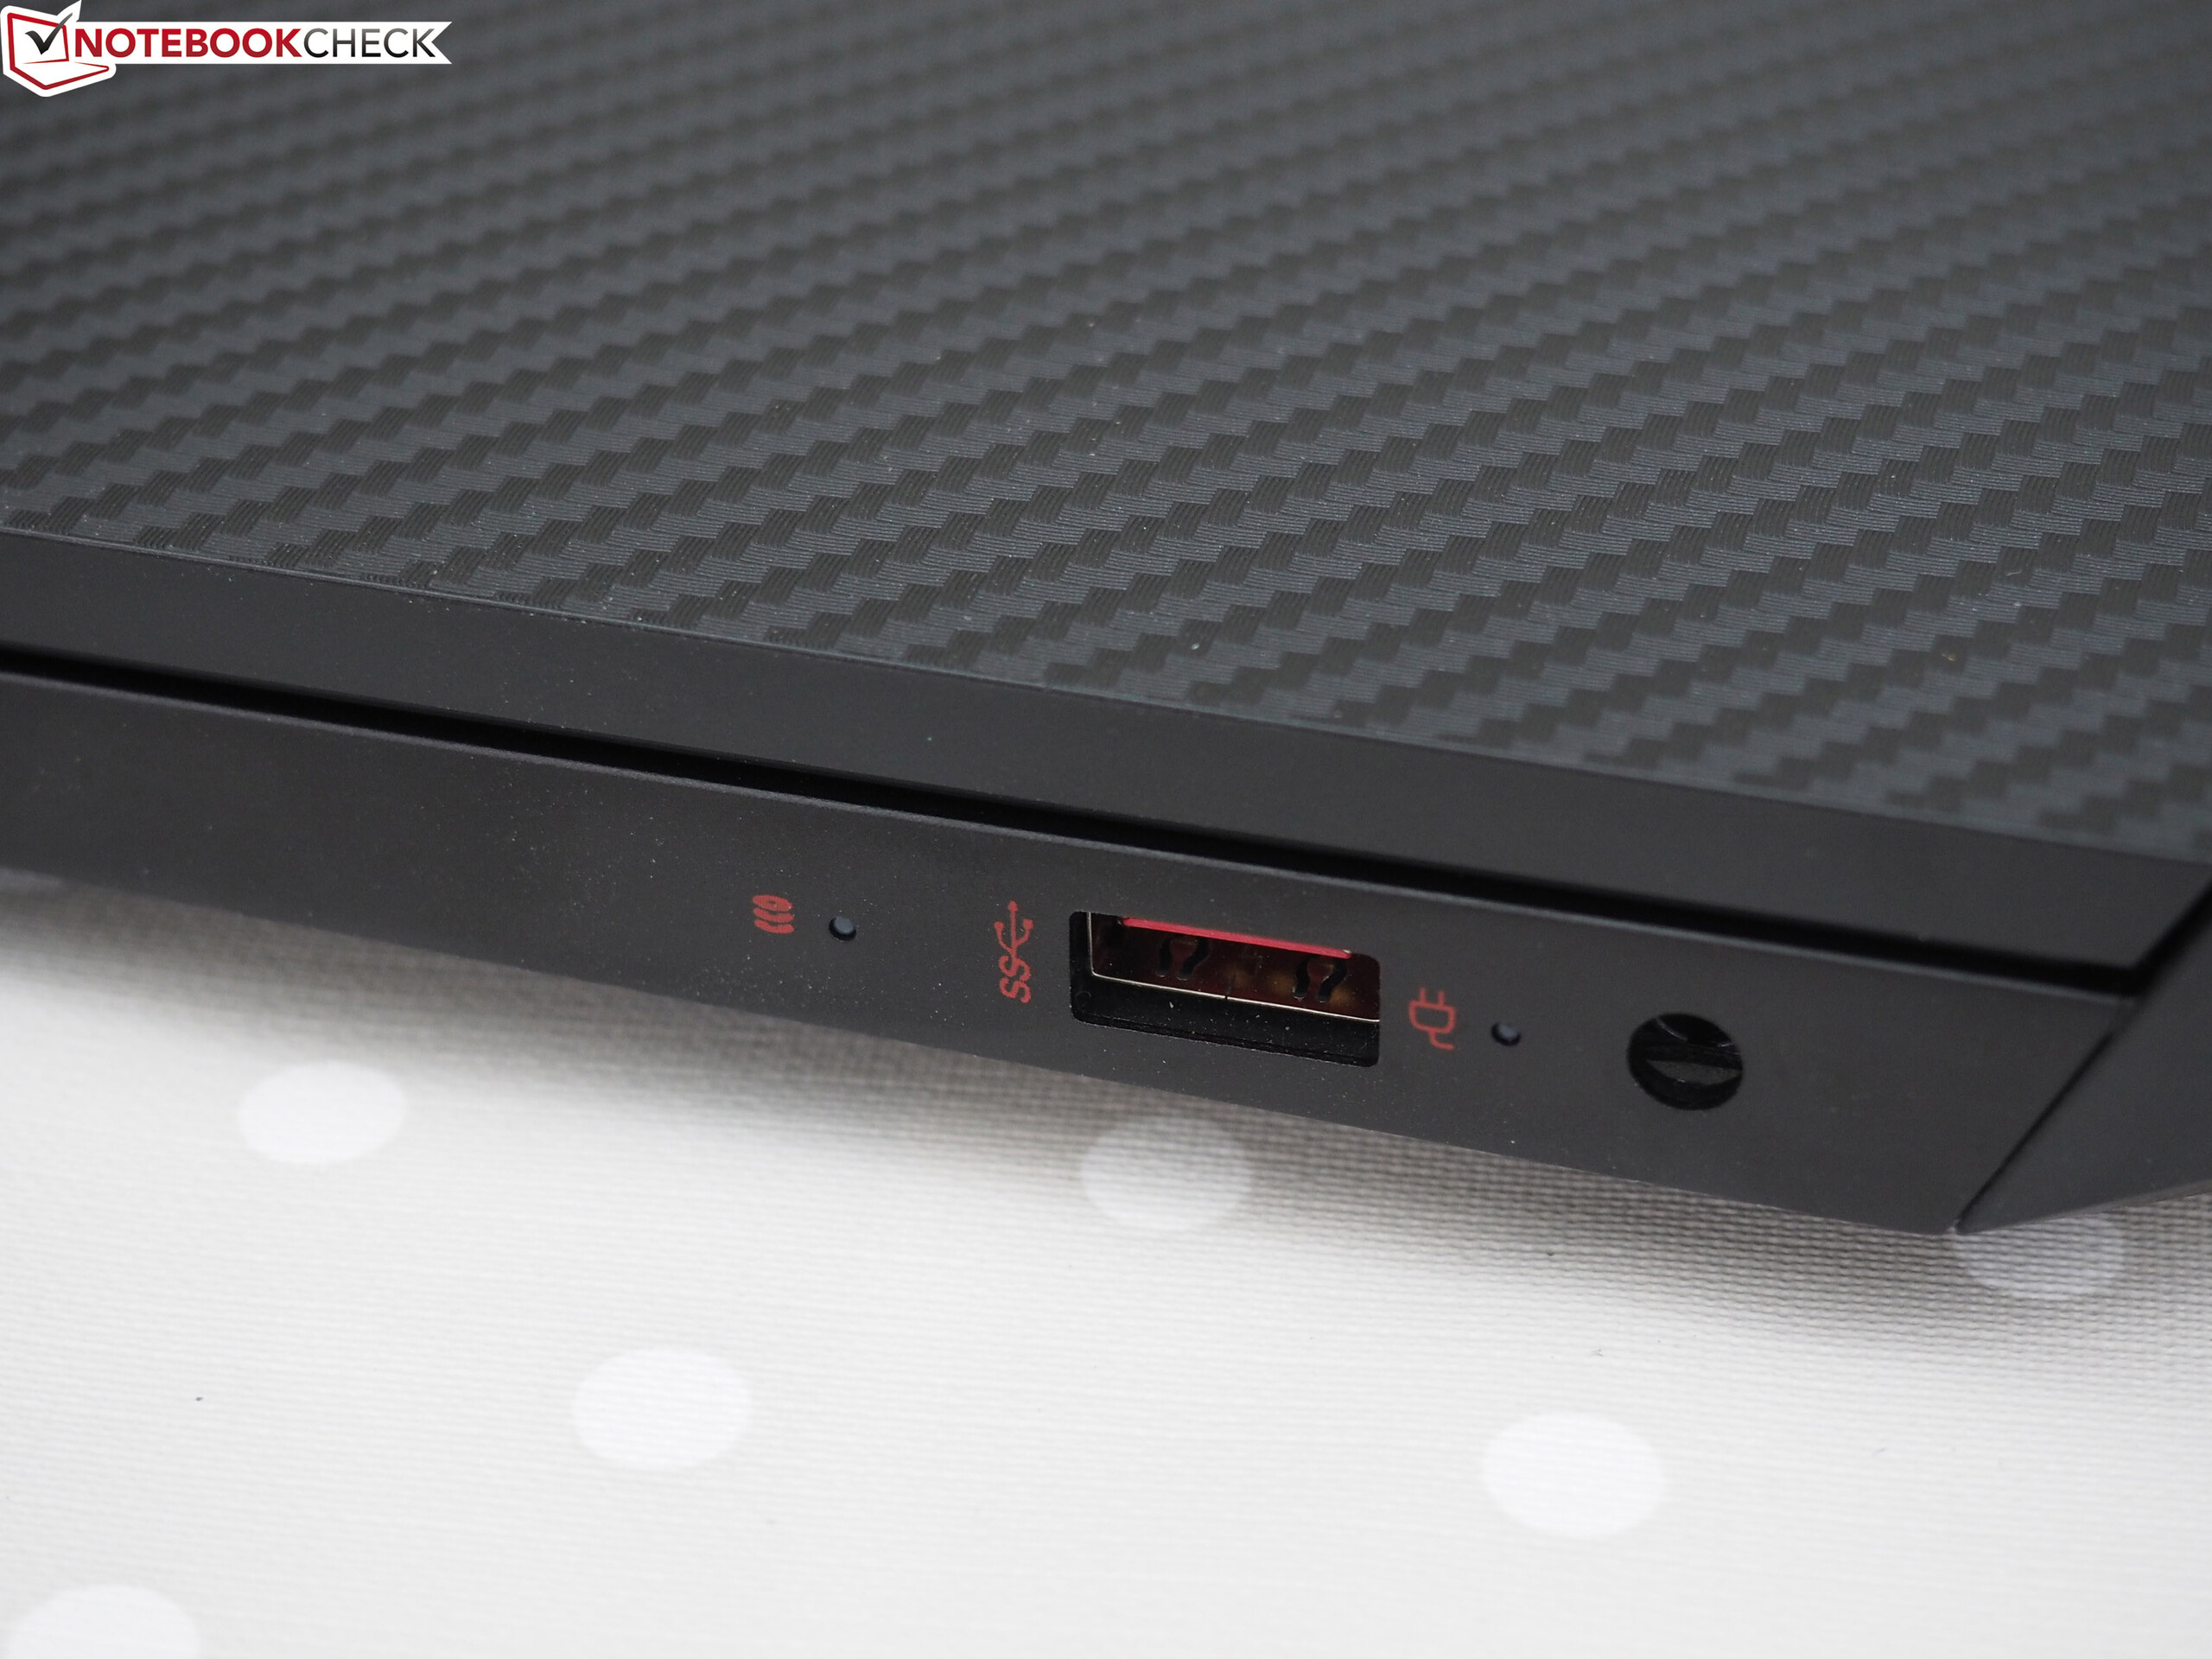
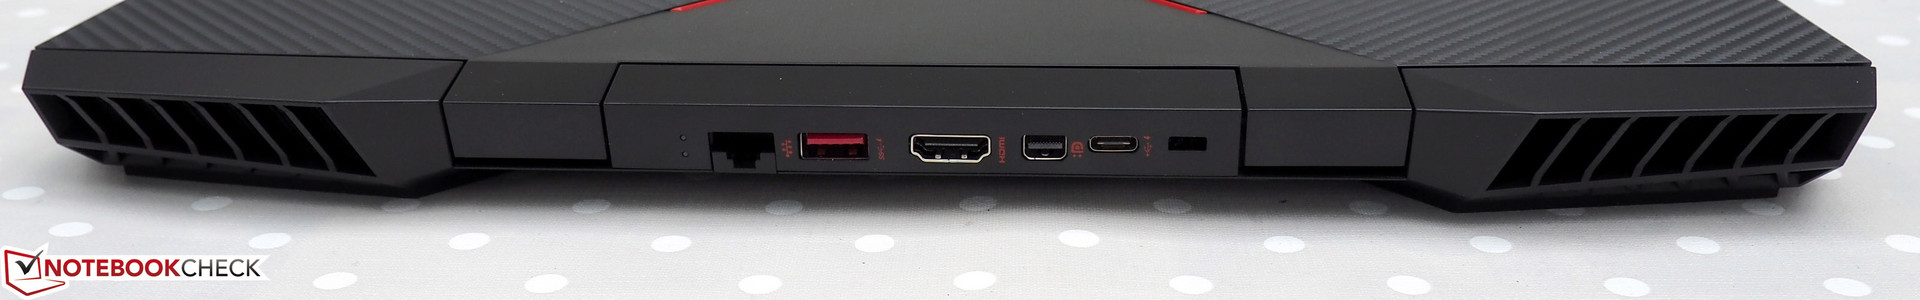
A HP obviamente teve que cortar custos para obter o preço abaixo da faixa dos $1.000, por exemplo, a cobertura de espaço de cor ruim e o baixo brilho da tela, o baixo desempenho de gravação do SSD ou a falta do Thunderbolt 3.
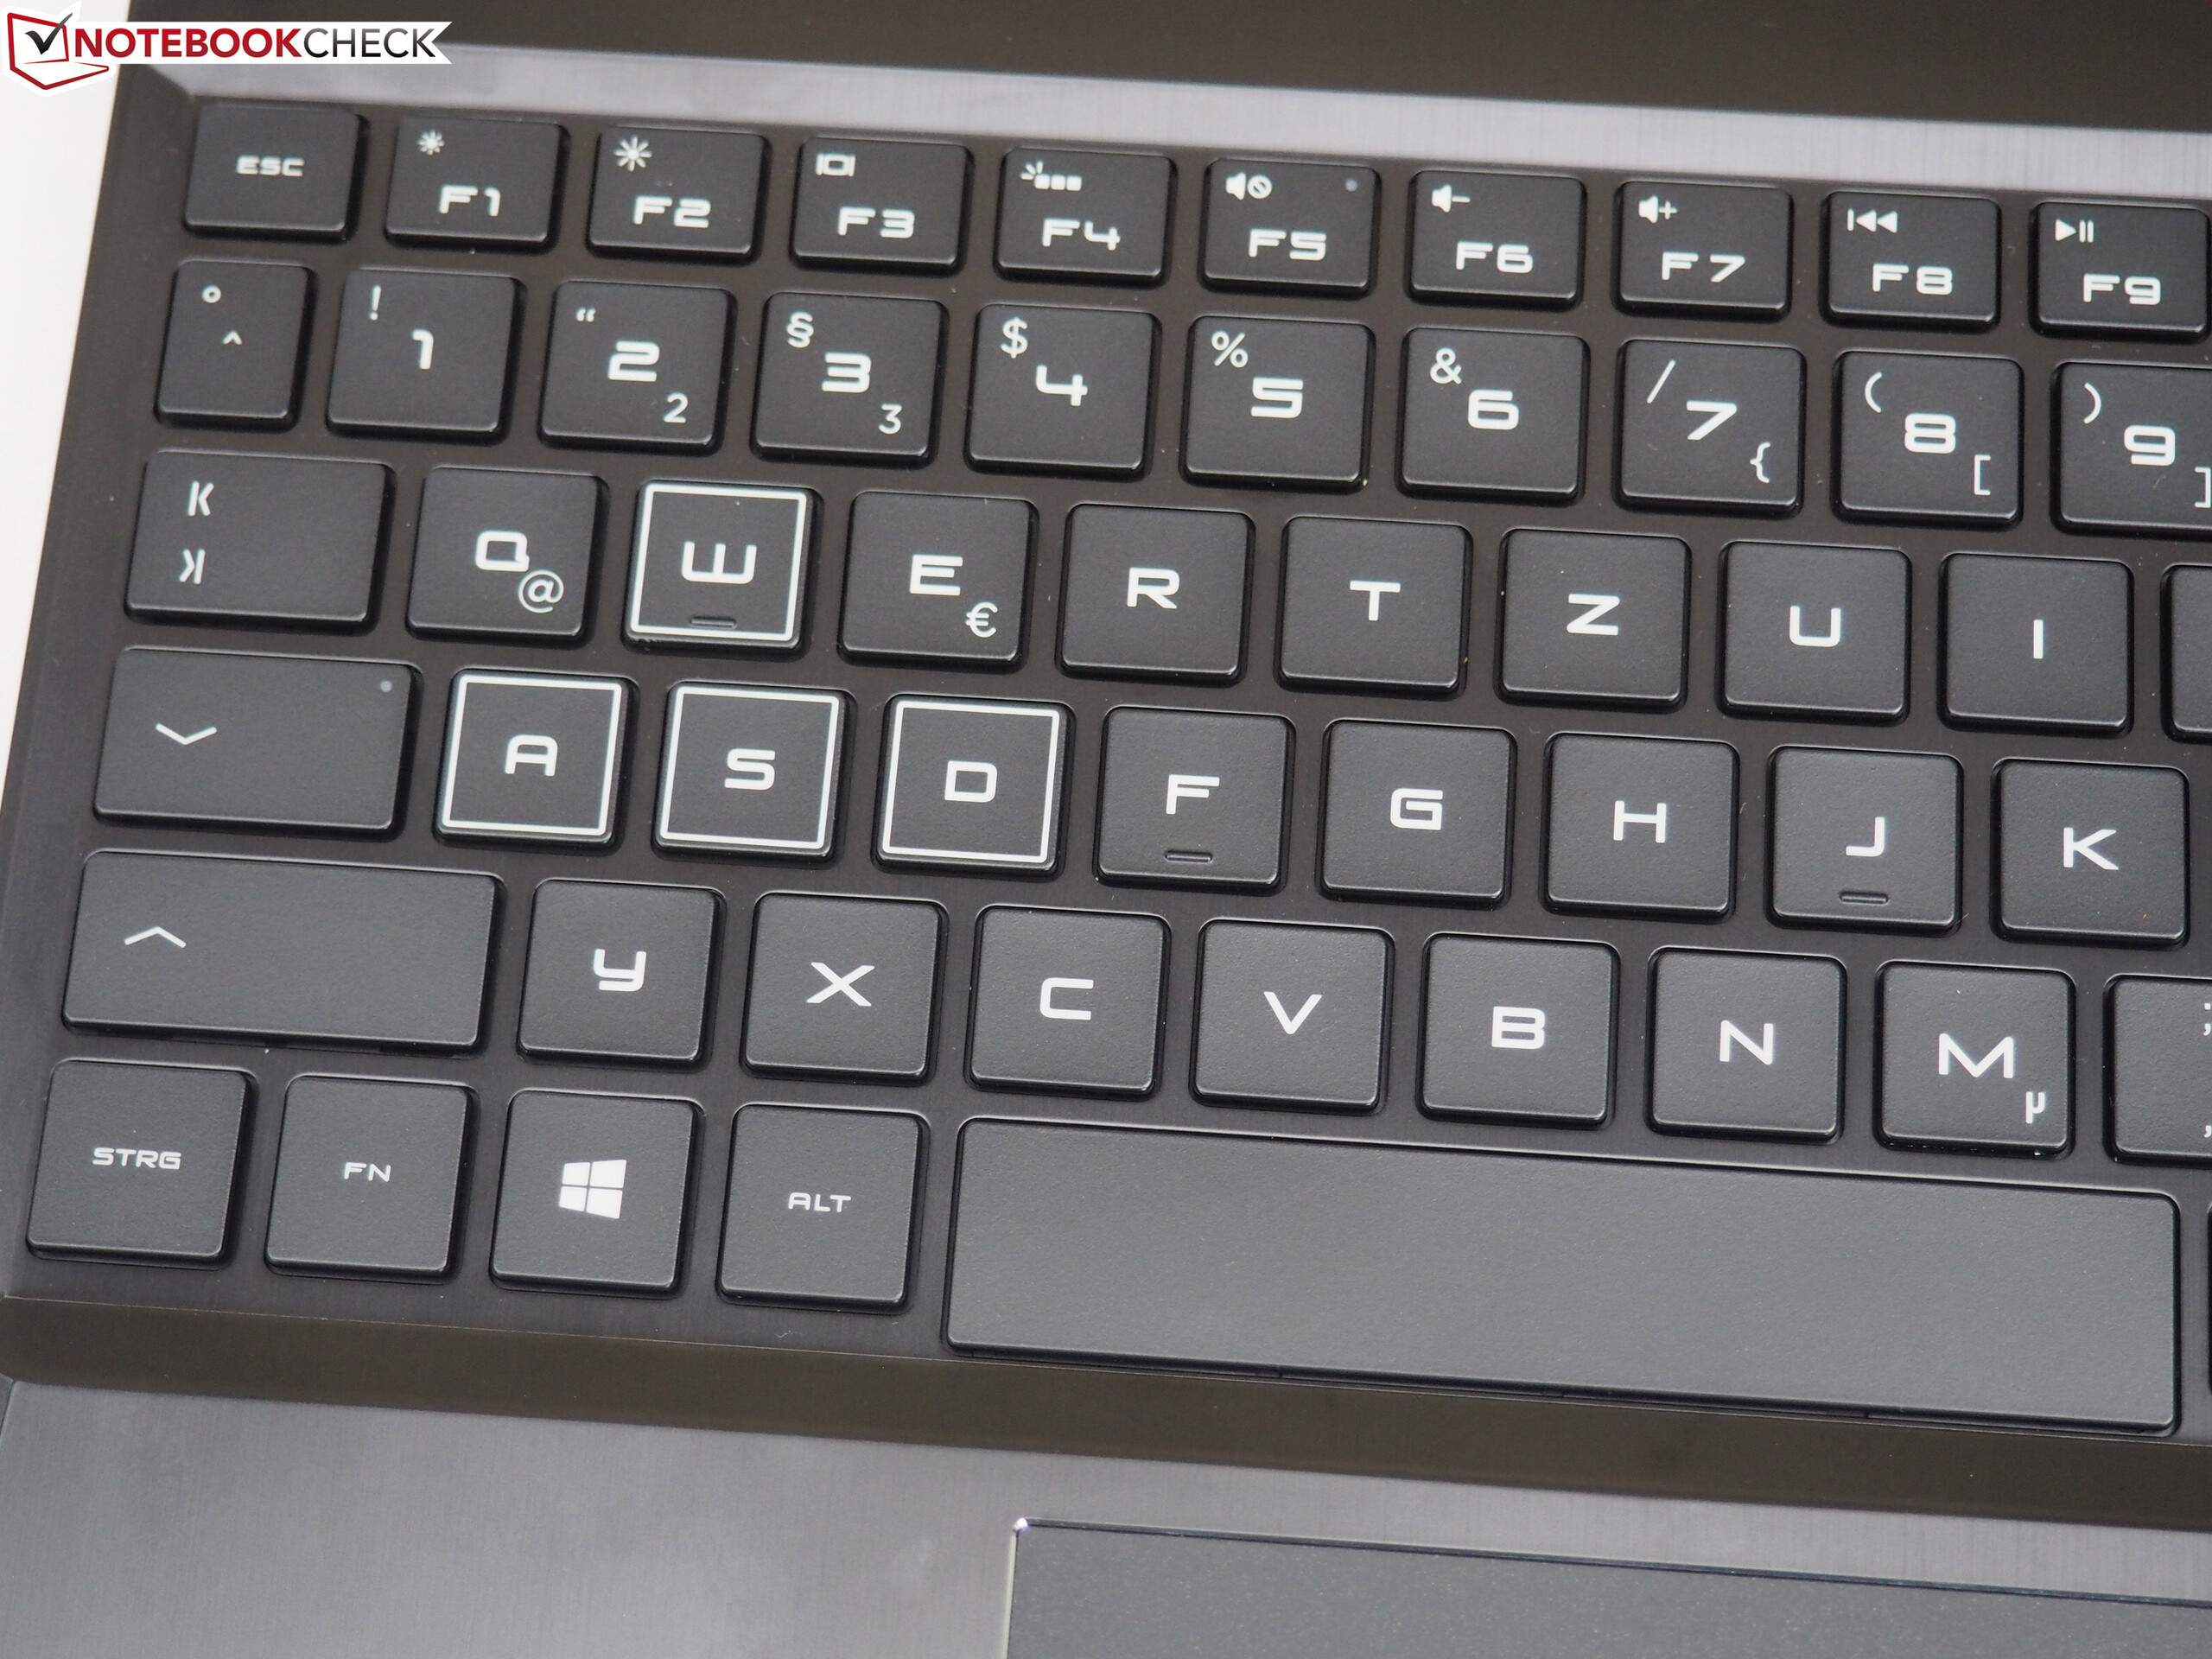
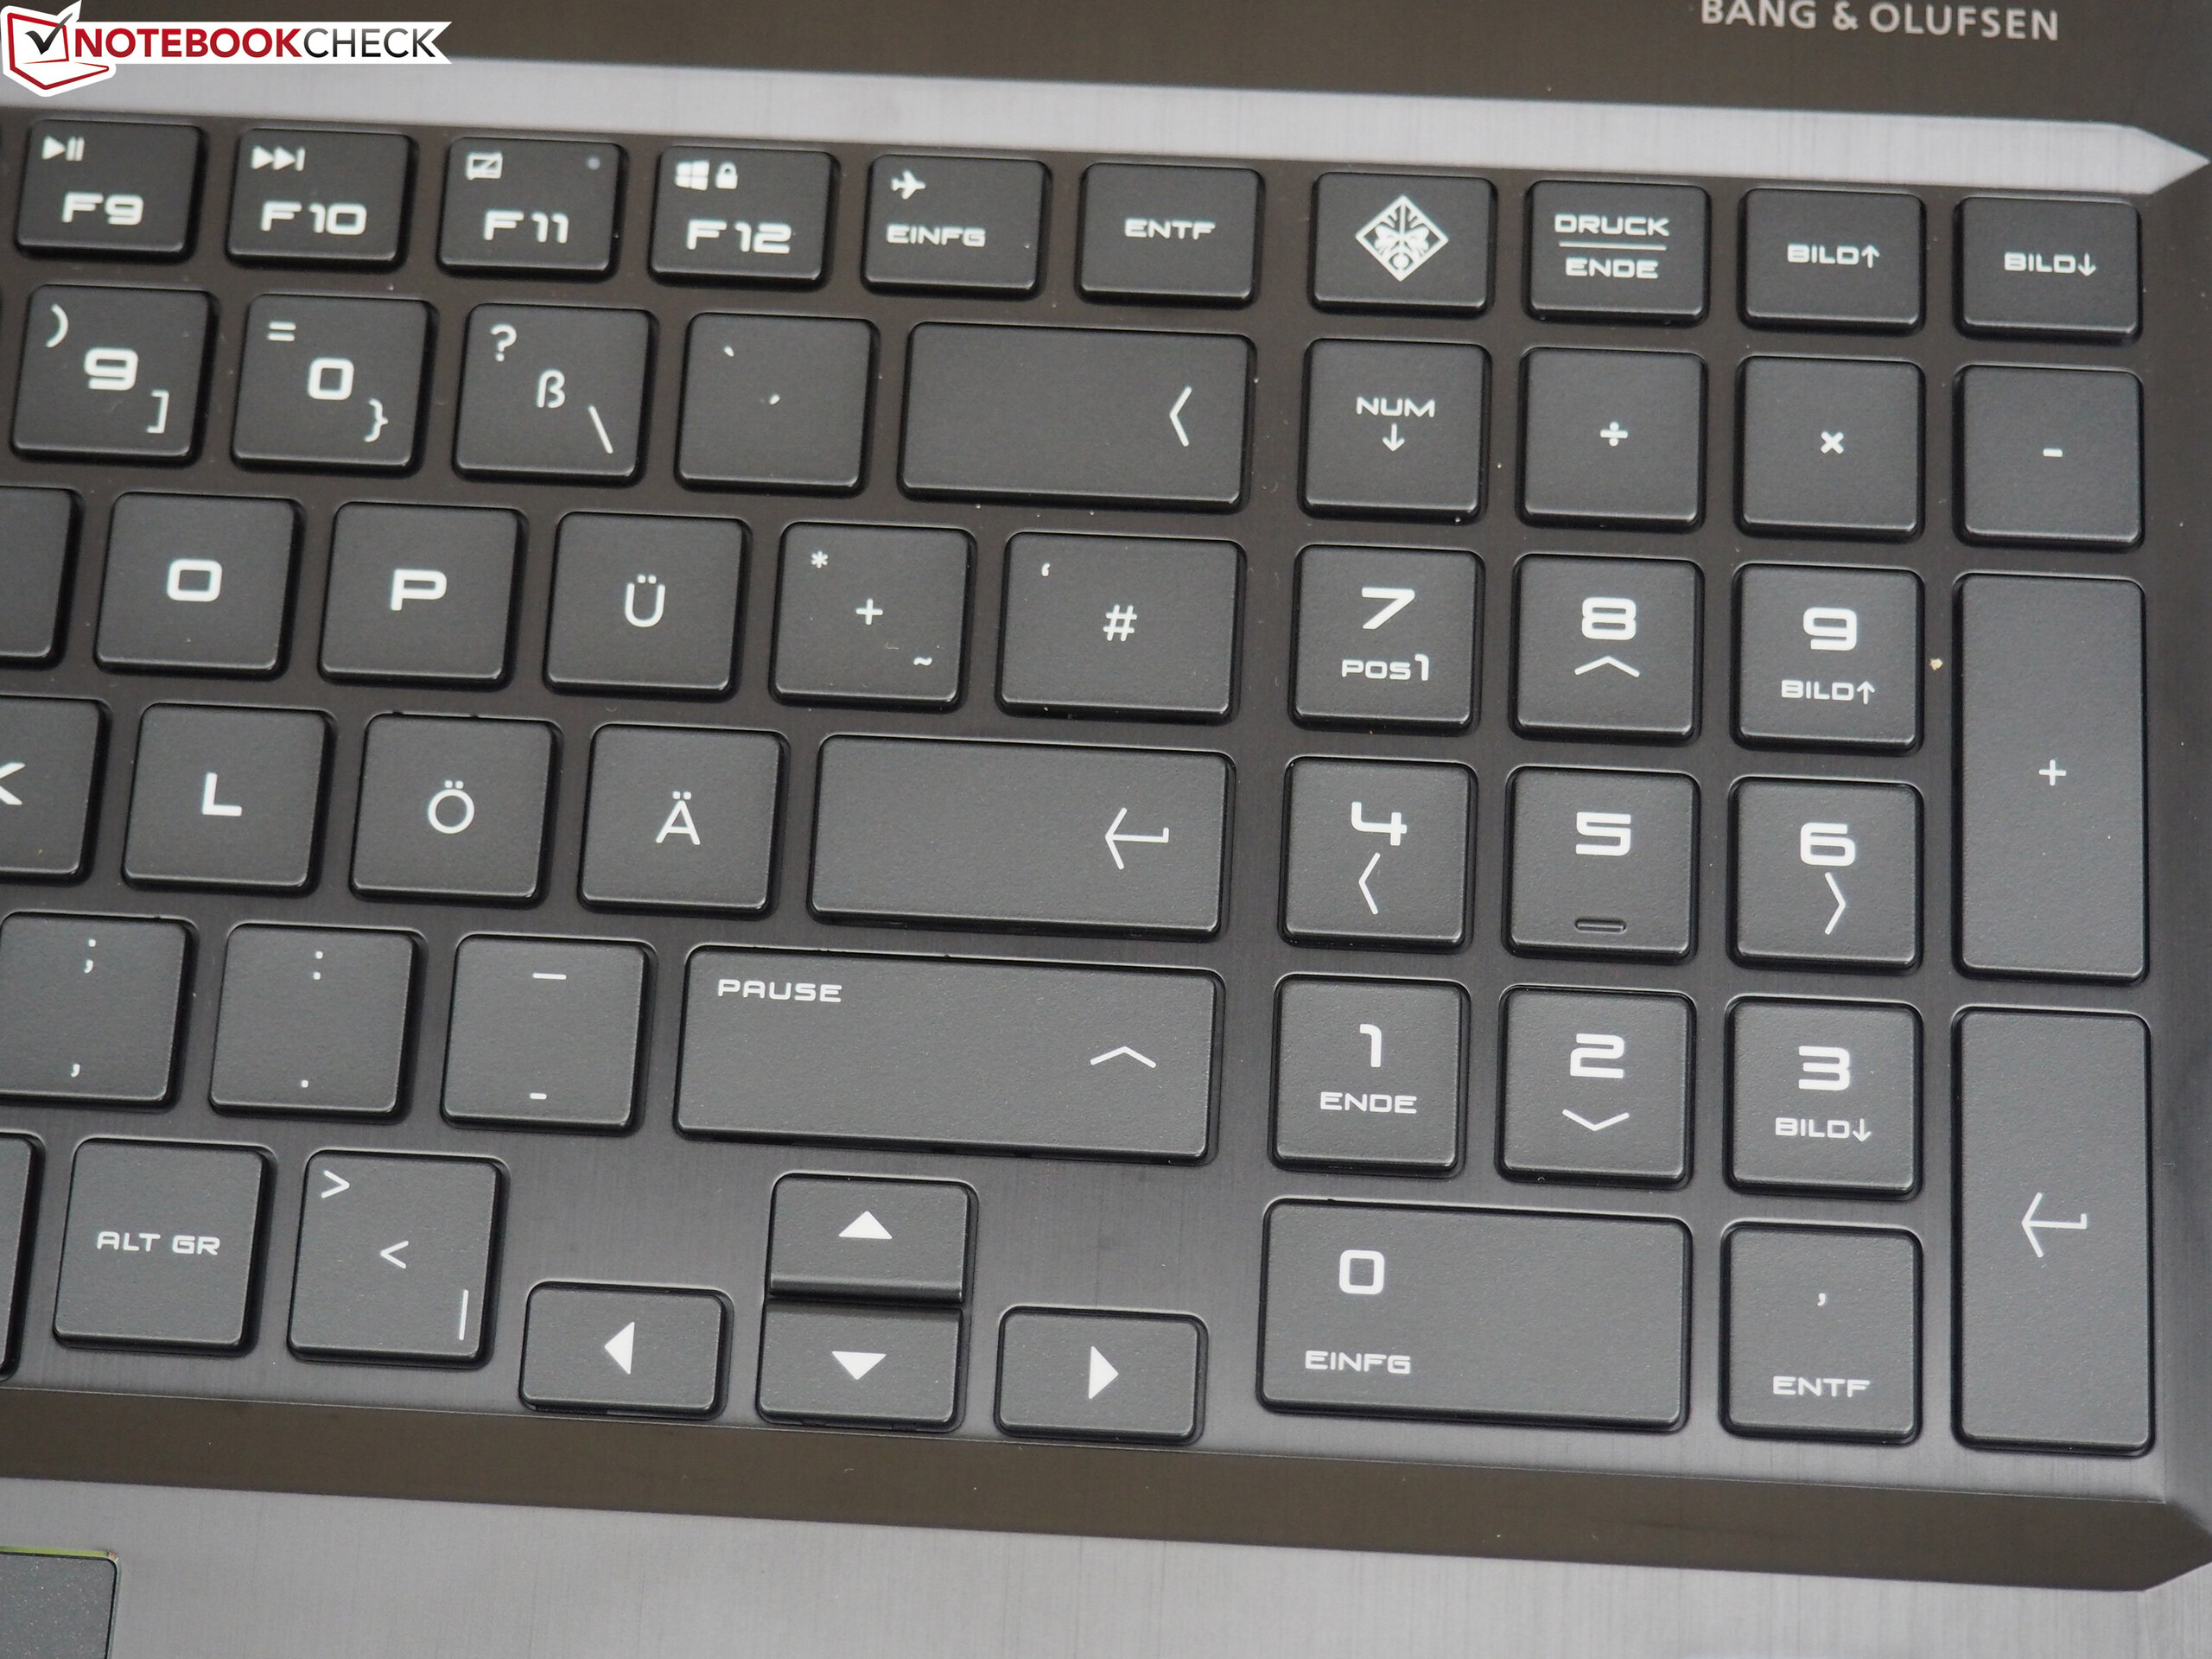
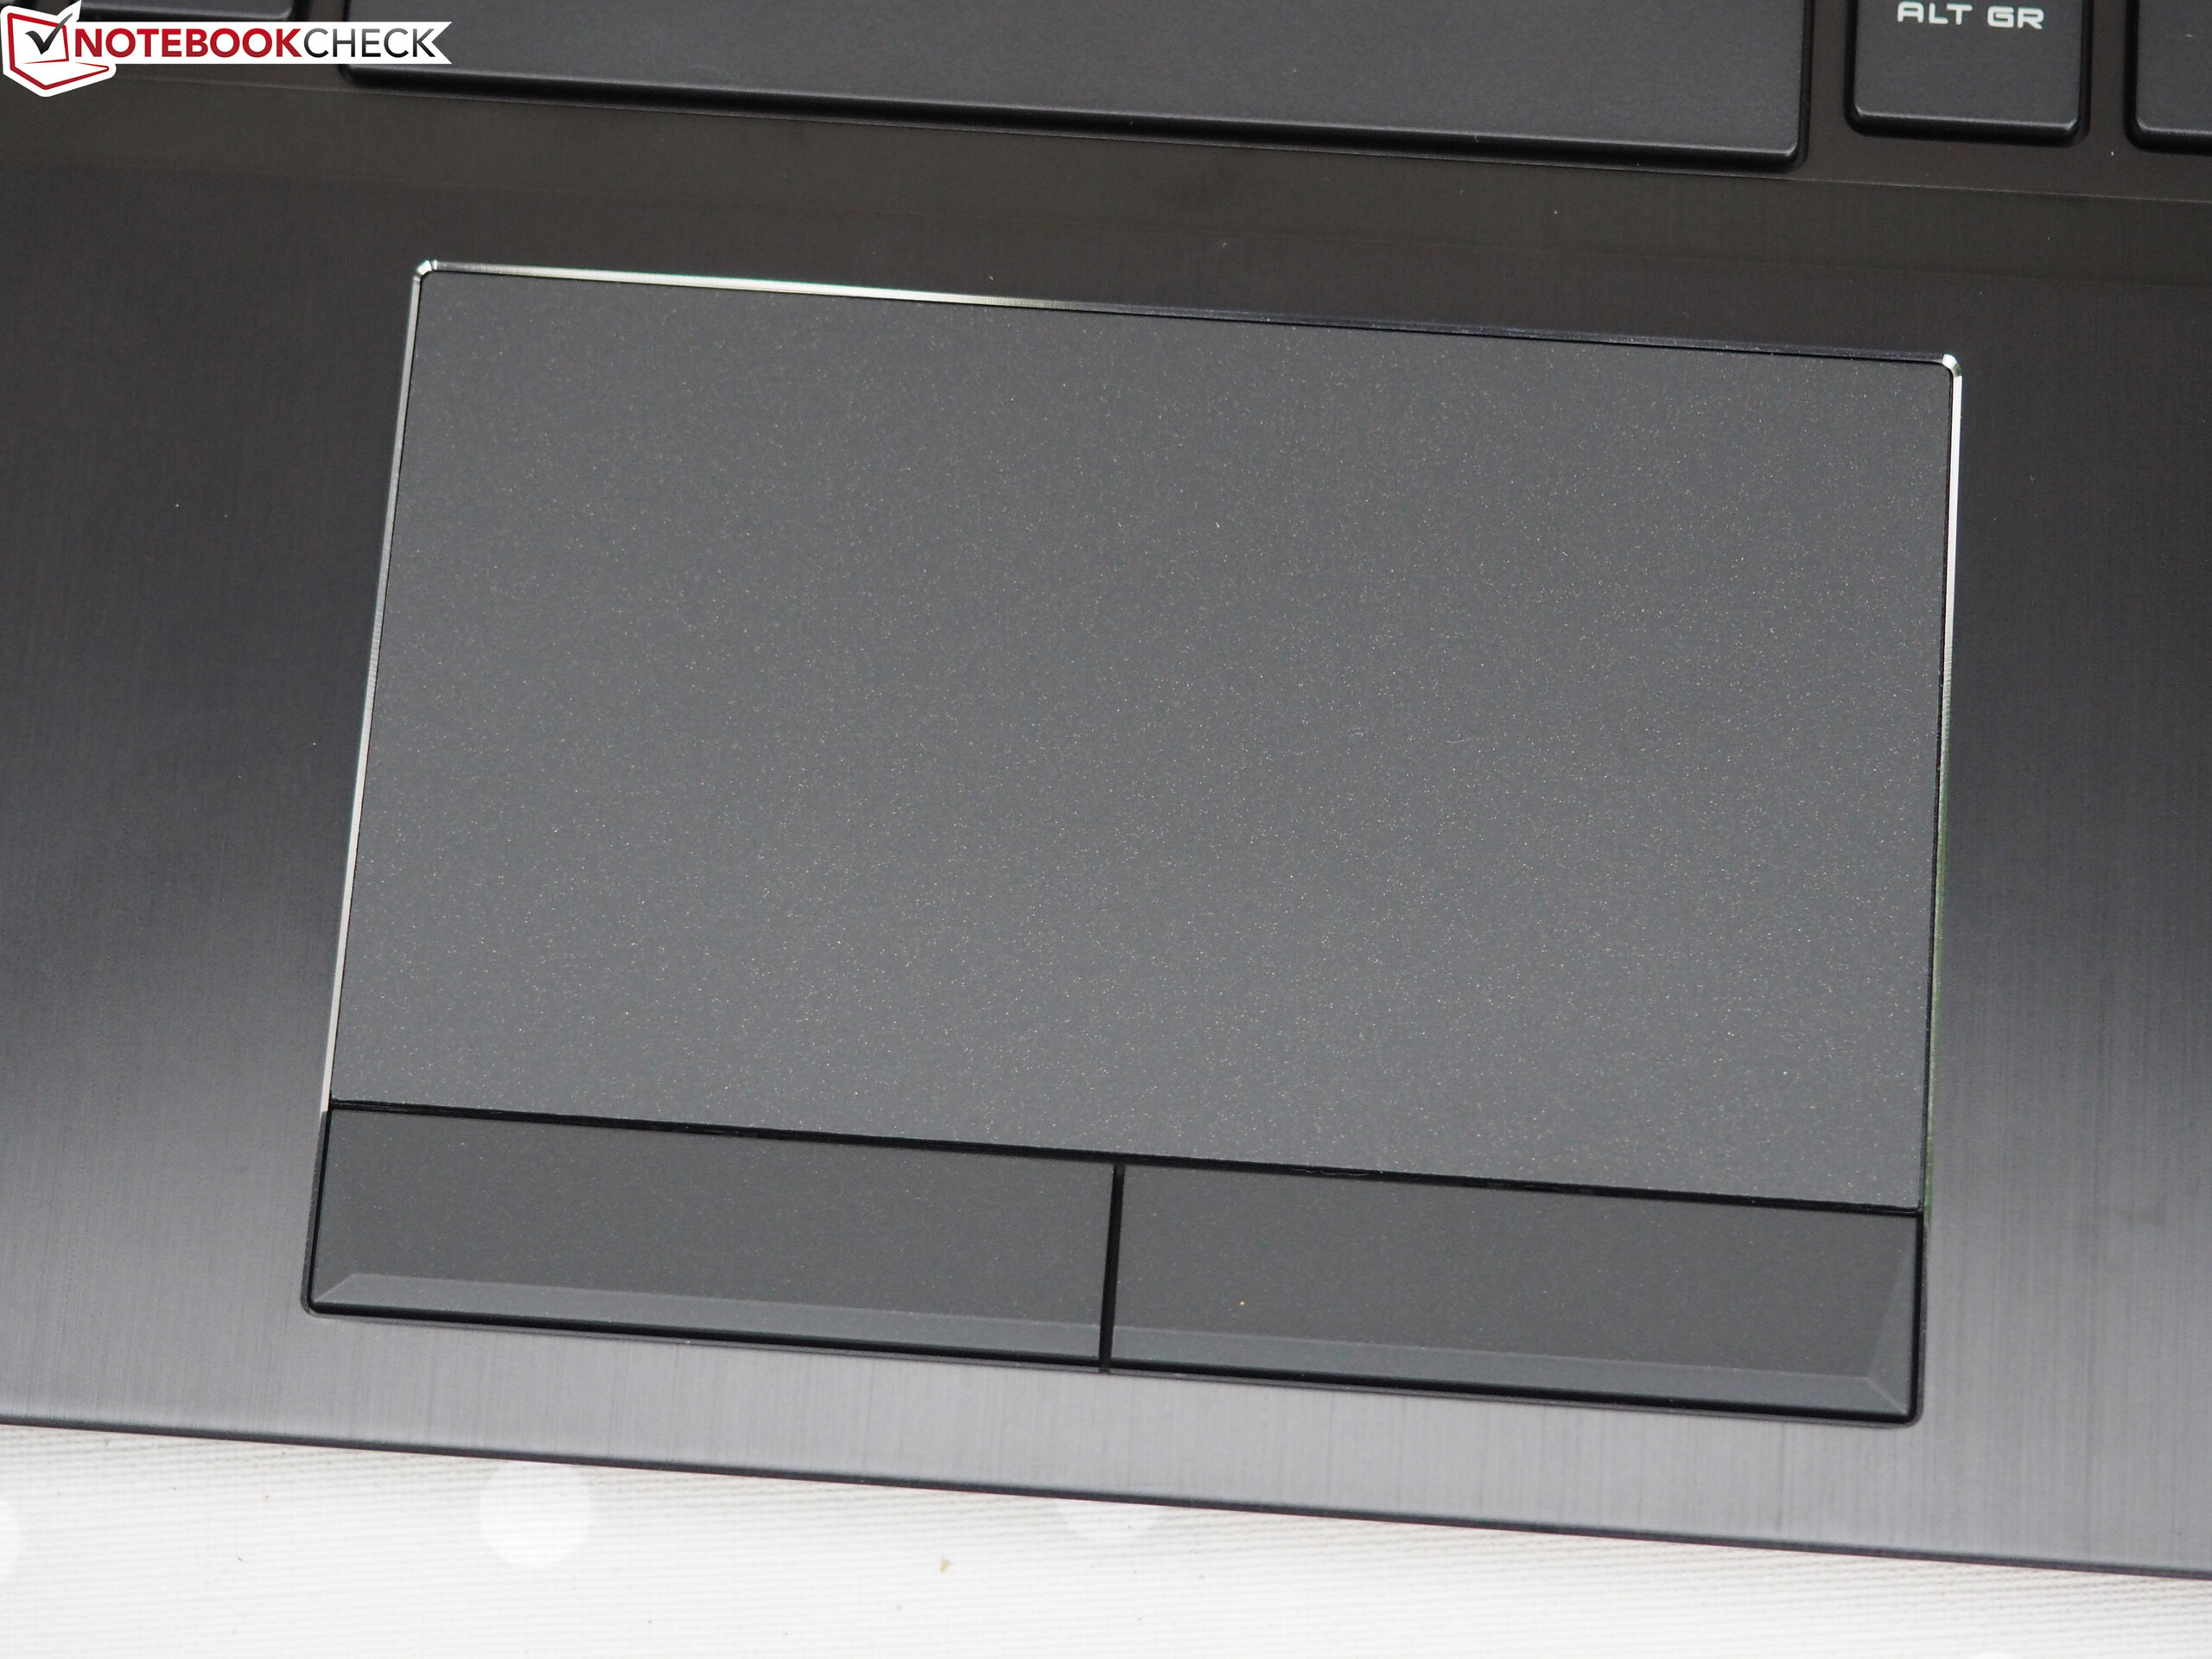
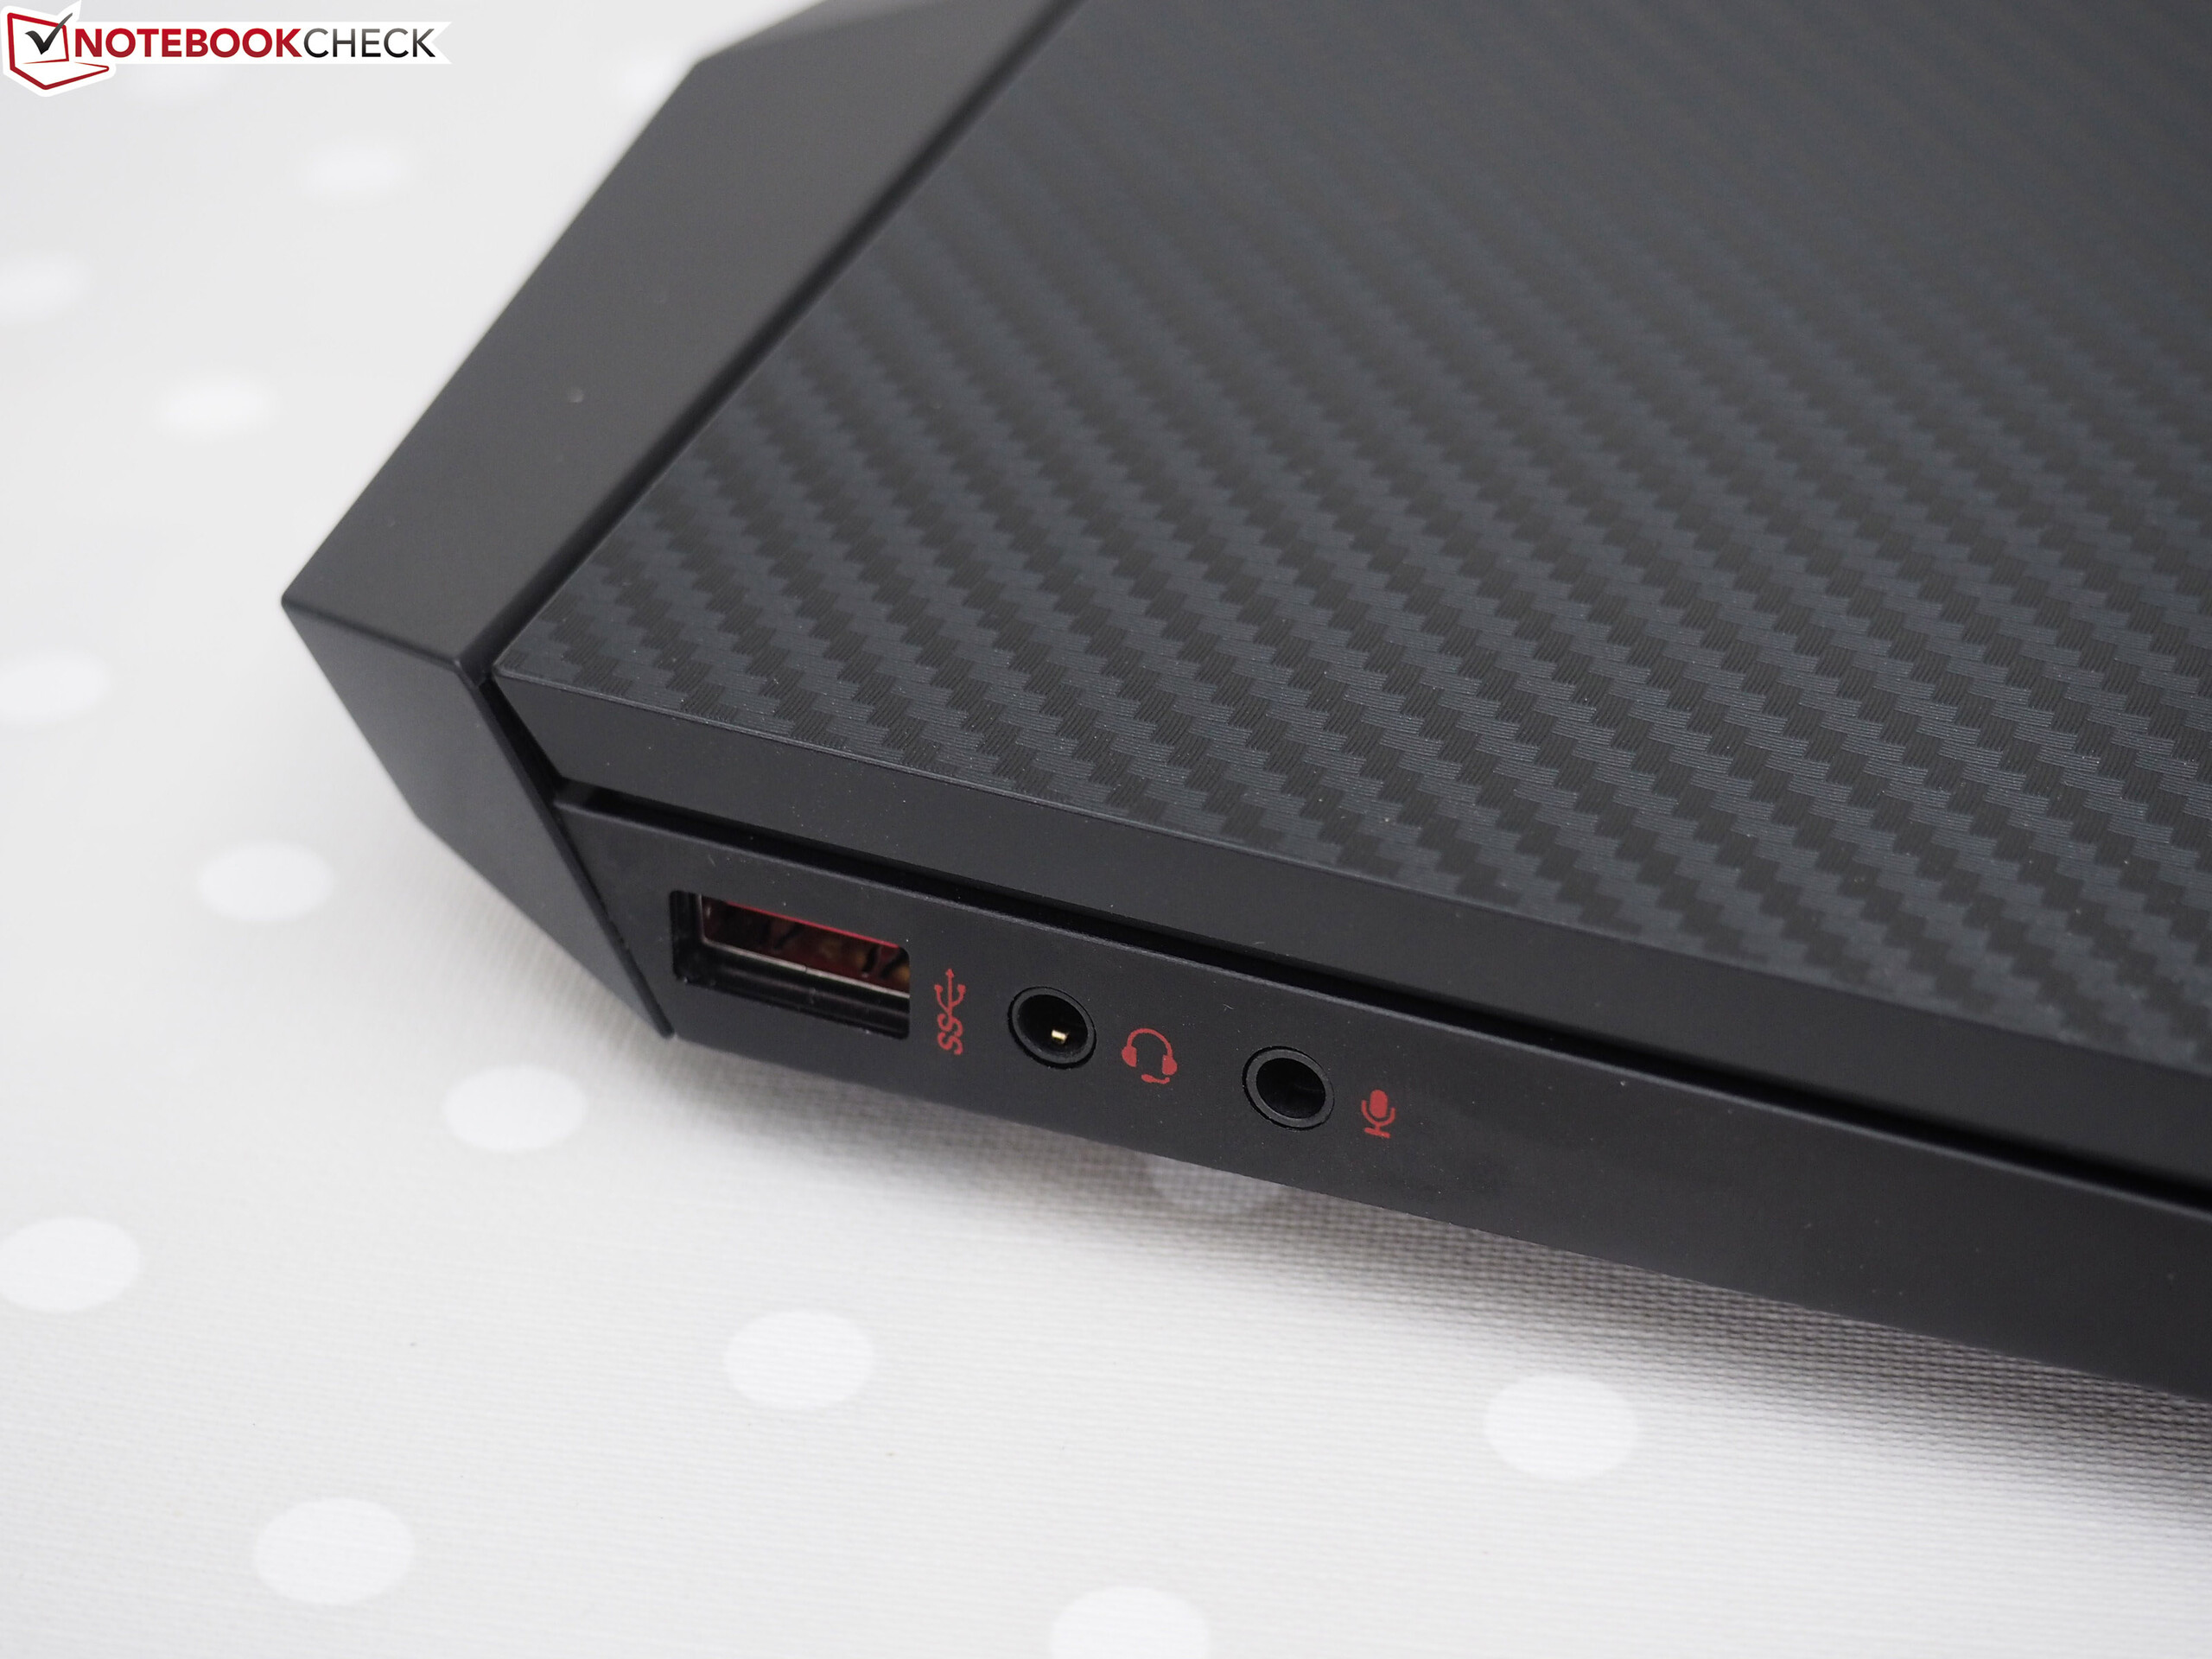
Se você não se importar com essas desvantagens, você terá um portátil para jogos muito bem equilibrado com uma carcaça estilosa, dispositivos de entrada decentes, várias portas e um desempenho de som decente. Os marcos estreitos da tela e a longa duração da bateria foram certamente os dois destaques deste dispositivo.
Dado que os seus concorrentes são mais frios e silenciosos ao mesmo tempo, a HP deve abordar a solução de resfriamento do Omen 15. Especialmente considerando que um modelo Core i7 2670QM será disponibilizado em breve.
HP Omen 15-dc0001ng
- 07/26/2018 v6 (old)
Florian Glaser
Price comparison