Breve Análise do Portátil HP Omen 15t-ce000 (7700HQ, GTX 1060 Max-Q, UHD)
| SD Card Reader | |
| average JPG Copy Test (av. of 3 runs) | |
| Dell XPS 15 9560 (i7-7700HQ, UHD) | |
| Gigabyte Aero 15 | |
| HP Omen 15t-ce000 | |
| Dell Inspiron 15 7000 7577 | |
| Acer Aspire VN7-593G-73HP V15 Nitro BE | |
| maximum AS SSD Seq Read Test (1GB) | |
| Dell XPS 15 9560 (i7-7700HQ, UHD) | |
| Gigabyte Aero 15 | |
| HP Omen 15t-ce000 | |
| Dell Inspiron 15 7000 7577 | |
| Acer Aspire VN7-593G-73HP V15 Nitro BE | |
| |||||||||||||||||||||||||
iluminação: 95 %
iluminação com acumulador: 358.5 cd/m²
Contraste: 919:1 (Preto: 0.39 cd/m²)
ΔE ColorChecker Calman: 4.6 | ∀{0.5-29.43 Ø4.71}
ΔE Greyscale Calman: 5.2 | ∀{0.09-98 Ø4.96}
91.8% sRGB (Argyll 1.6.3 3D)
66.9% AdobeRGB 1998 (Argyll 1.6.3 3D)
66.9% AdobeRGB 1998 (Argyll 3D)
91.8% sRGB (Argyll 3D)
66.1% Display P3 (Argyll 3D)
Gamma: 2.28
CCT: 6410 K
| HP Omen 15t-ce000 AU Optronics AUO23EB, IPS, 15.6", 3840x2160 | Lenovo Legion Y520-15IKBN 80WK0042GE LG Philips LP156WF6-SPK3, IPS, 15.6", 1920x1080 | Dell Inspiron 15 7000 7577 ID: LG Philips LGD053F, Name: 156WF6, Dell P/N: 4XK13, IPS, 15.6", 1920x1080 | Gigabyte Aero 15 N156HCA-EA1 (CMN15D7), IPS, 15.6", 1920x1080 | Acer Aspire VN7-593G-73HP V15 Nitro BE LG Display LP156WF6-SPP1, AH-IPS, Normally Black, Transmissive, 15.6", 1920x1080 | HP Omen 15-ce002ng AUO42ED, IPS, 15.6", 1920x1080 | Aorus X5 v7 AU Optronics B156ZAN02.3 (AUO23EB), IPS, 15.6", 3840x2160 | |
|---|---|---|---|---|---|---|---|
| Display | -39% | -42% | -0% | -5% | -1% | -1% | |
| Display P3 Coverage (%) | 66.1 | 39.01 -41% | 37.07 -44% | 65.2 -1% | 65.8 0% | 65.8 0% | 65.3 -1% |
| sRGB Coverage (%) | 91.8 | 58.4 -36% | 55.6 -39% | 92.5 1% | 85.1 -7% | 90.9 -1% | 91.9 0% |
| AdobeRGB 1998 Coverage (%) | 66.9 | 40.34 -40% | 38.32 -43% | 66.5 -1% | 62.2 -7% | 66.5 -1% | 66.3 -1% |
| Response Times | -11% | -3% | -22% | -23% | -21% | -12% | |
| Response Time Grey 50% / Grey 80% * (ms) | 37.6 ? | 39 ? -4% | 35.6 ? 5% | 42.8 ? -14% | 41 ? -9% | 43.2 ? -15% | 44 ? -17% |
| Response Time Black / White * (ms) | 24.8 ? | 29 ? -17% | 27.6 ? -11% | 32 ? -29% | 34 ? -37% | 31.2 ? -26% | 26.4 ? -6% |
| PWM Frequency (Hz) | 21000 ? | 26000 ? | |||||
| Screen | -22% | -27% | -6% | -3% | 9% | 0% | |
| Brightness middle (cd/m²) | 358.5 | 283 -21% | 235.4 -34% | 320 -11% | 322 -10% | 304 -15% | 307 -14% |
| Brightness (cd/m²) | 350 | 281 -20% | 223 -36% | 316 -10% | 297 -15% | 289 -17% | 297 -15% |
| Brightness Distribution (%) | 95 | 91 -4% | 91 -4% | 90 -5% | 86 -9% | 86 -9% | 92 -3% |
| Black Level * (cd/m²) | 0.39 | 0.39 -0% | 0.28 28% | 0.36 8% | 0.31 21% | 0.26 33% | 0.3 23% |
| Contrast (:1) | 919 | 726 -21% | 841 -8% | 889 -3% | 1039 13% | 1169 27% | 1023 11% |
| Colorchecker dE 2000 * | 4.6 | 6.1 -33% | 5.6 -22% | 4.62 -0% | 4.73 -3% | 3.46 25% | 4.72 -3% |
| Colorchecker dE 2000 max. * | 8.5 | 11.08 -30% | 20.3 -139% | 9.75 -15% | 12.37 -46% | 7.72 9% | 8.07 5% |
| Greyscale dE 2000 * | 5.2 | 5.69 -9% | 3.6 31% | 6 -15% | 2.99 42% | 2.46 53% | 4.79 8% |
| Gamma | 2.28 96% | 2.44 90% | 2.23 99% | 2.46 89% | 2.32 95% | 2.38 92% | 2.42 91% |
| CCT | 6410 101% | 6702 97% | 7214 90% | 6761 96% | 6905 94% | 6915 94% | 7690 85% |
| Color Space (Percent of AdobeRGB 1998) (%) | 66.9 | 37 -45% | 35.2 -47% | 60 -10% | 56 -16% | 59 -12% | 60 -10% |
| Color Space (Percent of sRGB) (%) | 91.8 | 58 -37% | 55.4 -40% | 92 0% | 85 -7% | 91 -1% | 92 0% |
| Média Total (Programa/Configurações) | -24% /
-24% | -24% /
-27% | -9% /
-7% | -10% /
-6% | -4% /
3% | -4% /
-2% |
* ... menor é melhor
Exibir tempos de resposta
| ↔ Tempo de resposta preto para branco | ||
|---|---|---|
| 24.8 ms ... ascensão ↗ e queda ↘ combinadas | ↗ 12.4 ms ascensão | 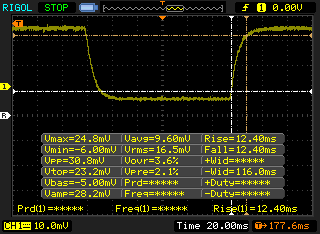 |
| ↘ 12.4 ms queda | ||
| A tela mostra boas taxas de resposta em nossos testes, mas pode ser muito lenta para jogadores competitivos. Em comparação, todos os dispositivos testados variam de 0.1 (mínimo) a 240 (máximo) ms. » 58 % de todos os dispositivos são melhores. Isso significa que o tempo de resposta medido é pior que a média de todos os dispositivos testados (19.8 ms). | ||
| ↔ Tempo de resposta 50% cinza a 80% cinza | ||
| 37.6 ms ... ascensão ↗ e queda ↘ combinadas | ↗ 19.6 ms ascensão | 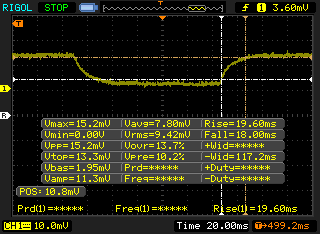 |
| ↘ 18 ms queda | ||
| A tela mostra taxas de resposta lentas em nossos testes e será insatisfatória para os jogadores. Em comparação, todos os dispositivos testados variam de 0.165 (mínimo) a 636 (máximo) ms. » 55 % de todos os dispositivos são melhores. Isso significa que o tempo de resposta medido é pior que a média de todos os dispositivos testados (31 ms). | ||
Cintilação da tela / PWM (modulação por largura de pulso)
| Tela tremeluzindo / PWM não detectado | 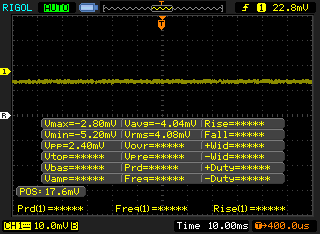 | ||
[pwm_comparison] Em comparação: 52 % de todos os dispositivos testados não usam PWM para escurecer a tela. Se PWM foi detectado, uma média de 7754 (mínimo: 5 - máximo: 343500) Hz foi medida. | |||
| Cinebench R10 | |
| Rendering Multiple CPUs 32Bit | |
| HP Omen 15-ce002ng | |
| HP Omen 15t-ce000 | |
| Lenovo Legion Y520-15IKBN 80WK0042GE | |
| Dell Inspiron 15 7000 7577 | |
| HP Spectre x360 15t-bl100 | |
| Rendering Single 32Bit | |
| HP Spectre x360 15t-bl100 | |
| HP Omen 15-ce002ng | |
| HP Omen 15t-ce000 | |
| Lenovo Legion Y520-15IKBN 80WK0042GE | |
| Dell Inspiron 15 7000 7577 | |
| wPrime 2.10 - 1024m | |
| HP Spectre x360 15t-bl100 | |
| Dell Inspiron 15 7000 7577 | |
| HP Omen 15t-ce000 | |
* ... menor é melhor
| PCMark 8 | |
| Home Score Accelerated v2 | |
| HP Omen 15-ce002ng | |
| Aorus X5 v7 | |
| HP Omen 15t-ce000 | |
| Gigabyte Aero 15 | |
| Dell Inspiron 15 7000 7577 | |
| Lenovo Legion Y520-15IKBN 80WK0042GE | |
| Work Score Accelerated v2 | |
| HP Omen 15-ce002ng | |
| Gigabyte Aero 15 | |
| Dell Inspiron 15 7000 7577 | |
| Lenovo Legion Y520-15IKBN 80WK0042GE | |
| HP Omen 15t-ce000 | |
| Creative Score Accelerated v2 | |
| HP Omen 15t-ce000 | |
| Dell Inspiron 15 7000 7577 | |
| Lenovo Legion Y520-15IKBN 80WK0042GE | |
| PCMark 8 Home Score Accelerated v2 | 4325 pontos | |
| PCMark 8 Creative Score Accelerated v2 | 6901 pontos | |
| PCMark 8 Work Score Accelerated v2 | 2484 pontos | |
| PCMark 10 Score | 3969 pontos | |
Ajuda | ||
| HP Omen 15t-ce000 Samsung PM961 NVMe MZVLW128HEGR | Lenovo Legion Y520-15IKBN 80WK0042GE Samsung PM961 NVMe MZVLW128HEGR | Dell Inspiron 15 7000 7577 Samsung PM961 MZVLW256HEHP | Aorus X5 v7 Toshiba NVMe THNSN5256GPU7 | HP Spectre x360 15t-bl100 Samsung PM961 NVMe MZVLW512HMJP | |
|---|---|---|---|---|---|
| AS SSD | -9% | 32% | -436% | 133% | |
| Copy Game MB/s (MB/s) | 736 | 197.3 -73% | 382.5 -48% | 988 34% | 1134 54% |
| Copy Program MB/s (MB/s) | 195.4 | 127.3 -35% | 274.8 41% | 424.4 117% | 534 173% |
| Copy ISO MB/s (MB/s) | 1087 | 497.6 -54% | 814 -25% | 1482 36% | 1936 78% |
| Score Total (Points) | 1515 | 1434 -5% | 2405 59% | 490 -68% | 3781 150% |
| Score Write (Points) | 361 | 368 2% | 594 65% | 24 -93% | 1556 331% |
| Score Read (Points) | 789 | 746 -5% | 1241 57% | 361 -54% | 1493 89% |
| Access Time Write * (ms) | 0.034 | 0.032 6% | 0.037 -9% | 1.987 -5744% | 0.026 24% |
| Access Time Read * (ms) | 0.071 | 0.07 1% | 0.058 18% | 0.067 6% | 0.04 44% |
| 4K-64 Write (MB/s) | 175.9 | 158.6 -10% | 375.8 114% | 2.12 -99% | 1262 617% |
| 4K-64 Read (MB/s) | 568 | 463.2 -18% | 929 64% | 112.5 -80% | 1206 112% |
| 4K Write (MB/s) | 111.2 | 127.9 15% | 100.2 -10% | 2.03 -98% | 141.1 27% |
| 4K Read (MB/s) | 43.09 | 46.98 9% | 46.95 9% | 38.45 -11% | 51.9 20% |
| Seq Write (MB/s) | 743 | 814 10% | 1181 59% | 200.3 -73% | 1530 106% |
| Seq Read (MB/s) | 1774 | 2362 33% | 2652 49% | 2103 19% | 2342 32% |
* ... menor é melhor

| 3DMark | |
| 3840x2160 Fire Strike Ultra Graphics | |
| Dell Inspiron 15 7000 7577 | |
| HP Omen 15t-ce000 | |
| Lenovo Legion Y520-15IKBN 80WK0042GE | |
| Fire Strike Extreme Graphics | |
| Dell Inspiron 15 7000 7577 | |
| HP Omen 15t-ce000 | |
| Lenovo Legion Y520-15IKBN 80WK0042GE | |
| 1920x1080 Fire Strike Graphics | |
| Aorus X5 v7 | |
| Acer Aspire VN7-593G-73HP V15 Nitro BE | |
| Gigabyte Aero 15 | |
| HP Omen 15-ce002ng | |
| Dell Inspiron 15 7000 7577 | |
| HP Omen 15t-ce000 | |
| Lenovo Legion Y520-15IKBN 80WK0042GE | |
| 1280x720 Cloud Gate Standard Graphics | |
| Aorus X5 v7 | |
| Gigabyte Aero 15 | |
| Dell Inspiron 15 7000 7577 | |
| HP Omen 15-ce002ng | |
| Acer Aspire VN7-593G-73HP V15 Nitro BE | |
| Lenovo Legion Y520-15IKBN 80WK0042GE | |
| HP Omen 15t-ce000 | |
| 3DMark 11 Performance | 11761 pontos | |
| 3DMark Cloud Gate Standard Score | 21508 pontos | |
| 3DMark Fire Strike Score | 8725 pontos | |
| 3DMark Fire Strike Extreme Score | 4487 pontos | |
Ajuda | ||
| Rise of the Tomb Raider | |
| 3840x2160 High Preset AA:FX AF:4x (classificar por valor) | |
| HP Omen 15t-ce000 | |
| HP Omen 15-ce002ng | |
| Aorus X5 v7 | |
| 1920x1080 Very High Preset AA:FX AF:16x (classificar por valor) | |
| HP Omen 15t-ce000 | |
| Dell Inspiron 15 7000 7577 | |
| Acer Aspire VN7-593G-73HP V15 Nitro BE | |
| HP Omen 15-ce002ng | |
| Aorus X5 v7 | |
| HP Spectre x360 15t-bl100 | |
| 1920x1080 High Preset AA:FX AF:4x (classificar por valor) | |
| HP Omen 15t-ce000 | |
| Dell Inspiron 15 7000 7577 | |
| Acer Aspire VN7-593G-73HP V15 Nitro BE | |
| HP Omen 15-ce002ng | |
| Aorus X5 v7 | |
| HP Spectre x360 15t-bl100 | |
| The Witcher 3 | |
| 3840x2160 High Graphics & Postprocessing (Nvidia HairWorks Off) (classificar por valor) | |
| HP Omen 15t-ce000 | |
| HP Omen 15-ce002ng | |
| Aorus X5 v7 | |
| 1920x1080 Ultra Graphics & Postprocessing (HBAO+) (classificar por valor) | |
| HP Omen 15t-ce000 | |
| Lenovo Legion Y520-15IKBN 80WK0042GE | |
| Dell Inspiron 15 7000 7577 | |
| Gigabyte Aero 15 | |
| Acer Aspire VN7-593G-73HP V15 Nitro BE | |
| HP Omen 15-ce002ng | |
| Aorus X5 v7 | |
| HP Spectre x360 15t-bl100 | |
| 1920x1080 High Graphics & Postprocessing (Nvidia HairWorks Off) (classificar por valor) | |
| HP Omen 15t-ce000 | |
| Lenovo Legion Y520-15IKBN 80WK0042GE | |
| Dell Inspiron 15 7000 7577 | |
| Gigabyte Aero 15 | |
| Acer Aspire VN7-593G-73HP V15 Nitro BE | |
| HP Omen 15-ce002ng | |
| Aorus X5 v7 | |
| HP Spectre x360 15t-bl100 | |
| baixo | média | alto | ultra | 4K | |
|---|---|---|---|---|---|
| Dirt 3 (2011) | 140.1 | 126.3 | 112.2 | 64.5 | |
| Sleeping Dogs (2012) | 218.4 | 192.7 | 164.7 | 69.5 | |
| Hitman: Absolution (2012) | 105.8 | 101 | 88.7 | 70 | |
| Tomb Raider (2013) | 308.4 | 277.7 | 170.5 | 115.6 | |
| BioShock Infinite (2013) | 209 | 193.3 | 180.1 | 102.4 | |
| GRID 2 (2013) | 210.8 | 152.8 | 143.3 | 116.7 | |
| Company of Heroes 2 (2013) | 68.9 | 65.7 | 63.4 | 40 | |
| Thief (2014) | 117.2 | 112 | 107.6 | 69 | |
| Middle-earth: Shadow of Mordor (2014) | 170.2 | 139.9 | 96.7 | 76.9 | |
| The Witcher 3 (2015) | 172.3 | 133.8 | 68.5 | 35 | 23.7 |
| Rise of the Tomb Raider (2016) | 148.1 | 117.8 | 67.6 | 54.6 | 24 |
| Ashes of the Singularity (2016) | 75.8 | 62.2 | 53.2 | 20.8 | |
| Deus Ex Mankind Divided (2016) | 110.3 | 93 | 52 | 27.6 | 16.3 |
| Prey (2017) | 116 | 92.9 | 80.2 | 30.7 | |
| Ark Survival Evolved (2017) | 109 | 48 | 35.5 | 25.6 | 8.5 |
| Middle-earth: Shadow of War (2017) | 128 | 81 | 62 | 46 | 27 |
| ELEX (2017) | 108.1 | 83.5 | 69.6 | 57.2 | 17 |
Barulho
| Ocioso |
| 30.4 / 30.4 / 30.5 dB |
| Carga |
| 38.5 / 49 dB |
 | ||
30 dB silencioso 40 dB(A) audível 50 dB(A) ruidosamente alto |
||
min: | ||
| HP Omen 15t-ce000 GeForce GTX 1060 Max-Q, i7-7700HQ, Samsung PM961 NVMe MZVLW128HEGR | Lenovo Legion Y520-15IKBN 80WK0042GE GeForce GTX 1050 Ti Mobile, i5-7300HQ, Samsung PM961 NVMe MZVLW128HEGR | Dell Inspiron 15 7000 7577 GeForce GTX 1060 Max-Q, i5-7300HQ, Samsung PM961 MZVLW256HEHP | Gigabyte Aero 15 GeForce GTX 1060 Mobile, i7-7700HQ, Lite-On CX2-8B512-Q11 | Acer Aspire VN7-593G-73HP V15 Nitro BE GeForce GTX 1060 Mobile, i7-7700HQ, Seagate Mobile HDD 1TB ST1000LM035 | HP Omen 15-ce002ng GeForce GTX 1060 Max-Q, i7-7700HQ, Samsung PM961 MZVLW256HEHP | Aorus X5 v7 GeForce GTX 1070 Mobile, i7-7820HK, Toshiba NVMe THNSN5256GPU7 | |
|---|---|---|---|---|---|---|---|
| Noise | -1% | 7% | -7% | -5% | -8% | -18% | |
| desligado / ambiente * (dB) | 28.2 | 30.6 -9% | 28 1% | 31 -10% | 30.4 -8% | 30 -6% | 30 -6% |
| Idle Minimum * (dB) | 30.4 | 31.9 -5% | 28 8% | 32 -5% | 30.9 -2% | 30 1% | 35 -15% |
| Idle Average * (dB) | 30.4 | 31.9 -5% | 28 8% | 33 -9% | 30.9 -2% | 33 -9% | 36 -18% |
| Idle Maximum * (dB) | 30.5 | 31.9 -5% | 28 8% | 34 -11% | 31.5 -3% | 37 -21% | 40 -31% |
| Load Average * (dB) | 38.5 | 34.6 10% | 30.3 21% | 39 -1% | 40.7 -6% | 41 -6% | 43 -12% |
| Witcher 3 ultra * (dB) | 37.6 | 39.3 -5% | 39.5 -5% | 43 -14% | 45.5 -21% | 42 -12% | 49 -30% |
| Load Maximum * (dB) | 49 | 41.7 15% | 46.5 5% | 50 -2% | 43.9 10% | 50 -2% | 55 -12% |
* ... menor é melhor
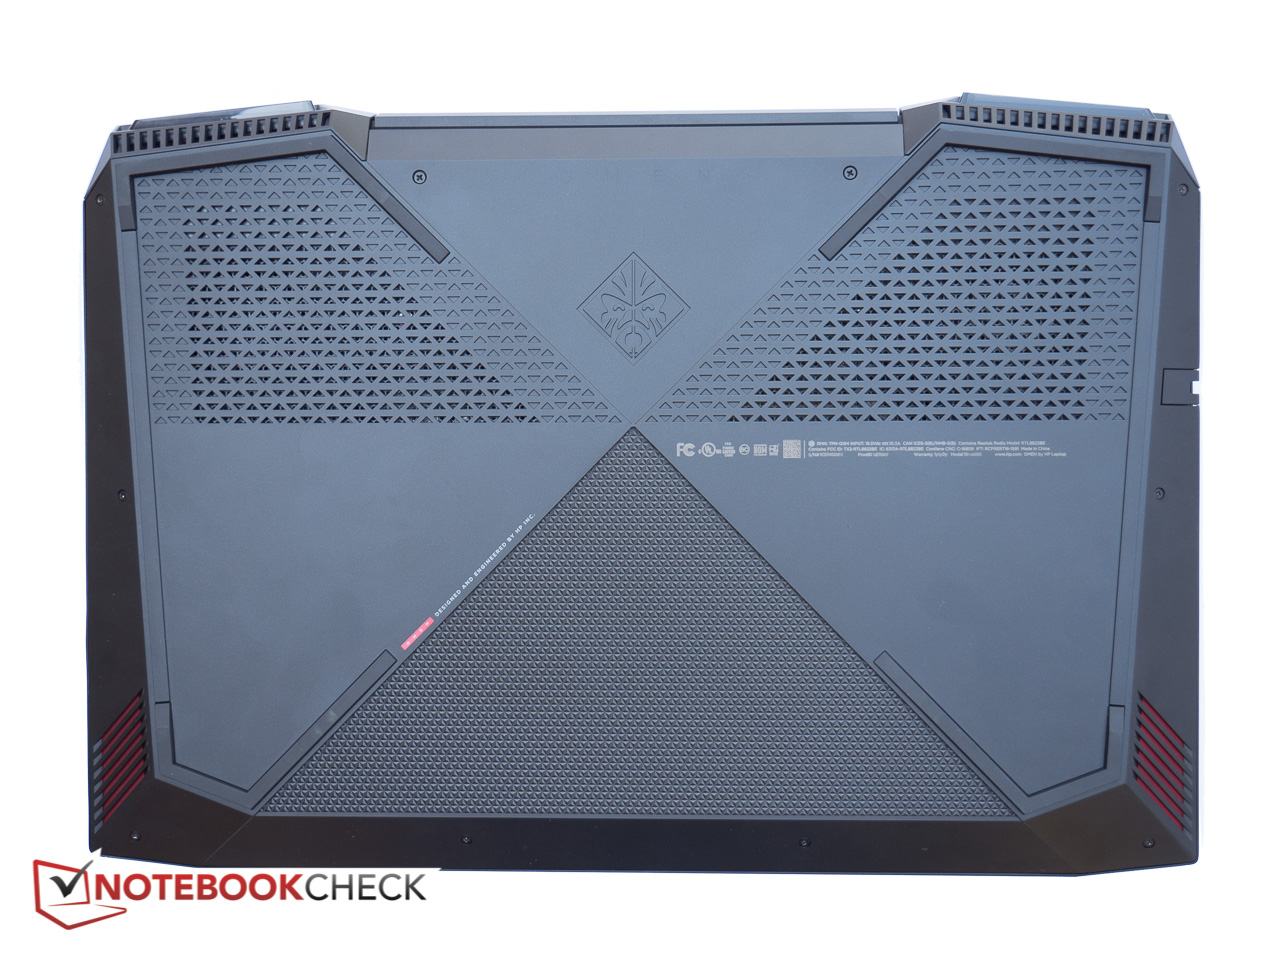
(-) A temperatura máxima no lado superior é 46 °C / 115 F, em comparação com a média de 40.4 °C / 105 F , variando de 21.2 a 68.8 °C para a classe Gaming.
(-) A parte inferior aquece até um máximo de 49.2 °C / 121 F, em comparação com a média de 43.2 °C / 110 F
(+) Em uso inativo, a temperatura média para o lado superior é 31.2 °C / 88 F, em comparação com a média do dispositivo de 33.9 °C / ### class_avg_f### F.
(±) Jogando The Witcher 3, a temperatura média para o lado superior é 36.2 °C / 97 F, em comparação com a média do dispositivo de 33.9 °C / ## #class_avg_f### F.
(+) Os apoios para as mãos e o touchpad são mais frios que a temperatura da pele, com um máximo de 31 °C / 87.8 F e, portanto, são frios ao toque.
(-) A temperatura média da área do apoio para as mãos de dispositivos semelhantes foi 28.8 °C / 83.8 F (-2.2 °C / -4 F).
HP Omen 15t-ce000 análise de áudio
(-) | alto-falantes não muito altos (###valor### dB)
Graves 100 - 315Hz
(±) | graves reduzidos - em média 13.8% menor que a mediana
(-) | graves não são lineares (15.7% delta para frequência anterior)
Médios 400 - 2.000 Hz
(+) | médios equilibrados - apenas 3.3% longe da mediana
(±) | a linearidade dos médios é média (10.4% delta para frequência anterior)
Altos 2 - 16 kHz
(+) | agudos equilibrados - apenas 3.8% longe da mediana
(±) | a linearidade dos máximos é média (7.2% delta para frequência anterior)
Geral 100 - 16.000 Hz
(±) | a linearidade do som geral é média (21.7% diferença em relação à mediana)
Comparado com a mesma classe
» 78% de todos os dispositivos testados nesta classe foram melhores, 5% semelhantes, 17% piores
» O melhor teve um delta de 6%, a média foi 18%, o pior foi 132%
Comparado com todos os dispositivos testados
» 62% de todos os dispositivos testados foram melhores, 7% semelhantes, 31% piores
» O melhor teve um delta de 4%, a média foi 23%, o pior foi 134%
Apple MacBook 12 (Early 2016) 1.1 GHz análise de áudio
(+) | os alto-falantes podem tocar relativamente alto (###valor### dB)
Graves 100 - 315Hz
(±) | graves reduzidos - em média 11.3% menor que a mediana
(±) | a linearidade dos graves é média (14.2% delta para a frequência anterior)
Médios 400 - 2.000 Hz
(+) | médios equilibrados - apenas 2.4% longe da mediana
(+) | médios são lineares (5.5% delta para frequência anterior)
Altos 2 - 16 kHz
(+) | agudos equilibrados - apenas 2% longe da mediana
(+) | os máximos são lineares (4.5% delta da frequência anterior)
Geral 100 - 16.000 Hz
(+) | o som geral é linear (10.2% diferença em relação à mediana)
Comparado com a mesma classe
» 7% de todos os dispositivos testados nesta classe foram melhores, 2% semelhantes, 90% piores
» O melhor teve um delta de 5%, a média foi 18%, o pior foi 53%
Comparado com todos os dispositivos testados
» 5% de todos os dispositivos testados foram melhores, 1% semelhantes, 94% piores
» O melhor teve um delta de 4%, a média foi 23%, o pior foi 134%
| desligado | |
| Ocioso | |
| Carga |
|
Key:
min: | |
| HP Omen 15t-ce000 i7-7700HQ, GeForce GTX 1060 Max-Q, Samsung PM961 NVMe MZVLW128HEGR, IPS, 3840x2160, 15.6" | Lenovo Legion Y520-15IKBN 80WK0042GE i5-7300HQ, GeForce GTX 1050 Ti Mobile, Samsung PM961 NVMe MZVLW128HEGR, IPS, 1920x1080, 15.6" | Dell Inspiron 15 7000 7577 i5-7300HQ, GeForce GTX 1060 Max-Q, Samsung PM961 MZVLW256HEHP, IPS, 1920x1080, 15.6" | Gigabyte Aero 15 i7-7700HQ, GeForce GTX 1060 Mobile, Lite-On CX2-8B512-Q11, IPS, 1920x1080, 15.6" | Acer Aspire VN7-593G-73HP V15 Nitro BE i7-7700HQ, GeForce GTX 1060 Mobile, Seagate Mobile HDD 1TB ST1000LM035, AH-IPS, Normally Black, Transmissive, 1920x1080, 15.6" | HP Omen 15-ce002ng i7-7700HQ, GeForce GTX 1060 Max-Q, Samsung PM961 MZVLW256HEHP, IPS, 1920x1080, 15.6" | Aorus X5 v7 i7-7820HK, GeForce GTX 1070 Mobile, Toshiba NVMe THNSN5256GPU7, IPS, 3840x2160, 15.6" | |
|---|---|---|---|---|---|---|---|
| Power Consumption | 39% | 39% | 4% | 15% | -13% | -58% | |
| Idle Minimum * (Watt) | 15.4 | 5.2 66% | 7.1 54% | 12 22% | 7.2 53% | 18 -17% | 26 -69% |
| Idle Average * (Watt) | 22.4 | 8.3 63% | 7.6 66% | 15 33% | 10.5 53% | 23 -3% | 31 -38% |
| Idle Maximum * (Watt) | 22.4 | 10.1 55% | 8.6 62% | 20 11% | 16 29% | 30 -34% | 36 -61% |
| Load Average * (Watt) | 78.1 | 62.7 20% | 59.5 24% | 82 -5% | 82 -5% | 85 -9% | 93 -19% |
| Witcher 3 ultra * (Watt) | 97.5 | 94 4% | 89 9% | 111 -14% | 124 -27% | 96 2% | 176 -81% |
| Load Maximum * (Watt) | 133.52 | 100 25% | 112.8 16% | 161 -21% | 155 -16% | 158 -18% | 240 -80% |
* ... menor é melhor
| HP Omen 15t-ce000 i7-7700HQ, GeForce GTX 1060 Max-Q, 70 Wh | Lenovo Legion Y520-15IKBN 80WK0042GE i5-7300HQ, GeForce GTX 1050 Ti Mobile, 45 Wh | Dell Inspiron 15 7000 7577 i5-7300HQ, GeForce GTX 1060 Max-Q, 56 Wh | Gigabyte Aero 15 i7-7700HQ, GeForce GTX 1060 Mobile, 94.24 Wh | Acer Aspire VN7-593G-73HP V15 Nitro BE i7-7700HQ, GeForce GTX 1060 Mobile, 69 Wh | HP Omen 15-ce002ng i7-7700HQ, GeForce GTX 1060 Max-Q, 70 Wh | Aorus X5 v7 i7-7820HK, GeForce GTX 1070 Mobile, 94 Wh | |
|---|---|---|---|---|---|---|---|
| Duração da bateria | 54% | 77% | 83% | 70% | -9% | -20% | |
| Reader / Idle (h) | 5 | 10.6 112% | 11 120% | 10.6 112% | 8.4 68% | 4.3 -14% | 3.5 -30% |
| WiFi v1.3 (h) | 3.5 | 5.2 49% | 6.9 97% | 7 100% | 6 71% | 3.3 -6% | 2.5 -29% |
| Load (h) | 1.4 | 1.4 0% | 1.6 14% | 1.9 36% | 2.4 71% | 1.3 -7% | 1.4 0% |
Pro
Contra


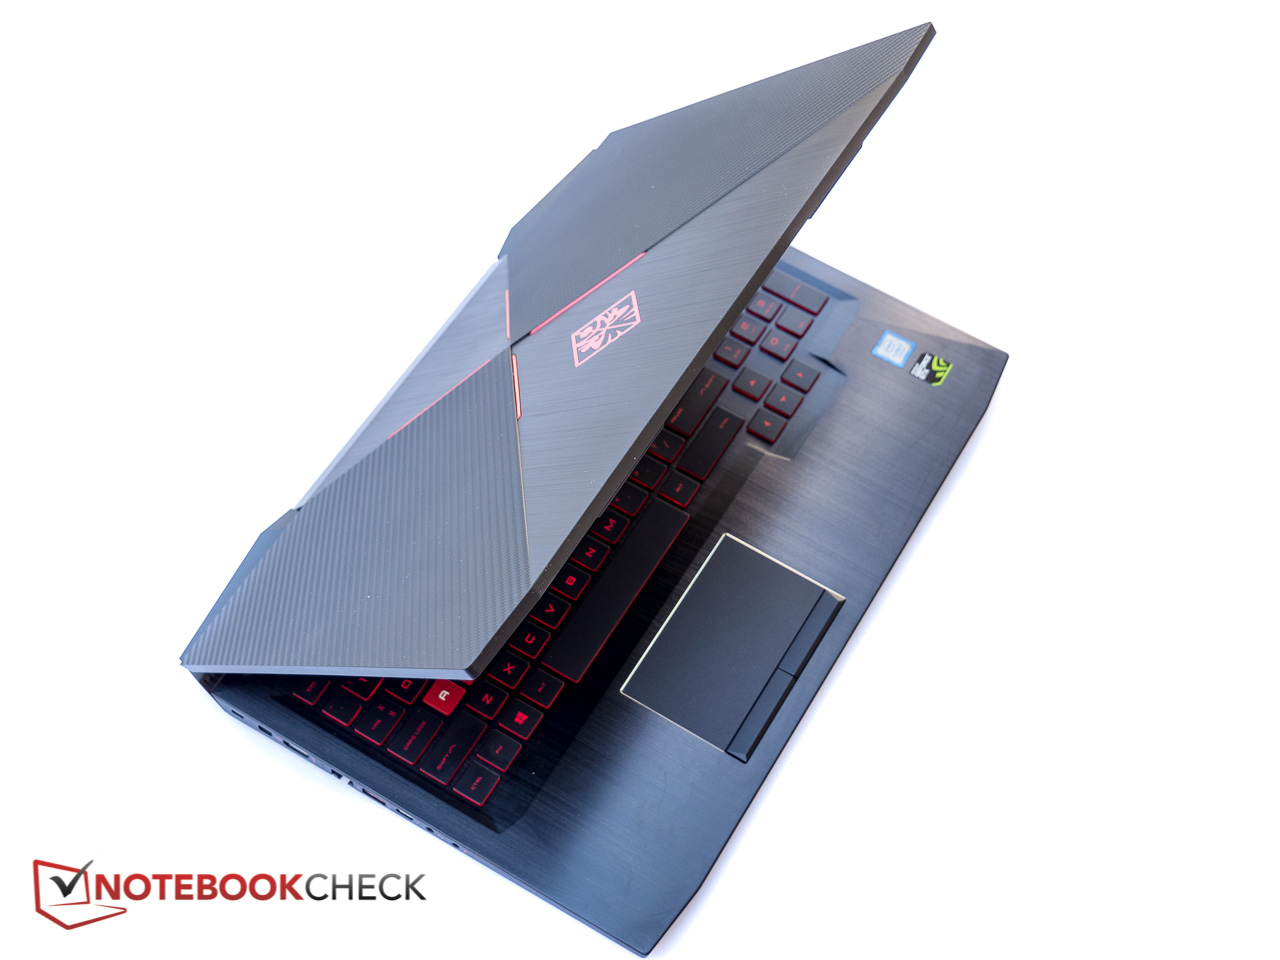
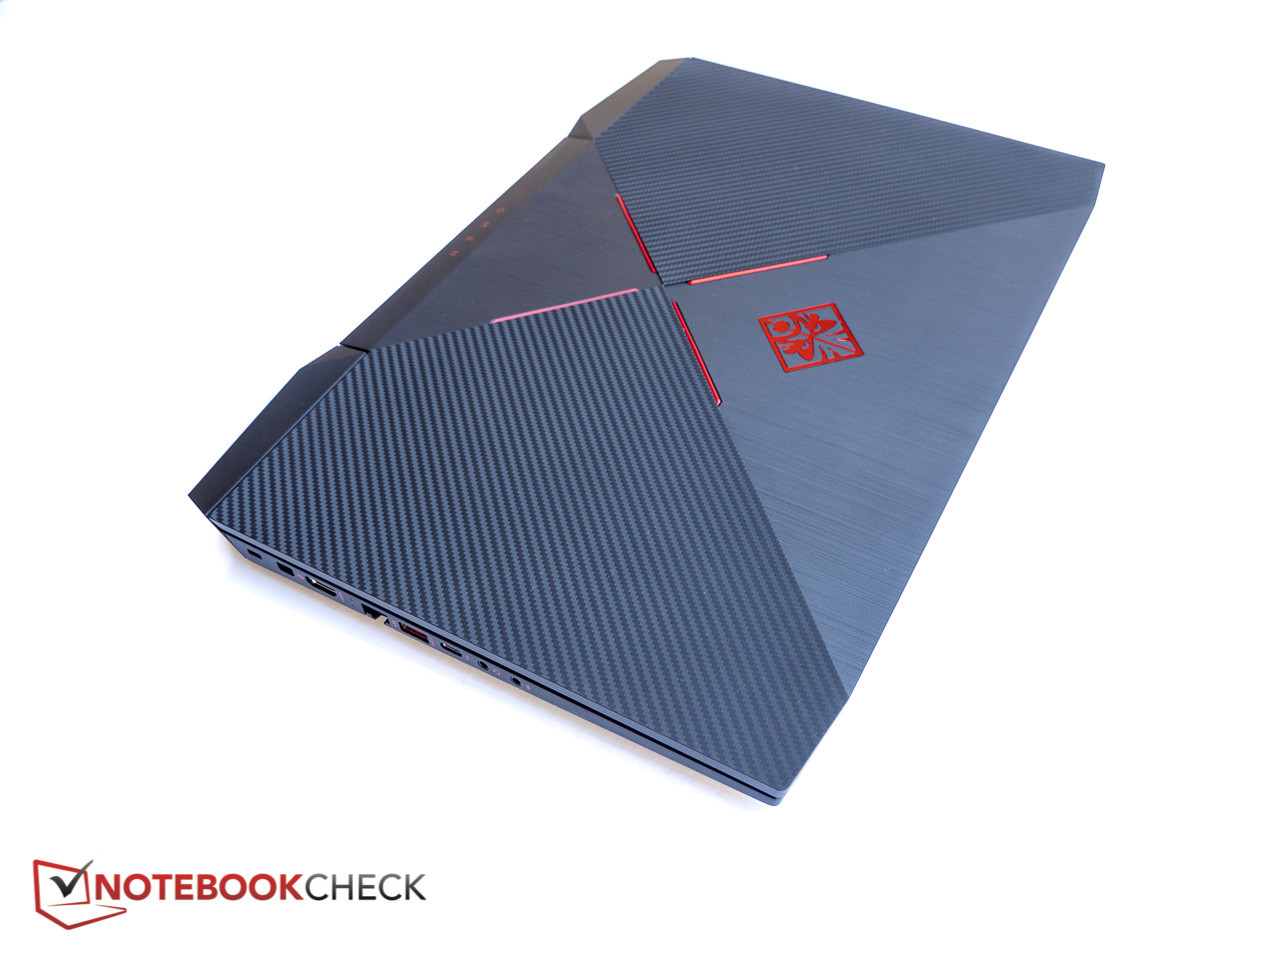
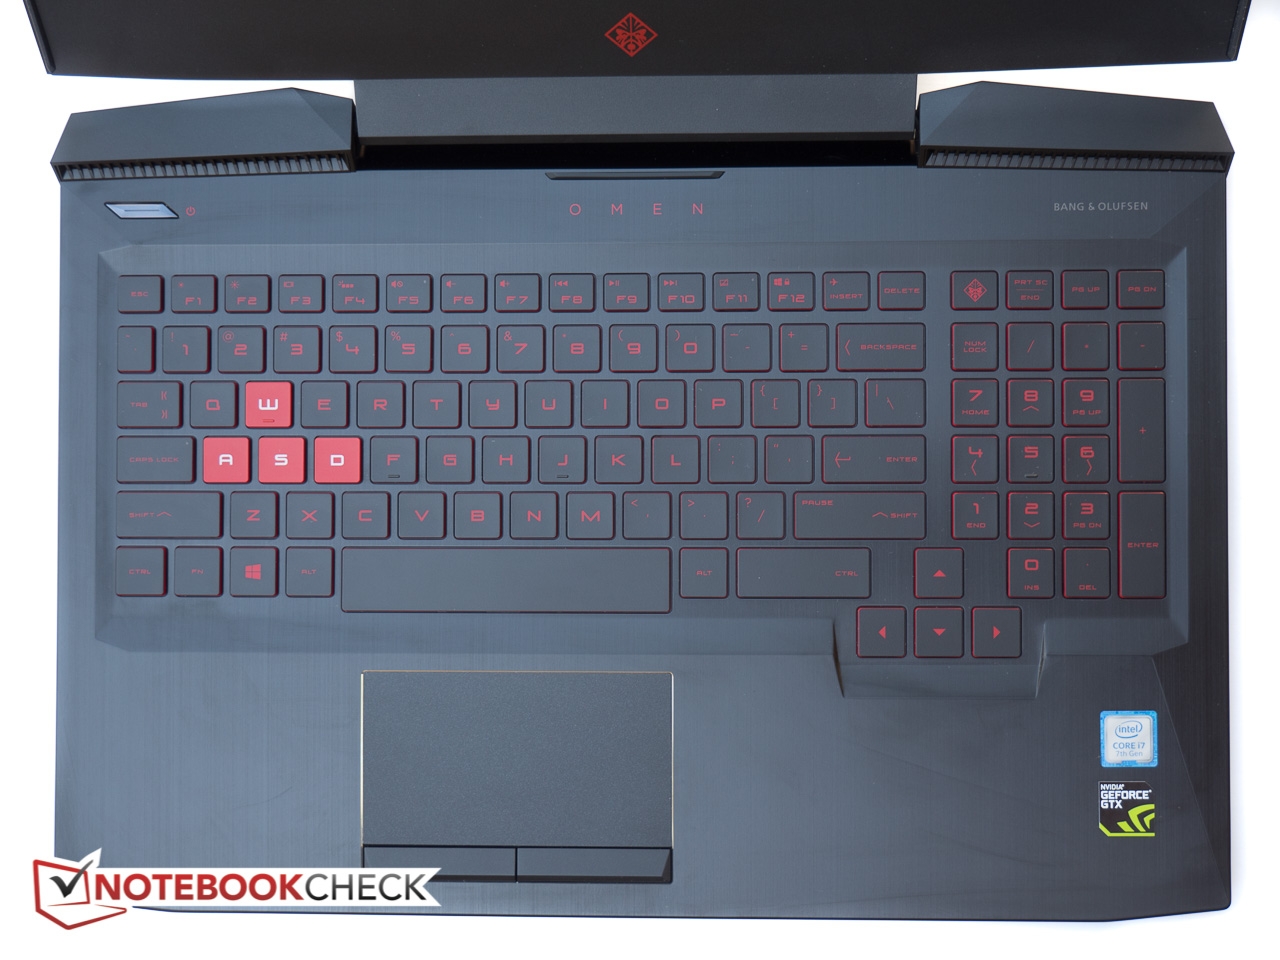
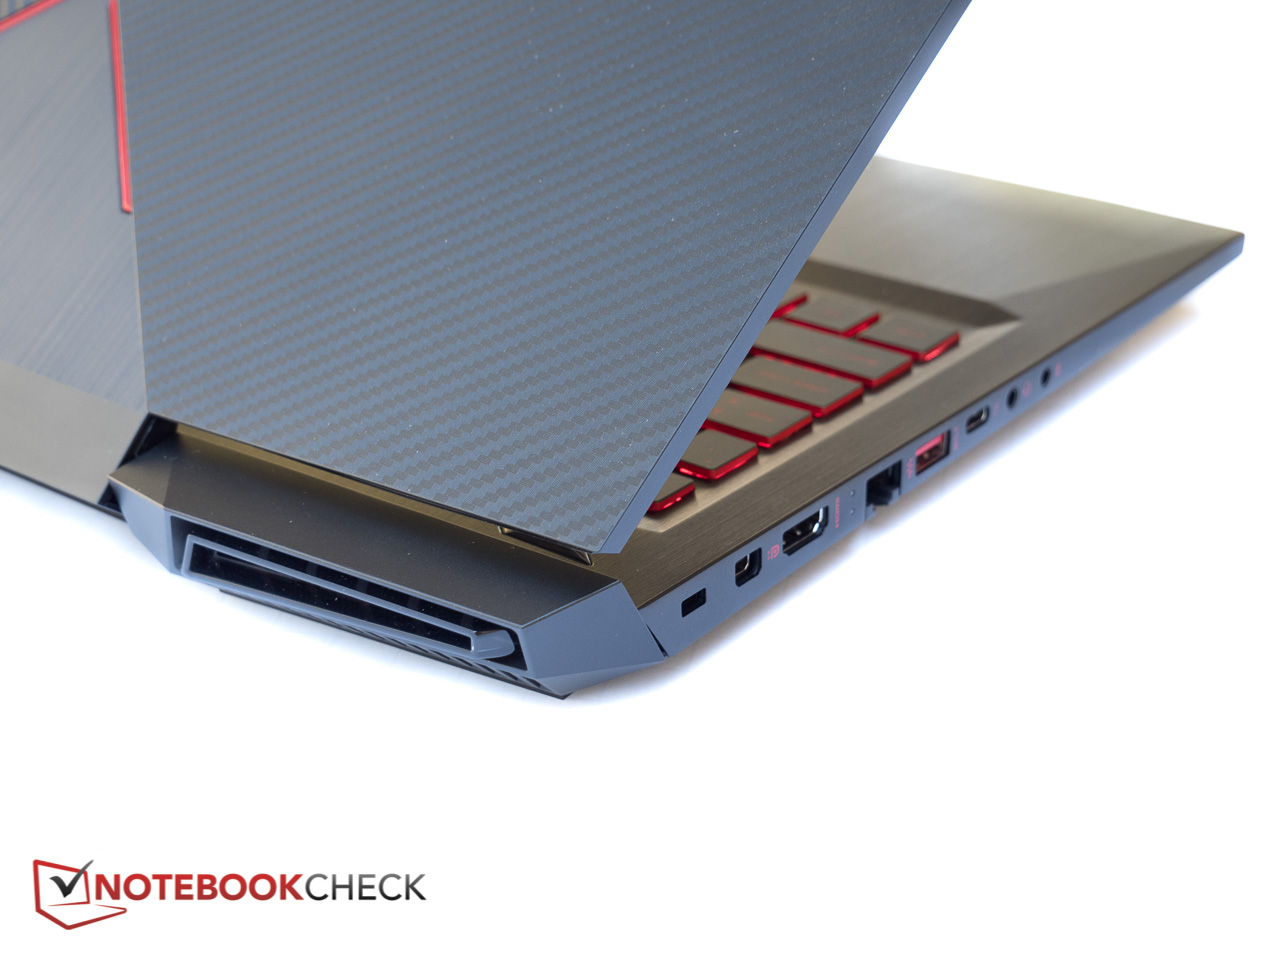
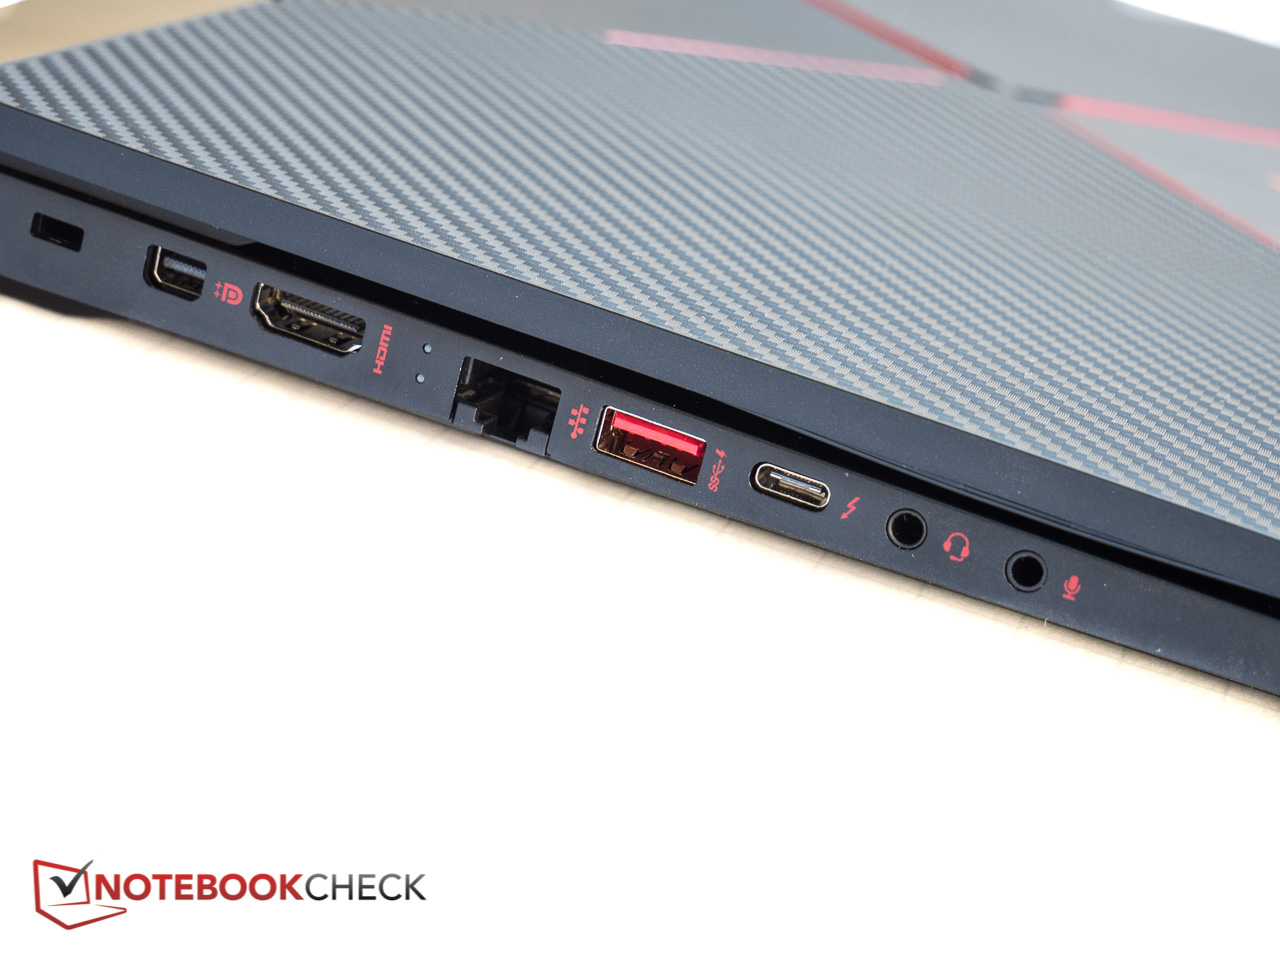
Não é muito difícil encontrar falhas ao examinar portáteis de jogos com preços mais baixos, já que o fabricante deve seguir uma linha muito fina para equilibrar materiais comparativamente baratos com boa aparência e hardware suficientemente potente para atrair o maior número possível de usuários. Para o Omen 15, talvez tenhamos a tentação de criticar a casca metálica superior estampada com suas bordas bastante afiadas, o bleeding da tela bastante notório ou o sistema da ventoinha bastante obstrutivo. Mas nenhuma das falhas é crucial quando se trata de um sistema de jogos: em resumo, o HP Omen 15 é um sistema Max-Q de preço acessível com suficiente poder para lidar com muitos jogos atuais, pelo menos com a resolução de tela Full HD .
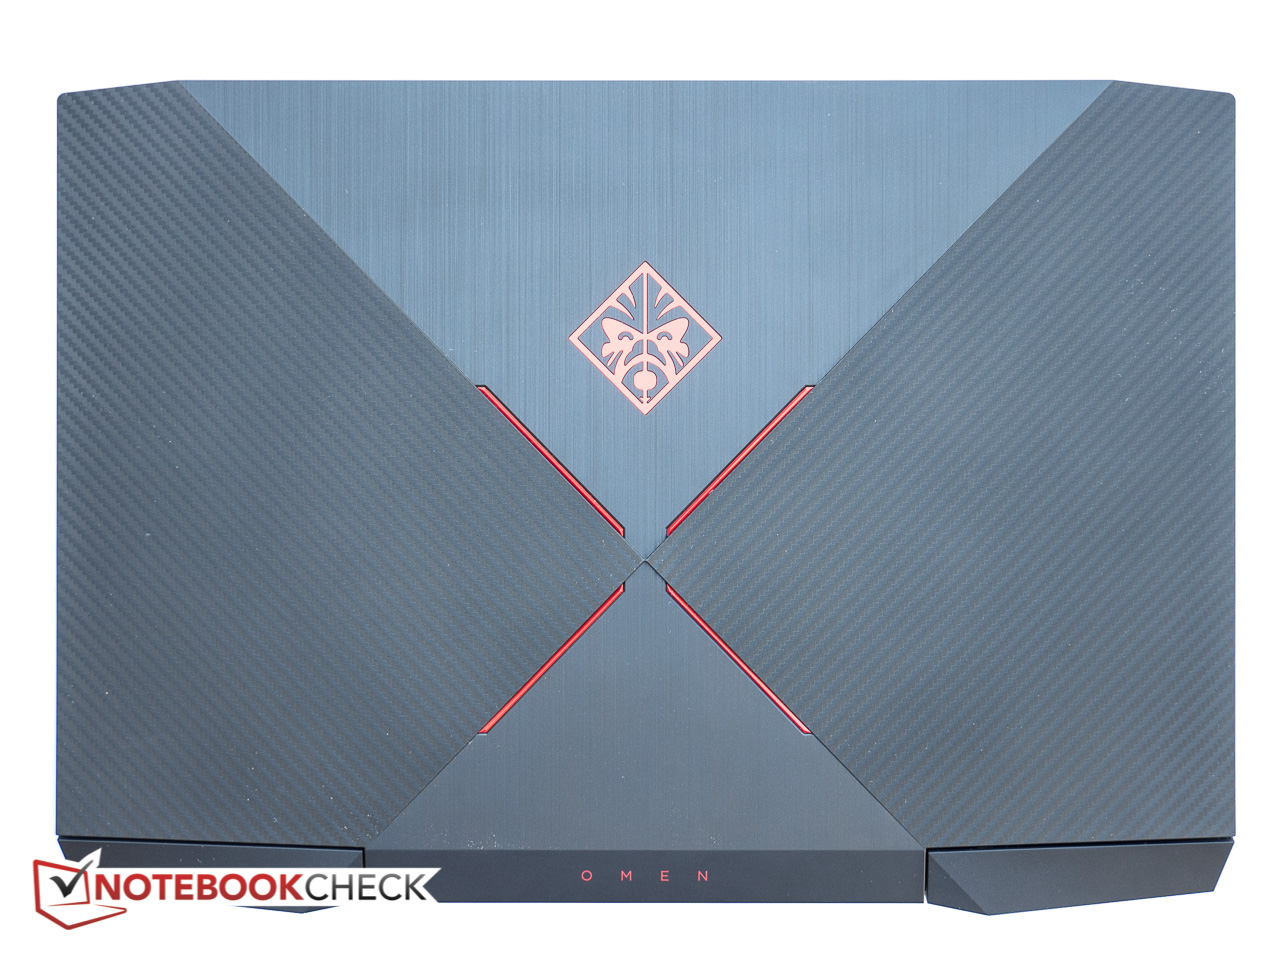
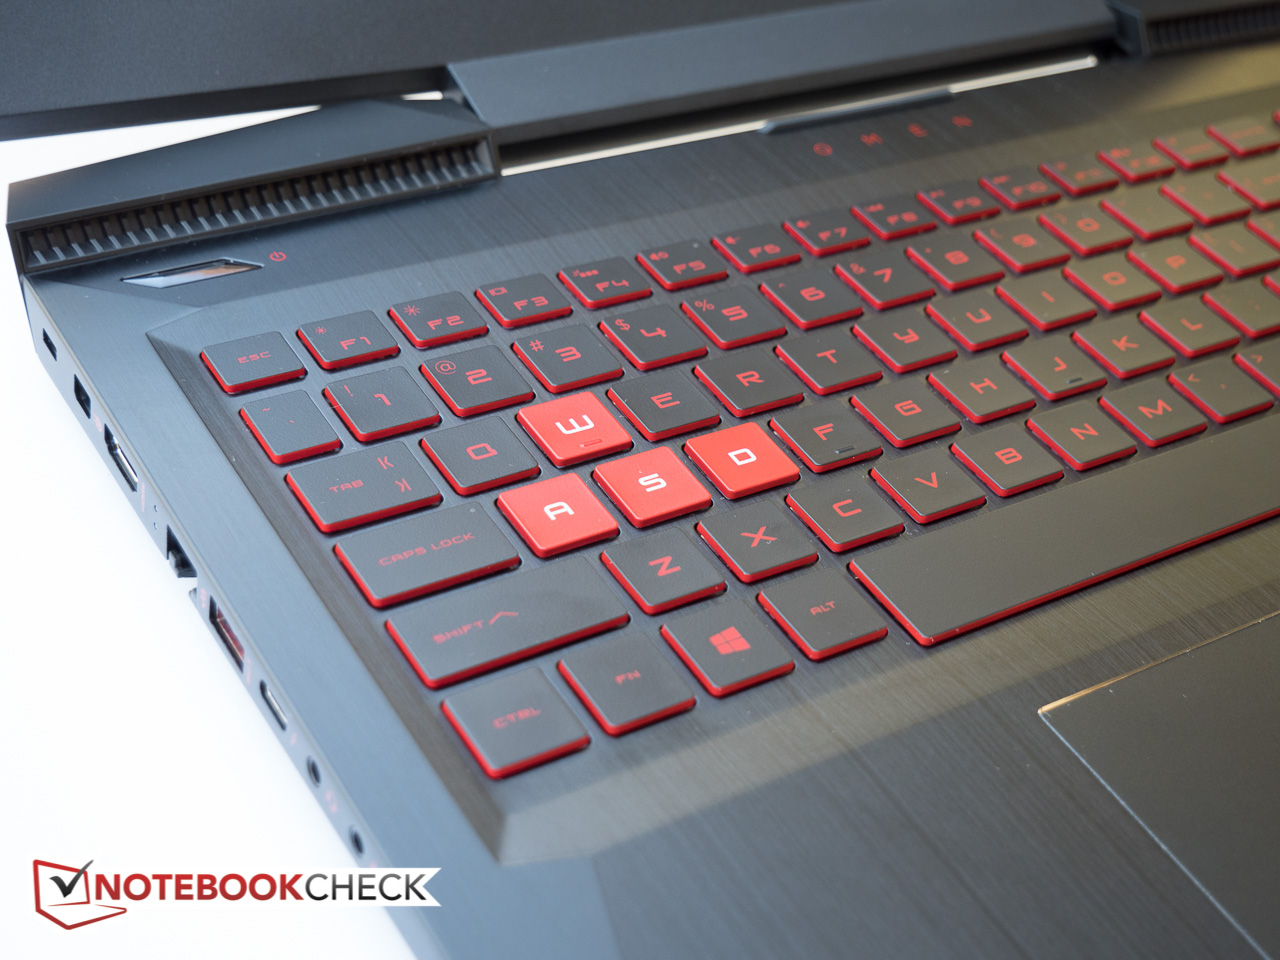
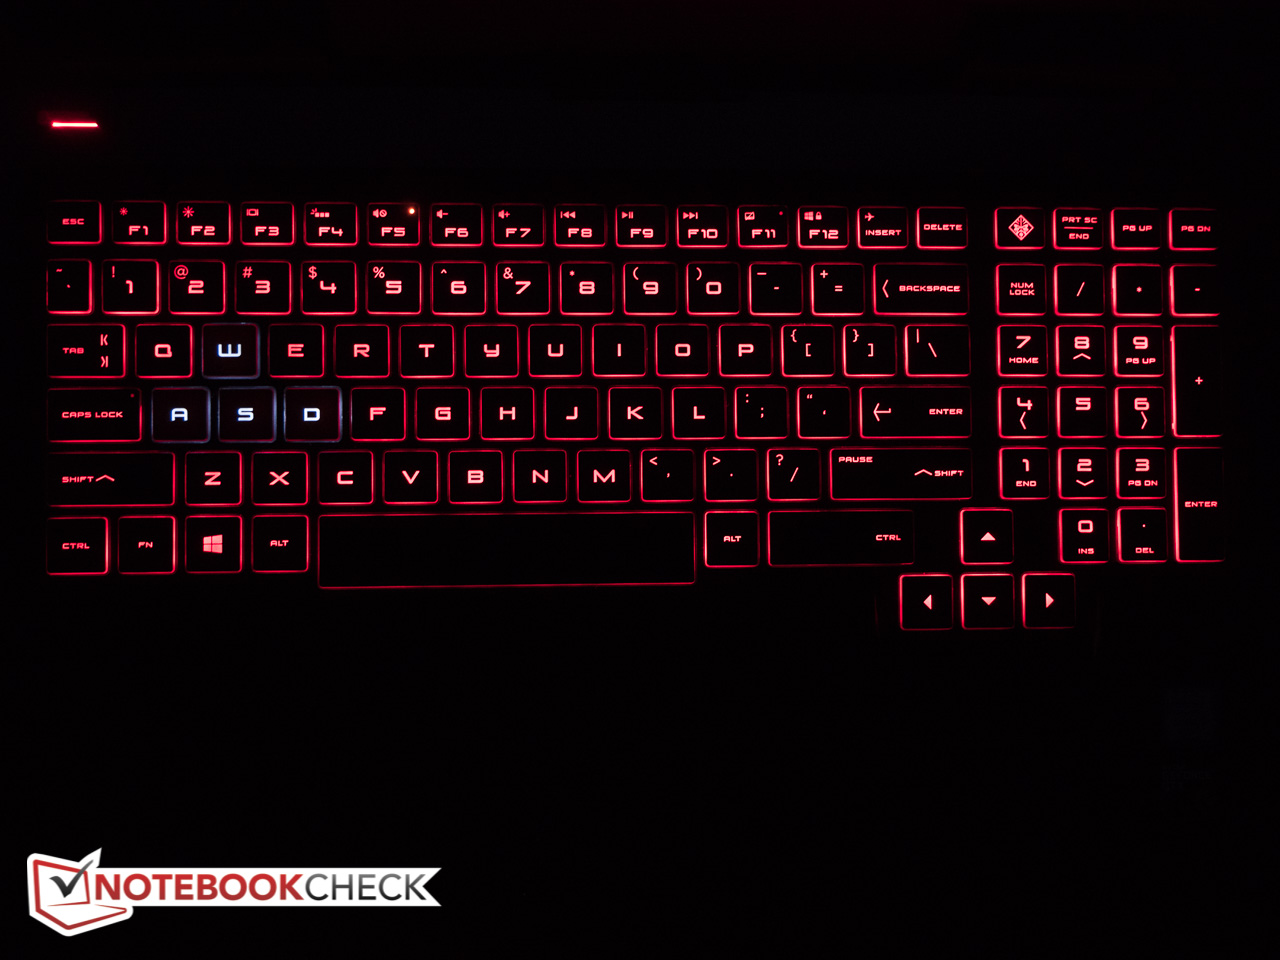
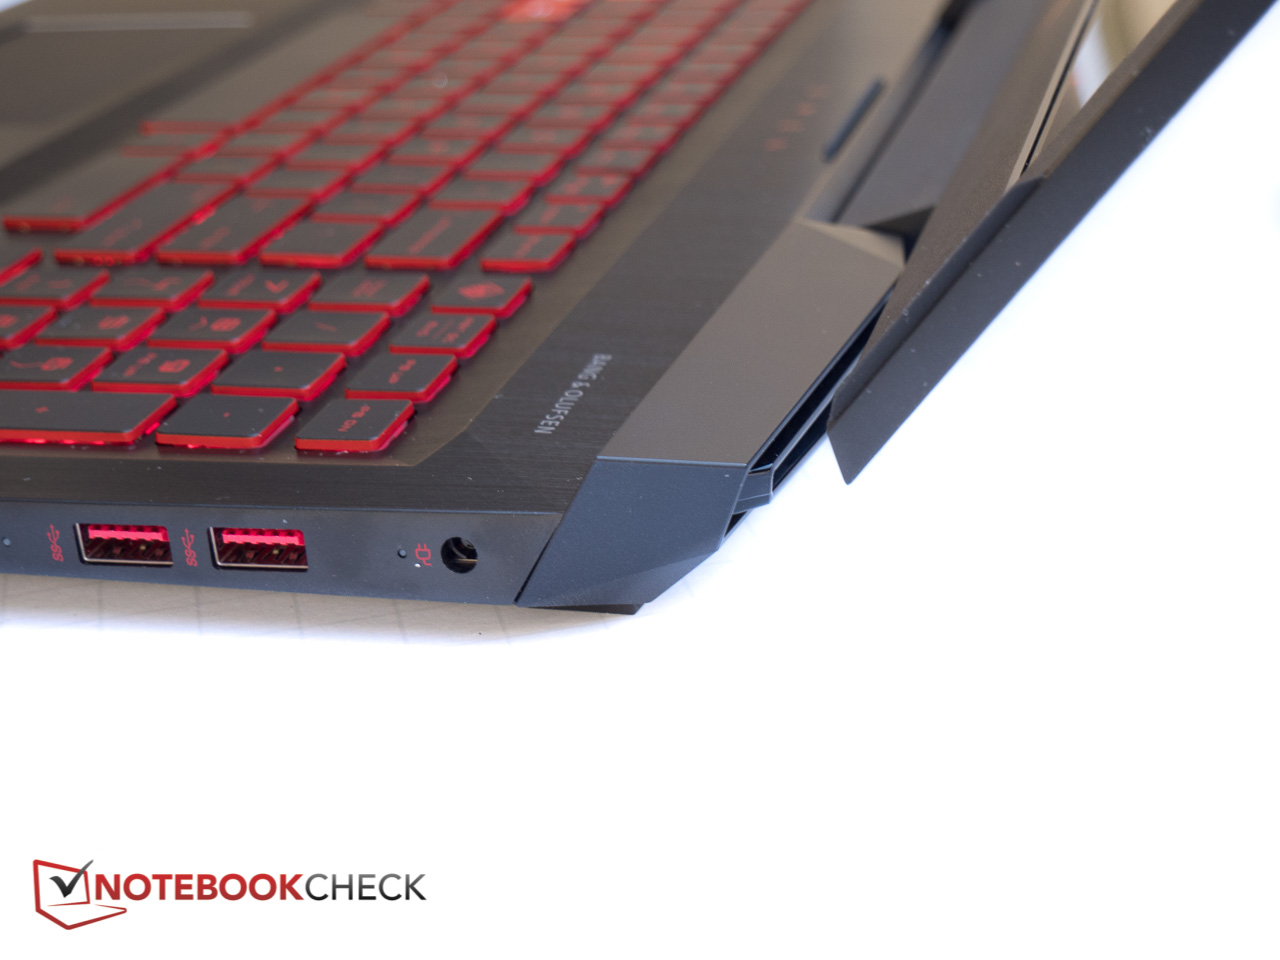
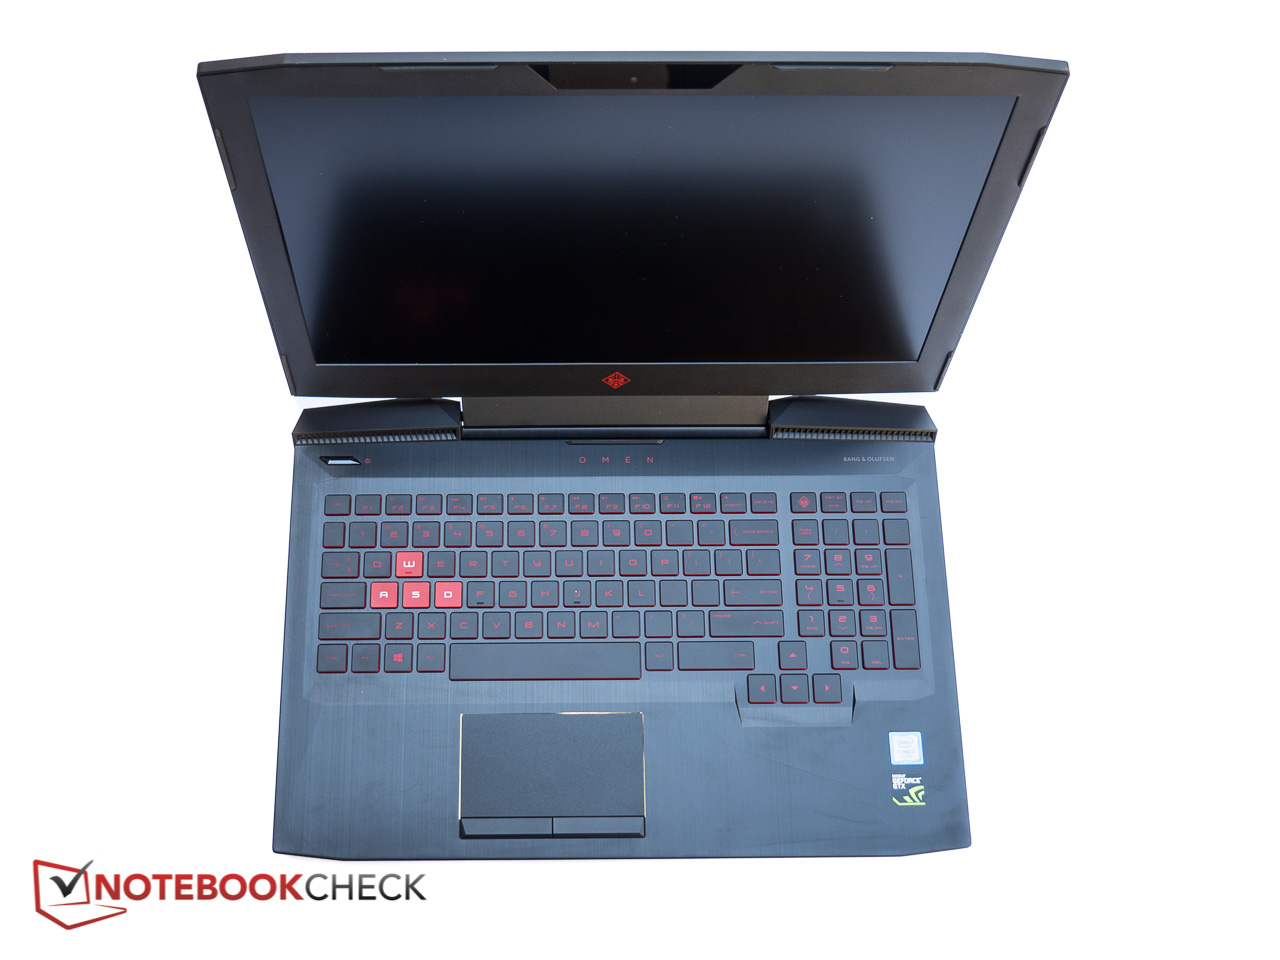
O design mais novo com seu estilo mais "no seu rosto" pode não ser atraente para todos, mas não há dúvida de que a qualidade de construção em si é bastante decente com boa rigidez de torção da unidade base e pouco ou nada de afundamento no teclado. Os dispositivos de entrada funcionam bem, o hardware oferece muito poder e a tela UHD IPS brilhante é - especialmente após uma calibração - bastante incrível pelo preço. O Omen 15 ainda esquenta bastante, mas não é tão quente quanto alguns outros sistemas. As ventoinhas são, no entanto, bastante irritantes, enquanto giram frequentemente e produzem frequentemente um som oscilante que irrita os nervos.
Os usuários que procuram um portátil de jogos acessível de gama média-baixa com tela 4K definitivamente devem colocar o Omen 15 em sua lista de potenciais candidatos.
O portátil de jogos Dell Inspiron 15 possui uma tela inferior, mas um desempenho ainda muito decente e dura duas vezes mais com a bateria.
HP Omen 15t-ce000
- 12/01/2017 v6 (old)
Bernie Pechlaner
Price comparison
