Breve Análise do Conversível HP Spectre x360 15t-bl100 (i7-8550U, MX150)

| SD Card Reader | |
| average JPG Copy Test (av. of 3 runs) | |
| HP Spectre x360 15t-bl100 | |
| Dell XPS 15 9560 (i7-7700HQ, UHD) | |
| HP Pavilion x360 15-bk102ng | |
| Dell Inspiron 15 5578-1777 2-in-1 | |
| maximum AS SSD Seq Read Test (1GB) | |
| Dell XPS 15 9560 (i7-7700HQ, UHD) | |
| HP Spectre x360 15t-bl100 | |
| HP Pavilion x360 15-bk102ng | |
| Dell Inspiron 15 5578-1777 2-in-1 | |
| |||||||||||||||||||||||||
iluminação: 91 %
iluminação com acumulador: 338.7 cd/m²
Contraste: 1210:1 (Preto: 0.28 cd/m²)
ΔE ColorChecker Calman: 4.9 | ∀{0.5-29.43 Ø4.71}
ΔE Greyscale Calman: 5.5 | ∀{0.09-98 Ø4.96}
86.92% sRGB (Argyll 1.6.3 3D)
63.5% AdobeRGB 1998 (Argyll 1.6.3 3D)
63.5% AdobeRGB 1998 (Argyll 3D)
86.9% sRGB (Argyll 3D)
66.6% Display P3 (Argyll 3D)
Gamma: 2.08
CCT: 7498 K
| HP Spectre x360 15t-bl100 BOE06C3, IPS, 15.6", 3840x2160 | Dell Inspiron 15 5578-1777 2-in-1 LG Philips (Dell 156WF7), IPS, 15.6", 1920x1080 | Lenovo Yoga 720-15IKB-80X7 Chi Mei CMN N156HCE-EN1, IPS, 15.6", 1920x1080 | HP Pavilion x360 15-bk102ng LG Philips, IPS, 15.6", 1920x1080 | Lenovo Yoga 920-13IKB-80Y7 AU Optronics B139HAN03.0, IPS, 13.9", 1920x1080 | HP Spectre x360 13-ac033dx LG Philips LGD054D, IPS, 13.3", 3840x2160 | |
|---|---|---|---|---|---|---|
| Display | -32% | 2% | -36% | 0% | 9% | |
| Display P3 Coverage (%) | 66.6 | 41.74 -37% | 65 -2% | 39.45 -41% | 62.5 -6% | 69.4 4% |
| sRGB Coverage (%) | 86.9 | 62.8 -28% | 90.8 4% | 59.2 -32% | 91.7 6% | 96.8 11% |
| AdobeRGB 1998 Coverage (%) | 63.5 | 43.13 -32% | 65.8 4% | 40.76 -36% | 64.1 1% | 71.1 12% |
| Response Times | -1% | 20% | -11% | -10% | -5% | |
| Response Time Grey 50% / Grey 80% * (ms) | 41.2 ? | 55 ? -33% | 29.6 ? 28% | 55 ? -33% | 46 ? -12% | 42 ? -2% |
| Response Time Black / White * (ms) | 29.6 ? | 20 ? 32% | 26.4 ? 11% | 26 ? 12% | 31.6 ? -7% | 32 ? -8% |
| PWM Frequency (Hz) | 1000 | 25510 ? | 50 ? | |||
| Screen | -10% | -5% | -34% | -18% | 14% | |
| Brightness middle (cd/m²) | 338.7 | 244 -28% | 300.9 -11% | 205 -39% | 297.9 -12% | 302.6 -11% |
| Brightness (cd/m²) | 325 | 242 -26% | 285 -12% | 191 -41% | 278 -14% | 282 -13% |
| Brightness Distribution (%) | 91 | 93 2% | 92 1% | 74 -19% | 81 -11% | 83 -9% |
| Black Level * (cd/m²) | 0.28 | 0.25 11% | 0.24 14% | 0.3 -7% | 0.44 -57% | 0.25 11% |
| Contrast (:1) | 1210 | 976 -19% | 1254 4% | 683 -44% | 677 -44% | 1210 0% |
| Colorchecker dE 2000 * | 4.9 | 4.94 -1% | 5 -2% | 7.2 -47% | 5.1 -4% | 2.4 51% |
| Colorchecker dE 2000 max. * | 8.7 | 7.3 16% | 10.2 -17% | 12.7 -46% | 11 -26% | 4.9 44% |
| Greyscale dE 2000 * | 5.5 | 4.93 10% | 7 -27% | 6.86 -25% | 6.7 -22% | 2.8 49% |
| Gamma | 2.08 106% | 2.7 81% | 2.34 94% | 2.27 97% | 2.9 76% | 2.2 100% |
| CCT | 7498 87% | 7401 88% | 6578 99% | 6983 93% | 6839 95% | 6333 103% |
| Color Space (Percent of AdobeRGB 1998) (%) | 63.5 | 40 -37% | 59 -7% | 38 -40% | 64.1 1% | 65.5 3% |
| Color Space (Percent of sRGB) (%) | 86.92 | 63 -28% | 90 4% | 59 -32% | 91.7 5% | 97.1 12% |
| Média Total (Programa/Configurações) | -14% /
-13% | 6% /
-1% | -27% /
-31% | -9% /
-13% | 6% /
10% |
* ... menor é melhor
Exibir tempos de resposta
| ↔ Tempo de resposta preto para branco | ||
|---|---|---|
| 29.6 ms ... ascensão ↗ e queda ↘ combinadas | ↗ 16.4 ms ascensão | 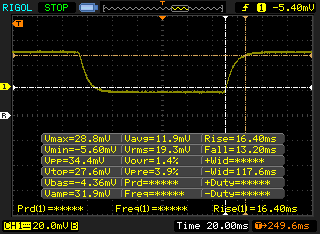 |
| ↘ 13.2 ms queda | ||
| A tela mostra taxas de resposta relativamente lentas em nossos testes e pode ser muito lenta para os jogadores. Em comparação, todos os dispositivos testados variam de 0.1 (mínimo) a 240 (máximo) ms. » 79 % de todos os dispositivos são melhores. Isso significa que o tempo de resposta medido é pior que a média de todos os dispositivos testados (19.8 ms). | ||
| ↔ Tempo de resposta 50% cinza a 80% cinza | ||
| 41.2 ms ... ascensão ↗ e queda ↘ combinadas | ↗ 23.2 ms ascensão | 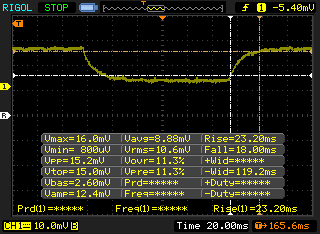 |
| ↘ 18 ms queda | ||
| A tela mostra taxas de resposta lentas em nossos testes e será insatisfatória para os jogadores. Em comparação, todos os dispositivos testados variam de 0.165 (mínimo) a 636 (máximo) ms. » 66 % de todos os dispositivos são melhores. Isso significa que o tempo de resposta medido é pior que a média de todos os dispositivos testados (31 ms). | ||
Cintilação da tela / PWM (modulação por largura de pulso)
| Tela tremeluzindo/PWM detectado | 1000 Hz | 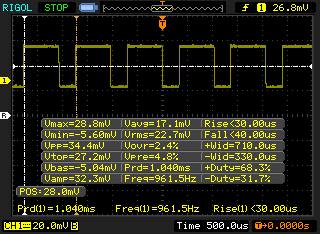 | |
A luz de fundo da tela pisca em 1000 Hz (pior caso, por exemplo, utilizando PWM) . A frequência de 1000 Hz é bastante alta, então a maioria dos usuários sensíveis ao PWM não deve notar nenhuma oscilação. [pwm_comparison] Em comparação: 52 % de todos os dispositivos testados não usam PWM para escurecer a tela. Se PWM foi detectado, uma média de 7754 (mínimo: 5 - máximo: 343500) Hz foi medida. | |||
| wPrime 2.10 - 1024m | |
| HP Spectre x360 15-bl002xx | |
| HP Spectre x360 13-ac033dx | |
| HP Spectre x360 15t-bl100 | |
| Lenovo Yoga 720-15IKB-80X7 | |
| Dell XPS 15 9560 (i7-7700HQ, UHD) | |
* ... menor é melhor
| PCMark 8 Home Score Accelerated v2 | 3457 pontos | |
| PCMark 8 Creative Score Accelerated v2 | 5083 pontos | |
| PCMark 8 Work Score Accelerated v2 | 4217 pontos | |
| PCMark 10 Score | 3673 pontos | |
Ajuda | ||
| HP Spectre x360 15t-bl100 Samsung PM961 NVMe MZVLW512HMJP | Dell Inspiron 15 5578-1777 2-in-1 SanDisk X400 256GB, SATA (SD8SB8U-256G) | Lenovo Yoga 720-15IKB-80X7 Samsung PM961 MZVLW256HEHP | Lenovo Yoga 920-13IKB-80Y7 Samsung PM961 MZVLW256HEHP | HP Spectre x360 15-bl002xx Toshiba XG4 NVMe (THNSN5512GPUK) | HP Spectre x360 13-ac033dx Samsung PM961 NVMe MZVLW512HMJP | |
|---|---|---|---|---|---|---|
| AS SSD | -96% | -1505% | -27% | -649% | -20% | |
| Copy Game MB/s (MB/s) | 1134 | 150 -87% | 319.2 -72% | 727 -36% | 1123 -1% | |
| Copy Program MB/s (MB/s) | 534 | 77.3 -86% | 463.3 -13% | 475.1 -11% | 466.7 -13% | |
| Copy ISO MB/s (MB/s) | 1936 | 325.7 -83% | 1341 -31% | 1126 -42% | 1672 -14% | |
| Score Total (Points) | 3781 | 920 -76% | 942 -75% | 2536 -33% | 426 -89% | 2219 -41% |
| Score Write (Points) | 1556 | 241 -85% | 48 -97% | 608 -61% | 20 -99% | 832 -47% |
| Score Read (Points) | 1493 | 443 -70% | 646 -57% | 1316 -12% | 307 -79% | 945 -37% |
| Access Time Write * (ms) | 0.026 | 0.083 -219% | 4.15 -15862% | 0.028 -8% | 2.179 -8281% | 0.031 -19% |
| Access Time Read * (ms) | 0.04 | 0.128 -220% | 0.08 -100% | 0.044 -10% | 0.044 -10% | 0.036 10% |
| 4K-64 Write (MB/s) | 1262 | 144.6 -89% | 15.3 -99% | 391.3 -69% | 2.08 -100% | 566 -55% |
| 4K-64 Read (MB/s) | 1206 | 371.1 -69% | 371.6 -69% | 1039 -14% | 113.7 -91% | 641 -47% |
| 4K Write (MB/s) | 141.1 | 50.4 -64% | 1.2 -99% | 128.1 -9% | 1.91 -99% | 118.5 -16% |
| 4K Read (MB/s) | 51.9 | 27.09 -48% | 47.1 -9% | 48.46 -7% | 35 -33% | 48.18 -7% |
| Seq Write (MB/s) | 1530 | 460.3 -70% | 311.7 -80% | 885 -42% | 160.4 -90% | 1476 -4% |
| Seq Read (MB/s) | 2342 | 451 -81% | 2277 -3% | 2282 -3% | 1599 -32% | 2556 9% |
* ... menor é melhor

| 3DMark 11 Performance | 4825 pontos | |
| 3DMark Cloud Gate Standard Score | 13664 pontos | |
| 3DMark Fire Strike Score | 3217 pontos | |
Ajuda | ||
| Rise of the Tomb Raider | |
| 1024x768 Lowest Preset (classificar por valor) | |
| HP Spectre x360 15t-bl100 | |
| Acer Aspire 5 A517-51G-80L | |
| Lenovo Yoga 920-13IKB-80Y7 | |
| HP Spectre x360 15-bl002xx | |
| 1366x768 Medium Preset AF:2x (classificar por valor) | |
| HP Spectre x360 15t-bl100 | |
| Acer Aspire 5 A517-51G-80L | |
| Lenovo Yoga 920-13IKB-80Y7 | |
| HP Spectre x360 15-bl002xx | |
| 1920x1080 High Preset AA:FX AF:4x (classificar por valor) | |
| HP Spectre x360 15t-bl100 | |
| Acer Aspire 5 A517-51G-80L | |
| Lenovo Yoga 920-13IKB-80Y7 | |
| HP Spectre x360 15-bl002xx | |
| 1920x1080 Very High Preset AA:FX AF:16x (classificar por valor) | |
| HP Spectre x360 15t-bl100 | |
| Acer Aspire 5 A517-51G-80L | |
| Lenovo Yoga 720-15IKB-80X7 | |
| HP Spectre x360 15-bl002xx | |
| The Witcher 3 | |
| 1024x768 Low Graphics & Postprocessing (classificar por valor) | |
| HP Spectre x360 15t-bl100 | |
| Dell XPS 13 9360 FHD i7 Iris | |
| 1366x768 Medium Graphics & Postprocessing (classificar por valor) | |
| HP Spectre x360 15t-bl100 | |
| 1920x1080 High Graphics & Postprocessing (Nvidia HairWorks Off) (classificar por valor) | |
| HP Spectre x360 15t-bl100 | |
| 1920x1080 Ultra Graphics & Postprocessing (HBAO+) (classificar por valor) | |
| HP Spectre x360 15t-bl100 | |
| Lenovo Yoga 720-15IKB-80X7 | |
| baixo | média | alto | ultra | |
|---|---|---|---|---|
| BioShock Infinite (2013) | 201 | 112.9 | 94.3 | 34.8 |
| The Witcher 3 (2015) | 68.3 | 39.5 | 22.8 | 12.8 |
| Rise of the Tomb Raider (2016) | 72.3 | 40.8 | 23.1 | 17.6 |
Barulho
| Ocioso |
| 28.4 / 28.4 / 28.4 dB |
| Carga |
| 41.6 / 41.6 dB |
 | ||
30 dB silencioso 40 dB(A) audível 50 dB(A) ruidosamente alto |
||
min: | ||
| HP Spectre x360 15t-bl100 GeForce MX150, i5-8550U, Samsung PM961 NVMe MZVLW512HMJP | Dell Inspiron 15 5578-1777 2-in-1 HD Graphics 620, i5-7200U, SanDisk X400 256GB, SATA (SD8SB8U-256G) | Lenovo Yoga 720-15IKB-80X7 GeForce GTX 1050 Mobile, i7-7700HQ, Samsung PM961 MZVLW256HEHP | Lenovo Yoga 920-13IKB-80Y7 UHD Graphics 620, i5-8550U, Samsung PM961 MZVLW256HEHP | HP Spectre x360 15-bl002xx GeForce 940MX, i7-7500U, Toshiba XG4 NVMe (THNSN5512GPUK) | HP Pavilion x360 15-bk102ng HD Graphics 620, i5-7200U, WDC Slim WD10SPCX-21KHST0 | HP Spectre x360 13-ac033dx HD Graphics 620, i7-7500U, Samsung PM961 NVMe MZVLW512HMJP | |
|---|---|---|---|---|---|---|---|
| Noise | 1% | -0% | 5% | -6% | -3% | -5% | |
| desligado / ambiente * (dB) | 28.4 | 30.6 -8% | 28.2 1% | 28 1% | 28.5 -0% | 28.7 -1% | |
| Idle Minimum * (dB) | 28.4 | 30.4 -7% | 28.2 1% | 28 1% | 28.5 -0% | 31.7 -12% | 28.7 -1% |
| Idle Average * (dB) | 28.4 | 30.4 -7% | 28.2 1% | 28.8 -1% | 28.5 -0% | 31.7 -12% | 34.2 -20% |
| Idle Maximum * (dB) | 28.4 | 30.4 -7% | 28.2 1% | 30.3 -7% | 36.3 -28% | 31.7 -12% | 35.8 -26% |
| Load Average * (dB) | 41.6 | 32.3 22% | 39 6% | 34.5 17% | 42.7 -3% | 38.8 7% | 35.8 14% |
| Witcher 3 ultra * (dB) | 36.1 | ||||||
| Load Maximum * (dB) | 41.6 | 35.2 15% | 46.3 -11% | 34.3 18% | 42.7 -3% | 36.8 12% | 39.6 5% |
* ... menor é melhor
(-) A temperatura máxima no lado superior é 49.2 °C / 121 F, em comparação com a média de 36.8 °C / 98 F , variando de 21 a 71 °C para a classe Multimedia.
(-) A parte inferior aquece até um máximo de 52 °C / 126 F, em comparação com a média de 39.1 °C / 102 F
(+) Em uso inativo, a temperatura média para o lado superior é 23.2 °C / 74 F, em comparação com a média do dispositivo de 31.3 °C / ### class_avg_f### F.
(-) Jogando The Witcher 3, a temperatura média para o lado superior é 38.6 °C / 101 F, em comparação com a média do dispositivo de 31.3 °C / ## #class_avg_f### F.
(+) Os apoios para as mãos e o touchpad estão atingindo a temperatura máxima da pele (34.2 °C / 93.6 F) e, portanto, não estão quentes.
(-) A temperatura média da área do apoio para as mãos de dispositivos semelhantes foi 28.7 °C / 83.7 F (-5.5 °C / -9.9 F).
HP Spectre x360 15t-bl100 análise de áudio
(-) | alto-falantes não muito altos (###valor### dB)
Graves 100 - 315Hz
(±) | graves reduzidos - em média 14% menor que a mediana
(±) | a linearidade dos graves é média (14.7% delta para a frequência anterior)
Médios 400 - 2.000 Hz
(+) | médios equilibrados - apenas 3.7% longe da mediana
(+) | médios são lineares (4.5% delta para frequência anterior)
Altos 2 - 16 kHz
(+) | agudos equilibrados - apenas 2.8% longe da mediana
(±) | a linearidade dos máximos é média (7% delta para frequência anterior)
Geral 100 - 16.000 Hz
(±) | a linearidade do som geral é média (19.5% diferença em relação à mediana)
Comparado com a mesma classe
» 63% de todos os dispositivos testados nesta classe foram melhores, 7% semelhantes, 29% piores
» O melhor teve um delta de 5%, a média foi 17%, o pior foi 45%
Comparado com todos os dispositivos testados
» 49% de todos os dispositivos testados foram melhores, 7% semelhantes, 44% piores
» O melhor teve um delta de 4%, a média foi 23%, o pior foi 134%
Apple MacBook 12 (Early 2016) 1.1 GHz análise de áudio
(+) | os alto-falantes podem tocar relativamente alto (###valor### dB)
Graves 100 - 315Hz
(±) | graves reduzidos - em média 11.3% menor que a mediana
(±) | a linearidade dos graves é média (14.2% delta para a frequência anterior)
Médios 400 - 2.000 Hz
(+) | médios equilibrados - apenas 2.4% longe da mediana
(+) | médios são lineares (5.5% delta para frequência anterior)
Altos 2 - 16 kHz
(+) | agudos equilibrados - apenas 2% longe da mediana
(+) | os máximos são lineares (4.5% delta da frequência anterior)
Geral 100 - 16.000 Hz
(+) | o som geral é linear (10.2% diferença em relação à mediana)
Comparado com a mesma classe
» 7% de todos os dispositivos testados nesta classe foram melhores, 2% semelhantes, 90% piores
» O melhor teve um delta de 5%, a média foi 18%, o pior foi 53%
Comparado com todos os dispositivos testados
» 5% de todos os dispositivos testados foram melhores, 1% semelhantes, 94% piores
» O melhor teve um delta de 4%, a média foi 23%, o pior foi 134%
| desligado | |
| Ocioso | |
| Carga |
|
Key:
min: | |
| HP Spectre x360 15t-bl100 i5-8550U, GeForce MX150, Samsung PM961 NVMe MZVLW512HMJP, IPS, 3840x2160, 15.6" | Dell Inspiron 15 5578-1777 2-in-1 i5-7200U, HD Graphics 620, SanDisk X400 256GB, SATA (SD8SB8U-256G), IPS, 1920x1080, 15.6" | Lenovo Yoga 720-15IKB-80X7 i7-7700HQ, GeForce GTX 1050 Mobile, Samsung PM961 MZVLW256HEHP, IPS, 1920x1080, 15.6" | HP Spectre x360 15-bl002xx i7-7500U, GeForce 940MX, Toshiba XG4 NVMe (THNSN5512GPUK), IPS, 3840x2160, 15.6" | HP Pavilion x360 15-bk102ng i5-7200U, HD Graphics 620, WDC Slim WD10SPCX-21KHST0, IPS, 1920x1080, 15.6" | Lenovo Yoga 920-13IKB-80Y7 i5-8550U, UHD Graphics 620, Samsung PM961 MZVLW256HEHP, IPS, 1920x1080, 13.9" | |
|---|---|---|---|---|---|---|
| Power Consumption | 51% | -6% | 20% | 44% | 56% | |
| Idle Minimum * (Watt) | 11.6 | 4.3 63% | 8.3 28% | 8.14 30% | 5.9 49% | 3.1 73% |
| Idle Average * (Watt) | 13.8 | 7.6 45% | 10.2 26% | 10.91 21% | 9.2 33% | 6.6 52% |
| Idle Maximum * (Watt) | 14.2 | 9.8 31% | 10.4 27% | 12.26 14% | 9.3 35% | 7 51% |
| Load Average * (Watt) | 67.9 | 32.6 52% | 67.5 1% | 45.67 33% | 35.6 48% | 35.2 48% |
| Witcher 3 ultra * (Watt) | 59 | 96.5 -64% | ||||
| Load Maximum * (Watt) | 76.9 | 28.4 63% | 117.2 -52% | 74.94 3% | 32.9 57% | 34.6 55% |
* ... menor é melhor
| HP Spectre x360 15t-bl100 i5-8550U, GeForce MX150, 79.2 Wh | Dell Inspiron 15 5578-1777 2-in-1 i5-7200U, HD Graphics 620, 42 Wh | Lenovo Yoga 720-15IKB-80X7 i7-7700HQ, GeForce GTX 1050 Mobile, 72 Wh | Lenovo Yoga 920-13IKB-80Y7 i5-8550U, UHD Graphics 620, 70 Wh | HP Spectre x360 15-bl002xx i7-7500U, GeForce 940MX, 79.2 Wh | HP Pavilion x360 15-bk102ng i5-7200U, HD Graphics 620, 48 Wh | |
|---|---|---|---|---|---|---|
| Duração da bateria | -22% | -7% | 37% | 2% | -32% | |
| Reader / Idle (h) | 15.6 | 17.8 14% | 27.6 77% | 14.4 -8% | ||
| WiFi v1.3 (h) | 8.5 | 6.6 -22% | 8.1 -5% | 11.4 34% | 8.9 5% | 5.8 -32% |
| Load (h) | 2.3 | 1.6 -30% | 2.3 0% | 2.5 9% |
Pro
Contra

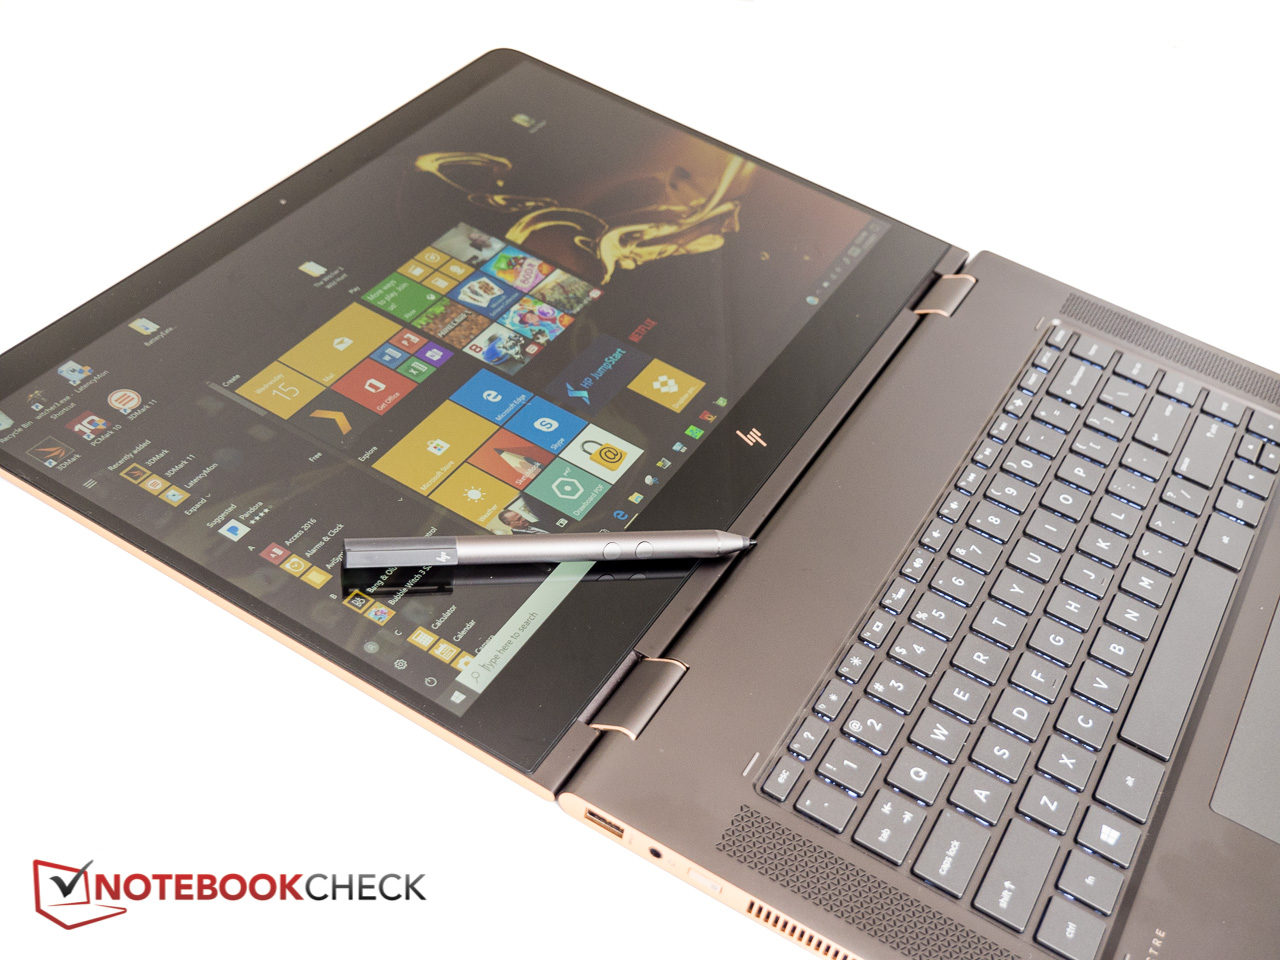
O Spectre x360 15 de 15,6 polegadas é um ótimo 2-em-1 com suficiente poder de processamento para lidar inclusive com aplicativos exigentes. A HP deixou o chassi intacto, mas atualizou o hardware com uma CPU Kaby Lake-R mais poderosa e gráficos GeForce de nível de entrada. As grandes novidades são, é claro, as melhorias no desempenho da CPU e GPU e aqui o novo Spectre supera o predecessor por uma boa margem - pelo menos quando o aplicativo pode tomar vantagem dos dois núcleos adicionais. Como tal, o conversível com sua vívida tela 4K, 16 GB de RAM e um SSD NVMe de 512 GB ainda mais veloz, possa ser muito atraente para os usuários que procuram uma máquina produtiva que também possa lidar com jogos leves.
As durações da bateria sofreram um pouco, mas com um uso moderado, o Spectre ainda duraria todo um dia de trabalho. De outra maneira, os pros e os contras da nossa anterior análise ainda se aplicam: As dobradiças não são muito rígidas para segurar a tela com segurança em todas as posições, o painel 4K pode ser demais para alguns usuários, especialmente em vista dos ocasionais problemas de dimensionamento, e um conversível de 15,6 polegadas é bastante grande e pesado, o que pode limitar sua utilidade no modo tablet.
Depois da atualização somente de hardware, o HP Spectre x360 15t continua sendo um 2-em-1 sólido com bom desempenho e uma das melhores opções ao considerar um conversível grande.
Os usuários que não precisem de uma GPU dedicada e que preferem uma duração de bateria mais longa, também deveriam dar uma olhada no Lenovo Yoga 920 um pouco menor
.
HP Spectre x360 15t-bl100
- 11/16/2017 v6 (old)
Bernie Pechlaner
Price comparison
