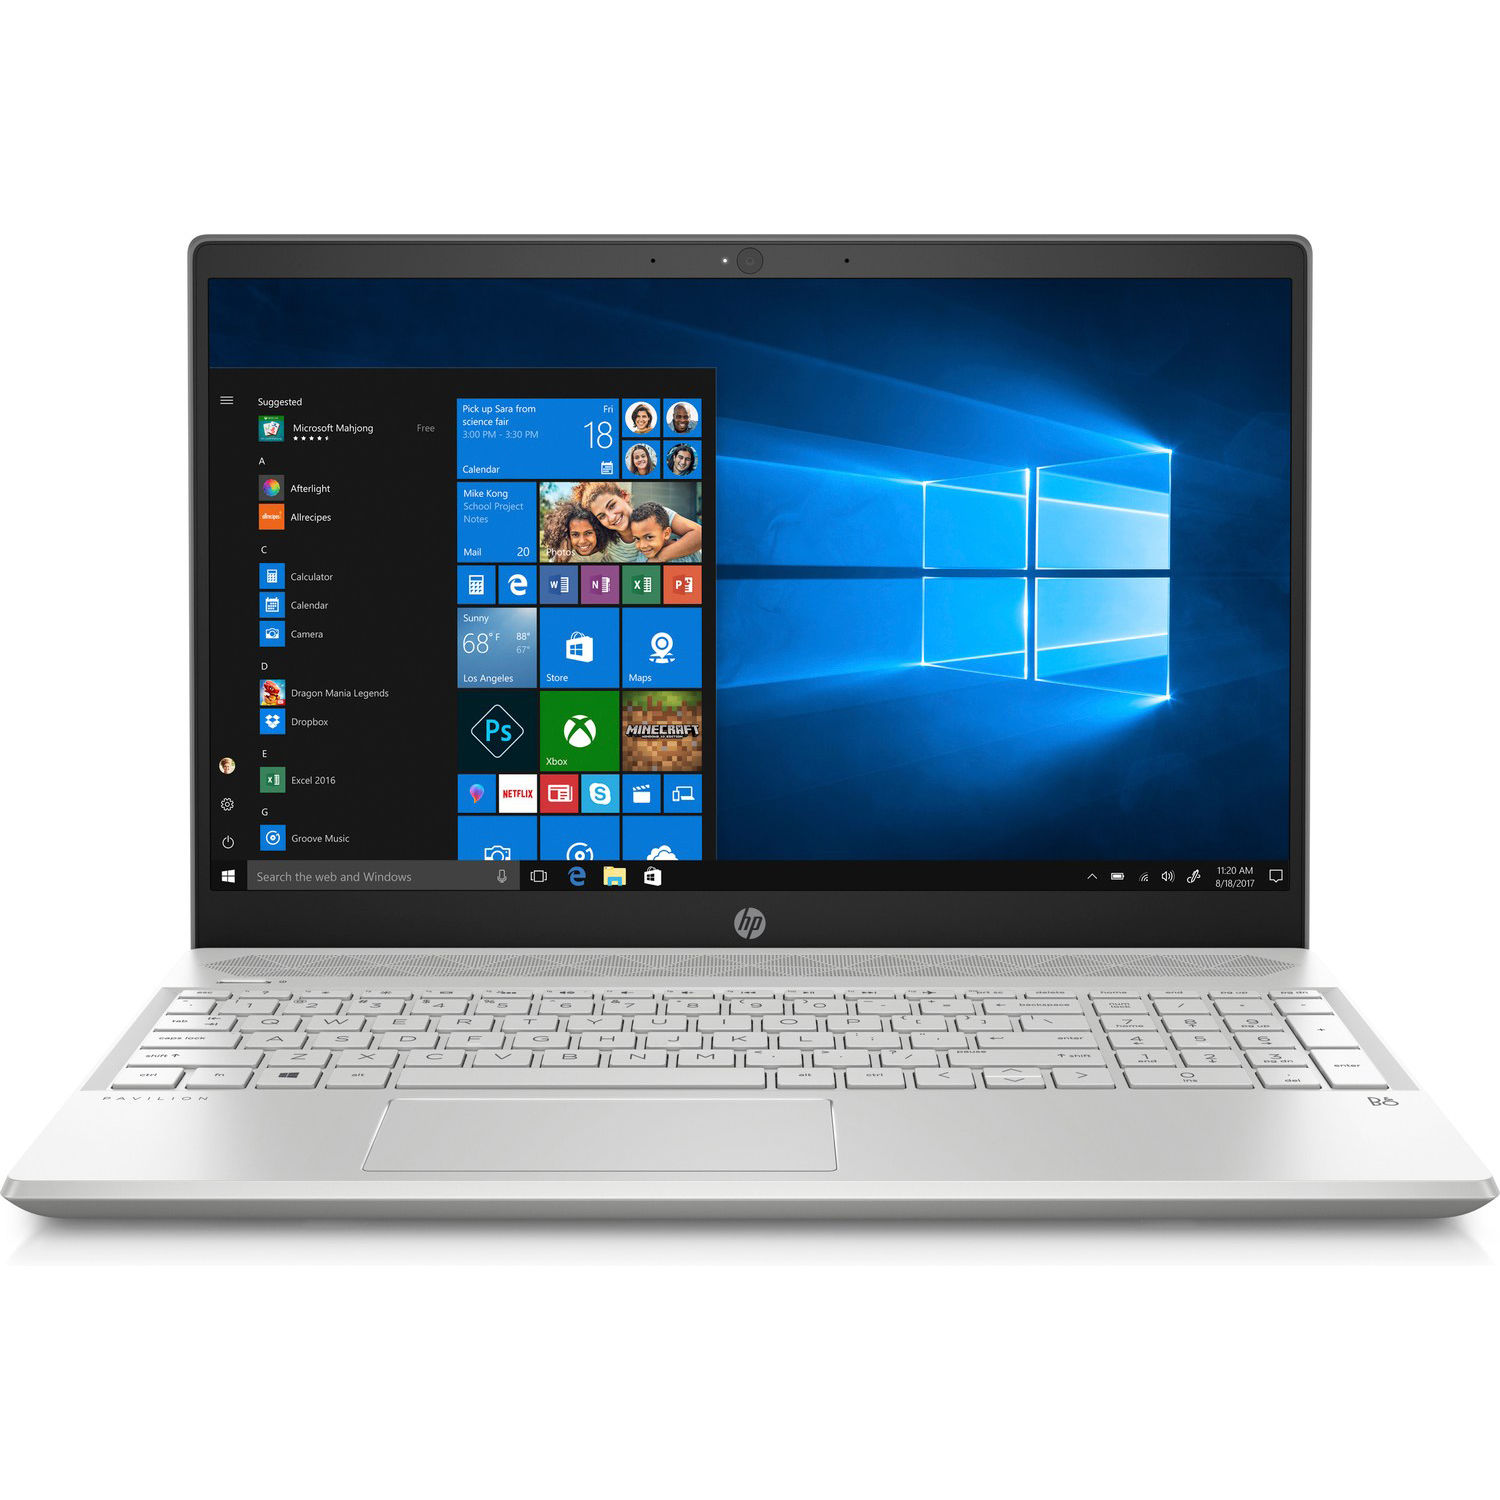
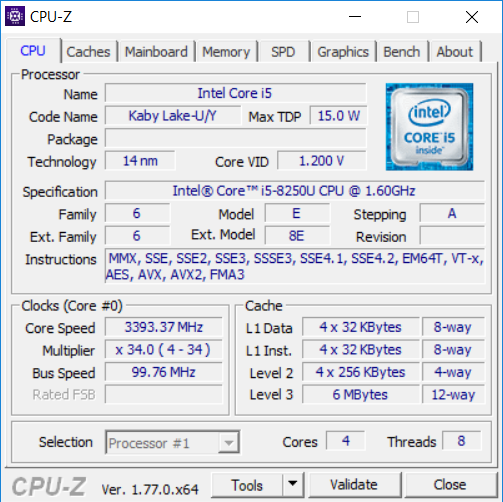
Breve Análise do Portátil HP Pavilion 15 (Core i5-8250U, NVIDIA MX130)

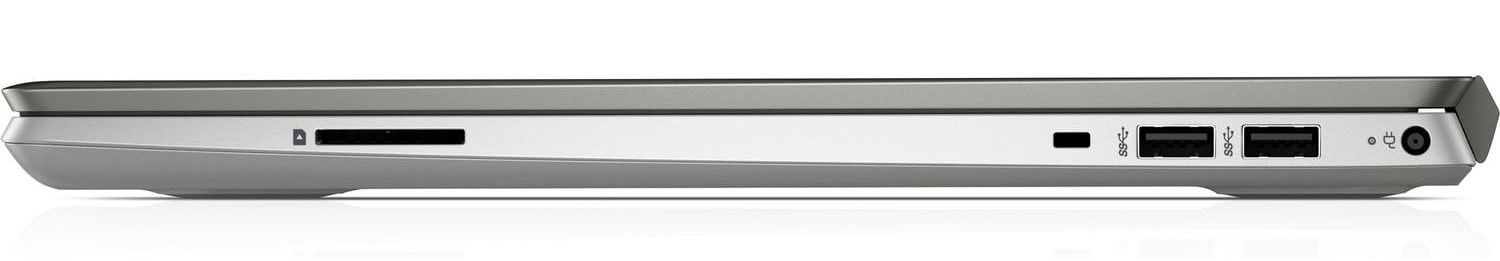
| SD Card Reader | |
| average JPG Copy Test (av. of 3 runs) | |
| Média da turma Multimedia (23 - 531, n=37, últimos 2 anos) | |
| HP Pavilion 15-cw0003ng (Toshiba Exceria Pro SDXC 64 GB UHS-II) | |
| HP Pavilion 15-cs0053cl (Toshiba Exceria Pro SDXC 64 GB UHS-II) | |
| Asus VivoBook 15 X542UF-DM143T (Toshiba Exceria Pro SDXC 64 GB UHS-II) | |
| HP Pavilion 15-cs0003ng (Toshiba Exceria Pro SDXC 64 GB UHS-II) | |
| Acer TravelMate P2510-G2-MG-50WE (Toshiba Exceria Pro SDXC 64 GB UHS-II) | |
| Lenovo IdeaPad 330S-15IKB-81F500N5GE (Toshiba Exceria Pro SDXC 64 GB UHS-II) | |
| Xiaomi Mi Notebook 15.6 (E58514D1D) (Toshiba Exceria Pro SDXC 64 GB UHS-II) | |
| maximum AS SSD Seq Read Test (1GB) | |
| Média da turma Multimedia (37.3 - 1455, n=36, últimos 2 anos) | |
| HP Pavilion 15-cs0053cl (Toshiba Exceria Pro SDXC 64 GB UHS-II) | |
| HP Pavilion 15-cw0003ng (Toshiba Exceria Pro SDXC 64 GB UHS-II) | |
| HP Pavilion 15-cs0003ng (Toshiba Exceria Pro SDXC 64 GB UHS-II) | |
| Asus VivoBook 15 X542UF-DM143T (Toshiba Exceria Pro SDXC 64 GB UHS-II) | |
| Xiaomi Mi Notebook 15.6 (E58514D1D) (Toshiba Exceria Pro SDXC 64 GB UHS-II) | |
| Acer TravelMate P2510-G2-MG-50WE (Toshiba Exceria Pro SDXC 64 GB UHS-II) | |
| Networking | |
| iperf3 transmit AX12 | |
| Acer TravelMate P2510-G2-MG-50WE | |
| Xiaomi Mi Notebook 15.6 (E58514D1D) | |
| Asus VivoBook 15 X542UF-DM143T | |
| Lenovo IdeaPad 330S-15IKB-81F500N5GE | |
| HP Pavilion 15-cs0003ng | |
| HP Pavilion 15-cs0053cl | |
| HP Pavilion 15-cw0003ng | |
| iperf3 receive AX12 | |
| Acer TravelMate P2510-G2-MG-50WE | |
| Asus VivoBook 15 X542UF-DM143T | |
| Lenovo IdeaPad 330S-15IKB-81F500N5GE | |
| HP Pavilion 15-cw0003ng | |
| Xiaomi Mi Notebook 15.6 (E58514D1D) | |
| HP Pavilion 15-cs0003ng | |
| HP Pavilion 15-cs0053cl | |
| |||||||||||||||||||||||||
iluminação: 90 %
iluminação com acumulador: 209 cd/m²
Contraste: 571:1 (Preto: 0.42 cd/m²)
ΔE ColorChecker Calman: 7.43 | ∀{0.5-29.43 Ø4.71}
ΔE Greyscale Calman: 6.26 | ∀{0.09-98 Ø4.96}
54% sRGB (Argyll 1.6.3 3D)
35% AdobeRGB 1998 (Argyll 1.6.3 3D)
37.47% AdobeRGB 1998 (Argyll 3D)
54.6% sRGB (Argyll 3D)
36.27% Display P3 (Argyll 3D)
Gamma: 2.96
CCT: 6661 K
| HP Pavilion 15-cs0003ng 1920x1080, 15.6" | Xiaomi Mi Notebook 15.6 (E58514D1D) BOE07C5 (NV156FHM-N42), , 1920x1080, 15.6" | Lenovo IdeaPad 330S-15IKB-81F500N5GE BOE0700, , 1920x1080, 15.6" | Acer TravelMate P2510-G2-MG-50WE Chi Mei CMN15D3, , 1920x1080, 15.6" | Asus VivoBook 15 X542UF-DM143T BOE CQ NT156FHM-N41, , 1920x1080, 15.6" | |
|---|---|---|---|---|---|
| Display | 10% | 9% | 17% | 3% | |
| Display P3 Coverage (%) | 36.27 | 40.21 11% | 39.85 10% | 42.27 17% | 37.47 3% |
| sRGB Coverage (%) | 54.6 | 59.6 9% | 58.8 8% | 63.5 16% | 56.4 3% |
| AdobeRGB 1998 Coverage (%) | 37.47 | 41.54 11% | 41.17 10% | 43.69 17% | 38.71 3% |
| Response Times | -12% | -5% | -2% | 21% | |
| Response Time Grey 50% / Grey 80% * (ms) | 45 ? | 46 ? -2% | 44 ? 2% | 40 ? 11% | 41 ? 9% |
| Response Time Black / White * (ms) | 28 ? | 34 ? -21% | 31 ? -11% | 32 ? -14% | 19 ? 32% |
| PWM Frequency (Hz) | 60 ? | 86000 ? | 25000 ? | 7000 ? | |
| Screen | 35% | 11% | 39% | 14% | |
| Brightness middle (cd/m²) | 240 | 280 17% | 283 18% | 259 8% | 230 -4% |
| Brightness (cd/m²) | 237 | 267 13% | 252 6% | 230 -3% | 221 -7% |
| Brightness Distribution (%) | 90 | 85 -6% | 75 -17% | 82 -9% | 91 1% |
| Black Level * (cd/m²) | 0.42 | 0.2 52% | 0.63 -50% | 0.19 55% | 0.45 -7% |
| Contrast (:1) | 571 | 1400 145% | 449 -21% | 1363 139% | 511 -11% |
| Colorchecker dE 2000 * | 7.43 | 5 33% | 4.02 46% | 3.13 58% | 3.6 52% |
| Colorchecker dE 2000 max. * | 12.42 | 7.9 36% | 8.77 29% | 7.81 37% | 5.59 55% |
| Greyscale dE 2000 * | 6.26 | 3.7 41% | 0.8 87% | 1.42 77% | 3.13 50% |
| Gamma | 2.96 74% | 2.08 106% | 2.35 94% | 2.36 93% | 2.45 90% |
| CCT | 6661 98% | 7309 89% | 6552 99% | 6391 102% | 7244 90% |
| Color Space (Percent of AdobeRGB 1998) (%) | 35 | 38.09 9% | 38 9% | 40 14% | 36 3% |
| Color Space (Percent of sRGB) (%) | 54 | 59.26 10% | 58 7% | 63 17% | 56 4% |
| Colorchecker dE 2000 calibrated * | 3.6 | 4.03 | 3.09 | ||
| Média Total (Programa/Configurações) | 11% /
24% | 5% /
9% | 18% /
29% | 13% /
12% |
* ... menor é melhor
Exibir tempos de resposta
| ↔ Tempo de resposta preto para branco | ||
|---|---|---|
| 28 ms ... ascensão ↗ e queda ↘ combinadas | ↗ 16 ms ascensão | 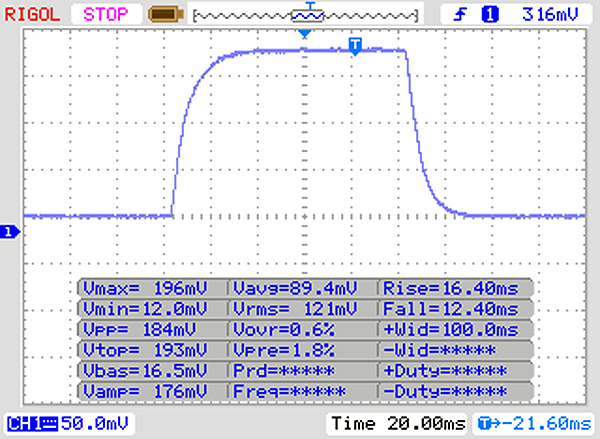 |
| ↘ 12 ms queda | ||
| A tela mostra taxas de resposta relativamente lentas em nossos testes e pode ser muito lenta para os jogadores. Em comparação, todos os dispositivos testados variam de 0.1 (mínimo) a 240 (máximo) ms. » 71 % de todos os dispositivos são melhores. Isso significa que o tempo de resposta medido é pior que a média de todos os dispositivos testados (19.8 ms). | ||
| ↔ Tempo de resposta 50% cinza a 80% cinza | ||
| 45 ms ... ascensão ↗ e queda ↘ combinadas | ↗ 21 ms ascensão | 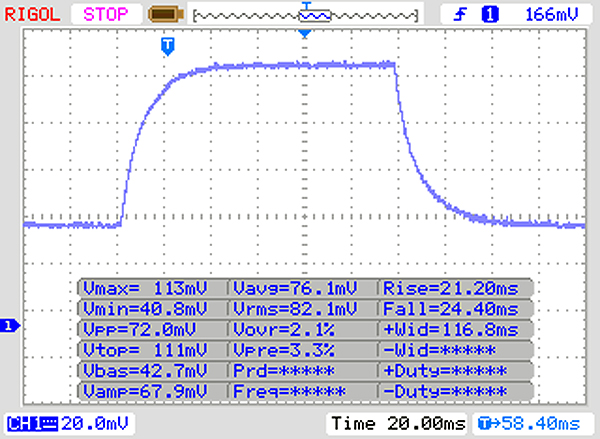 |
| ↘ 24 ms queda | ||
| A tela mostra taxas de resposta lentas em nossos testes e será insatisfatória para os jogadores. Em comparação, todos os dispositivos testados variam de 0.165 (mínimo) a 636 (máximo) ms. » 77 % de todos os dispositivos são melhores. Isso significa que o tempo de resposta medido é pior que a média de todos os dispositivos testados (31 ms). | ||
Cintilação da tela / PWM (modulação por largura de pulso)
| Tela tremeluzindo / PWM não detectado | 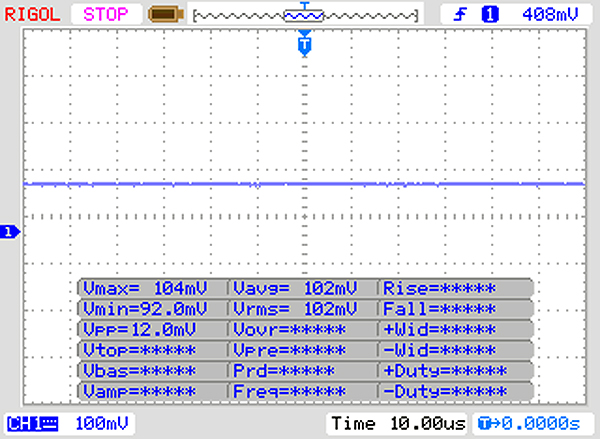 | ||
[pwm_comparison] Em comparação: 52 % de todos os dispositivos testados não usam PWM para escurecer a tela. Se PWM foi detectado, uma média de 7754 (mínimo: 5 - máximo: 343500) Hz foi medida. | |||
| PCMark 8 | |
| Home Score Accelerated v2 | |
| Média da turma Multimedia (n=1últimos 2 anos) | |
| Asus VivoBook 15 X542UF-DM143T | |
| HP Pavilion 15-cs0053cl | |
| HP Pavilion 15-cs0003ng | |
| Lenovo IdeaPad 330S-15IKB-81F500N5GE | |
| Média Intel Core i5-8250U, NVIDIA GeForce MX130 (3207 - 3903, n=5) | |
| Acer TravelMate P2510-G2-MG-50WE | |
| HP Pavilion 15-cw0003ng | |
| Xiaomi Mi Notebook 15.6 (E58514D1D) | |
| Work Score Accelerated v2 | |
| Lenovo IdeaPad 330S-15IKB-81F500N5GE | |
| Asus VivoBook 15 X542UF-DM143T | |
| Média Intel Core i5-8250U, NVIDIA GeForce MX130 (4762 - 4779, n=4) | |
| Acer TravelMate P2510-G2-MG-50WE | |
| HP Pavilion 15-cs0003ng | |
| HP Pavilion 15-cs0053cl | |
| Xiaomi Mi Notebook 15.6 (E58514D1D) | |
| HP Pavilion 15-cw0003ng | |
| PCMark 8 Home Score Accelerated v2 | 3647 pontos | |
| PCMark 8 Work Score Accelerated v2 | 4762 pontos | |
| PCMark 10 Score | 3402 pontos | |
Ajuda | ||
| HP Pavilion 15-cs0003ng SK Hynix SC313 HFS256G39TNF | Xiaomi Mi Notebook 15.6 (E58514D1D) Samsung PM871b MZNLN128HAHQ | Lenovo IdeaPad 330S-15IKB-81F500N5GE | Acer TravelMate P2510-G2-MG-50WE SK Hynix HFS256G39TND-N210A | Asus VivoBook 15 X542UF-DM143T Micron 1100 MTFDDAV256TBN | Média SK Hynix SC313 HFS256G39TNF | |
|---|---|---|---|---|---|---|
| CrystalDiskMark 5.2 / 6 | -2% | 3% | -13% | 3% | -0% | |
| Write 4K (MB/s) | 66.9 | 77.3 16% | 71.8 7% | 94.9 42% | 71.3 ? 7% | |
| Read 4K (MB/s) | 30.33 | 29.77 -2% | 21.23 -30% | 27.3 -10% | 25.3 ? -17% | |
| Write Seq (MB/s) | 447.6 | 442.5 -1% | 158.1 -65% | 257.1 -43% | 410.4 -8% | 473 ? 6% |
| Read Seq (MB/s) | 534 | 442.7 -17% | 892 67% | 476.3 -11% | 464 -13% | 517 ? -3% |
| Write 4K Q32T1 (MB/s) | 197.5 | 173.8 -12% | 162.2 -18% | 202.6 3% | 246.5 25% | 209 ? 6% |
| Read 4K Q32T1 (MB/s) | 234.5 | 233.6 0% | 320.4 37% | 282 20% | 246.4 5% | 234 ? 0% |
| Write Seq Q32T1 (MB/s) | 495.6 | 510 3% | 160.2 -68% | 265.6 -46% | 451.4 -9% | 494 ? 0% |
| Read Seq Q32T1 (MB/s) | 559 | 530 -5% | 933 67% | 559 0% | 532 -5% | 552 ? -1% |
| AS SSD | -2% | -193% | -30% | -2% | -3% | |
| Seq Read (MB/s) | 522 | 489 -6% | 95.9 -82% | 487.3 -7% | 493.7 -5% | 499 ? -4% |
| Seq Write (MB/s) | 476.1 | 458 -4% | 78.9 -83% | 250.6 -47% | 420.1 -12% | 474 ? 0% |
| 4K Read (MB/s) | 30.14 | 30.24 0% | 2.25 -93% | 27.61 -8% | 25.01 -17% | 28.6 ? -5% |
| 4K Write (MB/s) | 64.3 | 81.6 27% | 54.9 -15% | 72.1 12% | 78.2 22% | 60.7 ? -6% |
| 4K-64 Read (MB/s) | 319.2 | 271.8 -15% | 43.28 -86% | 375.9 18% | 236.4 -26% | 298 ? -7% |
| 4K-64 Write (MB/s) | 239.8 | 163 -32% | 116.6 -51% | 202.1 -16% | 277.8 16% | 233 ? -3% |
| Access Time Read * (ms) | 0.131 | 0.092 30% | 2.127 -1524% | 0.08 39% | 0.104 21% | 0.1193 ? 9% |
| Access Time Write * (ms) | 0.056 | 0.044 21% | 0.045 20% | 0.233 -316% | 0.058 -4% | 0.06033 ? -8% |
| Score Read (Points) | 402 | 351 -13% | 55 -86% | 452 12% | 311 -23% | 376 ? -6% |
| Score Write (Points) | 352 | 290 -18% | 179 -49% | 299 -15% | 398 13% | 341 ? -3% |
| Score Total (Points) | 967 | 830 -14% | 262 -73% | 980 1% | 873 -10% | 918 ? -5% |
| Copy ISO MB/s (MB/s) | 253 | 287.4 | 514 ? | |||
| Copy Program MB/s (MB/s) | 108.8 | 155.4 | 259 ? | |||
| Copy Game MB/s (MB/s) | 154.4 | 245.8 | 521 ? | |||
| Média Total (Programa/Configurações) | -2% /
-2% | -95% /
-124% | -22% /
-22% | 1% /
0% | -2% /
-2% |
* ... menor é melhor

| 3DMark 11 - 1280x720 Performance GPU | |
| Média da turma Multimedia (3749 - 60002, n=55, últimos 2 anos) | |
| HP Pavilion 15-cs0003ng | |
| Média NVIDIA GeForce MX130 (2476 - 3203, n=14) | |
| Acer TravelMate P2510-G2-MG-50WE | |
| Asus VivoBook 15 X542UF-DM143T | |
| HP Pavilion 15-cw0003ng | |
| Xiaomi Mi Notebook 15.6 (E58514D1D) | |
| Lenovo IdeaPad 330S-15IKB-81F500N5GE | |
| HP Pavilion 15-cs0053cl | |
| 3DMark | |
| 1280x720 Cloud Gate Standard Graphics | |
| Média da turma Multimedia (16765 - 143501, n=32, últimos 2 anos) | |
| Média NVIDIA GeForce MX130 (12166 - 14880, n=13) | |
| HP Pavilion 15-cs0003ng | |
| Acer TravelMate P2510-G2-MG-50WE | |
| Asus VivoBook 15 X542UF-DM143T | |
| Xiaomi Mi Notebook 15.6 (E58514D1D) | |
| HP Pavilion 15-cw0003ng | |
| Lenovo IdeaPad 330S-15IKB-81F500N5GE | |
| HP Pavilion 15-cs0053cl | |
| 1920x1080 Fire Strike Graphics | |
| Média da turma Multimedia (2328 - 48907, n=58, últimos 2 anos) | |
| Média NVIDIA GeForce MX130 (2149 - 2495, n=13) | |
| HP Pavilion 15-cs0003ng | |
| Acer TravelMate P2510-G2-MG-50WE | |
| Asus VivoBook 15 X542UF-DM143T | |
| Xiaomi Mi Notebook 15.6 (E58514D1D) | |
| HP Pavilion 15-cw0003ng | |
| Lenovo IdeaPad 330S-15IKB-81F500N5GE | |
| 2560x1440 Time Spy Graphics | |
| Média da turma Multimedia (696 - 19403, n=59, últimos 2 anos) | |
| Média NVIDIA GeForce MX130 (623 - 686, n=4) | |
| Asus VivoBook 15 X542UF-DM143T | |
| 3DMark 11 Performance | 3194 pontos | |
| 3DMark Cloud Gate Standard Score | 11187 pontos | |
| 3DMark Fire Strike Score | 2212 pontos | |
Ajuda | ||
| BioShock Infinite | |
| 1366x768 Medium Preset | |
| HP Pavilion 15-cs0003ng | |
| Média NVIDIA GeForce MX130 (57.3 - 84.5, n=10) | |
| Asus VivoBook 15 X542UF-DM143T | |
| Lenovo IdeaPad 330S-15IKB-81F500N5GE | |
| HP Pavilion 15-cs0053cl | |
| 1366x768 High Preset | |
| HP Pavilion 15-cs0003ng | |
| Média NVIDIA GeForce MX130 (48 - 69, n=10) | |
| Asus VivoBook 15 X542UF-DM143T | |
| Lenovo IdeaPad 330S-15IKB-81F500N5GE | |
| HP Pavilion 15-cs0053cl | |
| Thief | |
| 1366x768 High Preset AA:FXAA & Low SS AF:4x | |
| HP Pavilion 15-cs0003ng | |
| Média NVIDIA GeForce MX130 (n=1) | |
| Lenovo IdeaPad 330S-15IKB-81F500N5GE | |
| 1366x768 Normal Preset AA:FX | |
| HP Pavilion 15-cs0003ng | |
| Média NVIDIA GeForce MX130 (n=1) | |
| Lenovo IdeaPad 330S-15IKB-81F500N5GE | |
| F1 2018 | |
| 1920x1080 High Preset AA:T AF:8x | |
| HP Pavilion 15-cs0003ng | |
| Média NVIDIA GeForce MX130 (n=1) | |
| HP Pavilion 15-cw0003ng | |
| 1920x1080 Medium Preset AF:4x | |
| HP Pavilion 15-cs0003ng | |
| Média NVIDIA GeForce MX130 (n=1) | |
| HP Pavilion 15-cw0003ng | |
| baixo | média | alto | ultra | |
|---|---|---|---|---|
| BioShock Infinite (2013) | 135 | 75.3 | 64.8 | 23.7 |
| Thief (2014) | 58.1 | 37.1 | 32.2 | 15.5 |
| F1 2018 (2018) | 48 | 26 | 20 |
Barulho
| Ocioso |
| 30.6 / 30.6 / 32.1 dB |
| HDD |
| 32 dB |
| Carga |
| 43.2 / 43.4 dB |
 | ||
30 dB silencioso 40 dB(A) audível 50 dB(A) ruidosamente alto |
||
min: | ||
(-) A temperatura máxima no lado superior é 48 °C / 118 F, em comparação com a média de 36.8 °C / 98 F , variando de 21 a 71 °C para a classe Multimedia.
(-) A parte inferior aquece até um máximo de 49 °C / 120 F, em comparação com a média de 39.1 °C / 102 F
(+) Em uso inativo, a temperatura média para o lado superior é 23.7 °C / 75 F, em comparação com a média do dispositivo de 31.3 °C / ### class_avg_f### F.
(+) Os apoios para as mãos e o touchpad são mais frios que a temperatura da pele, com um máximo de 28.2 °C / 82.8 F e, portanto, são frios ao toque.
(±) A temperatura média da área do apoio para as mãos de dispositivos semelhantes foi 28.7 °C / 83.7 F (+0.5 °C / 0.9 F).
HP Pavilion 15-cs0003ng análise de áudio
(-) | alto-falantes não muito altos (###valor### dB)
Graves 100 - 315Hz
(-) | quase nenhum baixo - em média 29.8% menor que a mediana
(±) | a linearidade dos graves é média (11.5% delta para a frequência anterior)
Médios 400 - 2.000 Hz
(+) | médios equilibrados - apenas 1.4% longe da mediana
(±) | a linearidade dos médios é média (7.1% delta para frequência anterior)
Altos 2 - 16 kHz
(+) | agudos equilibrados - apenas 2.3% longe da mediana
(+) | os máximos são lineares (4.2% delta da frequência anterior)
Geral 100 - 16.000 Hz
(±) | a linearidade do som geral é média (20.8% diferença em relação à mediana)
Comparado com a mesma classe
» 71% de todos os dispositivos testados nesta classe foram melhores, 7% semelhantes, 22% piores
» O melhor teve um delta de 5%, a média foi 17%, o pior foi 45%
Comparado com todos os dispositivos testados
» 56% de todos os dispositivos testados foram melhores, 8% semelhantes, 36% piores
» O melhor teve um delta de 4%, a média foi 23%, o pior foi 134%
Apple MacBook 12 (Early 2016) 1.1 GHz análise de áudio
(+) | os alto-falantes podem tocar relativamente alto (###valor### dB)
Graves 100 - 315Hz
(±) | graves reduzidos - em média 11.3% menor que a mediana
(±) | a linearidade dos graves é média (14.2% delta para a frequência anterior)
Médios 400 - 2.000 Hz
(+) | médios equilibrados - apenas 2.4% longe da mediana
(+) | médios são lineares (5.5% delta para frequência anterior)
Altos 2 - 16 kHz
(+) | agudos equilibrados - apenas 2% longe da mediana
(+) | os máximos são lineares (4.5% delta da frequência anterior)
Geral 100 - 16.000 Hz
(+) | o som geral é linear (10.2% diferença em relação à mediana)
Comparado com a mesma classe
» 7% de todos os dispositivos testados nesta classe foram melhores, 2% semelhantes, 90% piores
» O melhor teve um delta de 5%, a média foi 18%, o pior foi 53%
Comparado com todos os dispositivos testados
» 5% de todos os dispositivos testados foram melhores, 1% semelhantes, 94% piores
» O melhor teve um delta de 4%, a média foi 23%, o pior foi 134%
| desligado | |
| Ocioso | |
| Carga |
|
Key:
min: | |
| HP Pavilion 15-cs0003ng i5-8250U, GeForce MX130, SK Hynix SC313 HFS256G39TNF, IPS, 1920x1080, 15.6" | HP Pavilion 15-cw0003ng R5 2500U, Vega 8, Intel SSD 600p SSDPEKKW512G7, IPS, 1920x1080, 15.6" | Xiaomi Mi Notebook 15.6 (E58514D1D) i5-8250U, GeForce MX110, Samsung PM871b MZNLN128HAHQ, LED, 1920x1080, 15.6" | Lenovo IdeaPad 330S-15IKB-81F500N5GE i5-8250U, UHD Graphics 620, , IPS, 1920x1080, 15.6" | Acer TravelMate P2510-G2-MG-50WE i5-8250U, GeForce MX130, SK Hynix HFS256G39TND-N210A, IPS, 1920x1080, 15.6" | Asus VivoBook 15 X542UF-DM143T i5-8250U, GeForce MX130, Micron 1100 MTFDDAV256TBN, TN LED, 1920x1080, 15.6" | HP Pavilion 15-cs0053cl i5-8250U, UHD Graphics 620, Toshiba MQ04ABF100, TN LED, 1366x768, 15.6" | Média NVIDIA GeForce MX130 | Média da turma Multimedia | |
|---|---|---|---|---|---|---|---|---|---|
| Power Consumption | 1% | -15% | 4% | 5% | -7% | 3% | -11% | -55% | |
| Idle Minimum * (Watt) | 3.3 | 4.5 -36% | 5.6 -70% | 5 -52% | 3.3 -0% | 4.75 -44% | 5.6 -70% | 4.54 ? -38% | 5.66 ? -72% |
| Idle Average * (Watt) | 6.1 | 7.3 -20% | 8.6 -41% | 7.6 -25% | 5.6 8% | 6.9 -13% | 7.1 -16% | 6.98 ? -14% | 10.2 ? -67% |
| Idle Maximum * (Watt) | 8.3 | 9.4 -13% | 8.7 -5% | 8.6 -4% | 7.8 6% | 7 16% | 7.9 5% | 9.08 ? -9% | 12.5 ? -51% |
| Load Average * (Watt) | 56 | 34 39% | 39.9 29% | 25.6 54% | 54 4% | 53 5% | 32.8 41% | 54.1 ? 3% | 65.2 ? -16% |
| Load Maximum * (Watt) | 67 | 41.9 37% | 59.9 11% | 34 49% | 63 6% | 65.3 3% | 30.5 54% | 66.4 ? 1% | 113.5 ? -69% |
| Witcher 3 ultra * (Watt) | 33.2 |
* ... menor é melhor
| HP Pavilion 15-cs0003ng i5-8250U, GeForce MX130, 41 Wh | HP Pavilion 15-cw0003ng R5 2500U, Vega 8, 41 Wh | Xiaomi Mi Notebook 15.6 (E58514D1D) i5-8250U, GeForce MX110, 40 Wh | Lenovo IdeaPad 330S-15IKB-81F500N5GE i5-8250U, UHD Graphics 620, 52 Wh | Acer TravelMate P2510-G2-MG-50WE i5-8250U, GeForce MX130, 48 Wh | Asus VivoBook 15 X542UF-DM143T i5-8250U, GeForce MX130, 38 Wh | HP Pavilion 15-cs0053cl i5-8250U, UHD Graphics 620, 41 Wh | Média da turma Multimedia | |
|---|---|---|---|---|---|---|---|---|
| Duração da bateria | 4% | 23% | 24% | 40% | 45% | 35% | 116% | |
| Reader / Idle (h) | 8.2 | 8.4 2% | 10.2 24% | 12.6 54% | 12 46% | 24.9 ? 204% | ||
| WiFi v1.3 (h) | 4.7 | 5 6% | 5.7 21% | 5.8 23% | 8.4 79% | 6.8 45% | 7 49% | 12.2 ? 160% |
| Load (h) | 2 | 2.1 5% | 1.9 -5% | 2 0% | 2.2 10% | 1.664 ? -17% |
Pro
Contra
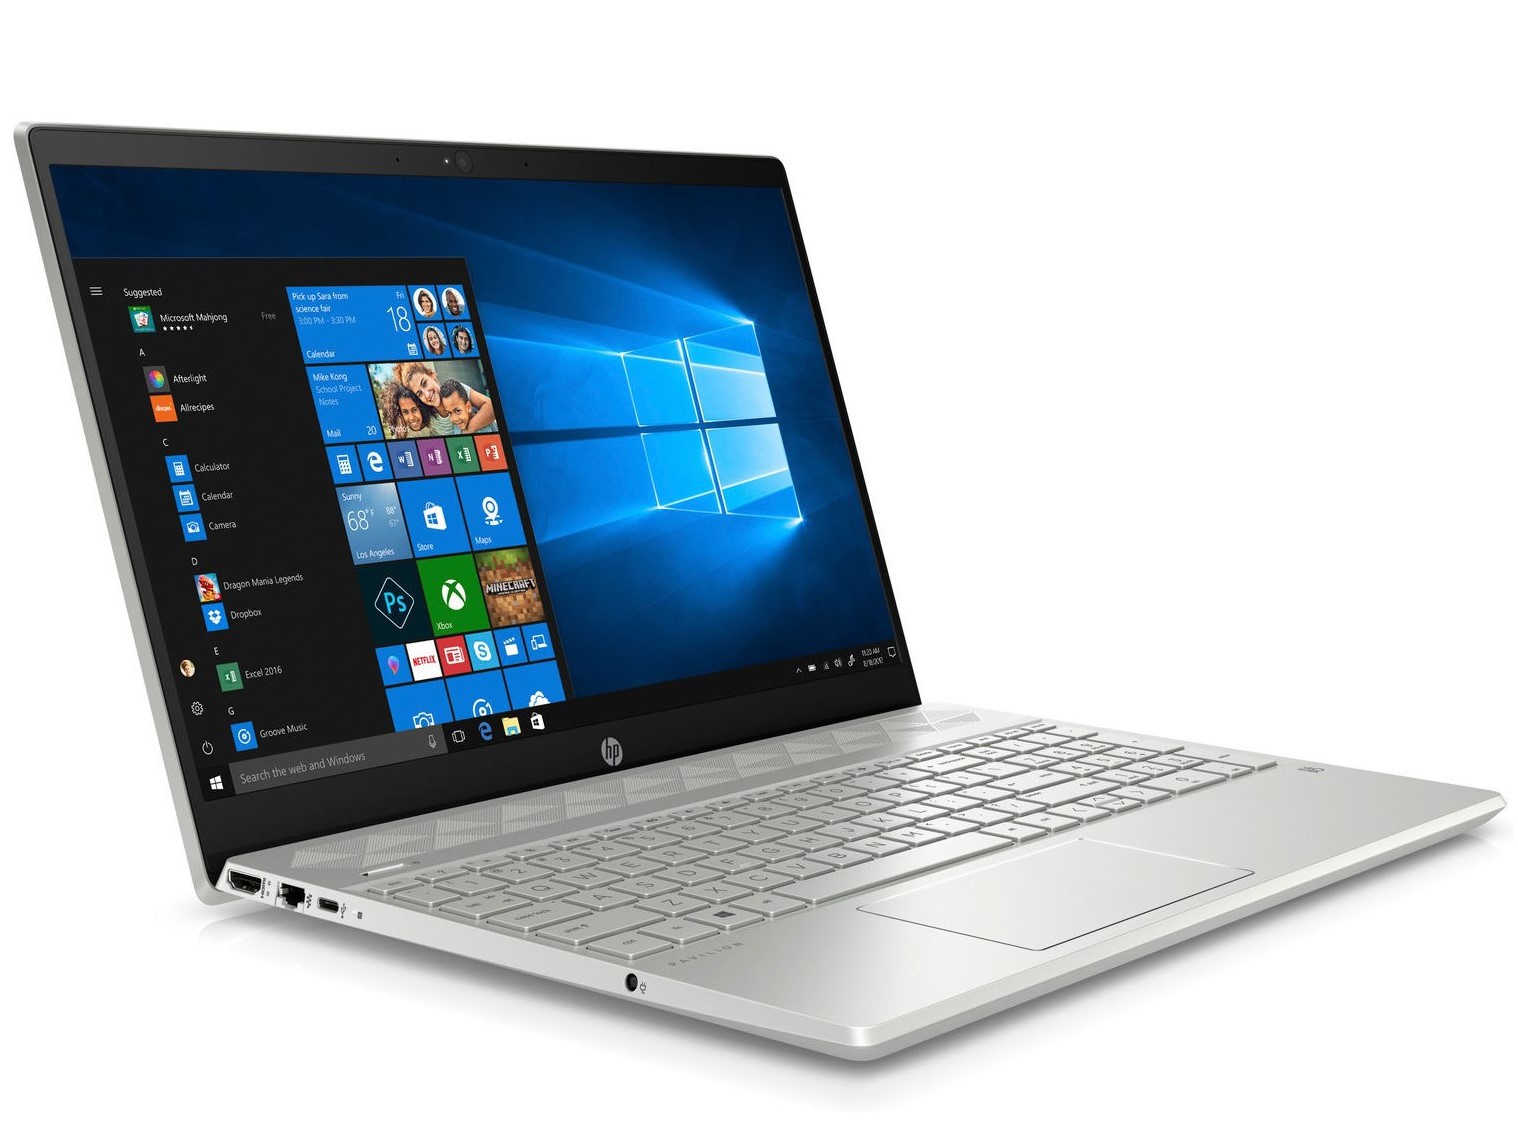
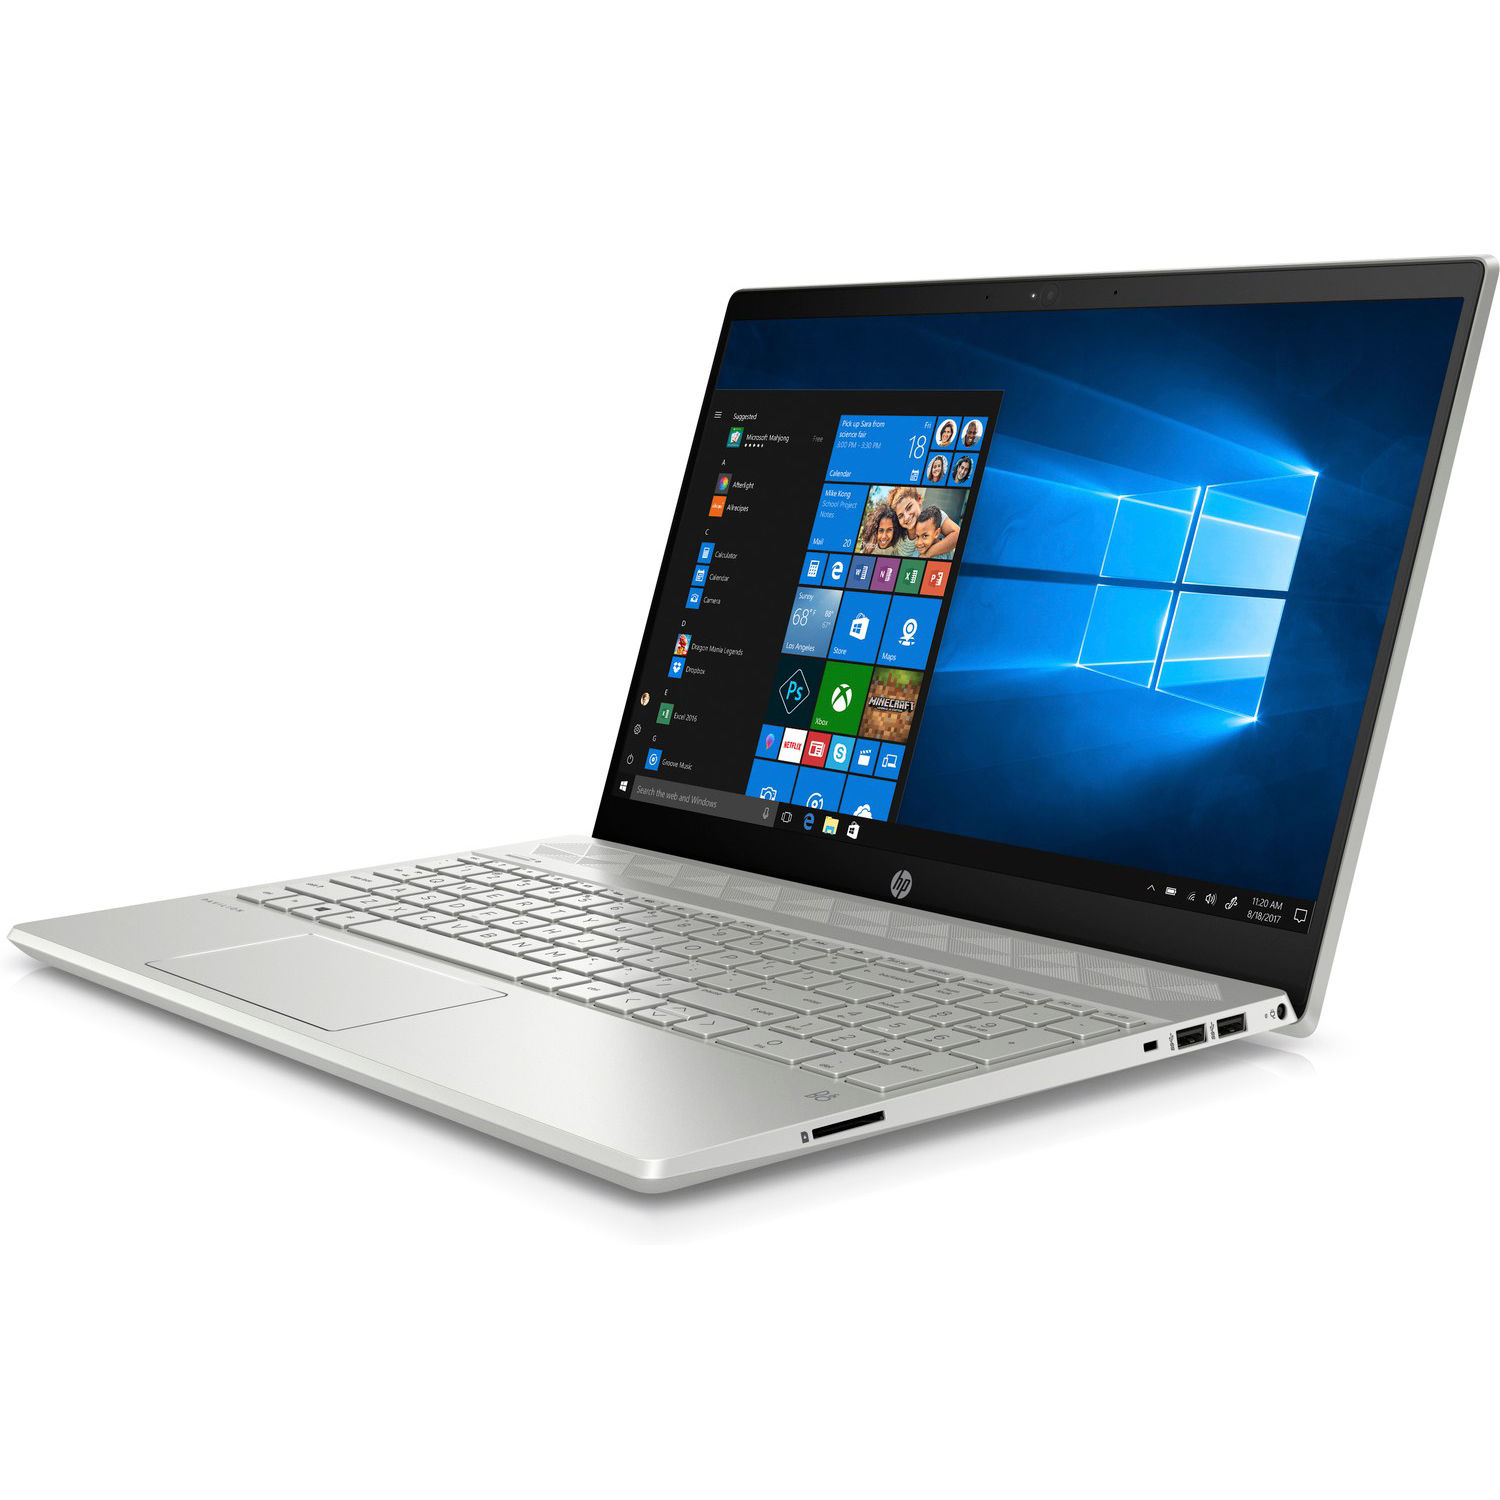
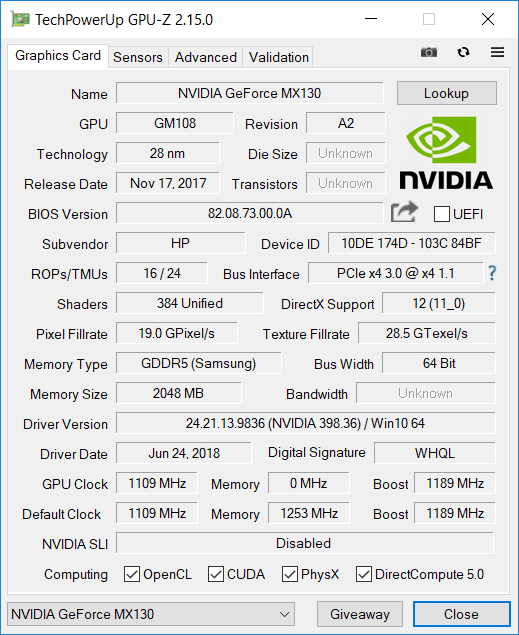
O HP Pavilion 15-cs0003ng tem um design moderno e uma tela quase sem marcos. Além disso, o processador Intel Core i5-8250U e a GPU NVIDIA GeForce MX130 são uma combinação poderosa que lida facilmente com tarefas gerais de escritório e até mesmo alguns jogos nas configurações gráficas certas.
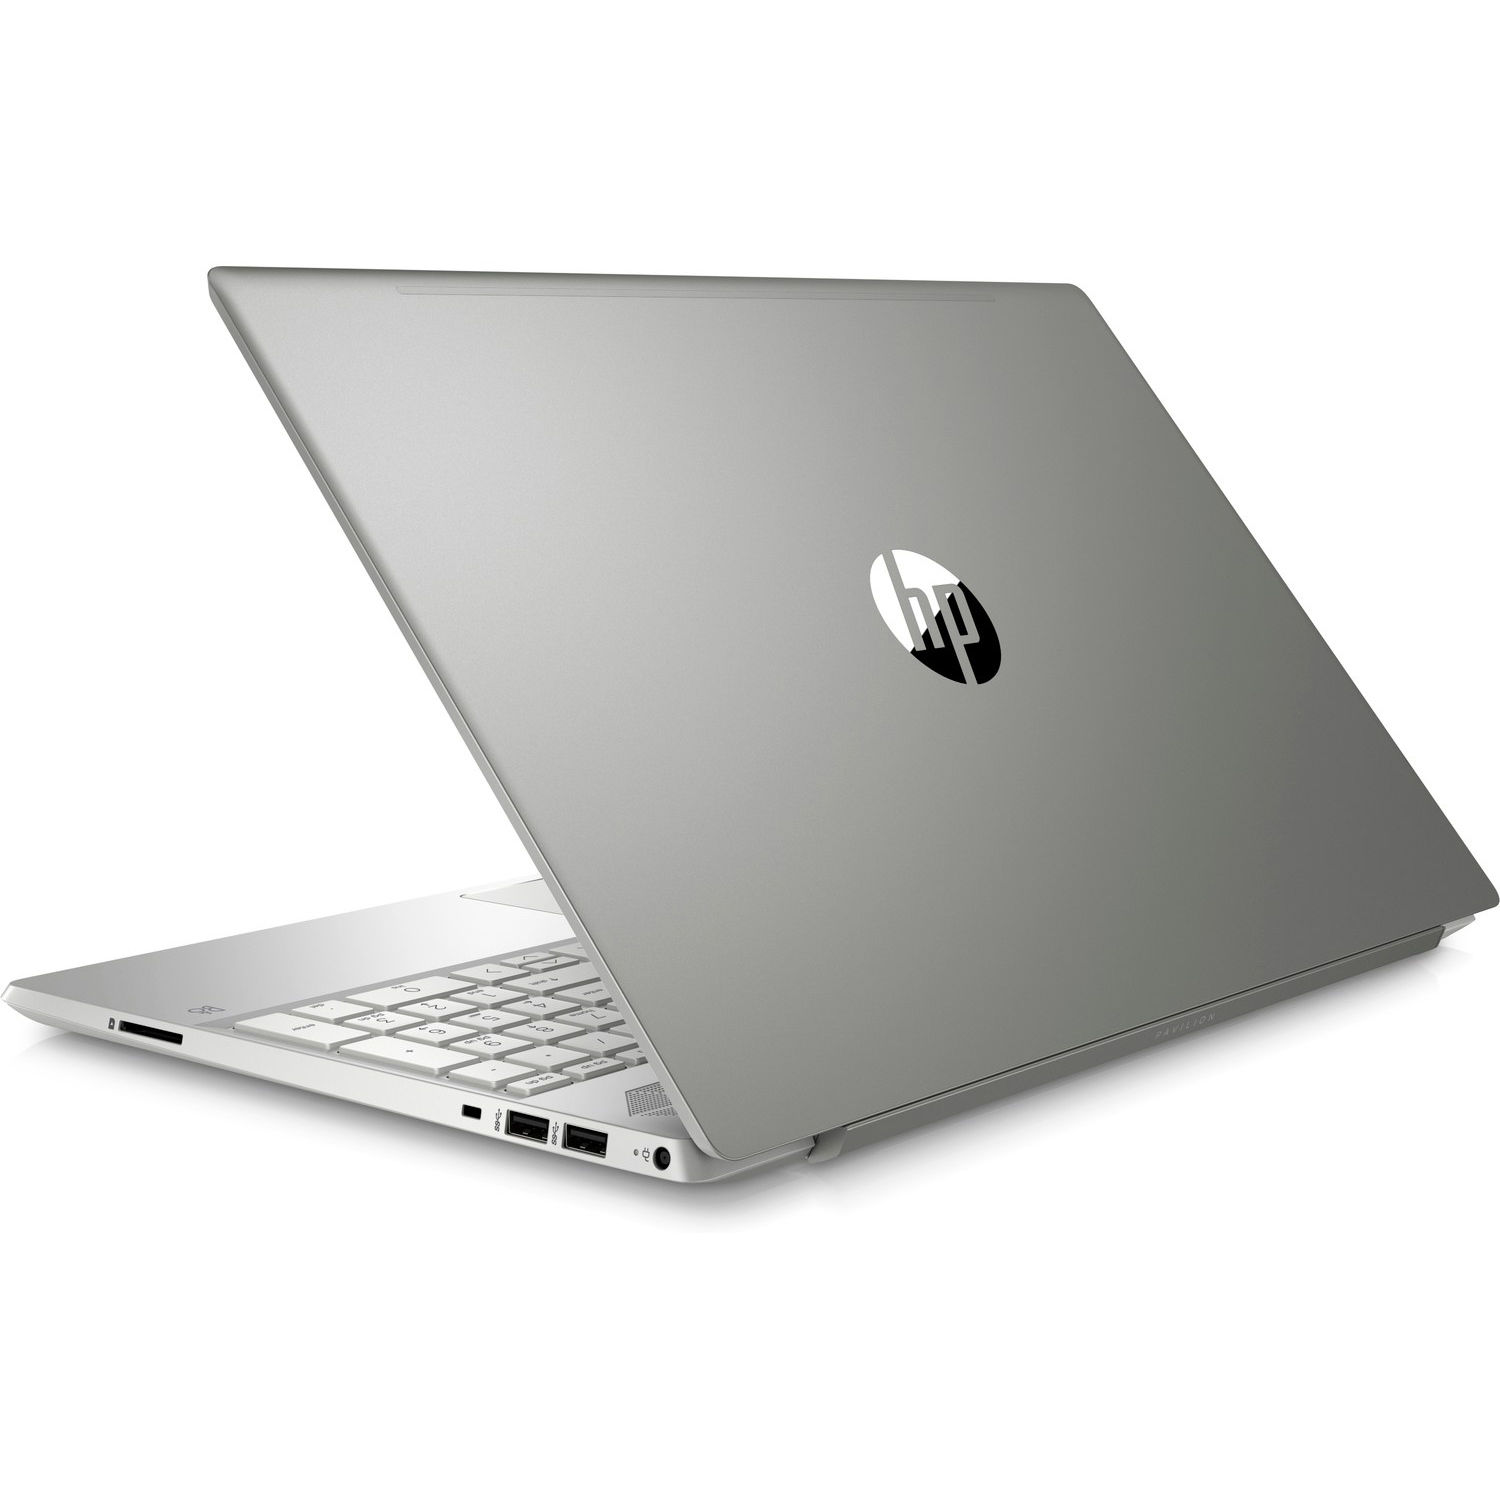
O HP Pavilion 15-cs0003ng é um portátil bem completo de 15,6 polegadas com um excelente design e potência suficiente para a maioria das tarefas. No entanto, ele tem uma duração de bateria comparativamente curta e um ventilador barulhento sob uso intenso, o que pode afastar alguns compradores em potencial.
Infelizmente, a GPU NVIDIA tem um impacto significativo na duração da bateria, com o Pavilion 15-cs0053cl praticamente equipado de forma idêntica, conseguindo durações duas vezes mais longas em nossos testes do que o 15-cs0003ng. Desabilitar a GPU NVIDIA no Gerenciador de dispositivos ajudaria a melhorar a duração da bateria. No geral, o Pavilion 15-cs0003ng é um ótimo portátil de 15,6 polegadas que fica aquém da concorrência em algumas áreas.
HP Pavilion 15-cs0003ng
- 01/10/2019 v6 (old)
Mike Wobker
Price comparison
