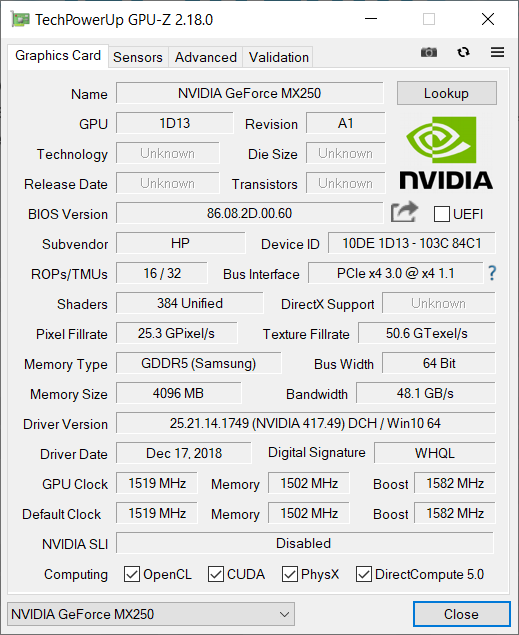
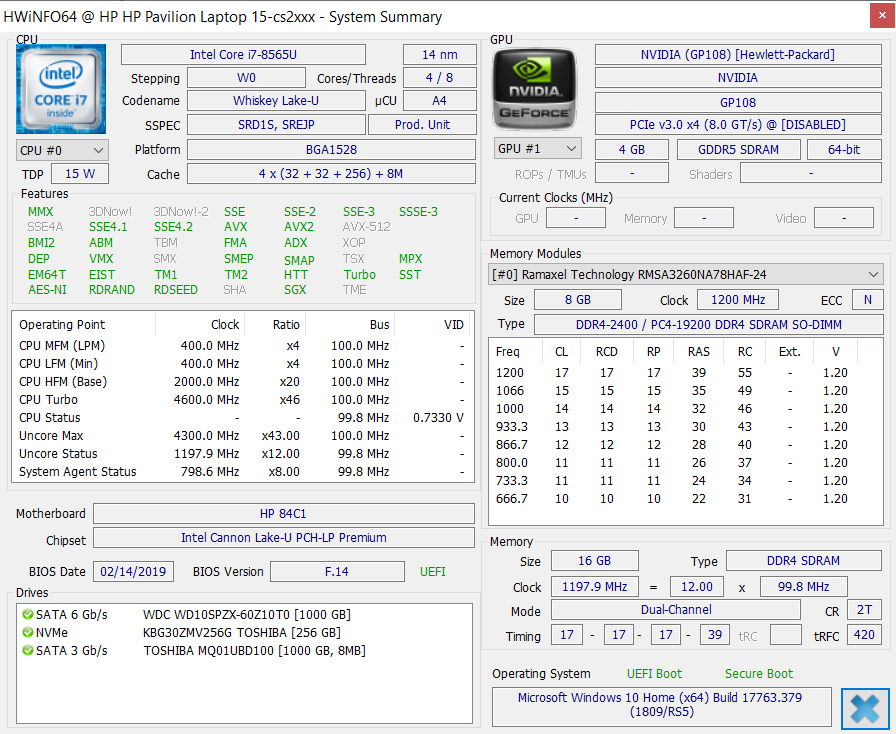
Breve Análise do Portátil HP Pavilion 15 (Core i5-8265U, GeForce MX250, 16 GB RAM)

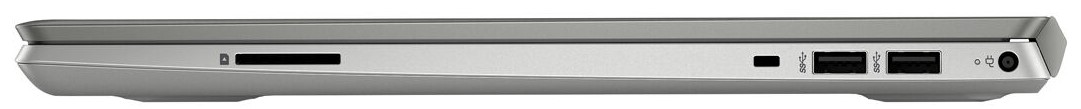
| SD Card Reader | |
| average JPG Copy Test (av. of 3 runs) | |
| Média da turma Multimedia (23 - 531, n=43, últimos 2 anos) | |
| Acer Aspire 5 A515-52G-723L (Toshiba Exceria Pro SDXC 64 GB UHS-II) | |
| HP Pavilion 15-cw0003ng (Toshiba Exceria Pro SDXC 64 GB UHS-II) | |
| HP Pavilion 15-cs2019ng (Toshiba Exceria Pro SDXC 64 GB UHS-II) | |
| HP Pavilion 15-cs0003ng (Toshiba Exceria Pro SDXC 64 GB UHS-II) | |
| Asus VivoBook S15 S530UN-BQ097T (Toshiba Exceria Pro M501 64 GB UHS-II) | |
| MSI PS63 Modern 8RC (Toshiba Exceria Pro SDXC 64 GB UHS-II) | |
| maximum AS SSD Seq Read Test (1GB) | |
| Média da turma Multimedia (27.9 - 1455, n=42, últimos 2 anos) | |
| Acer Aspire 5 A515-52G-723L (Toshiba Exceria Pro SDXC 64 GB UHS-II) | |
| HP Pavilion 15-cw0003ng (Toshiba Exceria Pro SDXC 64 GB UHS-II) | |
| HP Pavilion 15-cs0003ng (Toshiba Exceria Pro SDXC 64 GB UHS-II) | |
| HP Pavilion 15-cs2019ng (Toshiba Exceria Pro SDXC 64 GB UHS-II) | |
| Asus VivoBook S15 S530UN-BQ097T (Toshiba Exceria Pro M501 64 GB UHS-II) | |
| MSI PS63 Modern 8RC (Toshiba Exceria Pro SDXC 64 GB UHS-II) | |
| Networking | |
| iperf3 transmit AX12 | |
| Acer Aspire 5 A515-52G-723L | |
| MSI PS63 Modern 8RC | |
| Asus VivoBook S15 S530UN-BQ097T | |
| HP Pavilion 15-cs2019ng | |
| HP Pavilion 15-cs0003ng | |
| HP Pavilion 15-cw0003ng | |
| iperf3 receive AX12 | |
| HP Pavilion 15-cs2019ng | |
| MSI PS63 Modern 8RC | |
| Acer Aspire 5 A515-52G-723L | |
| Asus VivoBook S15 S530UN-BQ097T | |
| HP Pavilion 15-cw0003ng | |
| HP Pavilion 15-cs0003ng | |
| |||||||||||||||||||||||||
iluminação: 86 %
iluminação com acumulador: 273 cd/m²
Contraste: 1231:1 (Preto: 0.26 cd/m²)
ΔE ColorChecker Calman: 4.5 | ∀{0.5-29.43 Ø4.72}
ΔE Greyscale Calman: 4.71 | ∀{0.09-98 Ø4.97}
88% sRGB (Argyll 1.6.3 3D)
58% AdobeRGB 1998 (Argyll 1.6.3 3D)
64.4% AdobeRGB 1998 (Argyll 3D)
88.1% sRGB (Argyll 3D)
67.2% Display P3 (Argyll 3D)
Gamma: 2.45
CCT: 7085 K
| HP Pavilion 15-cs2019ng BOE080D, , 1920x1080, 15.6" | Acer Aspire 5 A515-52G-723L BOE NV156FHM-N48, , 1920x1080, 15.6" | Asus VivoBook S15 S530UN-BQ097T LP156WFC-SPD1, , 1920x1080, 15.6" | MSI PS63 Modern 8RC Chi Mei CMN15E8 N156HCE/EN1, , 1920x1080, 15.6" | HP Pavilion 15-cw0003ng AU Optronics AUO23ED, , 1920x1080, 15.6" | HP Pavilion 15-cs0003ng 1920x1080, 15.6" | |
|---|---|---|---|---|---|---|
| Display | -37% | -38% | -2% | -41% | -42% | |
| Display P3 Coverage (%) | 67.2 | 40.02 -40% | 38.51 -43% | 63.5 -6% | 36.7 -45% | 36.27 -46% |
| sRGB Coverage (%) | 88.1 | 58.5 -34% | 57.9 -34% | 87.9 0% | 55 -38% | 54.6 -38% |
| AdobeRGB 1998 Coverage (%) | 64.4 | 41.34 -36% | 39.79 -38% | 63.9 -1% | 37.91 -41% | 37.47 -42% |
| Response Times | -10% | 9% | -4% | 9% | -1% | |
| Response Time Grey 50% / Grey 80% * (ms) | 43 ? | 45 ? -5% | 38.8 ? 10% | 42 ? 2% | 40 ? 7% | 45 ? -5% |
| Response Time Black / White * (ms) | 29 ? | 33 ? -14% | 26.8 ? 8% | 32 ? -10% | 26 ? 10% | 28 ? 3% |
| PWM Frequency (Hz) | 208 ? | 250 ? | 25000 ? | |||
| Screen | -6% | -12% | 9% | -16% | -37% | |
| Brightness middle (cd/m²) | 320 | 278 -13% | 262 -18% | 289 -10% | 186 -42% | 240 -25% |
| Brightness (cd/m²) | 293 | 271 -8% | 256 -13% | 262 -11% | 180 -39% | 237 -19% |
| Brightness Distribution (%) | 86 | 89 3% | 90 5% | 75 -13% | 88 2% | 90 5% |
| Black Level * (cd/m²) | 0.26 | 0.26 -0% | 0.21 19% | 0.26 -0% | 0.15 42% | 0.42 -62% |
| Contrast (:1) | 1231 | 1069 -13% | 1248 1% | 1112 -10% | 1240 1% | 571 -54% |
| Colorchecker dE 2000 * | 4.5 | 4.73 -5% | 5.8 -29% | 2.9 36% | 5.94 -32% | 7.43 -65% |
| Colorchecker dE 2000 max. * | 8.81 | 8.38 5% | 14.3 -62% | 5.71 35% | 10.81 -23% | 12.42 -41% |
| Greyscale dE 2000 * | 4.71 | 2.59 45% | 2.5 47% | 1.42 70% | 4.44 6% | 6.26 -33% |
| Gamma | 2.45 90% | 2.38 92% | 1.99 111% | 2.39 92% | 2.81 78% | 2.96 74% |
| CCT | 7085 92% | 6160 106% | 6528 100% | 6705 97% | 6272 104% | 6661 98% |
| Color Space (Percent of AdobeRGB 1998) (%) | 58 | 36 -38% | 36.6 -37% | 57 -2% | 35 -40% | 35 -40% |
| Color Space (Percent of sRGB) (%) | 88 | 58 -34% | 57.6 -35% | 87 -1% | 55 -37% | 54 -39% |
| Colorchecker dE 2000 calibrated * | 5.17 | 4.6 | 2.88 | 6.07 | ||
| Média Total (Programa/Configurações) | -18% /
-12% | -14% /
-15% | 1% /
5% | -16% /
-18% | -27% /
-33% |
* ... menor é melhor
Exibir tempos de resposta
| ↔ Tempo de resposta preto para branco | ||
|---|---|---|
| 29 ms ... ascensão ↗ e queda ↘ combinadas | ↗ 16 ms ascensão | 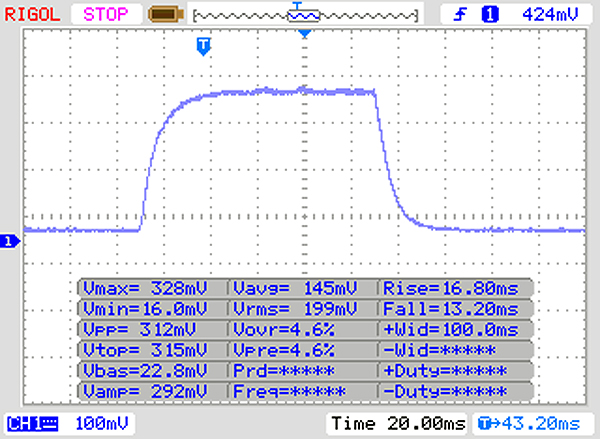 |
| ↘ 13 ms queda | ||
| A tela mostra taxas de resposta relativamente lentas em nossos testes e pode ser muito lenta para os jogadores. Em comparação, todos os dispositivos testados variam de 0.1 (mínimo) a 240 (máximo) ms. » 77 % de todos os dispositivos são melhores. Isso significa que o tempo de resposta medido é pior que a média de todos os dispositivos testados (19.8 ms). | ||
| ↔ Tempo de resposta 50% cinza a 80% cinza | ||
| 43 ms ... ascensão ↗ e queda ↘ combinadas | ↗ 22 ms ascensão | 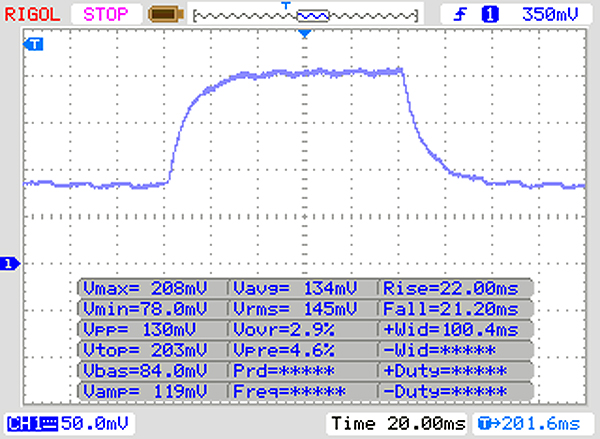 |
| ↘ 21 ms queda | ||
| A tela mostra taxas de resposta lentas em nossos testes e será insatisfatória para os jogadores. Em comparação, todos os dispositivos testados variam de 0.165 (mínimo) a 636 (máximo) ms. » 71 % de todos os dispositivos são melhores. Isso significa que o tempo de resposta medido é pior que a média de todos os dispositivos testados (31 ms). | ||
Cintilação da tela / PWM (modulação por largura de pulso)
| Tela tremeluzindo/PWM detectado | 208 Hz | ≤ 90 % configuração de brilho | 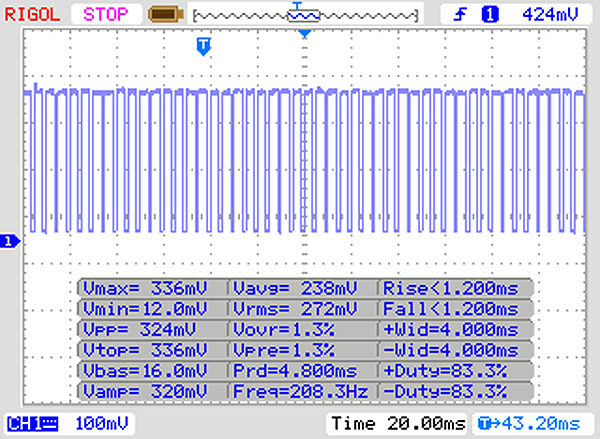 |
A luz de fundo da tela pisca em 208 Hz (pior caso, por exemplo, utilizando PWM) Cintilação detectada em uma configuração de brilho de 90 % e abaixo. Não deve haver cintilação ou PWM acima desta configuração de brilho. A frequência de 208 Hz é relativamente baixa, portanto, usuários sensíveis provavelmente notarão cintilação e sentirão fadiga ocular na configuração de brilho indicada e abaixo. [pwm_comparison] Em comparação: 52 % de todos os dispositivos testados não usam PWM para escurecer a tela. Se PWM foi detectado, uma média de 7763 (mínimo: 5 - máximo: 343500) Hz foi medida. | |||
| Cinebench R15 | |
| CPU Single 64Bit | |
| Média da turma Multimedia (184.8 - 326, n=65, últimos 2 anos) | |
| MSI PS63 Modern 8RC | |
| Asus VivoBook S15 S530UN-BQ097T | |
| Acer Aspire 5 A515-52G-723L | |
| HP Pavilion 15-cs2019ng | |
| Média Intel Core i5-8265U (111 - 164, n=35) | |
| HP Pavilion 15-cs0003ng | |
| HP Pavilion 15-cw0003ng | |
| CPU Multi 64Bit | |
| Média da turma Multimedia (856 - 5224, n=67, últimos 2 anos) | |
| Asus VivoBook S15 S530UN-BQ097T | |
| HP Pavilion 15-cw0003ng | |
| Média Intel Core i5-8265U (457 - 750, n=38) | |
| MSI PS63 Modern 8RC | |
| HP Pavilion 15-cs2019ng | |
| HP Pavilion 15-cs0003ng | |
| Acer Aspire 5 A515-52G-723L | |
| PCMark 8 | |
| Home Score Accelerated v2 | |
| Média da turma Multimedia (n=1últimos 2 anos) | |
| Acer Aspire 5 A515-52G-723L | |
| Média Intel Core i5-8265U, NVIDIA GeForce MX250 (3603 - 4220, n=2) | |
| MSI PS63 Modern 8RC | |
| HP Pavilion 15-cs0003ng | |
| Asus VivoBook S15 S530UN-BQ097T | |
| HP Pavilion 15-cs2019ng | |
| HP Pavilion 15-cw0003ng | |
| Work Score Accelerated v2 | |
| Acer Aspire 5 A515-52G-723L | |
| HP Pavilion 15-cs2019ng | |
| Média Intel Core i5-8265U, NVIDIA GeForce MX250 (4965 - 5223, n=2) | |
| Asus VivoBook S15 S530UN-BQ097T | |
| MSI PS63 Modern 8RC | |
| HP Pavilion 15-cs0003ng | |
| HP Pavilion 15-cw0003ng | |
| PCMark 8 Home Score Accelerated v2 | 3603 pontos | |
| PCMark 8 Work Score Accelerated v2 | 5223 pontos | |
| PCMark 10 Score | 4190 pontos | |
Ajuda | ||
| HP Pavilion 15-cs2019ng Toshiba KBG30ZMV256G | Acer Aspire 5 A515-52G-723L WDC PC SN520 SDAPNUW-512G | Asus VivoBook S15 S530UN-BQ097T SanDisk SD9SN8W256G1027 | MSI PS63 Modern 8RC WDC PC SN520 SDAPNUW-512G | HP Pavilion 15-cw0003ng Intel SSD 600p SSDPEKKW512G7 | HP Pavilion 15-cs0003ng SK Hynix SC313 HFS256G39TNF | Média Toshiba KBG30ZMV256G | |
|---|---|---|---|---|---|---|---|
| CrystalDiskMark 5.2 / 6 | 20% | -48% | 12% | -19% | -46% | -8% | |
| Write 4K (MB/s) | 149.3 | 130.1 -13% | 51.5 -66% | 121.3 -19% | 105.8 -29% | 66.9 -55% | 114.9 ? -23% |
| Read 4K (MB/s) | 52.7 | 27.64 -48% | 28.53 -46% | 44.07 -16% | 29.22 -45% | 30.33 -42% | 48 ? -9% |
| Write Seq (MB/s) | 667 | 1438 116% | 444.2 -33% | 1176 76% | 581 -13% | 447.6 -33% | 727 ? 9% |
| Read Seq (MB/s) | 818 | 1319 61% | 477.7 -42% | 1139 39% | 1065 30% | 534 -35% | 885 ? 8% |
| Write 4K Q32T1 (MB/s) | 332.1 | 323.3 -3% | 208.7 -37% | 257.8 -22% | 201 -39% | 197.5 -41% | 253 ? -24% |
| Read 4K Q32T1 (MB/s) | 467.1 | 359.9 -23% | 224.3 -52% | 325.9 -30% | 278.6 -40% | 234.5 -50% | 400 ? -14% |
| Write Seq Q32T1 (MB/s) | 985 | 1454 48% | 515 -48% | 1455 48% | 584 -41% | 495.6 -50% | 849 ? -14% |
| Read Seq Q32T1 (MB/s) | 1454 | 1740 20% | 559 -62% | 1741 20% | 1824 25% | 559 -62% | 1493 ? 3% |
| Write 4K Q8T8 (MB/s) | 207.5 | 536 ? | |||||
| Read 4K Q8T8 (MB/s) | 223.6 | 560 ? | |||||
| AS SSD | 69% | -57% | 69% | -6% | -24% | -13% | |
| Seq Read (MB/s) | 1153 | 1557 35% | 504 -56% | 1372 19% | 1480 28% | 522 -55% | 1283 ? 11% |
| Seq Write (MB/s) | 736 | 1237 68% | 202.7 -72% | 1244 69% | 540 -27% | 476.1 -35% | 676 ? -8% |
| 4K Read (MB/s) | 46.51 | 42.56 -8% | 27.67 -41% | 43.34 -7% | 20.36 -56% | 30.14 -35% | 42.7 ? -8% |
| 4K Write (MB/s) | 114.1 | 127.2 11% | 51.1 -55% | 162.2 42% | 54 -53% | 64.3 -44% | 87.7 ? -23% |
| 4K-64 Read (MB/s) | 618 | 1034 67% | 373.6 -40% | 1044 69% | 491.4 -20% | 319.2 -48% | 575 ? -7% |
| 4K-64 Write (MB/s) | 461.4 | 1186 157% | 173 -63% | 1111 141% | 390.3 -15% | 239.8 -48% | 270 ? -41% |
| Access Time Read * (ms) | 0.421 | 0.077 82% | 0.365 13% | 0.058 86% | 0.138 67% | 0.131 69% | 0.2746 ? 35% |
| Access Time Write * (ms) | 0.233 | 0.028 88% | 0.603 -159% | 0.024 90% | 0.078 67% | 0.056 76% | 0.3361 ? -44% |
| Score Read (Points) | 780 | 1233 58% | 452 -42% | 1224 57% | 660 -15% | 402 -48% | 746 ? -4% |
| Score Write (Points) | 649 | 1437 121% | 244 -62% | 1398 115% | 498 -23% | 352 -46% | 426 ? -34% |
| Score Total (Points) | 1822 | 3291 81% | 921 -49% | 3249 78% | 1451 -20% | 967 -47% | 1536 ? -16% |
| Copy ISO MB/s (MB/s) | 1313 | 810 | 491.3 | 761 ? | |||
| Copy Program MB/s (MB/s) | 334.6 | 332.5 | 203.9 | 243 ? | |||
| Copy Game MB/s (MB/s) | 684 | 557 | 359.3 | 457 ? | |||
| Média Total (Programa/Configurações) | 45% /
48% | -53% /
-53% | 41% /
45% | -13% /
-12% | -35% /
-33% | -11% /
-11% |
* ... menor é melhor

| 3DMark 11 - 1280x720 Performance GPU | |
| Média da turma Multimedia (3749 - 60002, n=61, últimos 2 anos) | |
| MSI PS63 Modern 8RC | |
| HP Pavilion 15-cs2019ng | |
| Acer Aspire 5 A515-52G-723L | |
| Asus VivoBook S15 S530UN-BQ097T | |
| Média NVIDIA GeForce MX250 (3585 - 4942, n=29) | |
| HP Pavilion 15-cs0003ng | |
| HP Pavilion 15-cw0003ng | |
| 3DMark | |
| 1280x720 Cloud Gate Standard Graphics | |
| Média da turma Multimedia (16765 - 143501, n=35, últimos 2 anos) | |
| MSI PS63 Modern 8RC | |
| HP Pavilion 15-cs2019ng | |
| Acer Aspire 5 A515-52G-723L | |
| Média NVIDIA GeForce MX250 (13805 - 23863, n=25) | |
| Asus VivoBook S15 S530UN-BQ097T | |
| HP Pavilion 15-cs0003ng | |
| HP Pavilion 15-cw0003ng | |
| 1920x1080 Fire Strike Graphics | |
| Média da turma Multimedia (2328 - 48907, n=65, últimos 2 anos) | |
| MSI PS63 Modern 8RC | |
| HP Pavilion 15-cs2019ng | |
| Acer Aspire 5 A515-52G-723L | |
| Média NVIDIA GeForce MX250 (2939 - 3885, n=29) | |
| Asus VivoBook S15 S530UN-BQ097T | |
| HP Pavilion 15-cs0003ng | |
| HP Pavilion 15-cw0003ng | |
| 2560x1440 Time Spy Graphics | |
| Média da turma Multimedia (696 - 19403, n=66, últimos 2 anos) | |
| Acer Aspire 5 A515-52G-723L | |
| Média NVIDIA GeForce MX250 (881 - 1169, n=22) | |
| Asus VivoBook S15 S530UN-BQ097T | |
| 3DMark 11 Performance | 4994 pontos | |
| 3DMark Cloud Gate Standard Score | 13164 pontos | |
| 3DMark Fire Strike Score | 3318 pontos | |
Ajuda | ||
| The Witcher 3 | |
| 1024x768 Low Graphics & Postprocessing | |
| Média da turma Multimedia (68 - 380, n=8, últimos 2 anos) | |
| HP Pavilion 15-cs2019ng | |
| Acer Aspire 5 A515-52G-723L | |
| Média NVIDIA GeForce MX250 (47.4 - 70, n=24) | |
| Asus VivoBook S15 S530UN-BQ097T | |
| 1366x768 Medium Graphics & Postprocessing | |
| Média da turma Multimedia (41 - 93, n=4, últimos 2 anos) | |
| Acer Aspire 5 A515-52G-723L | |
| HP Pavilion 15-cs2019ng | |
| Asus VivoBook S15 S530UN-BQ097T | |
| Média NVIDIA GeForce MX250 (30 - 40, n=27) | |
| 1920x1080 High Graphics & Postprocessing (Nvidia HairWorks Off) | |
| Média da turma Multimedia (22 - 224, n=11, últimos 2 anos) | |
| HP Pavilion 15-cs2019ng | |
| Acer Aspire 5 A515-52G-723L | |
| Média NVIDIA GeForce MX250 (16.3 - 23.1, n=27) | |
| Asus VivoBook S15 S530UN-BQ097T | |
| 1920x1080 Ultra Graphics & Postprocessing (HBAO+) | |
| Média da turma Multimedia (11 - 121, n=11, últimos 2 anos) | |
| HP Pavilion 15-cs2019ng | |
| Média NVIDIA GeForce MX250 (9 - 16, n=24) | |
| Acer Aspire 5 A515-52G-723L | |
| Asus VivoBook S15 S530UN-BQ097T | |
| BioShock Infinite | |
| 1280x720 Very Low Preset | |
| HP Pavilion 15-cs2019ng | |
| Média NVIDIA GeForce MX250 (133.9 - 212, n=14) | |
| Acer Aspire 5 A515-52G-723L | |
| Asus VivoBook S15 S530UN-BQ097T | |
| HP Pavilion 15-cs0003ng | |
| 1366x768 Medium Preset | |
| HP Pavilion 15-cs2019ng | |
| Média NVIDIA GeForce MX250 (98.4 - 117.5, n=14) | |
| Acer Aspire 5 A515-52G-723L | |
| Asus VivoBook S15 S530UN-BQ097T | |
| HP Pavilion 15-cs0003ng | |
| 1366x768 High Preset | |
| MSI PS63 Modern 8RC | |
| Acer Aspire 5 A515-52G-723L | |
| Média NVIDIA GeForce MX250 (84 - 100.5, n=14) | |
| HP Pavilion 15-cs2019ng | |
| Asus VivoBook S15 S530UN-BQ097T | |
| HP Pavilion 15-cs0003ng | |
| 1920x1080 Ultra Preset, DX11 (DDOF) | |
| MSI PS63 Modern 8RC | |
| Média NVIDIA GeForce MX250 (32.3 - 38.1, n=14) | |
| HP Pavilion 15-cs2019ng | |
| Acer Aspire 5 A515-52G-723L | |
| Asus VivoBook S15 S530UN-BQ097T | |
| HP Pavilion 15-cs0003ng | |
| baixo | média | alto | ultra | |
|---|---|---|---|---|
| BioShock Infinite (2013) | 197 | 110 | 93 | 35 |
| Dota 2 (2013) | 101 | 88 | 64 | |
| Thief (2014) | 66.8 | 47.5 | 44.3 | 21 |
| The Witcher 3 (2015) | 65 | 37 | 21 | 16 |
| Rise of the Tomb Raider (2016) | 71 | 39 | 24 | 20 |
Barulho
| Ocioso |
| 31.5 / 31.5 / 31.5 dB |
| Carga |
| 42.5 / 42.5 dB |
 | ||
30 dB silencioso 40 dB(A) audível 50 dB(A) ruidosamente alto |
||
min: | ||
(-) A temperatura máxima no lado superior é 46 °C / 115 F, em comparação com a média de 36.8 °C / 98 F , variando de 21 a 71 °C para a classe Multimedia.
(±) A parte inferior aquece até um máximo de 44.6 °C / 112 F, em comparação com a média de 39.1 °C / 102 F
(+) Em uso inativo, a temperatura média para o lado superior é 26 °C / 79 F, em comparação com a média do dispositivo de 31.3 °C / ### class_avg_f### F.
(+) Os apoios para as mãos e o touchpad são mais frios que a temperatura da pele, com um máximo de 30.8 °C / 87.4 F e, portanto, são frios ao toque.
(-) A temperatura média da área do apoio para as mãos de dispositivos semelhantes foi 28.7 °C / 83.7 F (-2.1 °C / -3.7 F).
HP Pavilion 15-cs2019ng análise de áudio
(-) | alto-falantes não muito altos (###valor### dB)
Graves 100 - 315Hz
(-) | quase nenhum baixo - em média 27.4% menor que a mediana
(±) | a linearidade dos graves é média (10.6% delta para a frequência anterior)
Médios 400 - 2.000 Hz
(+) | médios equilibrados - apenas 2.5% longe da mediana
(±) | a linearidade dos médios é média (8.3% delta para frequência anterior)
Altos 2 - 16 kHz
(+) | agudos equilibrados - apenas 3.2% longe da mediana
(+) | os máximos são lineares (4.8% delta da frequência anterior)
Geral 100 - 16.000 Hz
(±) | a linearidade do som geral é média (20.8% diferença em relação à mediana)
Comparado com a mesma classe
» 71% de todos os dispositivos testados nesta classe foram melhores, 7% semelhantes, 22% piores
» O melhor teve um delta de 5%, a média foi 17%, o pior foi 45%
Comparado com todos os dispositivos testados
» 56% de todos os dispositivos testados foram melhores, 8% semelhantes, 36% piores
» O melhor teve um delta de 4%, a média foi 24%, o pior foi 134%
Apple MacBook 12 (Early 2016) 1.1 GHz análise de áudio
(+) | os alto-falantes podem tocar relativamente alto (###valor### dB)
Graves 100 - 315Hz
(±) | graves reduzidos - em média 11.3% menor que a mediana
(±) | a linearidade dos graves é média (14.2% delta para a frequência anterior)
Médios 400 - 2.000 Hz
(+) | médios equilibrados - apenas 2.4% longe da mediana
(+) | médios são lineares (5.5% delta para frequência anterior)
Altos 2 - 16 kHz
(+) | agudos equilibrados - apenas 2% longe da mediana
(+) | os máximos são lineares (4.5% delta da frequência anterior)
Geral 100 - 16.000 Hz
(+) | o som geral é linear (10.2% diferença em relação à mediana)
Comparado com a mesma classe
» 7% de todos os dispositivos testados nesta classe foram melhores, 2% semelhantes, 91% piores
» O melhor teve um delta de 5%, a média foi 18%, o pior foi 53%
Comparado com todos os dispositivos testados
» 5% de todos os dispositivos testados foram melhores, 1% semelhantes, 94% piores
» O melhor teve um delta de 4%, a média foi 24%, o pior foi 134%
| desligado | |
| Ocioso | |
| Carga |
|
Key:
min: | |
| HP Pavilion 15-cs2019ng i5-8265U, GeForce MX250, Toshiba KBG30ZMV256G, IPS, 1920x1080, 15.6" | Acer Aspire 5 A515-52G-723L i7-8565U, GeForce MX250, WDC PC SN520 SDAPNUW-512G, IPS, 1920x1080, 15.6" | Asus VivoBook S15 S530UN-BQ097T i5-8550U, GeForce MX150, SanDisk SD9SN8W256G1027, IPS LED, 1920x1080, 15.6" | MSI PS63 Modern 8RC i7-8565U, GeForce GTX 1050 Max-Q, WDC PC SN520 SDAPNUW-512G, IPS, 1920x1080, 15.6" | HP Pavilion 15-cw0003ng R5 2500U, Vega 8, Intel SSD 600p SSDPEKKW512G7, IPS, 1920x1080, 15.6" | HP Pavilion 15-cs0003ng i5-8250U, GeForce MX130, SK Hynix SC313 HFS256G39TNF, IPS, 1920x1080, 15.6" | Média NVIDIA GeForce MX250 | Média da turma Multimedia | |
|---|---|---|---|---|---|---|---|---|
| Power Consumption | -7% | 3% | -50% | 11% | 1% | -13% | -54% | |
| Idle Minimum * (Watt) | 4.9 | 4.4 10% | 3.1 37% | 6.8 -39% | 4.5 8% | 3.3 33% | 4.1 ? 16% | 5.65 ? -15% |
| Idle Average * (Watt) | 7.9 | 6.9 13% | 6.3 20% | 9.8 -24% | 7.3 8% | 6.1 23% | 7.91 ? -0% | 10 ? -27% |
| Idle Maximum * (Watt) | 10.1 | 9.9 2% | 8.6 15% | 11.4 -13% | 9.4 7% | 8.3 18% | 10.4 ? -3% | 12.3 ? -22% |
| Load Average * (Watt) | 60 | 55 8% | 56.4 6% | 76 -27% | 34 43% | 56 7% | 58.6 ? 2% | 65.1 ? -9% |
| Load Maximum * (Watt) | 38 | 63.4 -67% | 62.7 -65% | 93 -145% | 41.9 -10% | 67 -76% | 68.9 ? -81% | 112.5 ? -196% |
| Witcher 3 ultra * (Watt) | 45 |
* ... menor é melhor
| HP Pavilion 15-cs2019ng i5-8265U, GeForce MX250, 41 Wh | Acer Aspire 5 A515-52G-723L i7-8565U, GeForce MX250, 48 Wh | Asus VivoBook S15 S530UN-BQ097T i5-8550U, GeForce MX150, 42 Wh | MSI PS63 Modern 8RC i7-8565U, GeForce GTX 1050 Max-Q, 82 Wh | HP Pavilion 15-cw0003ng R5 2500U, Vega 8, 41 Wh | HP Pavilion 15-cs0003ng i5-8250U, GeForce MX130, 41 Wh | Média da turma Multimedia | |
|---|---|---|---|---|---|---|---|
| Duração da bateria | 51% | 30% | 106% | 22% | 17% | 128% | |
| Reader / Idle (h) | 8 | 12.9 61% | 14 75% | 8.4 5% | 8.2 2% | 25.2 ? 215% | |
| WiFi v1.3 (h) | 5 | 6.9 38% | 6.5 30% | 11.4 128% | 5 0% | 4.7 -6% | 12 ? 140% |
| Load (h) | 1.3 | 2 54% | 2.8 115% | 2.1 62% | 2 54% | 1.669 ? 28% |
Pro
Contra
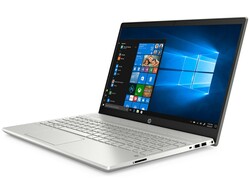
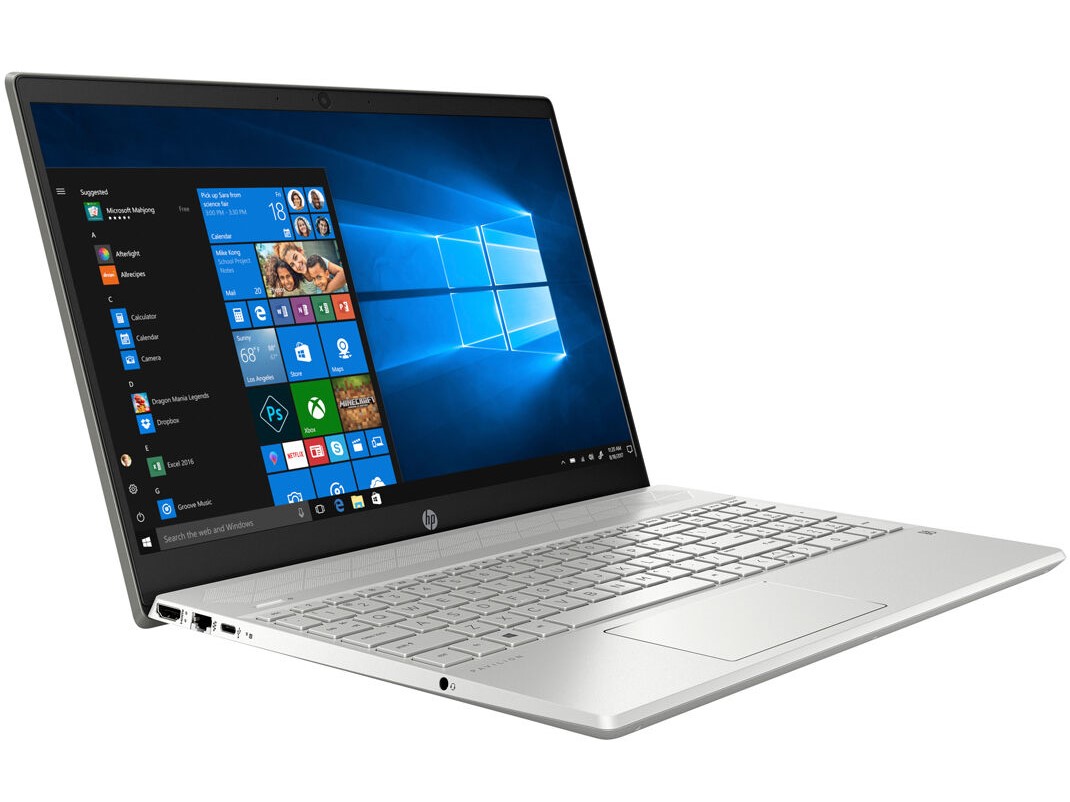
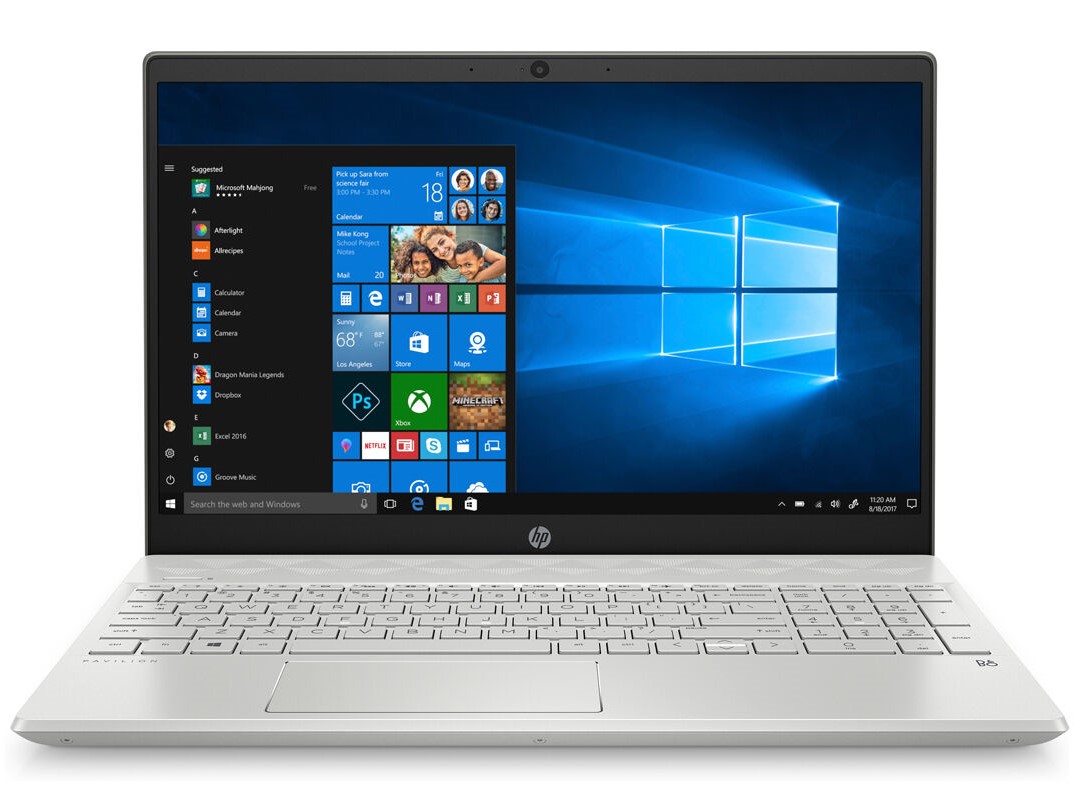
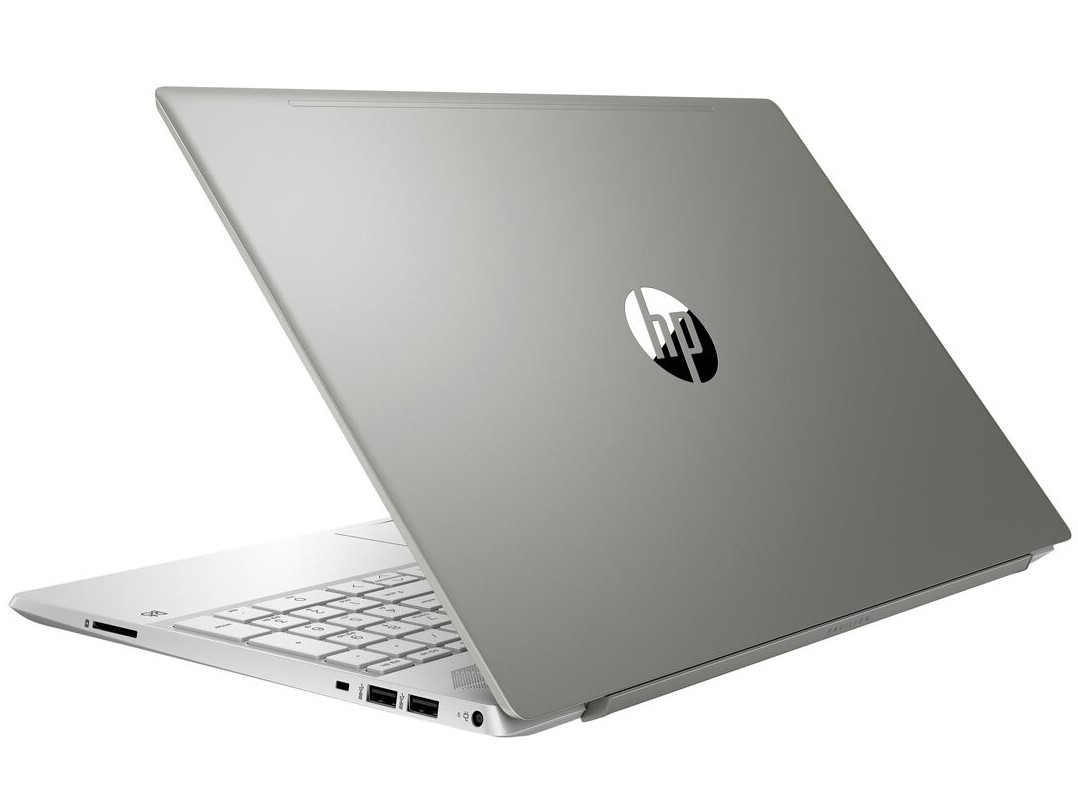
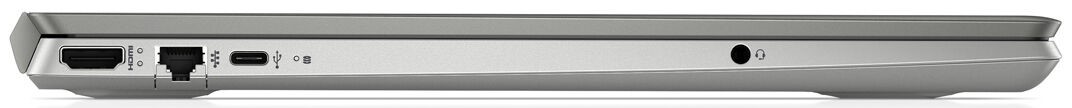
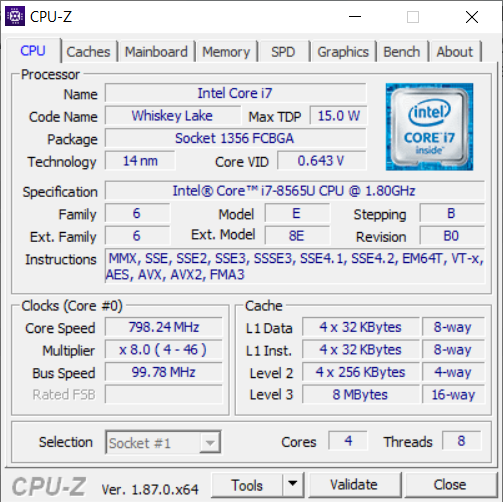
O HP Pavilion 15-cs2019ng é uma atualização moderada de seus irmãos e confirma nossas impressões anteriores sobre a série. O Pavilion 15 é um dispositivo bem construído que aparenta ser caro e tem uma sólida seleção de portas. O cs2019ng também oferece mais do que suficiente potência para todas as tarefas diárias e pode até mesmo lidar com alguns jogos leves. A atualização para uma CPU Whiskey Lake e a GeForce MX250 também oferece um aumento modesto no desempenho.
O HP Pavilion 15-cs2019ng é um elegante portátil de 15,6 polegadas que tem muito a oferecer. Sua fraca duração de bateria e uso de PWM tiram o brilho do que é um portátil multimídia que de outra forma é competente.
Infelizmente, o cs2019ng compartilha as mesmas falhas de seus irmãos. O dispositivo tem uma duração de bateria comparativamente curta, e é difícil acessar seus componentes internos. A inclusão do PWM também é decepcionante e será problemático para algumas pessoas. No geral, o Pavilion 15-cs2019ng oferece mais potência do que seus irmãos Kaby Lake e AMD, mantendo seu design premium e bom desempenho de resfriamento.
HP Pavilion 15-cs2019ng
- 04/21/2019 v6 (old)
Mike Wobker
Price comparison
