Breve Análise do Portátil HP Pavilion 15-cs0053cl (i5-8250U, HD)
| SD Card Reader | |
| average JPG Copy Test (av. of 3 runs) | |
| Dell XPS 15 9570 i7 UHD (Toshiba Exceria Pro SDXC 64 GB UHS-II) | |
| HP Spectre x360 15-ch011nr (Toshiba Exceria Pro SDXC 64 GB UHS-II) | |
| HP Pavilion 15-cs0053cl (Toshiba Exceria Pro SDXC 64 GB UHS-II) | |
| maximum AS SSD Seq Read Test (1GB) | |
| HP Spectre x360 15-ch011nr (Toshiba Exceria Pro SDXC 64 GB UHS-II) | |
| Dell XPS 15 9570 i7 UHD (Toshiba Exceria Pro SDXC 64 GB UHS-II) | |
| HP Pavilion 15-cs0053cl (Toshiba Exceria Pro SDXC 64 GB UHS-II) | |
| Networking | |
| iperf3 transmit AX12 | |
| Dell XPS 15 9570 i7 UHD | |
| HP Spectre x360 15-ch011nr | |
| HP Pavilion 15-cs0053cl | |
| iperf3 receive AX12 | |
| HP Spectre x360 15-ch011nr | |
| Dell XPS 15 9570 i7 UHD | |
| HP Pavilion 15-cs0053cl | |
| |||||||||||||||||||||||||
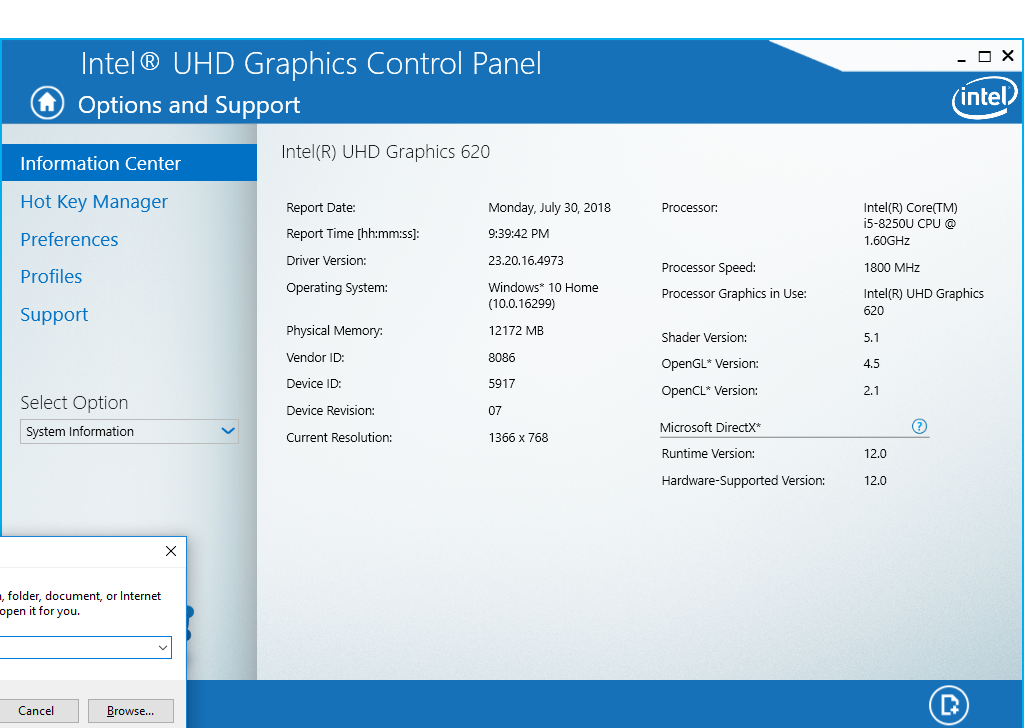
iluminação: 93 %
iluminação com acumulador: 220.1 cd/m²
Contraste: 759:1 (Preto: 0.29 cd/m²)
ΔE ColorChecker Calman: 11.4 | ∀{0.5-29.43 Ø4.71}
calibrated: 4.09
ΔE Greyscale Calman: 12 | ∀{0.09-98 Ø4.96}
57.5% sRGB (Argyll 1.6.3 3D)
36.5% AdobeRGB 1998 (Argyll 1.6.3 3D)
39.65% AdobeRGB 1998 (Argyll 3D)
57.7% sRGB (Argyll 3D)
38.37% Display P3 (Argyll 3D)
Gamma: 2.09
CCT: 12625 K
| HP Pavilion 15-cs0053cl AU Optronics B156XW02 V0, TN LED, 15.6", 1366x768 | Asus VivoBook 15 X570UD AU Optronics B156HAN06.1, IPS, 15.6", 1920x1080 | Dell Inspiron 15 5579-9672 AUO, B156HW01, IPS, 15.6", 1920x1080 | Acer Aspire 3 A315-41-R7BM Chi Mei CMN15D5, TN LED, 15.6", 1920x1080 | Dell XPS 15 2018 i5 FHD 97Wh Sharp SHP149A LQ156M1, LED IGZO IPS InfinityEdge, 15.6", 1920x1080 | |
|---|---|---|---|---|---|
| Display | 1% | -4% | 4% | 69% | |
| Display P3 Coverage (%) | 38.37 | 38.66 1% | 37 -4% | 40.09 4% | 66 72% |
| sRGB Coverage (%) | 57.7 | 57.9 0% | 55.6 -4% | 59.7 3% | 96.5 67% |
| AdobeRGB 1998 Coverage (%) | 39.65 | 39.94 1% | 38.23 -4% | 41.47 5% | 66.7 68% |
| Response Times | -33% | -43% | 4% | -55% | |
| Response Time Grey 50% / Grey 80% * (ms) | 43.6 ? | 32 ? 27% | 41 ? 6% | 44 ? -1% | 49 ? -12% |
| Response Time Black / White * (ms) | 15.2 ? | 29.2 ? -92% | 29 ? -91% | 14 ? 8% | 30 ? -97% |
| PWM Frequency (Hz) | 25000 ? | 961 ? | |||
| Screen | 23% | 29% | -4% | 60% | |
| Brightness middle (cd/m²) | 220.1 | 240.1 9% | 251 14% | 234 6% | 413 88% |
| Brightness (cd/m²) | 210 | 233 11% | 240 14% | 211 0% | 378 80% |
| Brightness Distribution (%) | 93 | 91 -2% | 84 -10% | 83 -11% | 86 -8% |
| Black Level * (cd/m²) | 0.29 | 0.23 21% | 0.2 31% | 0.43 -48% | 0.29 -0% |
| Contrast (:1) | 759 | 1044 38% | 1255 65% | 544 -28% | 1424 88% |
| Colorchecker dE 2000 * | 11.4 | 4.25 63% | 5.25 54% | 11.27 1% | 2.44 79% |
| Colorchecker dE 2000 max. * | 25.96 | 17.84 31% | 10.04 61% | 18.03 31% | 4.46 83% |
| Colorchecker dE 2000 calibrated * | 4.09 | 4 2% | 2.48 39% | ||
| Greyscale dE 2000 * | 12 | 2.8 77% | 3.28 73% | 11.54 4% | 2.48 79% |
| Gamma | 2.09 105% | 2.3 96% | 2.15 102% | 2.09 105% | 2.43 91% |
| CCT | 12625 51% | 6503 100% | 6502 100% | 11607 56% | 7006 93% |
| Color Space (Percent of AdobeRGB 1998) (%) | 36.5 | 36.8 1% | 35 -4% | 38 4% | 62 70% |
| Color Space (Percent of sRGB) (%) | 57.5 | 57.8 1% | 55 -4% | 60 4% | 96 67% |
| Média Total (Programa/Configurações) | -3% /
12% | -6% /
13% | 1% /
-1% | 25% /
48% |
* ... menor é melhor
Exibir tempos de resposta
| ↔ Tempo de resposta preto para branco | ||
|---|---|---|
| 15.2 ms ... ascensão ↗ e queda ↘ combinadas | ↗ 10 ms ascensão | 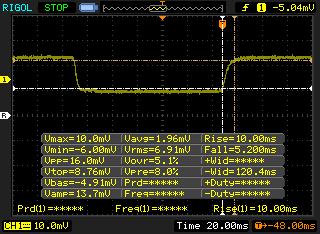 |
| ↘ 5.2 ms queda | ||
| A tela mostra boas taxas de resposta em nossos testes, mas pode ser muito lenta para jogadores competitivos. Em comparação, todos os dispositivos testados variam de 0.1 (mínimo) a 240 (máximo) ms. » 37 % de todos os dispositivos são melhores. Isso significa que o tempo de resposta medido é melhor que a média de todos os dispositivos testados (19.8 ms). | ||
| ↔ Tempo de resposta 50% cinza a 80% cinza | ||
| 43.6 ms ... ascensão ↗ e queda ↘ combinadas | ↗ 20 ms ascensão | 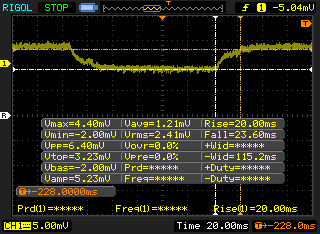 |
| ↘ 23.6 ms queda | ||
| A tela mostra taxas de resposta lentas em nossos testes e será insatisfatória para os jogadores. Em comparação, todos os dispositivos testados variam de 0.165 (mínimo) a 636 (máximo) ms. » 73 % de todos os dispositivos são melhores. Isso significa que o tempo de resposta medido é pior que a média de todos os dispositivos testados (31 ms). | ||
Cintilação da tela / PWM (modulação por largura de pulso)
| Tela tremeluzindo / PWM não detectado |  | ||
[pwm_comparison] Em comparação: 52 % de todos os dispositivos testados não usam PWM para escurecer a tela. Se PWM foi detectado, uma média de 7754 (mínimo: 5 - máximo: 343500) Hz foi medida. | |||
| Cinebench R11.5 | |
| CPU Single 64Bit | |
| HP Pavilion 15-cs0053cl | |
| Média Intel Core i5-8250U (0.91 - 1.79, n=35) | |
| HP Envy x360 15-bq102ng | |
| CPU Multi 64Bit | |
| HP Envy x360 15-bq102ng | |
| Média Intel Core i5-8250U (3.15 - 7.76, n=35) | |
| HP Pavilion 15-cs0053cl | |
| PCMark 10 - Score | |
| Asus VivoBook 15 X570UD | |
| HP Spectre x360 15-ch011nr | |
| Média Intel Core i5-8250U, Intel UHD Graphics 620 (3358 - 4081, n=67) | |
| HP Pavilion 15-cs0053cl | |
| Acer Aspire 3 A315-41-R7BM | |
| HP Envy x360 15m-bq121dx | |
| Dell Inspiron 15 5579-9672 | |
| PCMark 8 | |
| Home Score Accelerated v2 | |
| Asus VivoBook 15 X570UD | |
| HP Pavilion 15-cs0053cl | |
| Média Intel Core i5-8250U, Intel UHD Graphics 620 (2986 - 4458, n=69) | |
| HP Spectre x360 15-ch011nr | |
| Acer Aspire 3 A315-41-R7BM | |
| HP Envy x360 15m-bq121dx | |
| Dell Inspiron 15 5579-9672 | |
| Work Score Accelerated v2 | |
| HP Pavilion 15-cs0053cl | |
| Média Intel Core i5-8250U, Intel UHD Graphics 620 (2699 - 5106, n=58) | |
| Acer Aspire 3 A315-41-R7BM | |
| Dell Inspiron 15 5579-9672 | |
| HP Spectre x360 15-ch011nr | |
| PCMark 8 Home Score Accelerated v2 | 3675 pontos | |
| PCMark 8 Work Score Accelerated v2 | 4654 pontos | |
| PCMark 10 Score | 3250 pontos | |
Ajuda | ||
| HP Pavilion 15-cs0053cl Toshiba MQ04ABF100 | HP Envy x360 15m-bq121dx HGST Travelstar 7K1000 HTS721010A9E630 | Dell G3 15 3579 Seagate Mobile HDD 1TB ST1000LX015-1U7172 | Asus VivoBook 15 X570UD SK hynix PC300 HFS512GD9MND | Dell Inspiron 15 5579-9672 SK hynix SC311 SATA | |
|---|---|---|---|---|---|
| CrystalDiskMark 5.2 / 6 | -22% | -44% | 6194% | 3535% | |
| Write 4K (MB/s) | 3.885 | 1.168 -70% | 0.202 -95% | 95.9 2368% | 48.25 1142% |
| Read 4K (MB/s) | 0.426 | 0.536 26% | 0.461 8% | 31.32 7252% | 23.77 5480% |
| Write Seq (MB/s) | 121 | 114.1 -6% | 53.5 -56% | 746 517% | 444.9 268% |
| Read Seq (MB/s) | 142.6 | 114.9 -19% | 107.2 -25% | 1347 845% | 497.5 249% |
| Write 4K Q32T1 (MB/s) | 4.249 | 1.212 -71% | 0.882 -79% | 294.6 6833% | 223.5 5160% |
| Read 4K Q32T1 (MB/s) | 1.106 | 1.189 8% | 1.057 -4% | 334 30099% | 171.8 15433% |
| Write Seq Q32T1 (MB/s) | 134.3 | 113.2 -16% | 63.7 -53% | 766 470% | 511 280% |
| Read Seq Q32T1 (MB/s) | 149.8 | 114.1 -24% | 77.1 -49% | 1896 1166% | 553 269% |
| Write 4K Q8T8 (MB/s) | 310.2 | ||||
| Read 4K Q8T8 (MB/s) | 349.5 |

| 3DMark 11 Performance | 1840 pontos | |
| 3DMark Cloud Gate Standard Score | 7721 pontos | |
Ajuda | ||
| baixo | média | alto | ultra | |
|---|---|---|---|---|
| BioShock Infinite (2013) | 39.2 | 18.3 | 15.7 | |
| Metro: Last Light (2013) | 23.3 | 16.4 | ||
| Rise of the Tomb Raider (2016) | 10.4 | 6.5 |
Barulho
| Ocioso |
| 31.7 / 31.7 / 32 dB |
| Carga |
| 32.8 / 35 dB |
 | ||
30 dB silencioso 40 dB(A) audível 50 dB(A) ruidosamente alto |
||
min: | ||
| HP Pavilion 15-cs0053cl UHD Graphics 620, i5-8250U, Toshiba MQ04ABF100 | Asus VivoBook 15 X570UD GeForce GTX 1050 Mobile, i5-8550U, SK hynix PC300 HFS512GD9MND | Dell Inspiron 15 5579-9672 UHD Graphics 620, i5-8250U, SK hynix SC311 SATA | Acer Aspire 3 A315-41-R7BM Vega 3, R3 2200U, SK Hynix HFS256G39TND-N210A | LG Gram 15Z980-B.AA78B UHD Graphics 620, i5-8550U, SK Hynix Canvas SC300 512GB M.2 (HFS512G39TNF) | HP Envy x360 15m-bq121dx Vega 8, R5 2500U, HGST Travelstar 7K1000 HTS721010A9E630 | |
|---|---|---|---|---|---|---|
| Noise | -8% | 3% | -5% | 0% | -9% | |
| desligado / ambiente * (dB) | 28.2 | 29.2 -4% | 30.4 -8% | 30.3 -7% | 29.7 -5% | 28.5 -1% |
| Idle Minimum * (dB) | 31.7 | 29.3 8% | 30.4 4% | 30.3 4% | 30.3 4% | 32.3 -2% |
| Idle Average * (dB) | 31.7 | 29.5 7% | 30.4 4% | 30.3 4% | 30.3 4% | 32.4 -2% |
| Idle Maximum * (dB) | 32 | 30.5 5% | 31.2 2% | 30.9 3% | 31.1 3% | 34.2 -7% |
| Load Average * (dB) | 32.8 | 41.2 -26% | 31.5 4% | 37.8 -15% | 34.9 -6% | 36.2 -10% |
| Load Maximum * (dB) | 35 | 47.2 -35% | 31.5 10% | 40.6 -16% | 34.9 -0% | 45.3 -29% |
| Witcher 3 ultra * (dB) | 44 | 34.3 | 42.8 |
* ... menor é melhor
(+) A temperatura máxima no lado superior é 35.8 °C / 96 F, em comparação com a média de 36.8 °C / 98 F , variando de 21 a 71 °C para a classe Multimedia.
(±) A parte inferior aquece até um máximo de 41.4 °C / 107 F, em comparação com a média de 39.1 °C / 102 F
(+) Em uso inativo, a temperatura média para o lado superior é 24.4 °C / 76 F, em comparação com a média do dispositivo de 31.3 °C / ### class_avg_f### F.
(+) Os apoios para as mãos e o touchpad são mais frios que a temperatura da pele, com um máximo de 26.8 °C / 80.2 F e, portanto, são frios ao toque.
(±) A temperatura média da área do apoio para as mãos de dispositivos semelhantes foi 28.7 °C / 83.7 F (+1.9 °C / 3.5 F).
HP Pavilion 15-cs0053cl análise de áudio
(±) | o volume do alto-falante é médio, mas bom (###valor### dB)
Graves 100 - 315Hz
(-) | quase nenhum baixo - em média 19.7% menor que a mediana
(-) | graves não são lineares (15.7% delta para frequência anterior)
Médios 400 - 2.000 Hz
(+) | médios equilibrados - apenas 4.1% longe da mediana
(±) | a linearidade dos médios é média (7.9% delta para frequência anterior)
Altos 2 - 16 kHz
(+) | agudos equilibrados - apenas 2.1% longe da mediana
(±) | a linearidade dos máximos é média (7.3% delta para frequência anterior)
Geral 100 - 16.000 Hz
(±) | a linearidade do som geral é média (21.8% diferença em relação à mediana)
Comparado com a mesma classe
» 77% de todos os dispositivos testados nesta classe foram melhores, 5% semelhantes, 18% piores
» O melhor teve um delta de 5%, a média foi 17%, o pior foi 45%
Comparado com todos os dispositivos testados
» 62% de todos os dispositivos testados foram melhores, 7% semelhantes, 31% piores
» O melhor teve um delta de 4%, a média foi 23%, o pior foi 134%
Apple MacBook 12 (Early 2016) 1.1 GHz análise de áudio
(+) | os alto-falantes podem tocar relativamente alto (###valor### dB)
Graves 100 - 315Hz
(±) | graves reduzidos - em média 11.3% menor que a mediana
(±) | a linearidade dos graves é média (14.2% delta para a frequência anterior)
Médios 400 - 2.000 Hz
(+) | médios equilibrados - apenas 2.4% longe da mediana
(+) | médios são lineares (5.5% delta para frequência anterior)
Altos 2 - 16 kHz
(+) | agudos equilibrados - apenas 2% longe da mediana
(+) | os máximos são lineares (4.5% delta da frequência anterior)
Geral 100 - 16.000 Hz
(+) | o som geral é linear (10.2% diferença em relação à mediana)
Comparado com a mesma classe
» 7% de todos os dispositivos testados nesta classe foram melhores, 2% semelhantes, 90% piores
» O melhor teve um delta de 5%, a média foi 18%, o pior foi 53%
Comparado com todos os dispositivos testados
» 5% de todos os dispositivos testados foram melhores, 1% semelhantes, 94% piores
» O melhor teve um delta de 4%, a média foi 23%, o pior foi 134%
| desligado | |
| Ocioso | |
| Carga |
|
Key:
min: | |
| HP Pavilion 15-cs0053cl i5-8250U, UHD Graphics 620, Toshiba MQ04ABF100, TN LED, 1366x768, 15.6" | Asus VivoBook 15 X570UD i5-8550U, GeForce GTX 1050 Mobile, SK hynix PC300 HFS512GD9MND, IPS, 1920x1080, 15.6" | Dell Inspiron 15 5579-9672 i5-8250U, UHD Graphics 620, SK hynix SC311 SATA, IPS, 1920x1080, 15.6" | Acer Aspire 3 A315-41-R7BM R3 2200U, Vega 3, SK Hynix HFS256G39TND-N210A, TN LED, 1920x1080, 15.6" | HP Envy x360 15m-bq121dx R5 2500U, Vega 8, HGST Travelstar 7K1000 HTS721010A9E630, IPS, 1920x1080, 15.6" | LG Gram 15Z980-B.AA78B i5-8550U, UHD Graphics 620, SK Hynix Canvas SC300 512GB M.2 (HFS512G39TNF), IPS LED, 1920x1080, 15.6" | |
|---|---|---|---|---|---|---|
| Power Consumption | -80% | 4% | -19% | -32% | -17% | |
| Idle Minimum * (Watt) | 5.6 | 5.1 9% | 3.9 30% | 5.6 -0% | 5.9 -5% | 3.7 34% |
| Idle Average * (Watt) | 7.1 | 6.3 11% | 6.6 7% | 8.5 -20% | 8.7 -23% | 8.5 -20% |
| Idle Maximum * (Watt) | 7.9 | 10.5 -33% | 9.3 -18% | 8.4 -6% | 10.5 -33% | 10 -27% |
| Load Average * (Watt) | 32.8 | 82.2 -151% | 30.2 8% | 41 -25% | 45.7 -39% | 36 -10% |
| Load Maximum * (Watt) | 30.5 | 103.2 -238% | 33.2 -9% | 44.2 -45% | 49.4 -62% | 48.7 -60% |
| Witcher 3 ultra * (Watt) | 85.9 | 32 | 45.8 |
* ... menor é melhor
| HP Pavilion 15-cs0053cl i5-8250U, UHD Graphics 620, 41 Wh | Asus VivoBook 15 X570UD i5-8550U, GeForce GTX 1050 Mobile, 48 Wh | Dell Inspiron 15 5579-9672 i5-8250U, UHD Graphics 620, 42 Wh | Acer Aspire 3 A315-41-R7BM R3 2200U, Vega 3, 37 Wh | Dell XPS 15 9570 i7 UHD i7-8750H, GeForce GTX 1050 Ti Max-Q, 97 Wh | HP Envy x360 15m-bq121dx R5 2500U, Vega 8, 55.8 Wh | |
|---|---|---|---|---|---|---|
| Duração da bateria | -24% | -7% | -27% | -2% | -19% | |
| Reader / Idle (h) | 12 | 11.2 -7% | 8.9 -26% | 10.9 -9% | ||
| WiFi v1.3 (h) | 7 | 5.3 -24% | 7.3 4% | 5.7 -19% | 9.6 37% | 6.6 -6% |
| Load (h) | 2.2 | 1.8 -18% | 1.4 -36% | 1.3 -41% | 1.3 -41% | |
| Witcher 3 ultra (h) | 1 |
Pro
Contra
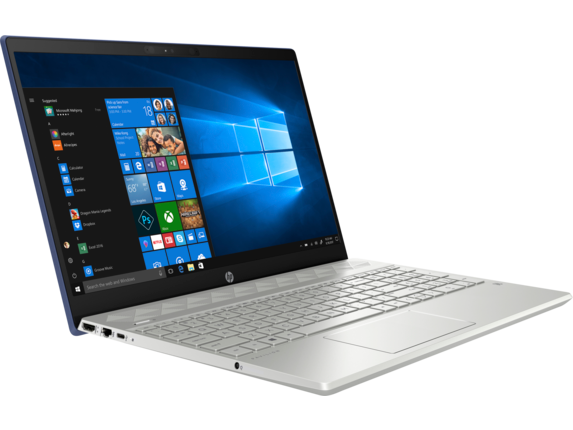
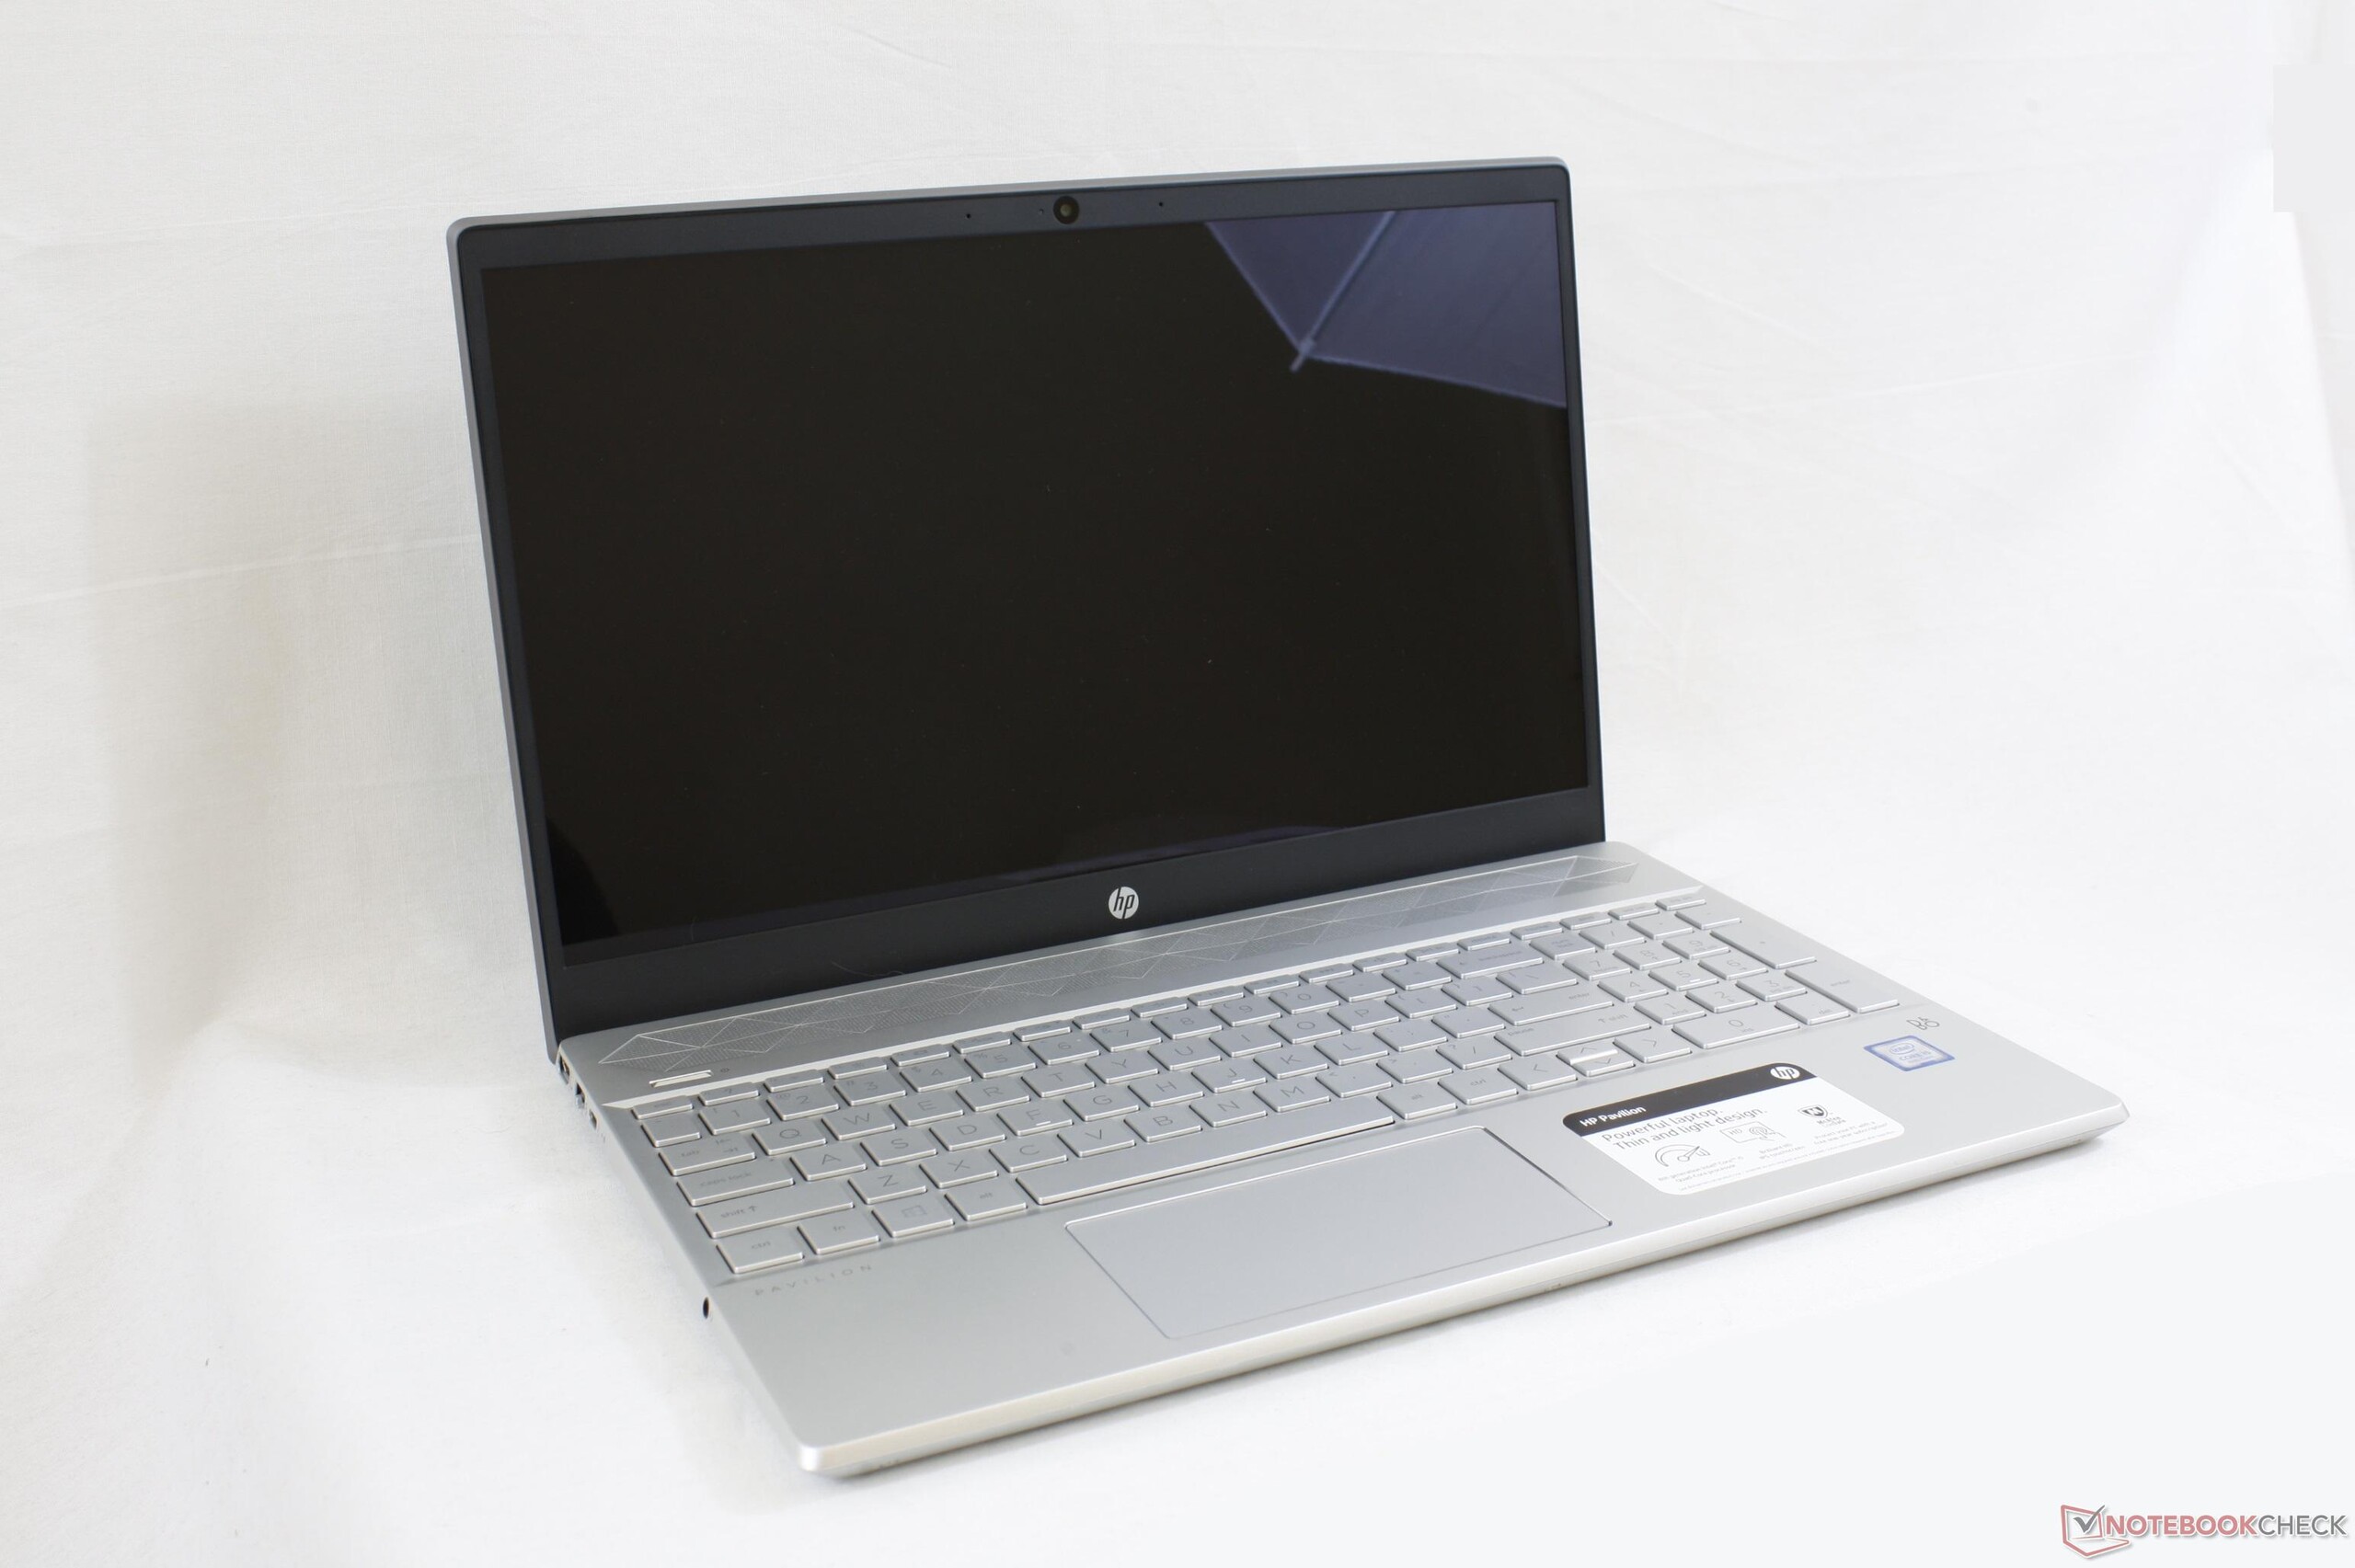
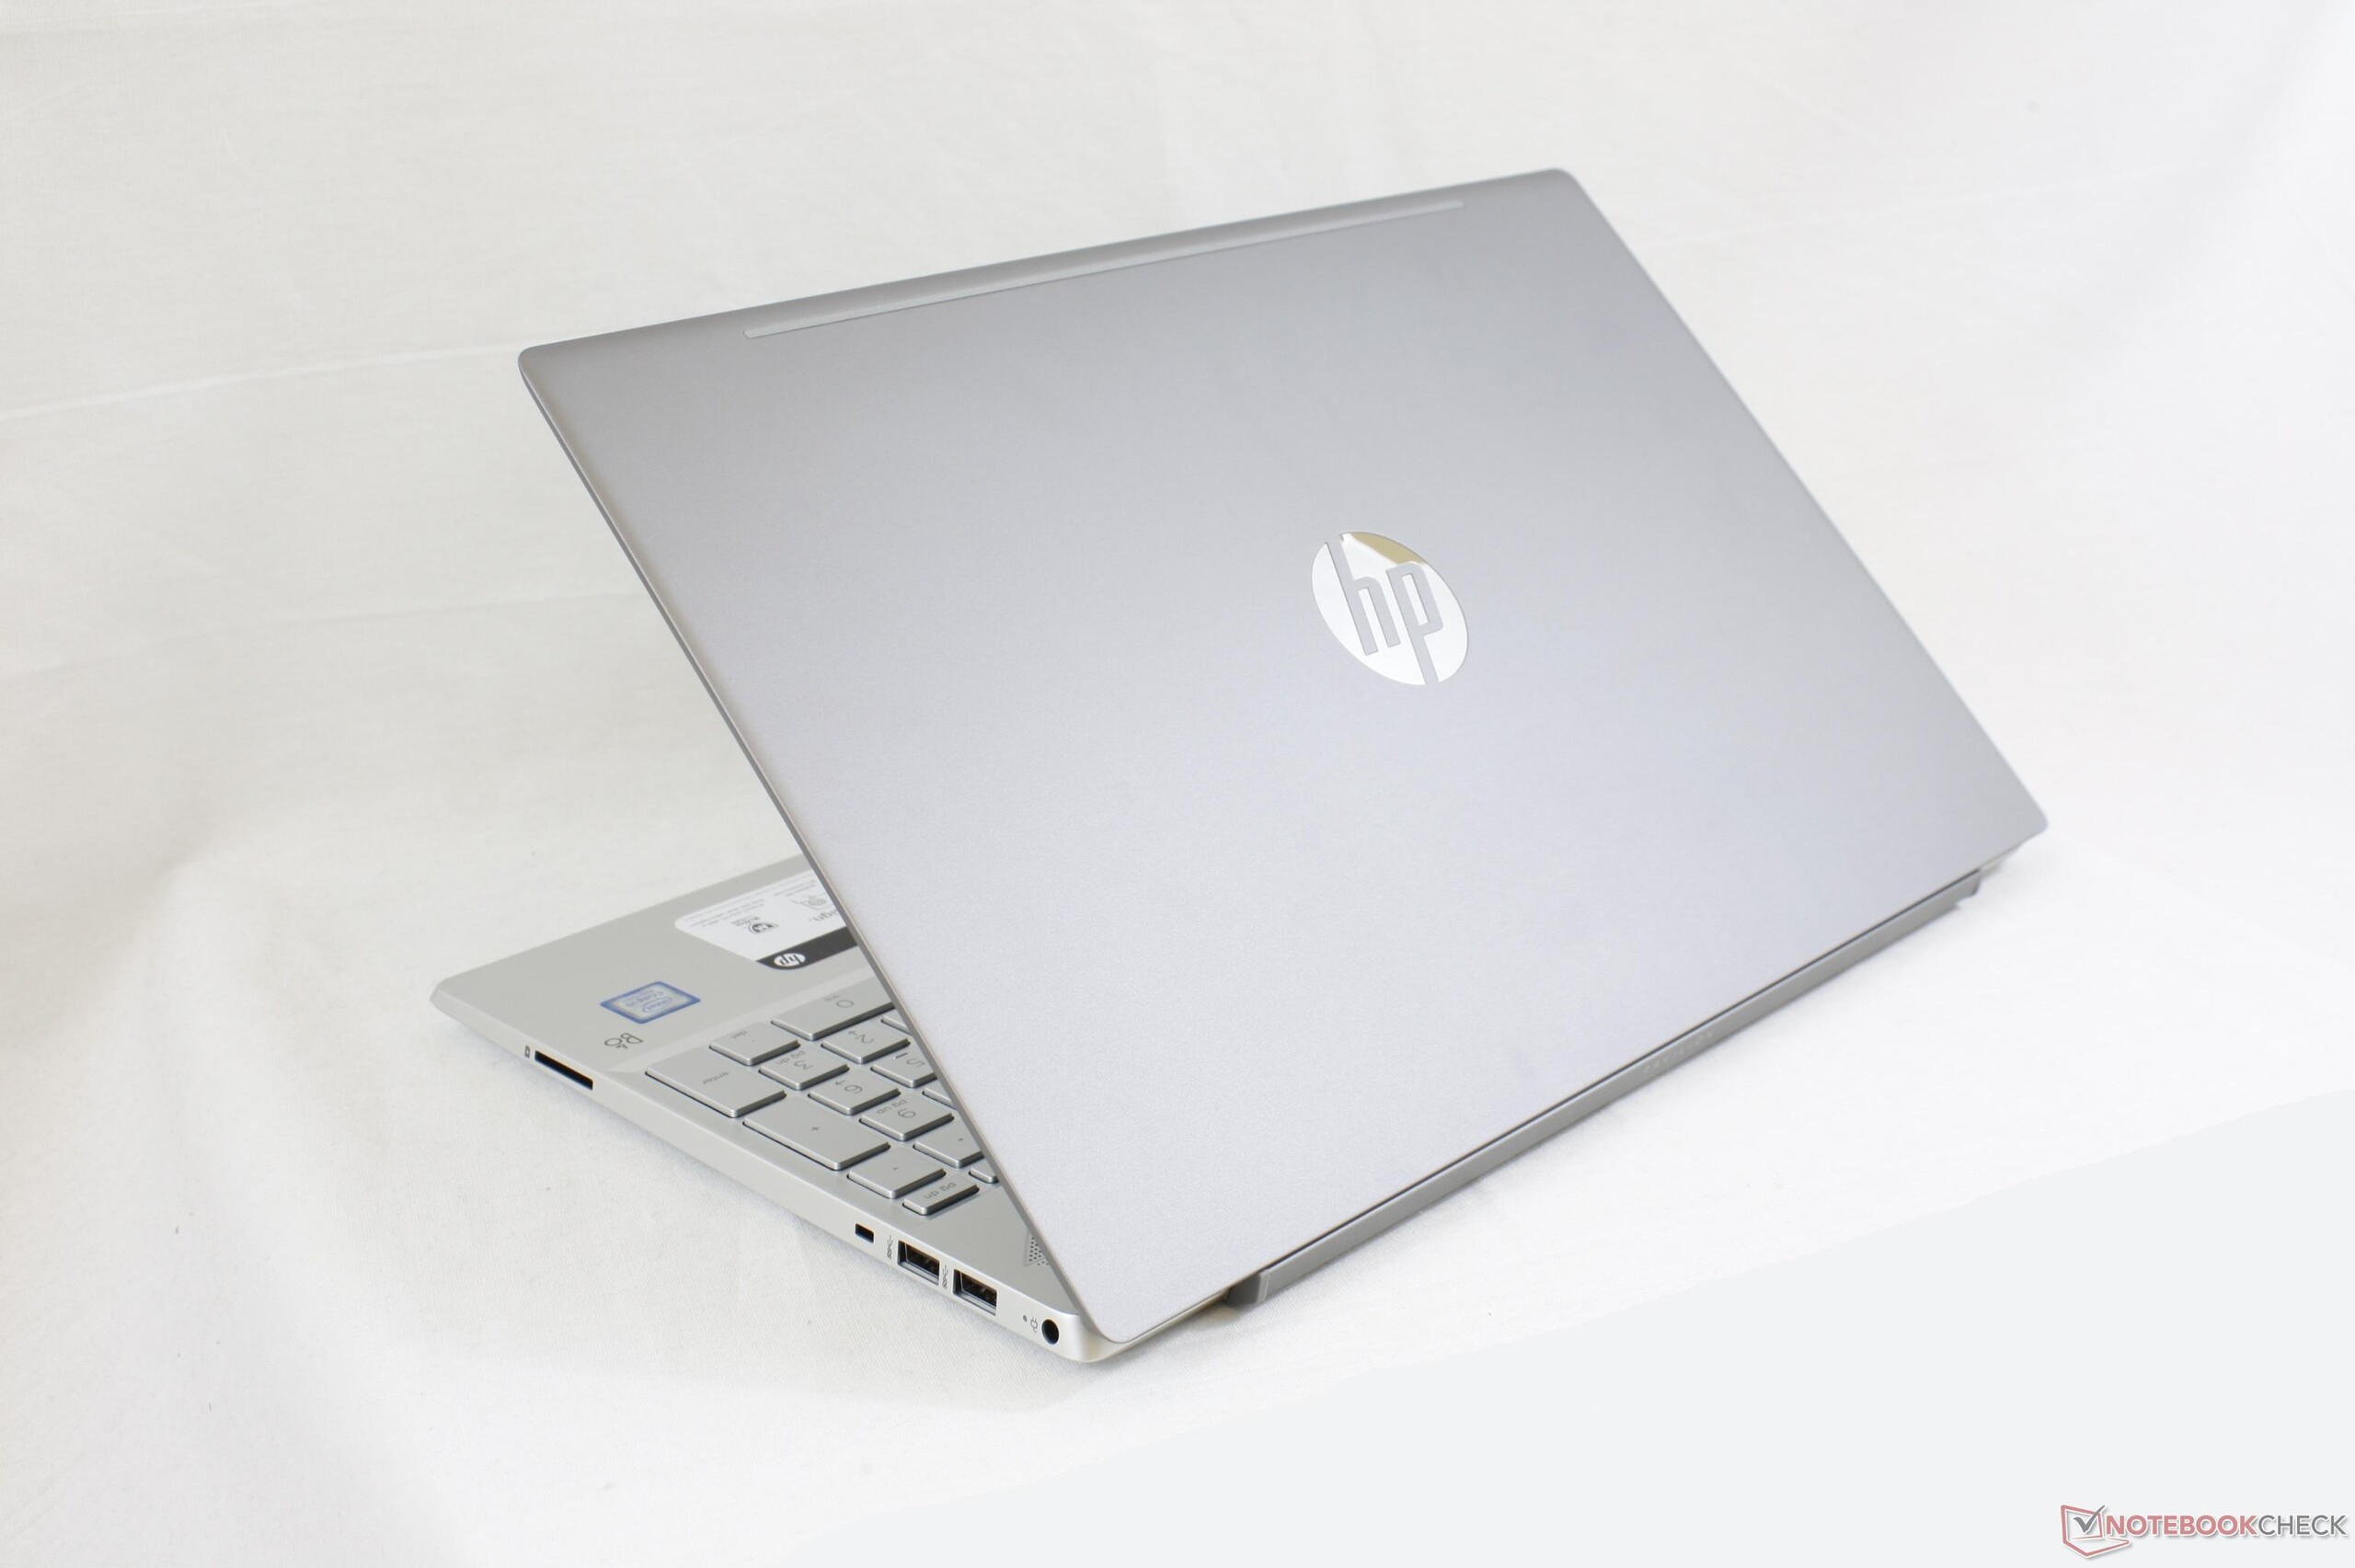
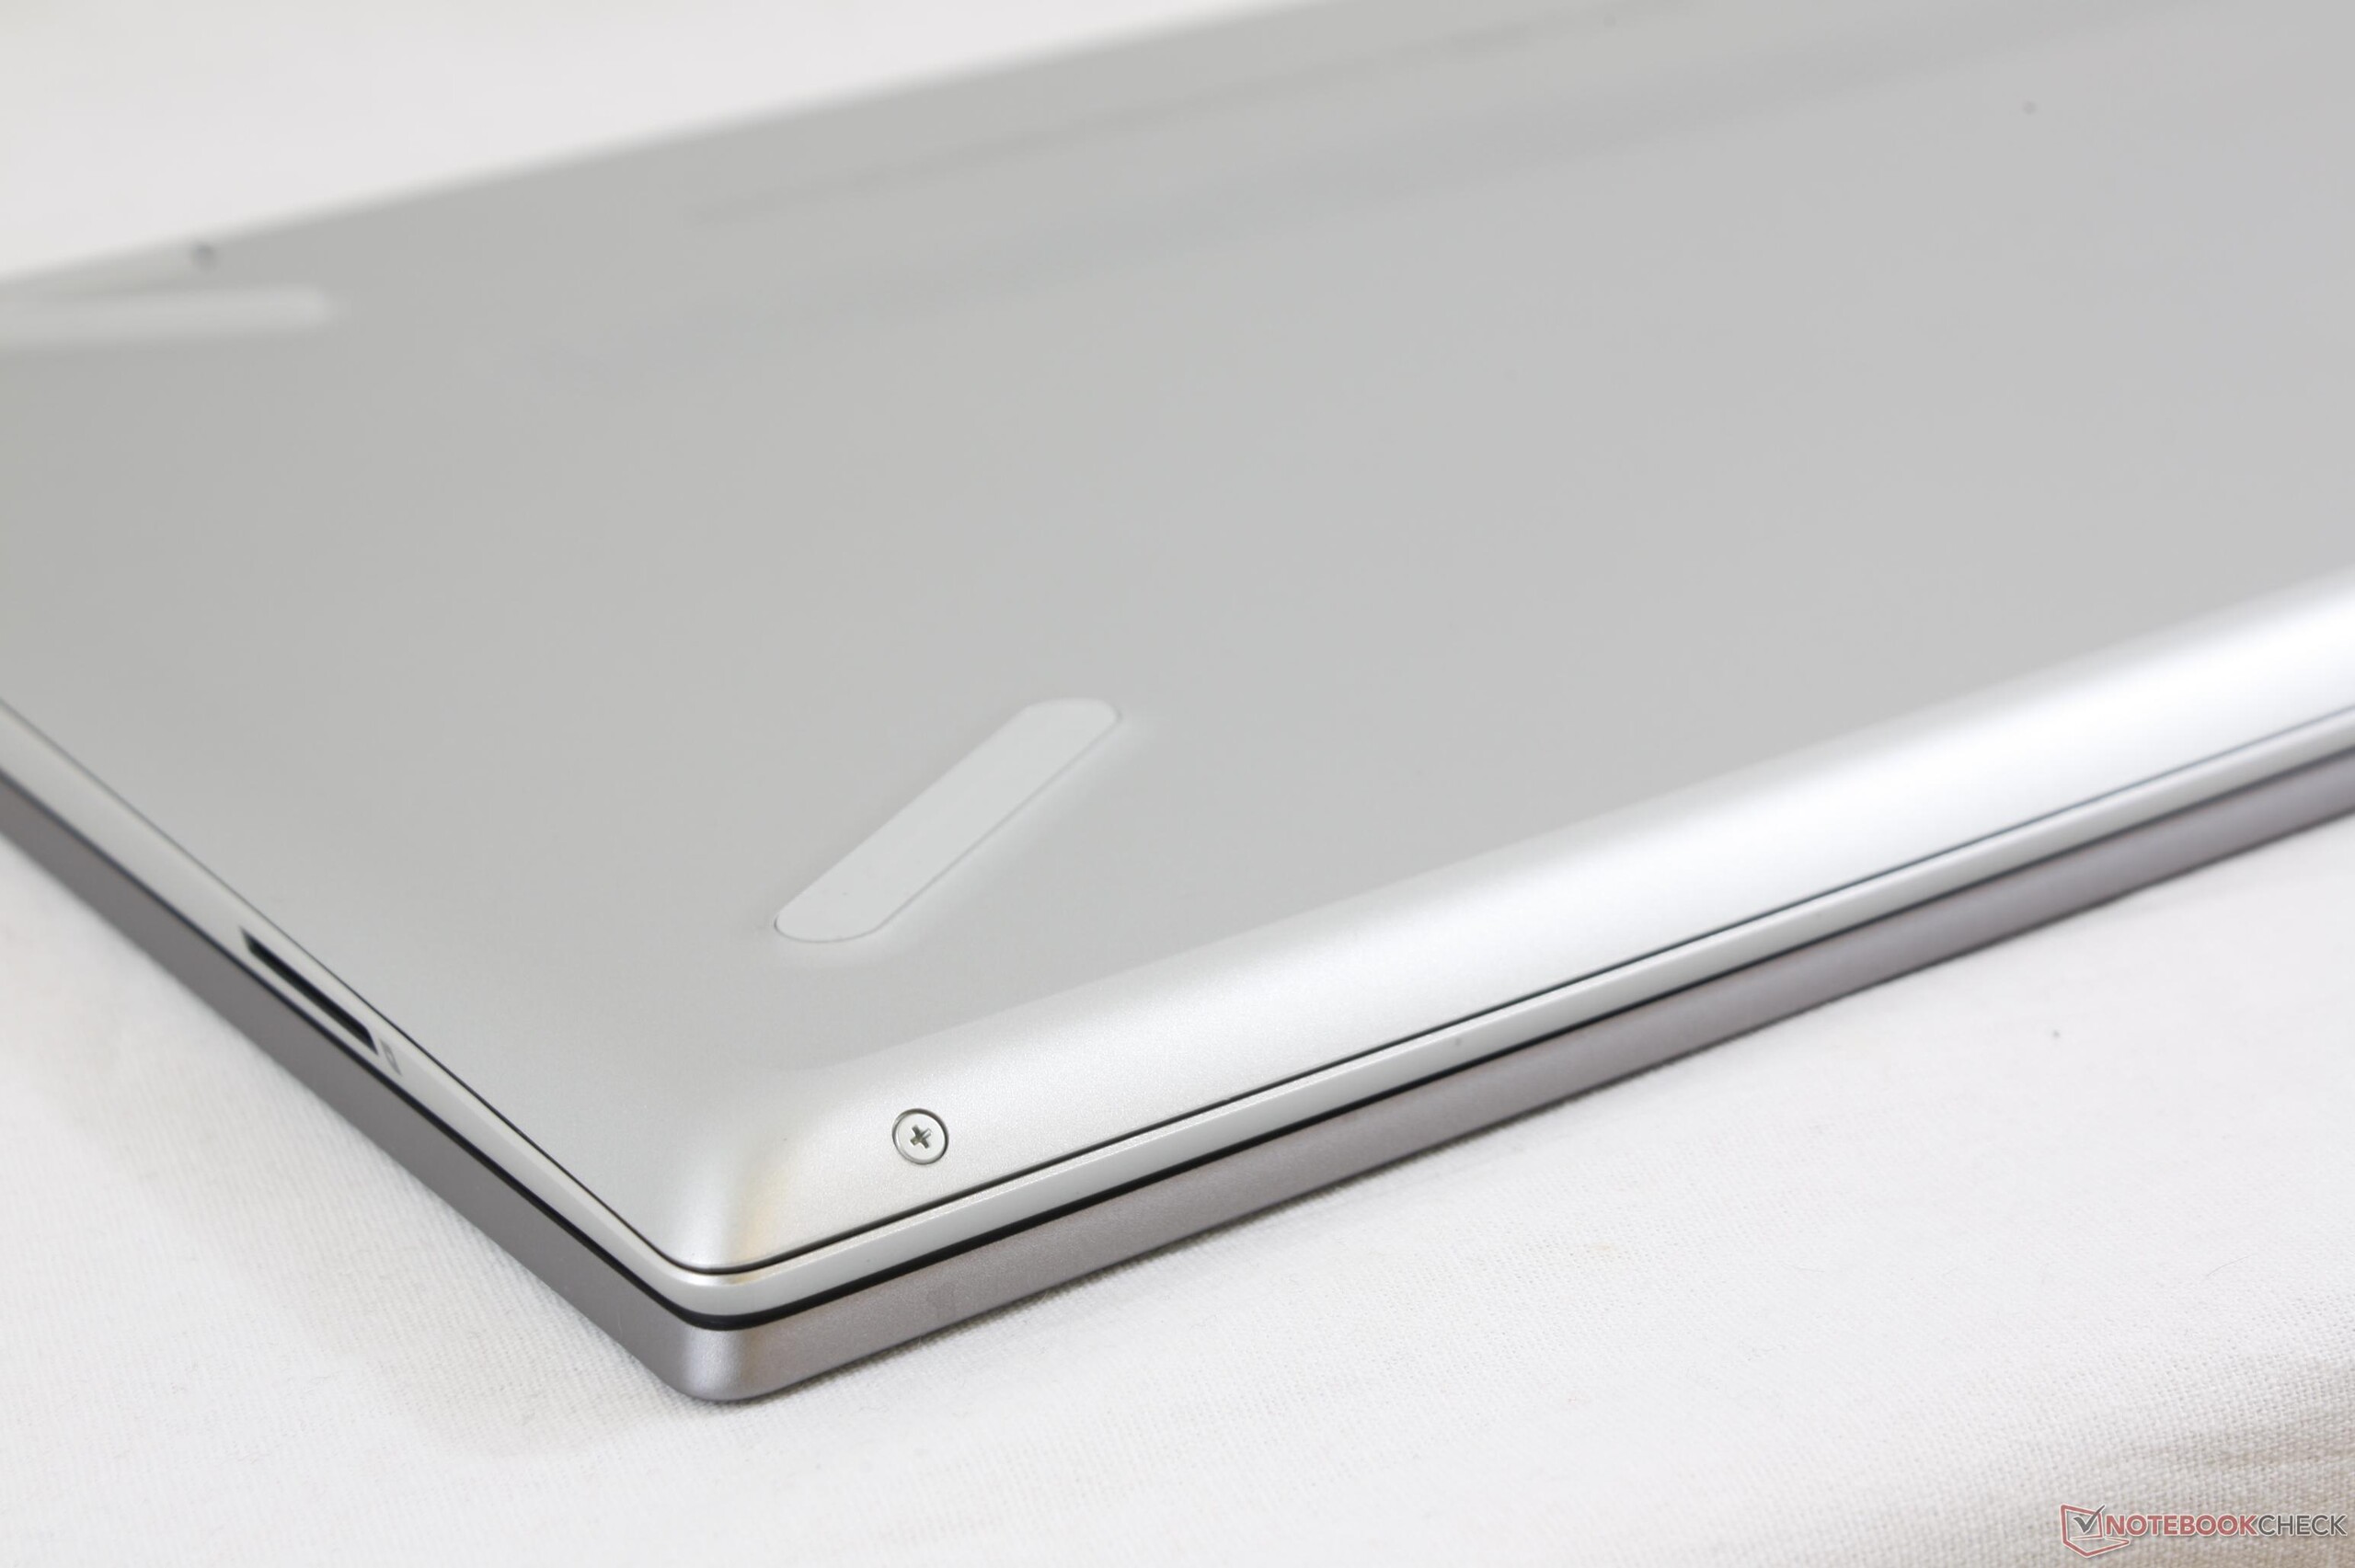
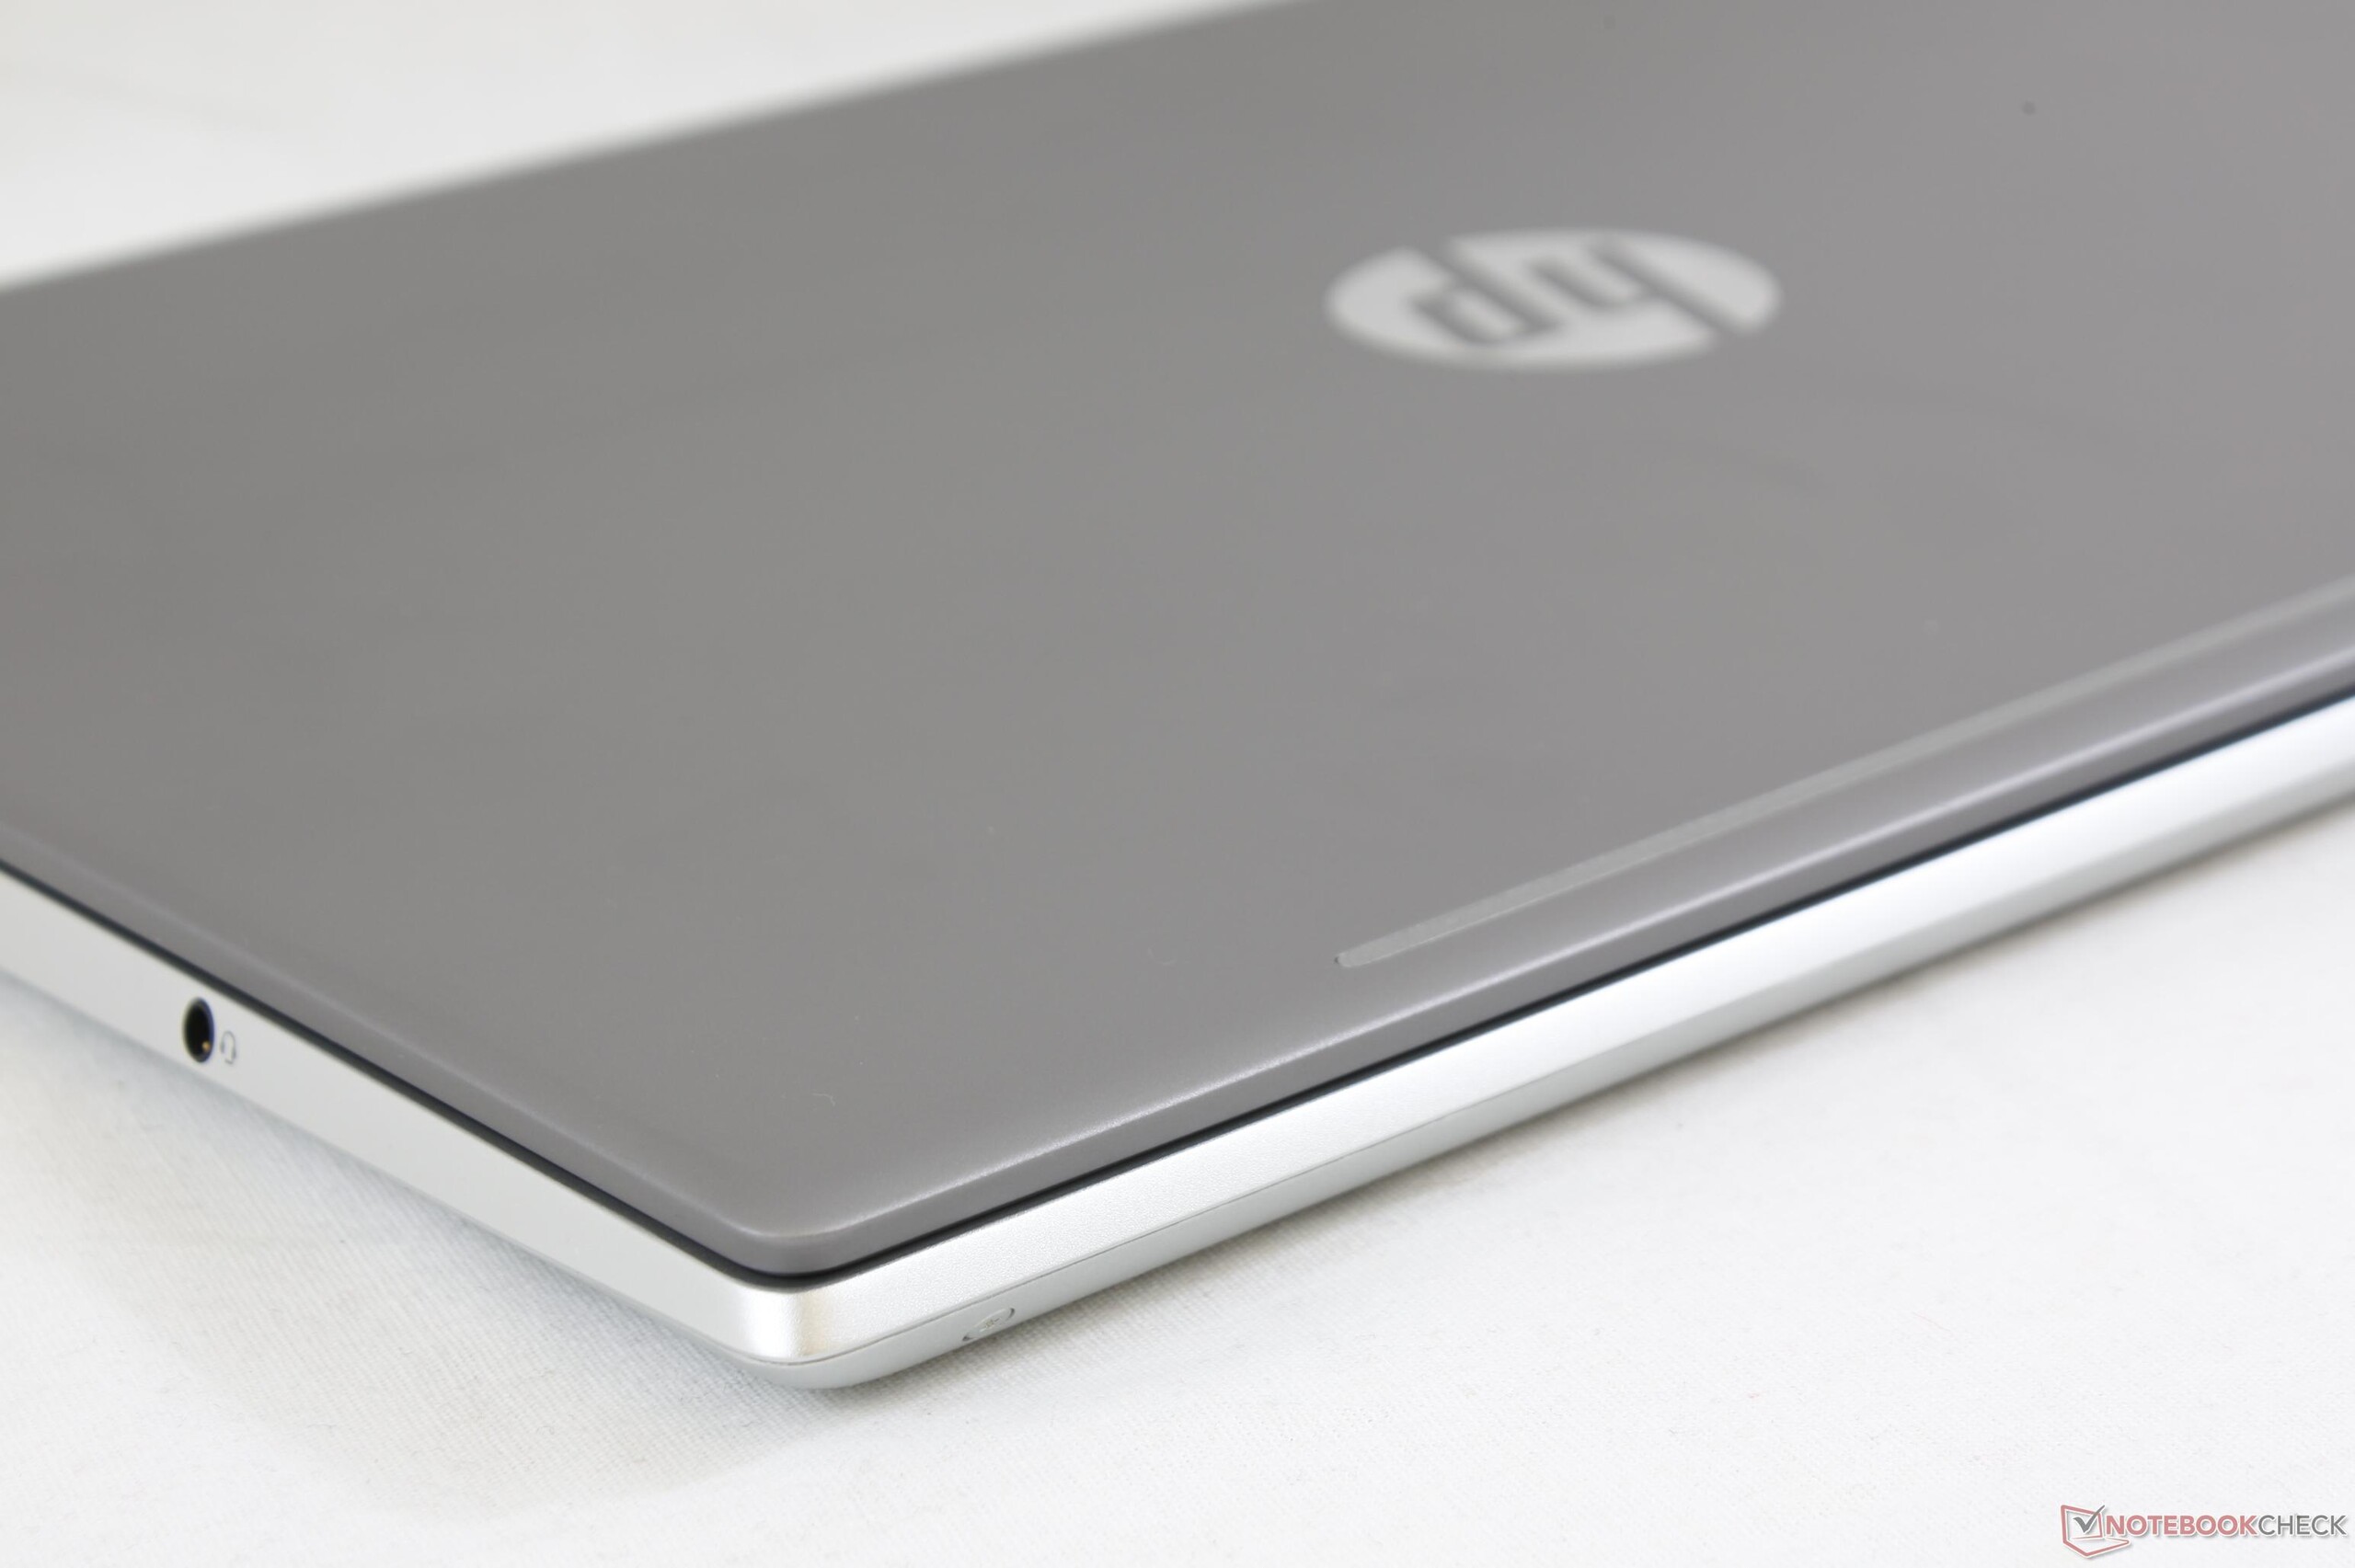
Um dos principais detratores dos anteriores portáteis Pavilion 15 foi o design orçamental pouco atrativo. Uma rápida olhada no antigo Pavilion 15 de 2015, em comparação com um MacBook Pro, mostra por que o Pavilion pode ser vendido por menos da metade do preço da Apple. A disparidade visual ainda existe entre o novo Pavilion 15 de 2018 e o mais recente da Apple, mas não é tão ruim quanto costumava ser. Para o público-alvo de estudantes e usuários mais jovens, a atualização visual notável poderia fazer com que o Pavilion fosse considerado.
Internamente, estamos impressionados com a sustentabilidade do Turbo Boost, baixas temperaturas do núcleo e um ventilador geralmente silencioso. Esses atributos não são tão comuns quanto gostaríamos, especialmente em Ultrabooks caros, onde o resfriamento fica em segundo plano em relação à espessura e ao peso.
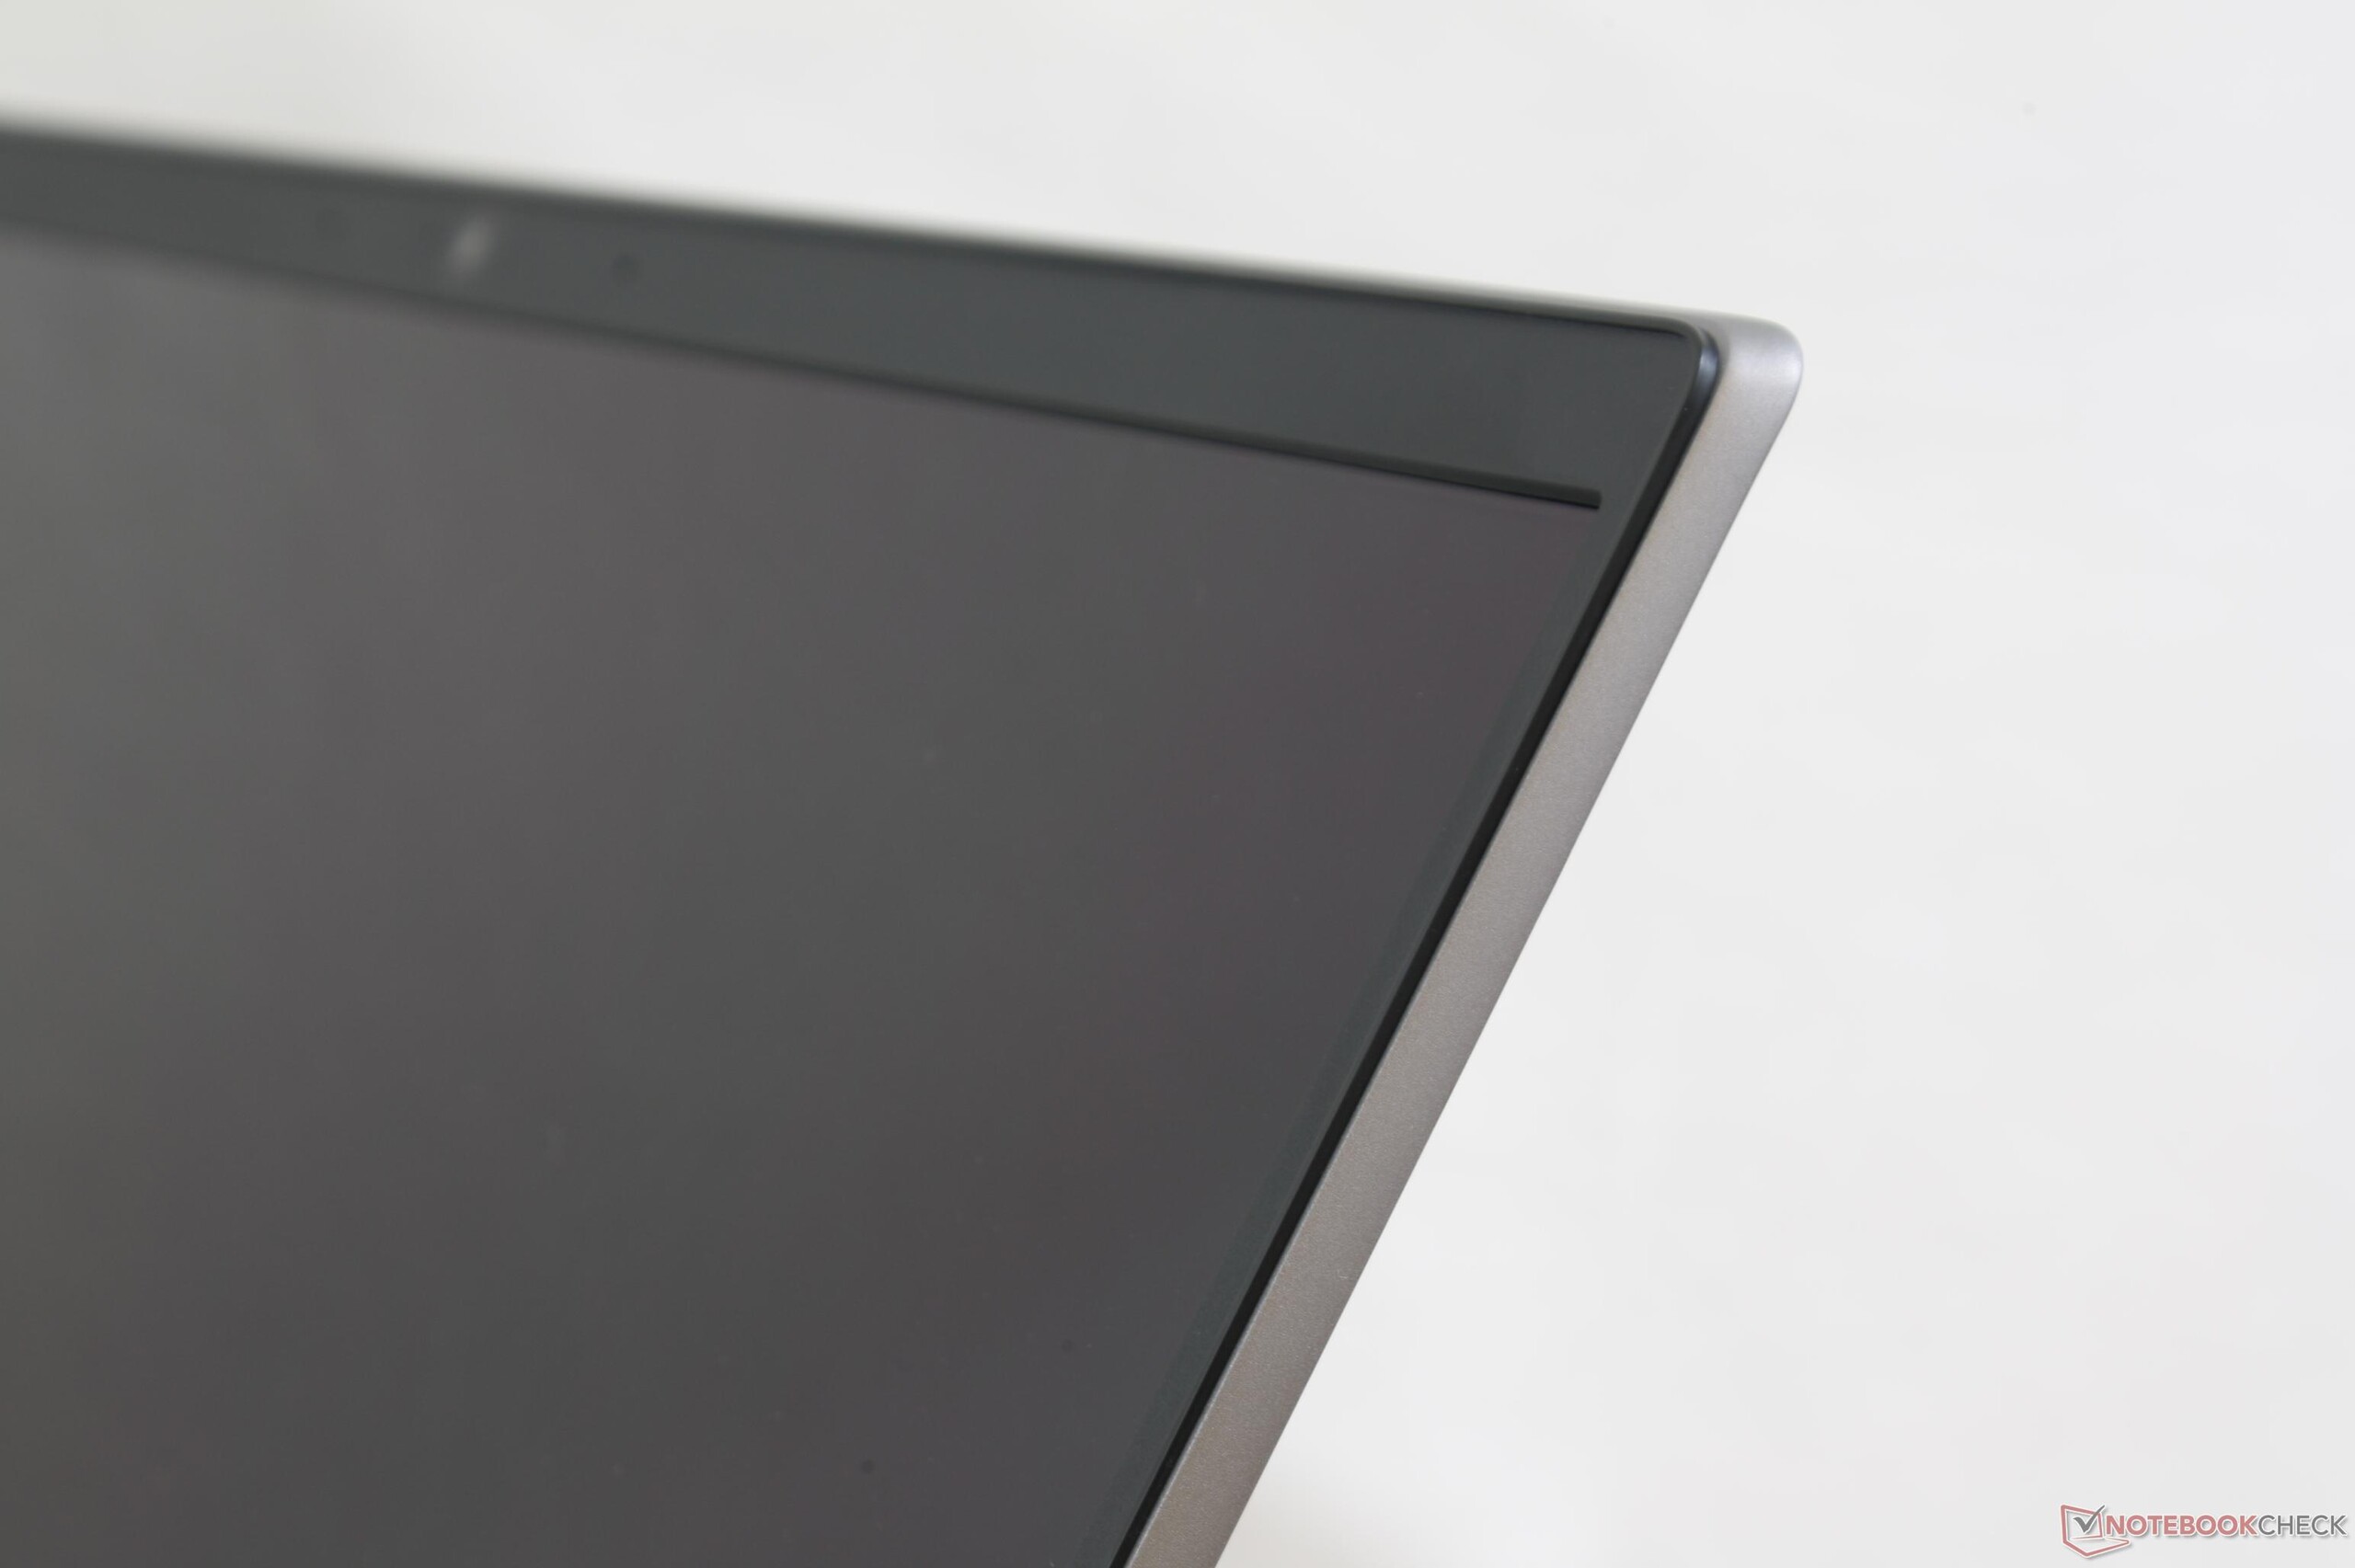
Os aspectos mais pobres do novo Pavilion são as teclas do teclado, os botões do trackpad e a tela oscilante. Essas desvantagens se combinam para fazer o Pavilion parecer um portátil barato, apesar do novo design visual.
Na faixa de gama baixa dos $600 a $700, o Pavilion 15 pode valer a pena procurar usuários com orçamentos apertados. Evite os SKUs mais caros a todo custo, dado que os portáteis Envy e Spectre seriam melhores investimentos.
HP Pavilion 15-cs0053cl
- 08/05/2018 v6 (old)
Allen Ngo
Price comparison
