Breve Análise do Portátil HP Pavilion 15z-bw000 (A10-9620P, HD)
| SD Card Reader | |
| average JPG Copy Test (av. of 3 runs) | |
| Lenovo ThinkPad E570-20H6S00000 | |
| Acer Aspire E15 E5-553G-109A | |
| HP 15-ba077ng | |
| HP Pavilion 15z-bw000 | |
| Asus X555DA-BB11 | |
| Dell Inspiron 15 5000 5567-1753 | |
| maximum AS SSD Seq Read Test (1GB) | |
| Acer Aspire E15 E5-553G-109A | |
| Lenovo ThinkPad E570-20H6S00000 | |
| HP 15-ba077ng | |
| HP Pavilion 15z-bw000 | |
| Dell Inspiron 15 5000 5567-1753 | |
| Asus X555DA-BB11 | |
| |||||||||||||||||||||||||
iluminação: 83 %
iluminação com acumulador: 251.3 cd/m²
Contraste: 524:1 (Preto: 0.48 cd/m²)
ΔE ColorChecker Calman: 9.9 | ∀{0.5-29.43 Ø4.71}
ΔE Greyscale Calman: 11.7 | ∀{0.09-98 Ø4.96}
56.8% sRGB (Argyll 1.6.3 3D)
39.17% AdobeRGB 1998 (Argyll 1.6.3 3D)
39.17% AdobeRGB 1998 (Argyll 3D)
56.8% sRGB (Argyll 3D)
37.92% Display P3 (Argyll 3D)
Gamma: 2.05
CCT: 11713 K
| HP Pavilion 15z-bw000 BOE06A4, TN LED, 15.6", 1366x768 | Asus X555DA-BB11 TN LED, 15.6", 1920x1080 | Dell Inspiron 15 5000 5567-1753 BOE NT15N41, TN LED, 15.6", 1920x1080 | Acer Aspire E15 E5-553G-109A Chi Mei CMN15C4 / N156HGE-EAB, TN LED, 15.6", 1920x1080 | Lenovo ThinkPad E570-20H6S00000 AUO B156HAN04.4, IPS LED, 15.6", 1920x1080 | Lenovo Ideapad 110-15ACL 15.6", 1366x768 | |
|---|---|---|---|---|---|---|
| Display | -7% | -4% | 5% | 2% | -1% | |
| Display P3 Coverage (%) | 37.92 | 35.12 -7% | 36.24 -4% | 39.72 5% | 38.65 2% | 37.39 -1% |
| sRGB Coverage (%) | 56.8 | 52.7 -7% | 54.6 -4% | 59.2 4% | 58 2% | 56.2 -1% |
| AdobeRGB 1998 Coverage (%) | 39.17 | 36.29 -7% | 37.44 -4% | 41.07 5% | 39.94 2% | 38.63 -1% |
| Response Times | -2% | 17% | 16% | -12% | -22% | |
| Response Time Grey 50% / Grey 80% * (ms) | 41.6 ? | 42 ? -1% | 43 ? -3% | 42.4 ? -2% | 44.8 ? -8% | 58 ? -39% |
| Response Time Black / White * (ms) | 22 ? | 22.4 ? -2% | 14 ? 36% | 14.6 ? 34% | 25.6 ? -16% | 23 ? -5% |
| PWM Frequency (Hz) | 198.4 ? | 28740 | 200 ? | |||
| Screen | 10% | -11% | -2% | 31% | 6% | |
| Brightness middle (cd/m²) | 251.3 | 242.7 -3% | 145 -42% | 224 -11% | 242 -4% | 253 1% |
| Brightness (cd/m²) | 243 | 232 -5% | 144 -41% | 201 -17% | 243 0% | 246 1% |
| Brightness Distribution (%) | 83 | 88 6% | 90 8% | 75 -10% | 75 -10% | 86 4% |
| Black Level * (cd/m²) | 0.48 | 0.52 -8% | 0.49 -2% | 0.46 4% | 0.24 50% | 0.43 10% |
| Contrast (:1) | 524 | 467 -11% | 296 -44% | 487 -7% | 1008 92% | 588 12% |
| Colorchecker dE 2000 * | 9.9 | 4.9 51% | 9.27 6% | 10.5 -6% | 4.65 53% | |
| Colorchecker dE 2000 max. * | 22.9 | 20.3 11% | 16.9 26% | 16.8 27% | 9.64 58% | |
| Greyscale dE 2000 * | 11.7 | 2.7 77% | 12.28 -5% | 11.23 4% | 3.39 71% | |
| Gamma | 2.05 107% | 2.34 94% | 2.03 108% | 2.12 104% | 2.7 81% | |
| CCT | 11713 55% | 6876 95% | 10732 61% | 11096 59% | 6246 104% | |
| Color Space (Percent of AdobeRGB 1998) (%) | 39.17 | 33.5 -14% | 35 -11% | 38 -3% | 36.69 -6% | |
| Color Space (Percent of sRGB) (%) | 56.8 | 52.5 -8% | 55 -3% | 59 4% | 57.66 2% | |
| Média Total (Programa/Configurações) | 0% /
5% | 1% /
-6% | 6% /
2% | 7% /
19% | -6% /
-2% |
* ... menor é melhor
Exibir tempos de resposta
| ↔ Tempo de resposta preto para branco | ||
|---|---|---|
| 22 ms ... ascensão ↗ e queda ↘ combinadas | ↗ 16 ms ascensão | 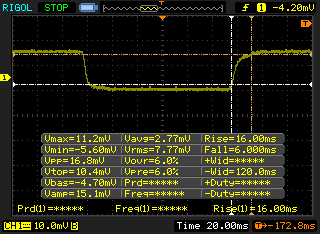 |
| ↘ 6 ms queda | ||
| A tela mostra boas taxas de resposta em nossos testes, mas pode ser muito lenta para jogadores competitivos. Em comparação, todos os dispositivos testados variam de 0.1 (mínimo) a 240 (máximo) ms. » 49 % de todos os dispositivos são melhores. Isso significa que o tempo de resposta medido é pior que a média de todos os dispositivos testados (19.8 ms). | ||
| ↔ Tempo de resposta 50% cinza a 80% cinza | ||
| 41.6 ms ... ascensão ↗ e queda ↘ combinadas | ↗ 14.8 ms ascensão | 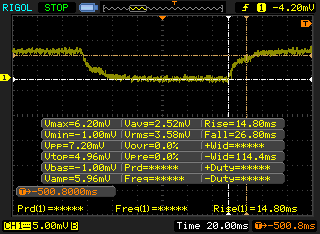 |
| ↘ 26.8 ms queda | ||
| A tela mostra taxas de resposta lentas em nossos testes e será insatisfatória para os jogadores. Em comparação, todos os dispositivos testados variam de 0.165 (mínimo) a 636 (máximo) ms. » 67 % de todos os dispositivos são melhores. Isso significa que o tempo de resposta medido é pior que a média de todos os dispositivos testados (31 ms). | ||
Cintilação da tela / PWM (modulação por largura de pulso)
| Tela tremeluzindo/PWM detectado | 198.4 Hz | ≤ 99 % configuração de brilho | 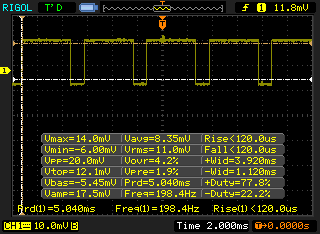 |
A luz de fundo da tela pisca em 198.4 Hz (pior caso, por exemplo, utilizando PWM) Cintilação detectada em uma configuração de brilho de 99 % e abaixo. Não deve haver cintilação ou PWM acima desta configuração de brilho. A frequência de 198.4 Hz é relativamente baixa, portanto, usuários sensíveis provavelmente notarão cintilação e sentirão fadiga ocular na configuração de brilho indicada e abaixo. [pwm_comparison] Em comparação: 52 % de todos os dispositivos testados não usam PWM para escurecer a tela. Se PWM foi detectado, uma média de 7754 (mínimo: 5 - máximo: 343500) Hz foi medida. | |||
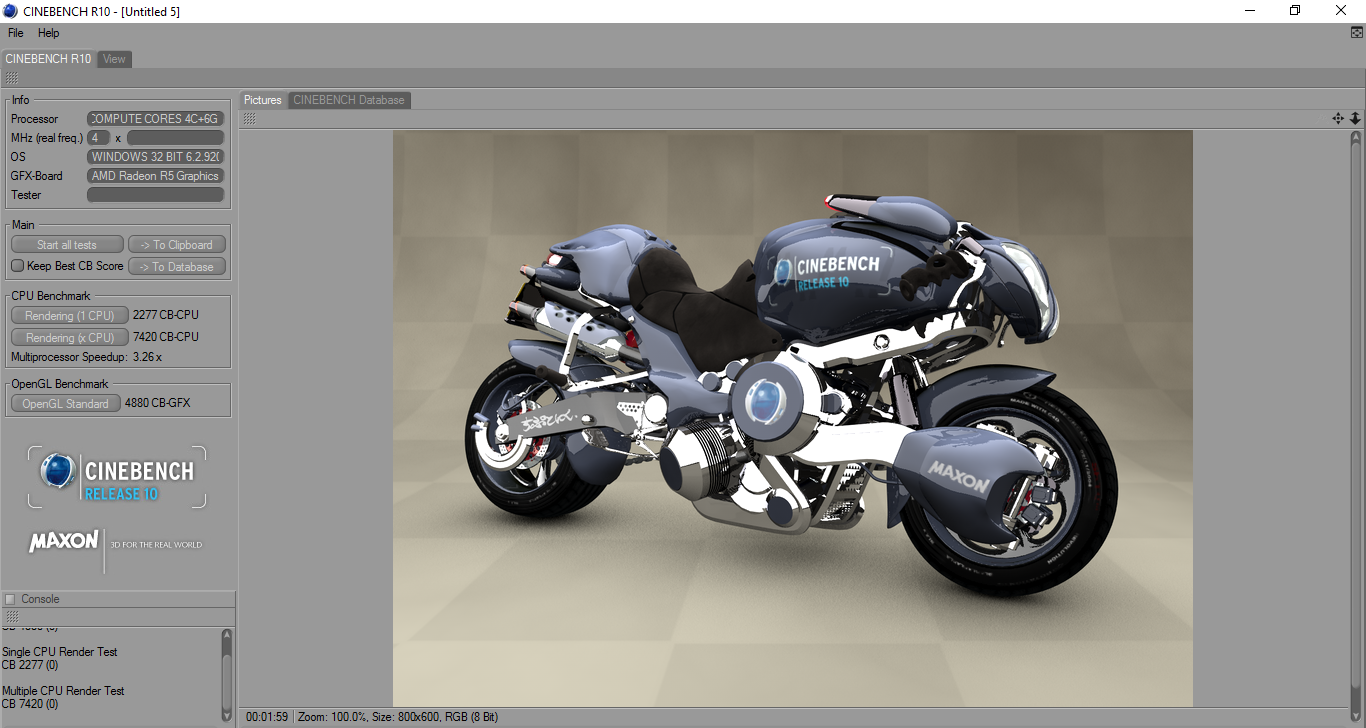
| Cinebench R10 | |
| Rendering Multiple CPUs 32Bit | |
| Dell Inspiron 15 5000 5567-1753 | |
| HP Pavilion 15z-bw000 | |
| HP 15-ba077ng | |
| Acer Aspire E15 E5-553G-109A | |
| Asus X555DA-BB11 | |
| Rendering Single 32Bit | |
| Dell Inspiron 15 5000 5567-1753 | |
| HP 15-ba077ng | |
| HP Pavilion 15z-bw000 | |
| Acer Aspire E15 E5-553G-109A | |
| Asus X555DA-BB11 | |
| wPrime 2.10 - 1024m | |
| Asus X555DA-BB11 | |
| HP Pavilion 15z-bw000 | |
* ... menor é melhor
| PCMark 8 Home Score Accelerated v2 | 2624 pontos | |
| PCMark 8 Creative Score Accelerated v2 | 3075 pontos | |
| PCMark 8 Work Score Accelerated v2 | 3669 pontos | |
| PCMark 10 Score | 2080 pontos | |
Ajuda | ||
| HP Pavilion 15z-bw000 Avolusion MD1TBLSSHD | Asus X555DA-BB11 Seagate Momentus SpinPoint M8 ST1000LM024 HN-M101MBB | Dell Inspiron 15 5000 5567-1753 SanDisk X400 SED 256GB, SATA (SD8TB8U-256G) | HP 15-ba077ng SanDisk Z400s SD8SNAT-256G | Acer Aspire E15 E5-553G-109A Liteonit CV3-8D128 | Lenovo ThinkPad E570-20H6S00000 Toshiba THNSF5256GPUK | |
|---|---|---|---|---|---|---|
| CrystalDiskMark 3.0 | -26% | 6943% | 4243% | 4443% | 11273% | |
| Read Seq (MB/s) | 109.6 | 106.9 -2% | 502 358% | 447.4 308% | 348.6 218% | 1140 940% |
| Write Seq (MB/s) | 104.6 | 97.5 -7% | 458.1 338% | 243.3 133% | 311.8 198% | 468.1 348% |
| Read 512 (MB/s) | 36.88 | 32.28 -12% | 382.8 938% | 333.4 804% | 295.9 702% | 759 1958% |
| Write 512 (MB/s) | 56.3 | 35.39 -37% | 385.7 585% | 283.1 403% | 185.8 230% | 414 635% |
| Read 4k (MB/s) | 0.436 | 0.373 -14% | 29.25 6609% | 20.99 4714% | 23.76 5350% | 34.3 7767% |
| Write 4k (MB/s) | 1.212 | 0.636 -48% | 55.9 4512% | 62.7 5073% | 44.94 3608% | 123.4 10082% |
| Read 4k QD32 (MB/s) | 1.234 | 0.694 -44% | 285.2 23012% | 143.1 11496% | 171.6 13806% | 530 42850% |
| Write 4k QD32 (MB/s) | 1.242 | 0.682 -45% | 239.6 19191% | 138 11011% | 143.2 11430% | 319.2 25600% |

| 3DMark | |
| 1280x720 Cloud Gate Standard Graphics | |
| Lenovo ThinkPad E570-20H6S00000 | |
| Acer Aspire E15 E5-553G-109A | |
| Dell Inspiron 15 5000 5567-1753 | |
| HP Pavilion 15z-bw000 | |
| Asus X555DA-BB11 | |
| 1920x1080 Fire Strike Graphics | |
| Lenovo ThinkPad E570-20H6S00000 | |
| Acer Aspire E15 E5-553G-109A | |
| Dell Inspiron 15 5000 5567-1753 | |
| HP Pavilion 15z-bw000 | |
| Asus X555DA-BB11 | |
| 1920x1080 Ice Storm Extreme Graphics | |
| Dell Inspiron 15 5000 5567-1753 | |
| HP Pavilion 15z-bw000 | |
| Asus X555DA-BB11 | |
| 3DMark 11 Performance | 1686 pontos | |
| 3DMark Ice Storm Standard Score | 37793 pontos | |
| 3DMark Cloud Gate Standard Score | 4365 pontos | |
| 3DMark Fire Strike Score | 898 pontos | |
| 3DMark Fire Strike Extreme Score | 464 pontos | |
Ajuda | ||
| BioShock Infinite | |
| 1280x720 Very Low Preset (classificar por valor) | |
| HP Pavilion 15z-bw000 | |
| Asus X555DA-BB11 | |
| Dell Inspiron 15 5000 5567-1753 | |
| HP 15-ba077ng | |
| Lenovo ThinkPad E570-20H6S00000 | |
| Acer Aspire E5-774-54HJ | |
| 1366x768 Medium Preset (classificar por valor) | |
| HP Pavilion 15z-bw000 | |
| Dell Inspiron 15 5000 5567-1753 | |
| HP 15-ba077ng | |
| Lenovo ThinkPad E570-20H6S00000 | |
| Acer Aspire E5-774-54HJ | |
| 1366x768 High Preset (classificar por valor) | |
| HP Pavilion 15z-bw000 | |
| Dell Inspiron 15 5000 5567-1753 | |
| HP 15-ba077ng | |
| Lenovo ThinkPad E570-20H6S00000 | |
| Acer Aspire E5-774-54HJ | |
| baixo | média | alto | ultra | |
|---|---|---|---|---|
| Tomb Raider (2013) | 51.8 | 29.1 | 21.3 | |
| BioShock Infinite (2013) | 45.9 | 28.7 | 21.8 | |
| Rise of the Tomb Raider (2016) | 19 | 12.2 |
Barulho
| Ocioso |
| 31 / 31.2 / 31.3 dB |
| Carga |
| 34.4 / 38.9 dB |
 | ||
30 dB silencioso 40 dB(A) audível 50 dB(A) ruidosamente alto |
||
min: | ||
| HP Pavilion 15z-bw000 Radeon R5 (Carrizo), A10-9620P, Avolusion MD1TBLSSHD | Asus X555DA-BB11 Radeon R6 (Carrizo), A10-8700P, Seagate Momentus SpinPoint M8 ST1000LM024 HN-M101MBB | Dell Inspiron 15 5000 5567-1753 Radeon R7 M445, i7-7500U, SanDisk X400 SED 256GB, SATA (SD8TB8U-256G) | HP 15-ba077ng Radeon R7 (Bristol Ridge), A12-9700P, SanDisk Z400s SD8SNAT-256G | Acer Aspire E15 E5-553G-109A Radeon R8 M445DX, A12-9700P, Liteonit CV3-8D128 | Lenovo ThinkPad E570-20H6S00000 GeForce GTX 950M, i5-7200U, Toshiba THNSF5256GPUK | Lenovo Ideapad 110-15ACL Radeon R5 (Beema/Carrizo-L), A8-7410 | Acer Aspire E5-774-54HJ HD Graphics 620, i5-7200U, Western Digital Scorpio Blue WD5000LPCX-24C6HT0 | Apple MacBook 12 (Early 2016) 1.1 GHz HD Graphics 515, 6Y30, Apple SSD AP0256 | |
|---|---|---|---|---|---|---|---|---|---|
| Noise | 0% | -5% | 2% | 1% | 3% | 4% | 3% | ||
| desligado / ambiente * (dB) | 28.3 | 28.9 -2% | 30.6 -8% | 30.6 -8% | 30.5 -8% | 29 -2% | 30.4 -7% | 30.5 -8% | |
| Idle Minimum * (dB) | 31 | 31.6 -2% | 30.6 1% | 31.5 -2% | 31.4 -1% | 29 6% | 30.9 -0% | 30.8 1% | |
| Idle Average * (dB) | 31.2 | 32 -3% | 30.6 2% | 31.8 -2% | 31.4 -1% | 29 7% | 30.9 1% | 30.8 1% | |
| Idle Maximum * (dB) | 31.3 | 32.4 -4% | 30.6 2% | 31.8 -2% | 31.9 -2% | 29 7% | 31 1% | 30.8 2% | |
| Load Average * (dB) | 34.4 | 33.3 3% | 41.9 -22% | 31.4 9% | 33.7 2% | 34.3 -0% | 31.8 8% | 32.1 7% | |
| Load Maximum * (dB) | 38.9 | 35.5 9% | 41.8 -7% | 33.4 14% | 33.8 13% | 40.1 -3% | 31.9 18% | 33.8 13% | |
| Witcher 3 ultra * (dB) | 40.6 |
* ... menor é melhor
(+) A temperatura máxima no lado superior é 38 °C / 100 F, em comparação com a média de 36.8 °C / 98 F , variando de 21 a 71 °C para a classe Multimedia.
(±) A parte inferior aquece até um máximo de 40.8 °C / 105 F, em comparação com a média de 39.1 °C / 102 F
(+) Em uso inativo, a temperatura média para o lado superior é 26.2 °C / 79 F, em comparação com a média do dispositivo de 31.3 °C / ### class_avg_f### F.
(±) Os apoios para as mãos e o touchpad podem ficar muito quentes ao toque, com um máximo de 36 °C / 96.8 F.
(-) A temperatura média da área do apoio para as mãos de dispositivos semelhantes foi 28.7 °C / 83.7 F (-7.3 °C / -13.1 F).
HP Pavilion 15z-bw000 análise de áudio
(±) | o volume do alto-falante é médio, mas bom (###valor### dB)
Graves 100 - 315Hz
(-) | quase nenhum baixo - em média 17.5% menor que a mediana
(-) | graves não são lineares (16.2% delta para frequência anterior)
Médios 400 - 2.000 Hz
(+) | médios equilibrados - apenas 2.6% longe da mediana
(±) | a linearidade dos médios é média (10.4% delta para frequência anterior)
Altos 2 - 16 kHz
(+) | agudos equilibrados - apenas 1.9% longe da mediana
(±) | a linearidade dos máximos é média (9.1% delta para frequência anterior)
Geral 100 - 16.000 Hz
(±) | a linearidade do som geral é média (18.8% diferença em relação à mediana)
Comparado com a mesma classe
» 58% de todos os dispositivos testados nesta classe foram melhores, 8% semelhantes, 34% piores
» O melhor teve um delta de 5%, a média foi 17%, o pior foi 45%
Comparado com todos os dispositivos testados
» 43% de todos os dispositivos testados foram melhores, 8% semelhantes, 49% piores
» O melhor teve um delta de 4%, a média foi 23%, o pior foi 134%
Apple MacBook 12 (Early 2016) 1.1 GHz análise de áudio
(+) | os alto-falantes podem tocar relativamente alto (###valor### dB)
Graves 100 - 315Hz
(±) | graves reduzidos - em média 11.3% menor que a mediana
(±) | a linearidade dos graves é média (14.2% delta para a frequência anterior)
Médios 400 - 2.000 Hz
(+) | médios equilibrados - apenas 2.4% longe da mediana
(+) | médios são lineares (5.5% delta para frequência anterior)
Altos 2 - 16 kHz
(+) | agudos equilibrados - apenas 2% longe da mediana
(+) | os máximos são lineares (4.5% delta da frequência anterior)
Geral 100 - 16.000 Hz
(+) | o som geral é linear (10.2% diferença em relação à mediana)
Comparado com a mesma classe
» 7% de todos os dispositivos testados nesta classe foram melhores, 2% semelhantes, 90% piores
» O melhor teve um delta de 5%, a média foi 18%, o pior foi 53%
Comparado com todos os dispositivos testados
» 5% de todos os dispositivos testados foram melhores, 1% semelhantes, 94% piores
» O melhor teve um delta de 4%, a média foi 23%, o pior foi 134%
| desligado | |
| Ocioso | |
| Carga |
|
Key:
min: | |
| HP Pavilion 15z-bw000 A10-9620P, Radeon R5 (Carrizo), Avolusion MD1TBLSSHD, TN LED, 1366x768, 15.6" | Asus X555DA-BB11 A10-8700P, Radeon R6 (Carrizo), Seagate Momentus SpinPoint M8 ST1000LM024 HN-M101MBB, TN LED, 1920x1080, 15.6" | Dell Inspiron 15 5000 5567-1753 i7-7500U, Radeon R7 M445, SanDisk X400 SED 256GB, SATA (SD8TB8U-256G), TN LED, 1920x1080, 15.6" | HP 15-ba077ng A12-9700P, Radeon R7 (Bristol Ridge), SanDisk Z400s SD8SNAT-256G, TN LED, 1920x1080, 15.6" | Acer Aspire E15 E5-553G-109A A12-9700P, Radeon R8 M445DX, Liteonit CV3-8D128, TN LED, 1920x1080, 15.6" | Lenovo ThinkPad E570-20H6S00000 i5-7200U, GeForce GTX 950M, Toshiba THNSF5256GPUK, IPS LED, 1920x1080, 15.6" | Acer Aspire E5-774-54HJ i5-7200U, HD Graphics 620, Western Digital Scorpio Blue WD5000LPCX-24C6HT0, TN LED, 1920x1080, 17.3" | |
|---|---|---|---|---|---|---|---|
| Power Consumption | -21% | -4% | 14% | -37% | -4% | -6% | |
| Idle Minimum * (Watt) | 5.38 | 8.3 -54% | 4 26% | 4.4 18% | 7.2 -34% | 2.8 48% | 5.3 1% |
| Idle Average * (Watt) | 7.9 | 8.6 -9% | 5.4 32% | 6.8 14% | 10.3 -30% | 6.3 20% | 10.1 -28% |
| Idle Maximum * (Watt) | 8.98 | 13.1 -46% | 8.3 8% | 8.9 1% | 11.9 -33% | 6.9 23% | 10.5 -17% |
| Load Average * (Watt) | 34.74 | 31.2 10% | 54 -55% | 30.9 11% | 48.2 -39% | 51.6 -49% | 34.3 1% |
| Load Maximum * (Watt) | 42.41 | 43.9 -4% | 55.4 -31% | 31 27% | 63 -49% | 69.7 -64% | 37 13% |
| Witcher 3 ultra * (Watt) | 51.8 |
* ... menor é melhor
| HP Pavilion 15z-bw000 A10-9620P, Radeon R5 (Carrizo), 31 Wh | Asus X555DA-BB11 A10-8700P, Radeon R6 (Carrizo), 37 Wh | Dell Inspiron 15 5000 5567-1753 i7-7500U, Radeon R7 M445, 42 Wh | Acer Aspire E15 E5-553G-109A A12-9700P, Radeon R8 M445DX, 40 Wh | Lenovo ThinkPad E570-20H6S00000 i5-7200U, GeForce GTX 950M, 41 Wh | Acer Aspire E5-774-54HJ i5-7200U, HD Graphics 620, 41 Wh | |
|---|---|---|---|---|---|---|
| Duração da bateria | 0% | 52% | -3% | 113% | 43% | |
| Reader / Idle (h) | 6.4 | 7.3 14% | 7.8 22% | 6 -6% | 14.7 130% | |
| WiFi v1.3 (h) | 3.7 | 2.9 -22% | 7 89% | 4.3 16% | 7.7 108% | 5.3 43% |
| Load (h) | 1.1 | 1.2 9% | 1.6 45% | 0.9 -18% | 2.2 100% |
Pro
Contra


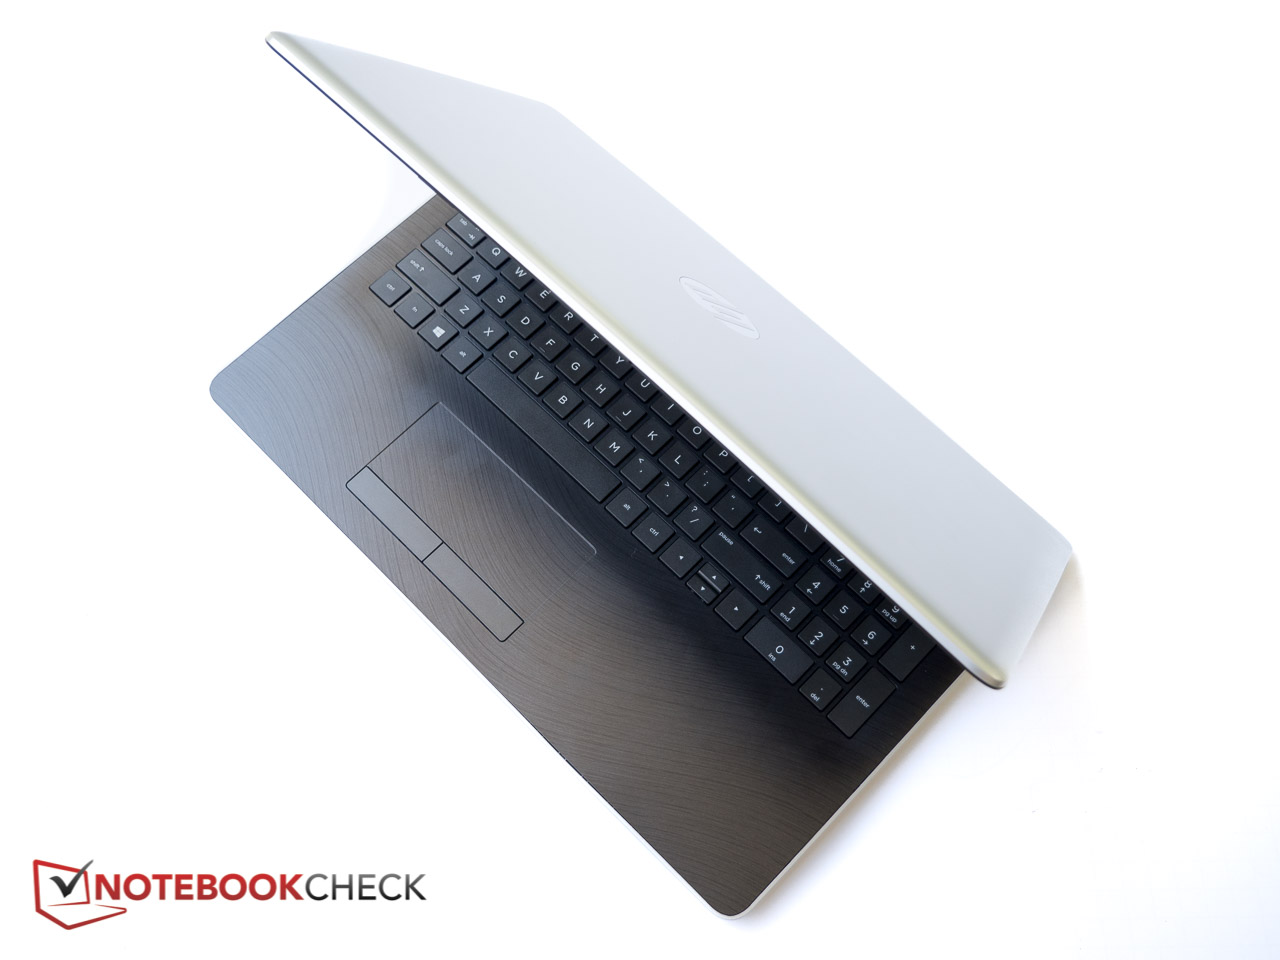
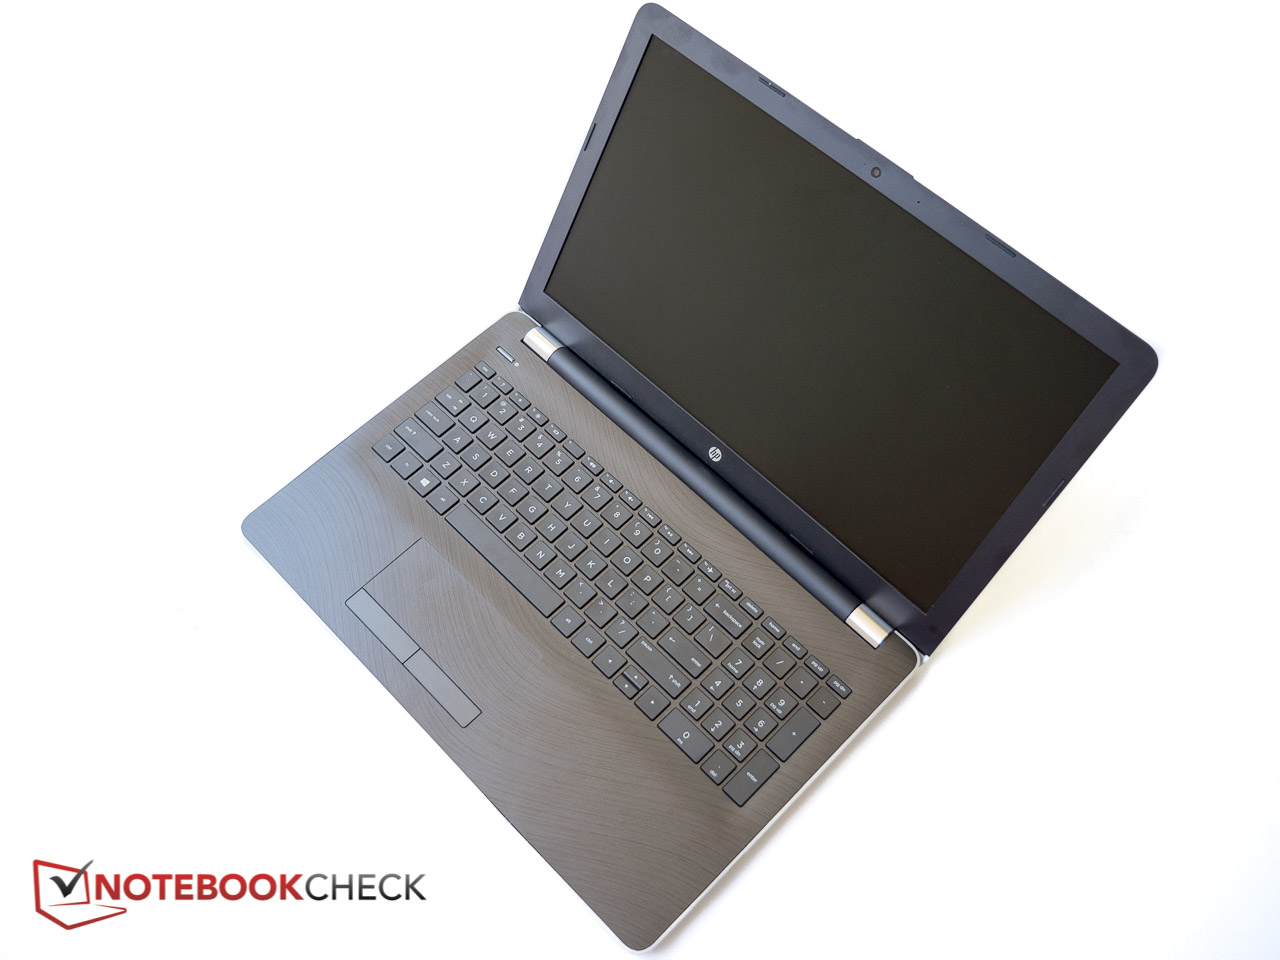
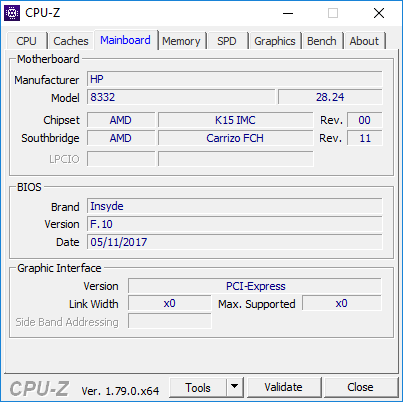
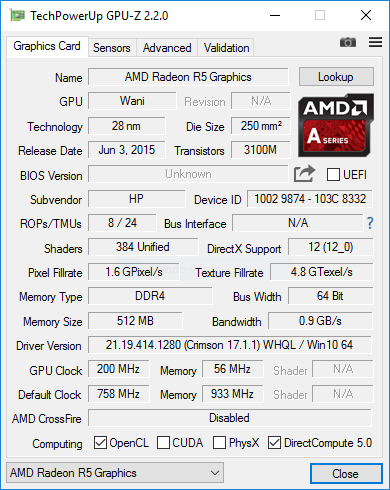
O Pavilion 15z é um portátil de 15,6 polegadas razoavelmente leve, discreto, mas também pouco inspirador. O componente do processador da APU AMD não funciona tão bem como as CPUs Intel ULV da geração atual, embora a Radeon R5 iGP ofereça um desempenho decente o suficiente para lidar com pelo menos alguns jogos mais antigos com configurações e resoluções mais baixas.
O sistema é retido por seu disco rígido mecânico, uma tela HD TN com baixa estabilidade dos ângulos de visão e sua bateria funesta.
Com tantas ofertas de nível de entrada no mercado, é difícil defender o HP Pavilion 15z - simplesmente não se destaca entre a multidão.
HP Pavilion 15z-bw000
- 07/15/2017 v6 (old)
Bernie Pechlaner
Price comparison
