Breve Análise do Portátil HP Pavilion 17 FHD V3A33AV


| SD Card Reader | |
| average JPG Copy Test (av. of 3 runs) | |
| Dell XPS 13 2016 9350 (FHD, i7-6560U) | |
| Apple MacBook Pro Retina 13 inch 2013-10 | |
| Alienware 17 R3 (A17-9935) | |
| HP Pavilion 17 FHD V3A33AV | |
| maximum AS SSD Seq Read Test (1GB) | |
| Dell XPS 13 2016 9350 (FHD, i7-6560U) | |
| Alienware 17 R3 (A17-9935) | |
| HP Pavilion 17 FHD V3A33AV | |
| Networking | |
| iperf Server (receive) TCP 1 m | |
| Dell XPS 13 2016 9350 (FHD, i7-6560U) | |
| Apple MacBook 12 (Early 2016) 1.1 GHz | |
| iperf Client (transmit) TCP 1 m | |
| Dell XPS 13 2016 9350 (FHD, i7-6560U) | |
| Apple MacBook 12 (Early 2016) 1.1 GHz | |
| |||||||||||||||||||||||||
iluminação: 86 %
iluminação com acumulador: 327.2 cd/m²
Contraste: 1128:1 (Preto: 0.29 cd/m²)
ΔE ColorChecker Calman: 3.03 | ∀{0.5-29.43 Ø4.71}
ΔE Greyscale Calman: 1.8 | ∀{0.09-98 Ø4.96}
87.6% sRGB (Argyll 1.6.3 3D)
57.2% AdobeRGB 1998 (Argyll 1.6.3 3D)
64.4% AdobeRGB 1998 (Argyll 3D)
88.1% sRGB (Argyll 3D)
64.3% Display P3 (Argyll 3D)
Gamma: 2.17
CCT: 6633 K
| HP Pavilion 17 FHD V3A33AV IPS, 17.3", 1920x1080 | Lenovo Ideapad Y700 17ISK 80Q0 IPS, 17.3", 1920x1080 | HP Pavilion 17-g120ng Samsung_SDC3854, IPS, 17.3", 1920x1080 | Gigabyte P57W LG Philips LP173WF4-SPF1 (LGD0469), IPS, 17.3", 1920x1080 | Asus ZenBook Pro UX501VW-DS71T IPS, 15.6", 3840x2160 | |
|---|---|---|---|---|---|
| Display | -1% | 6% | -2% | 1% | |
| Display P3 Coverage (%) | 64.3 | 67.4 5% | 65.7 2% | 66.5 3% | 64.3 0% |
| sRGB Coverage (%) | 88.1 | 84.8 -4% | 97.6 11% | 84.4 -4% | 89.9 2% |
| AdobeRGB 1998 Coverage (%) | 64.4 | 62 -4% | 67.7 5% | 61.7 -4% | 65.4 2% |
| Response Times | -42% | -91% | -1% | -16% | |
| Response Time Grey 50% / Grey 80% * (ms) | 31.2 ? | 51.6 ? -65% | 70 ? -124% | 37 ? -19% | 43.2 ? -38% |
| Response Time Black / White * (ms) | 29.2 ? | 34.4 ? -18% | 46 ? -58% | 24 ? 18% | 27.2 ? 7% |
| PWM Frequency (Hz) | 200 ? | ||||
| Screen | -13% | -27% | -28% | -53% | |
| Brightness middle (cd/m²) | 327.2 | 349.7 7% | 309 -6% | 286 -13% | 252.9 -23% |
| Brightness (cd/m²) | 297 | 332 12% | 292 -2% | 274 -8% | 250 -16% |
| Brightness Distribution (%) | 86 | 90 5% | 86 0% | 87 1% | 89 3% |
| Black Level * (cd/m²) | 0.29 | 0.304 -5% | 0.27 7% | 0.31 -7% | 0.5 -72% |
| Contrast (:1) | 1128 | 1150 2% | 1144 1% | 923 -18% | 506 -55% |
| Colorchecker dE 2000 * | 3.03 | 3.99 -32% | 4.53 -50% | 4.49 -48% | 5.22 -72% |
| Colorchecker dE 2000 max. * | 6.87 | 8.74 -27% | 7.83 -14% | 8.33 -21% | |
| Greyscale dE 2000 * | 1.8 | 3.34 -86% | 5.66 -214% | 4.76 -164% | 6.74 -274% |
| Gamma | 2.17 101% | 2.23 99% | 2.62 84% | 2.47 89% | 2.45 90% |
| CCT | 6633 98% | 6111 106% | 7893 82% | 6843 95% | 6026 108% |
| Color Space (Percent of AdobeRGB 1998) (%) | 57.2 | 55.8 -2% | 62 8% | 55 -4% | 58.4 2% |
| Color Space (Percent of sRGB) (%) | 87.6 | 84.8 -3% | 98 12% | 84 -4% | 89.7 2% |
| Média Total (Programa/Configurações) | -19% /
-14% | -37% /
-29% | -10% /
-19% | -23% /
-37% |
* ... menor é melhor
Exibir tempos de resposta
| ↔ Tempo de resposta preto para branco | ||
|---|---|---|
| 29.2 ms ... ascensão ↗ e queda ↘ combinadas | ↗ 6 ms ascensão | 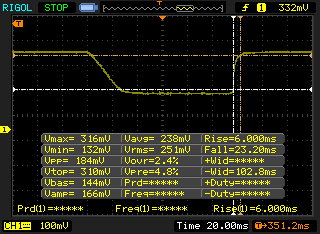 |
| ↘ 23.2 ms queda | ||
| A tela mostra taxas de resposta relativamente lentas em nossos testes e pode ser muito lenta para os jogadores. Em comparação, todos os dispositivos testados variam de 0.1 (mínimo) a 240 (máximo) ms. » 78 % de todos os dispositivos são melhores. Isso significa que o tempo de resposta medido é pior que a média de todos os dispositivos testados (19.8 ms). | ||
| ↔ Tempo de resposta 50% cinza a 80% cinza | ||
| 31.2 ms ... ascensão ↗ e queda ↘ combinadas | ↗ 15.2 ms ascensão | 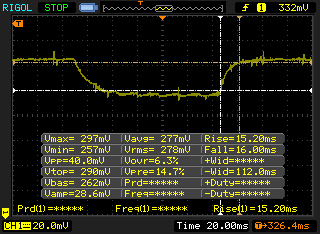 |
| ↘ 16 ms queda | ||
| A tela mostra taxas de resposta lentas em nossos testes e será insatisfatória para os jogadores. Em comparação, todos os dispositivos testados variam de 0.165 (mínimo) a 636 (máximo) ms. » 42 % de todos os dispositivos são melhores. Isso significa que o tempo de resposta medido é semelhante à média de todos os dispositivos testados (31 ms). | ||
Cintilação da tela / PWM (modulação por largura de pulso)
| Tela tremeluzindo / PWM não detectado | 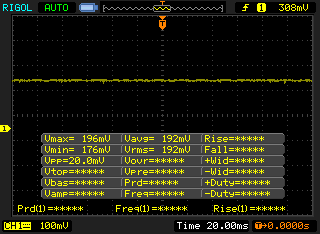 | ||
[pwm_comparison] Em comparação: 52 % de todos os dispositivos testados não usam PWM para escurecer a tela. Se PWM foi detectado, uma média de 7757 (mínimo: 5 - máximo: 343500) Hz foi medida. | |||
| Cinebench R15 | |
| CPU Single 64Bit | |
| DogHouse Systems Mobius SS | |
| Asus G701VO-CS74K | |
| HP Pavilion 17 FHD V3A33AV | |
| MSI GE62 2QC-468XPL | |
| Acer Aspire V Nitro VN7-792G-55SF | |
| Toshiba Satellite S70-B-106 | |
| Acer TravelMate P648-M-757N | |
| CPU Multi 64Bit | |
| DogHouse Systems Mobius SS | |
| MSI GE62 2QC-468XPL | |
| Asus G701VO-CS74K | |
| HP Pavilion 17 FHD V3A33AV | |
| Toshiba Satellite S70-B-106 | |
| Acer Aspire V Nitro VN7-792G-55SF | |
| Acer TravelMate P648-M-757N | |
| Cinebench R11.5 | |
| CPU Single 64Bit | |
| DogHouse Systems Mobius SS | |
| Asus G701VO-CS74K | |
| MSI GE62 2QC-468XPL | |
| HP Pavilion 17 FHD V3A33AV | |
| Toshiba Satellite S70-B-106 | |
| Acer Aspire V Nitro VN7-792G-55SF | |
| Acer TravelMate P648-M-757N | |
| CPU Multi 64Bit | |
| DogHouse Systems Mobius SS | |
| MSI GE62 2QC-468XPL | |
| Asus G701VO-CS74K | |
| HP Pavilion 17 FHD V3A33AV | |
| Toshiba Satellite S70-B-106 | |
| Acer Aspire V Nitro VN7-792G-55SF | |
| Acer TravelMate P648-M-757N | |
| Cinebench R10 | |
| Rendering Multiple CPUs 32Bit | |
| DogHouse Systems Mobius SS | |
| MSI GE62 2QC-468XPL | |
| Asus G701VO-CS74K | |
| HP Pavilion 17 FHD V3A33AV | |
| Acer Aspire V Nitro VN7-792G-55SF | |
| Acer TravelMate P648-M-757N | |
| Rendering Single 32Bit | |
| DogHouse Systems Mobius SS | |
| Asus G701VO-CS74K | |
| MSI GE62 2QC-468XPL | |
| HP Pavilion 17 FHD V3A33AV | |
| Acer Aspire V Nitro VN7-792G-55SF | |
| Acer TravelMate P648-M-757N | |
| wPrime 2.10 - 1024m | |
| Acer Aspire V Nitro VN7-792G-55SF | |
| Asus G701VO-CS74K | |
| MSI GE62 2QC-468XPL | |
| DogHouse Systems Mobius SS | |
| Super Pi Mod 1.5 XS 32M - 32M | |
| Acer Aspire V Nitro VN7-792G-55SF | |
| MSI GE62 2QC-468XPL | |
| HP Pavilion 17 FHD V3A33AV | |
| Asus G701VO-CS74K | |
| DogHouse Systems Mobius SS | |
* ... menor é melhor
| PCMark 8 | |
| Home Score Accelerated v2 | |
| Dell XPS 15 9550 i7 FHD | |
| Asus Strix GL502VT-DS74 | |
| Asus G501VW-FY081T | |
| HP Pavilion 17 FHD V3A33AV | |
| HP Pavilion 15 UHD T9Y85AV | |
| Work Score Accelerated v2 | |
| Asus Strix GL502VT-DS74 | |
| Dell XPS 15 9550 i7 FHD | |
| HP Pavilion 17 FHD V3A33AV | |
| Asus G501VW-FY081T | |
| HP Pavilion 15 UHD T9Y85AV | |
| Creative Score Accelerated v2 | |
| Dell XPS 15 9550 i7 FHD | |
| HP Pavilion 15 UHD T9Y85AV | |
| Asus Strix GL502VT-DS74 | |
| Asus G501VW-FY081T | |
| HP Pavilion 17 FHD V3A33AV | |
| PCMark 8 Home Score Accelerated v2 | 3133 pontos | |
| PCMark 8 Creative Score Accelerated v2 | 3658 pontos | |
| PCMark 8 Work Score Accelerated v2 | 4604 pontos | |
Ajuda | ||
| HP Pavilion 17 FHD V3A33AV SanDisk Z400s SD8SNAT-128G | Lenovo Ideapad Y700 17ISK 80Q0 Samsung MZNLN128HCGR-000L2 | HP Pavilion 17-g120ng Toshiba MQ01ABD100 | Gigabyte P57W Lite-On IT L8T-256L9G | Asus ZenBook Pro UX501VW-DS71T Samsung SM951 MZVPV512HDGL m.2 PCI-e | |
|---|---|---|---|---|---|
| CrystalDiskMark 3.0 | 32% | -87% | 52% | 322% | |
| Read Seq (MB/s) | 517 | 513 -1% | 104.6 -80% | 491.6 -5% | 1633 216% |
| Write Seq (MB/s) | 185.1 | 156.3 -16% | 96.3 -48% | 391.1 111% | 1579 753% |
| Read 512 (MB/s) | 319.3 | 435.6 36% | 30.33 -91% | 352.8 10% | 1068 234% |
| Write 512 (MB/s) | 179.5 | 156.5 -13% | 36.95 -79% | 371.7 107% | 1570 775% |
| Read 4k (MB/s) | 20.99 | 36.89 76% | 0.358 -98% | 29.89 42% | 50.4 140% |
| Write 4k (MB/s) | 68.3 | 96.9 42% | 0.815 -99% | 37.75 -45% | 128.6 88% |
| Read 4k QD32 (MB/s) | 144.6 | 358.8 148% | 0.679 -100% | 338.7 134% | 534 269% |
| Write 4k QD32 (MB/s) | 169.8 | 138.9 -18% | 0.79 -100% | 278 64% | 344 103% |

| 3DMark 11 | |
| 1280x720 Performance GPU | |
| Asus Strix GL502VY-DS71 | |
| Asus Strix GL502VT-DS74 | |
| HP Omen 17-w010ng | |
| Lenovo Y700-15 80NV004LPB | |
| HP Pavilion 17 FHD V3A33AV | |
| MSI PX60 6QD | |
| 1280x720 Performance Combined | |
| Asus Strix GL502VY-DS71 | |
| Asus Strix GL502VT-DS74 | |
| HP Omen 17-w010ng | |
| Lenovo Y700-15 80NV004LPB | |
| HP Pavilion 17 FHD V3A33AV | |
| MSI PX60 6QD | |
| 3DMark | |
| 1920x1080 Fire Strike Graphics | |
| Asus Strix GL502VY-DS71 | |
| Asus Strix GL502VT-DS74 | |
| HP Omen 17-w010ng | |
| Lenovo Y700-15 80NV004LPB | |
| HP Pavilion 17 FHD V3A33AV | |
| MSI PX60 6QD | |
| Fire Strike Extreme Graphics | |
| Asus Strix GL502VY-DS71 | |
| Asus Strix GL502VT-DS74 | |
| HP Pavilion 17 FHD V3A33AV | |
| 3DMark 11 Performance | 5576 pontos | |
| 3DMark Ice Storm Standard Score | 80214 pontos | |
| 3DMark Cloud Gate Standard Score | 15746 pontos | |
| 3DMark Fire Strike Score | 3994 pontos | |
| 3DMark Fire Strike Extreme Score | 2009 pontos | |
Ajuda | ||
| BioShock Infinite - 1920x1080 Ultra Preset, DX11 (DDOF) | |
| Asus Strix GL502VY-DS71 | |
| Asus Strix GL502VT-DS74 | |
| Gigabyte P55K v5 | |
| HP Pavilion 17 FHD V3A33AV | |
| MSI PX60 6QD | |
| Sleeping Dogs - 1920x1080 Extreme Preset AA:Extreme | |
| Asus Strix GL502VY-DS71 | |
| Asus Strix GL502VT-DS74 | |
| Gigabyte P55K v5 | |
| HP Pavilion 17 FHD V3A33AV | |
| Metro: Last Light - 1920x1080 Very High (DX11) AF:16x | |
| Asus Strix GL502VT-DS74 | |
| Gigabyte P55K v5 | |
| HP Pavilion 17 FHD V3A33AV | |
| Thief - 1920x1080 Very High Preset AA:FXAA & High SS AF:8x | |
| Asus Strix GL502VY-DS71 | |
| Asus Strix GL502VT-DS74 | |
| Gigabyte P55K v5 | |
| HP Pavilion 17 FHD V3A33AV | |
| Batman: Arkham Knight - 1920x1080 High / On AA:SM AF:16x | |
| Asus Strix GL502VT-DS74 | |
| Gigabyte P55K v5 | |
| HP Pavilion 17 FHD V3A33AV | |
| Metal Gear Solid V - 1920x1080 Extra High / On | |
| Asus Strix GL502VT-DS74 | |
| Asus Strix GL502VY-DS71 | |
| Gigabyte P55K v5 | |
| HP Pavilion 17 FHD V3A33AV | |
| Fallout 4 - 1920x1080 Ultra Preset AA:T AF:16x | |
| Asus Strix GL502VY-DS71 | |
| Asus Strix GL502VT-DS74 | |
| Gigabyte P55K v5 | |
| HP Pavilion 17 FHD V3A33AV | |
| Rise of the Tomb Raider - 1920x1080 Very High Preset AA:FX AF:16x | |
| Asus Strix GL502VY-DS71 | |
| Asus Strix GL502VT-DS74 | |
| Gigabyte P55K v5 | |
| HP Pavilion 17 FHD V3A33AV | |
| baixo | média | alto | ultra | |
|---|---|---|---|---|
| Sleeping Dogs (2012) | 91.3 | 24.3 | ||
| BioShock Infinite (2013) | 117.9 | 45 | ||
| Metro: Last Light (2013) | 59.3 | 31.2 | ||
| Thief (2014) | 55.5 | 28.4 | ||
| Batman: Arkham Knight (2015) | 34 | 23 | ||
| Metal Gear Solid V (2015) | 56.1 | 37.9 | ||
| Fallout 4 (2015) | 30.6 | 24.5 | ||
| Rise of the Tomb Raider (2016) | 30.2 | 24.2 | ||
| Overwatch (2016) | 39.4 |
Barulho
| Ocioso |
| 34.6 / 34.8 / 35.5 dB |
| DVD |
| 39.4 / dB |
| Carga |
| 45.4 / 52.3 dB |
 | ||
30 dB silencioso 40 dB(A) audível 50 dB(A) ruidosamente alto |
||
min: | ||
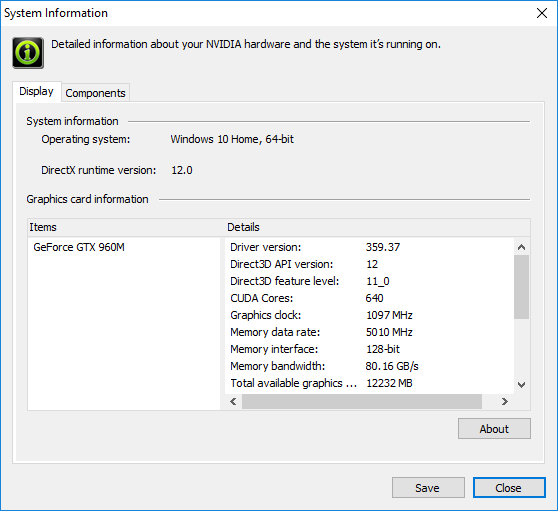
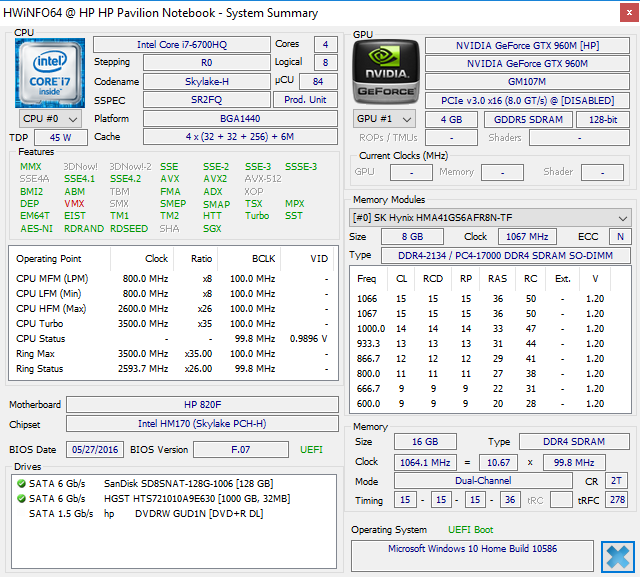
| HP Pavilion 17 FHD V3A33AV GeForce GTX 960M, 6700HQ, SanDisk Z400s SD8SNAT-128G | Lenovo Ideapad Y700-17 80QK7709PB GeForce GTX 960M, 6700HQ, Samsung SSD 850 EVO 500GB | HP Pavilion 17-g120ng GeForce 940M, 6500U, Toshiba MQ01ABD100 | Gigabyte P57W GeForce GTX 970M, 6700HQ, Lite-On IT L8T-256L9G | Asus ZenBook Pro UX501VW-DS71T GeForce GTX 960M, 6700HQ, Samsung SM951 MZVPV512HDGL m.2 PCI-e | |
|---|---|---|---|---|---|
| Noise | 9% | 5% | 6% | 14% | |
| desligado / ambiente * (dB) | 29 | 30 -3% | |||
| Idle Minimum * (dB) | 34.6 | 31.4 9% | 33.5 3% | 32 8% | 28.9 16% |
| Idle Average * (dB) | 34.8 | 31.4 10% | 33.5 4% | 33 5% | 28.9 17% |
| Idle Maximum * (dB) | 35.5 | 34.3 3% | 33.5 6% | 37 -4% | 30.2 15% |
| Load Average * (dB) | 45.4 | 41.3 9% | 45 1% | 37 19% | 41.8 8% |
| Load Maximum * (dB) | 52.3 | 44 16% | 47 10% | 47 10% | 43.9 16% |
* ... menor é melhor
(-) A temperatura máxima no lado superior é 50 °C / 122 F, em comparação com a média de 40.4 °C / 105 F , variando de 21.2 a 68.8 °C para a classe Gaming.
(±) A parte inferior aquece até um máximo de 44 °C / 111 F, em comparação com a média de 43.2 °C / 110 F
(+) Em uso inativo, a temperatura média para o lado superior é 23.3 °C / 74 F, em comparação com a média do dispositivo de 33.9 °C / ### class_avg_f### F.
(+) Os apoios para as mãos e o touchpad são mais frios que a temperatura da pele, com um máximo de 31.6 °C / 88.9 F e, portanto, são frios ao toque.
(-) A temperatura média da área do apoio para as mãos de dispositivos semelhantes foi 28.8 °C / 83.8 F (-2.8 °C / -5.1 F).
HP Pavilion 17 FHD V3A33AV análise de áudio
(-) | alto-falantes não muito altos (###valor### dB)
Analysis not possible as minimum curve is missing or too high
Apple MacBook 12 (Early 2016) 1.1 GHz análise de áudio
(+) | os alto-falantes podem tocar relativamente alto (###valor### dB)
Graves 100 - 315Hz
(±) | graves reduzidos - em média 11.3% menor que a mediana
(±) | a linearidade dos graves é média (14.2% delta para a frequência anterior)
Médios 400 - 2.000 Hz
(+) | médios equilibrados - apenas 2.4% longe da mediana
(+) | médios são lineares (5.5% delta para frequência anterior)
Altos 2 - 16 kHz
(+) | agudos equilibrados - apenas 2% longe da mediana
(+) | os máximos são lineares (4.5% delta da frequência anterior)
Geral 100 - 16.000 Hz
(+) | o som geral é linear (10.2% diferença em relação à mediana)
Comparado com a mesma classe
» 7% de todos os dispositivos testados nesta classe foram melhores, 2% semelhantes, 90% piores
» O melhor teve um delta de 5%, a média foi 18%, o pior foi 53%
Comparado com todos os dispositivos testados
» 5% de todos os dispositivos testados foram melhores, 1% semelhantes, 94% piores
» O melhor teve um delta de 4%, a média foi 23%, o pior foi 134%
Schenker F516 Flex análise de áudio
(-) | alto-falantes não muito altos (###valor### dB)
Analysis not possible as minimum curve is missing or too high
| desligado | |
| Ocioso | |
| Carga |
|
Key:
min: | |
| HP Pavilion 17 FHD V3A33AV 6700HQ, GeForce GTX 960M, SanDisk Z400s SD8SNAT-128G, IPS, 1920x1080, 17.3" | Lenovo Ideapad Y700-17 80QK7709PB 6700HQ, GeForce GTX 960M, Samsung SSD 850 EVO 500GB, IPS, 1920x1080, 17.3" | HP Pavilion 17-g120ng 6500U, GeForce 940M, Toshiba MQ01ABD100, IPS, 1920x1080, 17.3" | Gigabyte P57W 6700HQ, GeForce GTX 970M, Lite-On IT L8T-256L9G, IPS, 1920x1080, 17.3" | Asus Zenbook Pro UX501JW-FI218H 4720HQ, GeForce GTX 960M, SanDisk SD7SN3Q128G1002, IPS, 3840x2160, 15.6" | |
|---|---|---|---|---|---|
| Power Consumption | -29% | 22% | -65% | -67% | |
| Idle Minimum * (Watt) | 5.3 | 4.3 19% | 4.8 9% | 11 -108% | 15.6 -194% |
| Idle Average * (Watt) | 10.6 | 13.8 -30% | 10.1 5% | 17 -60% | 20.5 -93% |
| Idle Maximum * (Watt) | 11.8 | 19.8 -68% | 10.4 12% | 22 -86% | 21.2 -80% |
| Load Average * (Watt) | 70.9 | 115.9 -63% | 45.4 36% | 85 -20% | 75.8 -7% |
| Load Maximum * (Watt) | 119.8 | 123.5 -3% | 63 47% | 178 -49% | 72.9 39% |
* ... menor é melhor
| HP Pavilion 17 FHD V3A33AV 6700HQ, GeForce GTX 960M, 62 Wh | Lenovo Ideapad Y700 17ISK 80Q0 6700HQ, GeForce GTX 960M, 60 Wh | HP Pavilion 17-g120ng 6500U, GeForce 940M, 41 Wh | Gigabyte P57W 6700HQ, GeForce GTX 970M, 75.81 Wh | Asus ZenBook Pro UX501VW-DS71T 6700HQ, GeForce GTX 960M, 96 Wh | |
|---|---|---|---|---|---|
| Duração da bateria | -8% | -27% | -14% | 6% | |
| Reader / Idle (h) | 12.5 | 11.5 -8% | 7.7 -38% | 11.5 -8% | |
| WiFi v1.3 (h) | 5.9 | 5.6 -5% | 4.3 -27% | 5.6 -5% | 6.3 7% |
| Load (h) | 1.7 | 1.5 -12% | 1.7 0% | 2 18% |
Pro
Contra
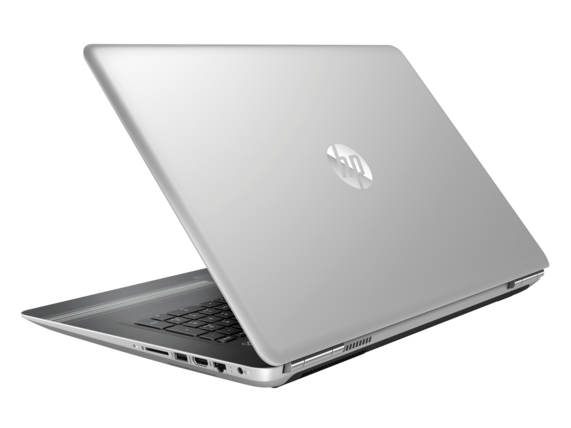

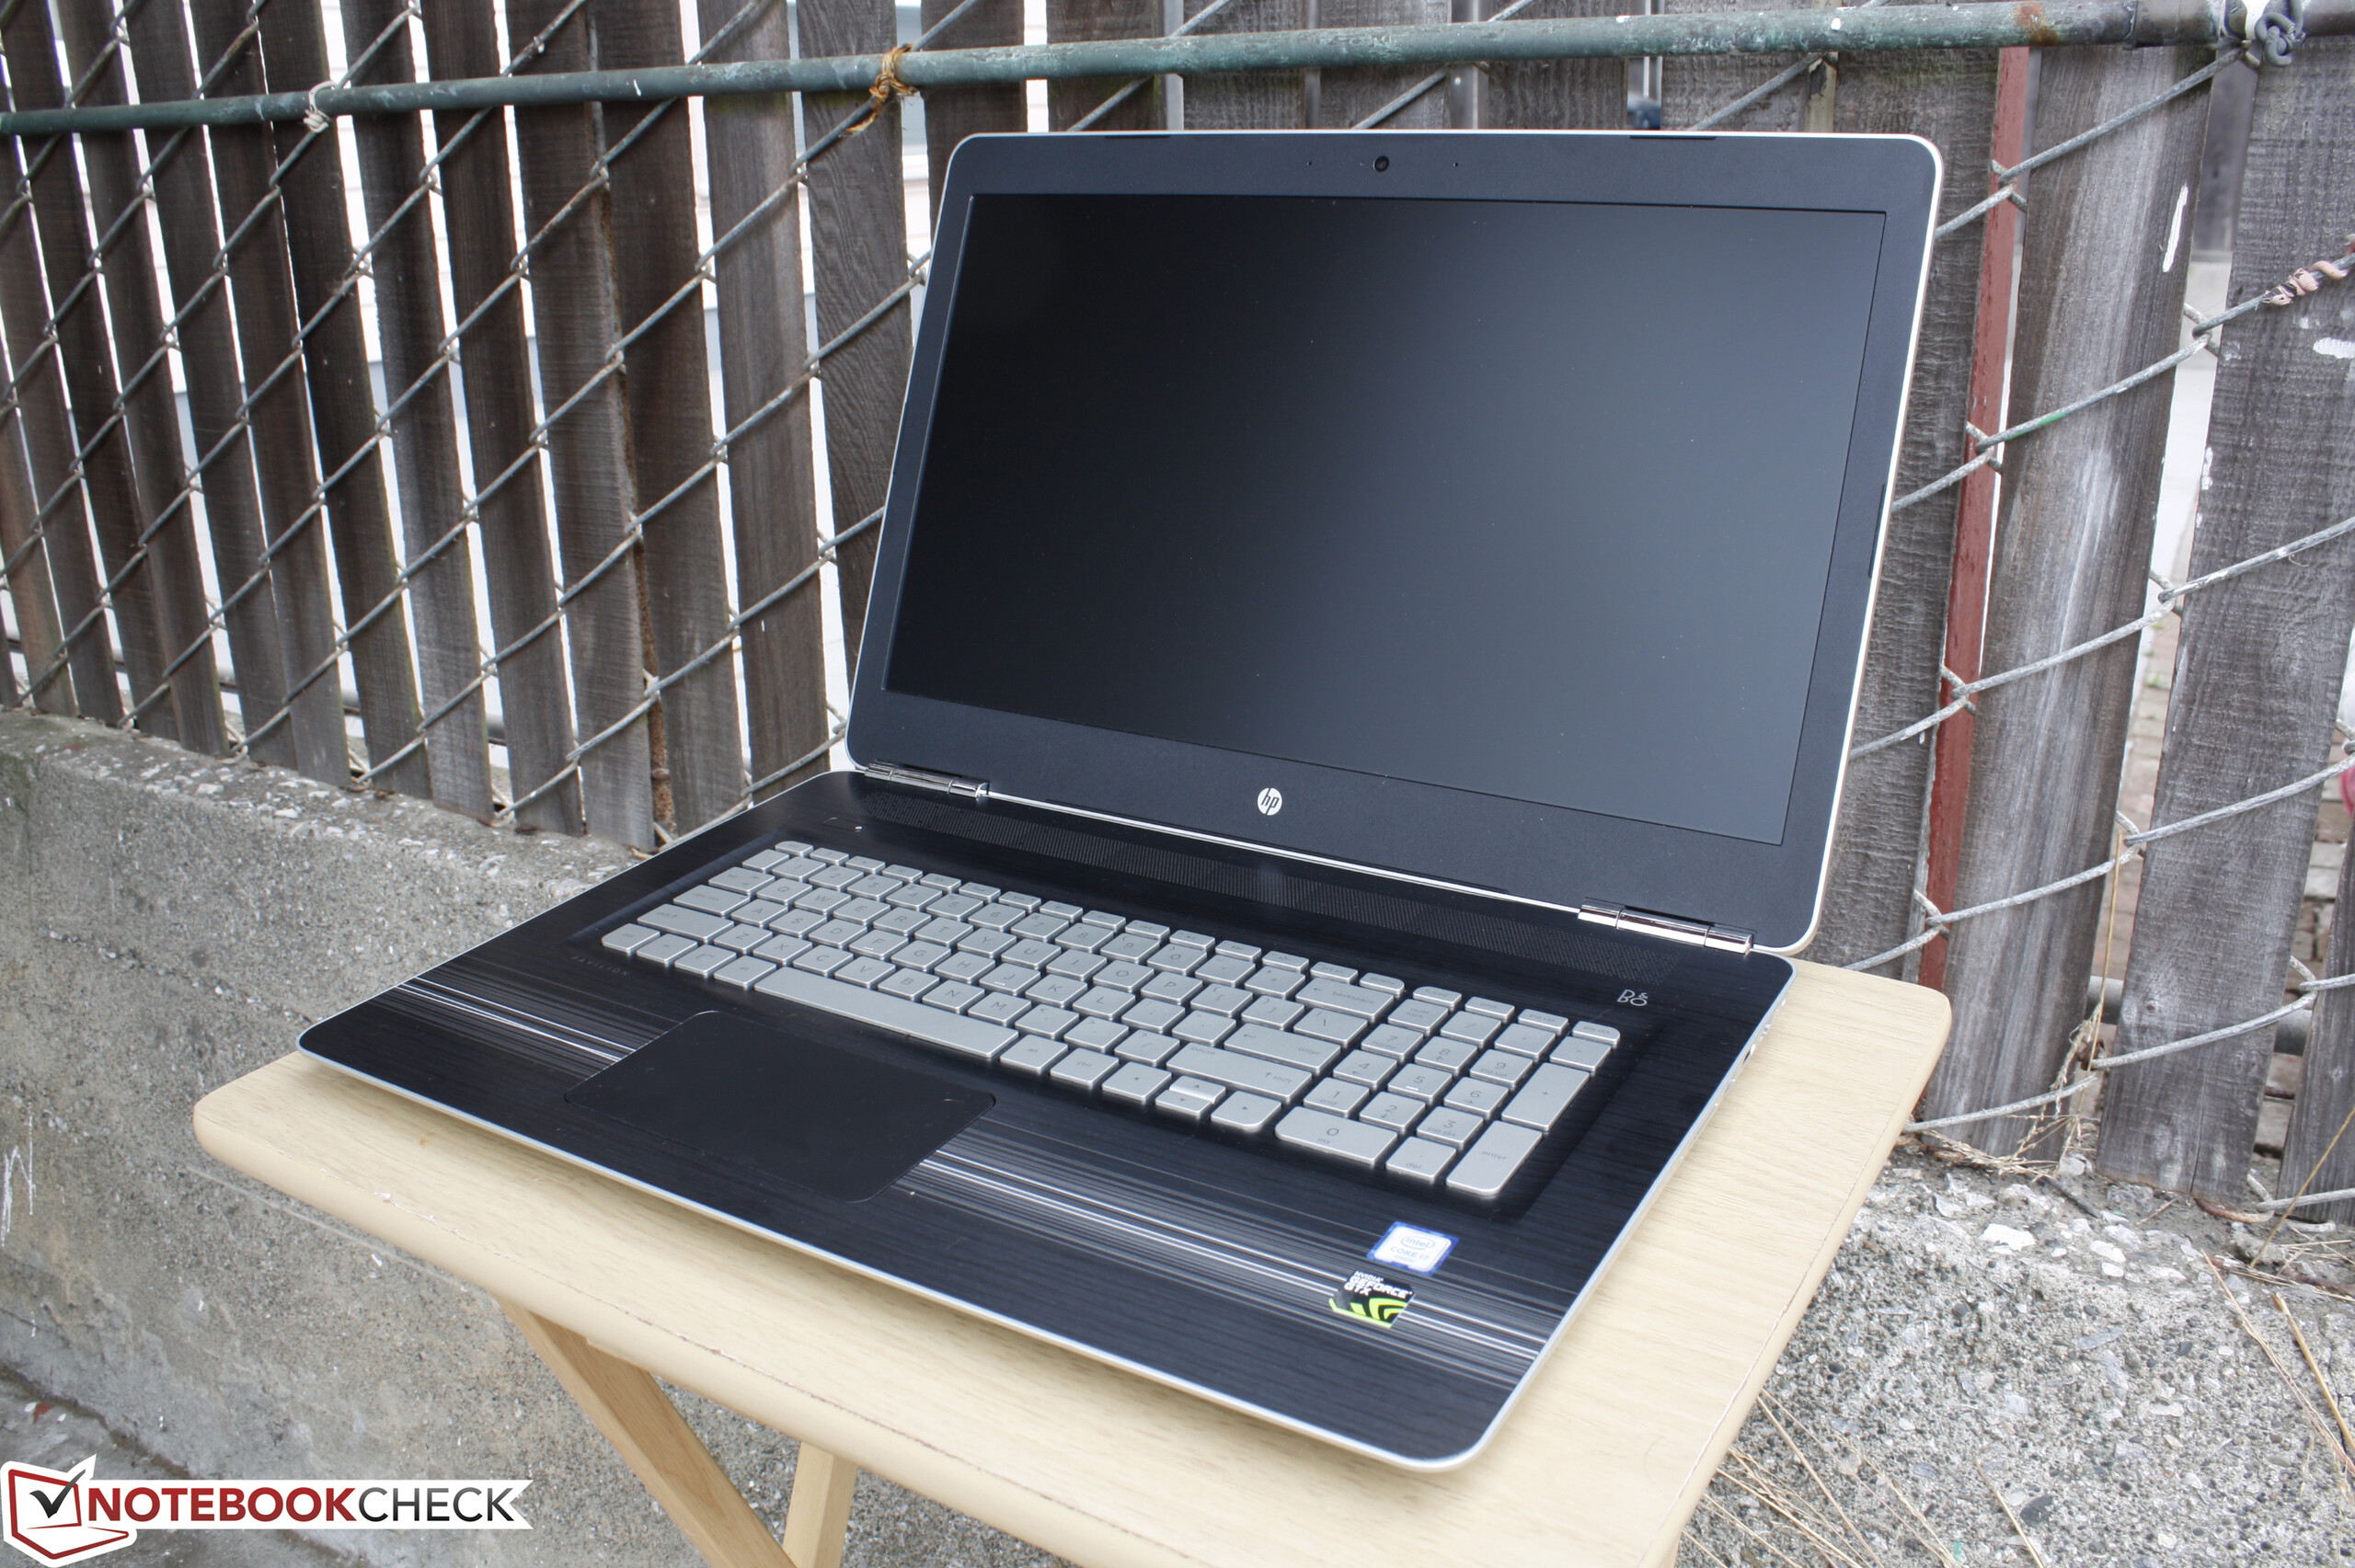
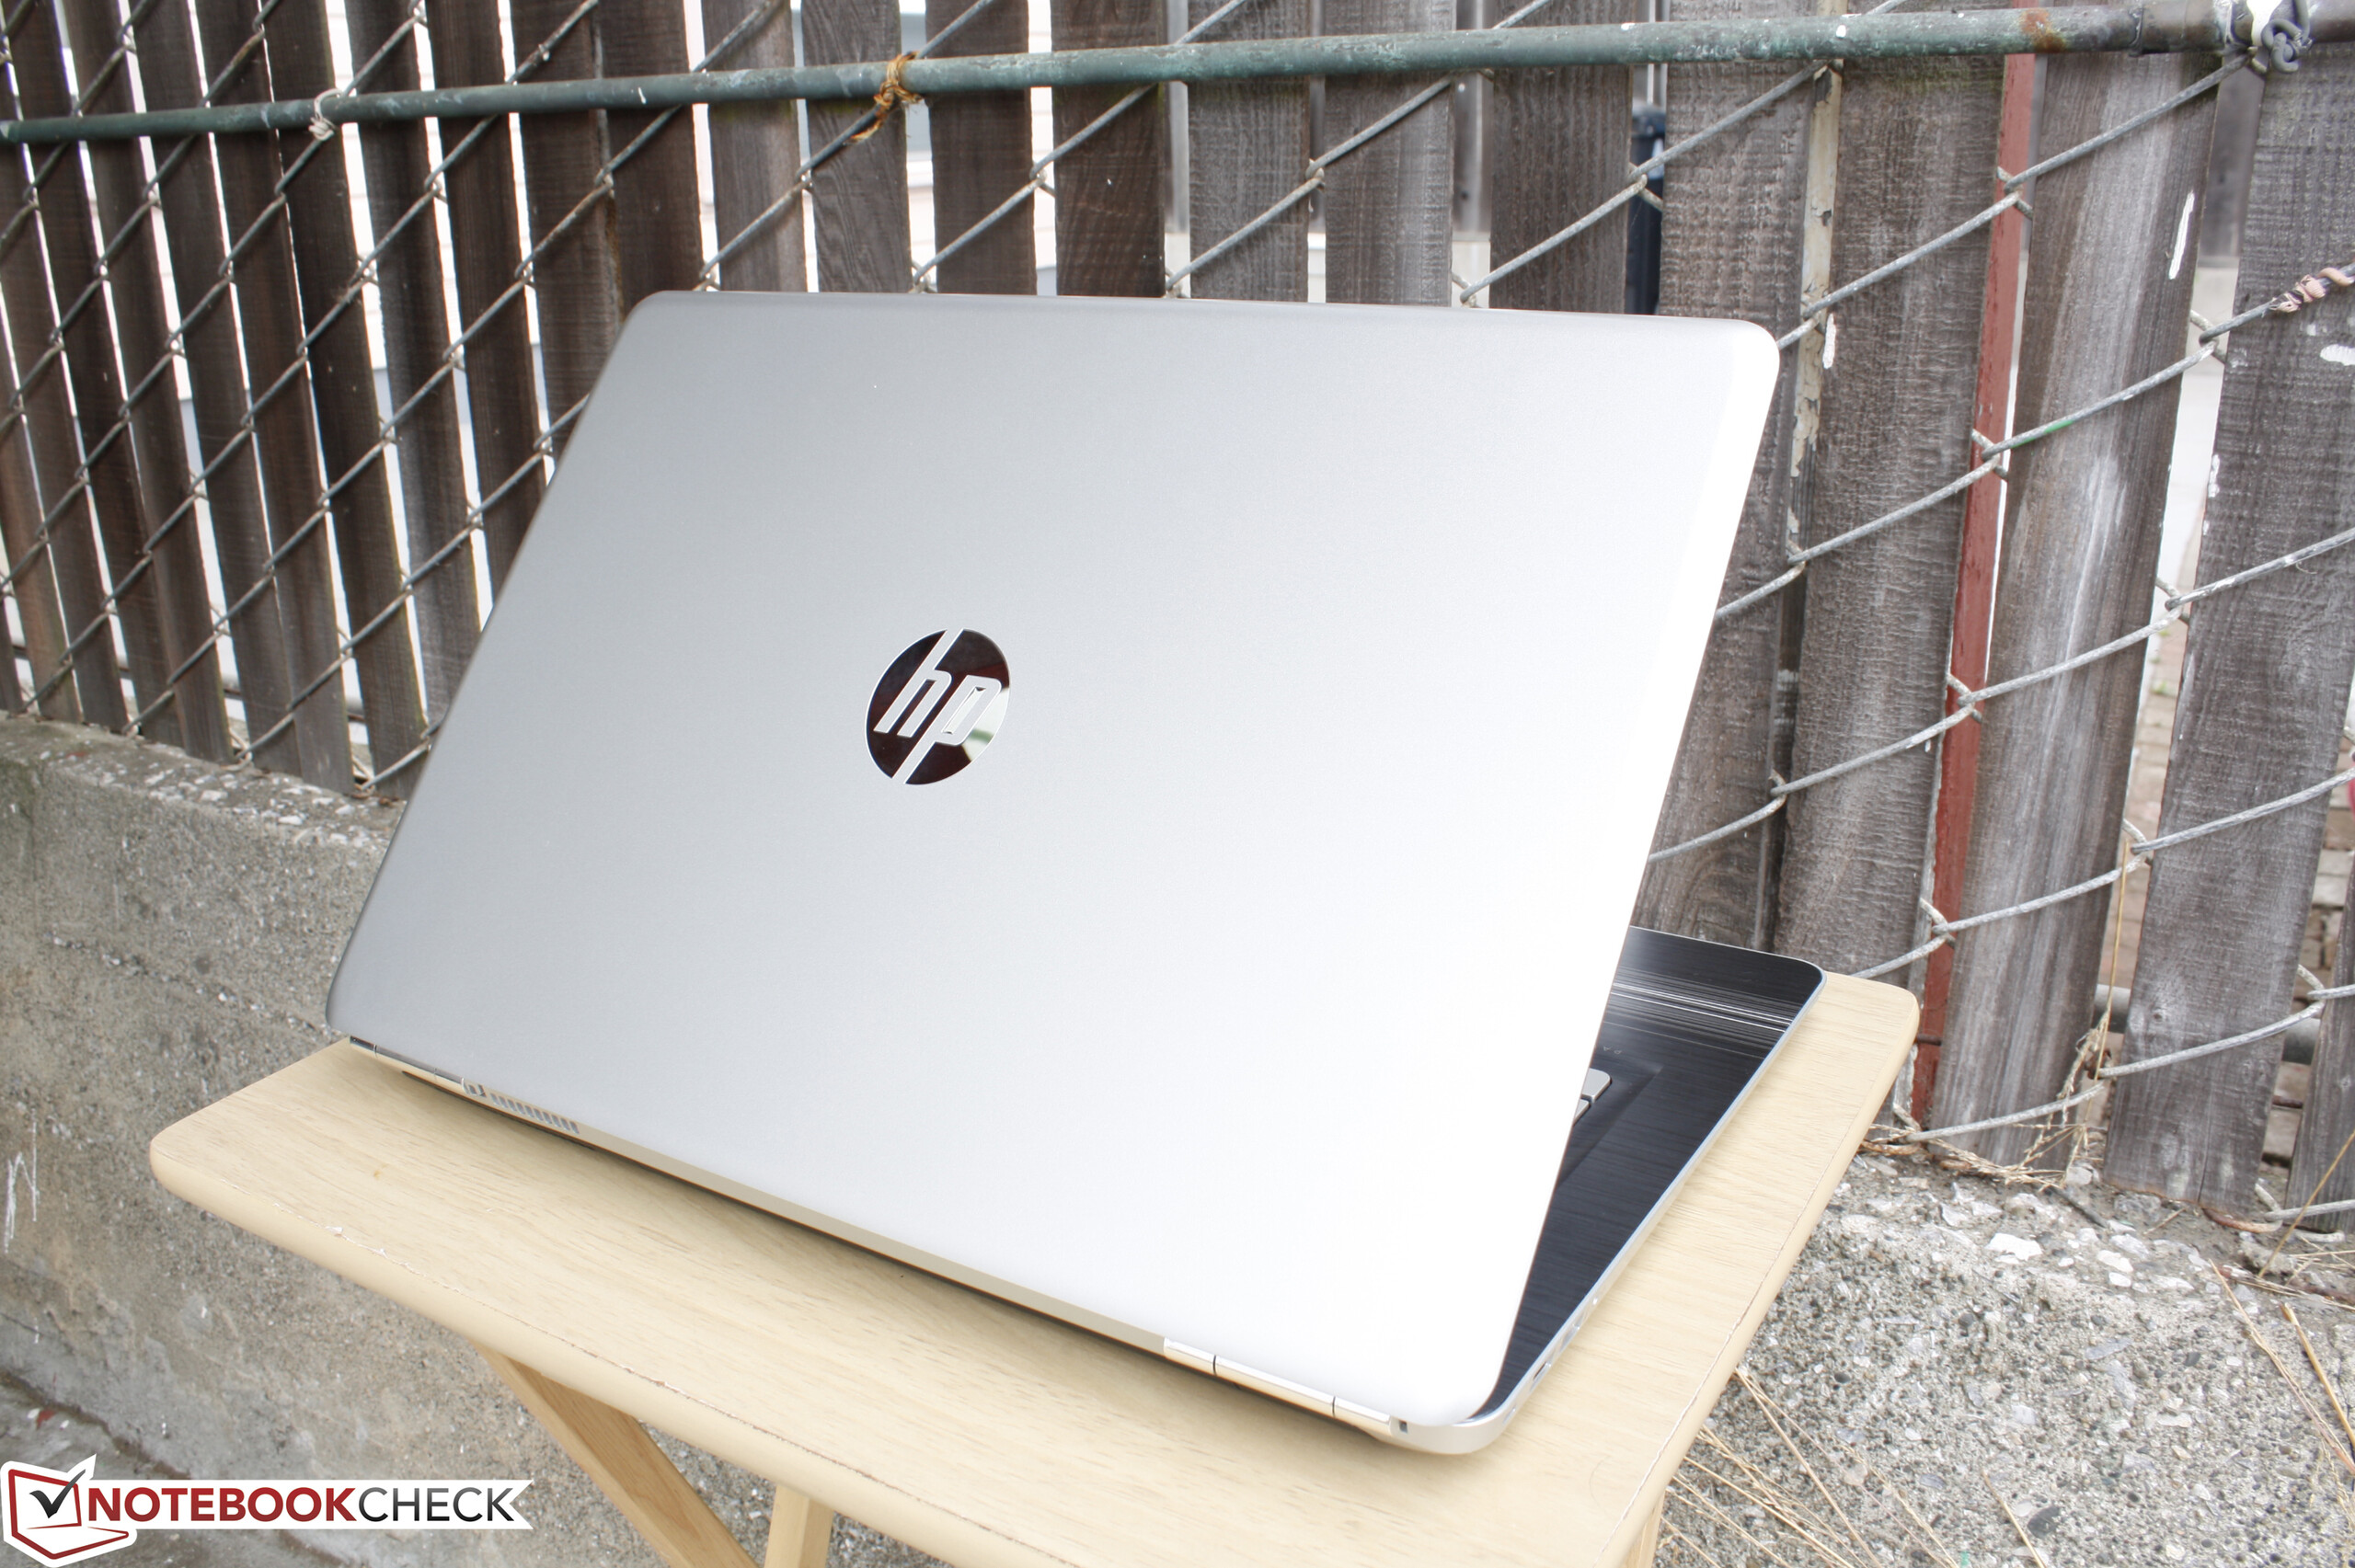
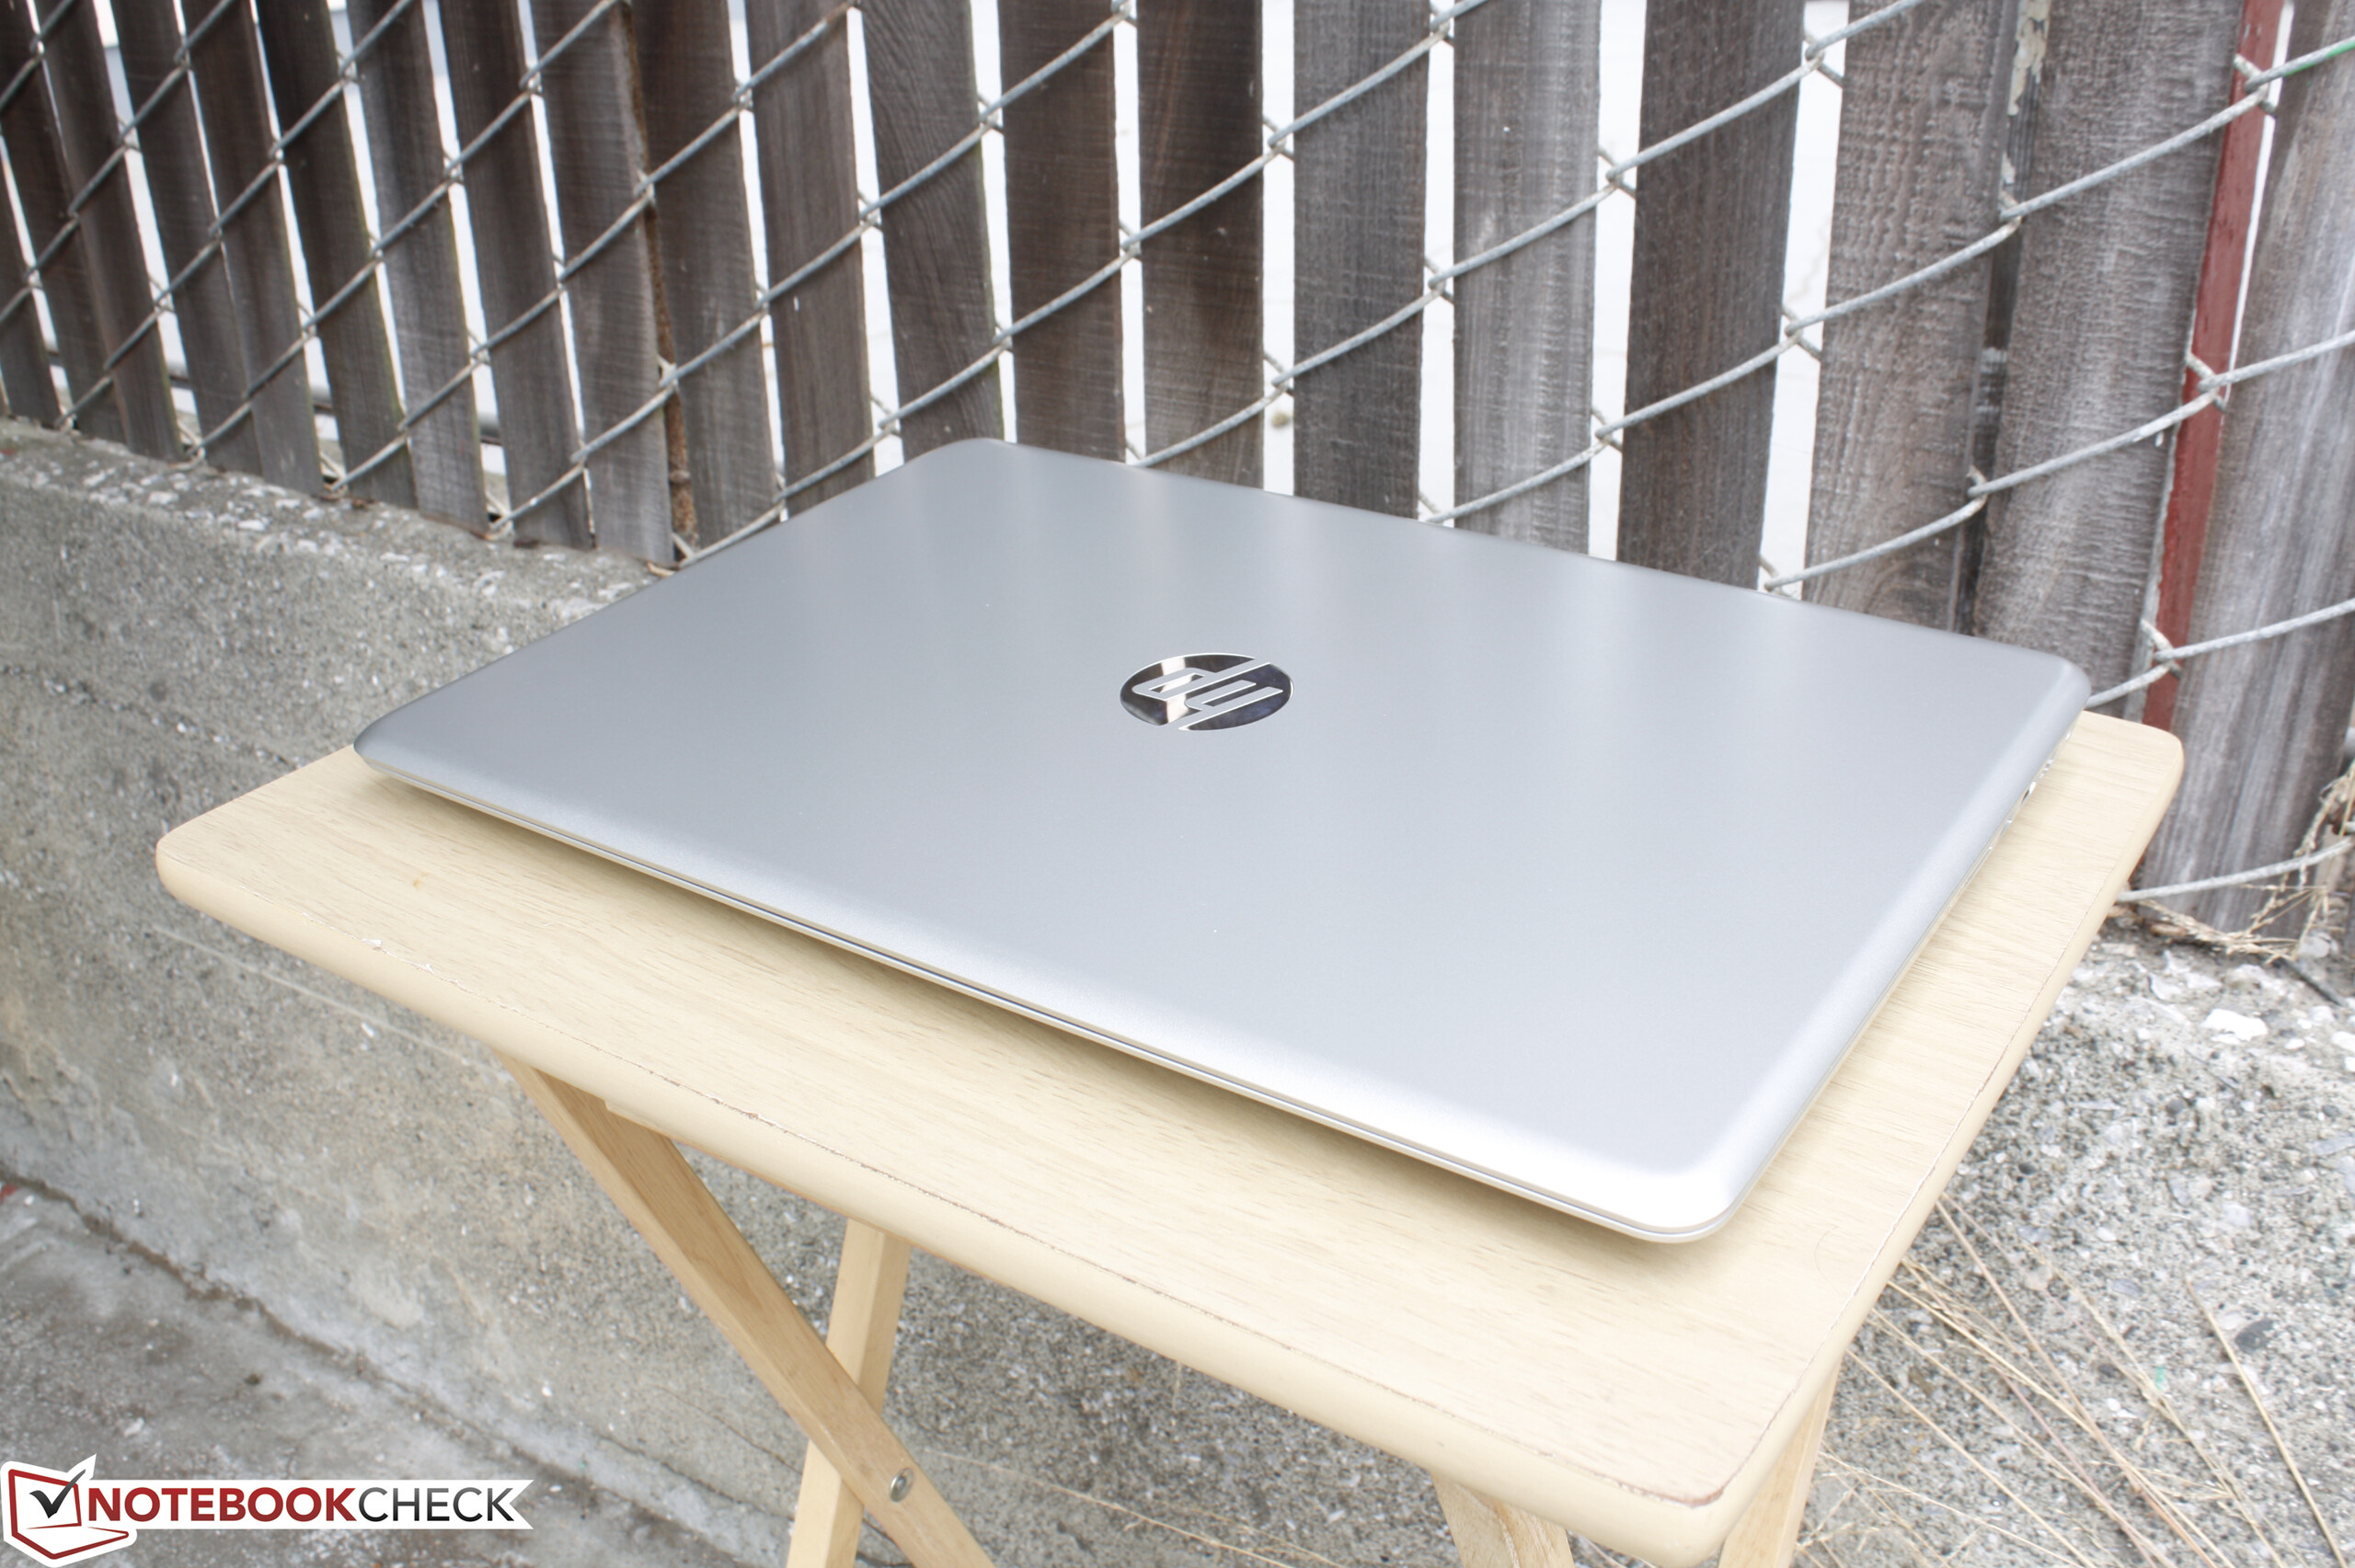
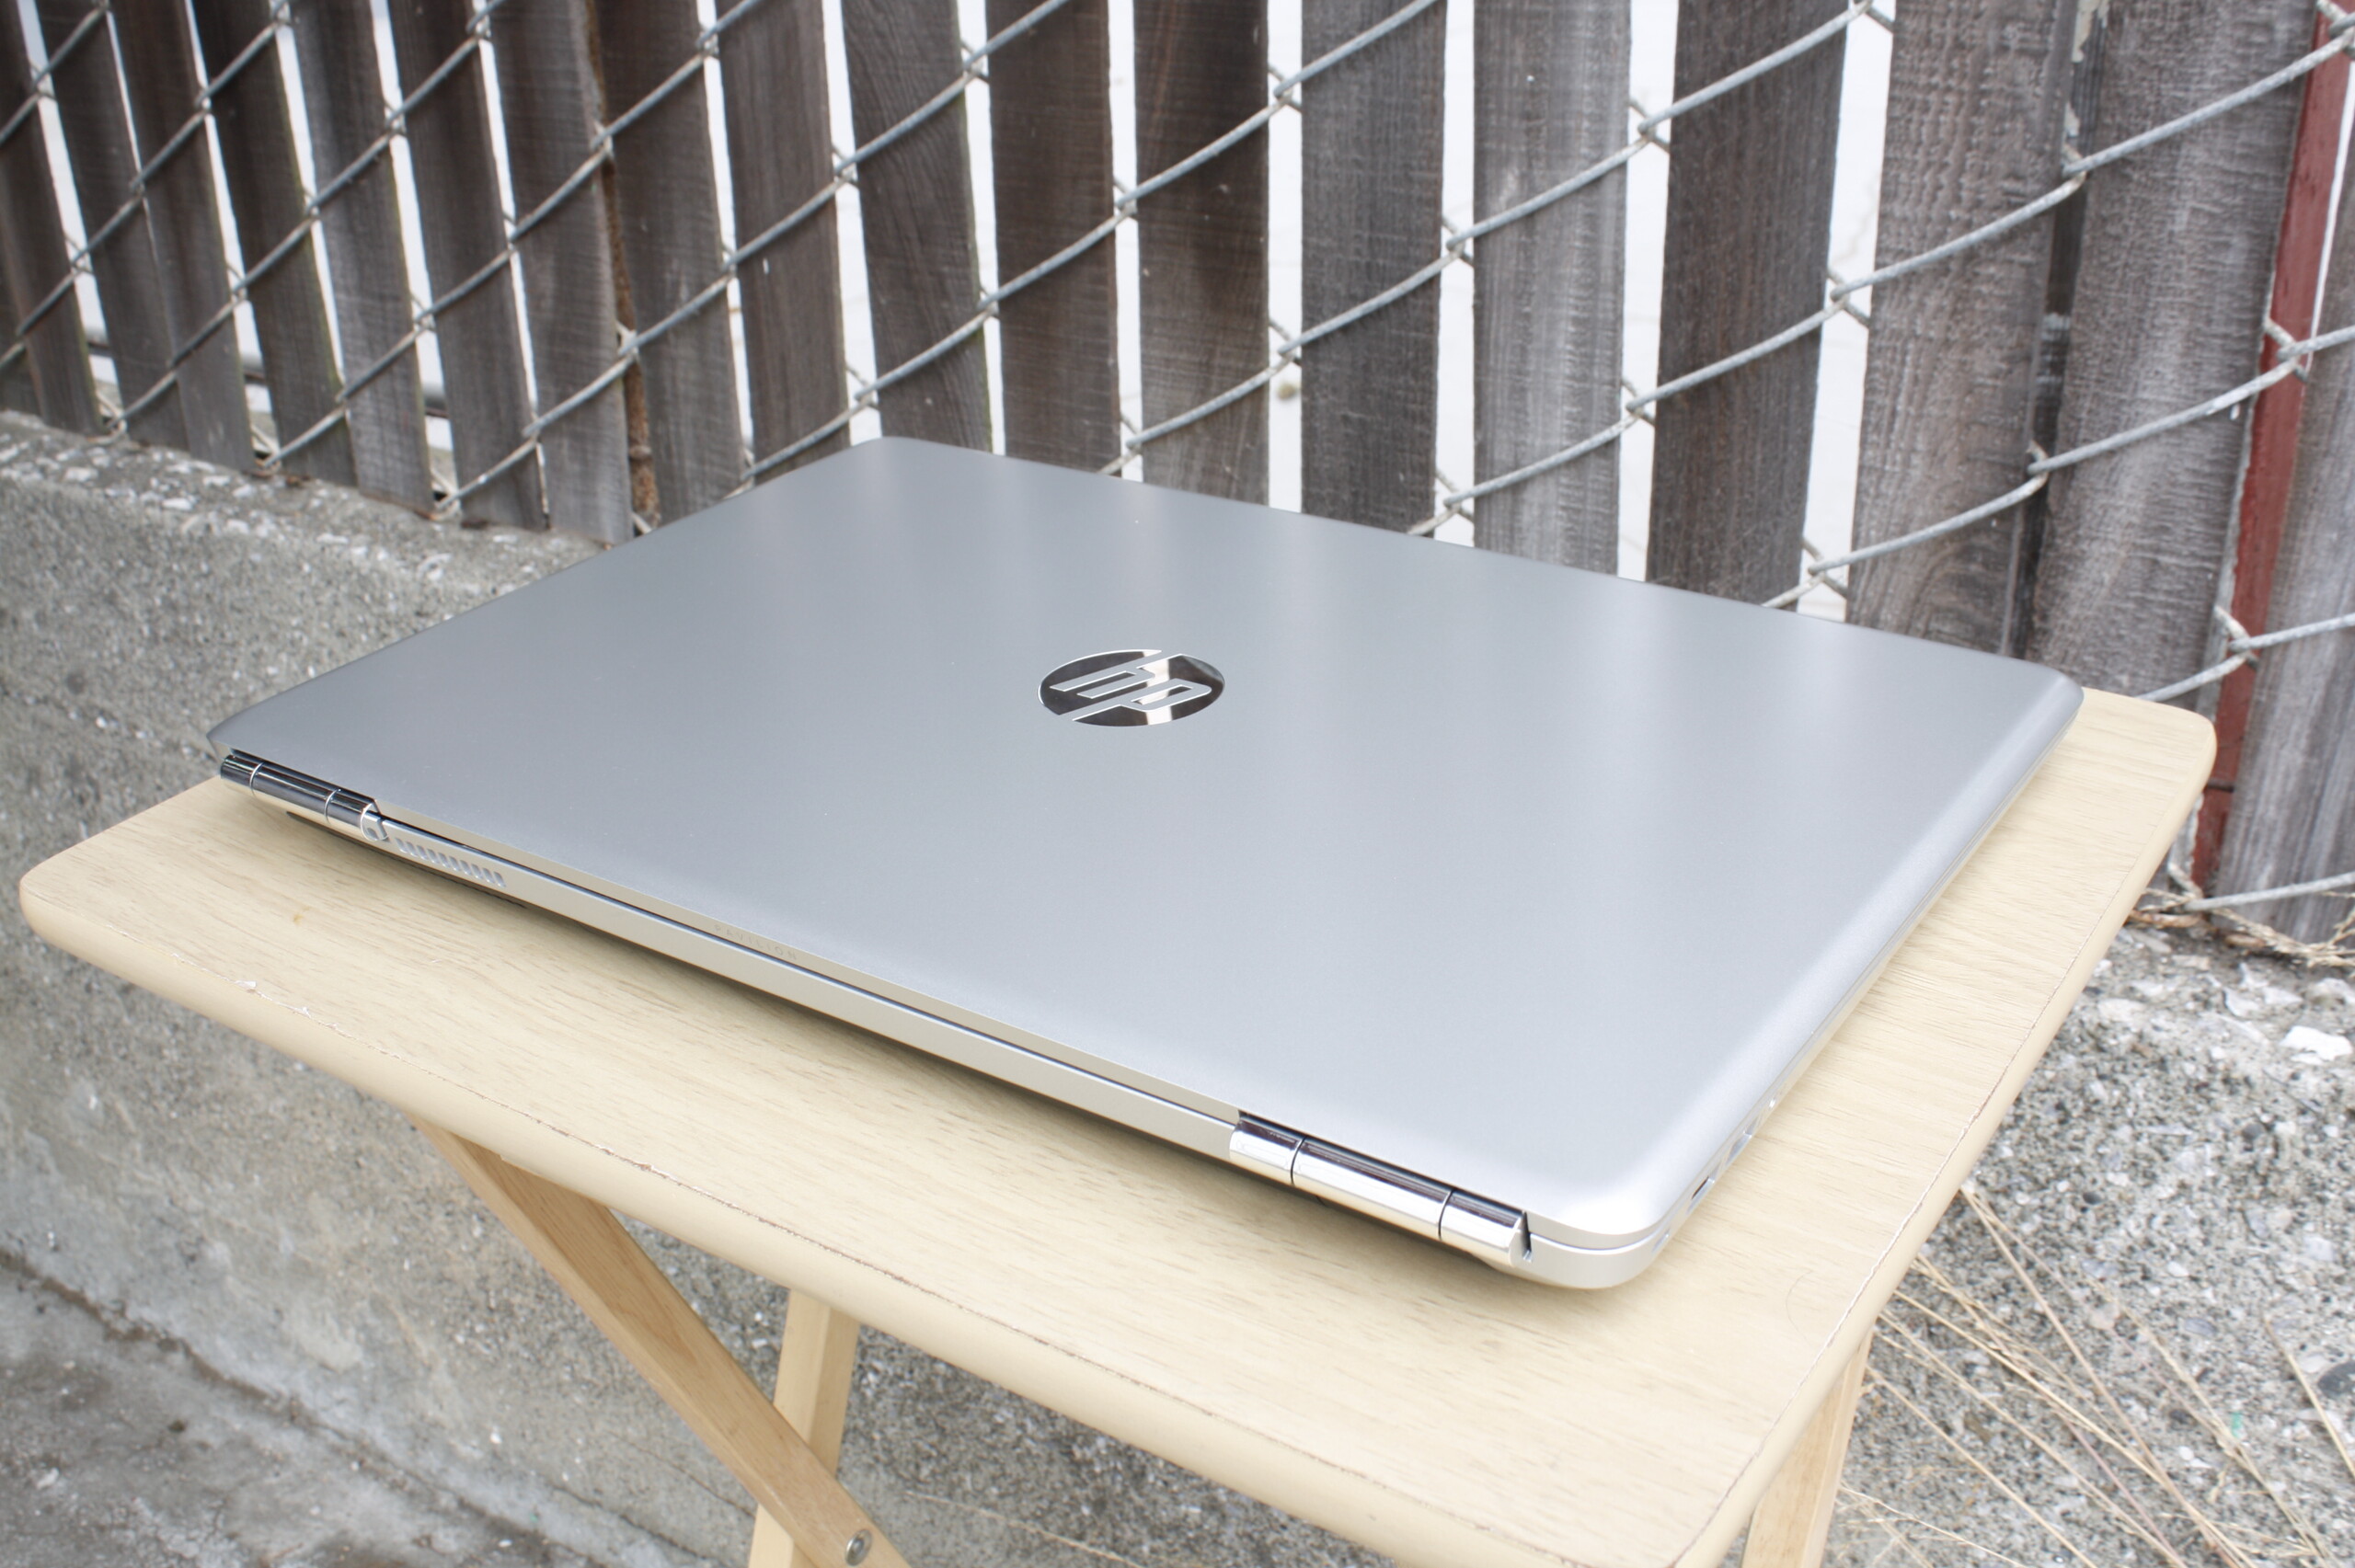
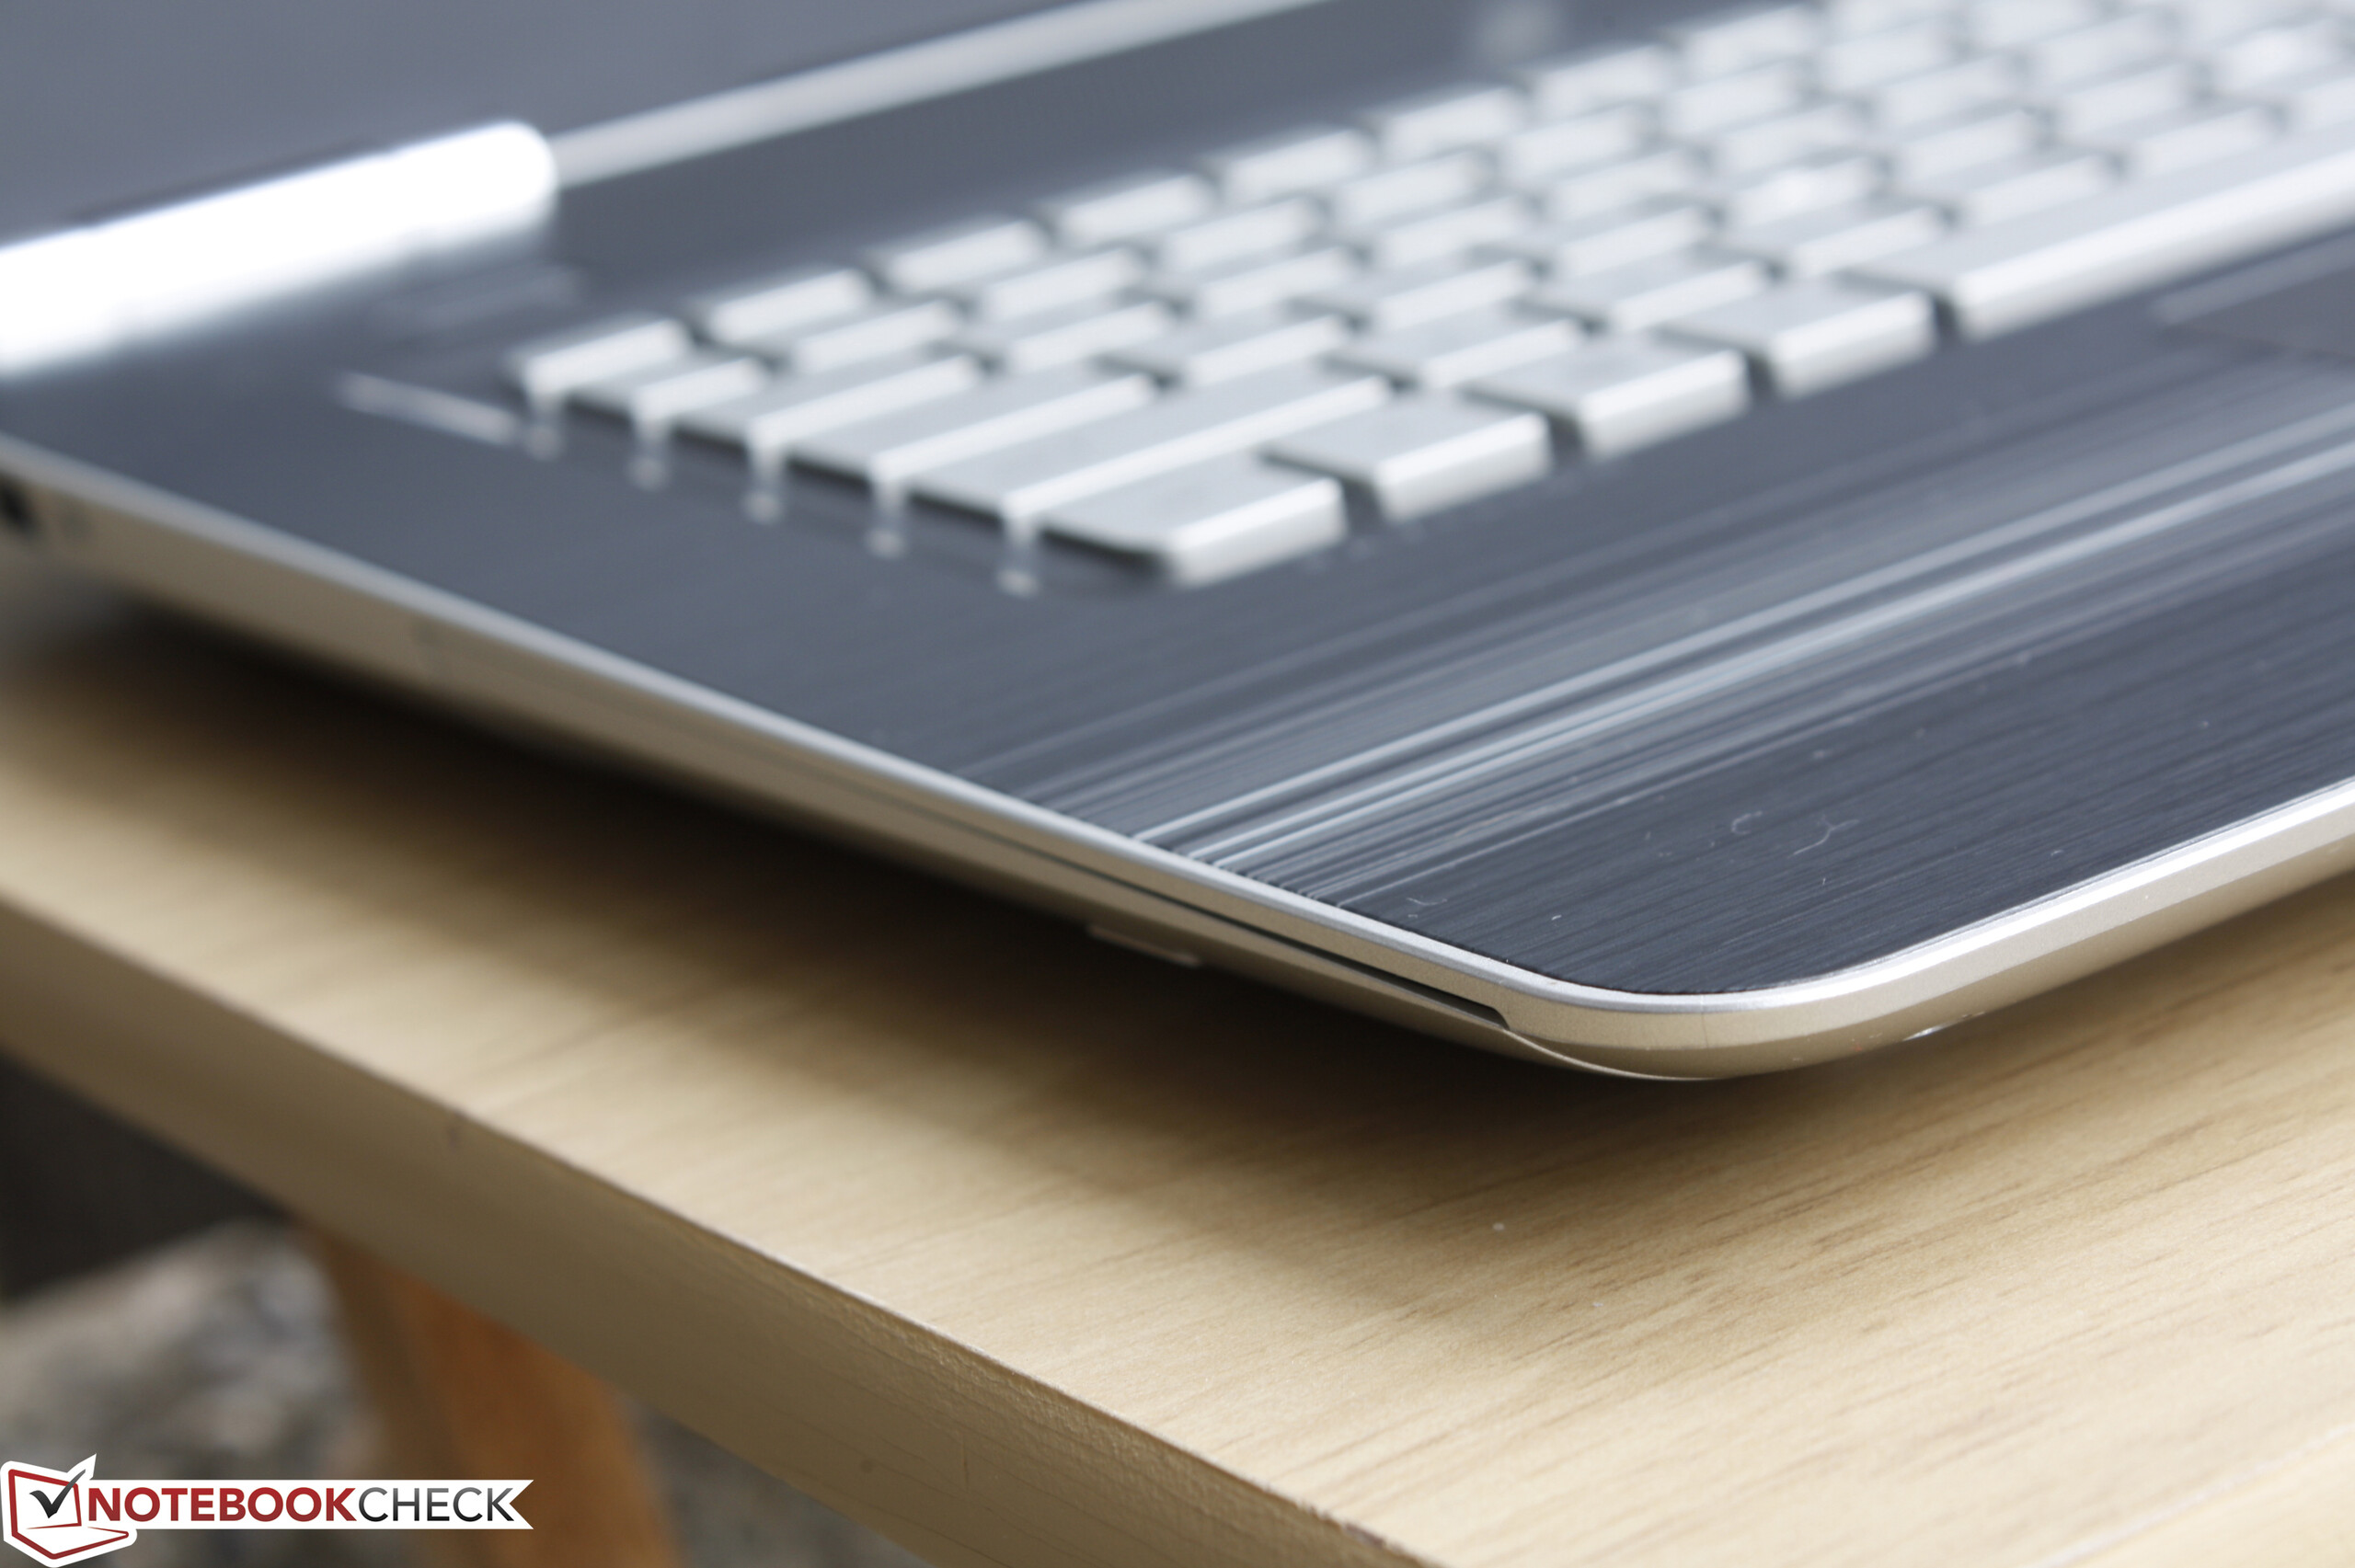
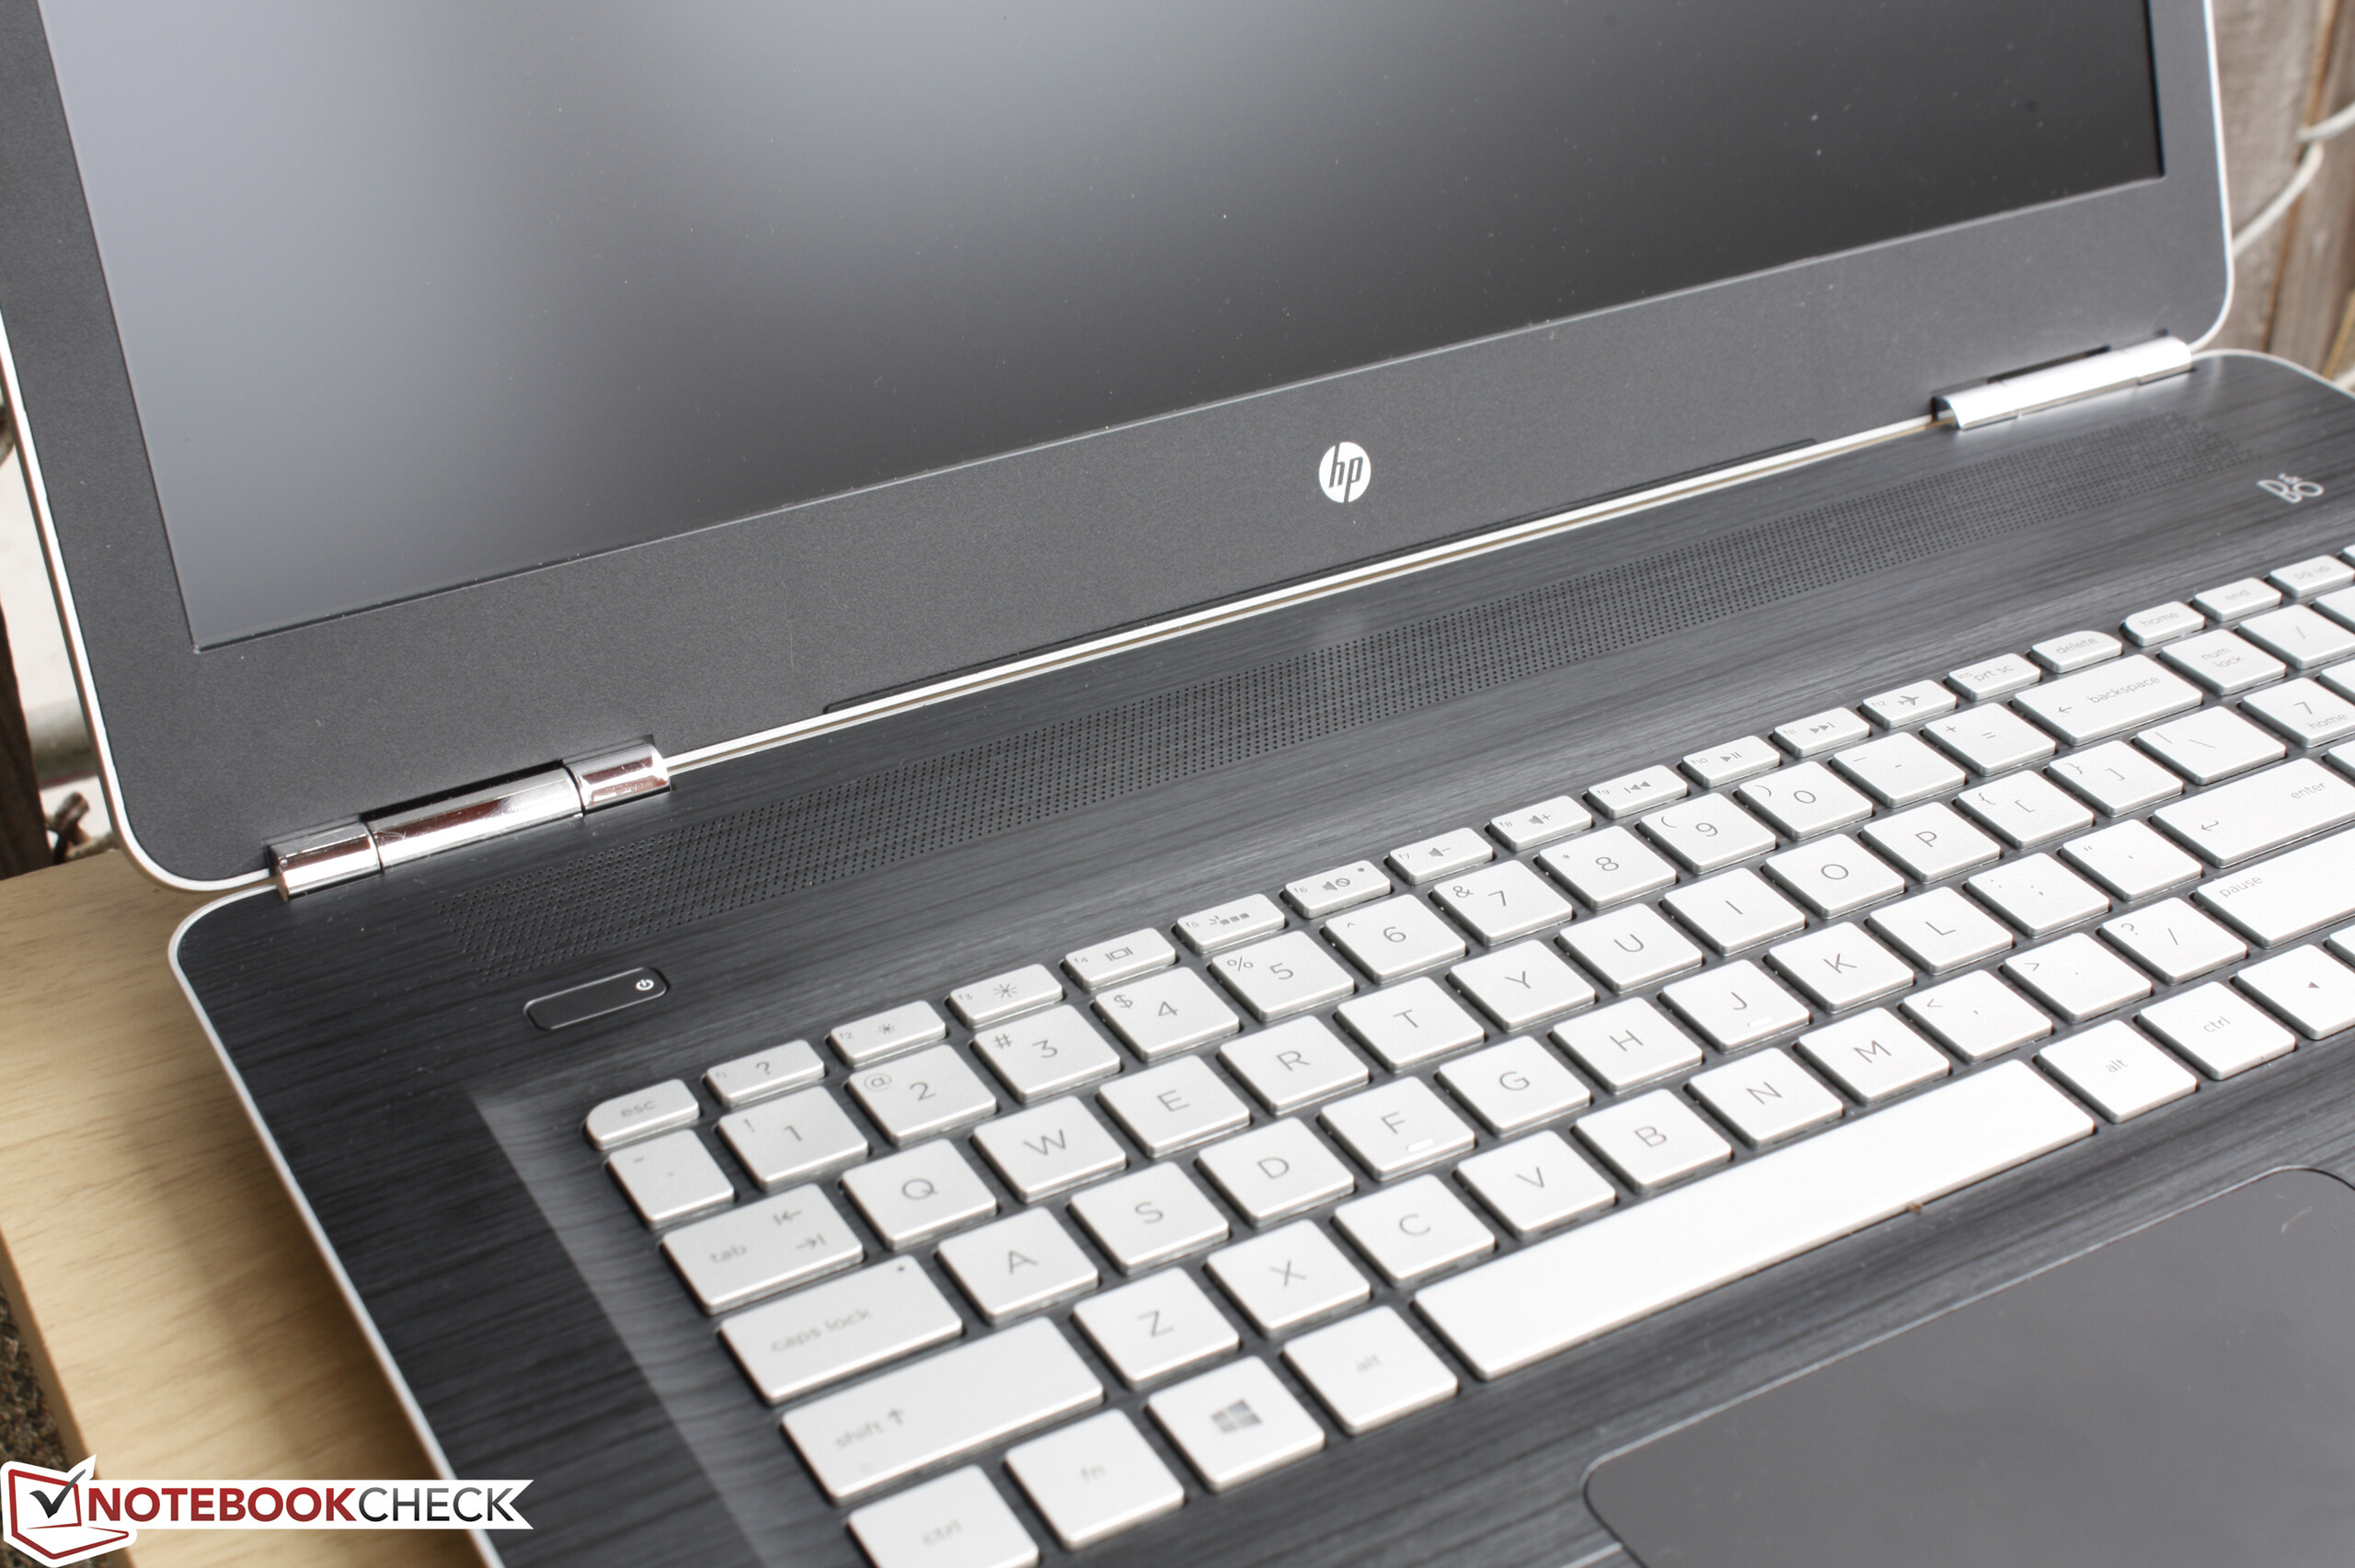
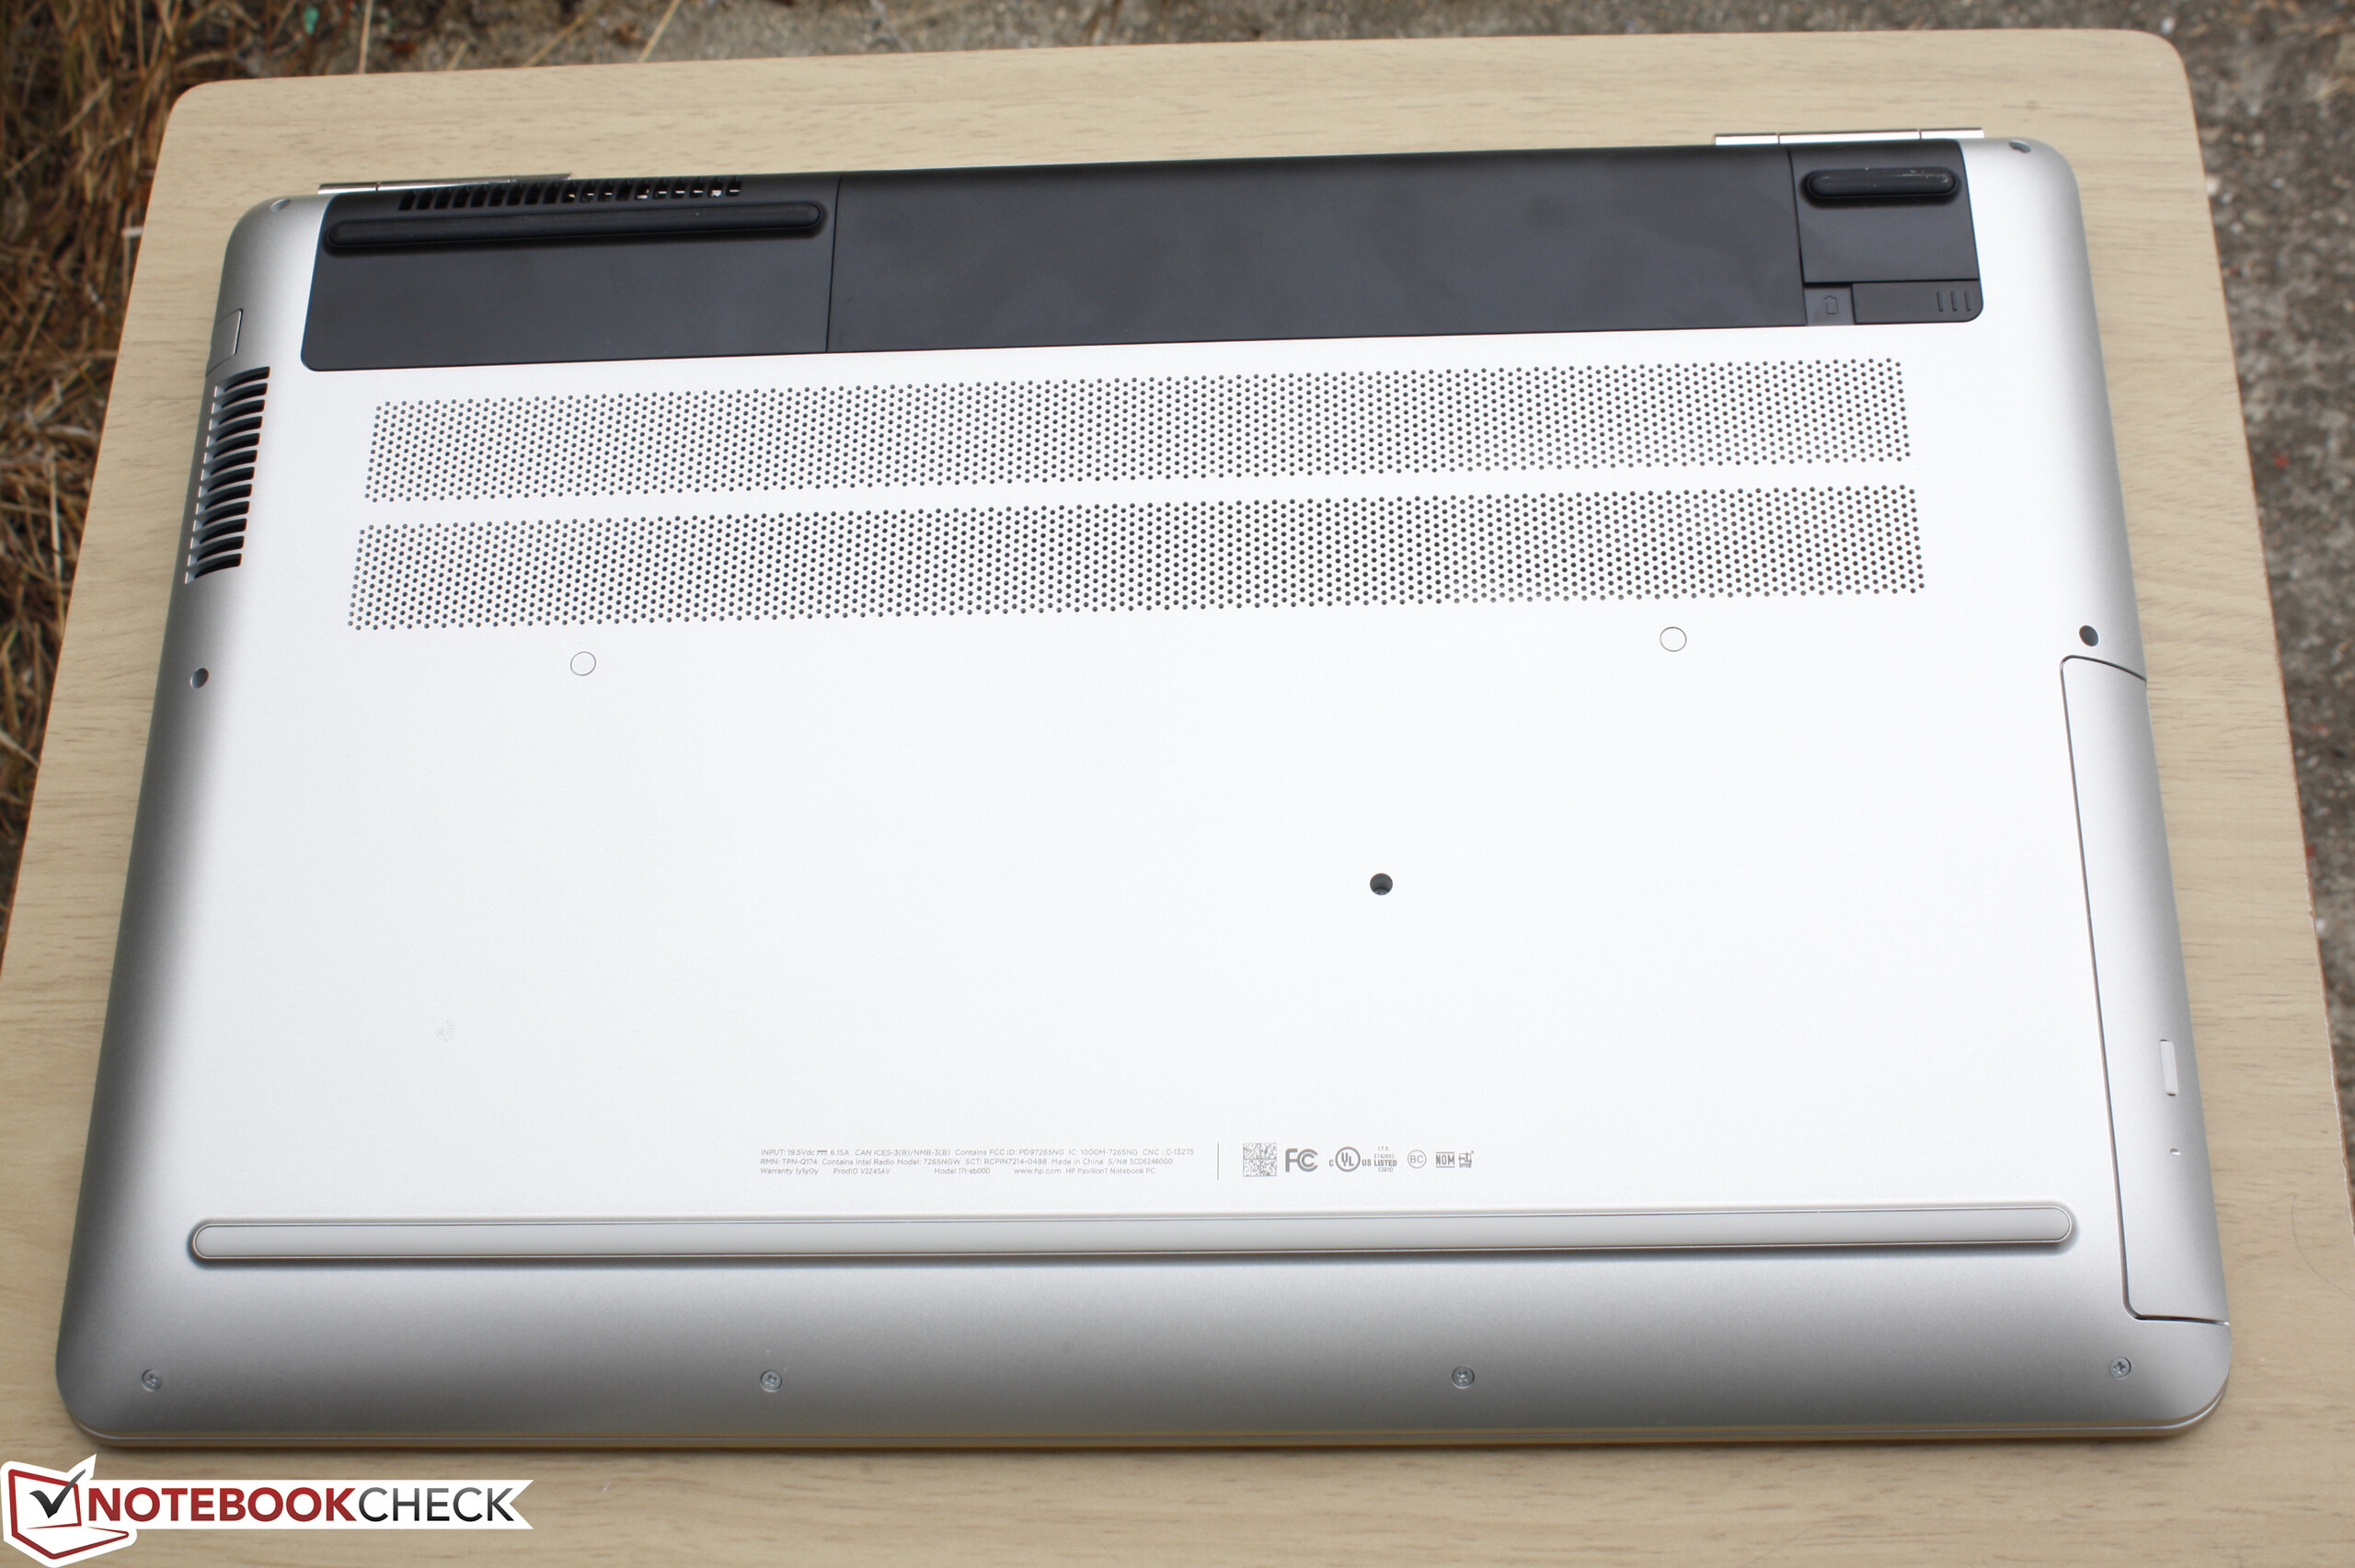
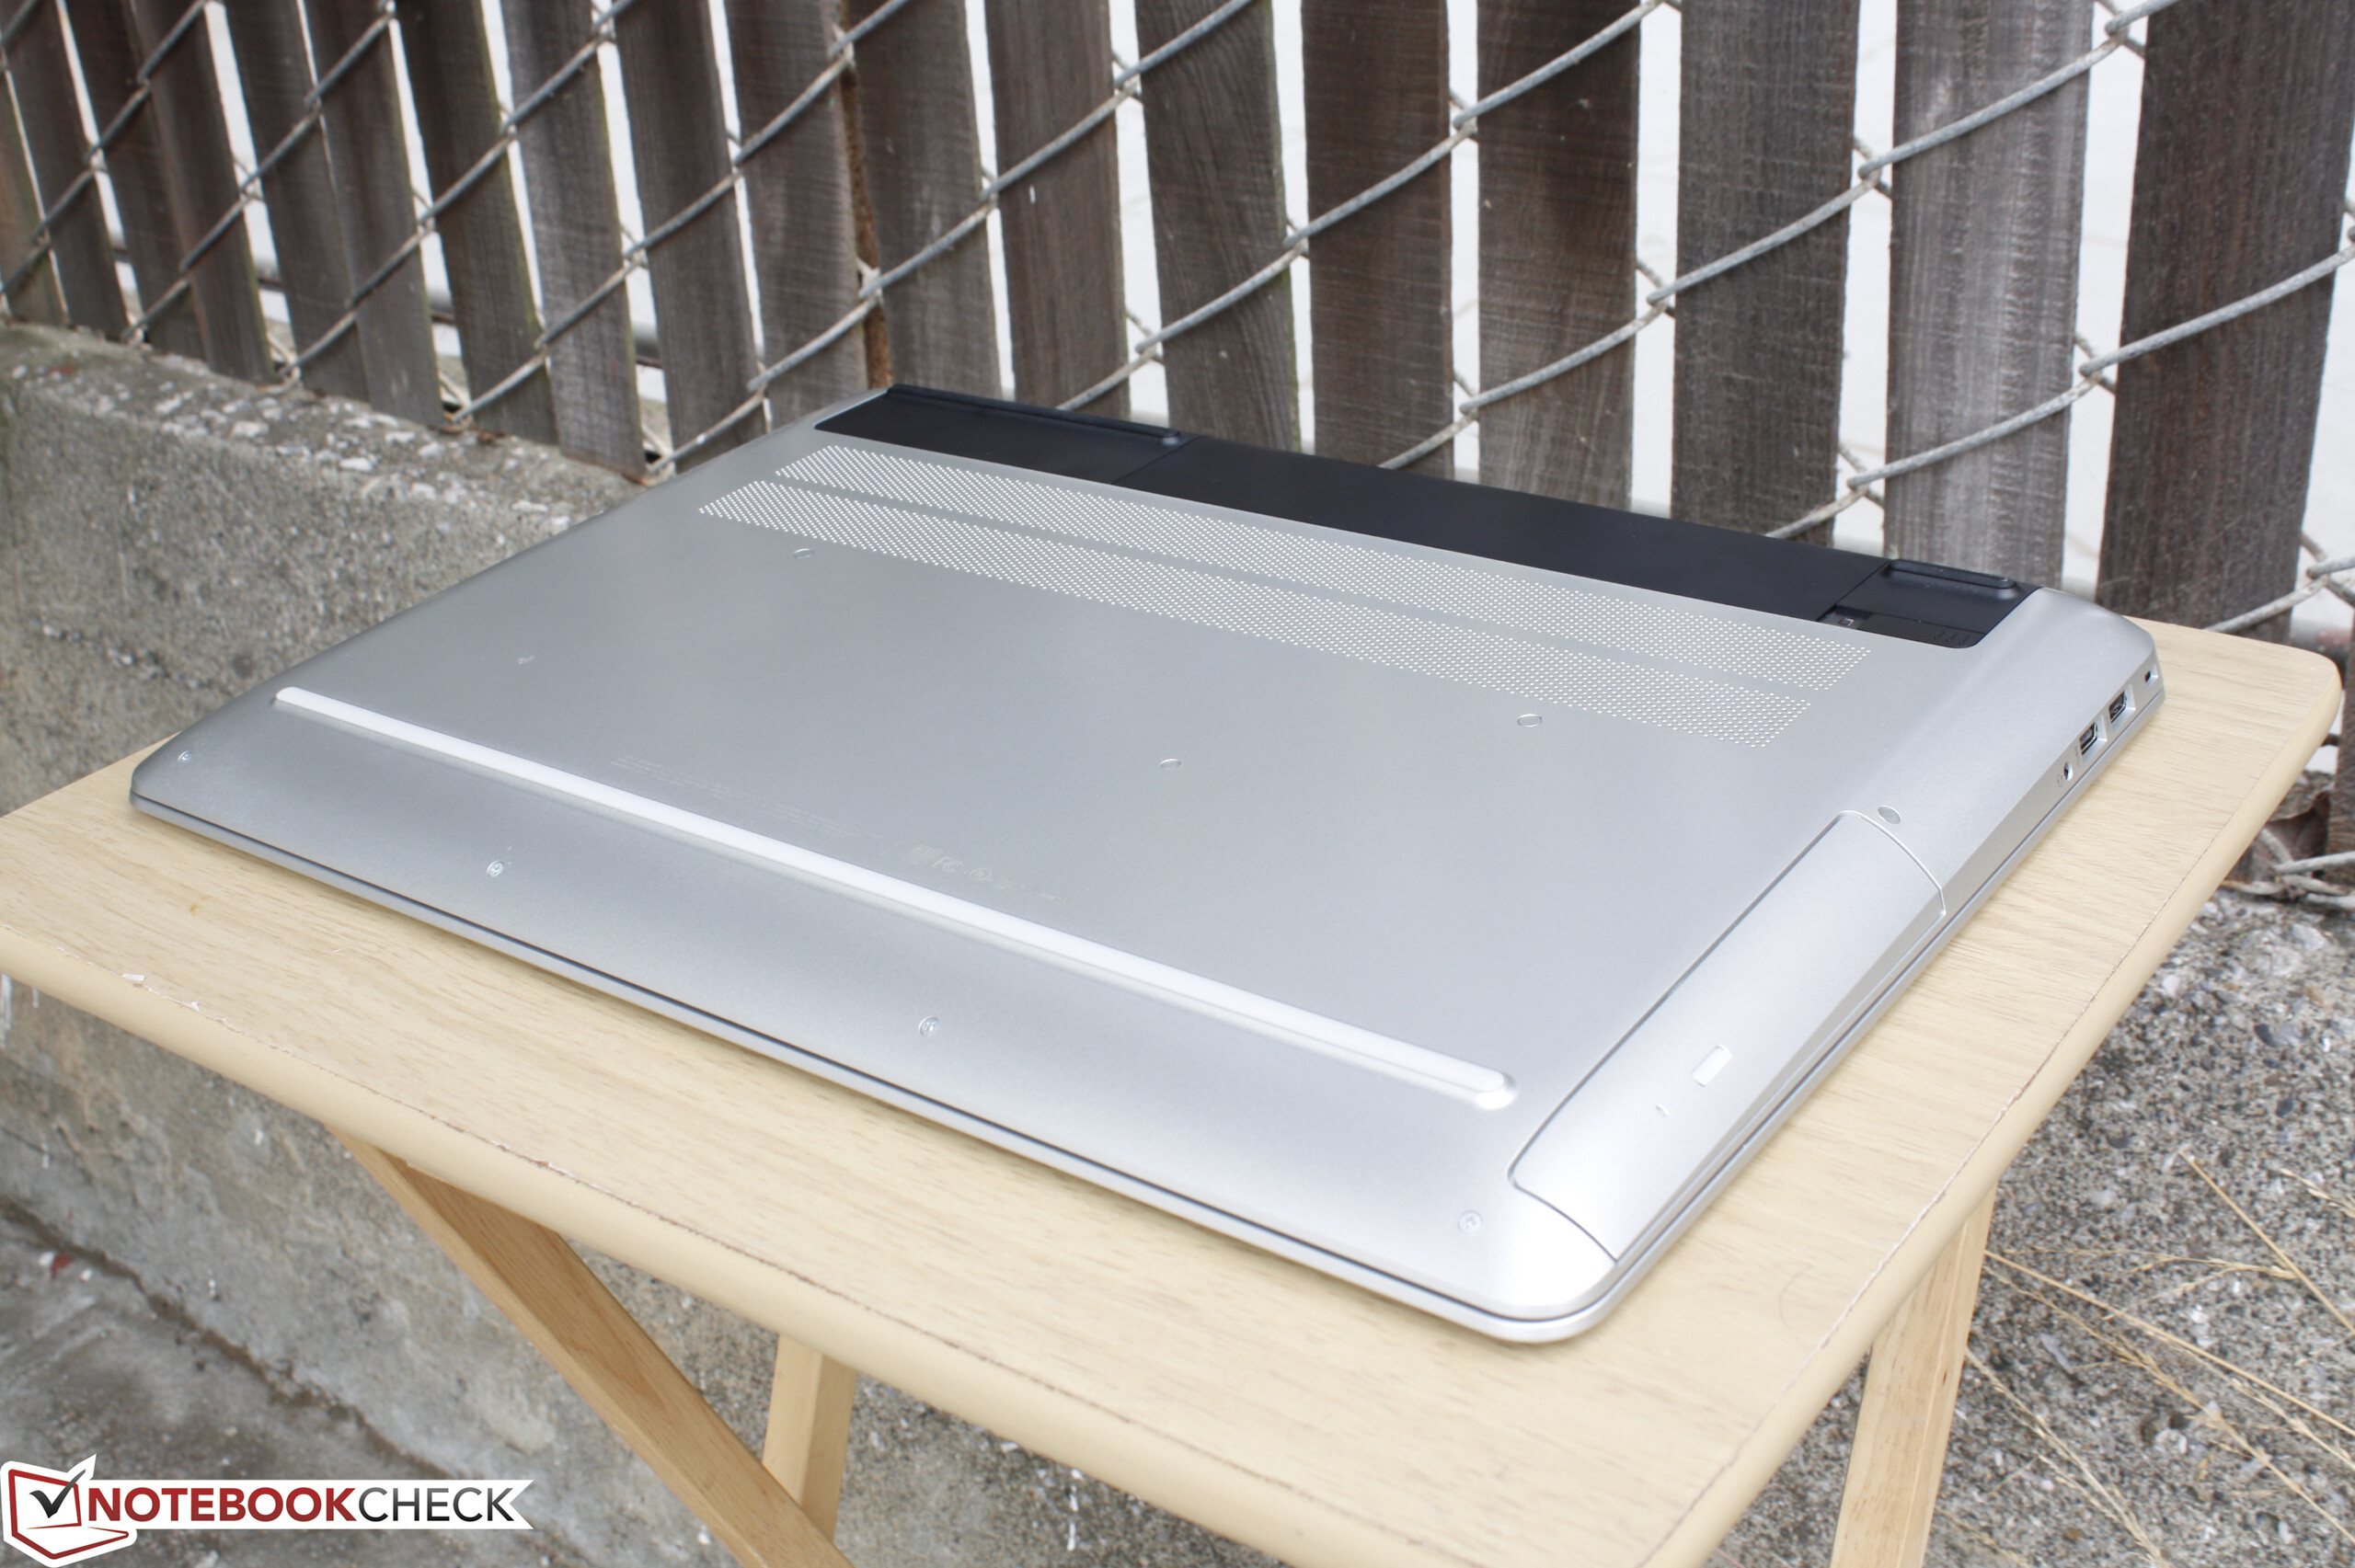
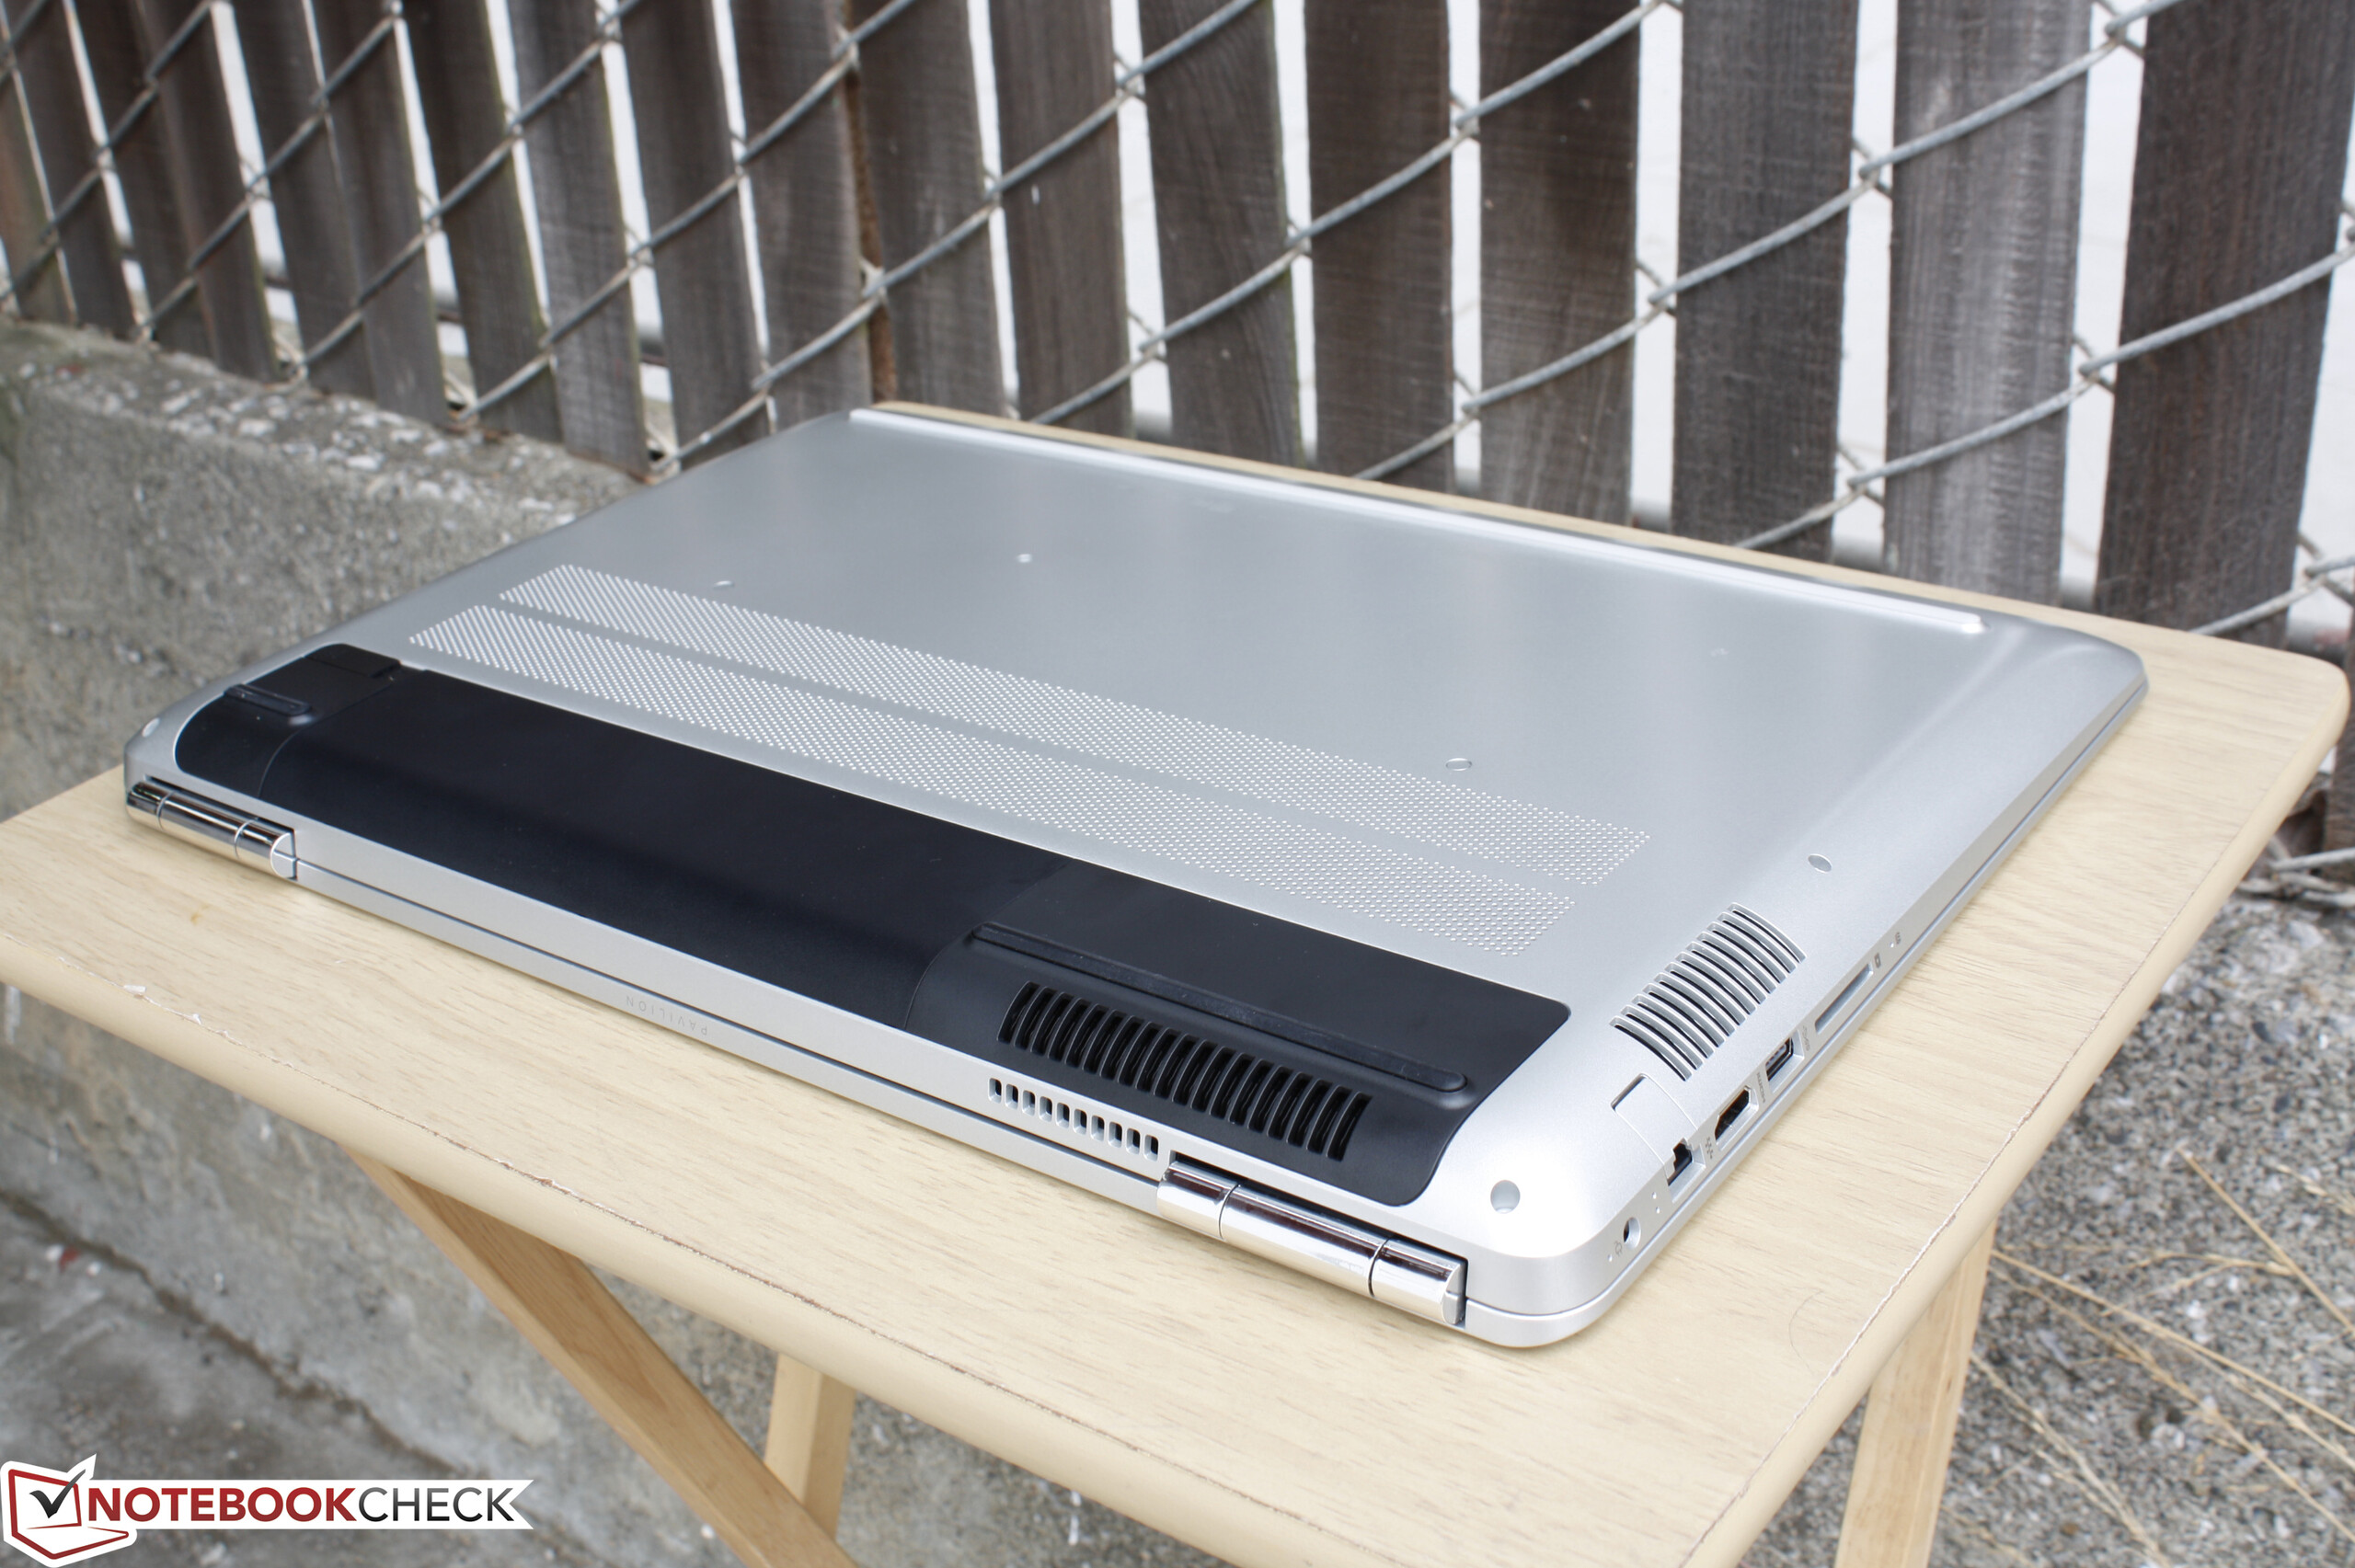
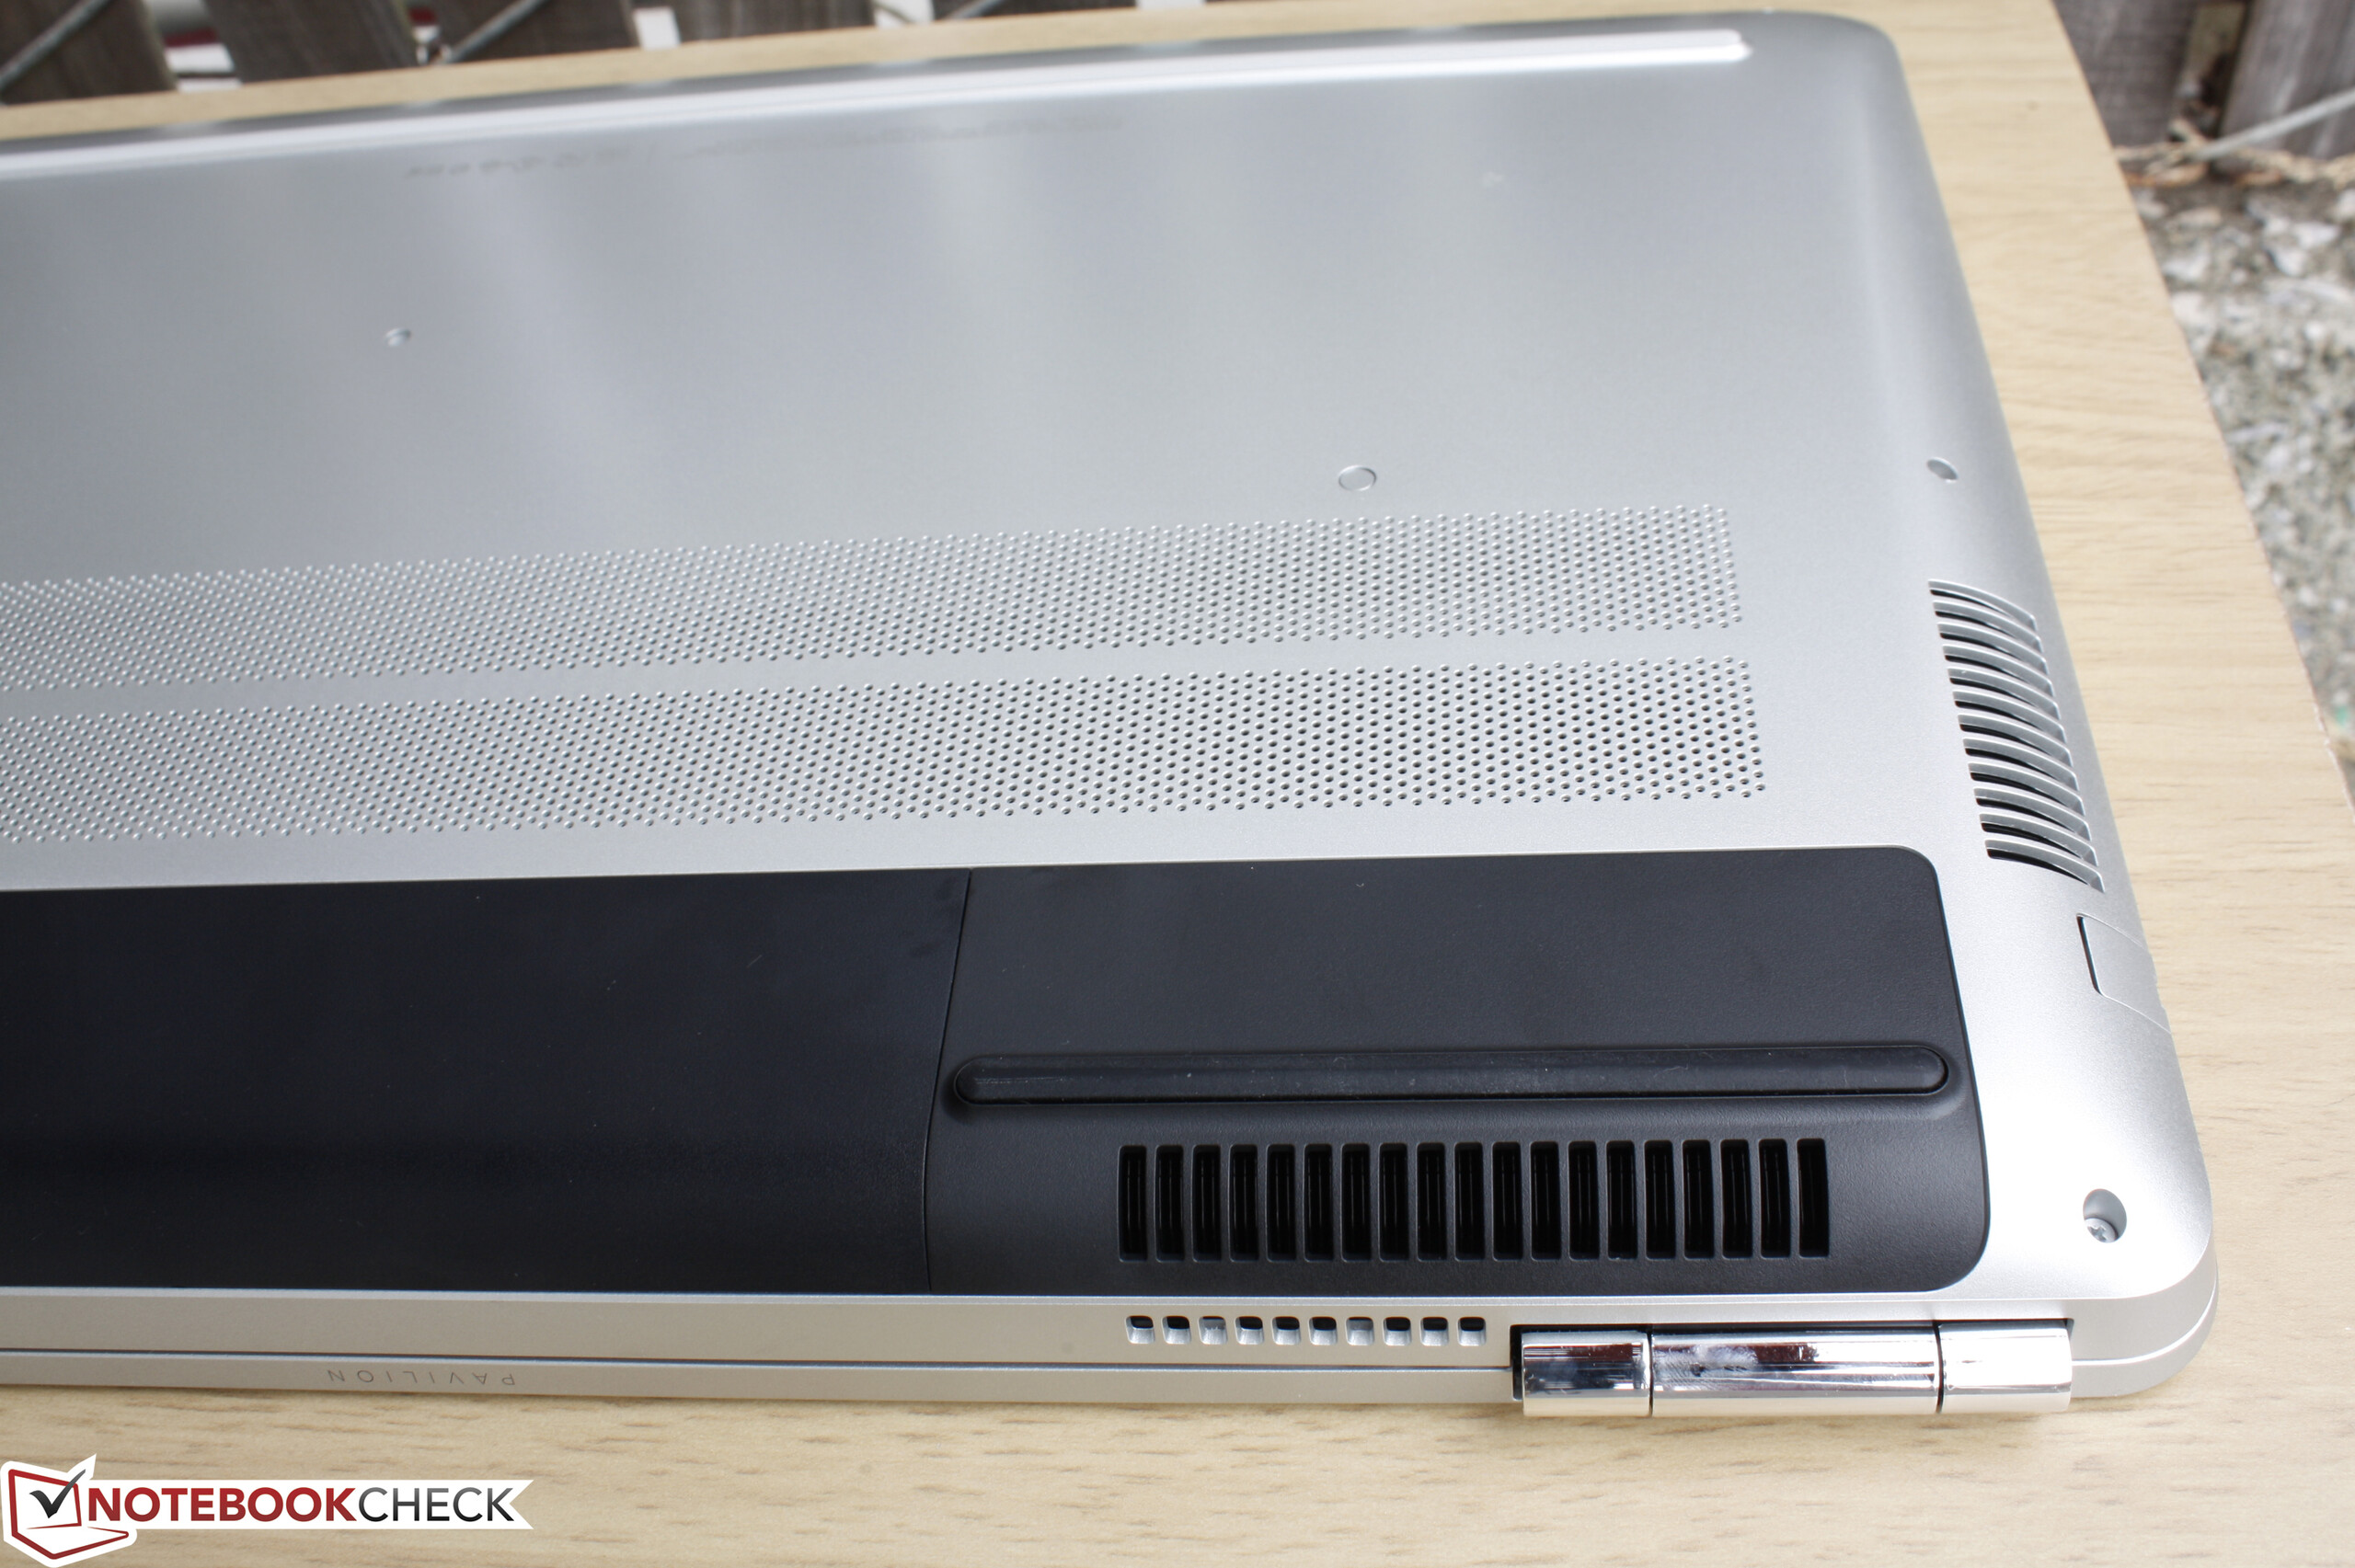
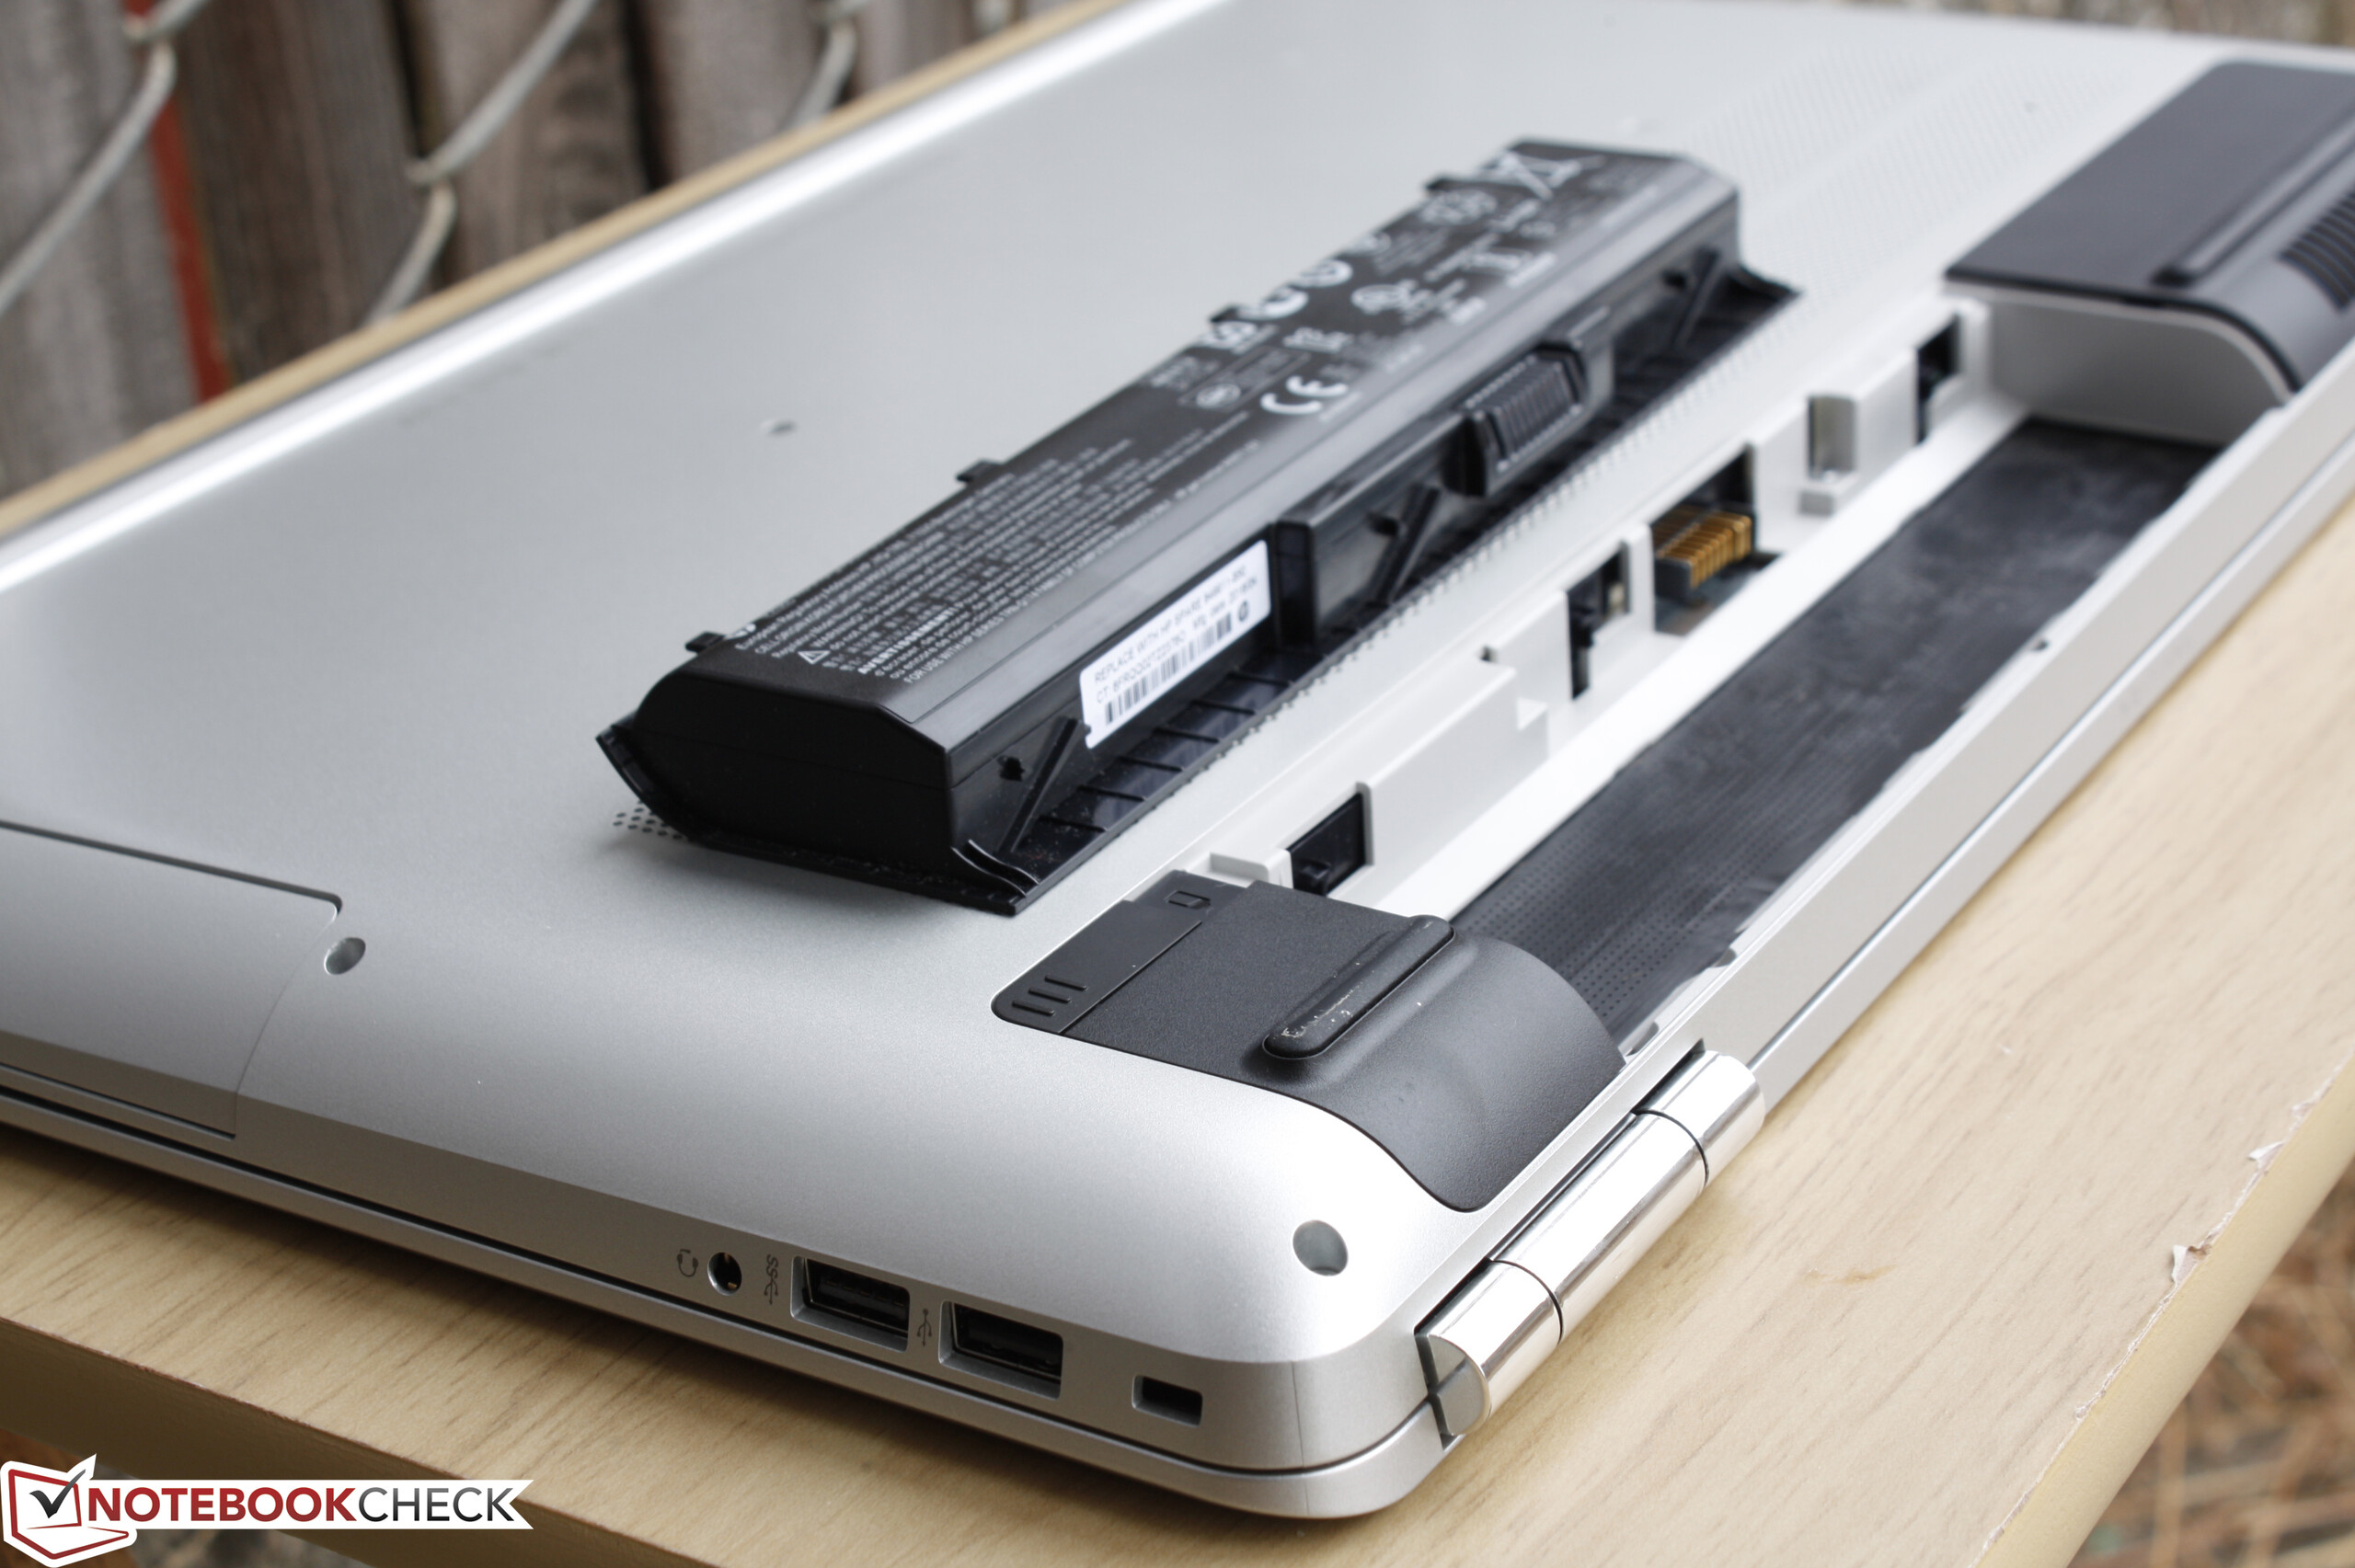
O mais recente Pavilion 17 caminha em uma linha fina entre ser um portátil multimídia e um portátil de jogos. Ele é mais poderoso do que o seu modesto design de plástico sugeriria e é relativamente portável considerando o tamanho de sua tela. Isto torna o portátil em uma solução de talentos múltiplos para aqueles que desejam uma tela maior e GPU Nvidia GTX sem comprometer muito o peso.
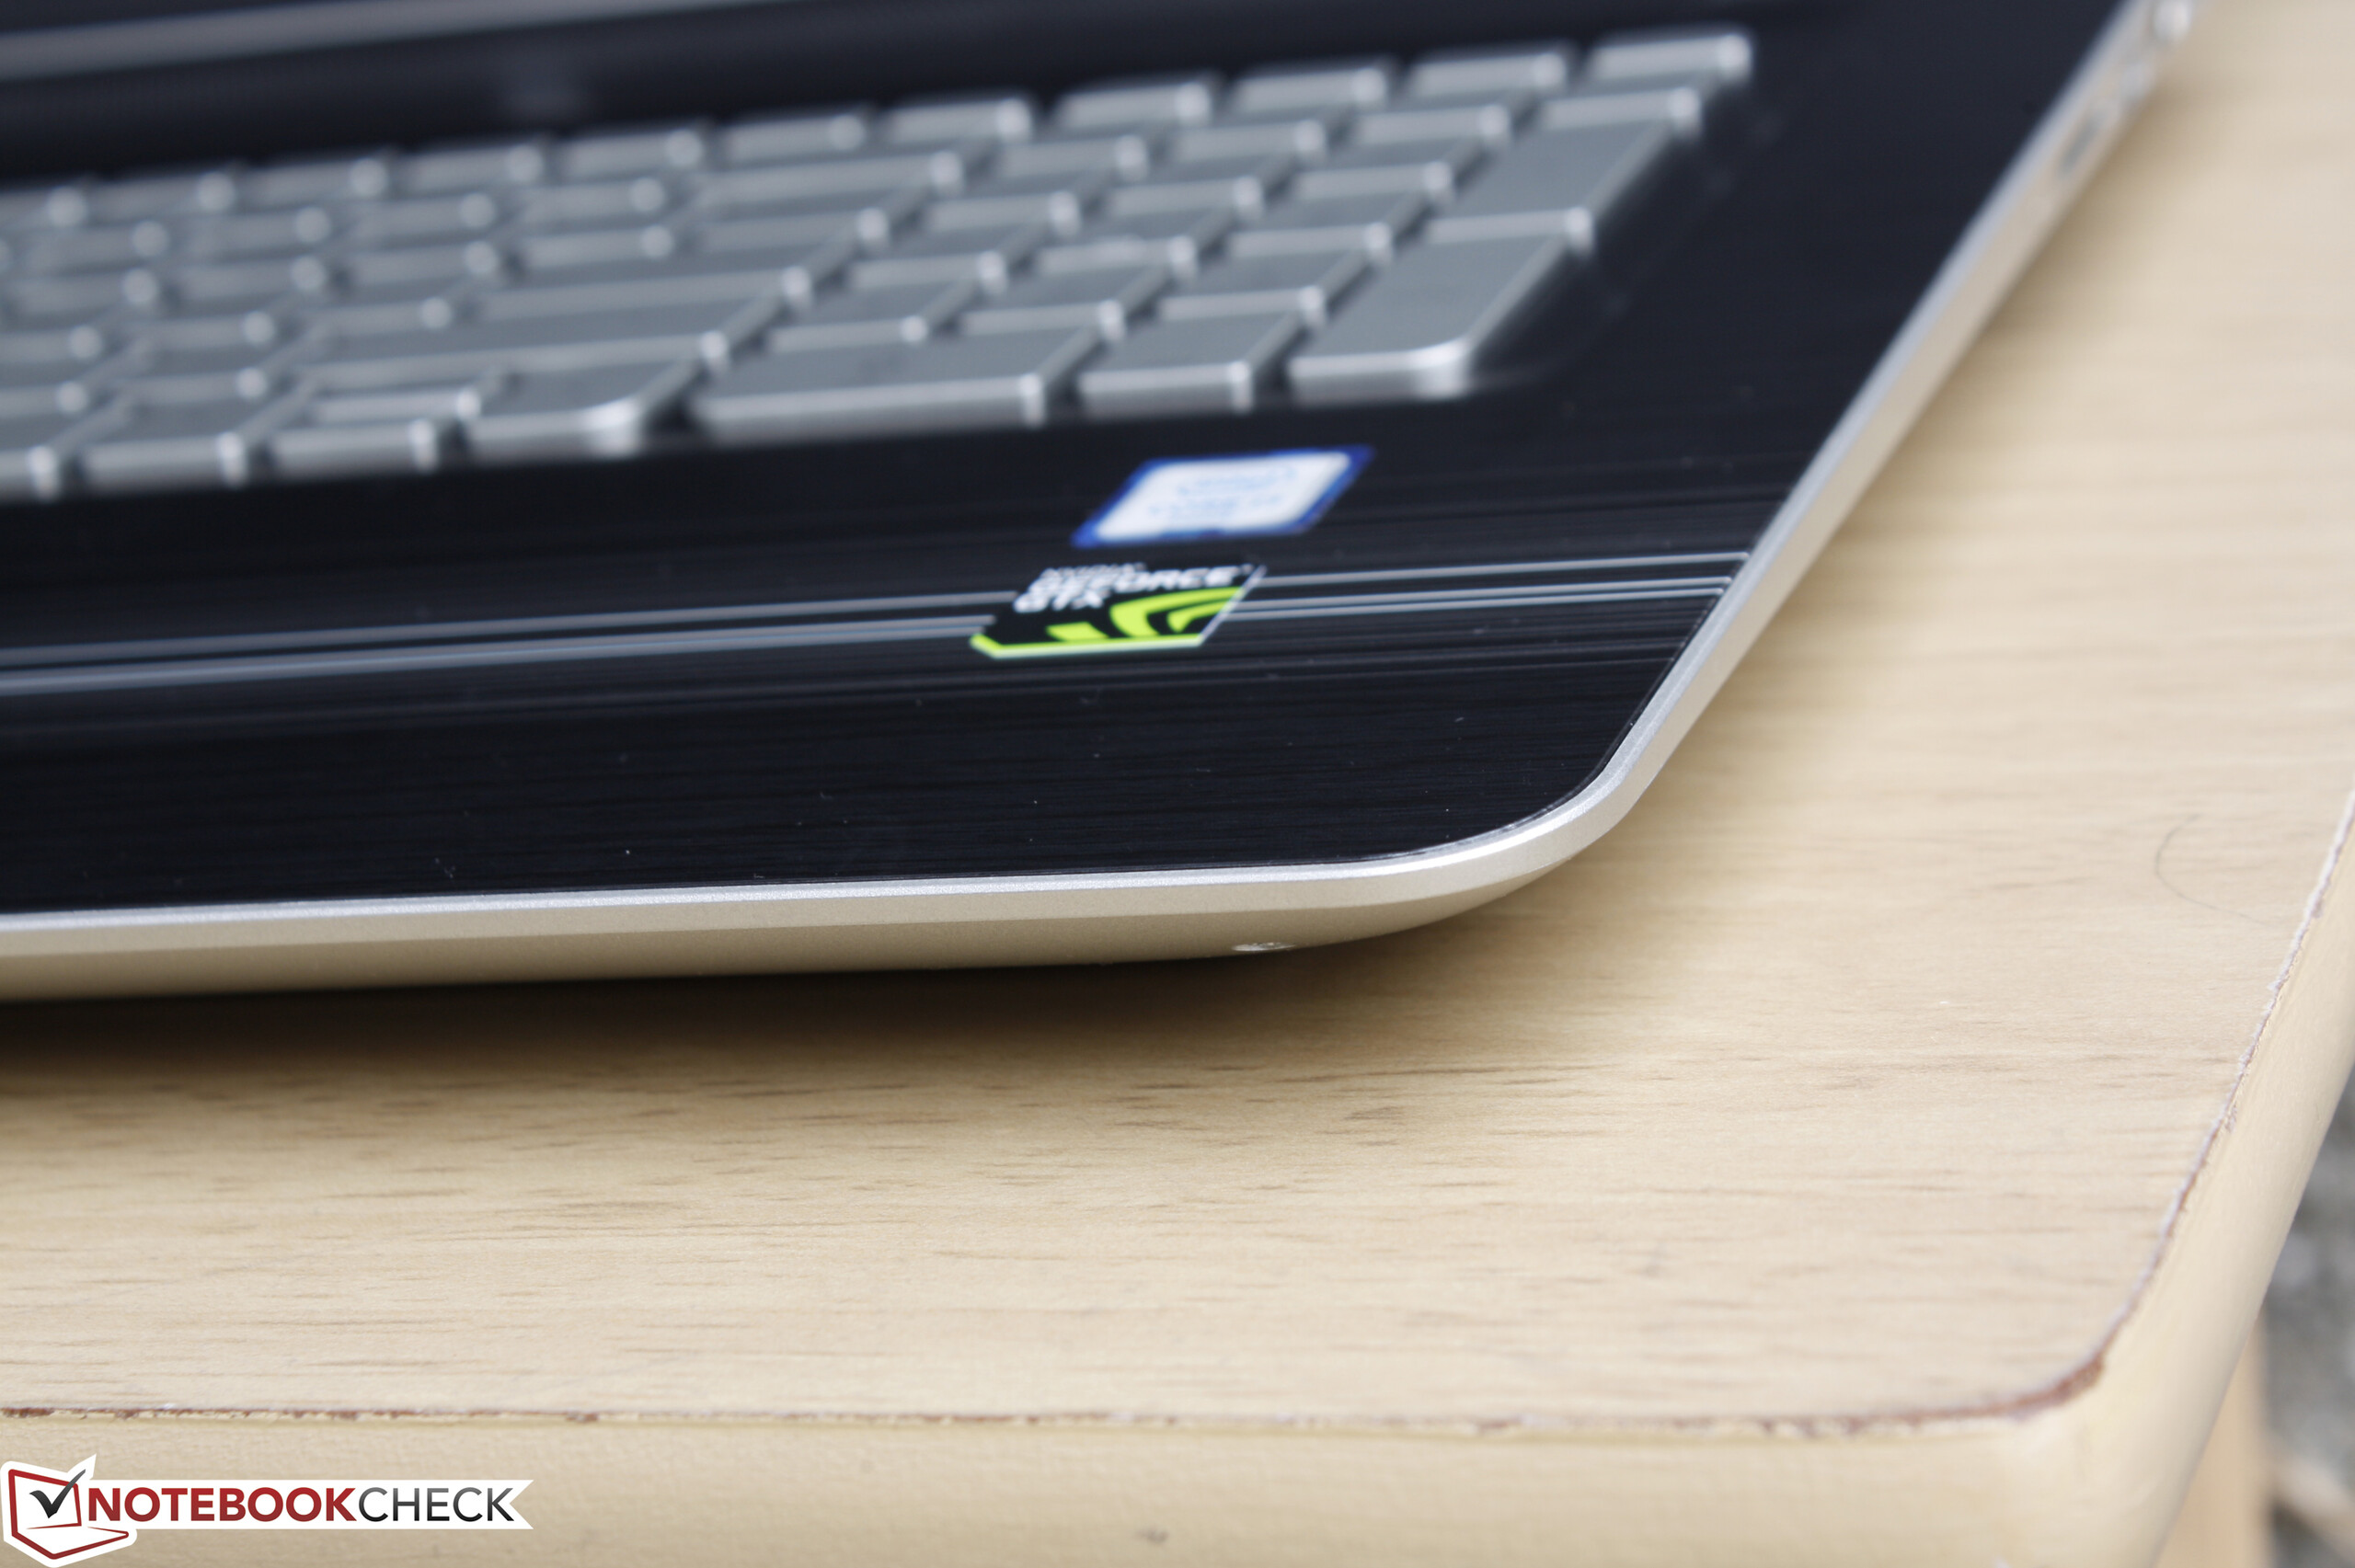
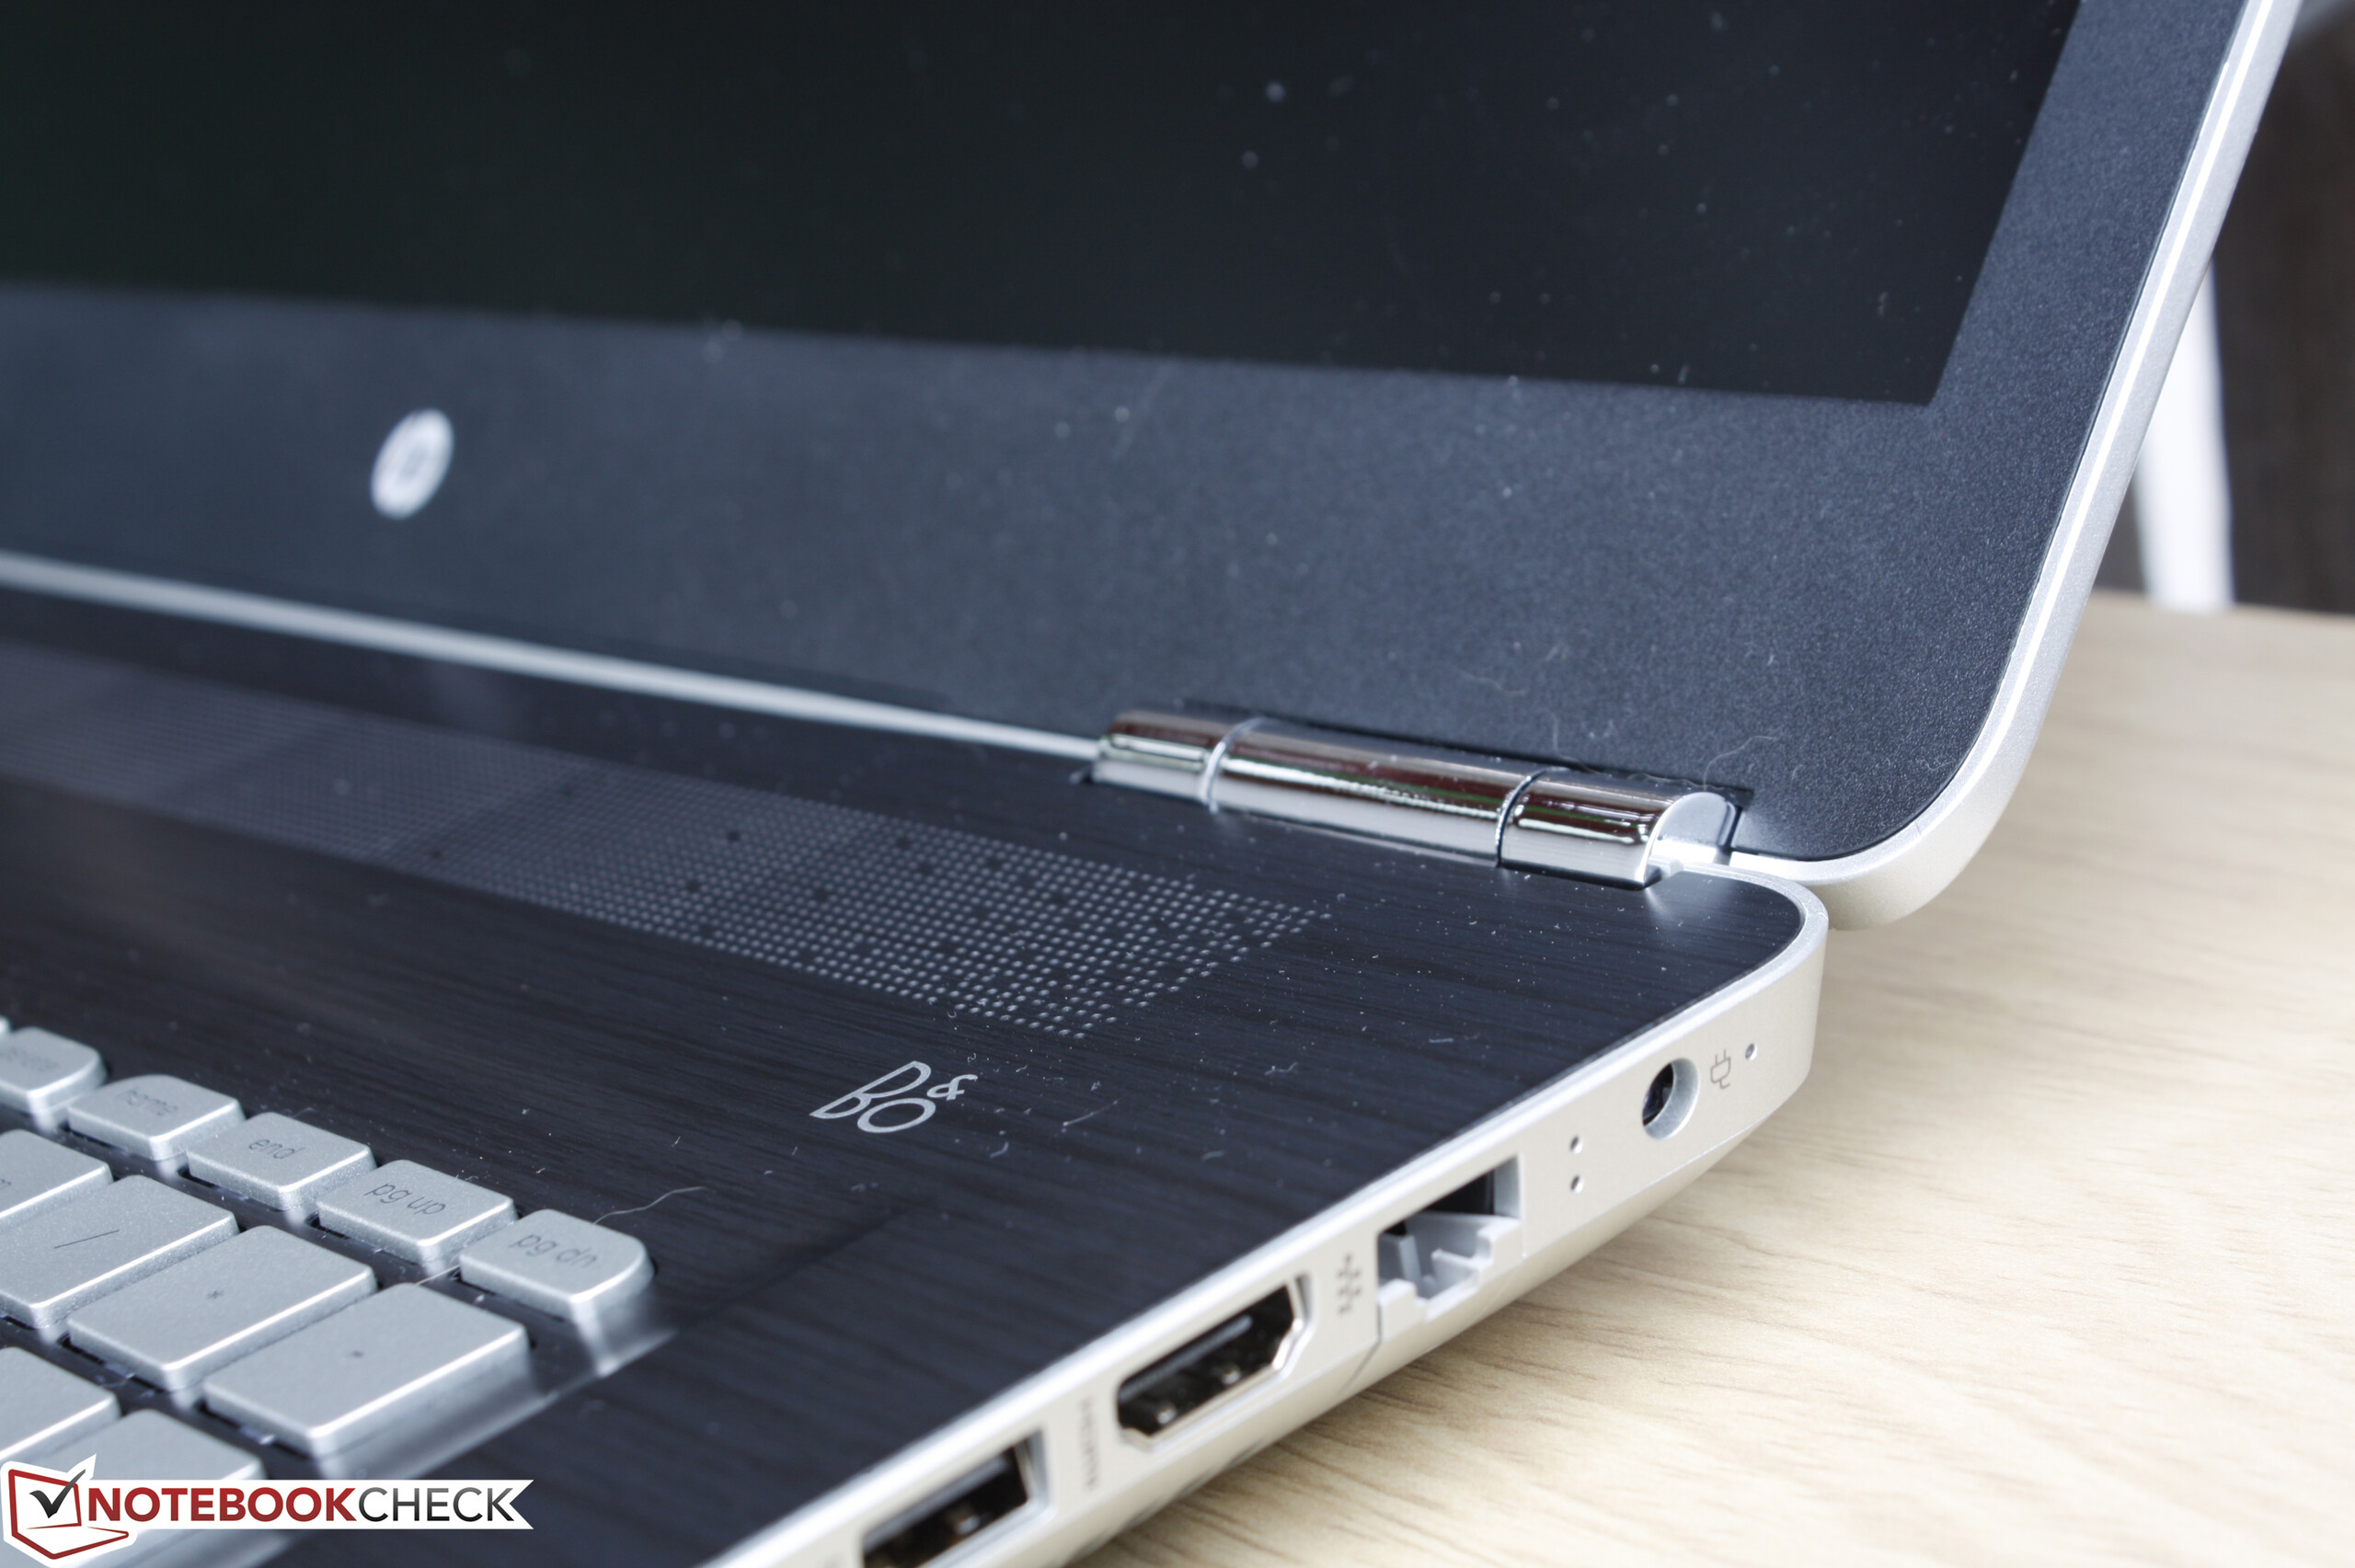
Olhe além dos gráficos e você terá um portátil barebone. O sistema não possui muitas opções de conectividade e recursos de gama alta encontrados em outros portáteis de jogos, como G-Sync e um subwoofer, e inclusive não possui alguns que são encontrados em Ultrabooks como USB Type-C e NVMe. O ruído da ventoinha é forte, inclusive para um portátil de jogos, devido, em parte, a seus poderosos componentes interiores, design relativamente fino, e uma só solução de resfriamento. Somente podemos recomendar o Pavilion 17 e sua GPU GTX 960Mse o tamanho de sua tela, portabilidade, preço e poder gráficos tomam a prioridade sobre os recursos extra, capacidade de manutenção, ruído da ventoinha.
Esta é uma versão reduzida da análise original. Você pode ler a análise completa em inglês.
HP Pavilion 17 FHD V3A33AV
- 08/16/2016 v5.1 (old)
Allen Ngo
Price comparison
