Breve Análise do Portátil HP Pavilion Gaming 16: Portátil barato de 16 polegadas com GPU GeForce
Avaliação | Data | Modelo | Peso | Altura | Size | Resolução | Preço |
|---|---|---|---|---|---|---|---|
| 79.9 % v7 (old) | 08/2020 | HP Pavilion Gaming 16-a0242ng i5-10300H, GeForce GTX 1650 Ti Mobile | 2.2 kg | 23.5 mm | 16.10" | 1920x1080 | |
| 83.7 % v7 (old) | 06/2020 | Dell G5 15 SE 5505 P89F R7 4800H, Radeon RX 5600M | 2.4 kg | 21.6 mm | 15.60" | 1920x1080 | |
| 82.7 % v7 (old) | 06/2020 | Asus TUF Gaming A15 FA506IV-HN172 R7 4800H, GeForce RTX 2060 Mobile | 2.2 kg | 24.9 mm | 15.60" | 1920x1080 | |
| 82.3 % v7 (old) | 11/2019 | Xiaomi Mi Gaming Laptop 2019 i7-9750H, GeForce RTX 2060 Mobile | 2.6 kg | 21 mm | 15.60" | 1920x1080 | |
| 83.3 % v7 (old) | 07/2020 | Lenovo Legion 5 15IMH05H i5-10300H, GeForce RTX 2060 Mobile | 2.5 kg | 26.1 mm | 15.60" | 1920x1080 | |
| 79.5 % v7 (old) | 07/2020 | MSI Bravo 15 A4DCR R7 4800H, Radeon RX 5300M | 2 kg | 22 mm | 15.60" | 1920x1080 |
| SD Card Reader | |
| average JPG Copy Test (av. of 3 runs) | |
| Média da turma Gaming (20.9 - 210, n=54, últimos 2 anos) | |
| Xiaomi Mi Gaming Laptop 2019 (Toshiba Exceria Pro SDXC 64 GB UHS-II) | |
| HP Pavilion Gaming 16-a0242ng (Toshiba Exceria Pro SDXC 64 GB UHS-II) | |
| Dell G5 15 SE 5505 P89F (Toshiba Exceria Pro SDXC 64 GB UHS-II) | |
| maximum AS SSD Seq Read Test (1GB) | |
| Média da turma Gaming (25.5 - 261, n=51, últimos 2 anos) | |
| HP Pavilion Gaming 16-a0242ng (Toshiba Exceria Pro SDXC 64 GB UHS-II) | |
| Xiaomi Mi Gaming Laptop 2019 (Toshiba Exceria Pro SDXC 64 GB UHS-II) | |
| Dell G5 15 SE 5505 P89F (Toshiba Exceria Pro SDXC 64 GB UHS-II) | |


| |||||||||||||||||||||||||
iluminação: 91 %
iluminação com acumulador: 319 cd/m²
Contraste: 1772:1 (Preto: 0.18 cd/m²)
ΔE ColorChecker Calman: 4 | ∀{0.5-29.43 Ø4.71}
calibrated: 3.52
ΔE Greyscale Calman: 1.53 | ∀{0.09-98 Ø4.96}
60% sRGB (Argyll 1.6.3 3D)
38% AdobeRGB 1998 (Argyll 1.6.3 3D)
41.77% AdobeRGB 1998 (Argyll 3D)
60.7% sRGB (Argyll 3D)
40.42% Display P3 (Argyll 3D)
Gamma: 2.39
CCT: 6533 K
| HP Pavilion Gaming 16-a0242ng BOE08F6, IPS, 1920x1080, 16.1" | Dell G5 15 SE 5505 P89F BOE NV156FH, WVA, 1920x1080, 15.6" | Asus TUF Gaming A15 FA506IV-HN172 LM156LF-2F01, IPS, 1920x1080, 15.6" | Xiaomi Mi Gaming Laptop 2019 NV156FHM-N4G (BOE0867), IPS, 1920x1080, 15.6" | Lenovo Legion 5 15IMH05H BOE CQ NV156FHM-NX1, IPS, 1920x1080, 15.6" | MSI Bravo 15 A4DCR AU Optronics B156HAN08.0 (AUO80ED), IPS-Level, 1920x1080, 15.6" | |
|---|---|---|---|---|---|---|
| Display | 52% | -4% | 57% | -4% | 49% | |
| Display P3 Coverage (%) | 40.42 | 63 56% | 38.92 -4% | 65.2 61% | 38.8 -4% | 62 53% |
| sRGB Coverage (%) | 60.7 | 90.1 48% | 58.5 -4% | 92.1 52% | 57.8 -5% | 86.8 43% |
| AdobeRGB 1998 Coverage (%) | 41.77 | 64.1 53% | 40.22 -4% | 66.4 59% | 40.09 -4% | 62.7 50% |
| Response Times | 59% | 21% | 71% | 42% | 65% | |
| Response Time Grey 50% / Grey 80% * (ms) | 43.2 ? | 20.4 ? 53% | 34 ? 21% | 8.8 ? 80% | 26 ? 40% | 16 ? 63% |
| Response Time Black / White * (ms) | 30.4 ? | 10.8 ? 64% | 24 ? 21% | 12 ? 61% | 17 ? 44% | 10.4 ? 66% |
| PWM Frequency (Hz) | 198.4 ? | |||||
| Screen | -6% | -31% | 2% | -26% | -15% | |
| Brightness middle (cd/m²) | 319 | 292 -8% | 280 -12% | 316 -1% | 301 -6% | 311 -3% |
| Brightness (cd/m²) | 306 | 290 -5% | 254 -17% | 295 -4% | 277 -9% | 313 2% |
| Brightness Distribution (%) | 91 | 77 -15% | 88 -3% | 87 -4% | 77 -15% | 88 -3% |
| Black Level * (cd/m²) | 0.18 | 0.27 -50% | 0.15 17% | 0.23 -28% | 0.26 -44% | 0.43 -139% |
| Contrast (:1) | 1772 | 1081 -39% | 1867 5% | 1374 -22% | 1158 -35% | 723 -59% |
| Colorchecker dE 2000 * | 4 | 3.99 -0% | 5.89 -47% | 3.84 4% | 5.12 -28% | 4.5 -13% |
| Colorchecker dE 2000 max. * | 11.18 | 6.11 45% | 19 -70% | 5.69 49% | 8.86 21% | 7.97 29% |
| Colorchecker dE 2000 calibrated * | 3.52 | 3.02 14% | 4.79 -36% | 1.64 53% | 4.88 -39% | 2.65 25% |
| Greyscale dE 2000 * | 1.53 | 3.3 -116% | 4.08 -167% | 3.66 -139% | 3.47 -127% | 3.3 -116% |
| Gamma | 2.39 92% | 2.25 98% | 2.33 94% | 2.62 84% | 2.37 93% | 2.129 103% |
| CCT | 6533 99% | 7047 92% | 7303 89% | 7165 91% | 7062 92% | 7227 90% |
| Color Space (Percent of AdobeRGB 1998) (%) | 38 | 58.1 53% | 37 -3% | 60 58% | 37 -3% | 63 66% |
| Color Space (Percent of sRGB) (%) | 60 | 89.7 50% | 58 -3% | 92 53% | 57 -5% | 86 43% |
| Média Total (Programa/Configurações) | 35% /
13% | -5% /
-19% | 43% /
21% | 4% /
-14% | 33% /
7% |
* ... menor é melhor
Exibir tempos de resposta
| ↔ Tempo de resposta preto para branco | ||
|---|---|---|
| 30.4 ms ... ascensão ↗ e queda ↘ combinadas | ↗ 16.4 ms ascensão | 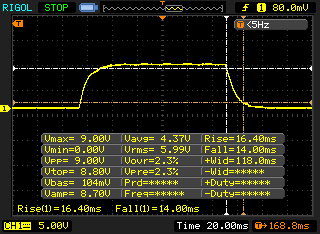 |
| ↘ 14 ms queda | ||
| A tela mostra taxas de resposta lentas em nossos testes e será insatisfatória para os jogadores. Em comparação, todos os dispositivos testados variam de 0.1 (mínimo) a 240 (máximo) ms. » 82 % de todos os dispositivos são melhores. Isso significa que o tempo de resposta medido é pior que a média de todos os dispositivos testados (19.8 ms). | ||
| ↔ Tempo de resposta 50% cinza a 80% cinza | ||
| 43.2 ms ... ascensão ↗ e queda ↘ combinadas | ↗ 22 ms ascensão | 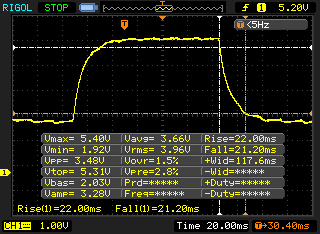 |
| ↘ 21.2 ms queda | ||
| A tela mostra taxas de resposta lentas em nossos testes e será insatisfatória para os jogadores. Em comparação, todos os dispositivos testados variam de 0.165 (mínimo) a 636 (máximo) ms. » 72 % de todos os dispositivos são melhores. Isso significa que o tempo de resposta medido é pior que a média de todos os dispositivos testados (31 ms). | ||
Cintilação da tela / PWM (modulação por largura de pulso)
| Tela tremeluzindo / PWM não detectado | 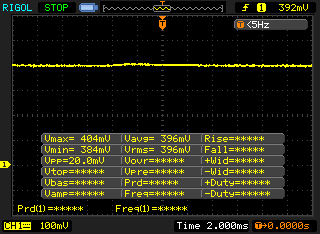 | ||
[pwm_comparison] Em comparação: 52 % de todos os dispositivos testados não usam PWM para escurecer a tela. Se PWM foi detectado, uma média de 7757 (mínimo: 5 - máximo: 343500) Hz foi medida. | |||

* ... menor é melhor
| PCMark 8 Home Score Accelerated v2 | 4455 pontos | |
| PCMark 8 Creative Score Accelerated v2 | 6793 pontos | |
| PCMark 8 Work Score Accelerated v2 | 5176 pontos | |
| PCMark 10 Score | 4868 pontos | |
Ajuda | ||
| DPC Latencies / LatencyMon - interrupt to process latency (max), Web, Youtube, Prime95 | |
| HP Pavilion Gaming 16-a0242ng | |
* ... menor é melhor
| HP Pavilion Gaming 16-a0242ng Intel SSD 660p SSDPEKNW512G8 | Dell G5 15 SE 5505 P89F Samsung PM991 MZ9LQ512HALU | Asus TUF Gaming A15 FA506IV-HN172 Kingston OM8PCP3512F-AB | Xiaomi Mi Gaming Laptop 2019 Toshiba XG6 KXG60ZNV512G | Lenovo Legion 5 15IMH05H Samsung PM991 MZALQ512HALU | MSI Bravo 15 A4DCR Samsung PM981a MZVLB1T0HBLR | |
|---|---|---|---|---|---|---|
| AS SSD | 17% | 11% | 114% | 29% | 155% | |
| Seq Read (MB/s) | 1438 | 1386 -4% | 1682 17% | 2772 93% | 2012 40% | 2730 90% |
| Seq Write (MB/s) | 905 | 1234 36% | 904 0% | 2489 175% | 1261 39% | 2513 178% |
| 4K Read (MB/s) | 50.3 | 41.32 -18% | 60.2 20% | 48.62 -3% | 43.66 -13% | 61.4 22% |
| 4K Write (MB/s) | 111.7 | 128 15% | 164.8 48% | 136.6 22% | 109.3 -2% | 156.1 40% |
| 4K-64 Read (MB/s) | 324 | 854 164% | 472.5 46% | 1393 330% | 851 163% | 1780 449% |
| 4K-64 Write (MB/s) | 729 | 721 -1% | 845 16% | 1450 99% | 780 7% | 1920 163% |
| Access Time Read * (ms) | 0.105 | 0.098 7% | 0.087 17% | 0.088 16% | 0.117 -11% | 0.063 40% |
| Access Time Write * (ms) | 0.047 | 0.095 -102% | 0.02 57% | 0.03 36% | 0.036 23% | 0.025 47% |
| Score Read (Points) | 518 | 1034 100% | 701 35% | 1719 232% | 1096 112% | 2114 308% |
| Score Write (Points) | 931 | 973 5% | 1101 18% | 1835 97% | 1016 9% | 2327 150% |
| Score Total (Points) | 1707 | 2536 49% | 2143 26% | 4424 159% | 2643 55% | 5518 223% |
| Copy ISO MB/s (MB/s) | 1145 | 1284 12% | 675 -41% | 1481 29% | ||
| Copy Program MB/s (MB/s) | 602 | 401.9 -33% | 248.4 -59% | 467.5 -22% | ||
| Copy Game MB/s (MB/s) | 929 | 1013 9% | 535 -42% | 734 -21% |
* ... menor é melhor

Continuous read speed: DiskSpd Read Loop, Queue Depth 8
| 3DMark 11 Performance | 12461 pontos | |
| 3DMark Ice Storm Standard Score | 101019 pontos | |
| 3DMark Cloud Gate Standard Score | 27911 pontos | |
| 3DMark Fire Strike Score | 8780 pontos | |
| 3DMark Fire Strike Extreme Score | 4315 pontos | |
| 3DMark Time Spy Score | 3748 pontos | |
Ajuda | ||
| The Witcher 3 | |
| 1920x1080 High Graphics & Postprocessing (Nvidia HairWorks Off) | |
| Média da turma Gaming (341 - 404, n=2, últimos 2 anos) | |
| Lenovo Legion 5 15IMH05H | |
| Xiaomi Mi Gaming Laptop 2019 | |
| Asus TUF Gaming A15 FA506IV-HN172 | |
| Dell G5 15 SE 5505 P89F | |
| HP Pavilion Gaming 16-a0242ng | |
| MSI Bravo 15 A4DCR | |
| 1920x1080 Ultra Graphics & Postprocessing (HBAO+) | |
| Média da turma Gaming (104.7 - 240, n=7, últimos 2 anos) | |
| Lenovo Legion 5 15IMH05H | |
| Dell G5 15 SE 5505 P89F | |
| Xiaomi Mi Gaming Laptop 2019 | |
| Asus TUF Gaming A15 FA506IV-HN172 | |
| MSI Bravo 15 A4DCR | |
| HP Pavilion Gaming 16-a0242ng | |
| baixo | média | alto | ultra | |
|---|---|---|---|---|
| BioShock Infinite (2013) | 309 | 251 | 227 | 99 |
| GTA V (2015) | 173 | 165 | 107 | 53.2 |
| The Witcher 3 (2015) | 202 | 123 | 69.2 | 36.6 |
| Dota 2 Reborn (2015) | 136.2 | 123.8 | 117.1 | 113 |
| Rise of the Tomb Raider (2016) | 181 | 124 | 68.3 | 58.9 |
| Final Fantasy XV Benchmark (2018) | 107 | 55.2 | 40.9 | |
| X-Plane 11.11 (2018) | 90.1 | 81.4 | 69.5 | |
| Far Cry 5 (2018) | 119 | 67 | 62 | 58 |
| Strange Brigade (2018) | 230 | 95 | 75.2 | 62.7 |
| Far Cry New Dawn (2019) | 104 | 66 | 62 | 57 |
| Borderlands 3 (2019) | 122 | 63.4 | 40.8 | 30.5 |
Barulho
| Ocioso |
| 25 / 33 / 42 dB |
| Carga |
| 48 / 54 dB |
 | ||
30 dB silencioso 40 dB(A) audível 50 dB(A) ruidosamente alto |
||
min: | ||
(-) A temperatura máxima no lado superior é 49 °C / 120 F, em comparação com a média de 40.4 °C / 105 F , variando de 21.2 a 68.8 °C para a classe Gaming.
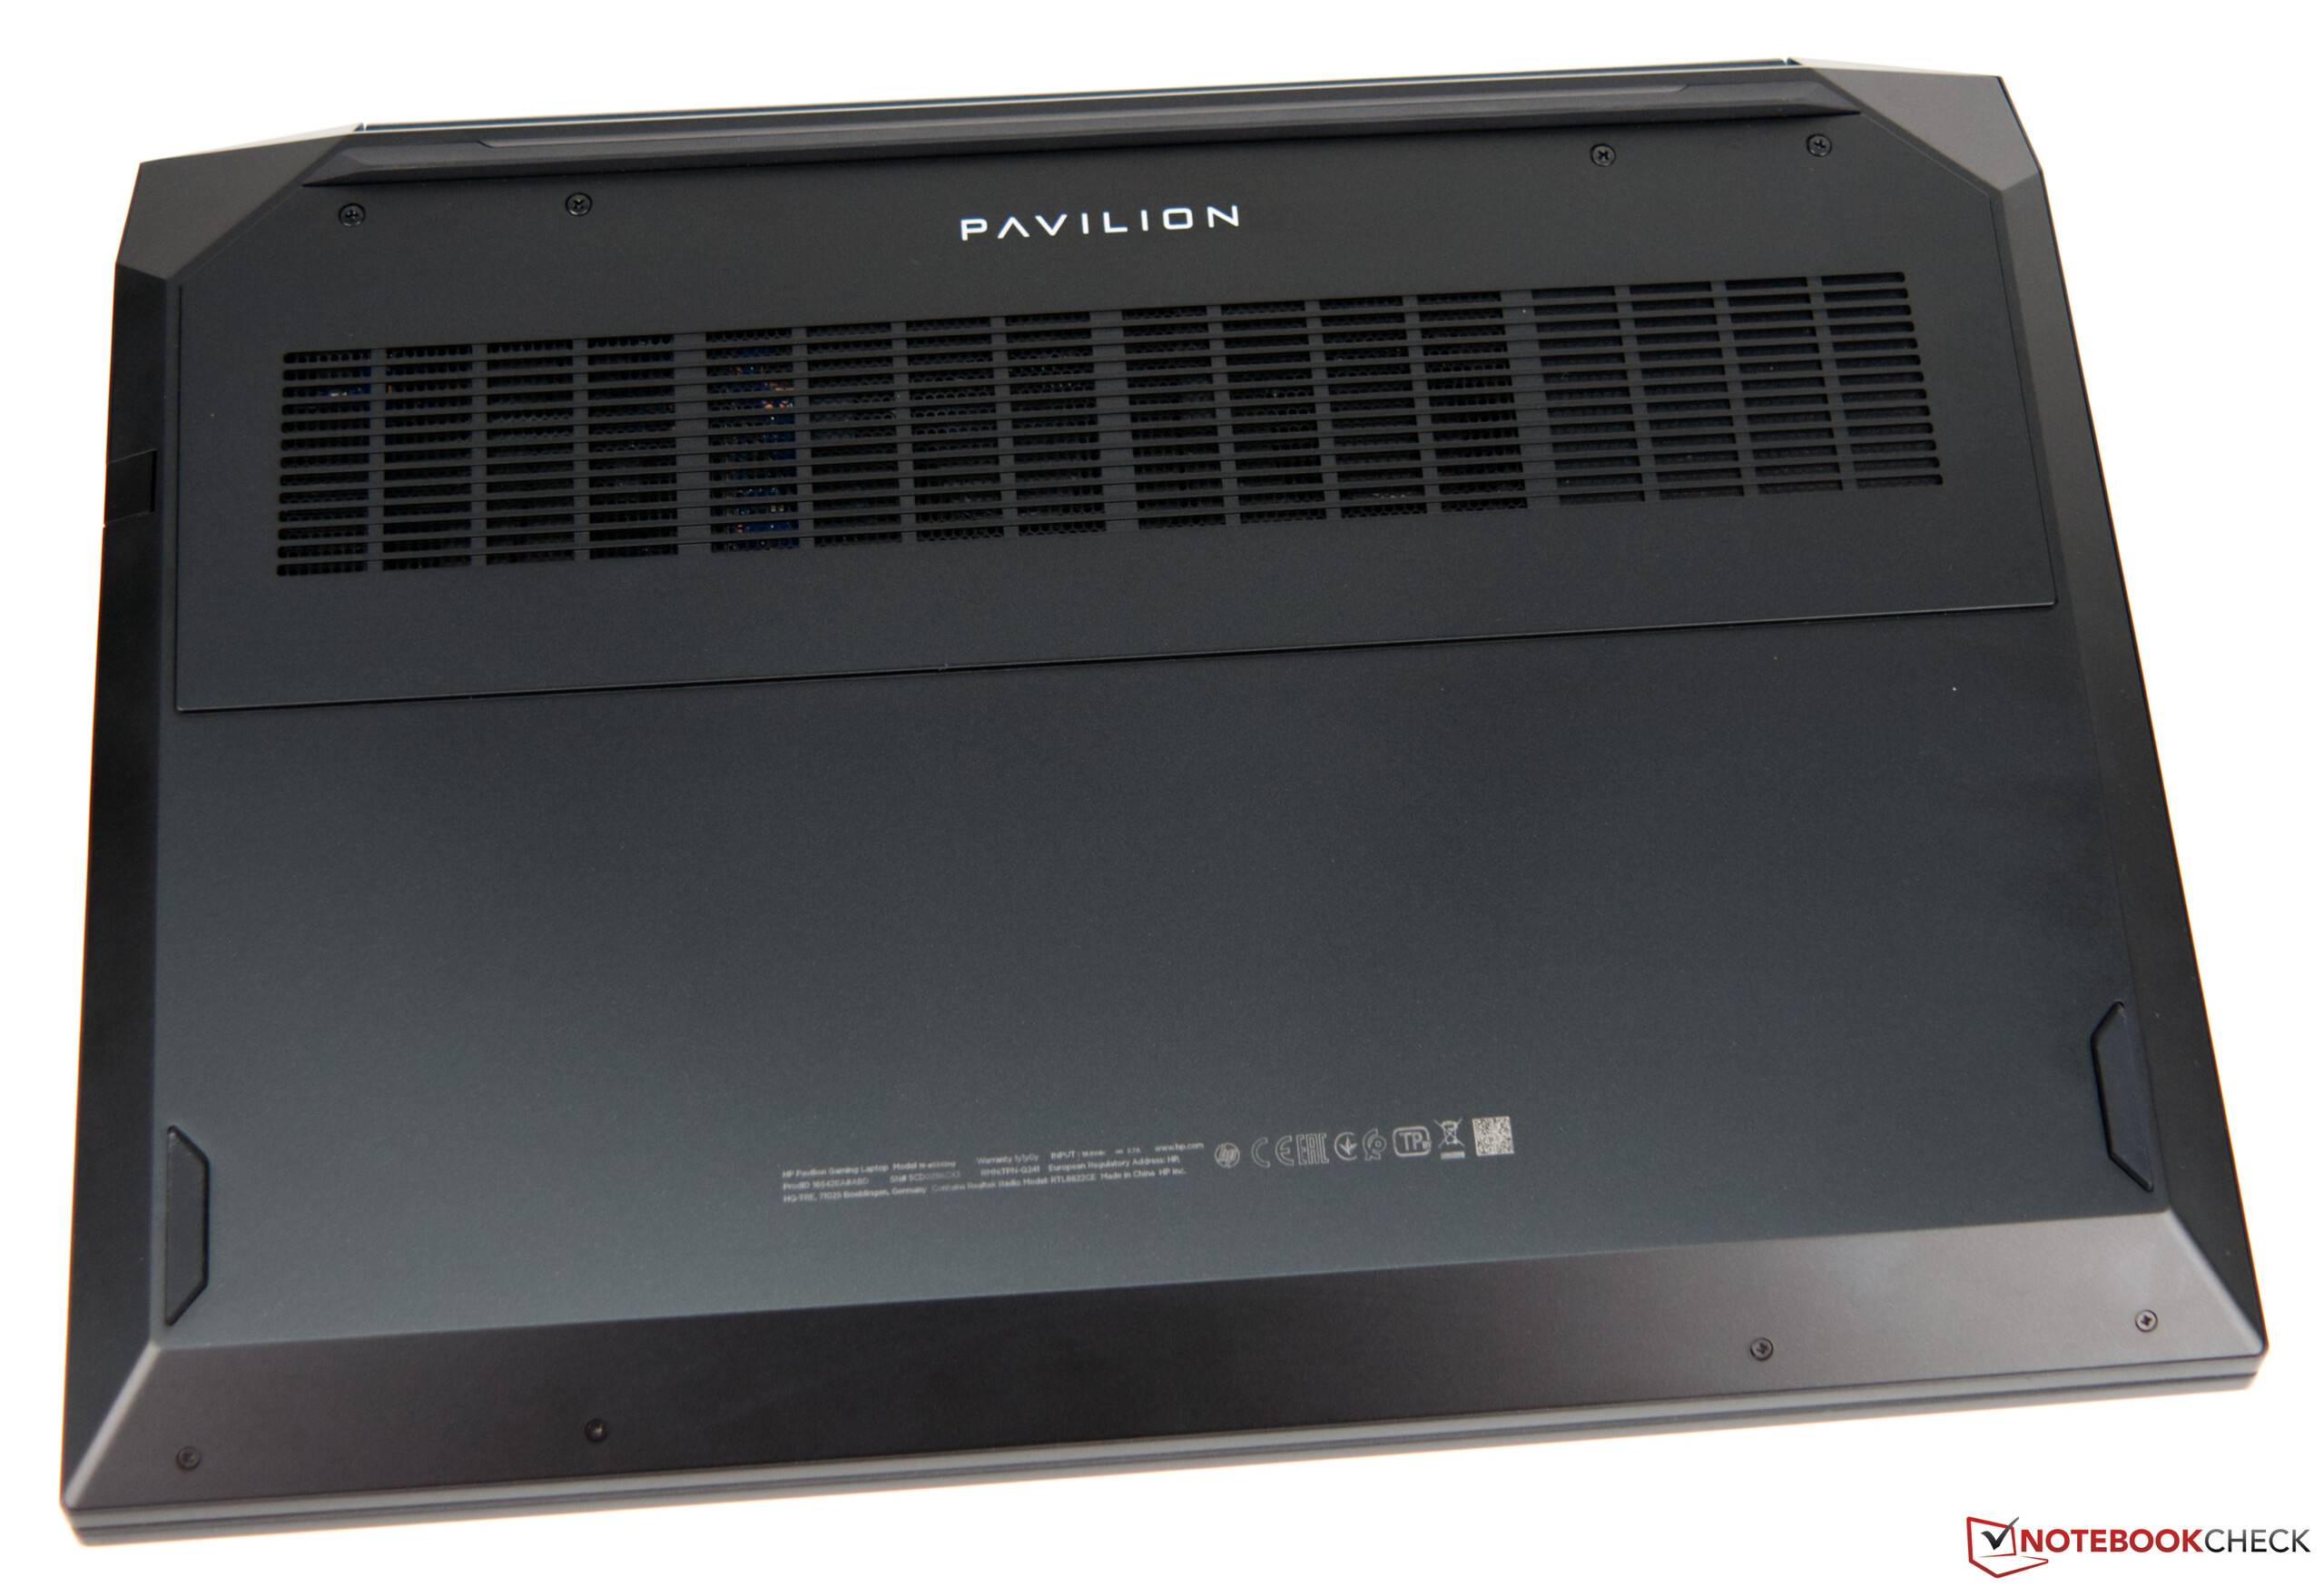
(-) A parte inferior aquece até um máximo de 50 °C / 122 F, em comparação com a média de 43.2 °C / 110 F
(+) Em uso inativo, a temperatura média para o lado superior é 27.6 °C / 82 F, em comparação com a média do dispositivo de 33.9 °C / ### class_avg_f### F.
(-) Jogando The Witcher 3, a temperatura média para o lado superior é 39.1 °C / 102 F, em comparação com a média do dispositivo de 33.9 °C / ## #class_avg_f### F.
(-) Os apoios para as mãos e o touchpad podem ficar muito quentes ao toque, com um máximo de 41 °C / 105.8 F.
(-) A temperatura média da área do apoio para as mãos de dispositivos semelhantes foi 28.8 °C / 83.8 F (-12.2 °C / -22 F).
HP Pavilion Gaming 16-a0242ng análise de áudio
(±) | o volume do alto-falante é médio, mas bom (###valor### dB)
Graves 100 - 315Hz
(-) | quase nenhum baixo - em média 19.4% menor que a mediana
(±) | a linearidade dos graves é média (14.3% delta para a frequência anterior)
Médios 400 - 2.000 Hz
(+) | médios equilibrados - apenas 1.6% longe da mediana
(+) | médios são lineares (3.5% delta para frequência anterior)
Altos 2 - 16 kHz
(+) | agudos equilibrados - apenas 3.9% longe da mediana
(+) | os máximos são lineares (5.8% delta da frequência anterior)
Geral 100 - 16.000 Hz
(±) | a linearidade do som geral é média (17.8% diferença em relação à mediana)
Comparado com a mesma classe
» 53% de todos os dispositivos testados nesta classe foram melhores, 10% semelhantes, 37% piores
» O melhor teve um delta de 6%, a média foi 18%, o pior foi 132%
Comparado com todos os dispositivos testados
» 36% de todos os dispositivos testados foram melhores, 8% semelhantes, 56% piores
» O melhor teve um delta de 4%, a média foi 23%, o pior foi 134%
| desligado | |
| Ocioso | |
| Carga |
|
Key:
min: | |
| HP Pavilion Gaming 16-a0242ng i5-10300H, GeForce GTX 1650 Ti Mobile | Dell G5 15 SE 5505 P89F R7 4800H, Radeon RX 5600M | Asus TUF Gaming A15 FA506IV-HN172 R7 4800H, GeForce RTX 2060 Mobile | Xiaomi Mi Gaming Laptop 2019 i7-9750H, GeForce RTX 2060 Mobile | Lenovo Legion 5 15IMH05H i5-10300H, GeForce RTX 2060 Mobile | MSI Bravo 15 A4DCR R7 4800H, Radeon RX 5300M | Média da turma Gaming | |
|---|---|---|---|---|---|---|---|
| Power Consumption | -40% | -36% | -79% | -15% | -71% | -130% | |
| Idle Minimum * (Watt) | 3 | 6.5 -117% | 5.4 -80% | 10 -233% | 3.2 -7% | 11 -267% | 13 ? -333% |
| Idle Average * (Watt) | 7 | 10.6 -51% | 10 -43% | 13 -86% | 8.3 -19% | 14 -100% | 19 ? -171% |
| Idle Maximum * (Watt) | 18 | 11 39% | 10.5 42% | 20 -11% | 8.7 52% | 25 -39% | 24.6 ? -37% |
| Load Average * (Watt) | 86 | 84.1 2% | 135 -57% | 100 -16% | 82 5% | 72 16% | 110.7 ? -29% |
| Witcher 3 ultra * (Watt) | 82 | 152.9 -86% | 144 -76% | 159 -94% | 151 -84% | 100 -22% | |
| Load Maximum * (Watt) | 144 | 180.4 -25% | 147 -2% | 196 -36% | 195 -35% | 163 -13% | 259 ? -80% |
* ... menor é melhor
| HP Pavilion Gaming 16-a0242ng i5-10300H, GeForce GTX 1650 Ti Mobile, 52 Wh | Dell G5 15 SE 5505 P89F R7 4800H, Radeon RX 5600M, 51 Wh | Asus TUF Gaming A15 FA506IV-HN172 R7 4800H, GeForce RTX 2060 Mobile, 48 Wh | Xiaomi Mi Gaming Laptop 2019 i7-9750H, GeForce RTX 2060 Mobile, 55 Wh | Lenovo Legion 5 15IMH05H i5-10300H, GeForce RTX 2060 Mobile, 60 Wh | MSI Bravo 15 A4DCR R7 4800H, Radeon RX 5300M, 51 Wh | Média da turma Gaming | |
|---|---|---|---|---|---|---|---|
| Duração da bateria | -27% | -28% | -56% | -14% | -53% | -24% | |
| Reader / Idle (h) | 16.5 | 11.2 -32% | 9.8 -41% | 6.2 -62% | 14.1 -15% | 7 -58% | 8.27 ? -50% |
| H.264 (h) | 8.9 | 5.4 -39% | 9.2 3% | 8.32 ? -7% | |||
| WiFi v1.3 (h) | 8.3 | 6.2 -25% | 6.2 -25% | 4.4 -47% | 7.2 -13% | 4.5 -46% | 7.11 ? -14% |
| Load (h) | 2 | 1.5 -25% | 1.9 -5% | 0.8 -60% | 1.4 -30% | 0.9 -55% | 1.502 ? -25% |


Pro
Contra
Veredicto - Bom desempenho, baixo preço
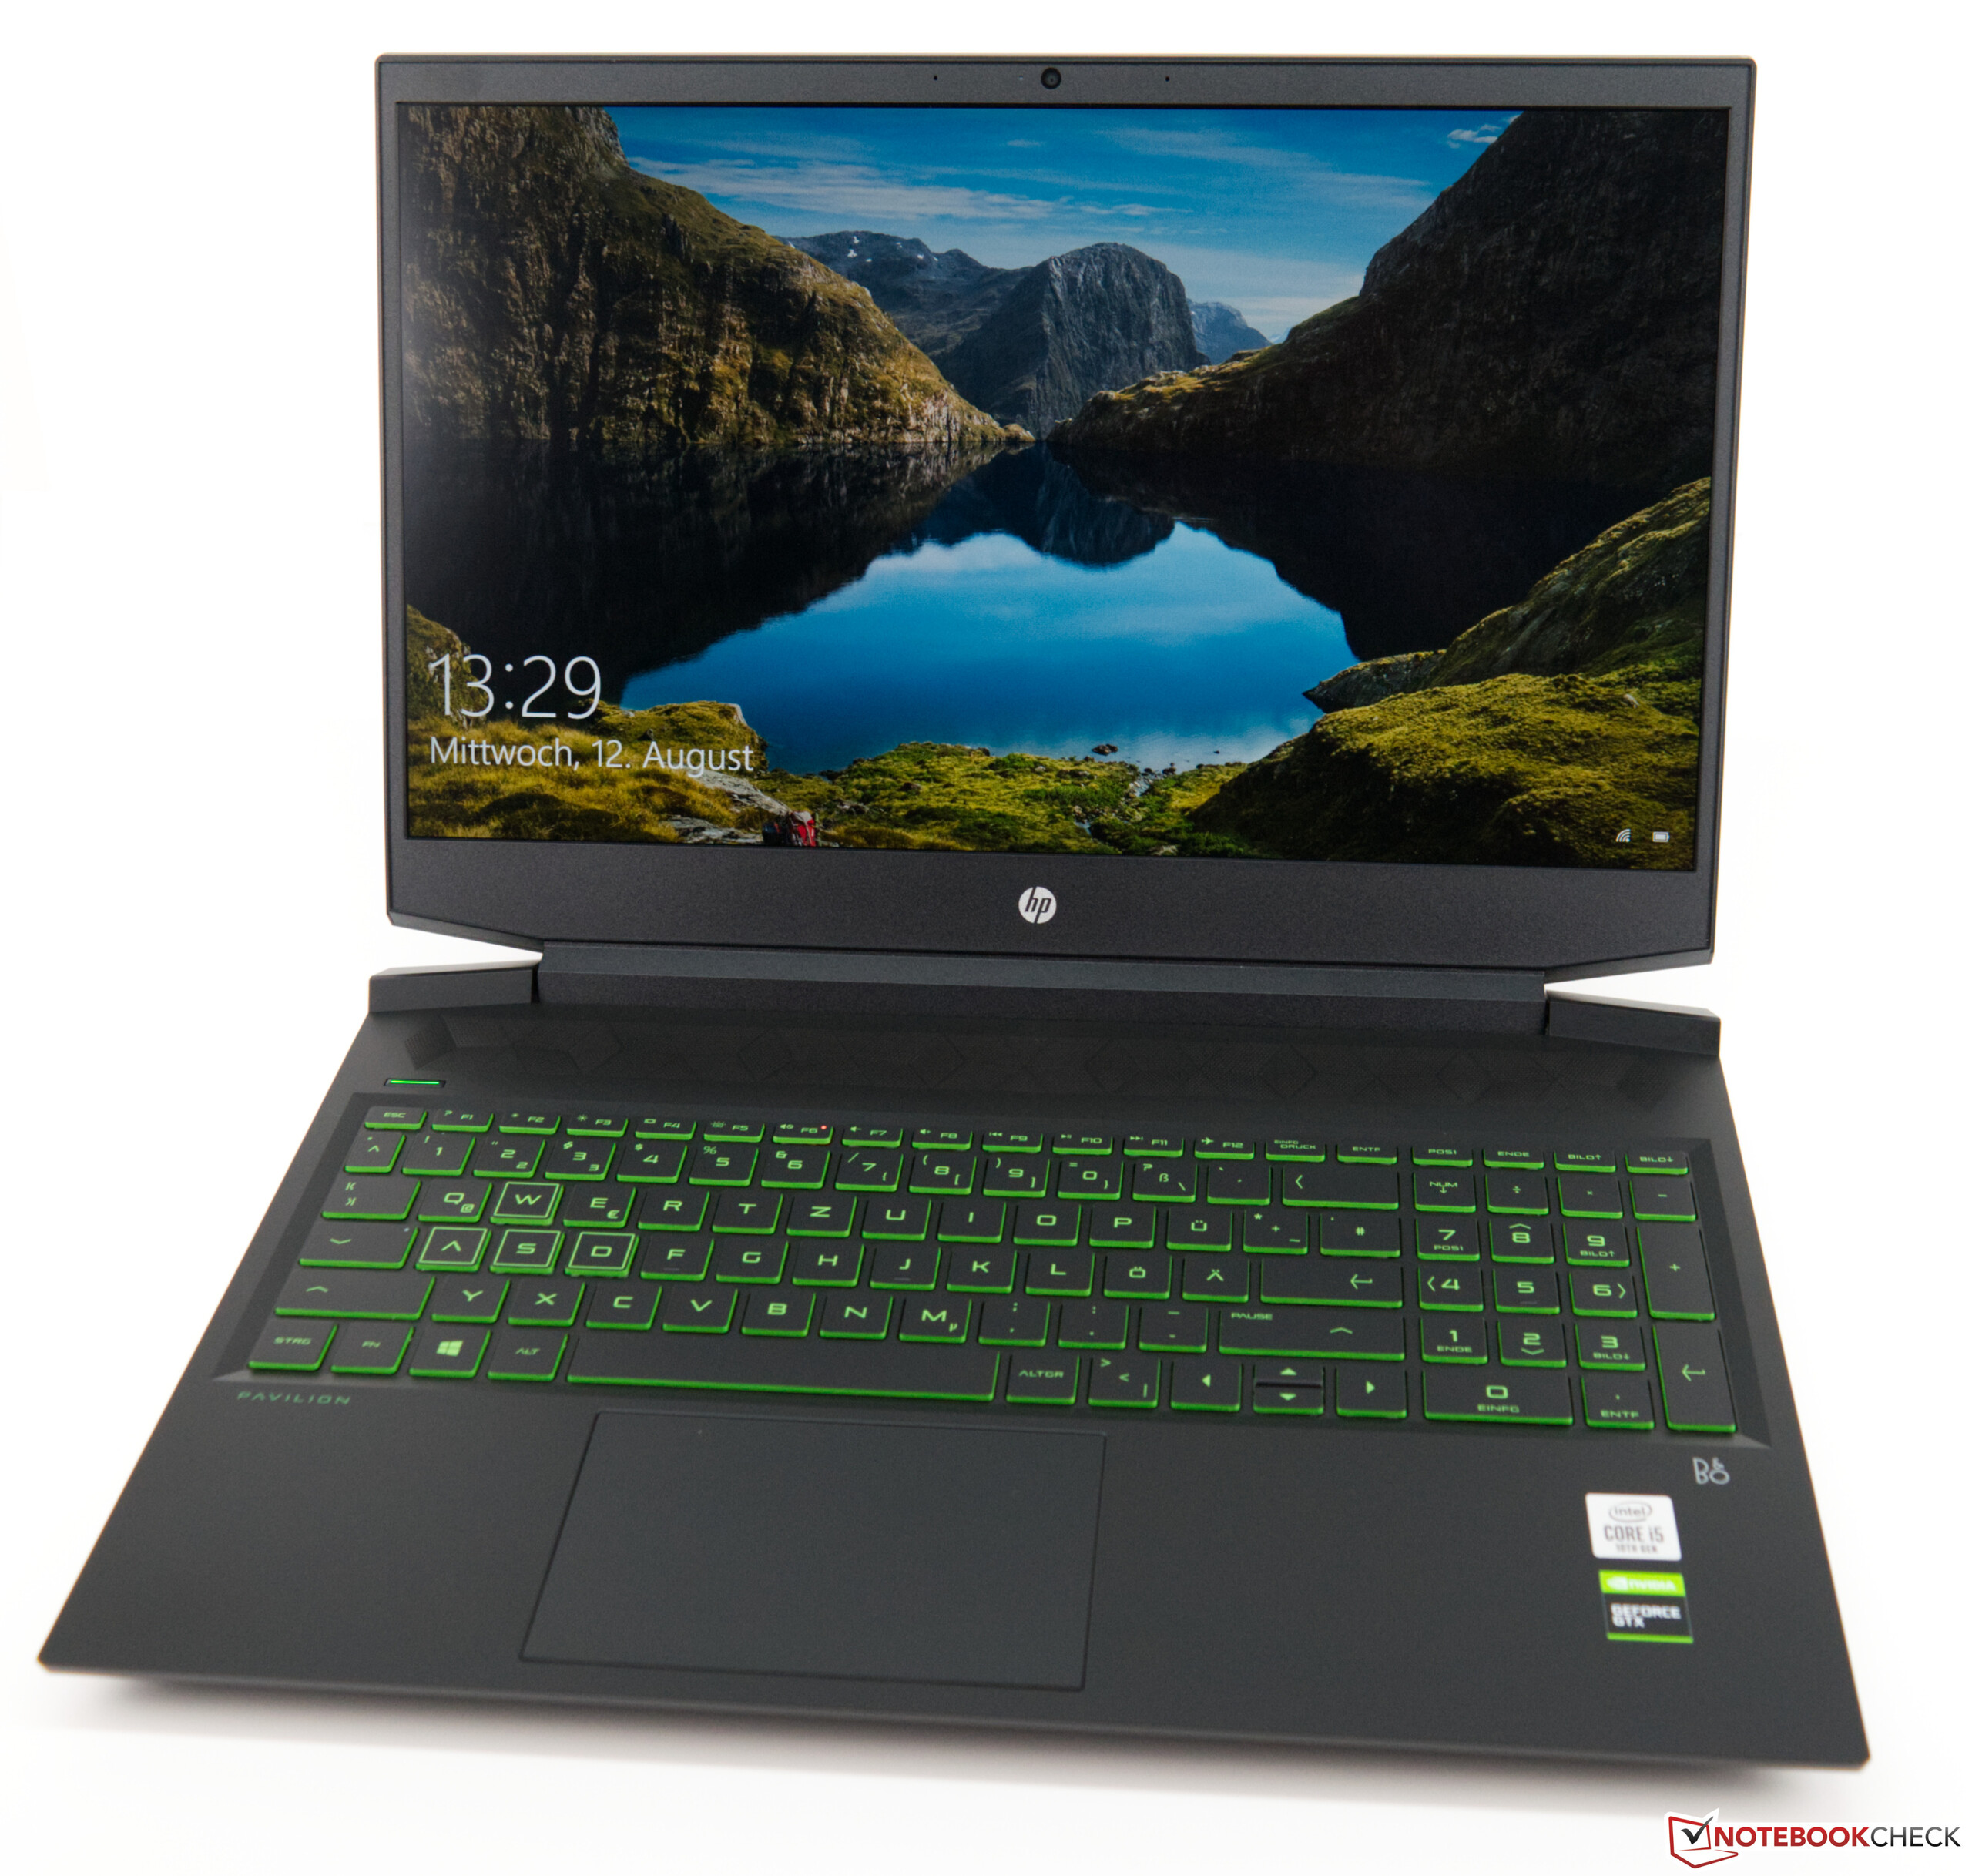
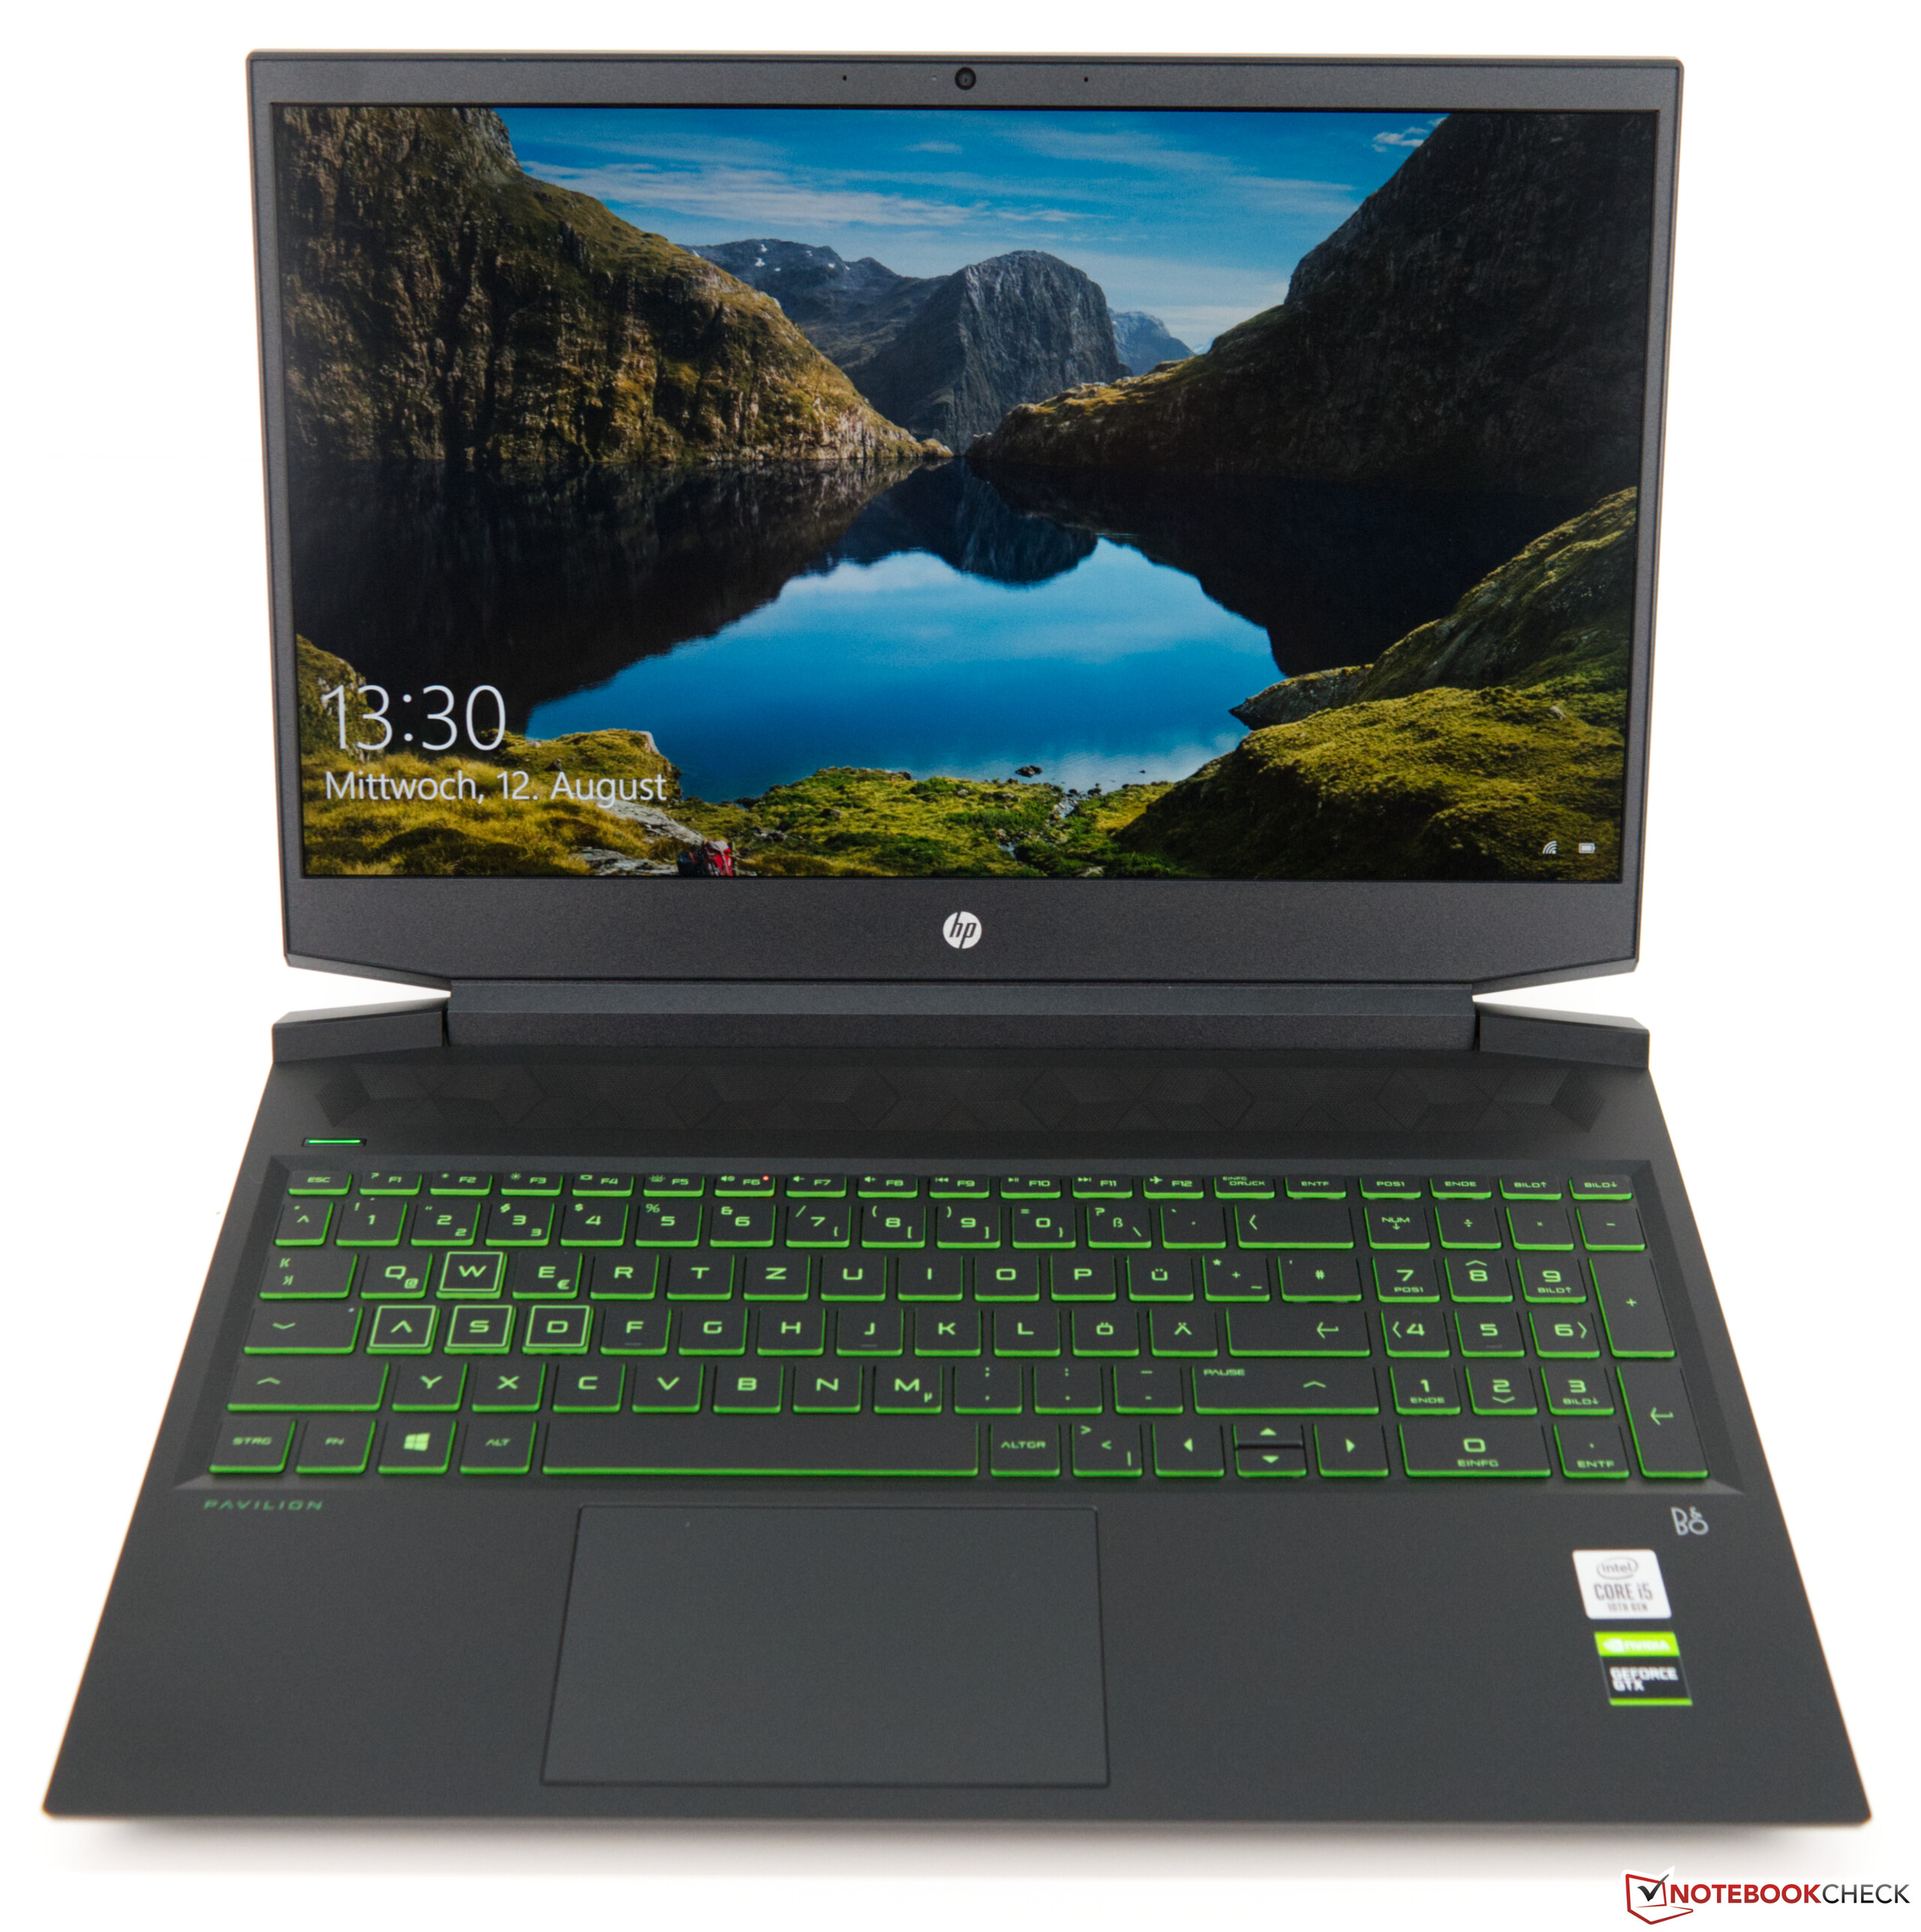
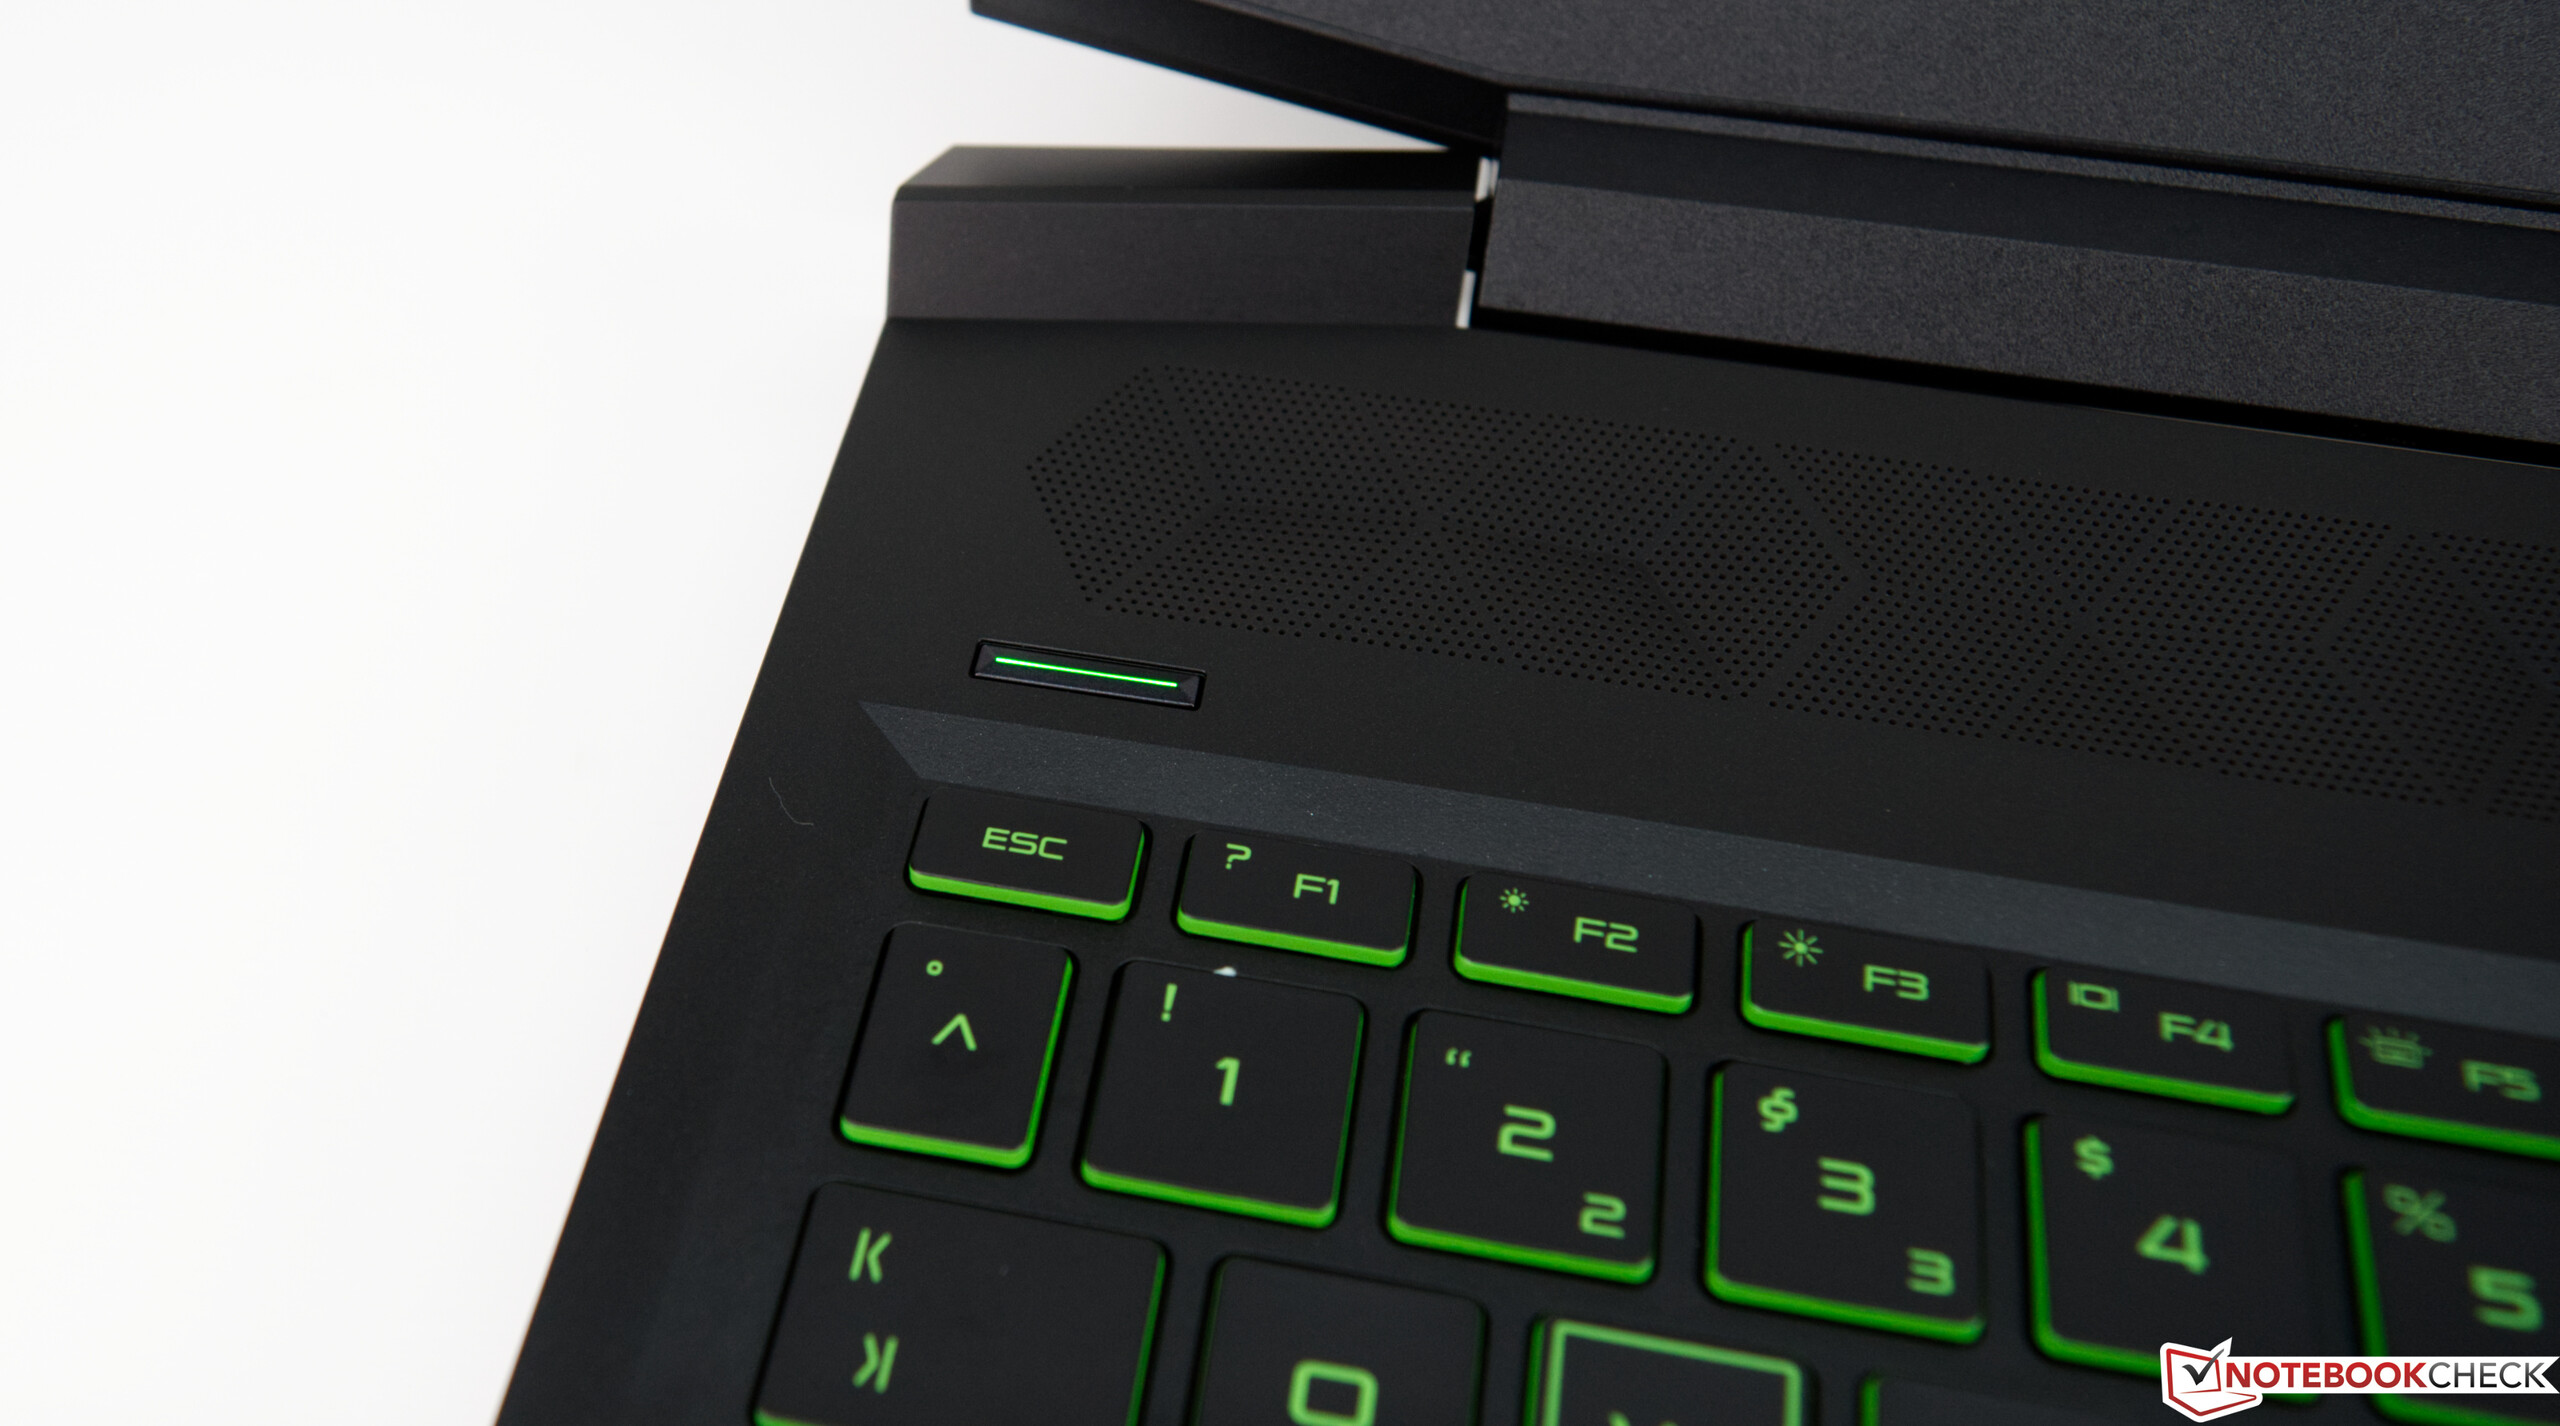
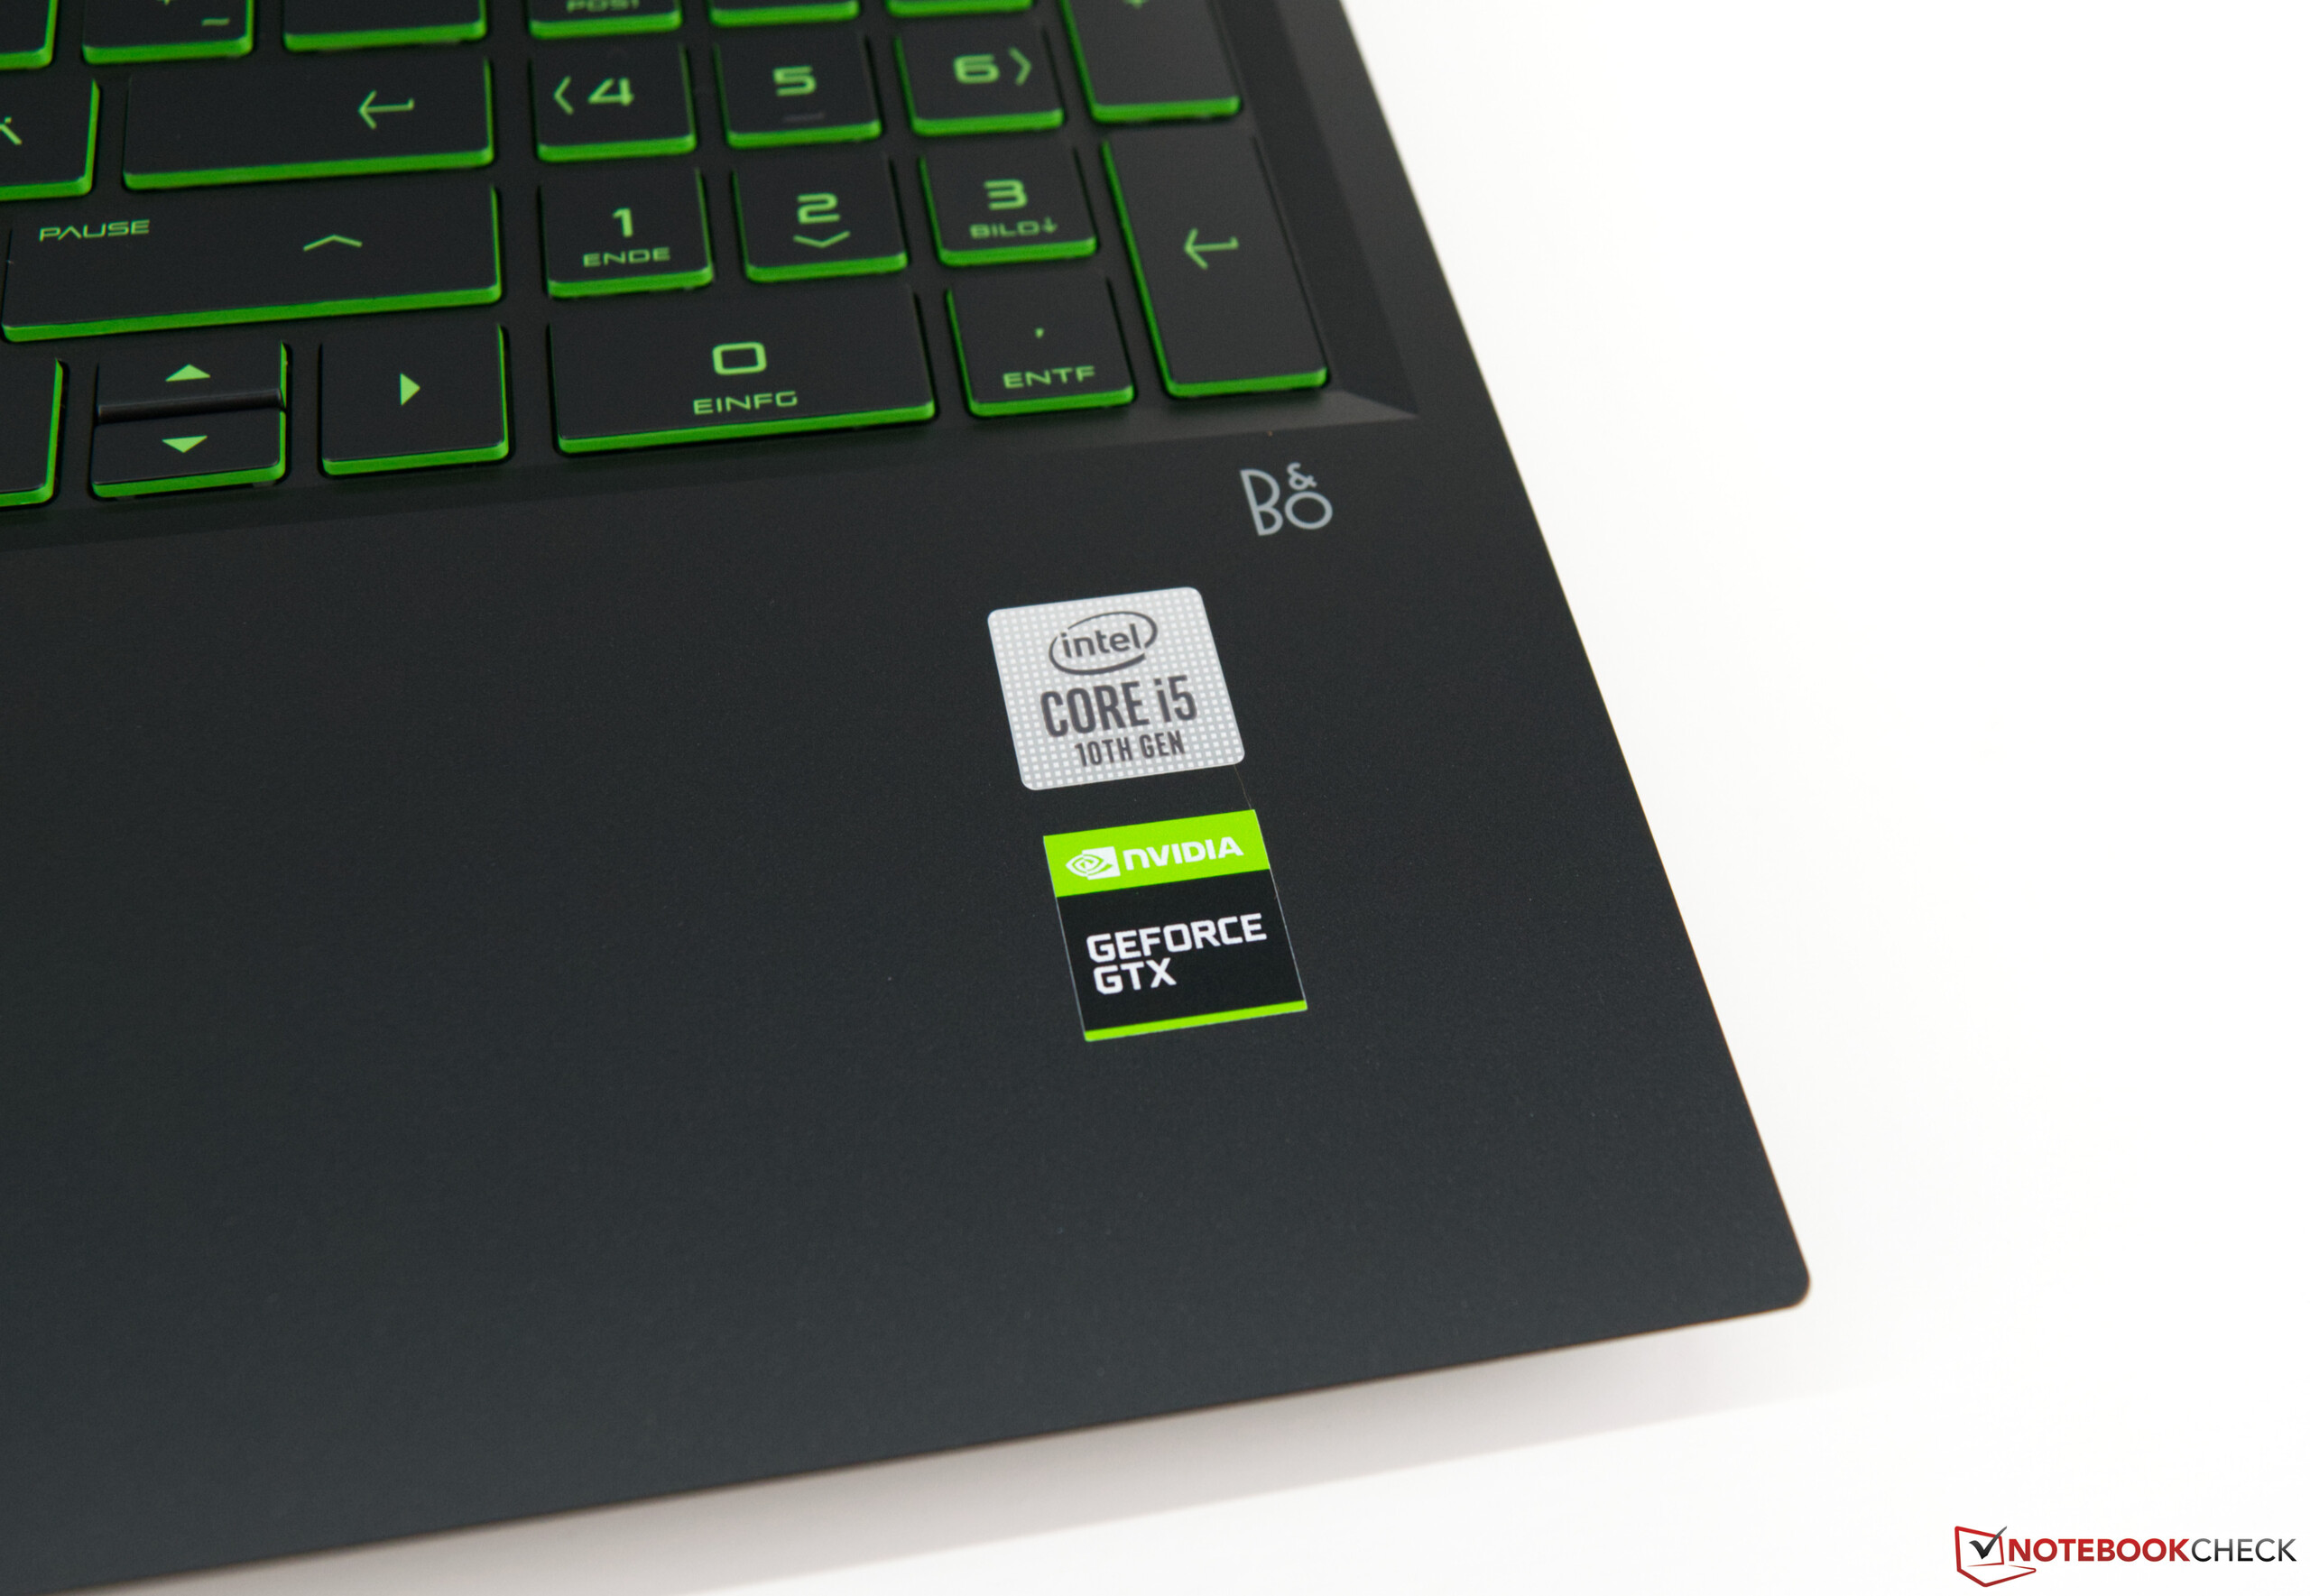
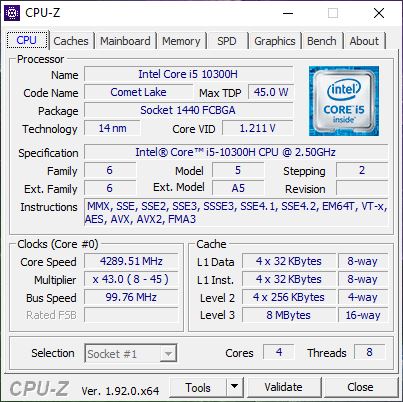
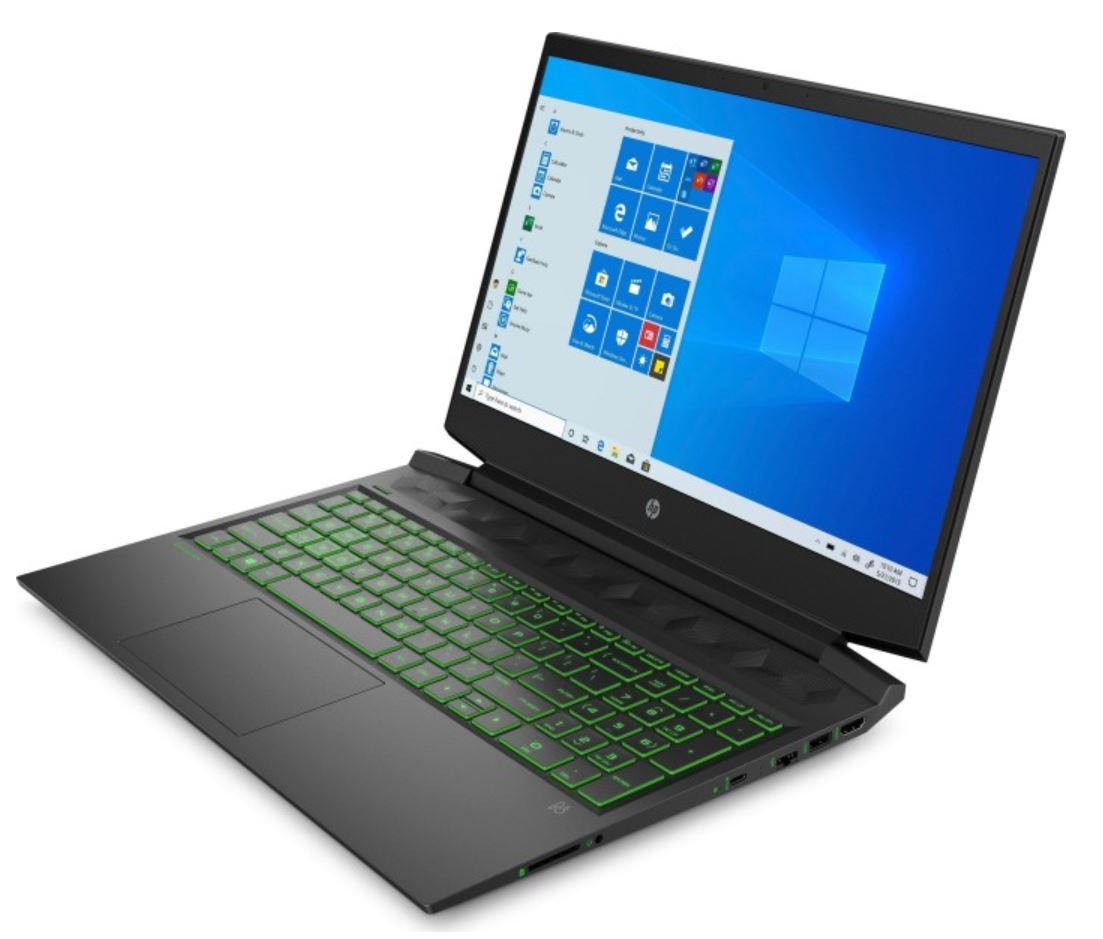
O HP Pavilion Gaming 16 é um portátil para jogos de baixo custo com bom hardware. Apesar de uma tela maior, o dispositivo é pouco maior do que portáteis de 15,6 polegadas comparáveis. Demos uma olhada na configuração com o Intel Core i5-10300H e a NVIDIA GeForce GTX 1650 Ti. Atualmente, nosso dispositivo de análise é vendido por cerca de 900 Euros (~$ 1068), o que é inteiramente justificado dadas as especificações. A quantidade de espaço de armazenamento pode ser criticada, porque 512 GB não é muito para um portátil de jogos. No entanto, os usuários podem expandir facilmente a capacidade de armazenamento. Em nossa análise, o Pavilion Gaming 16 apresentou um bom nível de desempenho, embora a GeForce GTX 1650 Ti seja uma placa de vídeo dedicada de baixo custo. Tendo dito isso, a GPU ainda é poderosa o suficiente para ser capaz de rodar muitos videogames a 1080p nas configurações mais altas.
O HP Pavilion Gaming 16 é um portátil para jogos com uma ótima relação preço-desempenho.
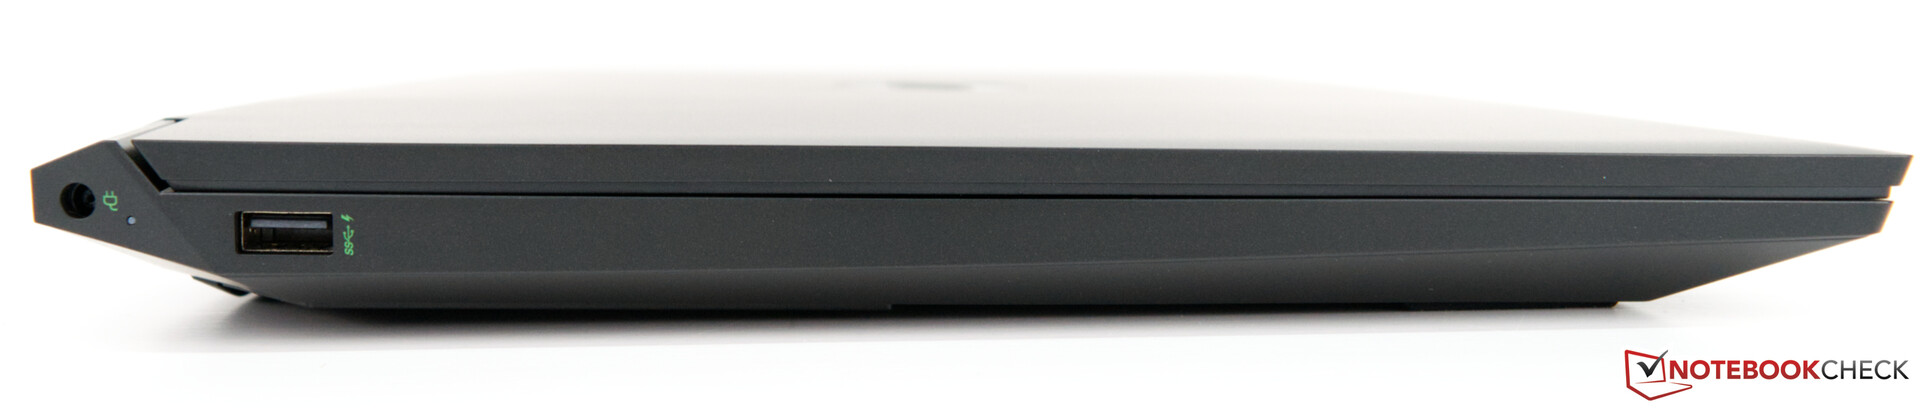
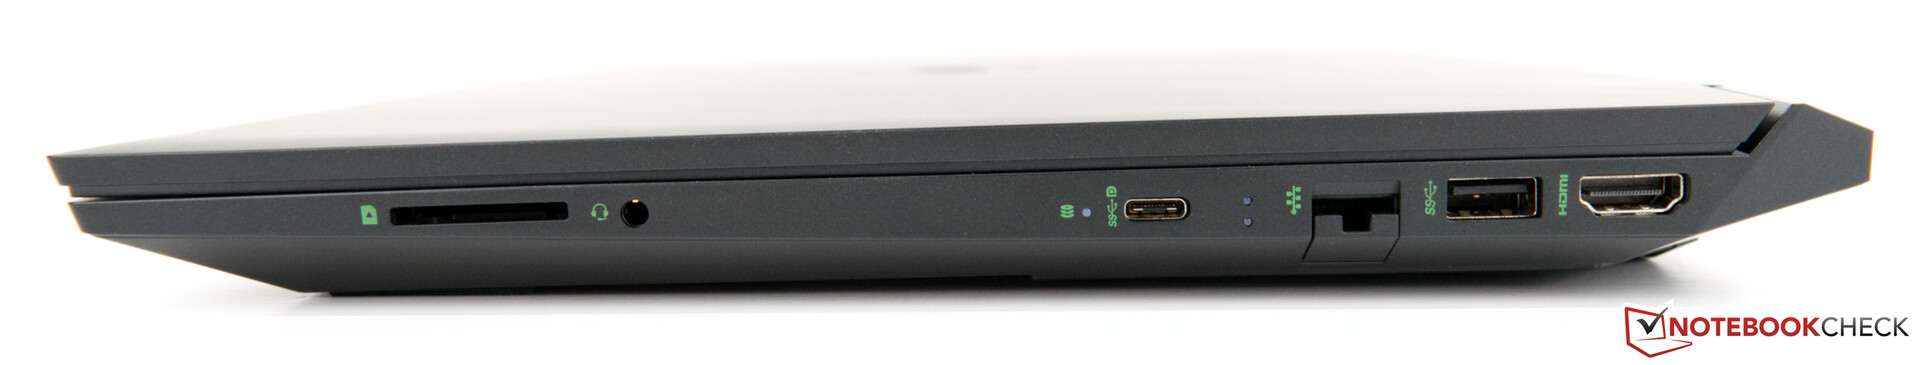
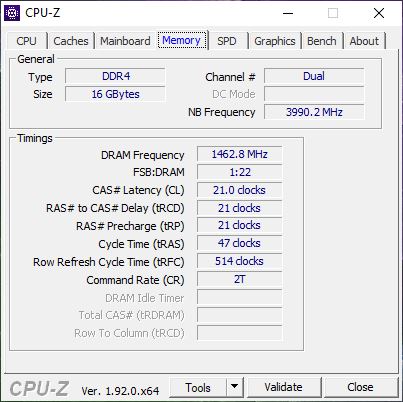
Os usuários terão que se contentar com um desempenho multi-core relativamente pobre, porque o Core i5-10300H tem apenas quatro núcleos. Quando se trata de portas, o Pavilion Gaming 16 oferece o mínimo. Uma porta USB Tipo A adicional seria útil. Wi-Fi 6 também seria uma inclusão bem-vinda. No entanto, nosso dispositivo de análise vem com 16 GB de RAM e uma tela IPS com uma boa relação de contraste.
The HP Pavilion Gaming 16 is a low-priced gaming notebook with good hardware. Despite a bigger screen, the device is barely larger than comparable 15.6-inch laptops. We have taken a close look at the configuration with the Intel Core i5-10300H and the NVIDIA GeForce GTX 1650 Ti. Currently, our review device retails for about 900 Euros (~$1068), which is entirely justified given the specifications. The amount of storage space can be criticised, because 512 GB is not much for a gaming laptop. However, users can easily expand storage capacity. In our review, the Pavilion Gaming 16 delivered a good level of performance, even though the GeForce GTX 1650 Ti is a low-end dedicated graphics card. Having said that, the GPU is still powerful enough to be able to run many video games at 1080p on the highest settings.
The HP Pavilion Gaming 16 is a gaming notebook with a very good price-to-performance ratio.
Users will have to make do with relatively poor multi-core performance, because the Core i5-10300H has only four cores. When it comes to the ports, the Pavilion Gaming 16 offers the bare minimum. An additional USB Type-A port would have come in handy. Wi-Fi 6 would also be a welcome inclusion. However, our review device comes with 16 GB of RAM and an IPS display with a good contrast ratio.
HP Pavilion Gaming 16-a0242ng
- 08/19/2020 v7 (old)
Sebastian Bade