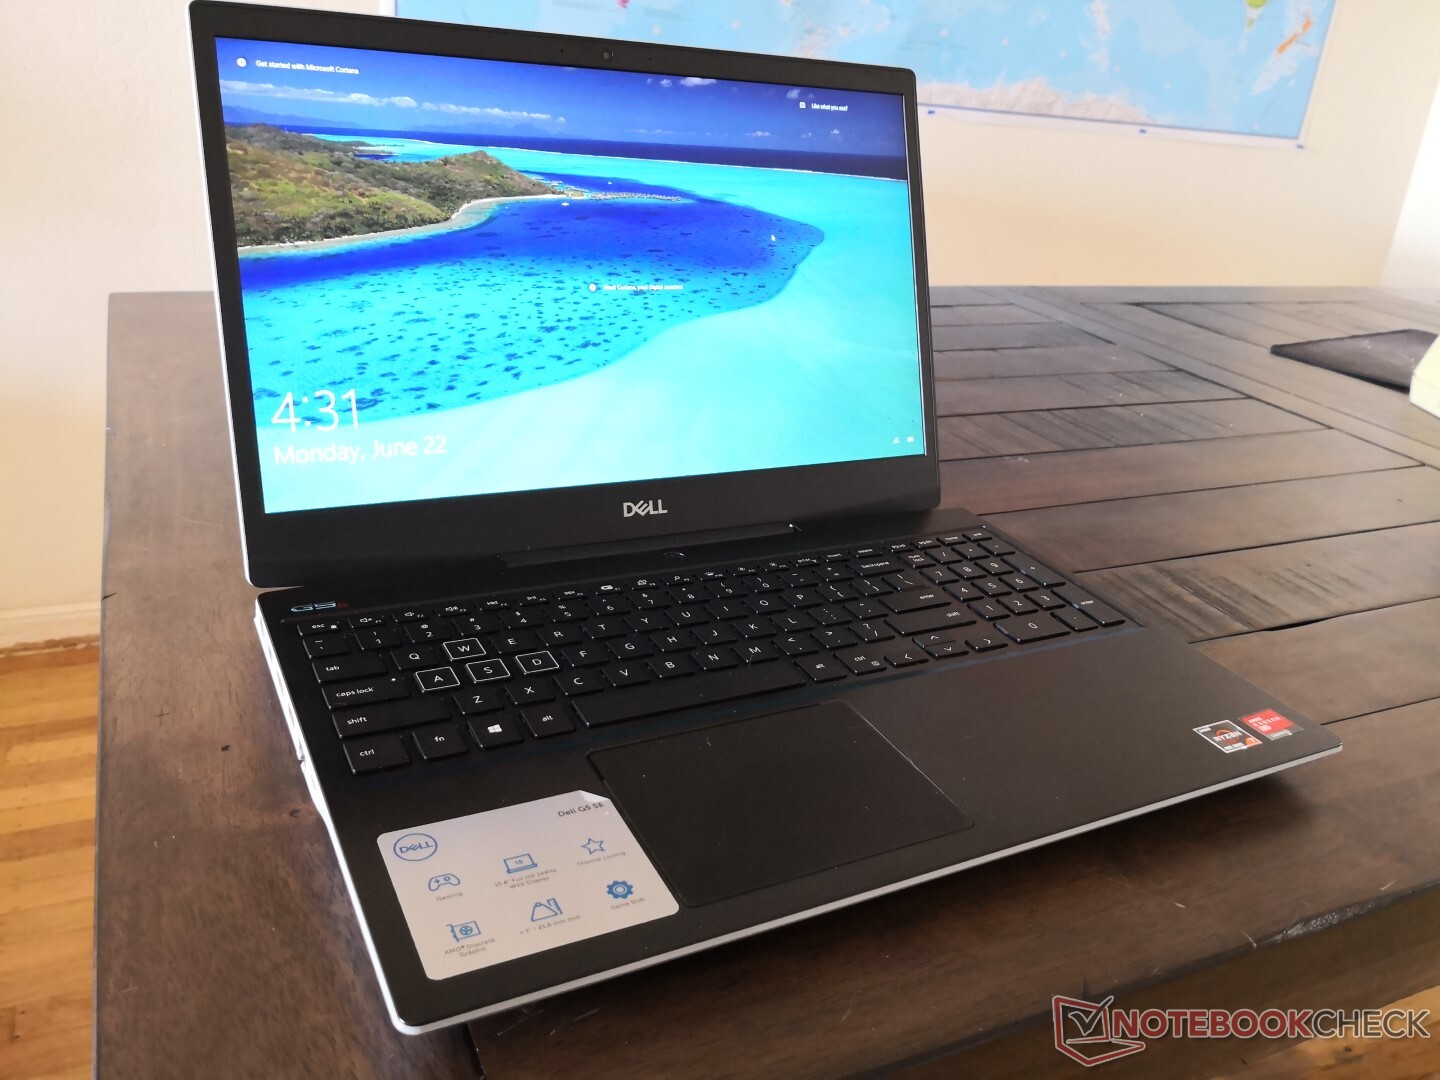
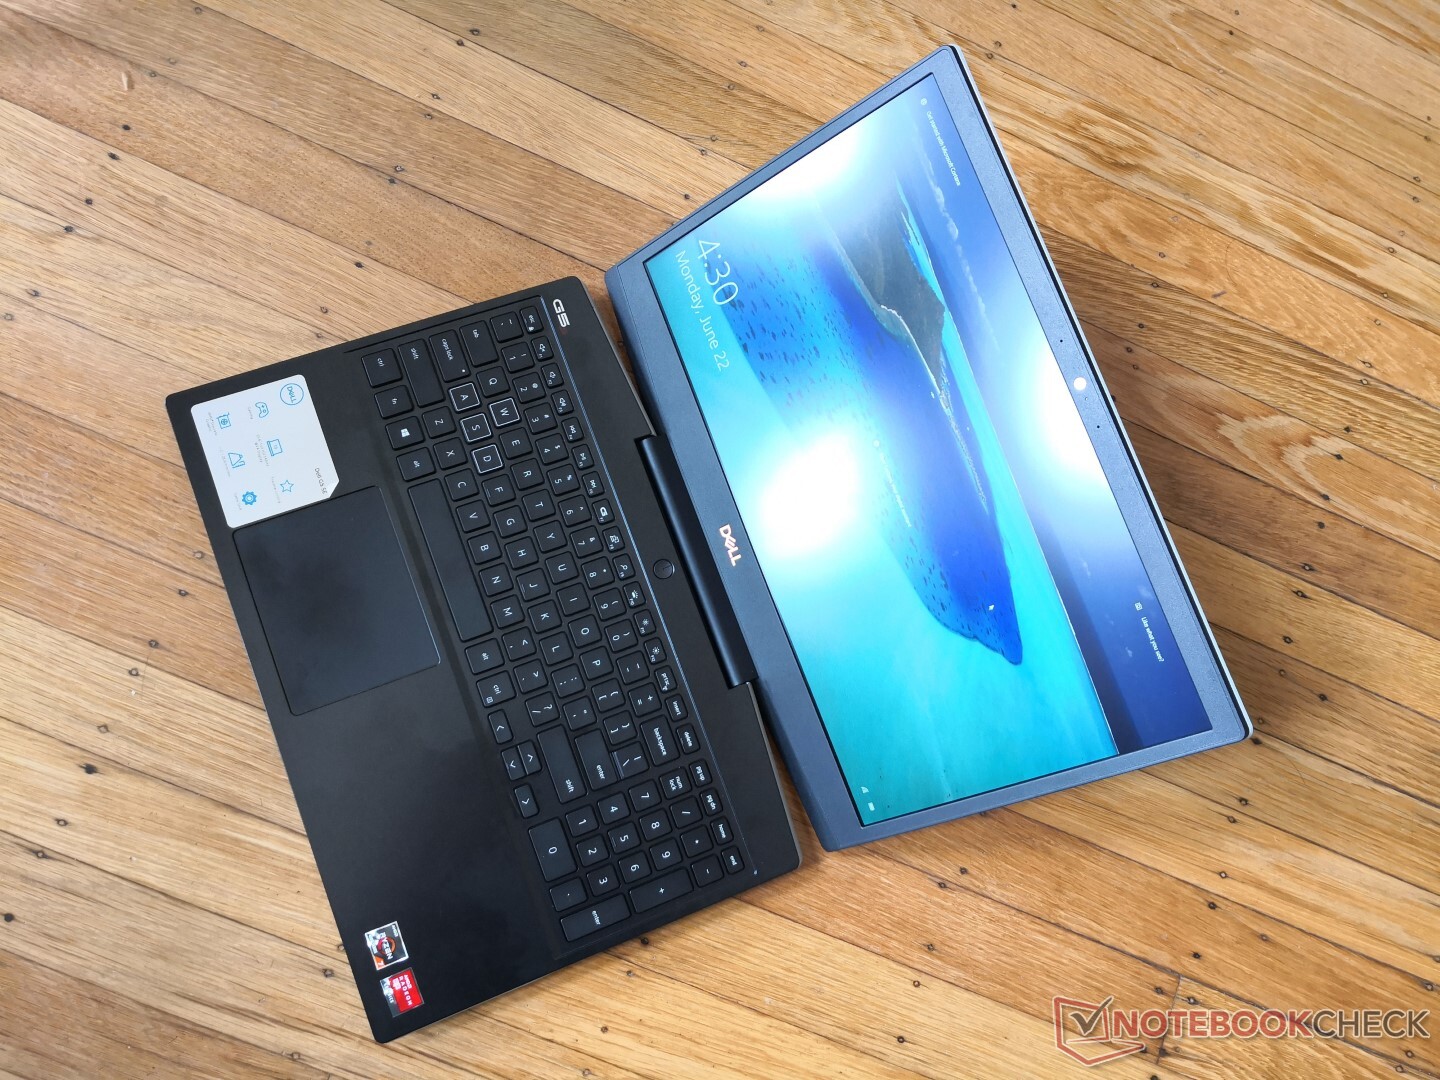
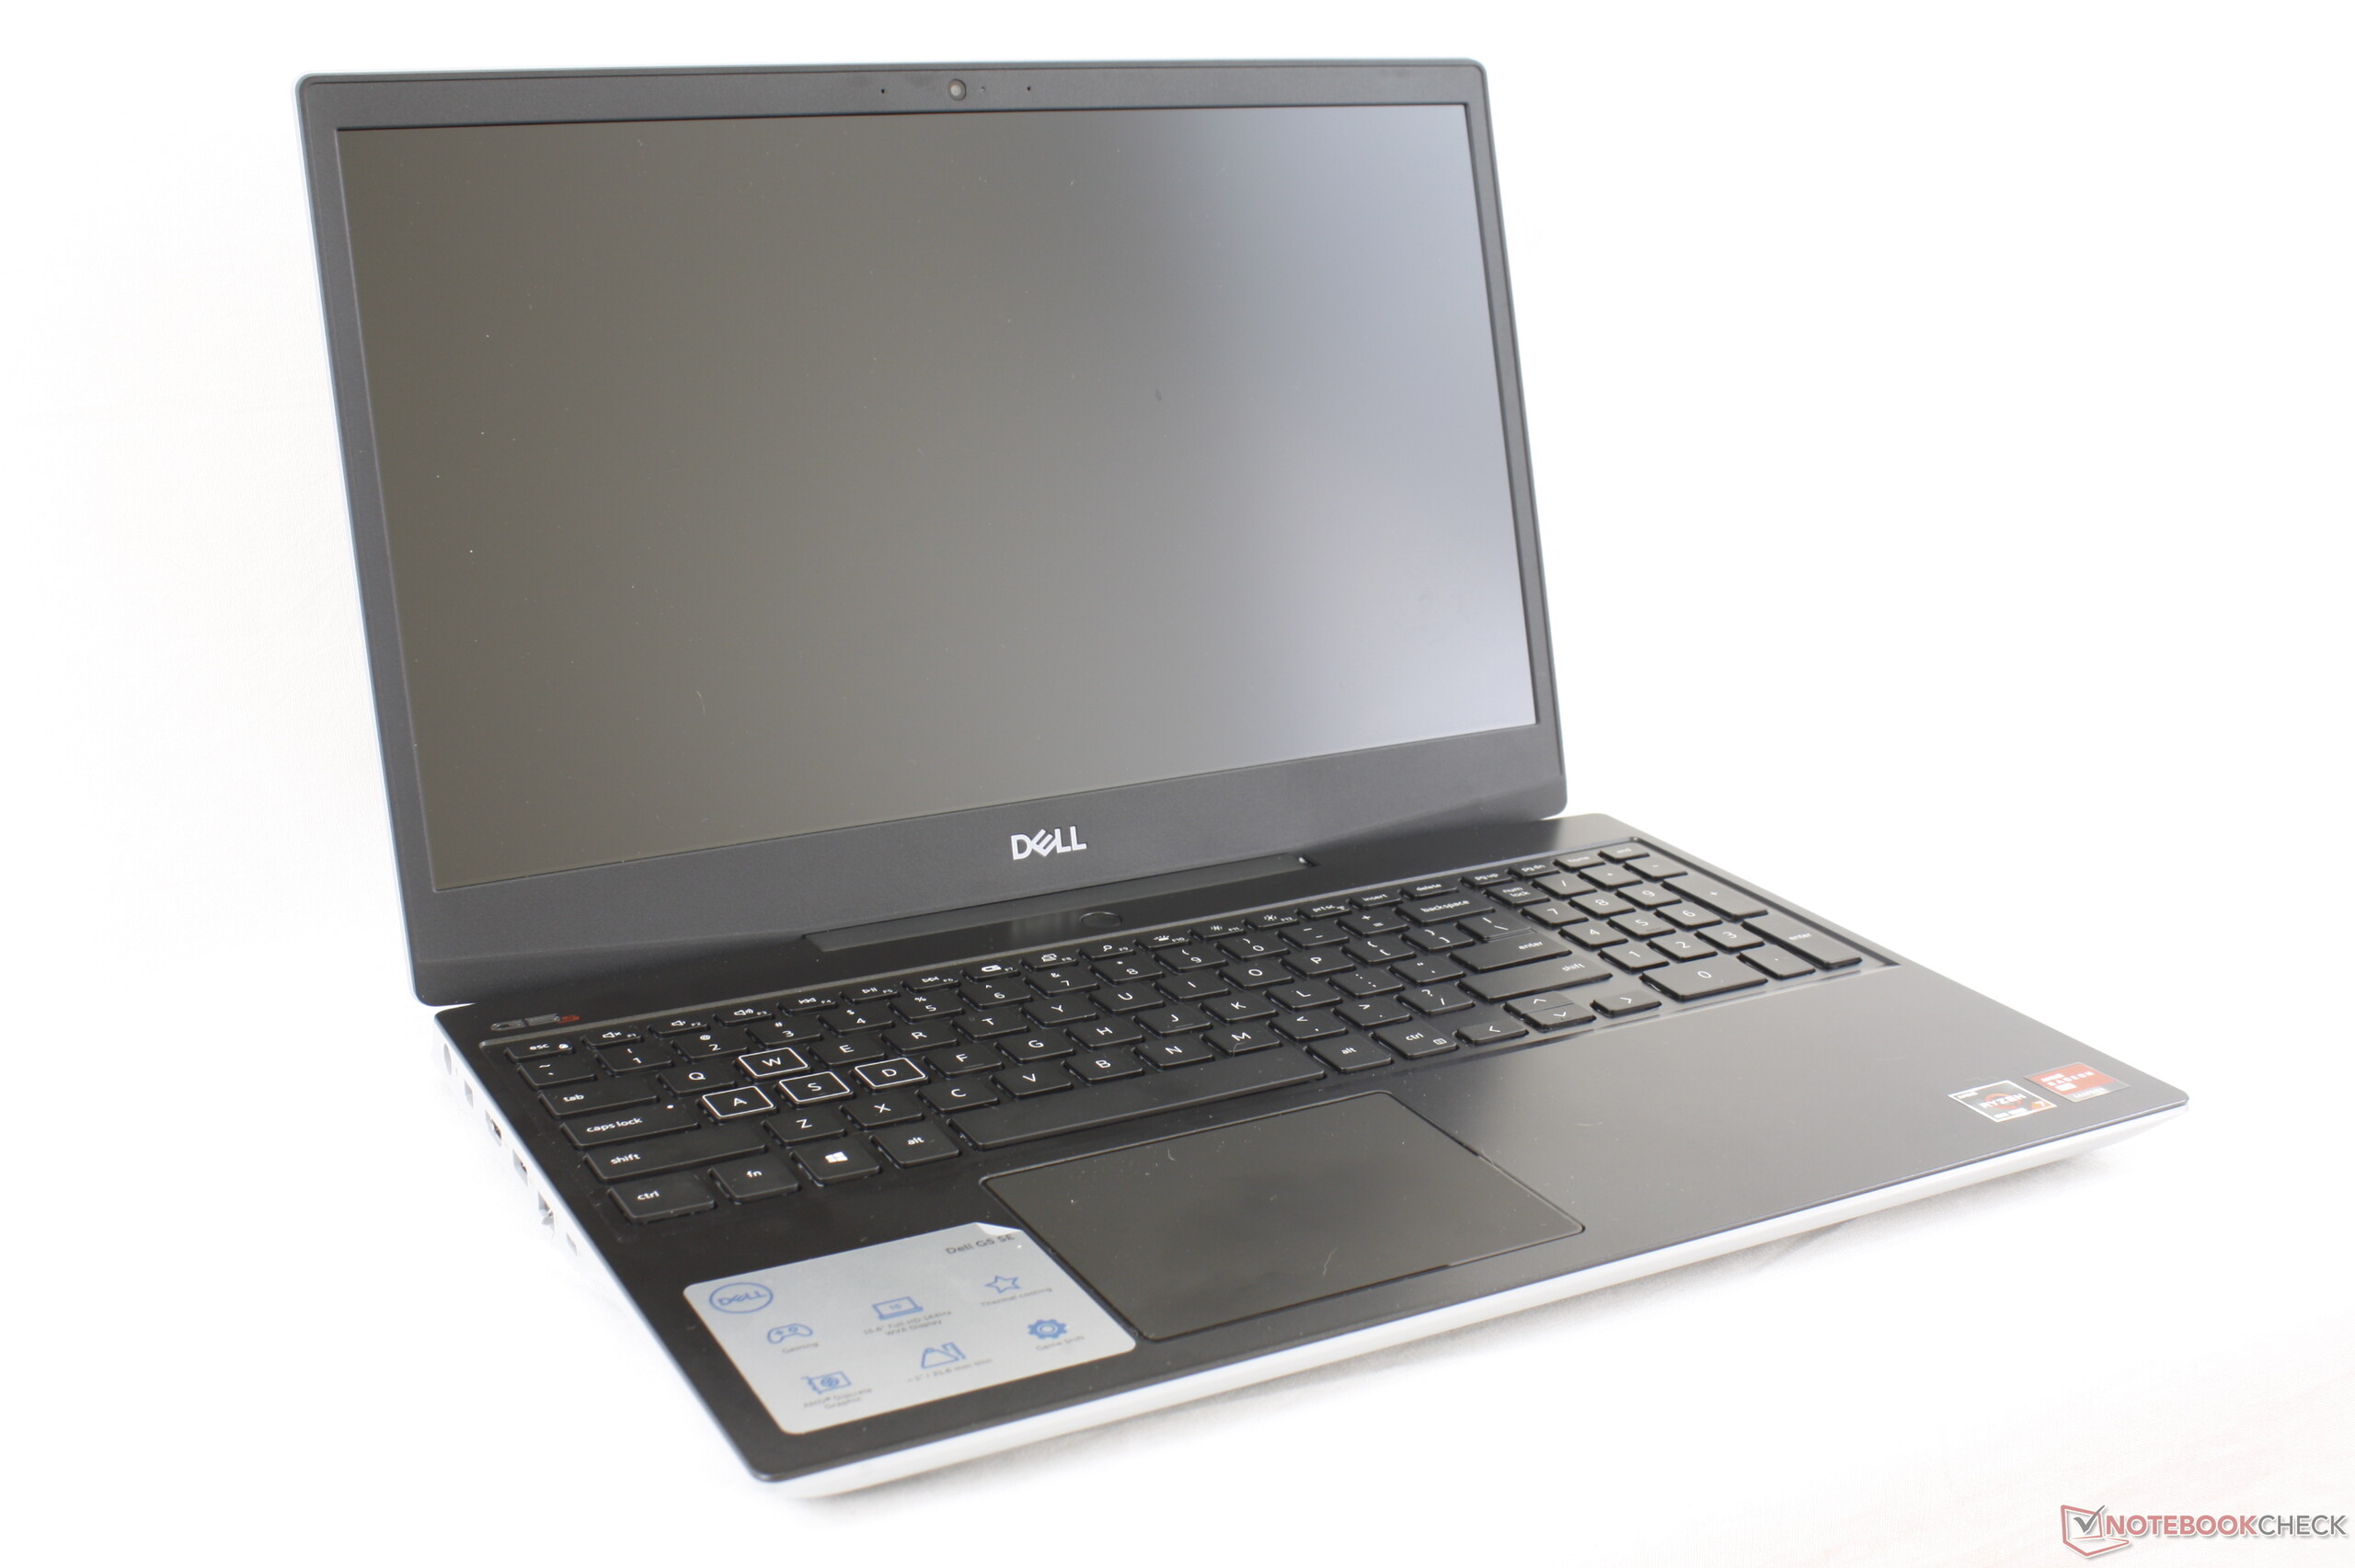
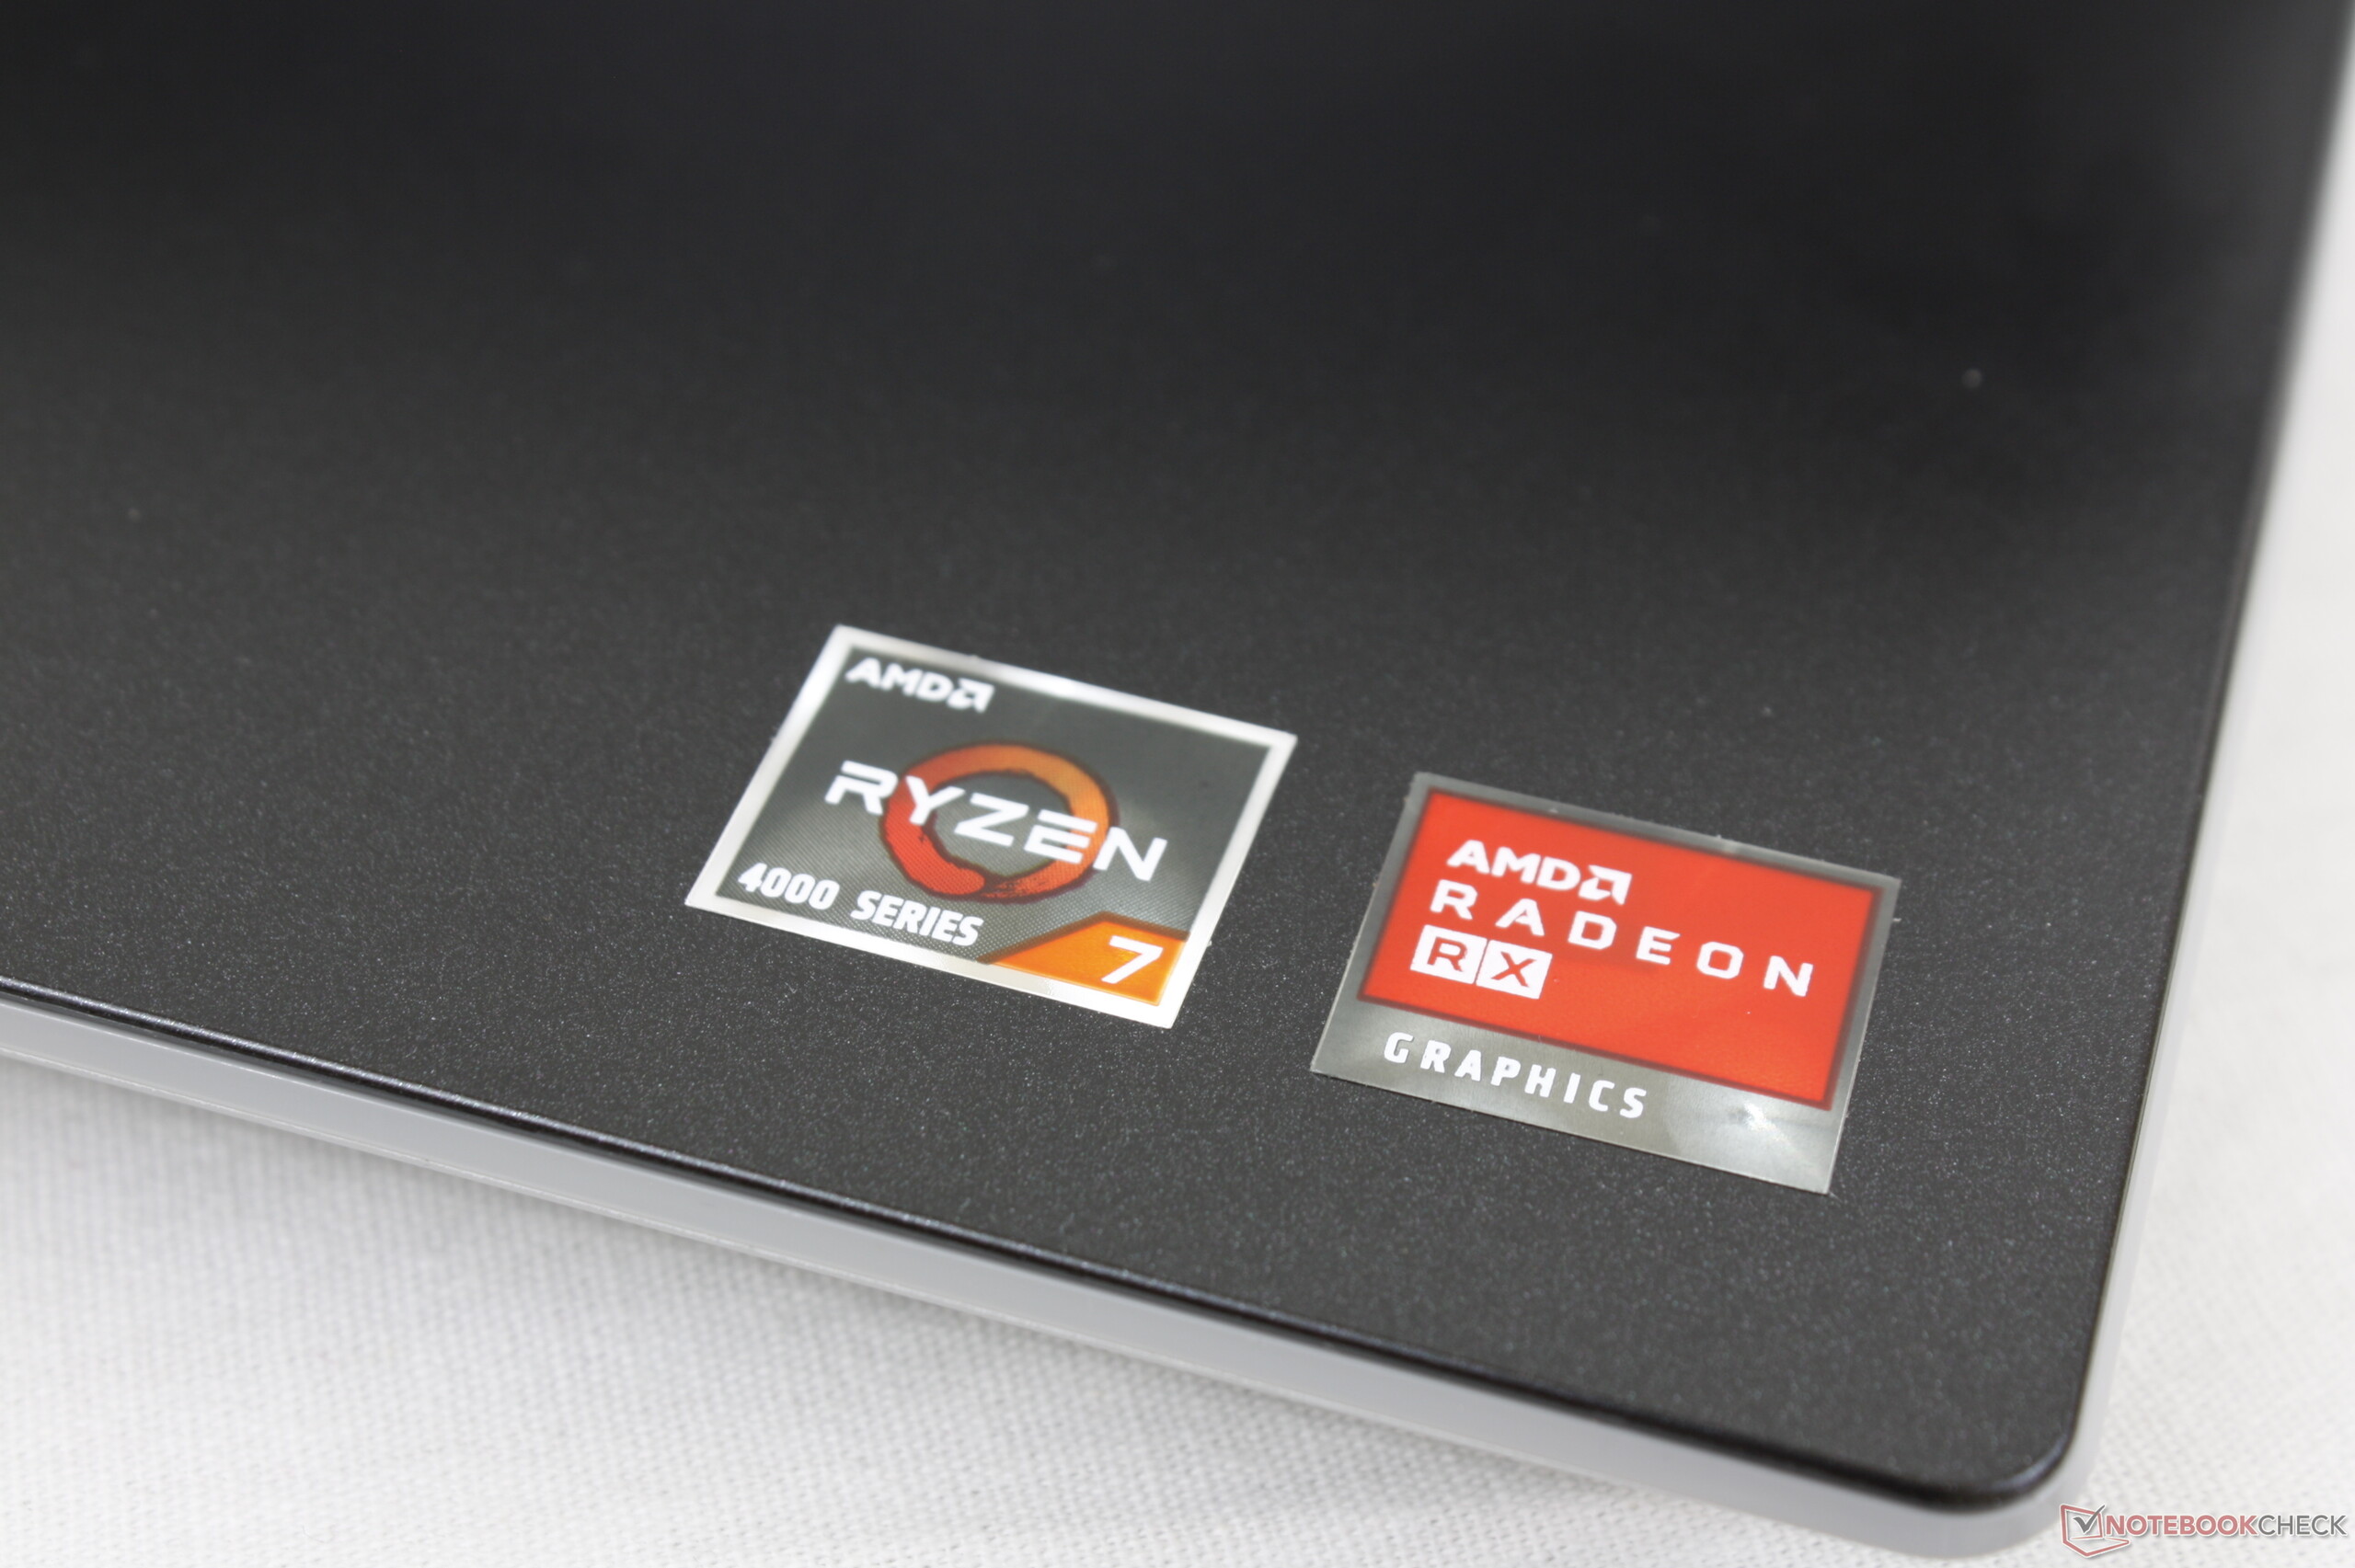
Indo de AMD com tudo: Breve Análise do Portátil Dell G5 15 Edição Especial Radeon RX 5600M
Avaliação | Data | Modelo | Peso | Altura | Size | Resolução | Preço |
|---|---|---|---|---|---|---|---|
| 83.7 % v7 (old) | 06/2020 | Dell G5 15 SE 5505 P89F R7 4800H, Radeon RX 5600M | 2.4 kg | 21.6 mm | 15.60" | 1920x1080 | |
| 82.7 % v7 (old) | 06/2020 | Asus TUF Gaming A15 FA506IV-HN172 R7 4800H, GeForce RTX 2060 Mobile | 2.2 kg | 24.9 mm | 15.60" | 1920x1080 | |
| 82.6 % v7 (old) | 11/2019 | Dell G5 15 5590-P8RVW i7-9750H, GeForce RTX 2070 Max-Q | 2.8 kg | 23.7 mm | 15.60" | 1920x1080 | |
| 84.8 % v7 (old) | Lenovo Legion Y740-15ICHg i7-9750H, GeForce RTX 2070 Max-Q | 2.3 kg | 25 mm | 15.60" | 1920x1080 | ||
| 83.2 % v7 (old) | 05/2020 | MSI GP65 10SFK-047US i7-10750H, GeForce RTX 2070 Mobile | 2.3 kg | 27.5 mm | 15.60" | 1920x1080 | |
| 81.5 % v7 (old) | 07/2019 | HP Omen 15-dc1020ng i5-9300H, GeForce GTX 1650 Mobile | 2.3 kg | 25 mm | 15.60" | 1920x1080 |
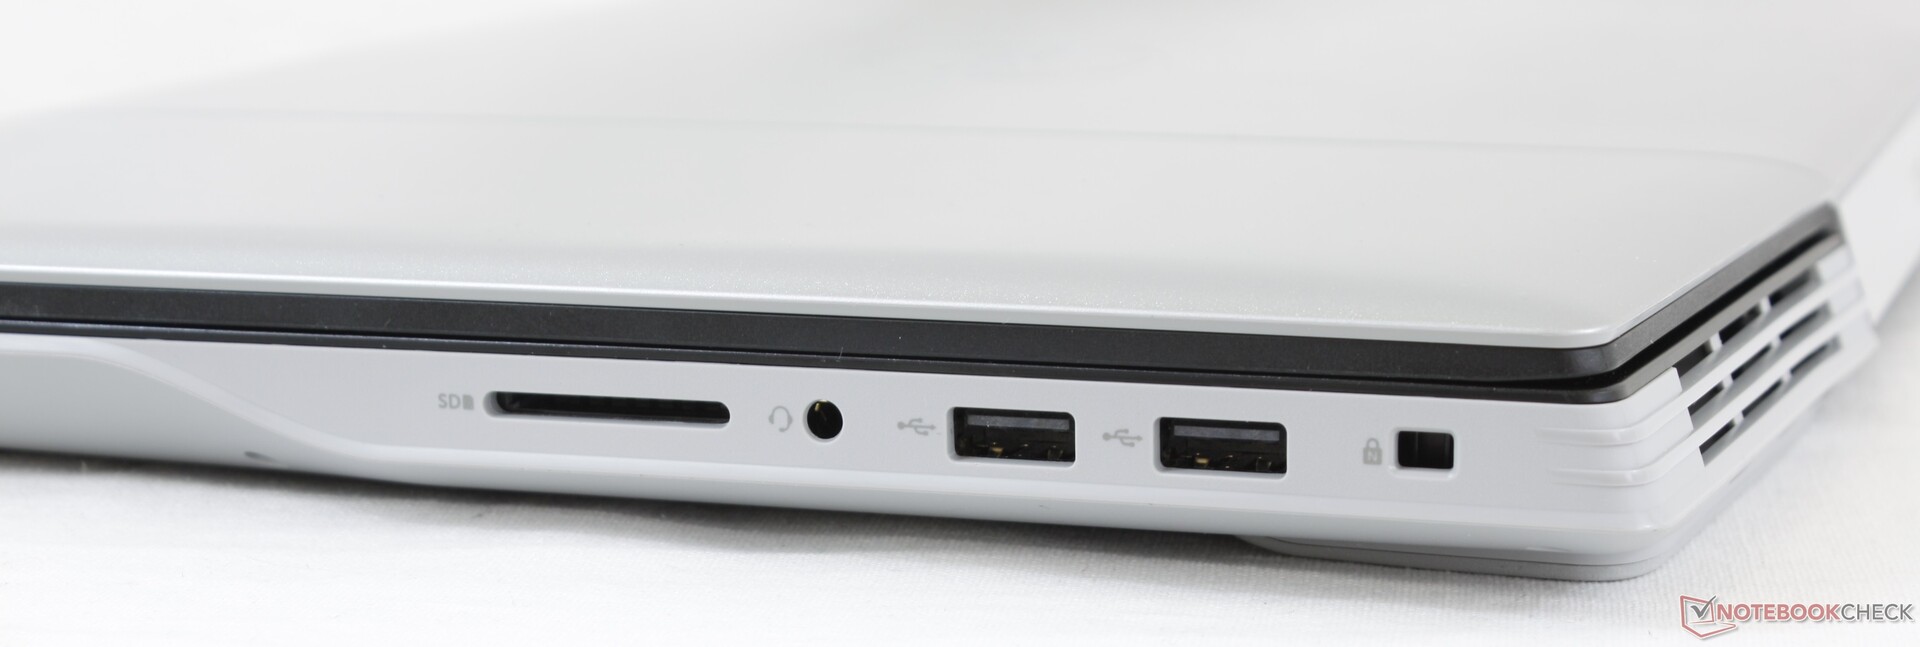
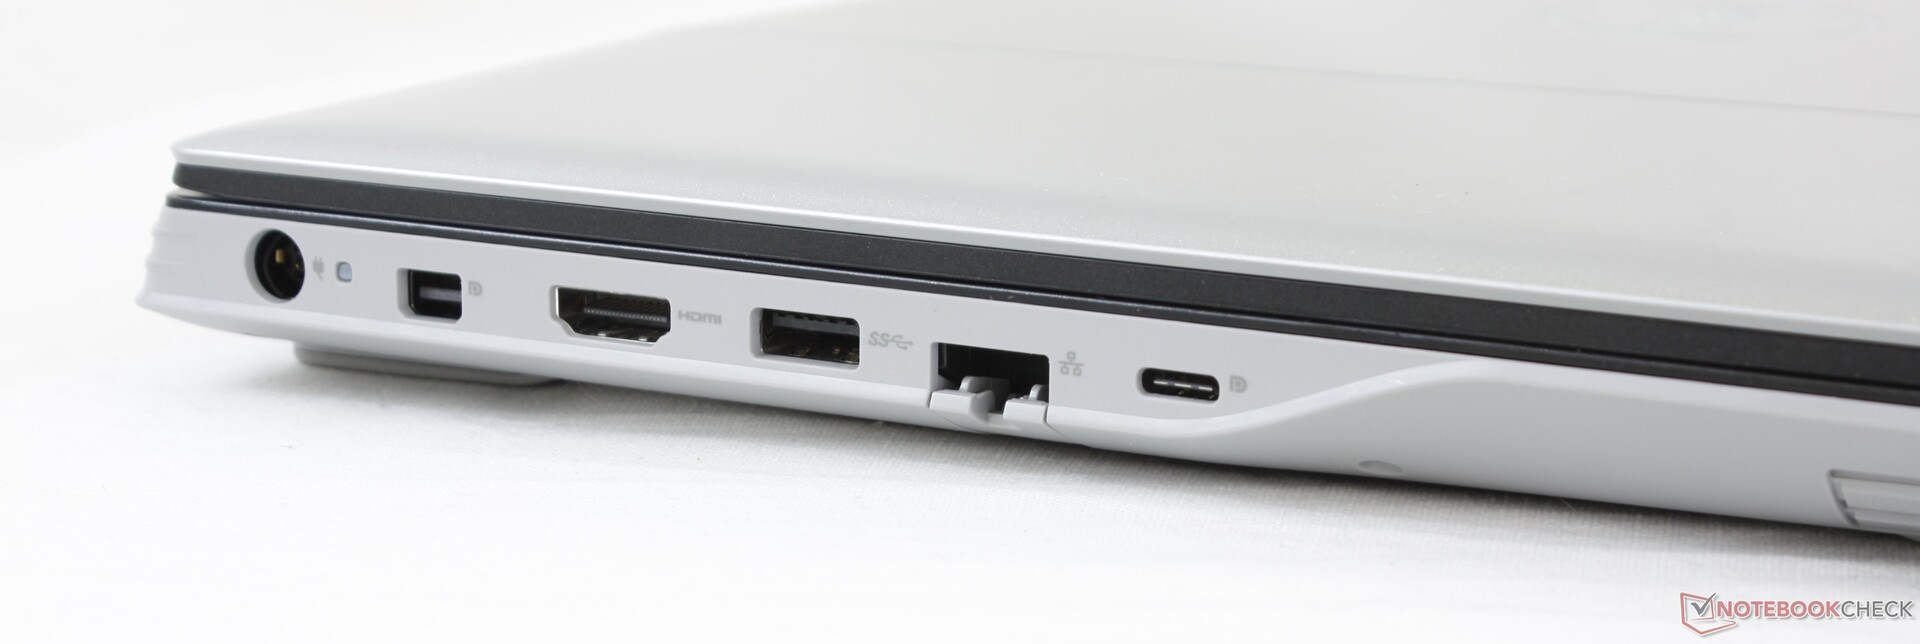
| SD Card Reader | |
| average JPG Copy Test (av. of 3 runs) | |
| HP Omen 15-dc1020ng (Toshiba Exceria Pro SDXC 64 GB UHS-II) | |
| Dell G5 15 SE 5505 P89F (Toshiba Exceria Pro SDXC 64 GB UHS-II) | |
| MSI GP65 10SFK-047US (Toshiba Exceria Pro SDXC 64 GB UHS-II) | |
| Dell G5 15 5590-P8RVW (Toshiba Exceria Pro SDXC 64 GB UHS-II) | |
| maximum AS SSD Seq Read Test (1GB) | |
| HP Omen 15-dc1020ng (Toshiba Exceria Pro SDXC 64 GB UHS-II) | |
| Dell G5 15 SE 5505 P89F (Toshiba Exceria Pro SDXC 64 GB UHS-II) | |
| MSI GP65 10SFK-047US (Toshiba Exceria Pro SDXC 64 GB UHS-II) | |
| Dell G5 15 5590-P8RVW (Toshiba Exceria Pro SDXC 64 GB UHS-II) | |


| |||||||||||||||||||||||||
iluminação: 77 %
iluminação com acumulador: 292 cd/m²
Contraste: 1081:1 (Preto: 0.27 cd/m²)
ΔE ColorChecker Calman: 3.99 | ∀{0.5-29.43 Ø4.72}
calibrated: 3.02
ΔE Greyscale Calman: 3.3 | ∀{0.09-98 Ø4.97}
89.7% sRGB (Argyll 1.6.3 3D)
58.1% AdobeRGB 1998 (Argyll 1.6.3 3D)
64.1% AdobeRGB 1998 (Argyll 3D)
90.1% sRGB (Argyll 3D)
63% Display P3 (Argyll 3D)
Gamma: 2.25
CCT: 7047 K
| Dell G5 15 SE 5505 P89F BOE NV156FH, WVA, 15.6", 1920x1080 | Asus TUF Gaming A15 FA506IV-HN172 LM156LF-2F01, IPS, 15.6", 1920x1080 | Dell G5 15 5590-P8RVW AU Optronics B156HAN (AUO80ED), IPS, 15.6", 1920x1080 | Lenovo Legion Y740-15ICHg BOE NV156FHM-N4J, IPS, 15.6", 1920x1080 | HP Omen 15-dc1020ng LGD05CE, IPS, 15.6", 1920x1080 | MSI Alpha 15 A3DDK-034 AU Optronics B156HAN08.0 (AUO80ED), IPS, 15.6", 1920x1080 | |
|---|---|---|---|---|---|---|
| Display | -37% | 3% | 5% | -38% | 3% | |
| Display P3 Coverage (%) | 63 | 38.92 -38% | 65.7 4% | 67.7 7% | 38.37 -39% | 66.4 5% |
| sRGB Coverage (%) | 90.1 | 58.5 -35% | 91.2 1% | 91.6 2% | 57.6 -36% | 91 1% |
| AdobeRGB 1998 Coverage (%) | 64.1 | 40.22 -37% | 66.7 4% | 67.1 5% | 39.69 -38% | 66.6 4% |
| Response Times | -95% | 1% | 7% | -135% | 35% | |
| Response Time Grey 50% / Grey 80% * (ms) | 20.4 ? | 34 ? -67% | 16.4 ? 20% | 19 ? 7% | 40 ? -96% | 7 ? 66% |
| Response Time Black / White * (ms) | 10.8 ? | 24 ? -122% | 12.8 ? -19% | 10 ? 7% | 29.6 ? -174% | 10.4 ? 4% |
| PWM Frequency (Hz) | 198.4 ? | |||||
| Screen | -27% | 4% | 28% | -34% | -5% | |
| Brightness middle (cd/m²) | 292 | 280 -4% | 291 0% | 477 63% | 251 -14% | 310 6% |
| Brightness (cd/m²) | 290 | 254 -12% | 295 2% | 431 49% | 232 -20% | 310 7% |
| Brightness Distribution (%) | 77 | 88 14% | 83 8% | 84 9% | 76 -1% | 86 12% |
| Black Level * (cd/m²) | 0.27 | 0.15 44% | 0.22 19% | 0.175 35% | 0.17 37% | 0.29 -7% |
| Contrast (:1) | 1081 | 1867 73% | 1323 22% | 2726 152% | 1476 37% | 1069 -1% |
| Colorchecker dE 2000 * | 3.99 | 5.89 -48% | 3.95 1% | 4.17 -5% | 6.2 -55% | 4.78 -20% |
| Colorchecker dE 2000 max. * | 6.11 | 19 -211% | 7.46 -22% | 6.97 -14% | 18.6 -204% | 8.1 -33% |
| Colorchecker dE 2000 calibrated * | 3.02 | 4.79 -59% | 2.05 32% | 2.51 17% | 4.8 -59% | 2.36 22% |
| Greyscale dE 2000 * | 3.3 | 4.08 -24% | 3.82 -16% | 3.49 -6% | 4.2 -27% | 4.78 -45% |
| Gamma | 2.25 98% | 2.33 94% | 2.49 88% | 2.5 88% | 2.32 95% | 2.43 91% |
| CCT | 7047 92% | 7303 89% | 7317 89% | 7076 92% | 7454 87% | 7739 84% |
| Color Space (Percent of AdobeRGB 1998) (%) | 58.1 | 37 -36% | 59 2% | 60 3% | 36.5 -37% | 59 2% |
| Color Space (Percent of sRGB) (%) | 89.7 | 58 -35% | 91 1% | 91 1% | 57.4 -36% | 91 1% |
| Média Total (Programa/Configurações) | -53% /
-37% | 3% /
4% | 13% /
21% | -69% /
-48% | 11% /
2% |
* ... menor é melhor
Exibir tempos de resposta
| ↔ Tempo de resposta preto para branco | ||
|---|---|---|
| 10.8 ms ... ascensão ↗ e queda ↘ combinadas | ↗ 6.4 ms ascensão | 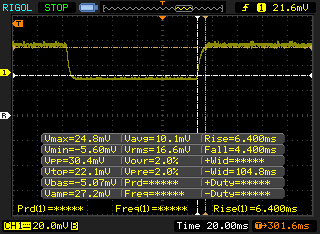 |
| ↘ 4.4 ms queda | ||
| A tela mostra boas taxas de resposta em nossos testes, mas pode ser muito lenta para jogadores competitivos. Em comparação, todos os dispositivos testados variam de 0.1 (mínimo) a 240 (máximo) ms. » 29 % de todos os dispositivos são melhores. Isso significa que o tempo de resposta medido é melhor que a média de todos os dispositivos testados (19.9 ms). | ||
| ↔ Tempo de resposta 50% cinza a 80% cinza | ||
| 20.4 ms ... ascensão ↗ e queda ↘ combinadas | ↗ 10.8 ms ascensão | 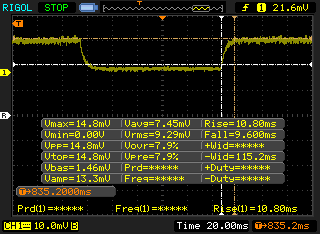 |
| ↘ 9.6 ms queda | ||
| A tela mostra boas taxas de resposta em nossos testes, mas pode ser muito lenta para jogadores competitivos. Em comparação, todos os dispositivos testados variam de 0.165 (mínimo) a 636 (máximo) ms. » 33 % de todos os dispositivos são melhores. Isso significa que o tempo de resposta medido é melhor que a média de todos os dispositivos testados (31.1 ms). | ||
Cintilação da tela / PWM (modulação por largura de pulso)
| Tela tremeluzindo/PWM detectado | 198.4 Hz | ≤ 99 % configuração de brilho | 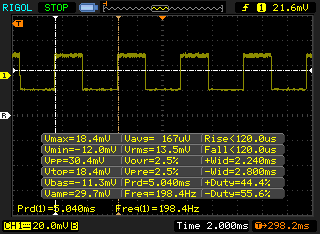 |
A luz de fundo da tela pisca em 198.4 Hz (pior caso, por exemplo, utilizando PWM) Cintilação detectada em uma configuração de brilho de 99 % e abaixo. Não deve haver cintilação ou PWM acima desta configuração de brilho. A frequência de 198.4 Hz é relativamente baixa, portanto, usuários sensíveis provavelmente notarão cintilação e sentirão fadiga ocular na configuração de brilho indicada e abaixo. [pwm_comparison] Em comparação: 52 % de todos os dispositivos testados não usam PWM para escurecer a tela. Se PWM foi detectado, uma média de 7784 (mínimo: 5 - máximo: 343500) Hz foi medida. | |||
Cinebench R15: CPU Multi 64Bit | CPU Single 64Bit
Blender: v2.79 BMW27 CPU
7-Zip 18.03: 7z b 4 -mmt1 | 7z b 4
Geekbench 5.5: Single-Core | Multi-Core
HWBOT x265 Benchmark v2.2: 4k Preset
LibreOffice : 20 Documents To PDF
R Benchmark 2.5: Overall mean
| Cinebench R20 / CPU (Multi Core) | |
| AMD Radeon RX Vega 64 | |
| Eurocom Sky X4C i9-9900KS | |
| Dell G5 15 SE 5505 P89F | |
| Asus Zephyrus G14 GA401IV | |
| Média AMD Ryzen 7 4800H (3692 - 4663, n=18) | |
| MSI GE66 Raider 10SFS | |
| Gigabyte Aero 15 OLED XB-8DE51B0SP | |
| MSI GE65 Raider 9SF-049US | |
| Dell XPS 15 9500 Core i7 4K UHD | |
| Acer Nitro 5 AN515-44-R5FT | |
| Schenker XMG Fusion 15 XFU15L19 | |
| MSI GE63 Raider 8SG | |
| MSI Alpha 15 A3DDK-034 | |
| Cinebench R20 / CPU (Single Core) | |
| Gigabyte Aero 15 OLED XB-8DE51B0SP | |
| Eurocom Sky X4C i9-9900KS | |
| AMD Radeon RX Vega 64 | |
| Asus Zephyrus G14 GA401IV | |
| Dell XPS 15 9500 Core i7 4K UHD | |
| Dell G5 15 SE 5505 P89F | |
| Média AMD Ryzen 7 4800H (462 - 491, n=17) | |
| MSI GE66 Raider 10SFS | |
| MSI GE65 Raider 9SF-049US | |
| Schenker XMG Fusion 15 XFU15L19 | |
| Acer Nitro 5 AN515-44-R5FT | |
| MSI GE63 Raider 8SG | |
| MSI Alpha 15 A3DDK-034 | |
| Cinebench R15 / CPU Multi 64Bit | |
| AMD Radeon RX Vega 64 | |
| Dell G5 15 SE 5505 P89F | |
| Eurocom Sky X4C i9-9900KS | |
| Asus Zephyrus G14 GA401IV | |
| Média AMD Ryzen 7 4800H (1652 - 1995, n=21) | |
| Gigabyte Aero 15 OLED XB-8DE51B0SP | |
| MSI GE66 Raider 10SFS | |
| MSI GE65 Raider 9SF-049US | |
| Acer Nitro 5 AN515-44-R5FT | |
| Dell XPS 15 9500 Core i7 4K UHD | |
| Schenker XMG Fusion 15 XFU15L19 | |
| MSI GE63 Raider 8SG | |
| MSI Alpha 15 A3DDK-034 | |
| Cinebench R15 / CPU Single 64Bit | |
| Eurocom Sky X4C i9-9900KS | |
| Gigabyte Aero 15 OLED XB-8DE51B0SP | |
| MSI GE66 Raider 10SFS | |
| AMD Radeon RX Vega 64 | |
| Dell XPS 15 9500 Core i7 4K UHD | |
| MSI GE65 Raider 9SF-049US | |
| Asus Zephyrus G14 GA401IV | |
| Dell G5 15 SE 5505 P89F | |
| Média AMD Ryzen 7 4800H (186 - 191, n=15) | |
| Schenker XMG Fusion 15 XFU15L19 | |
| Acer Nitro 5 AN515-44-R5FT | |
| MSI GE63 Raider 8SG | |
| MSI Alpha 15 A3DDK-034 | |
| Blender / v2.79 BMW27 CPU | |
| Schenker XMG Fusion 15 XFU15L19 | |
| Dell XPS 15 9500 Core i7 4K UHD | |
| Acer Nitro 5 AN515-44-R5FT | |
| Asus Zephyrus G14 GA401IV | |
| Gigabyte Aero 15 OLED XB-8DE51B0SP | |
| MSI GE66 Raider 10SFS | |
| Dell G5 15 SE 5505 P89F | |
| Média AMD Ryzen 7 4800H (248 - 299, n=15) | |
| Eurocom Sky X4C i9-9900KS | |
| AMD Radeon RX Vega 64 | |
| 7-Zip 18.03 / 7z b 4 -mmt1 | |
| Eurocom Sky X4C i9-9900KS | |
| MSI GE66 Raider 10SFS | |
| Gigabyte Aero 15 OLED XB-8DE51B0SP | |
| Dell XPS 15 9500 Core i7 4K UHD | |
| AMD Radeon RX Vega 64 | |
| Schenker XMG Fusion 15 XFU15L19 | |
| Média AMD Ryzen 7 4800H (4575 - 4743, n=15) | |
| Dell G5 15 SE 5505 P89F | |
| Asus Zephyrus G14 GA401IV | |
| Acer Nitro 5 AN515-44-R5FT | |
| 7-Zip 18.03 / 7z b 4 | |
| AMD Radeon RX Vega 64 | |
| Eurocom Sky X4C i9-9900KS | |
| Média AMD Ryzen 7 4800H (44827 - 53883, n=15) | |
| Dell G5 15 SE 5505 P89F | |
| Asus Zephyrus G14 GA401IV | |
| Gigabyte Aero 15 OLED XB-8DE51B0SP | |
| MSI GE66 Raider 10SFS | |
| Acer Nitro 5 AN515-44-R5FT | |
| Dell XPS 15 9500 Core i7 4K UHD | |
| Schenker XMG Fusion 15 XFU15L19 | |
| Geekbench 5.5 / Single-Core | |
| Eurocom Sky X4C i9-9900KS | |
| MSI GE66 Raider 10SFS | |
| Gigabyte Aero 15 OLED XB-8DE51B0SP | |
| Dell XPS 15 9500 Core i7 4K UHD | |
| AMD Radeon RX Vega 64 | |
| Schenker XMG Fusion 15 XFU15L19 | |
| Asus Zephyrus G14 GA401IV | |
| Média AMD Ryzen 7 4800H (1154 - 1207, n=17) | |
| Dell G5 15 SE 5505 P89F | |
| Acer Nitro 5 AN515-44-R5FT | |
| MSI Alpha 15 A3DDK-034 | |
| Geekbench 5.5 / Multi-Core | |
| Eurocom Sky X4C i9-9900KS | |
| AMD Radeon RX Vega 64 | |
| MSI GE66 Raider 10SFS | |
| Gigabyte Aero 15 OLED XB-8DE51B0SP | |
| Dell XPS 15 9500 Core i7 4K UHD | |
| Dell G5 15 SE 5505 P89F | |
| Média AMD Ryzen 7 4800H (5920 - 8672, n=17) | |
| Asus Zephyrus G14 GA401IV | |
| Schenker XMG Fusion 15 XFU15L19 | |
| Acer Nitro 5 AN515-44-R5FT | |
| MSI Alpha 15 A3DDK-034 | |
| HWBOT x265 Benchmark v2.2 / 4k Preset | |
| AMD Radeon RX Vega 64 | |
| Eurocom Sky X4C i9-9900KS | |
| Gigabyte Aero 15 OLED XB-8DE51B0SP | |
| MSI GE66 Raider 10SFS | |
| Dell G5 15 SE 5505 P89F | |
| Média AMD Ryzen 7 4800H (10.8 - 14.1, n=16) | |
| Asus Zephyrus G14 GA401IV | |
| Schenker XMG Fusion 15 XFU15L19 | |
| Dell XPS 15 9500 Core i7 4K UHD | |
| Acer Nitro 5 AN515-44-R5FT | |
| LibreOffice / 20 Documents To PDF | |
| Dell G5 15 SE 5505 P89F | |
| Acer Nitro 5 AN515-44-R5FT | |
| Média AMD Ryzen 7 4800H (28.6 - 95.8, n=14) | |
| Schenker XMG Fusion 15 XFU15L19 | |
| MSI GE66 Raider 10SFS | |
| Dell XPS 15 9500 Core i7 4K UHD | |
| Gigabyte Aero 15 OLED XB-8DE51B0SP | |
| R Benchmark 2.5 / Overall mean | |
| Acer Nitro 5 AN515-44-R5FT | |
| Schenker XMG Fusion 15 XFU15L19 | |
| Dell XPS 15 9500 Core i7 4K UHD | |
| Média AMD Ryzen 7 4800H (0.562 - 0.603, n=15) | |
| Dell G5 15 SE 5505 P89F | |
| MSI GE66 Raider 10SFS | |
| Gigabyte Aero 15 OLED XB-8DE51B0SP | |
Cinebench R15: CPU Multi 64Bit | CPU Single 64Bit
Blender: v2.79 BMW27 CPU
7-Zip 18.03: 7z b 4 -mmt1 | 7z b 4
Geekbench 5.5: Single-Core | Multi-Core
HWBOT x265 Benchmark v2.2: 4k Preset
LibreOffice : 20 Documents To PDF
R Benchmark 2.5: Overall mean
* ... menor é melhor
| PCMark 10 | |
| Score | |
| MSI GP65 10SFK-047US | |
| Lenovo Legion Y740-15ICHg | |
| Dell G5 15 SE 5505 P89F | |
| Dell G5 15 5590-P8RVW | |
| Asus TUF Gaming A15 FA506IV-HN172 | |
| HP Omen 15-dc1020ng | |
| MSI Alpha 15 A3DDK-034 | |
| Essentials | |
| MSI GP65 10SFK-047US | |
| Dell G5 15 SE 5505 P89F | |
| Lenovo Legion Y740-15ICHg | |
| Dell G5 15 5590-P8RVW | |
| Asus TUF Gaming A15 FA506IV-HN172 | |
| HP Omen 15-dc1020ng | |
| MSI Alpha 15 A3DDK-034 | |
| Productivity | |
| MSI GP65 10SFK-047US | |
| Lenovo Legion Y740-15ICHg | |
| Dell G5 15 SE 5505 P89F | |
| HP Omen 15-dc1020ng | |
| Asus TUF Gaming A15 FA506IV-HN172 | |
| Dell G5 15 5590-P8RVW | |
| MSI Alpha 15 A3DDK-034 | |
| Digital Content Creation | |
| Lenovo Legion Y740-15ICHg | |
| Dell G5 15 SE 5505 P89F | |
| MSI GP65 10SFK-047US | |
| Dell G5 15 5590-P8RVW | |
| Asus TUF Gaming A15 FA506IV-HN172 | |
| MSI Alpha 15 A3DDK-034 | |
| HP Omen 15-dc1020ng | |
| PCMark 8 | |
| Home Score Accelerated v2 | |
| Lenovo Legion Y740-15ICHg | |
| Dell G5 15 SE 5505 P89F | |
| Asus TUF Gaming A15 FA506IV-HN172 | |
| MSI GP65 10SFK-047US | |
| MSI Alpha 15 A3DDK-034 | |
| HP Omen 15-dc1020ng | |
| Work Score Accelerated v2 | |
| MSI GP65 10SFK-047US | |
| Lenovo Legion Y740-15ICHg | |
| Asus TUF Gaming A15 FA506IV-HN172 | |
| Dell G5 15 SE 5505 P89F | |
| HP Omen 15-dc1020ng | |
| MSI Alpha 15 A3DDK-034 | |
| PCMark 8 Home Score Accelerated v2 | 4894 pontos | |
| PCMark 8 Work Score Accelerated v2 | 5352 pontos | |
| PCMark 10 Score | 5936 pontos | |
Ajuda | ||
| DPC Latencies / LatencyMon - interrupt to process latency (max), Web, Youtube, Prime95 | |
| Dell XPS 15 9500 Core i7 4K UHD | |
| HP Envy x360 15-dr1679cl | |
| Dell G5 15 SE 5505 P89F | |
| Gigabyte Aero 15 OLED XB-8DE51B0SP | |
| MSI GP65 10SFK-047US | |
| Acer Nitro 5 AN515-44-R5FT | |
| MSI GE66 Raider 10SFS | |
| Asus TUF Gaming A15 FA506IV-HN172 | |
* ... menor é melhor
| Dell G5 15 SE 5505 P89F Samsung PM991 MZ9LQ512HALU | Dell G5 15 5590-P8RVW SK Hynix BC501 HFM512GDJTNG | Asus TUF Gaming A15 FA506IV-HN172 Kingston OM8PCP3512F-AB | HP Omen 15-dc1020ng WDC PC SN720 SDAQNTW-512G | MSI Alpha 15 A3DDK-034 Kingston RBUSNS8154P3512GJ | |
|---|---|---|---|---|---|
| AS SSD | -10% | -3% | 48% | -12% | |
| Seq Read (MB/s) | 1386 | 1221 -12% | 1682 21% | 2955 113% | 1423 3% |
| Seq Write (MB/s) | 1234 | 731 -41% | 904 -27% | 2440 98% | 958 -22% |
| 4K Read (MB/s) | 41.32 | 37.93 -8% | 60.2 46% | 40.56 -2% | 33.2 -20% |
| 4K Write (MB/s) | 128 | 88.1 -31% | 164.8 29% | 118.6 -7% | 80.7 -37% |
| 4K-64 Read (MB/s) | 854 | 778 -9% | 472.5 -45% | 1283 50% | 816 -4% |
| 4K-64 Write (MB/s) | 721 | 552 -23% | 845 17% | 1538 113% | 708 -2% |
| Access Time Read * (ms) | 0.098 | 0.091 7% | 0.087 11% | 0.084 14% | 0.1 -2% |
| Access Time Write * (ms) | 0.095 | 0.043 55% | 0.02 79% | 0.032 66% | 0.047 51% |
| Score Read (Points) | 1034 | 938 -9% | 701 -32% | 1619 57% | 991 -4% |
| Score Write (Points) | 973 | 713 -27% | 1101 13% | 1901 95% | 885 -9% |
| Score Total (Points) | 2536 | 2114 -17% | 2143 -15% | 4323 70% | 2365 -7% |
| Copy ISO MB/s (MB/s) | 1284 | 675 -47% | 1418 10% | 1043 -19% | |
| Copy Program MB/s (MB/s) | 401.9 | 248.4 -38% | 392.5 -2% | 252.7 -37% | |
| Copy Game MB/s (MB/s) | 1013 | 535 -47% | 907 -10% | 483.6 -52% | |
| CrystalDiskMark 5.2 / 6 | -32% | 1% | 22% | -25% | |
| Write 4K (MB/s) | 142.1 | 64.6 -55% | 219.8 55% | 112.1 -21% | 105.4 -26% |
| Read 4K (MB/s) | 46.43 | 35.64 -23% | 50.2 8% | 42.01 -10% | 33.24 -28% |
| Write Seq (MB/s) | 1108 | 748 -32% | 979 -12% | 1964 77% | 1029 -7% |
| Read Seq (MB/s) | 1622 | 1039 -36% | 1990 23% | 2065 27% | 1098 -32% |
| Write 4K Q32T1 (MB/s) | 467 | 435.7 -7% | 516 10% | 318.2 -32% | 322.1 -31% |
| Read 4K Q32T1 (MB/s) | 525 | 292.4 -44% | 298.3 -43% | 406.7 -23% | 352 -33% |
| Write Seq Q32T1 (MB/s) | 1203 | 870 -28% | 982 -18% | 2534 111% | 1036 -14% |
| Read Seq Q32T1 (MB/s) | 2288 | 1557 -32% | 1907 -17% | 3438 50% | 1606 -30% |
| Write 4K Q8T8 (MB/s) | 981 | ||||
| Read 4K Q8T8 (MB/s) | 300.9 | ||||
| Média Total (Programa/Configurações) | -21% /
-20% | -1% /
-1% | 35% /
38% | -19% /
-16% |
* ... menor é melhor

Disk Throttling: DiskSpd Read Loop, Queue Depth 8
| 3DMark 11 | |
| 1280x720 Performance GPU | |
| Eurocom Sky X4C i9-9900KS | |
| MSI GE66 Raider 10SFS | |
| MSI RTX 2060 Gaming Z 6G | |
| Dell G5 15 SE 5505 P89F | |
| Razer Blade 15 RZ09-0328 | |
| Asus TUF Gaming A15 FA506IV-HN172 | |
| Média NVIDIA GeForce RTX 2060 Mobile (19143 - 24662, n=40) | |
| Maingear Vector 15 | |
| HP Omen 15-dc0015ng | |
| MSI Bravo 17 A4DDR | |
| Acer Nitro 5 AN515-44-R5FT | |
| Asus Zephyrus S GX531GM | |
| 1280x720 Performance Combined | |
| Eurocom Sky X4C i9-9900KS | |
| MSI GE66 Raider 10SFS | |
| MSI RTX 2060 Gaming Z 6G | |
| MSI Bravo 17 A4DDR | |
| Dell G5 15 SE 5505 P89F | |
| Maingear Vector 15 | |
| HP Omen 15-dc0015ng | |
| Razer Blade 15 RZ09-0328 | |
| Média NVIDIA GeForce RTX 2060 Mobile (1107 - 14726, n=40) | |
| Asus TUF Gaming A15 FA506IV-HN172 | |
| Acer Nitro 5 AN515-44-R5FT | |
| Asus Zephyrus S GX531GM | |
| 3DMark 06 Standard Score | 38139 pontos | |
| 3DMark Vantage P Result | 18582 pontos | |
| 3DMark 11 Performance | 21400 pontos | |
| 3DMark Ice Storm Standard Score | 76143 pontos | |
| 3DMark Cloud Gate Standard Score | 36805 pontos | |
| 3DMark Fire Strike Score | 16652 pontos | |
| 3DMark Time Spy Score | 6610 pontos | |
Ajuda | ||
| Shadow of the Tomb Raider - 1920x1080 Highest Preset AA:T | |
| MSI GE66 Raider 10SFS | |
| Lenovo Legion Y740-17IRH | |
| Eluktronics RP-15 | |
| Média NVIDIA GeForce RTX 2060 Mobile (54 - 86, n=22) | |
| Asus Zephyrus G14 GA401IV | |
| Dell G5 15 SE 5505 P89F | |
| MSI Bravo 17 A4DDR | |
| Acer Nitro 5 AN515-44-R5FT | |
| Razer Blade Stealth Core i7 GTX 1650 Ti Max-Q 4K | |
| MSI Prestige 14 A10RD | |
| The Witcher 3 - 1920x1080 Ultra Graphics & Postprocessing (HBAO+) | |
| MSI GE66 Raider 10SFS | |
| Dell G5 15 SE 5505 P89F | |
| Eluktronics RP-15 | |
| Média NVIDIA GeForce RTX 2060 Mobile (50.6 - 74, n=40) | |
| Lenovo Legion Y740-17IRH | |
| Asus Zephyrus G14 GA401IV | |
| MSI Bravo 17 A4DDR | |
| Acer Nitro 5 AN515-44-R5FT | |
| Razer Blade Stealth Core i7 GTX 1650 Ti Max-Q 4K | |
| Asus ZenBook 15 UX534FTC-A8190T | |
| MSI Prestige 14 A10RD | |
| Borderlands 3 - 1920x1080 Badass Overall Quality (DX11) | |
| MSI GE66 Raider 10SFS | |
| Lenovo Legion Y740-17IRH | |
| Média NVIDIA GeForce RTX 2060 Mobile (47.5 - 57.3, n=7) | |
| Asus Zephyrus G14 GA401IV | |
| Dell G5 15 SE 5505 P89F | |
| Eluktronics RP-15 | |
| NVIDIA GeForce GTX 1060 | |
| MSI Bravo 17 A4DDR | |
| Acer Nitro 5 AN515-44-R5FT | |
| Razer Blade Stealth Core i7 GTX 1650 Ti Max-Q 4K | |
| Asus ZenBook 15 UX534FTC-A8190T | |
| MSI Prestige 14 A10RD | |
| baixo | média | alto | ultra | |
|---|---|---|---|---|
| The Witcher 3 (2015) | 266.4 | 103.6 | 66.1 | |
| Dota 2 Reborn (2015) | 124 | 119 | 106 | 102 |
| X-Plane 11.11 (2018) | 48.2 | 37.6 | 33.7 | |
| Shadow of the Tomb Raider (2018) | 122 | 89 | 83 | 68 |
| Assassin´s Creed Odyssey (2018) | 78 | 67 | 60 | 49 |
| Apex Legends (2019) | 143.7 | 137.1 | 110.7 | 104.1 |
| Far Cry New Dawn (2019) | 91 | 77 | 74 | 67 |
| Metro Exodus (2019) | 146.4 | 75.5 | 55.2 | 44.9 |
| Dirt Rally 2.0 (2019) | 215 | 135 | 113.6 | 77.3 |
| The Division 2 (2019) | 129 | 93 | 75 | 57 |
| Anno 1800 (2019) | 80.4 | 79.1 | 63.5 | 40 |
| Total War: Three Kingdoms (2019) | 196.8 | 96.9 | 64.9 | 44.2 |
| F1 2019 (2019) | 191 | 140 | 114 | 106 |
| Control (2019) | 176.7 | 72.3 | 53.1 | |
| Borderlands 3 (2019) | 105.2 | 81.7 | 61.2 | 47.8 |
| Ghost Recon Breakpoint (2019) | 96 | 76 | 68 | 50 |
| GRID 2019 (2019) | 186.2 | 134.3 | 116.6 | 88.6 |
| Need for Speed Heat (2019) | 86.9 | 76.6 | 70.1 | 60.1 |
| Star Wars Jedi Fallen Order (2019) | 76 | 68.4 | 67.1 | |
| Hunt Showdown (2020) | 150.7 | 91.3 | 66.2 | |
| Doom Eternal (2020) | 232.3 | 144.7 | 124 | 114.6 |
| Gears Tactics (2020) | 137.8 | 135.7 | 96.1 | 70.6 |
| Dell G5 15 SE 5505 P89F Radeon RX 5600M, R7 4800H, Samsung PM991 MZ9LQ512HALU | Dell G5 15 5590-P8RVW GeForce RTX 2070 Max-Q, i7-9750H, SK Hynix BC501 HFM512GDJTNG | Asus TUF Gaming A15 FA506IV-HN172 GeForce RTX 2060 Mobile, R7 4800H, Kingston OM8PCP3512F-AB | HP Omen 15-dc1020ng GeForce GTX 1650 Mobile, i5-9300H, WDC PC SN720 SDAQNTW-512G | MSI Alpha 15 A3DDK-034 Radeon RX 5500M, R7 3750H, Kingston RBUSNS8154P3512GJ | Lenovo Legion Y740-15ICHg GeForce RTX 2070 Max-Q, i7-9750H, WDC PC SN520 SDAPMUW-128G | |
|---|---|---|---|---|---|---|
| Noise | -20% | -10% | 0% | -32% | -10% | |
| desligado / ambiente * (dB) | 28 | 30 -7% | 30.2 -8% | 28.8 -3% | 29 -4% | 30 -7% |
| Idle Minimum * (dB) | 28 | 32 -14% | 30.2 -8% | 28.8 -3% | 36 -29% | 31.3 -12% |
| Idle Average * (dB) | 28 | 33 -18% | 30.2 -8% | 29.5 -5% | 37 -32% | 31.3 -12% |
| Idle Maximum * (dB) | 28 | 34 -21% | 30.2 -8% | 31.1 -11% | 46 -64% | 31.3 -12% |
| Load Average * (dB) | 28 | 50 -79% | 40 -43% | 35.2 -26% | 50 -79% | 42 -50% |
| Witcher 3 ultra * (dB) | 50.6 | 50 1% | 49 3% | 35.2 30% | 51 -1% | 42.1 17% |
| Load Maximum * (dB) | 50.6 | 52 -3% | 49 3% | 41 19% | 57 -13% | 46.5 8% |
* ... menor é melhor
Barulho
| Ocioso |
| 28 / 28 / 28 dB |
| Carga |
| 28 / 50.6 dB |
 | ||
30 dB silencioso 40 dB(A) audível 50 dB(A) ruidosamente alto |
||
min: | ||
(-) A temperatura máxima no lado superior é 53 °C / 127 F, em comparação com a média de 40.4 °C / 105 F , variando de 21.2 a 68.8 °C para a classe Gaming.
(-) A parte inferior aquece até um máximo de 57.6 °C / 136 F, em comparação com a média de 43.2 °C / 110 F
(+) Em uso inativo, a temperatura média para o lado superior é 25.4 °C / 78 F, em comparação com a média do dispositivo de 33.9 °C / ### class_avg_f### F.
(-) Jogando The Witcher 3, a temperatura média para o lado superior é 44.2 °C / 112 F, em comparação com a média do dispositivo de 33.9 °C / ## #class_avg_f### F.
(±) Os apoios para as mãos e o touchpad podem ficar muito quentes ao toque, com um máximo de 37.2 °C / 99 F.
(-) A temperatura média da área do apoio para as mãos de dispositivos semelhantes foi 28.8 °C / 83.8 F (-8.4 °C / -15.2 F).
| desligado | |
| Ocioso | |
| Carga |
|
Key:
min: | |
| Dell G5 15 SE 5505 P89F R7 4800H, Radeon RX 5600M, Samsung PM991 MZ9LQ512HALU, WVA, 1920x1080, 15.6" | Dell G5 15 5590-P8RVW i7-9750H, GeForce RTX 2070 Max-Q, SK Hynix BC501 HFM512GDJTNG, IPS, 1920x1080, 15.6" | Asus TUF Gaming A15 FA506IV-HN172 R7 4800H, GeForce RTX 2060 Mobile, Kingston OM8PCP3512F-AB, IPS, 1920x1080, 15.6" | HP Omen 15-dc1020ng i5-9300H, GeForce GTX 1650 Mobile, WDC PC SN720 SDAQNTW-512G, IPS, 1920x1080, 15.6" | MSI Alpha 15 A3DDK-034 R7 3750H, Radeon RX 5500M, Kingston RBUSNS8154P3512GJ, IPS, 1920x1080, 15.6" | Schenker XMG Core 15 GK5CP6V i7-9750H, GeForce GTX 1660 Ti Mobile, Samsung SSD 970 EVO Plus 500GB, IPS, 1920x1080, 15.6" | |
|---|---|---|---|---|---|---|
| Power Consumption | -24% | -1% | 22% | -57% | -16% | |
| Idle Minimum * (Watt) | 6.5 | 5 23% | 5.4 17% | 4.04 38% | 14 -115% | 9 -38% |
| Idle Average * (Watt) | 10.6 | 13 -23% | 10 6% | 7.2 32% | 18 -70% | 12 -13% |
| Idle Maximum * (Watt) | 11 | 23 -109% | 10.5 5% | 11.4 -4% | 32 -191% | 18 -64% |
| Load Average * (Watt) | 84.1 | 121 -44% | 135 -61% | 80.8 4% | 64 24% | 86 -2% |
| Witcher 3 ultra * (Watt) | 152.9 | 133 13% | 144 6% | 93.6 39% | 123 20% | 126 18% |
| Load Maximum * (Watt) | 180.4 | 184 -2% | 147 19% | 144.5 20% | 193 -7% | 173 4% |
* ... menor é melhor
| Dell G5 15 SE 5505 P89F R7 4800H, Radeon RX 5600M, 51 Wh | Dell G5 15 5590-P8RVW i7-9750H, GeForce RTX 2070 Max-Q, 90 Wh | Asus TUF Gaming A15 FA506IV-HN172 R7 4800H, GeForce RTX 2060 Mobile, 48 Wh | HP Omen 15-dc1020ng i5-9300H, GeForce GTX 1650 Mobile, 52.5 Wh | MSI Alpha 15 A3DDK-034 R7 3750H, Radeon RX 5500M, 51 Wh | Lenovo Legion Y740-15ICHg i7-9750H, GeForce RTX 2070 Max-Q, 57 Wh | |
|---|---|---|---|---|---|---|
| Duração da bateria | -8% | 5% | 8% | -43% | -52% | |
| Reader / Idle (h) | 11.2 | 8.6 -23% | 9.8 -12% | 15.9 42% | 5.8 -48% | |
| WiFi v1.3 (h) | 6.2 | 5.7 -8% | 6.2 0% | 6.4 3% | 4.1 -34% | 3 -52% |
| Load (h) | 1.5 | 1.6 7% | 1.9 27% | 1.2 -20% | 0.8 -47% | |
| Witcher 3 ultra (h) | 1 |
Pro
Contra

Um portátil para jogos de 15,6 polegadas com CPU Core i7-9750H e GPU GeForce RTX 2060 normalmente custará cerca de $1.200 USD. O all-AMD Dell G5 15 SE pode ser configurado com a CPU Ryzen 5 4600H e GPU Radeon RX 5600M para resultados muito semelhantes por cerca de $300 a menos. O desempenho por dólar é, portanto, a maior vantagem do sistema em um mercado ainda dominado pelas opções Intel-Nvidia.
Há desvantagens notáveis a ter em mente, sendo a temperatura e o ruído dos ventiladores os mais marcantes. Processadores quentes são esperados de portáteis para jogos, mas quando se chega a ~95 °C quando se joga com os ventiladores em pleno funcionamento, isto não deixa primeiras impressões muito fortes, especialmente no que diz respeito à longevidade do sistema.
Outros inconvenientes estão relacionados principalmente ao ponto de preço barato. O notável bleeding da luz de fundo, portas USB 2.0, falta de adaptative sync e chassis totalmente de plástico são os compromissos usuais na maioria dos portáteis de ~$1.000 para jogos. No entanto, do ponto de vista de desempenho, capacidade de manutenção e tela, estas características poderiam facilmente fazer parte de portáteis que se vendem por centenas de dólares a mais.
É muito poder por não muito dinheiro. Os usuários vão querer ter em mente que o desempenho impressionante vem ao custo tanto de temperaturas muito quentes quanto de ventiladores barulhentos como resultado.
Dell G5 15 SE 5505 P89F
- 06/24/2020 v7 (old)
Allen Ngo
Price comparison
