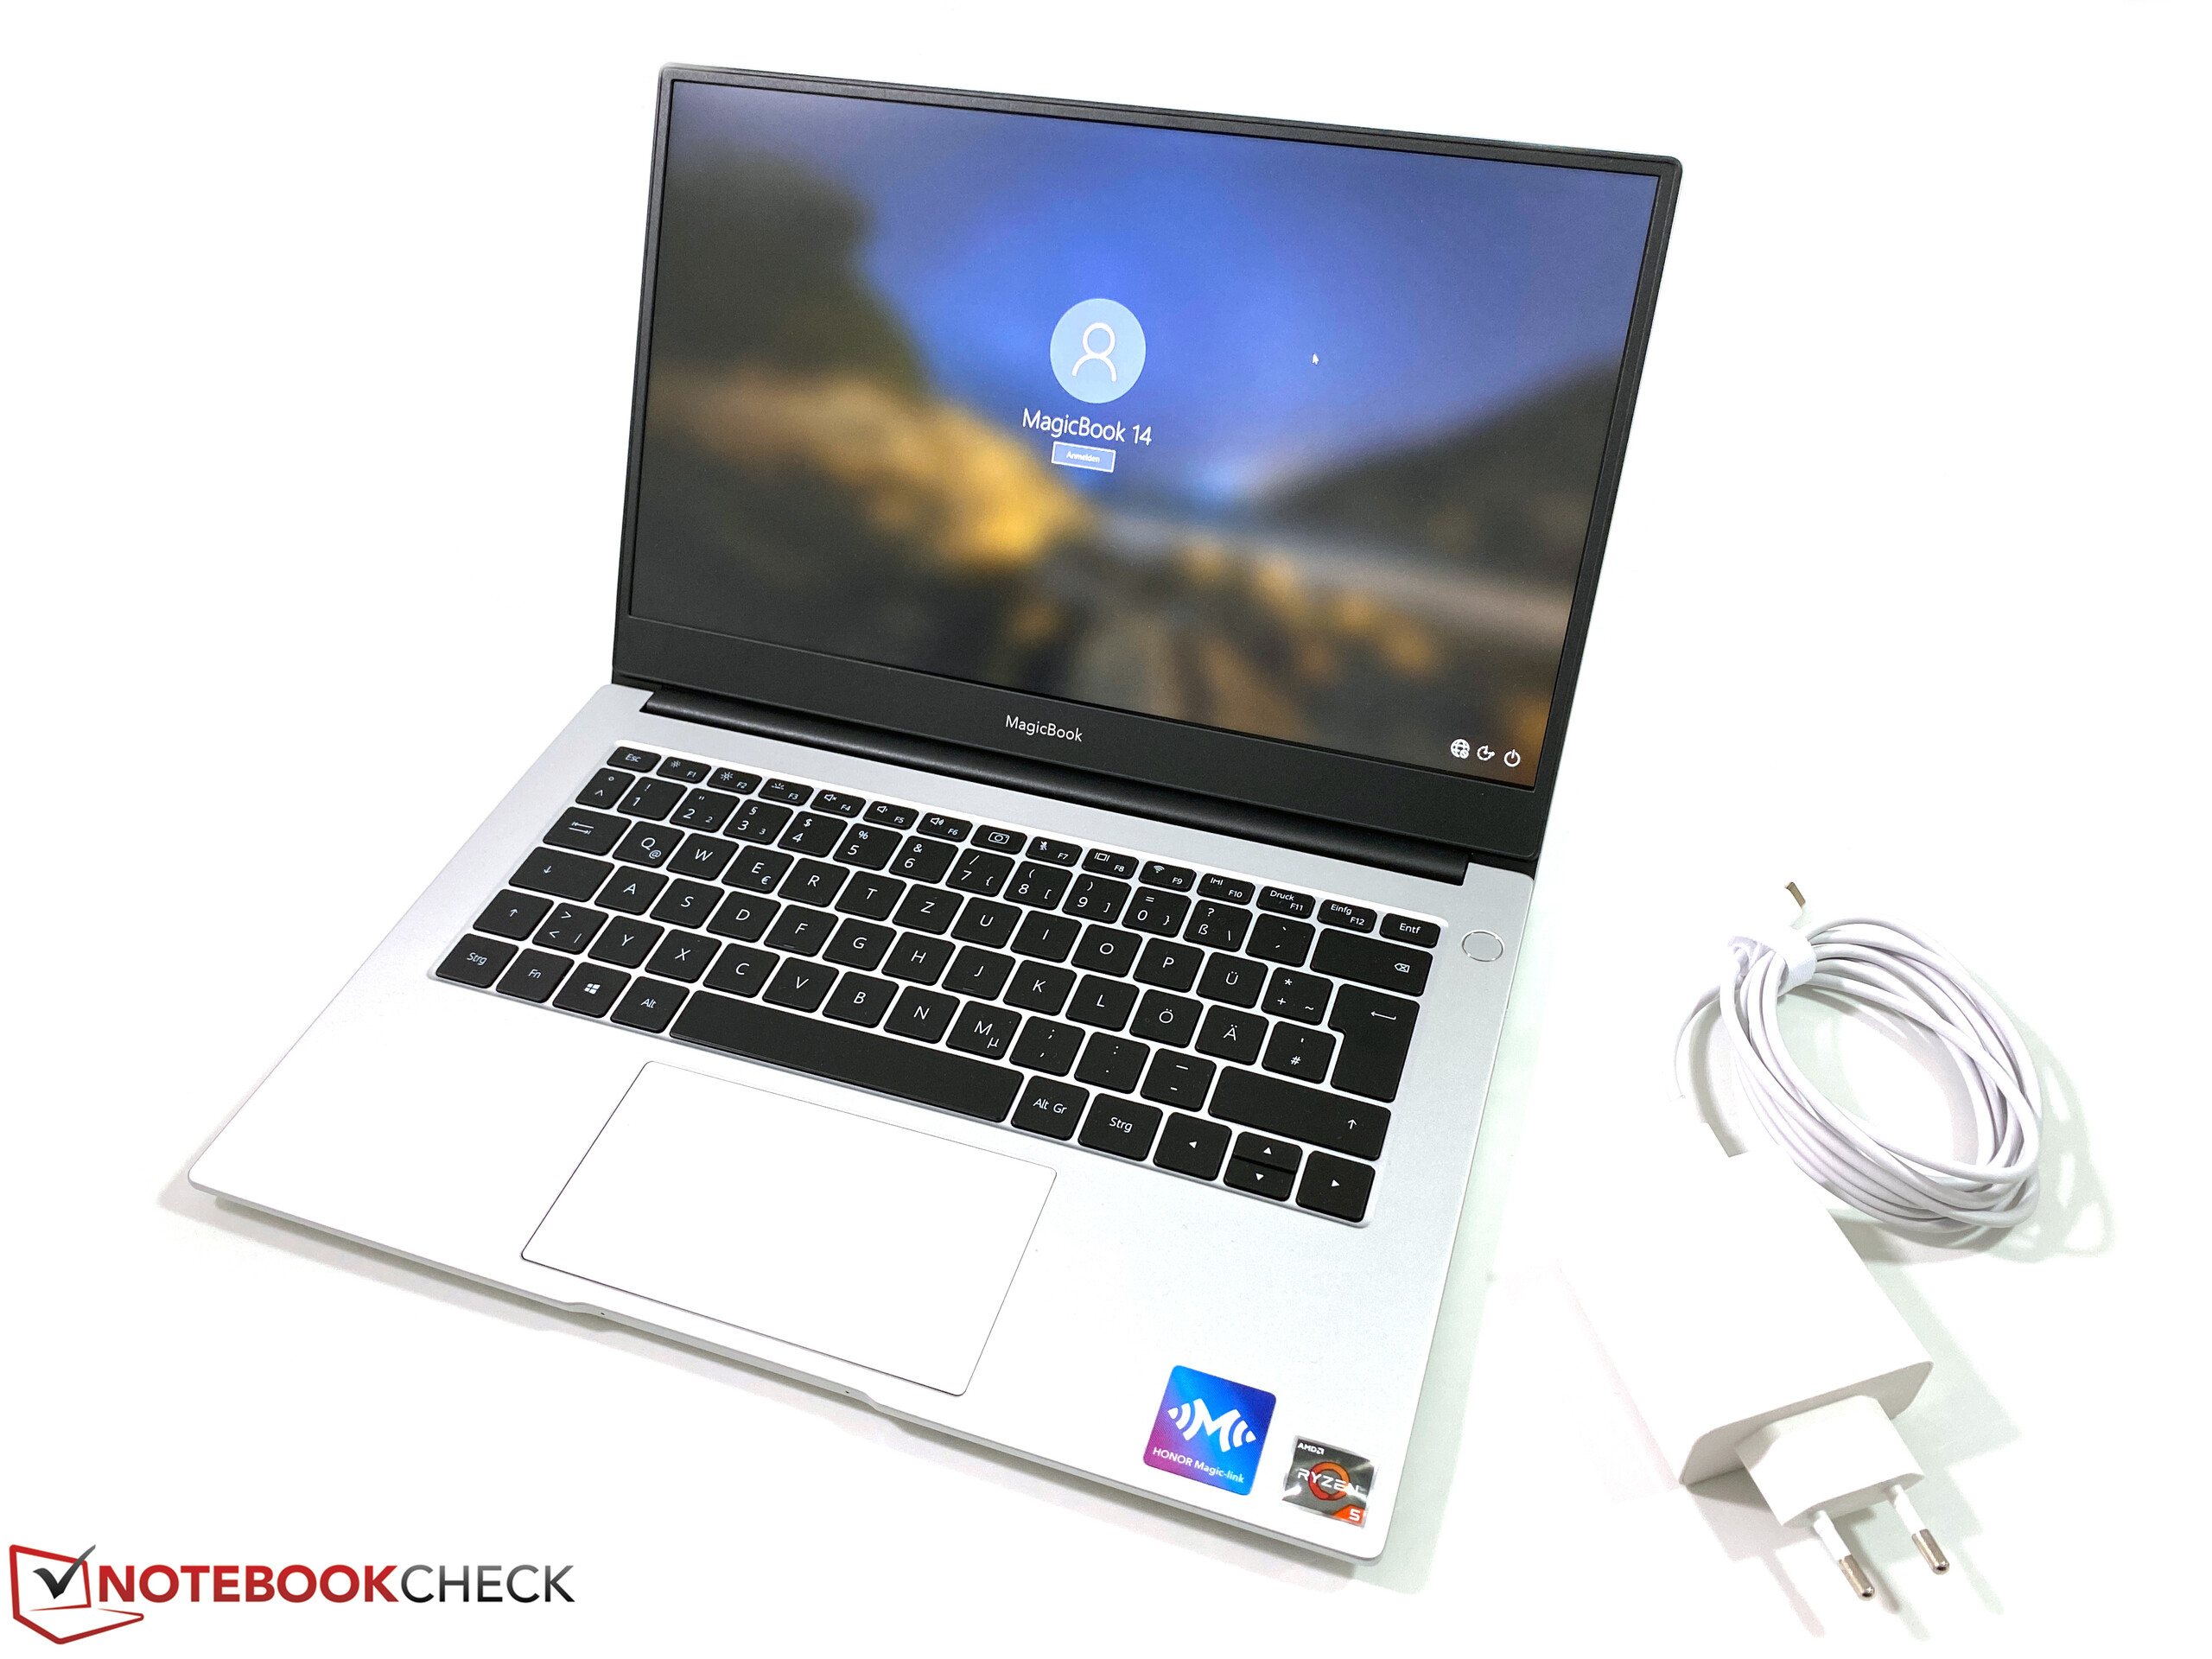
Breve Análise do Portátil Honor Magicbook 14: Uma versão melhor do MateBook D 14?
Avaliação | Data | Modelo | Peso | Altura | Size | Resolução | Preço |
|---|---|---|---|---|---|---|---|
| 86.5 % v7 (old) | 05/2020 | Honor Magicbook 14 R5 3500U, Vega 8 | 1.4 kg | 16 mm | 14.00" | 1920x1080 | |
| 87.3 % v7 (old) | 03/2020 | Huawei MateBook D 14-53010TVS R5 3500U, Vega 8 | 1.4 kg | 16 mm | 14.00" | 1920x1080 | |
| 81.2 % v7 (old) | 02/2020 | Asus ZenBook 14 UM431DA-AM020T R7 3700U, Vega 10 | 1.4 kg | 16 mm | 14.00" | 1920x1080 | |
| 82 % v7 (old) | 12/2019 | Lenovo ThinkBook 14-IML-20RV006TGE i5-10210U, UHD Graphics 620 | 1.6 kg | 17.9 mm | 14.00" | 1920x1080 | |
| 74.5 % v7 (old) | 01/2020 | Dell Inspiron 14 3493-4KWCF i7-1065G7, GeForce MX230 | 1.8 kg | 21 mm | 14.00" | 1920x1080 |


| |||||||||||||||||||||||||
iluminação: 92 %
iluminação com acumulador: 308 cd/m²
Contraste: 1728:1 (Preto: 0.18 cd/m²)
ΔE ColorChecker Calman: 5.3 | ∀{0.5-29.43 Ø4.71}
calibrated: 4.2
ΔE Greyscale Calman: 3.5 | ∀{0.09-98 Ø4.96}
65.8% sRGB (Argyll 1.6.3 3D)
42.5% AdobeRGB 1998 (Argyll 1.6.3 3D)
46.42% AdobeRGB 1998 (Argyll 3D)
66.2% sRGB (Argyll 3D)
44.93% Display P3 (Argyll 3D)
Gamma: 2.1
CCT: 7078 K
| Honor Magicbook 14 BOE CQ TV140FHM-NH1, IPS, 1920x1080, 14" | Huawei MateBook D 14-53010TVS Chi Mei CMN1404, IPS, 1920x1080, 14" | Asus ZenBook 14 UM431DA-AM020T CEC PA LM140LF-3L03, IPS, 1920x1080, 14" | Lenovo ThinkBook 14-IML-20RV006TGE Chi Mei, CMN14D4, N140HCA-EAC, IPS, 1920x1080, 14" | Dell Inspiron 14 3493-4KWCF Chi Mei 140HCA, IPS, 1920x1080, 14" | |
|---|---|---|---|---|---|
| Display | 4% | 44% | -4% | -7% | |
| Display P3 Coverage (%) | 44.93 | 46.54 4% | 66.7 48% | 42.93 -4% | 41.84 -7% |
| sRGB Coverage (%) | 66.2 | 69.8 5% | 92.3 39% | 64 -3% | 62.3 -6% |
| AdobeRGB 1998 Coverage (%) | 46.42 | 48.1 4% | 67.5 45% | 44.43 -4% | 43.33 -7% |
| Response Times | 12% | 22% | 14% | 9% | |
| Response Time Grey 50% / Grey 80% * (ms) | 44.8 ? | 41.2 ? 8% | 36 ? 20% | 40.8 ? 9% | 41 ? 8% |
| Response Time Black / White * (ms) | 34 ? | 28.8 ? 15% | 26 ? 24% | 28 ? 18% | 31 ? 9% |
| PWM Frequency (Hz) | 5952 ? | 25000 ? | 44 ? | 25000 ? | 2500 ? |
| Screen | -5% | -11% | -63% | -9% | |
| Brightness middle (cd/m²) | 311 | 250 -20% | 253 -19% | 256 -18% | 226 -27% |
| Brightness (cd/m²) | 296 | 241 -19% | 245 -17% | 232 -22% | 214 -28% |
| Brightness Distribution (%) | 92 | 94 2% | 78 -15% | 86 -7% | 92 0% |
| Black Level * (cd/m²) | 0.18 | 0.22 -22% | 0.225 -25% | 0.96 -433% | 0.17 6% |
| Contrast (:1) | 1728 | 1136 -34% | 1124 -35% | 267 -85% | 1329 -23% |
| Colorchecker dE 2000 * | 5.3 | 4.4 17% | 8.89 -68% | 6.5 -23% | 5.21 2% |
| Colorchecker dE 2000 max. * | 18.5 | 19.7 -6% | 4.56 75% | 21.5 -16% | 22.15 -20% |
| Colorchecker dE 2000 calibrated * | 4.2 | 4.2 -0% | 4.9 -17% | 4.8 -14% | 4.43 -5% |
| Greyscale dE 2000 * | 3.5 | 2.9 17% | 6.33 -81% | 5.7 -63% | 3.27 7% |
| Gamma | 2.1 105% | 2.3 96% | 2.52 87% | 1.9 116% | 2.36 93% |
| CCT | 7078 92% | 7045 92% | 6745 96% | 6282 103% | 6538 99% |
| Color Space (Percent of AdobeRGB 1998) (%) | 42.5 | 44.3 4% | 60 41% | 40.9 -4% | 40 -6% |
| Color Space (Percent of sRGB) (%) | 65.8 | 69.6 6% | 91 38% | 63.7 -3% | 62 -6% |
| Média Total (Programa/Configurações) | 4% /
-1% | 18% /
3% | -18% /
-42% | -2% /
-6% |
* ... menor é melhor
Exibir tempos de resposta
| ↔ Tempo de resposta preto para branco | ||
|---|---|---|
| 34 ms ... ascensão ↗ e queda ↘ combinadas | ↗ 19.2 ms ascensão | 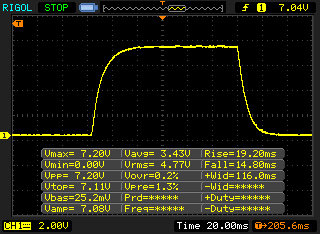 |
| ↘ 14.8 ms queda | ||
| A tela mostra taxas de resposta lentas em nossos testes e será insatisfatória para os jogadores. Em comparação, todos os dispositivos testados variam de 0.1 (mínimo) a 240 (máximo) ms. » 91 % de todos os dispositivos são melhores. Isso significa que o tempo de resposta medido é pior que a média de todos os dispositivos testados (19.8 ms). | ||
| ↔ Tempo de resposta 50% cinza a 80% cinza | ||
| 44.8 ms ... ascensão ↗ e queda ↘ combinadas | ↗ 24.4 ms ascensão | 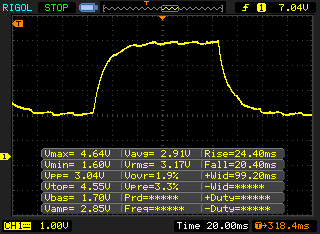 |
| ↘ 20.4 ms queda | ||
| A tela mostra taxas de resposta lentas em nossos testes e será insatisfatória para os jogadores. Em comparação, todos os dispositivos testados variam de 0.165 (mínimo) a 636 (máximo) ms. » 76 % de todos os dispositivos são melhores. Isso significa que o tempo de resposta medido é pior que a média de todos os dispositivos testados (31 ms). | ||
Cintilação da tela / PWM (modulação por largura de pulso)
| Tela tremeluzindo/PWM detectado | 5952 Hz | ≤ 99 % configuração de brilho | 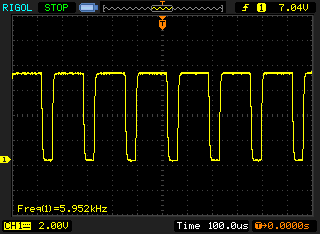 |
A luz de fundo da tela pisca em 5952 Hz (pior caso, por exemplo, utilizando PWM) Cintilação detectada em uma configuração de brilho de 99 % e abaixo. Não deve haver cintilação ou PWM acima desta configuração de brilho. A frequência de 5952 Hz é bastante alta, então a maioria dos usuários sensíveis ao PWM não deve notar nenhuma oscilação. [pwm_comparison] Em comparação: 52 % de todos os dispositivos testados não usam PWM para escurecer a tela. Se PWM foi detectado, uma média de 7754 (mínimo: 5 - máximo: 343500) Hz foi medida. | |||
Cinebench R15: CPU Single 64Bit | CPU Multi 64Bit
Blender: v2.79 BMW27 CPU
7-Zip 18.03: 7z b 4 -mmt1 | 7z b 4
Geekbench 5.5: Single-Core | Multi-Core
HWBOT x265 Benchmark v2.2: 4k Preset
R Benchmark 2.5: Overall mean
| Cinebench R20 / CPU (Single Core) | |
| Média da turma Subnotebook (128 - 832, n=56, últimos 2 anos) | |
| Lenovo ThinkBook 14-IML-20RV006TGE | |
| Dell Inspiron 14 3493-4KWCF | |
| Honor Magicbook 14 | |
| Média AMD Ryzen 5 3500U (317 - 372, n=15) | |
| Huawei MateBook D 14-53010TVS | |
| Huawei MateBook D 14-53010TVS | |
| Cinebench R20 / CPU (Multi Core) | |
| Média da turma Subnotebook (579 - 8541, n=56, últimos 2 anos) | |
| Lenovo ThinkBook 14-IML-20RV006TGE | |
| Huawei MateBook D 14-53010TVS | |
| Huawei MateBook D 14-53010TVS | |
| Honor Magicbook 14 | |
| Dell Inspiron 14 3493-4KWCF | |
| Média AMD Ryzen 5 3500U (1063 - 1540, n=15) | |
| Cinebench R15 / CPU Single 64Bit | |
| Média da turma Subnotebook (72.4 - 322, n=56, últimos 2 anos) | |
| Dell Inspiron 14 3493-4KWCF | |
| Lenovo ThinkBook 14-IML-20RV006TGE | |
| Honor Magicbook 14 | |
| Huawei MateBook D 14-53010TVS | |
| Média AMD Ryzen 5 3500U (131 - 147, n=18) | |
| Asus ZenBook 14 UM431DA-AM020T | |
| Cinebench R15 / CPU Multi 64Bit | |
| Média da turma Subnotebook (327 - 3345, n=56, últimos 2 anos) | |
| Lenovo ThinkBook 14-IML-20RV006TGE | |
| Huawei MateBook D 14-53010TVS | |
| Honor Magicbook 14 | |
| Dell Inspiron 14 3493-4KWCF | |
| Asus ZenBook 14 UM431DA-AM020T | |
| Média AMD Ryzen 5 3500U (482 - 682, n=19) | |
| Blender / v2.79 BMW27 CPU | |
| Média AMD Ryzen 5 3500U (680 - 796, n=10) | |
| Honor Magicbook 14 | |
| Huawei MateBook D 14-53010TVS | |
| Huawei MateBook D 14-53010TVS | |
| Lenovo ThinkBook 14-IML-20RV006TGE | |
| Média da turma Subnotebook (159 - 2271, n=57, últimos 2 anos) | |
| 7-Zip 18.03 / 7z b 4 -mmt1 | |
| Média da turma Subnotebook (2643 - 6699, n=58, últimos 2 anos) | |
| Lenovo ThinkBook 14-IML-20RV006TGE | |
| Honor Magicbook 14 | |
| Huawei MateBook D 14-53010TVS | |
| Huawei MateBook D 14-53010TVS | |
| Média AMD Ryzen 5 3500U (3502 - 3580, n=10) | |
| 7-Zip 18.03 / 7z b 4 | |
| Média da turma Subnotebook (11668 - 77867, n=56, últimos 2 anos) | |
| Lenovo ThinkBook 14-IML-20RV006TGE | |
| Honor Magicbook 14 | |
| Huawei MateBook D 14-53010TVS | |
| Huawei MateBook D 14-53010TVS | |
| Média AMD Ryzen 5 3500U (15825 - 17508, n=10) | |
| Geekbench 5.5 / Single-Core | |
| Média da turma Subnotebook (726 - 2224, n=48, últimos 2 anos) | |
| Lenovo ThinkBook 14-IML-20RV006TGE | |
| Honor Magicbook 14 | |
| Huawei MateBook D 14-53010TVS | |
| Huawei MateBook D 14-53010TVS | |
| Média AMD Ryzen 5 3500U (777 - 909, n=9) | |
| Geekbench 5.5 / Multi-Core | |
| Média da turma Subnotebook (2557 - 17218, n=48, últimos 2 anos) | |
| Lenovo ThinkBook 14-IML-20RV006TGE | |
| Huawei MateBook D 14-53010TVS | |
| Huawei MateBook D 14-53010TVS | |
| Honor Magicbook 14 | |
| Média AMD Ryzen 5 3500U (2543 - 3269, n=9) | |
| HWBOT x265 Benchmark v2.2 / 4k Preset | |
| Média da turma Subnotebook (0.97 - 25.1, n=56, últimos 2 anos) | |
| Lenovo ThinkBook 14-IML-20RV006TGE | |
| Huawei MateBook D 14-53010TVS | |
| Huawei MateBook D 14-53010TVS | |
| Honor Magicbook 14 | |
| Média AMD Ryzen 5 3500U (3.35 - 4.15, n=10) | |
| R Benchmark 2.5 / Overall mean | |
| Média AMD Ryzen 5 3500U (0.734 - 0.804, n=8) | |
| Huawei MateBook D 14-53010TVS | |
| Huawei MateBook D 14-53010TVS | |
| Honor Magicbook 14 | |
| Lenovo ThinkBook 14-IML-20RV006TGE | |
| Lenovo ThinkBook 14-IML-20RV006TGE | |
| Média da turma Subnotebook (0.4024 - 1.456, n=57, últimos 2 anos) | |
* ... menor é melhor
| PCMark 8 Home Score Accelerated v2 | 4235 pontos | |
| PCMark 8 Creative Score Accelerated v2 | 5141 pontos | |
| PCMark 8 Work Score Accelerated v2 | 5039 pontos | |
| PCMark 10 Score | 3862 pontos | |
Ajuda | ||
| DPC Latencies / LatencyMon - interrupt to process latency (max), Web, Youtube, Prime95 | |
| Honor Magicbook 14 | |
* ... menor é melhor
| Honor Magicbook 14 Samsung SSD PM981a MZVLB256HBHQ | Huawei MateBook D 14-53010TVS WDC PC SN730 SDBPNTY-512G | Asus ZenBook 14 UM431DA-AM020T SK hynix BC501 HFM512GDHTNG-8310A | Lenovo ThinkBook 14-IML-20RV006TGE Samsung SSD PM981a MZVLB256HBHQ | Dell Inspiron 14 3493-4KWCF Toshiba KBG40ZNS512G NVMe | Média Samsung SSD PM981a MZVLB256HBHQ | |
|---|---|---|---|---|---|---|
| CrystalDiskMark 5.2 / 6 | 0% | -34% | 8% | 1% | 3% | |
| Write 4K (MB/s) | 137.7 | 145.4 6% | 118.8 -14% | 169.7 23% | 159.6 16% | 135.2 ? -2% |
| Read 4K (MB/s) | 42.49 | 46.25 9% | 41.62 -2% | 47.6 12% | 53.5 26% | 44.6 ? 5% |
| Write Seq (MB/s) | 2341 | 2583 10% | 796 -66% | 1761 -25% | 1174 -50% | 2091 ? -11% |
| Read Seq (MB/s) | 2436 | 2141 -12% | 1101 -55% | 1630 -33% | 1648 -32% | 2097 ? -14% |
| Write 4K Q32T1 (MB/s) | 261 | 239.5 -8% | 234.7 -10% | 390.5 50% | 420.8 61% | 370 ? 42% |
| Read 4K Q32T1 (MB/s) | 335.4 | 340 1% | 313.8 -6% | 464.9 39% | 564 68% | 372 ? 11% |
| Write Seq Q32T1 (MB/s) | 2343 | 2701 15% | 842 -64% | 2347 0% | 1231 -47% | 2308 ? -1% |
| Read Seq Q32T1 (MB/s) | 3569 | 2871 -20% | 1645 -54% | 3505 -2% | 2274 -36% | 3395 ? -5% |
| AS SSD | 45% | -4% | 56% | -58% | 12% | |
| Seq Read (MB/s) | 2591 | 2263 -13% | 1417 -45% | 2501 -3% | 2074 -20% | 2276 ? -12% |
| Seq Write (MB/s) | 2133 | 2255 6% | 781 -63% | 2051 -4% | 775 -64% | 1486 ? -30% |
| 4K Read (MB/s) | 50 | 40.36 -19% | 37.03 -26% | 60.3 21% | 37.81 -24% | 49.6 ? -1% |
| 4K Write (MB/s) | 95.7 | 116.9 22% | 80.1 -16% | 131.5 37% | 101.3 6% | 129.5 ? 35% |
| 4K-64 Read (MB/s) | 607 | 1282 111% | 740 22% | 873 44% | 1265 108% | 683 ? 13% |
| 4K-64 Write (MB/s) | 482.6 | 1224 154% | 748 55% | 1565 224% | 383.5 -21% | 895 ? 85% |
| Access Time Read * (ms) | 0.075 | 0.074 1% | 0.047 37% | 0.046 39% | 0.081 -8% | 0.06433 ? 14% |
| Access Time Write * (ms) | 0.034 | 0.039 -15% | 0.045 -32% | 0.027 21% | 0.263 -674% | 0.04793 ? -41% |
| Score Read (Points) | 916 | 1549 69% | 918 0% | 1184 29% | 1510 65% | 960 ? 5% |
| Score Write (Points) | 792 | 1566 98% | 906 14% | 1902 140% | 562 -29% | 1173 ? 48% |
| Score Total (Points) | 2168 | 3909 80% | 2270 5% | 3685 70% | 2781 28% | 2598 ? 20% |
| Copy ISO MB/s (MB/s) | 1306 | 716 | 1474 ? | |||
| Copy Program MB/s (MB/s) | 365.8 | 335.4 | 426 ? | |||
| Copy Game MB/s (MB/s) | 434.9 | 484.8 | 760 ? | |||
| Média Total (Programa/Configurações) | 23% /
26% | -19% /
-17% | 32% /
36% | -29% /
-33% | 8% /
8% |
* ... menor é melhor

| 3DMark 11 Performance | 4095 pontos | |
| 3DMark Ice Storm Standard Score | 66654 pontos | |
| 3DMark Fire Strike Score | 2419 pontos | |
| 3DMark Time Spy Score | 882 pontos | |
Ajuda | ||
| baixo | média | alto | ultra | |
|---|---|---|---|---|
| The Witcher 3 (2015) | 47.4 | 16.4 | ||
| Dota 2 Reborn (2015) | 72 | 65.4 | 39.8 | 37.3 |
| X-Plane 11.11 (2018) | 28.1 | 20.6 | 18.1 | |
| Far Cry 5 (2018) | 31 | 14 | ||
| F1 2019 (2019) | 54 | 23 | 20 | 16 |
Barulho
| Ocioso |
| 29.6 / 29.6 / 29.6 dB |
| Carga |
| 30.8 / 35.3 dB |
 | ||
30 dB silencioso 40 dB(A) audível 50 dB(A) ruidosamente alto |
||
min: | ||
| Honor Magicbook 14 Vega 8, R5 3500U, Samsung SSD PM981a MZVLB256HBHQ | Huawei MateBook D 14-53010TVS Vega 8, R5 3500U, WDC PC SN730 SDBPNTY-512G | Asus ZenBook 14 UM431DA-AM020T Vega 10, R7 3700U, SK hynix BC501 HFM512GDHTNG-8310A | Lenovo ThinkBook 14-IML-20RV006TGE UHD Graphics 620, i5-10210U, Samsung SSD PM981a MZVLB256HBHQ | Dell Inspiron 14 3493-4KWCF GeForce MX230, i7-1065G7, Toshiba KBG40ZNS512G NVMe | |
|---|---|---|---|---|---|
| Noise | 1% | -3% | 3% | -12% | |
| desligado / ambiente * (dB) | 29.6 | 29.6 -0% | 29.8 -1% | 29.2 1% | 30.3 -2% |
| Idle Minimum * (dB) | 29.6 | 29.6 -0% | 28 5% | 29.2 1% | 30.3 -2% |
| Idle Average * (dB) | 29.6 | 29.6 -0% | 28 5% | 29.2 1% | 30.3 -2% |
| Idle Maximum * (dB) | 29.6 | 29.6 -0% | 28 5% | 29.6 -0% | 30.3 -2% |
| Load Average * (dB) | 30.8 | 30.7 -0% | 36.8 -19% | 30.2 2% | 42.9 -39% |
| Load Maximum * (dB) | 35.3 | 33.3 6% | 39 -10% | 31.8 10% | 43.3 -23% |
* ... menor é melhor
(±) A temperatura máxima no lado superior é 40.2 °C / 104 F, em comparação com a média de 35.9 °C / 97 F , variando de 21.4 a 59 °C para a classe Subnotebook.
(±) A parte inferior aquece até um máximo de 43.8 °C / 111 F, em comparação com a média de 39.2 °C / 103 F
(+) Em uso inativo, a temperatura média para o lado superior é 24.1 °C / 75 F, em comparação com a média do dispositivo de 30.8 °C / ### class_avg_f### F.
(+) Os apoios para as mãos e o touchpad são mais frios que a temperatura da pele, com um máximo de 31.6 °C / 88.9 F e, portanto, são frios ao toque.
(-) A temperatura média da área do apoio para as mãos de dispositivos semelhantes foi 28.2 °C / 82.8 F (-3.4 °C / -6.1 F).
Honor Magicbook 14 análise de áudio
(±) | o volume do alto-falante é médio, mas bom (###valor### dB)
Graves 100 - 315Hz
(±) | graves reduzidos - em média 13.5% menor que a mediana
(±) | a linearidade dos graves é média (11.8% delta para a frequência anterior)
Médios 400 - 2.000 Hz
(±) | médios mais altos - em média 6.4% maior que a mediana
(±) | a linearidade dos médios é média (7.6% delta para frequência anterior)
Altos 2 - 16 kHz
(+) | agudos equilibrados - apenas 3.2% longe da mediana
(±) | a linearidade dos máximos é média (8.5% delta para frequência anterior)
Geral 100 - 16.000 Hz
(±) | a linearidade do som geral é média (23.1% diferença em relação à mediana)
Comparado com a mesma classe
» 80% de todos os dispositivos testados nesta classe foram melhores, 3% semelhantes, 17% piores
» O melhor teve um delta de 5%, a média foi 18%, o pior foi 53%
Comparado com todos os dispositivos testados
» 69% de todos os dispositivos testados foram melhores, 5% semelhantes, 26% piores
» O melhor teve um delta de 4%, a média foi 23%, o pior foi 134%
Asus ZenBook 14 UM431DA-AM020T análise de áudio
(-) | alto-falantes não muito altos (###valor### dB)
Graves 100 - 315Hz
(±) | graves reduzidos - em média 11% menor que a mediana
(±) | a linearidade dos graves é média (14% delta para a frequência anterior)
Médios 400 - 2.000 Hz
(±) | médios mais altos - em média 6.4% maior que a mediana
(+) | médios são lineares (3.7% delta para frequência anterior)
Altos 2 - 16 kHz
(+) | agudos equilibrados - apenas 3.3% longe da mediana
(+) | os máximos são lineares (6% delta da frequência anterior)
Geral 100 - 16.000 Hz
(±) | a linearidade do som geral é média (18.4% diferença em relação à mediana)
Comparado com a mesma classe
» 54% de todos os dispositivos testados nesta classe foram melhores, 7% semelhantes, 39% piores
» O melhor teve um delta de 5%, a média foi 18%, o pior foi 53%
Comparado com todos os dispositivos testados
» 41% de todos os dispositivos testados foram melhores, 8% semelhantes, 51% piores
» O melhor teve um delta de 4%, a média foi 23%, o pior foi 134%
| desligado | |
| Ocioso | |
| Carga |
|
Key:
min: | |
| Honor Magicbook 14 R5 3500U, Vega 8, Samsung SSD PM981a MZVLB256HBHQ, IPS, 1920x1080, 14" | Huawei MateBook D 14-53010TVS R5 3500U, Vega 8, WDC PC SN730 SDBPNTY-512G, IPS, 1920x1080, 14" | Asus ZenBook 14 UM431DA-AM020T R7 3700U, Vega 10, SK hynix BC501 HFM512GDHTNG-8310A, IPS, 1920x1080, 14" | Lenovo ThinkBook 14-IML-20RV006TGE i5-10210U, UHD Graphics 620, Samsung SSD PM981a MZVLB256HBHQ, IPS, 1920x1080, 14" | Dell Inspiron 14 3493-4KWCF i7-1065G7, GeForce MX230, Toshiba KBG40ZNS512G NVMe, IPS, 1920x1080, 14" | Média AMD Radeon RX Vega 8 (Ryzen 2000/3000) | Média da turma Subnotebook | |
|---|---|---|---|---|---|---|---|
| Power Consumption | 3% | 7% | 22% | -1% | -4% | 4% | |
| Idle Minimum * (Watt) | 5.2 | 5.2 -0% | 3.6 31% | 2.94 43% | 4.7 10% | 5.68 ? -9% | 3.73 ? 28% |
| Idle Average * (Watt) | 7.7 | 7.7 -0% | 7.2 6% | 5.2 32% | 6.6 14% | 8.75 ? -14% | 6.51 ? 15% |
| Idle Maximum * (Watt) | 9.3 | 8.7 6% | 10.8 -16% | 5.96 36% | 5.9 37% | 10.1 ? -9% | 7.88 ? 15% |
| Load Average * (Watt) | 40.3 | 35.4 12% | 38 6% | 28.2 30% | 56 -39% | 37.8 ? 6% | 42.3 ? -5% |
| Load Maximum * (Watt) | 48 | 48.3 -1% | 45.2 6% | 62.2 -30% | 60.2 -25% | 46.2 ? 4% | 64.8 ? -35% |
* ... menor é melhor
| Honor Magicbook 14 R5 3500U, Vega 8, 56 Wh | Huawei MateBook D 14-53010TVS R5 3500U, Vega 8, 56 Wh | Asus ZenBook 14 UM431DA-AM020T R7 3700U, Vega 10, 47 Wh | Lenovo ThinkBook 14-IML-20RV006TGE i5-10210U, UHD Graphics 620, 45 Wh | Dell Inspiron 14 3493-4KWCF i7-1065G7, GeForce MX230, 42 Wh | Média da turma Subnotebook | |
|---|---|---|---|---|---|---|
| Duração da bateria | 22% | -3% | -18% | -20% | 35% | |
| H.264 (h) | 11 | 11.2 2% | 8.7 -21% | 8.6 -22% | 15.3 ? 39% | |
| WiFi v1.3 (h) | 9.5 | 14.4 52% | 6.7 -29% | 8.6 -9% | 6.5 -32% | 14 ? 47% |
| Load (h) | 1.7 | 1.9 12% | 2.1 24% | 1.3 -24% | 1.6 -6% | 1.998 ? 18% |
Pro
Contra
Veredicto – MagicBook 14 é o rei do preço-desempenho
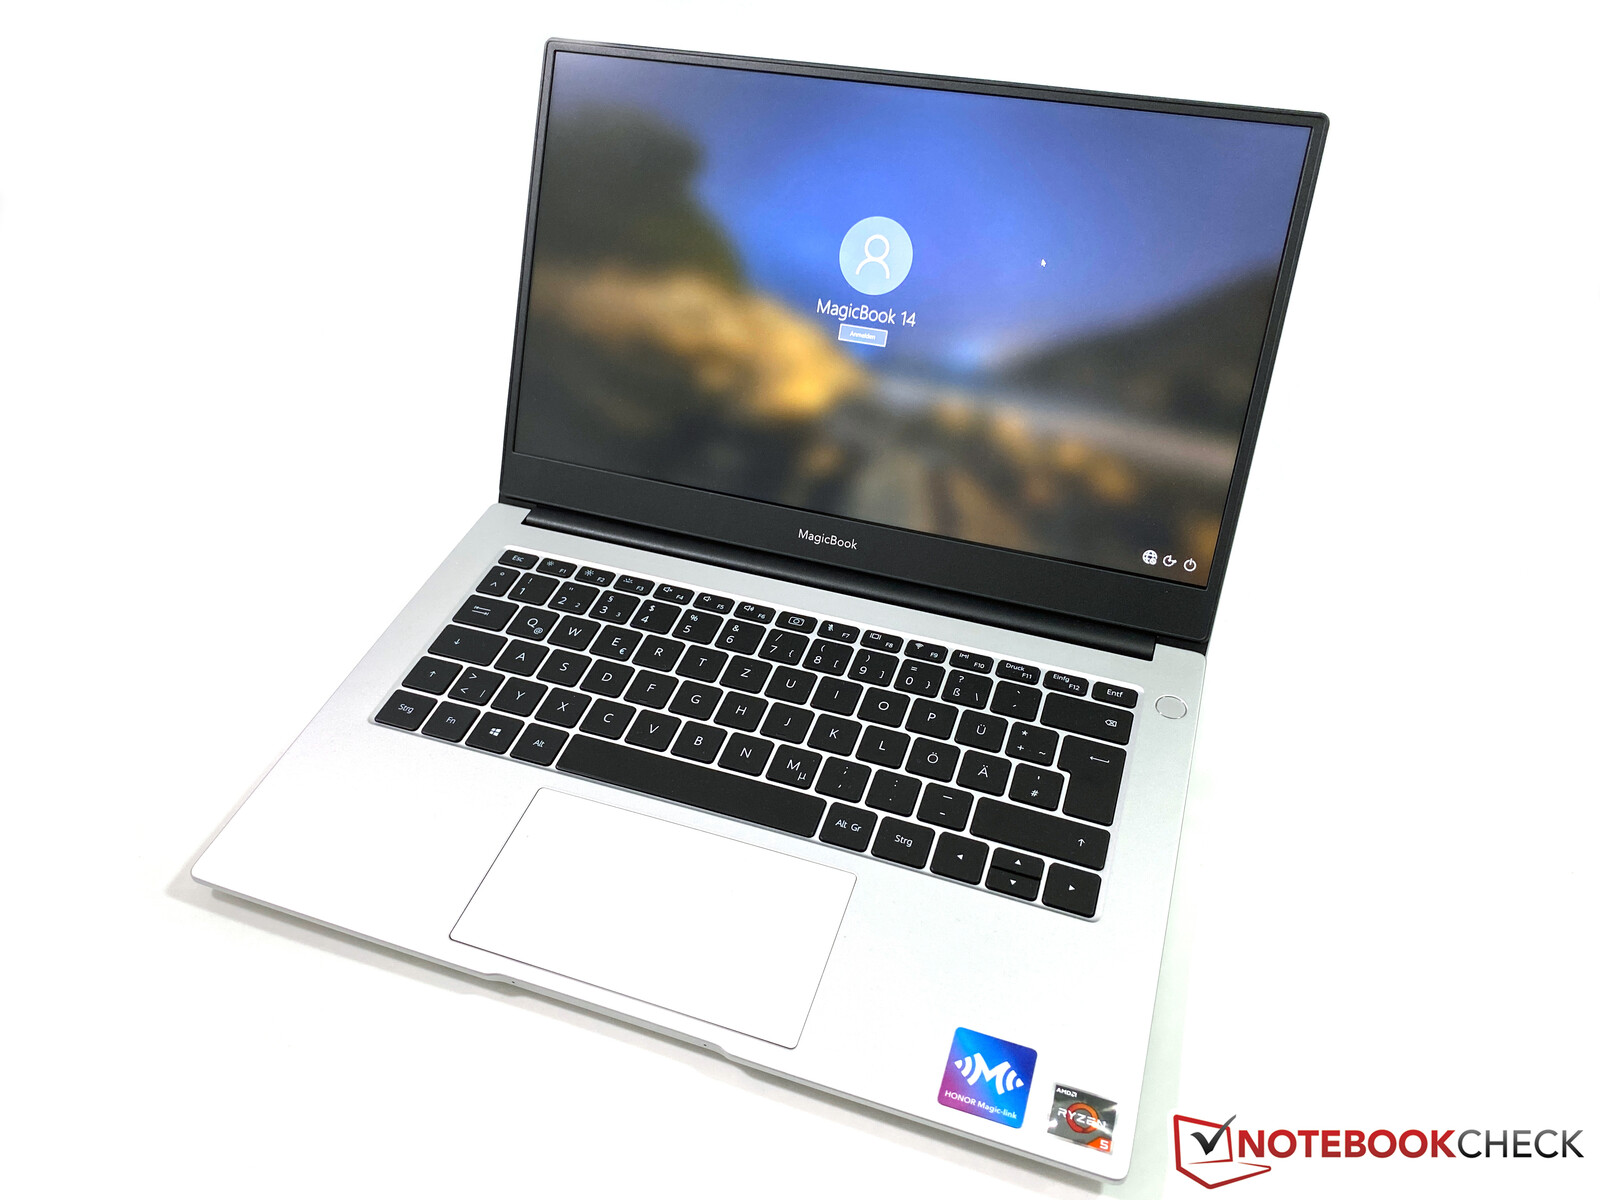
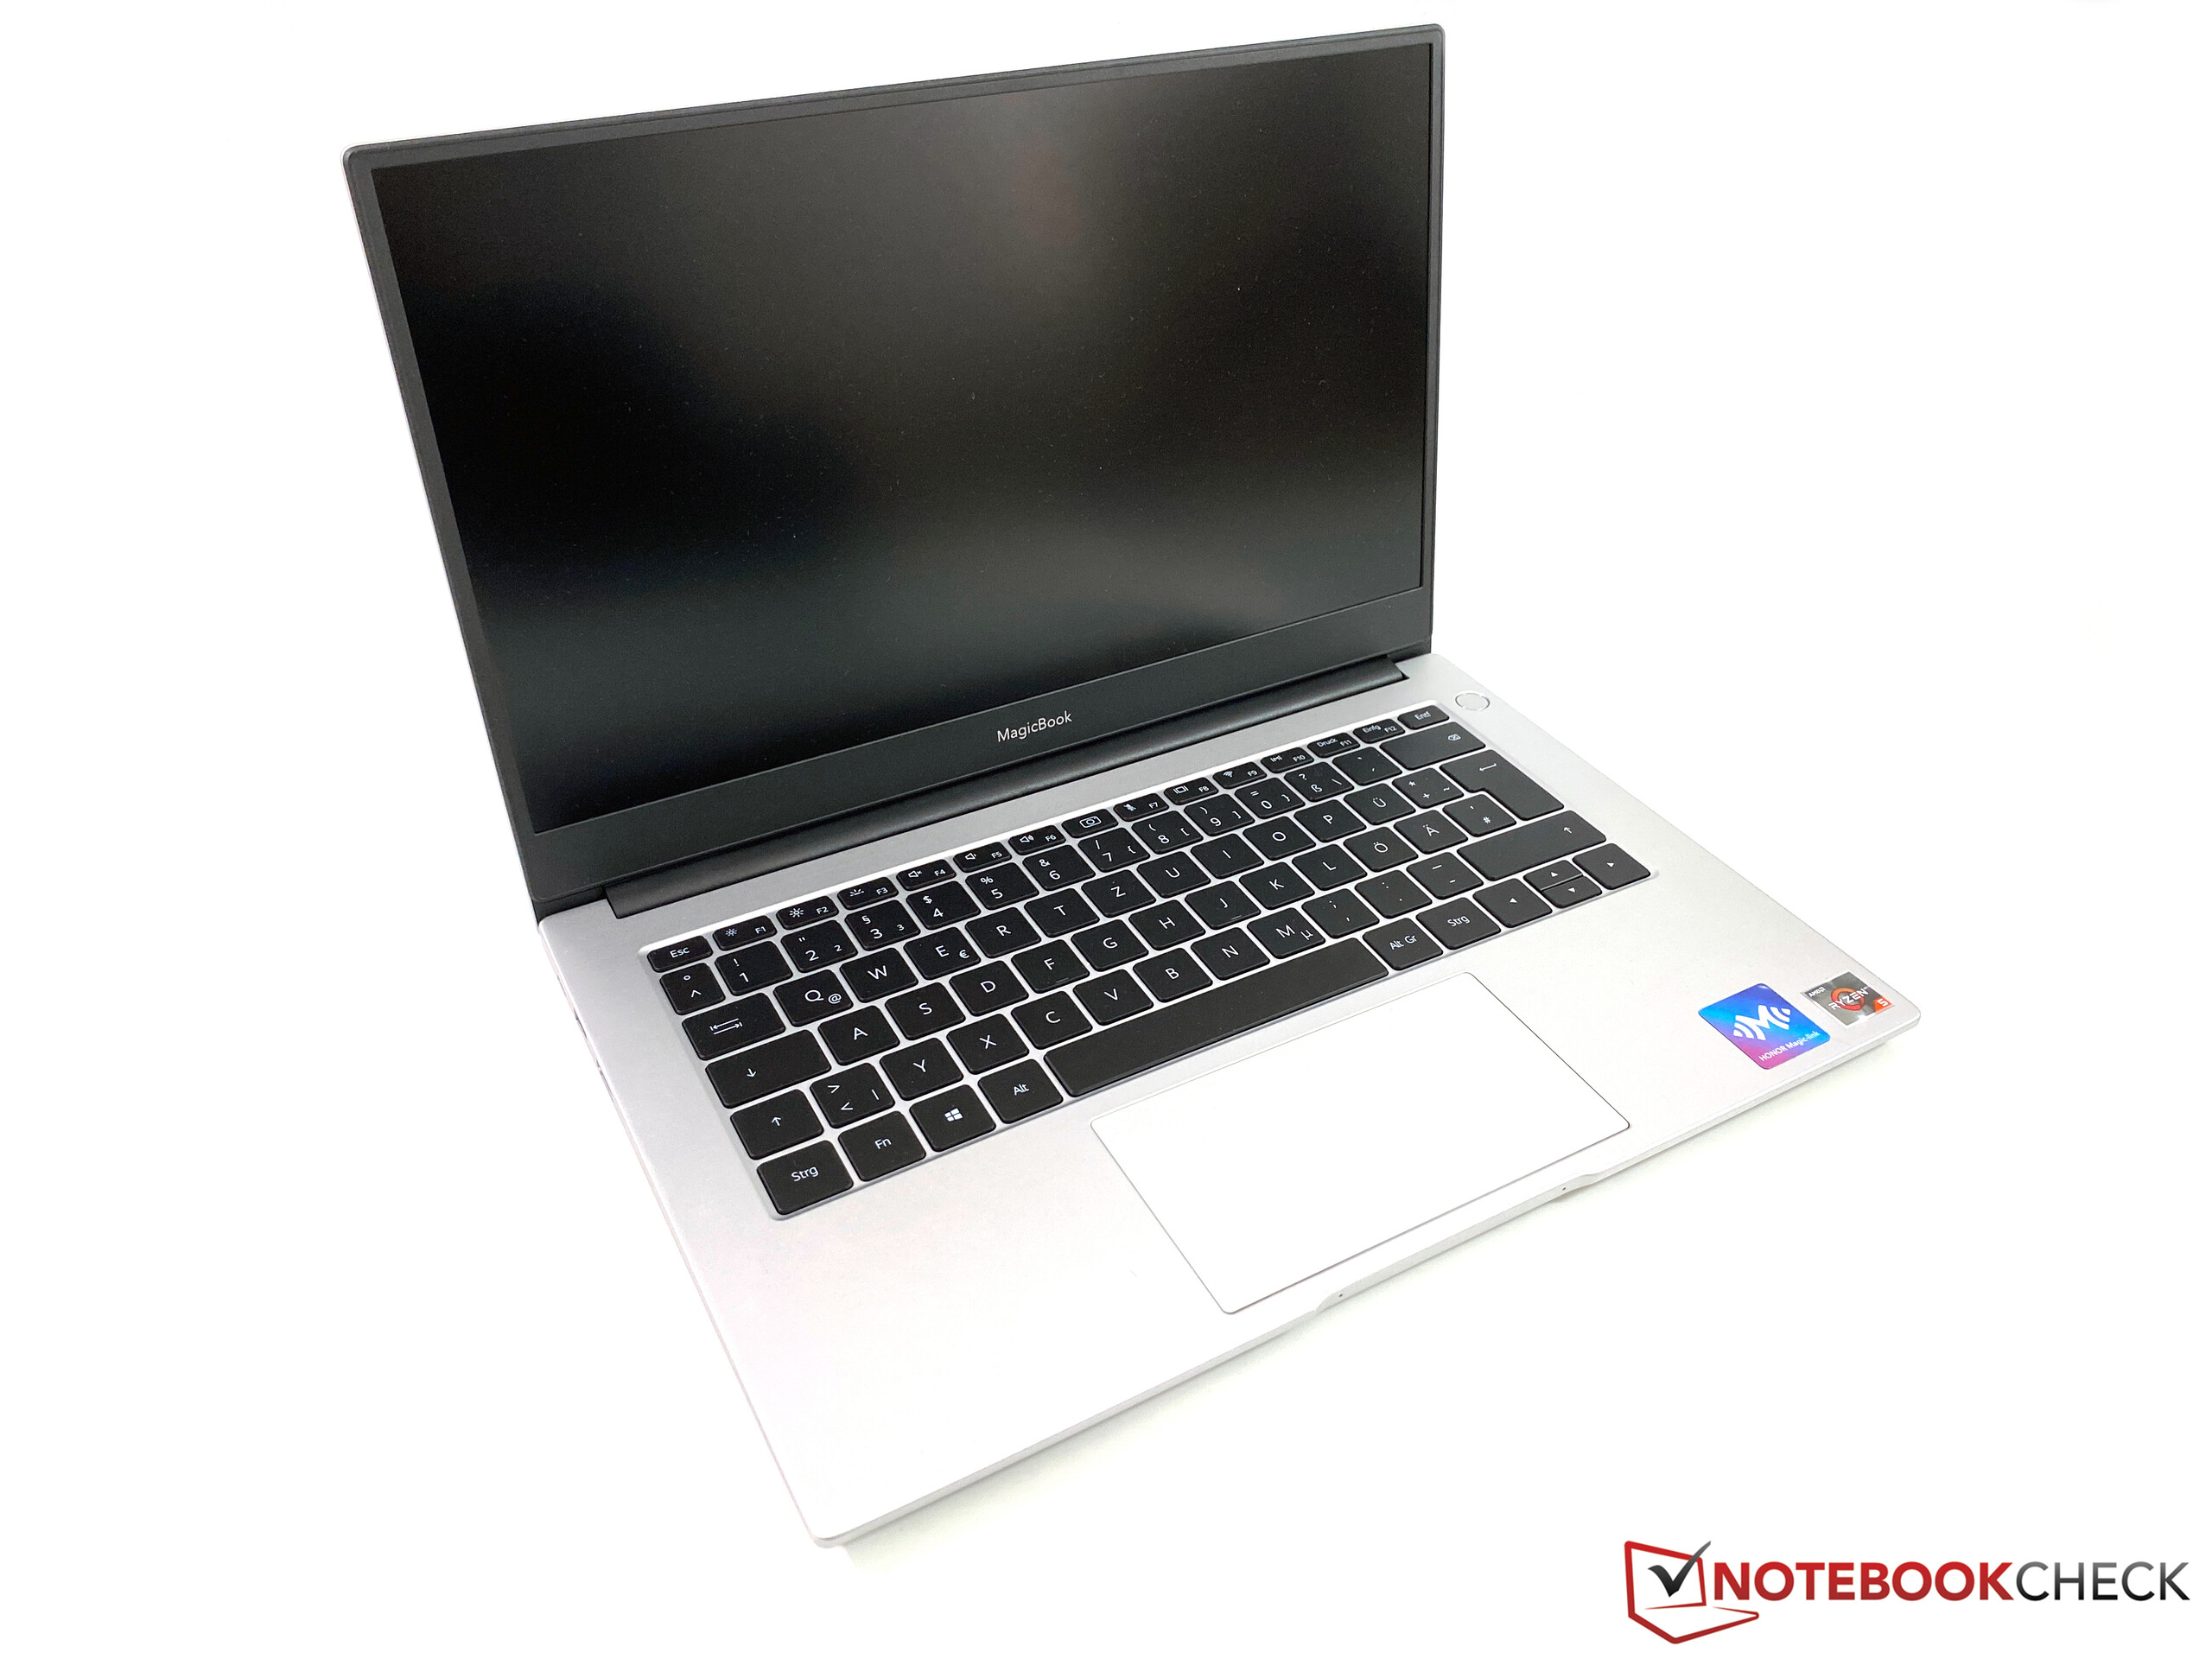
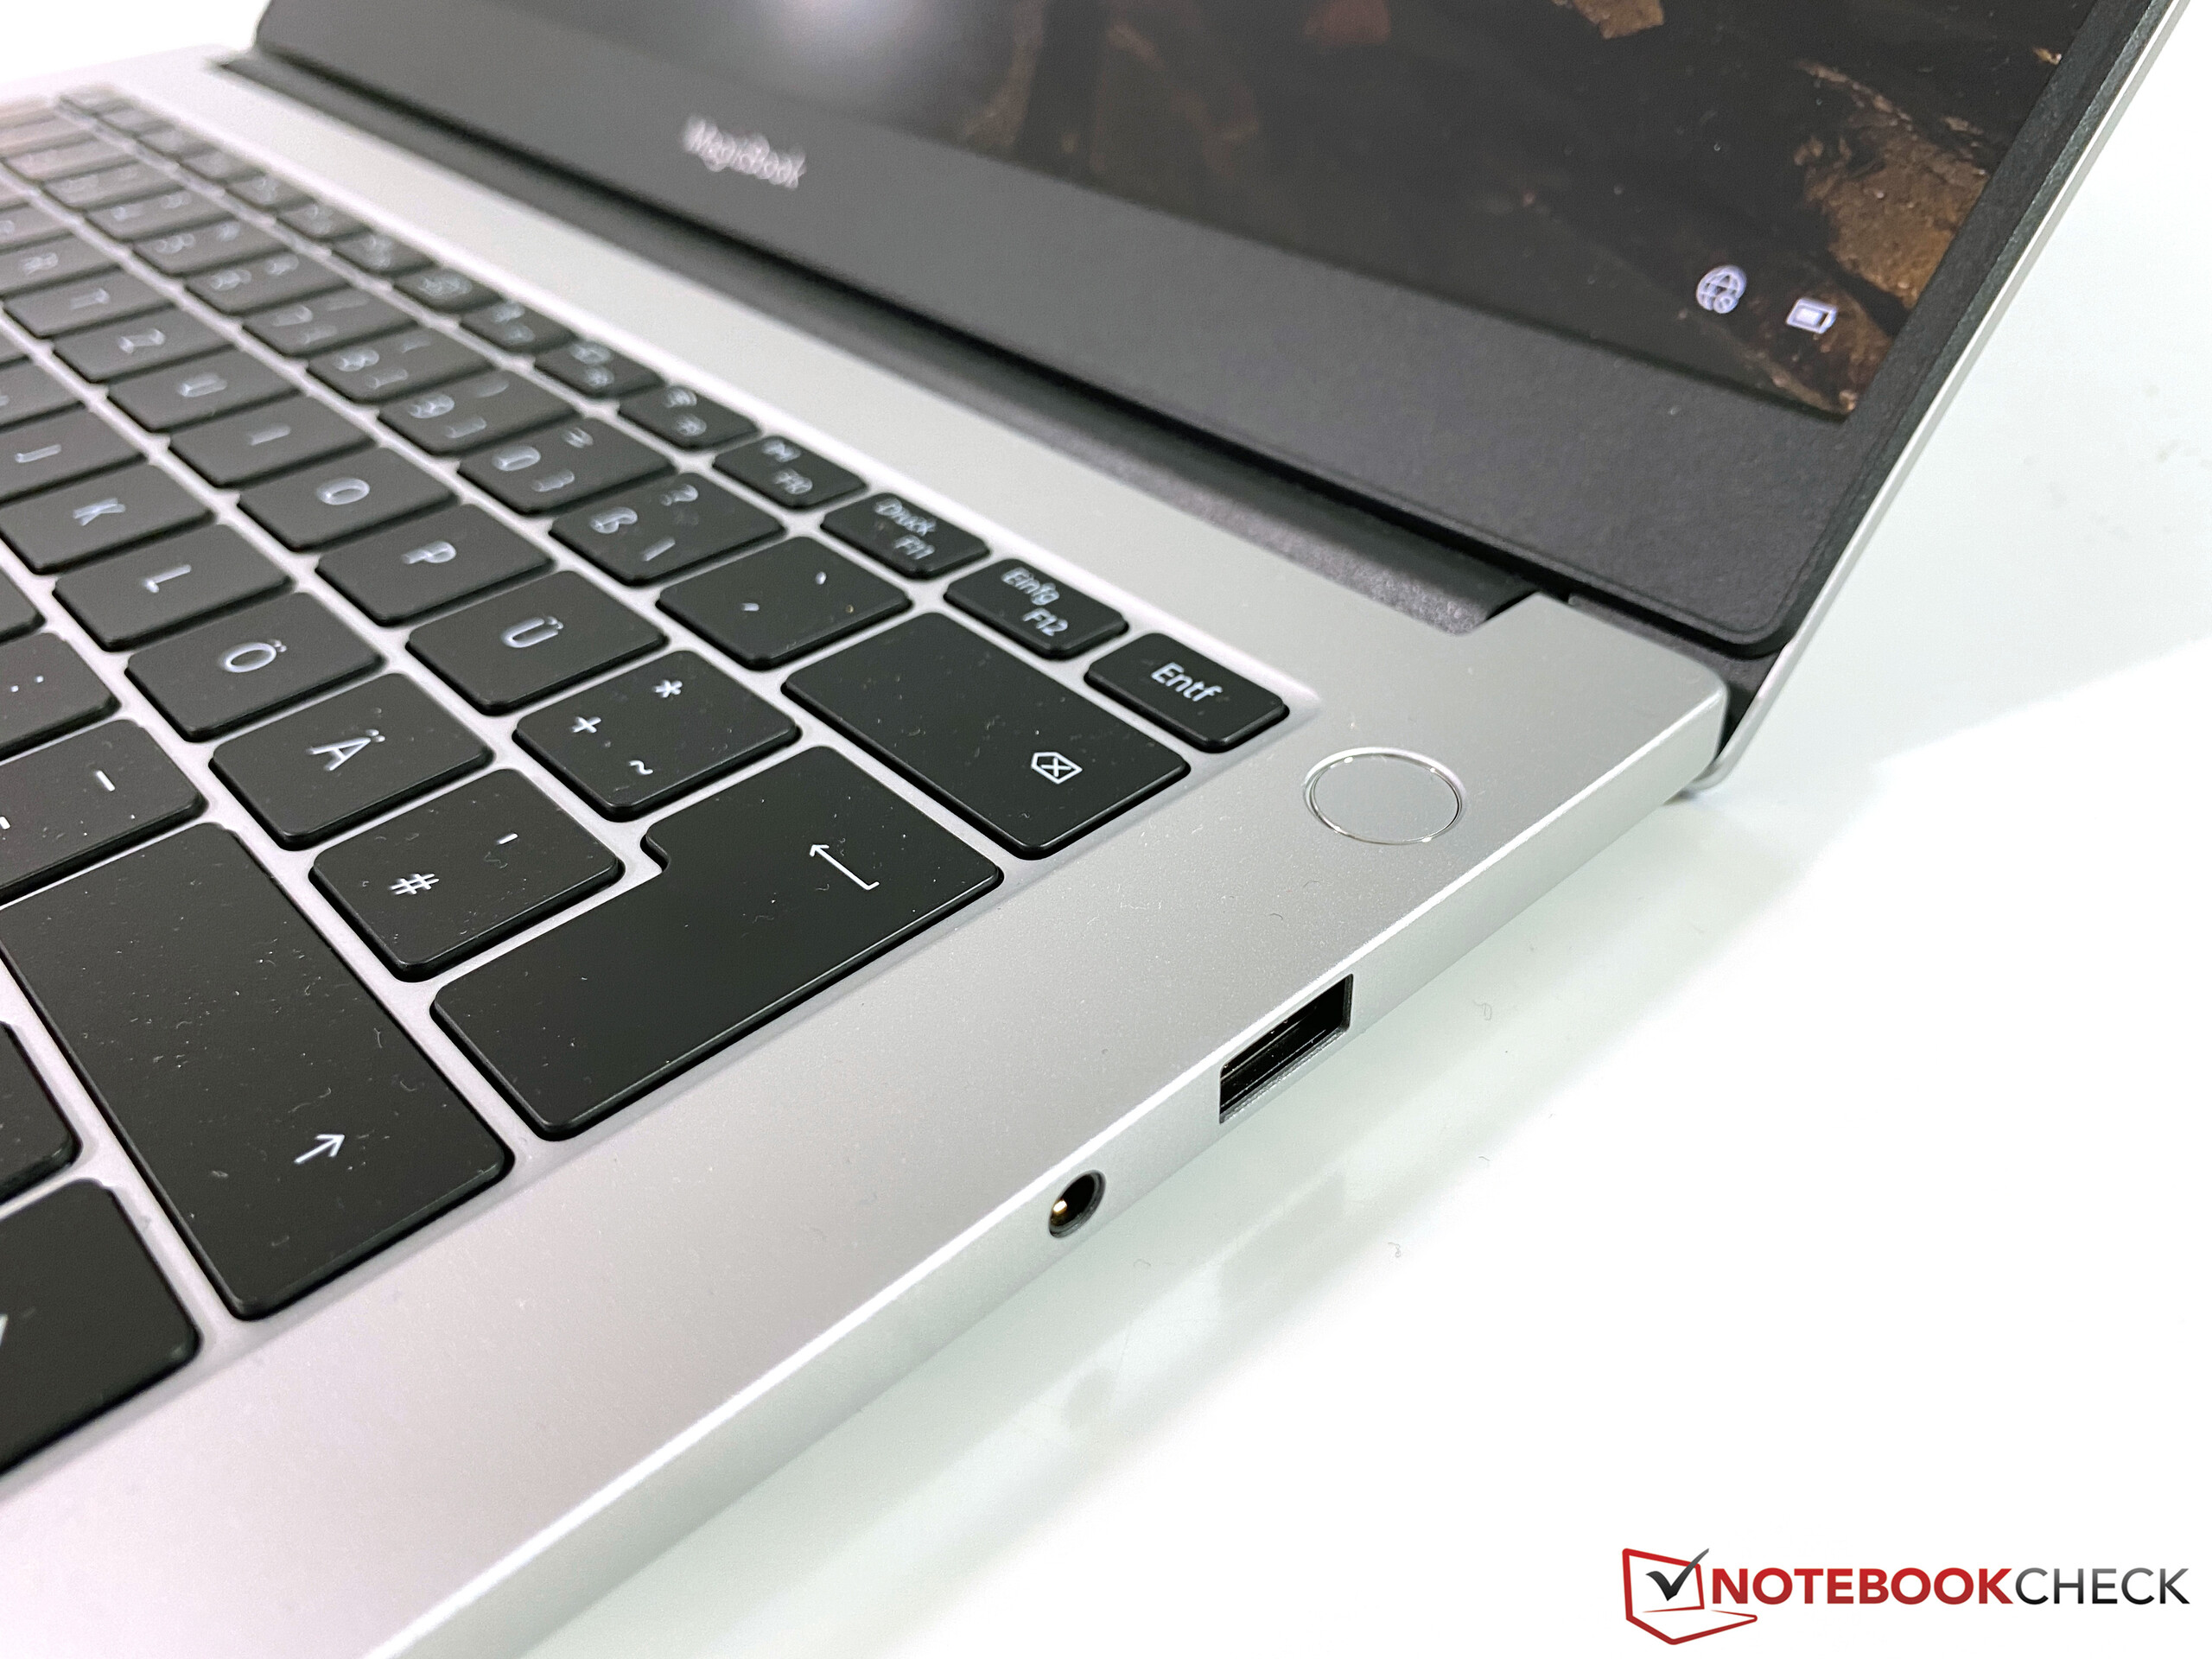
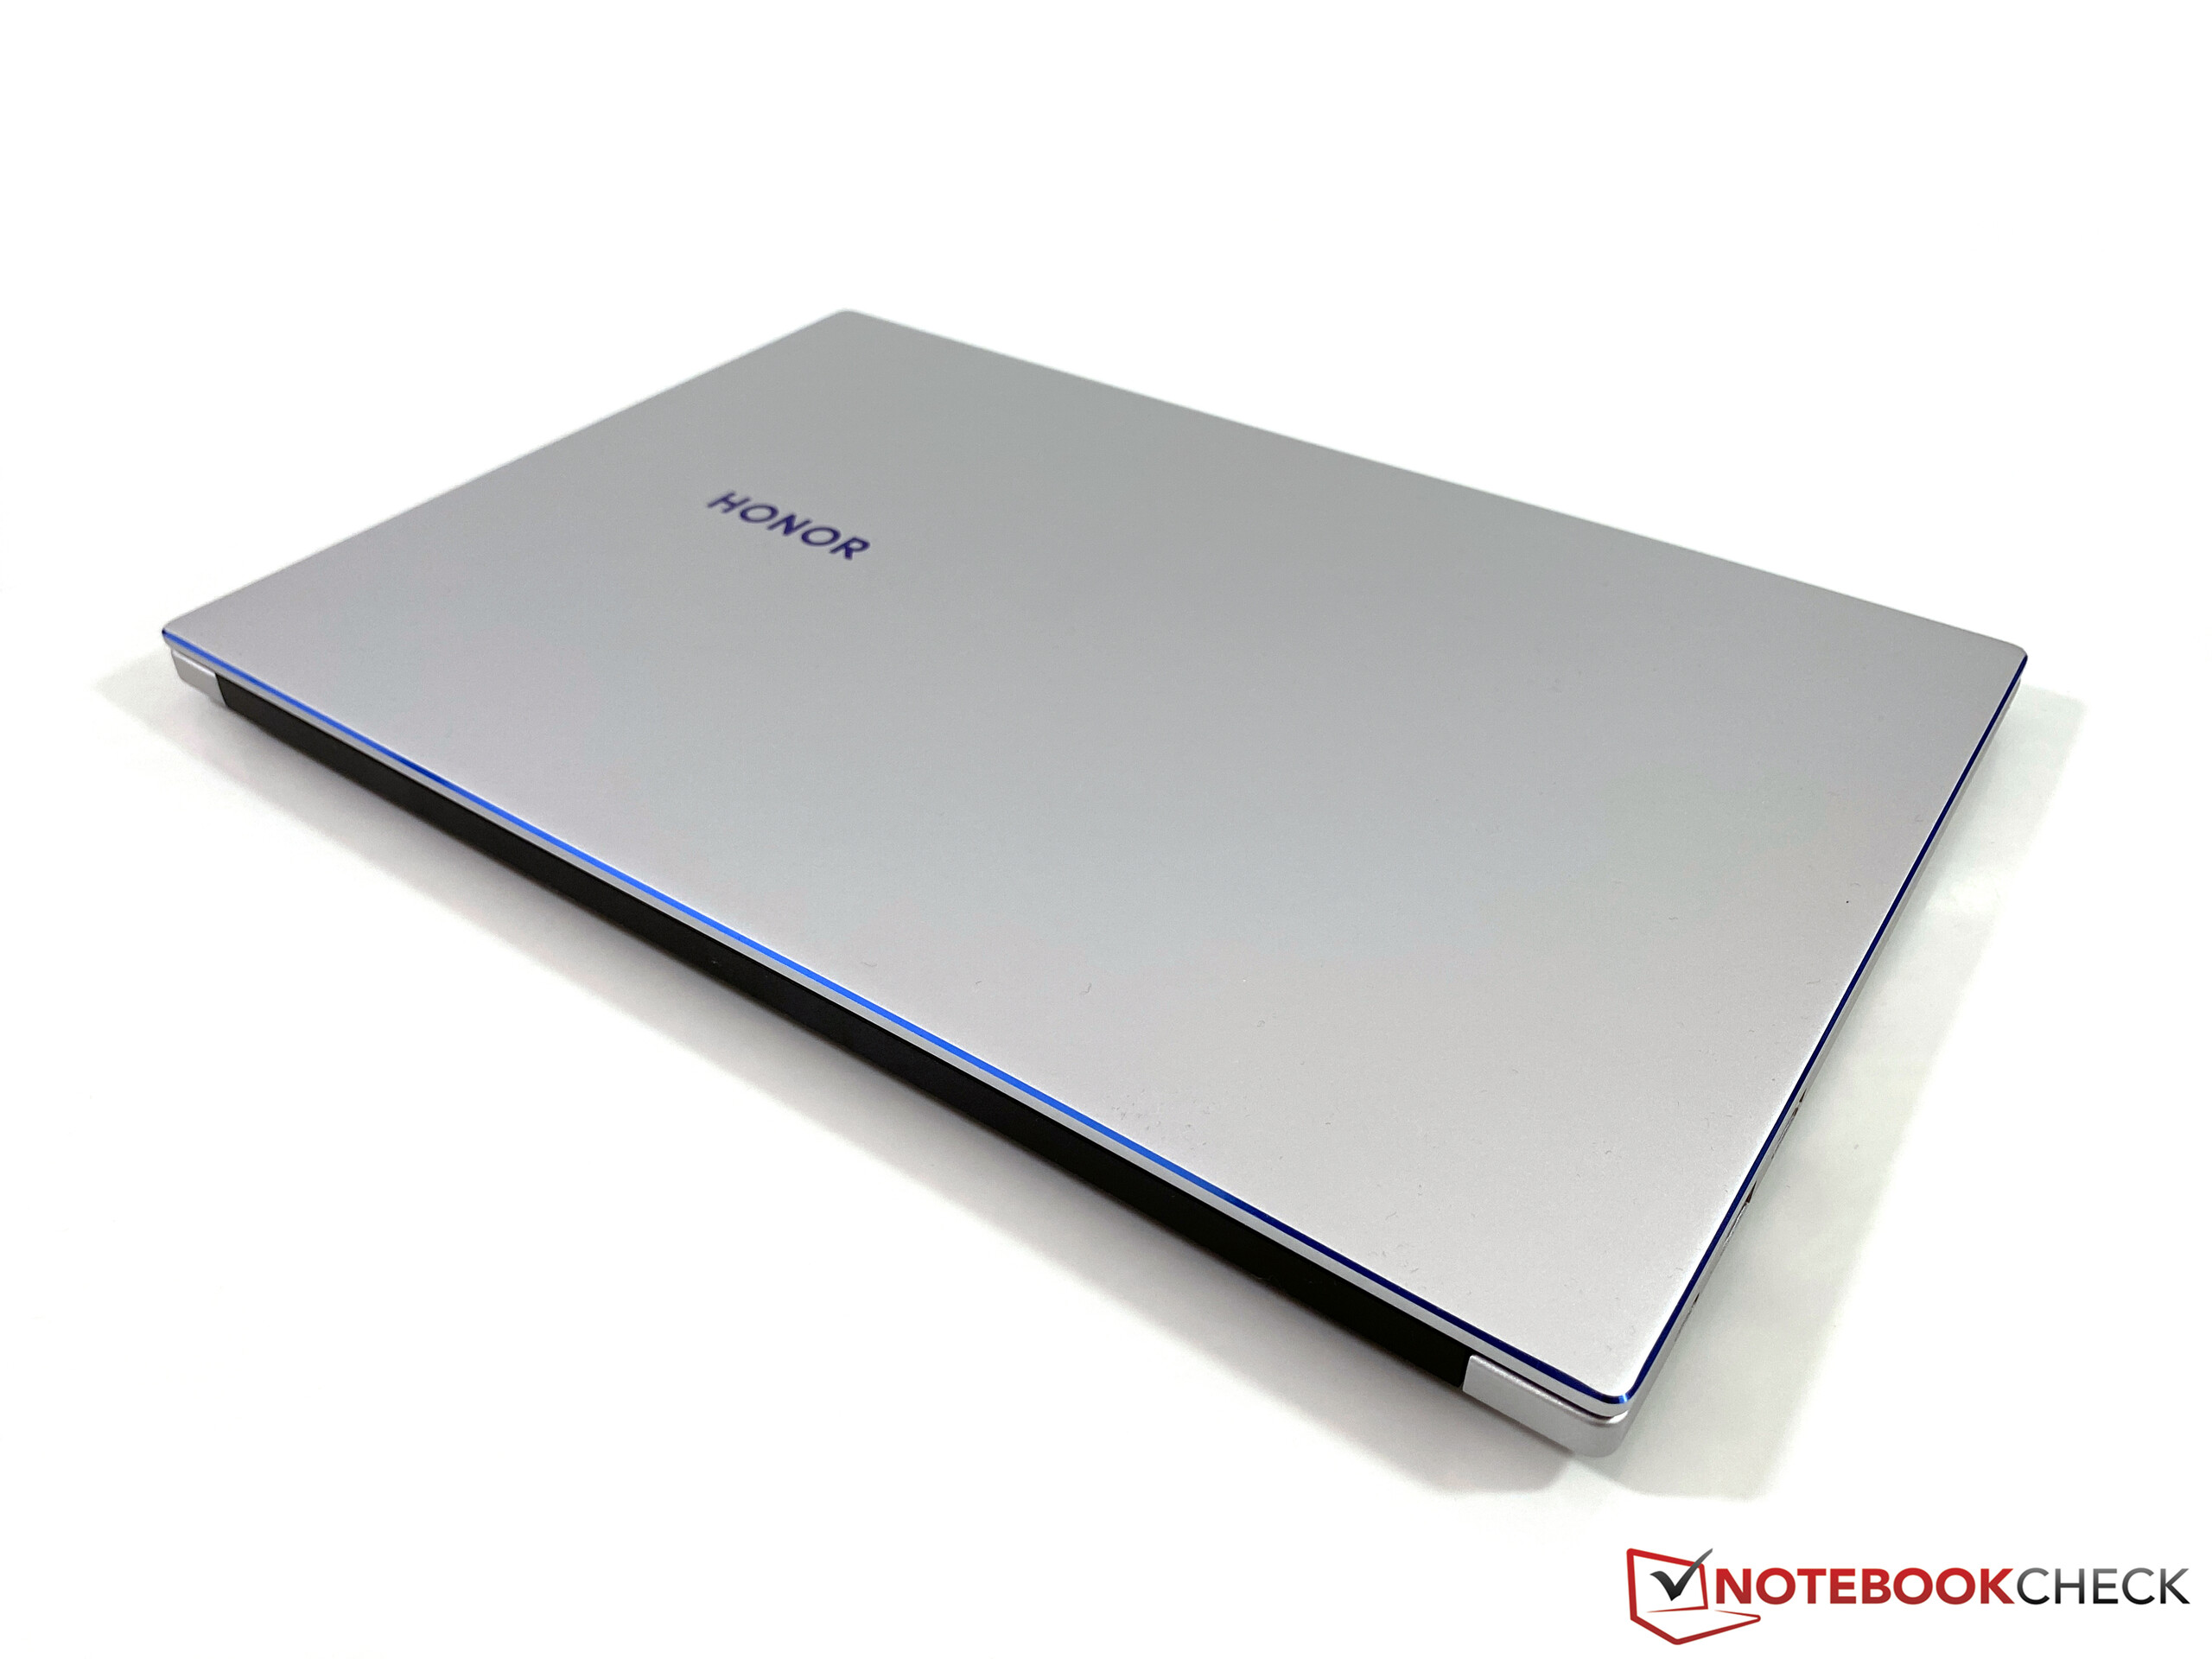
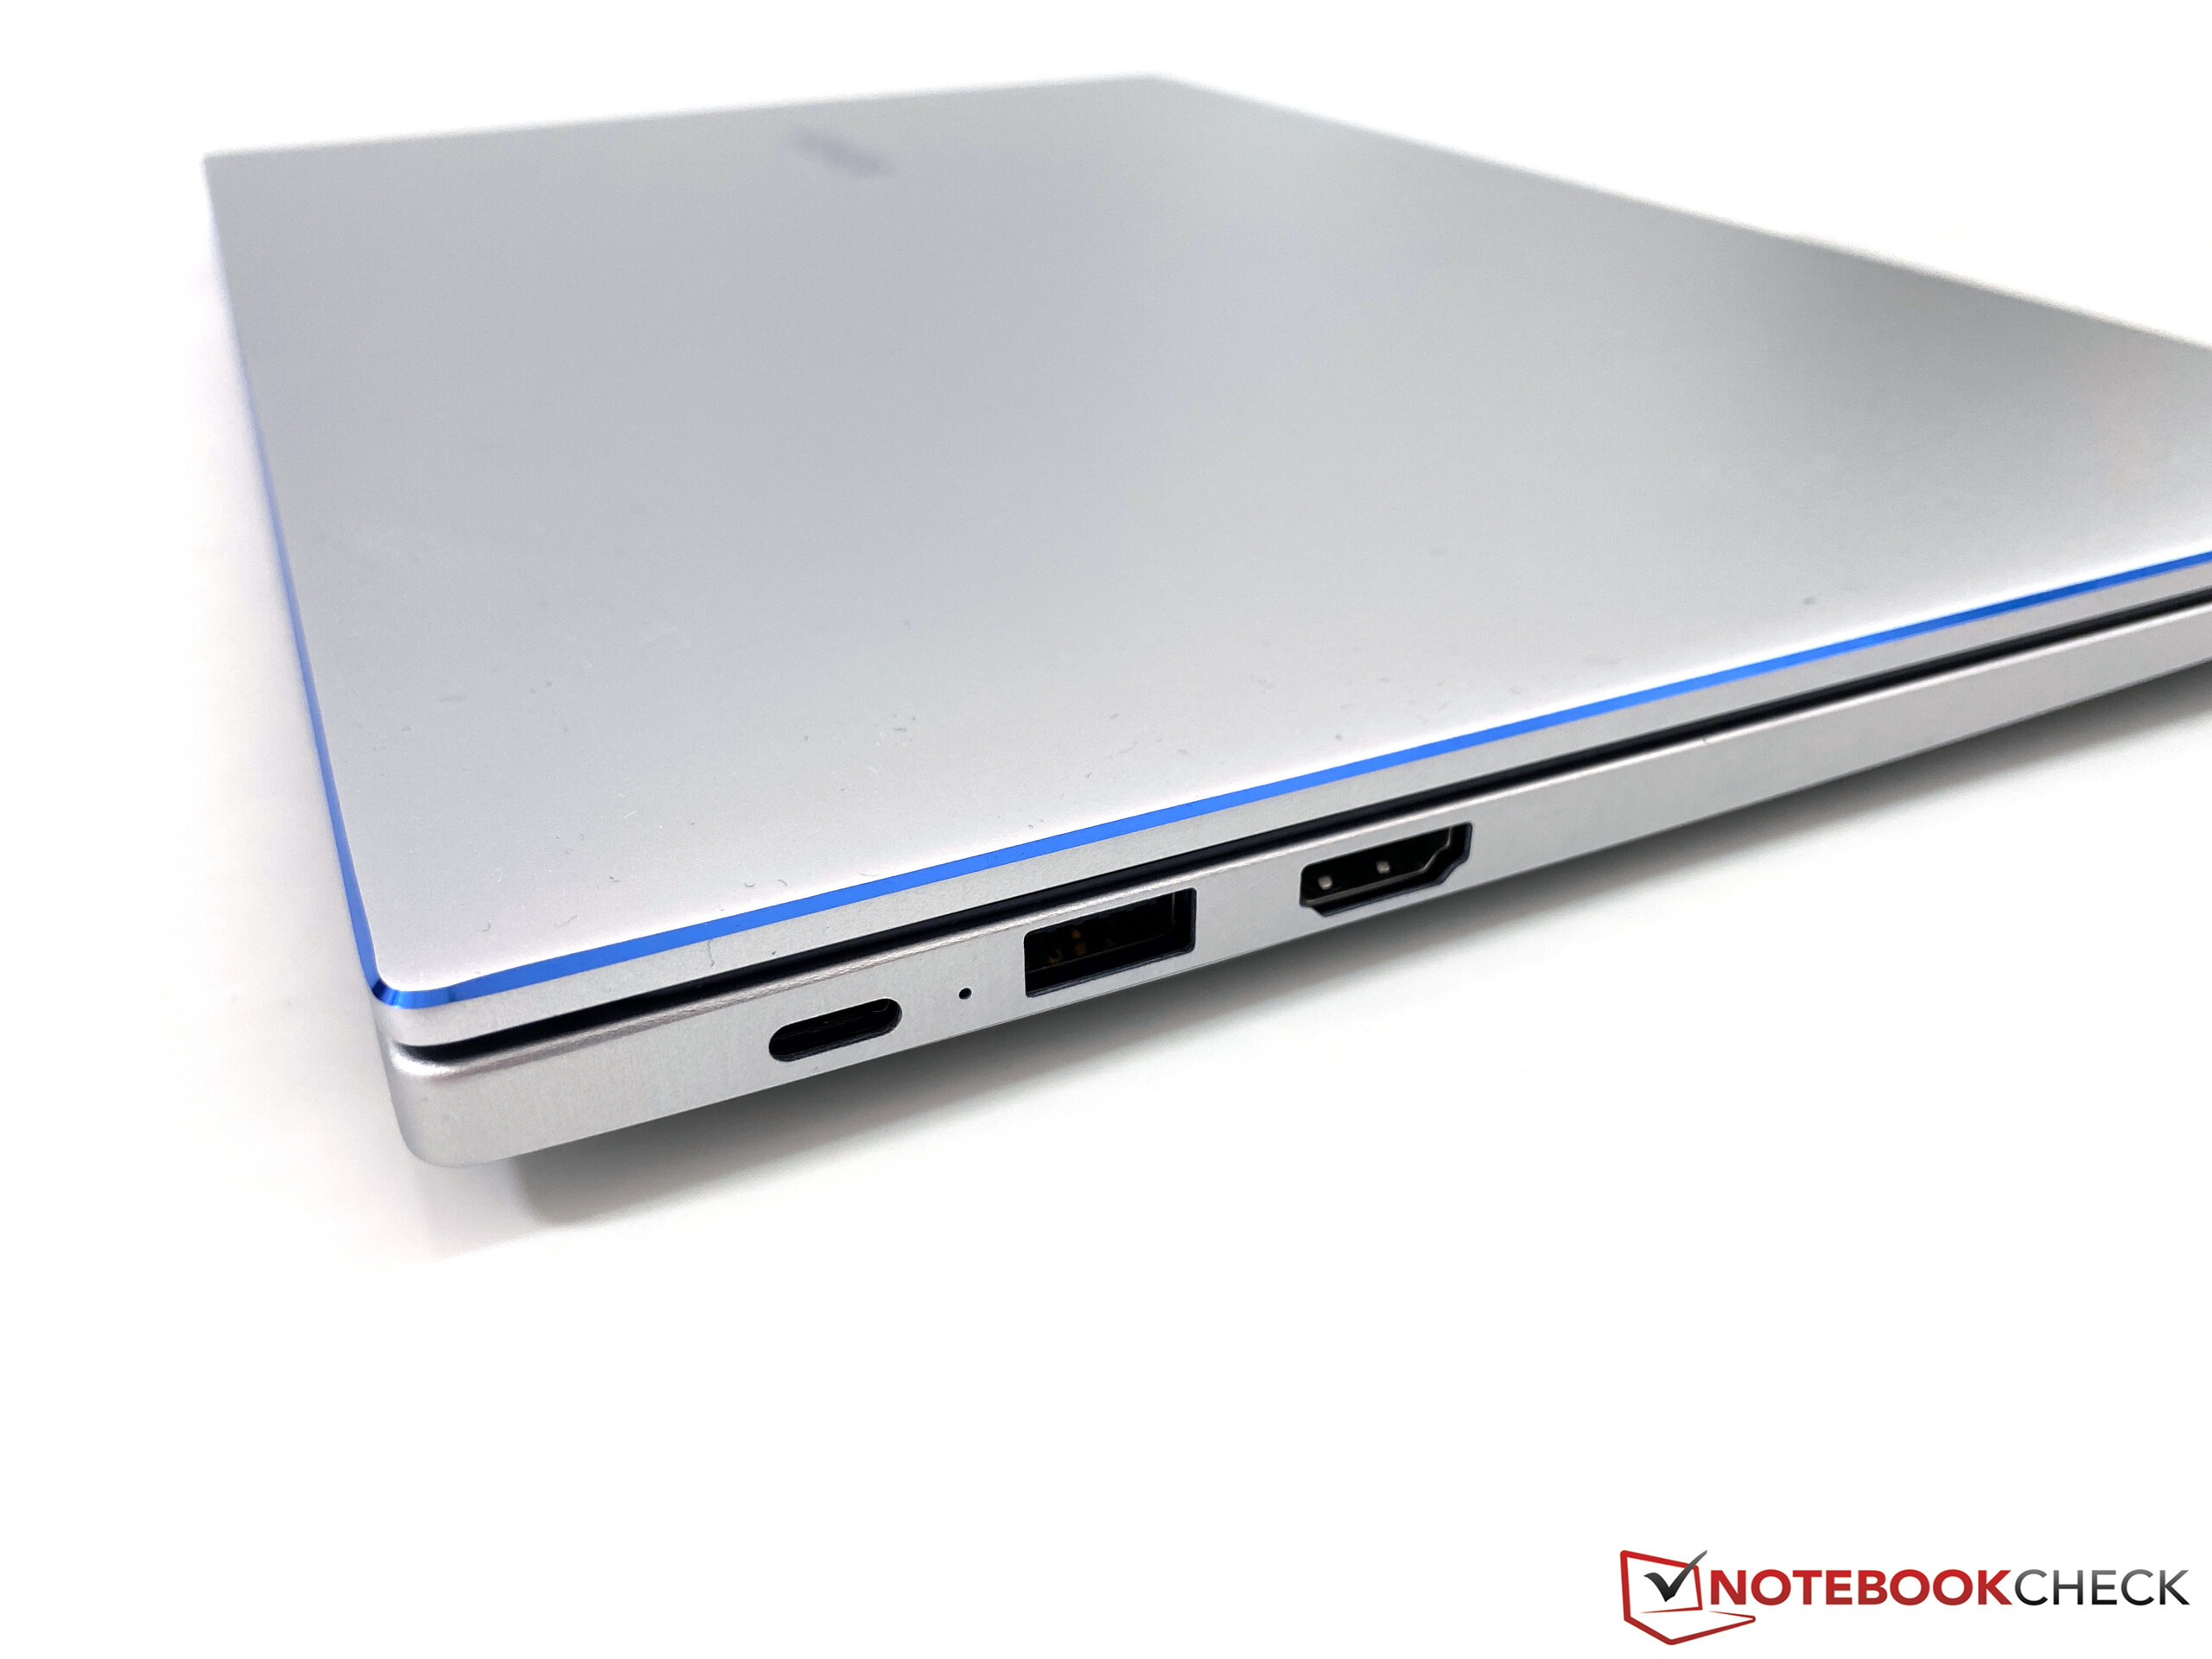
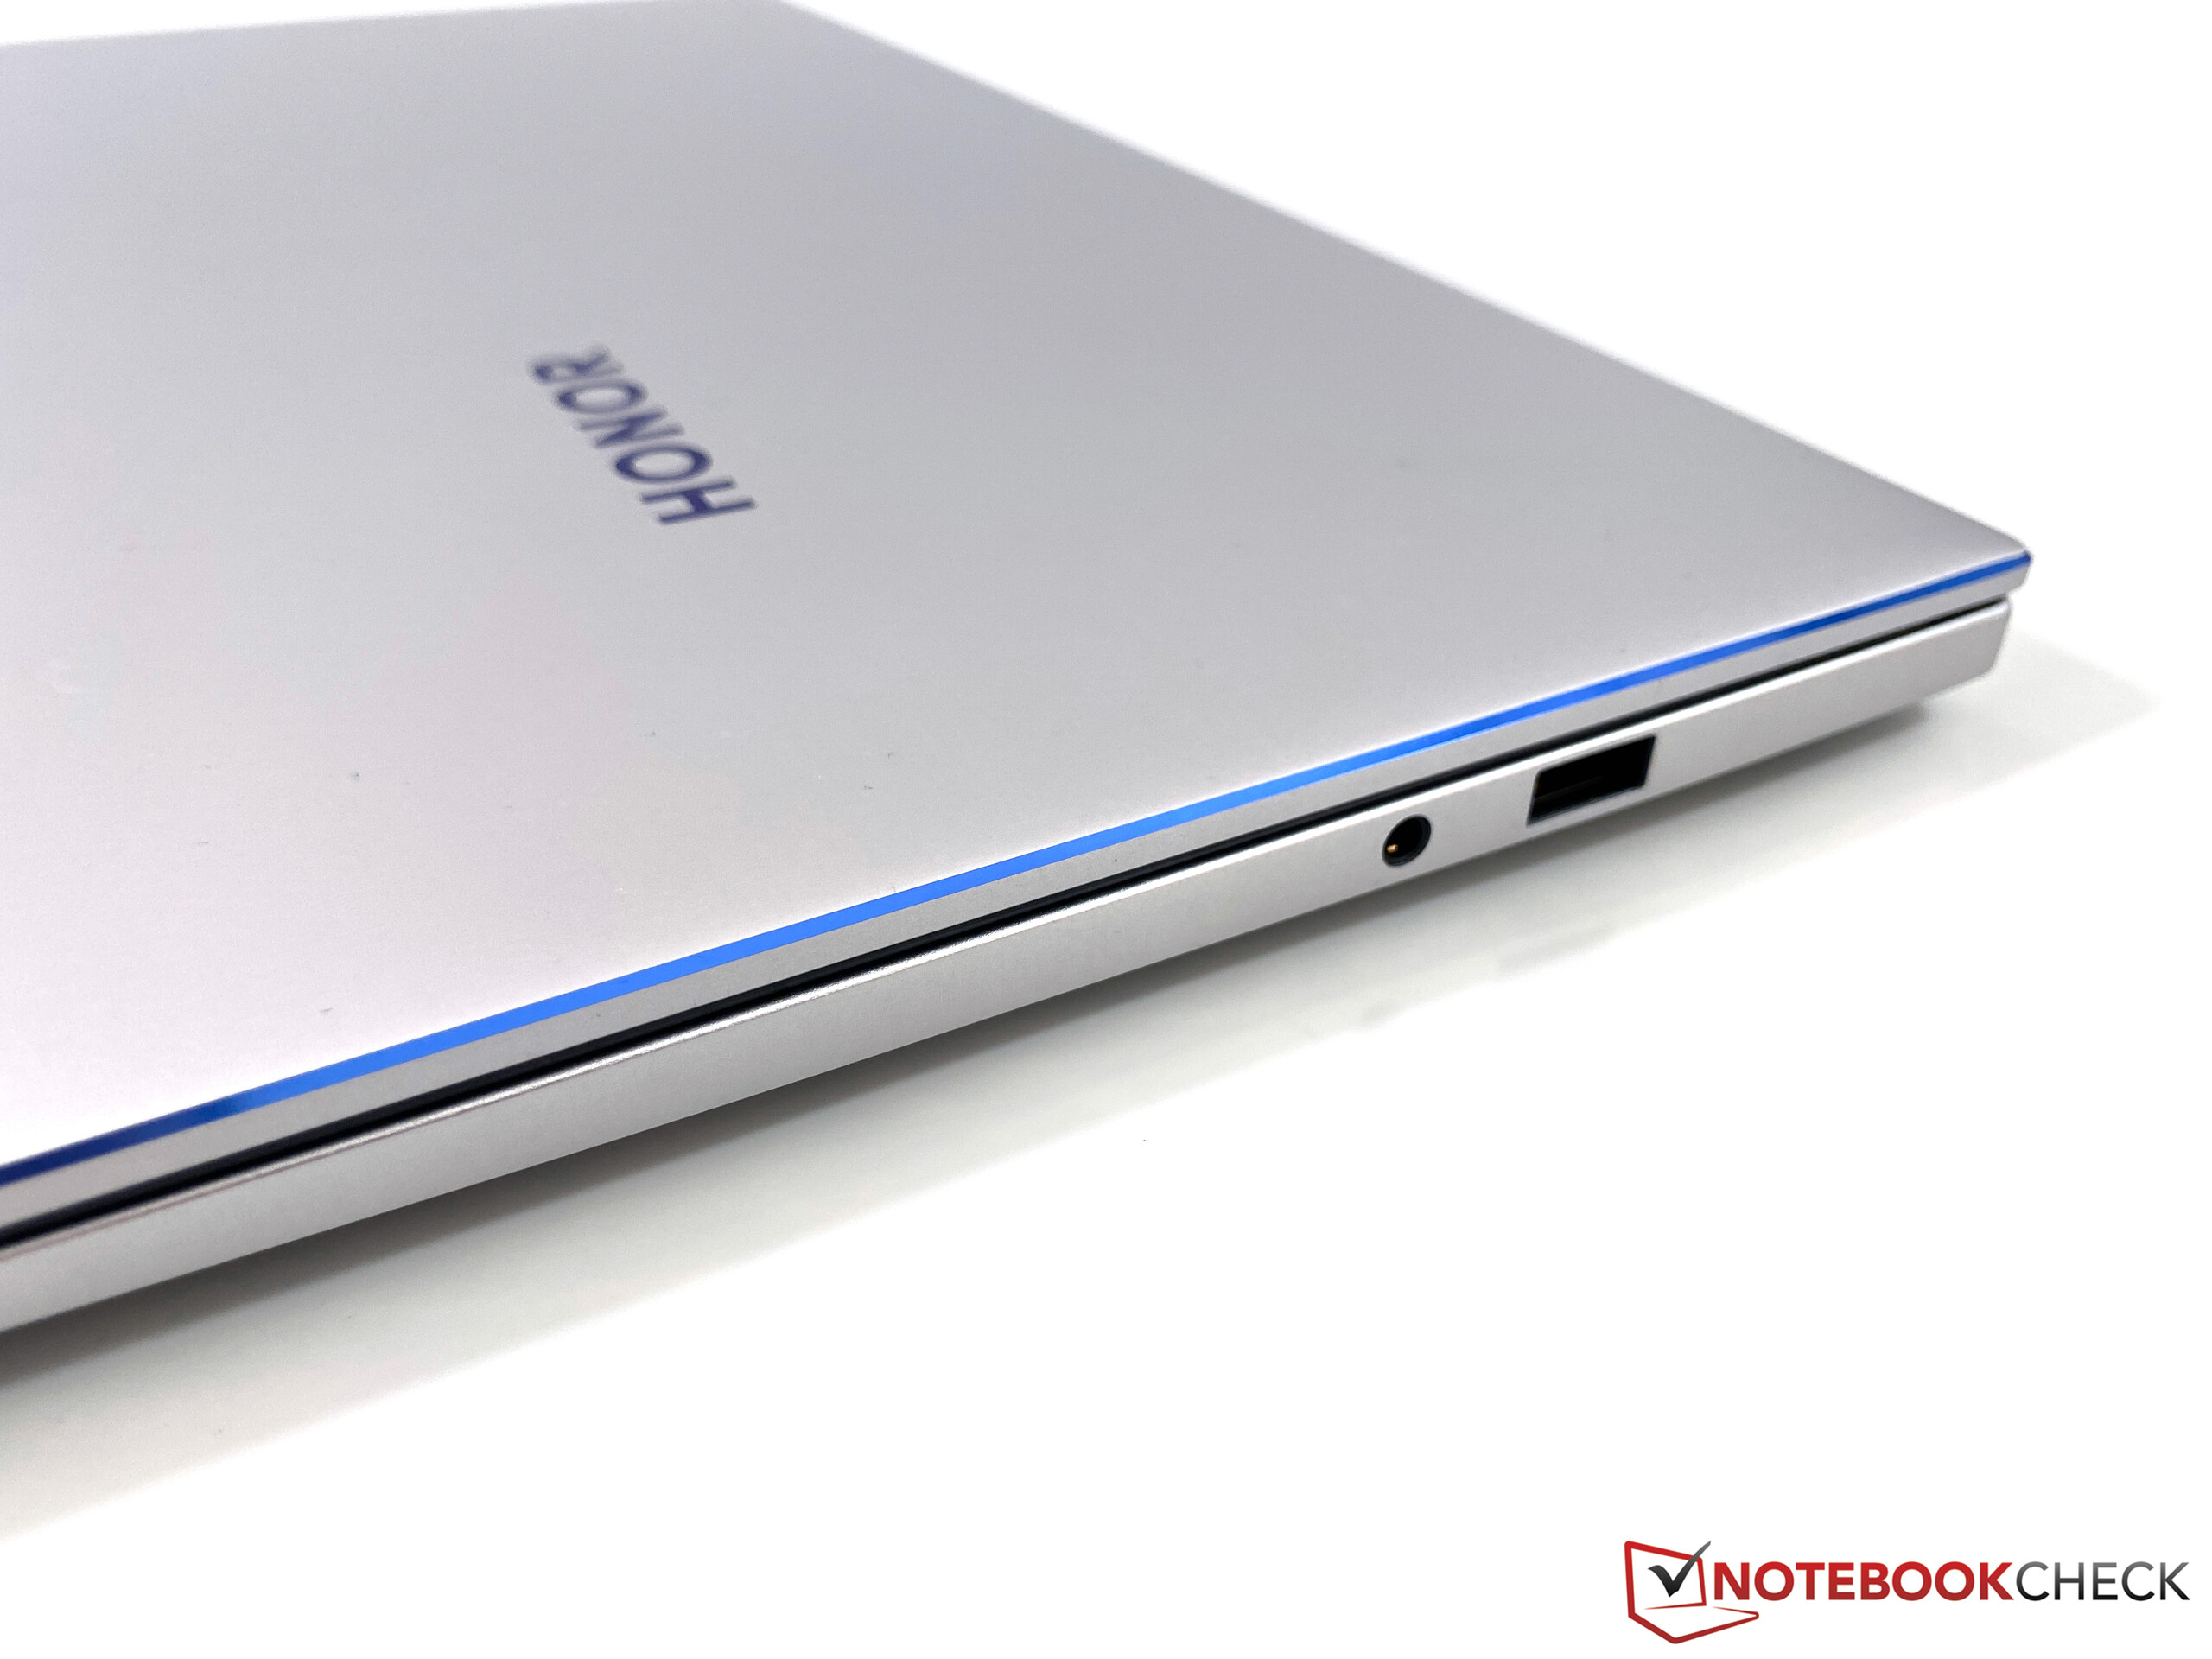
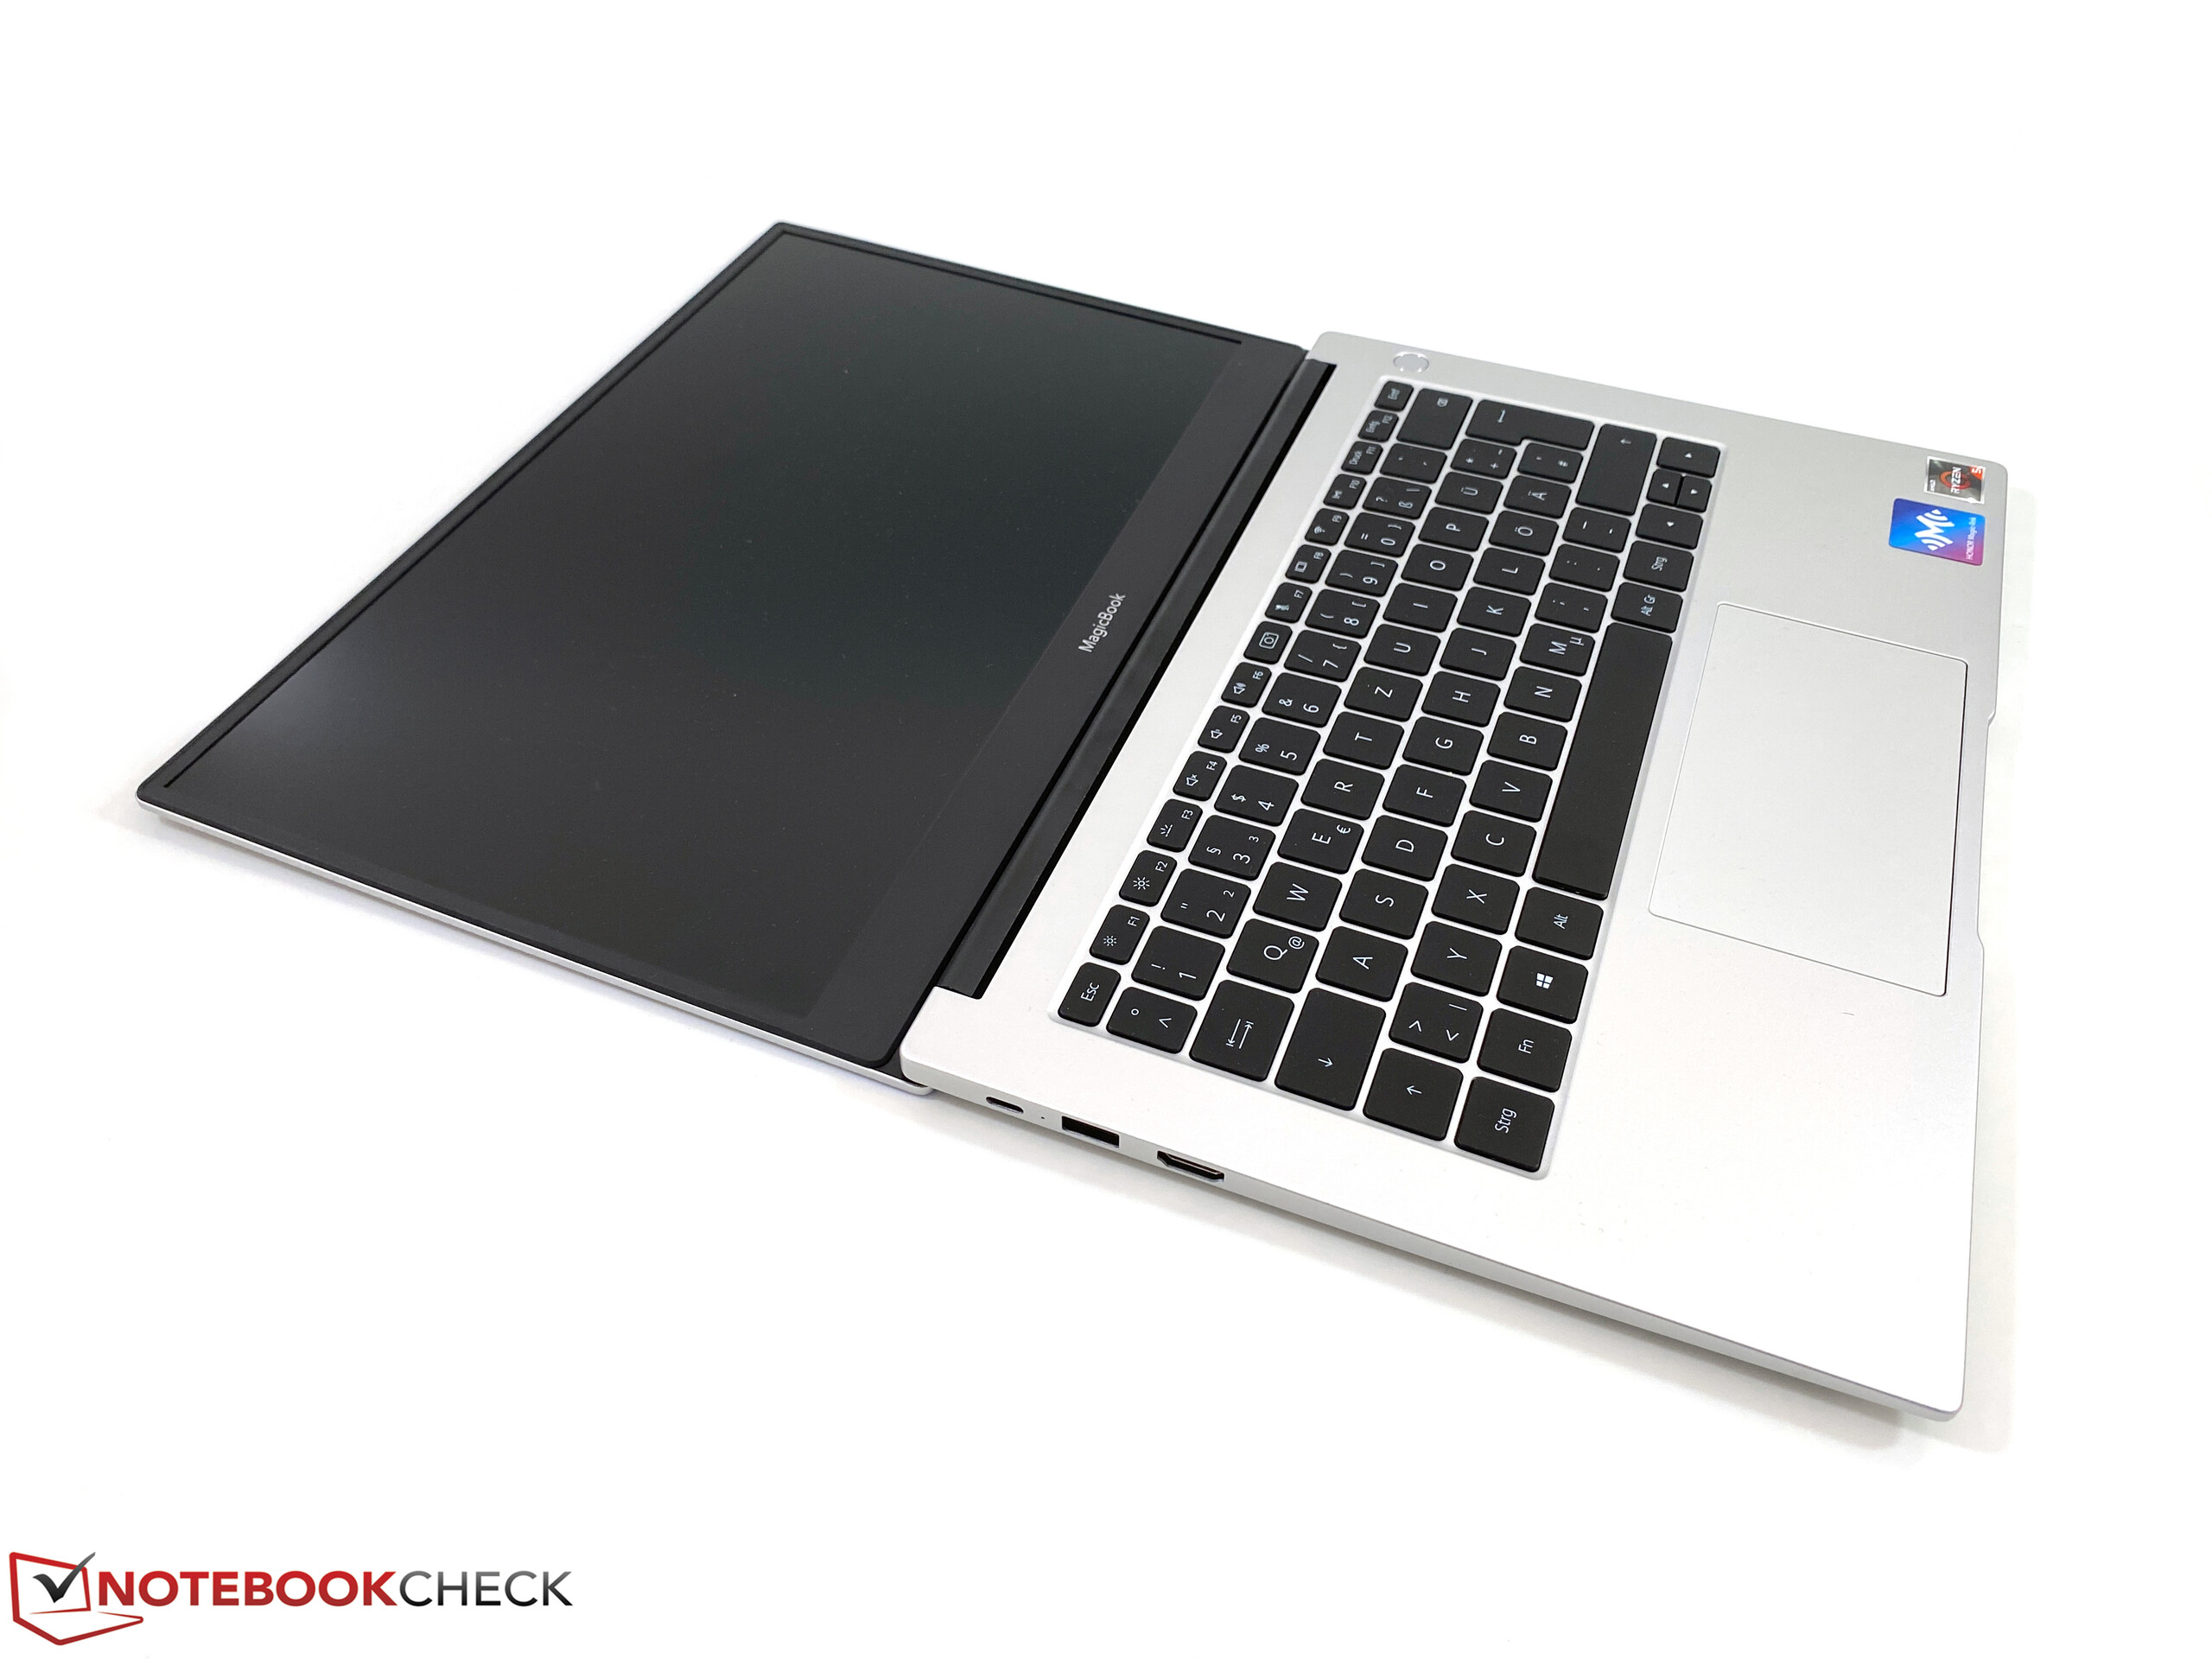
Depois que o Huawei MateBook D 14 já deixou uma boa impressão durante nossa análise, também estamos convencidos pela construção similar do Honor MagicBook 14. A única diferença real entre as duas unidades de teste é a capacidade de armazenamento do SSD, mas em troca, o menos caro oferece até um painel mais brilhante, bem como um SSD NVMe mais rápido da Samsung. Exceto pela cor do chassi, os dois dispositivos são idênticos, começando pela boa carcaça metálica, as portas, os dispositivos de entrada, até o desempenho.
Em nossa opinião, o MagicBook 14 supera claramente as expectativas que você pode ter para um portátil nesta faixa de preço. Exceto por alguns pequenos inconvenientes (como o equipamento de portas), o portátil Honor também poderia competir com aparelhos muito mais caros.
Com exceção do disco rígido menor, não há inconvenientes em relação à unidade de teste do MateBook D 14 de construção similar. O Honor MagicBook 14 é difícil de derrotar por um preço de apenas 599 Euros (~$648).
O preço mais baixo é definitivamente uma vantagem para o Honor MagicBook 14. Se você não precisa de uma GPU dedicada e só precisa de um bom portátil para as tarefas diárias, nós podemos facilmente recomendar o MagicBook 14, pois existem apenas pequenos compromissos apesar do baixo preço.
Honor Magicbook 14
- 05/15/2020 v7 (old)
Andreas Osthoff
Price comparison
