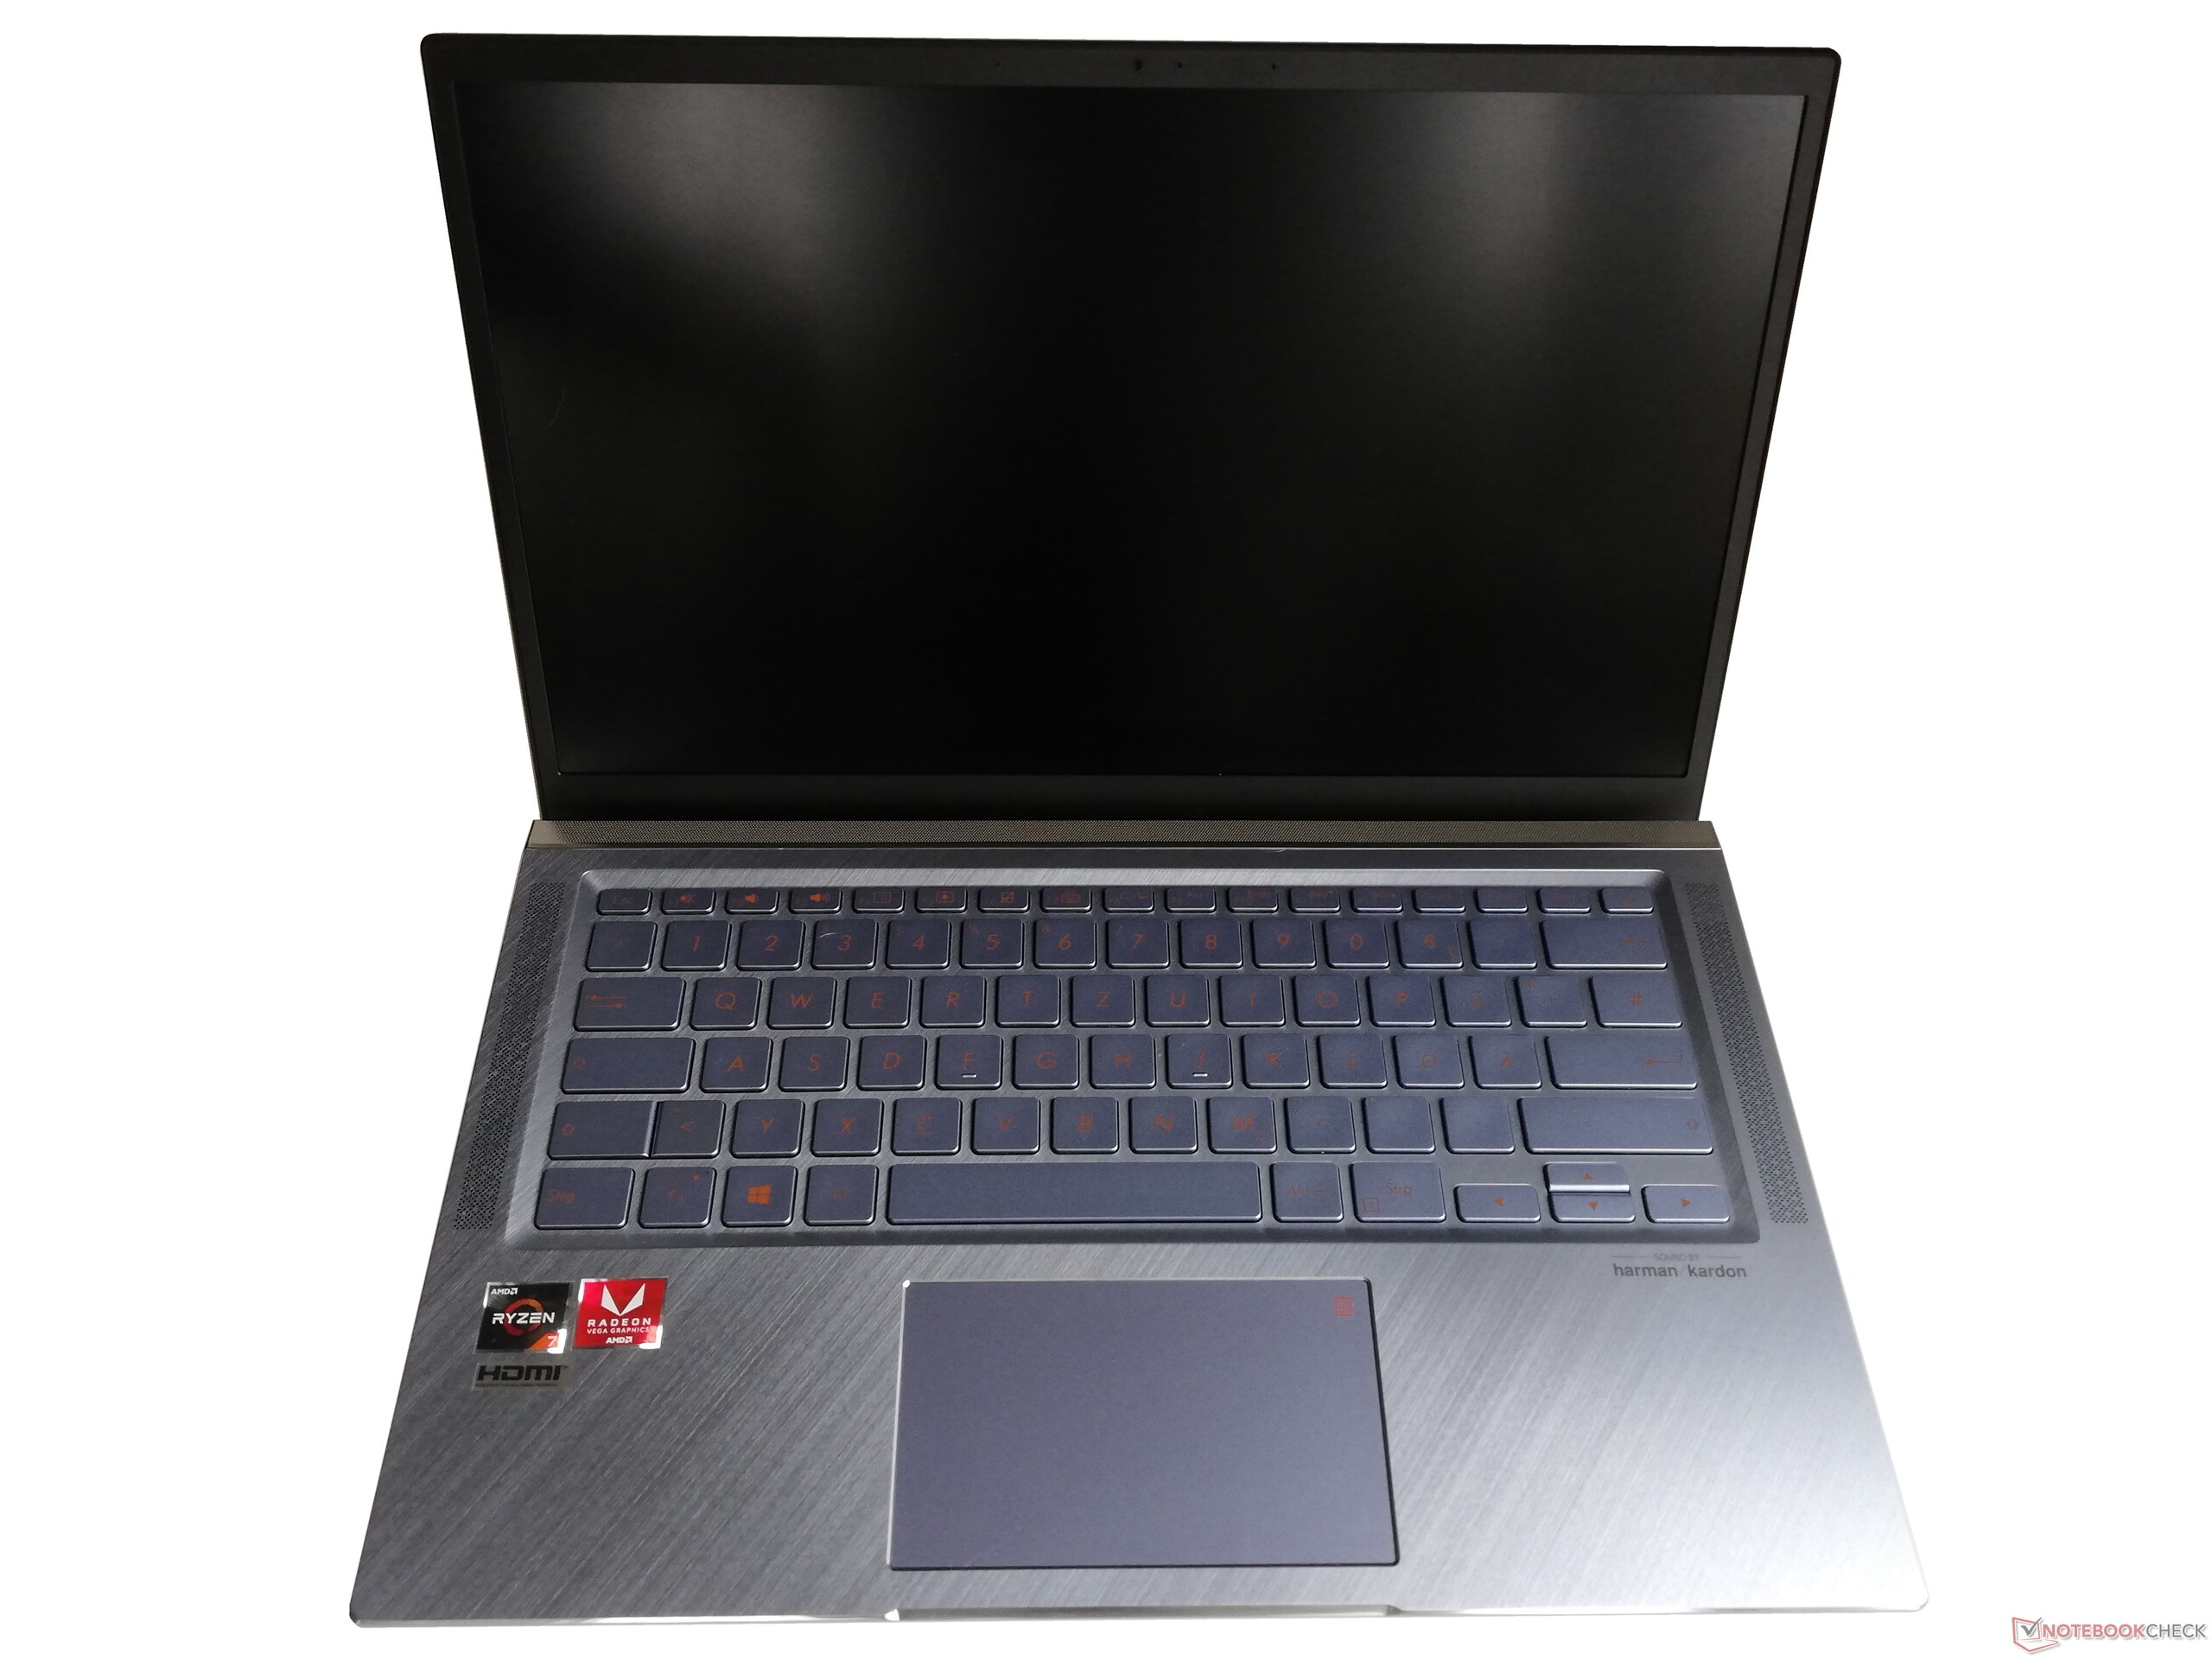
Breve Análise do Portátil Asus ZenBook 14 UM431DA: Também causa uma boa impressão com Ryzen
Avaliação | Data | Modelo | Peso | Altura | Size | Resolução | Preço |
|---|---|---|---|---|---|---|---|
| 81.2 % v7 (old) | 02/2020 | Asus ZenBook 14 UM431DA-AM020T R7 3700U, Vega 10 | 1.4 kg | 16 mm | 14.00" | 1920x1080 | |
| 88.4 % v6 (old) | 10/2024 | Lenovo ThinkPad E595-20NF0000GE R7 3700U, Vega 10 | 1.9 kg | 19.9 mm | 15.60" | 1920x1080 | |
| 79.7 % v6 (old) | 08/2019 | Dell Inspiron 15 5000 5585 R7 3700U, Vega 10 | 1.8 kg | 19.5 mm | 15.60" | 1920x1080 | |
| 80.9 % v7 (old) | 01/2020 | MSI Modern 14 A10RB-459US i5-10210U, GeForce MX250 | 1.2 kg | 16 mm | 14.00" | 1920x1080 | |
| 77.8 % v7 (old) | 01/2020 | HP Pavilion 14-ce3040ng i7-1065G7, GeForce MX250 | 1.6 kg | 18 mm | 14.00" | 1920x1080 |

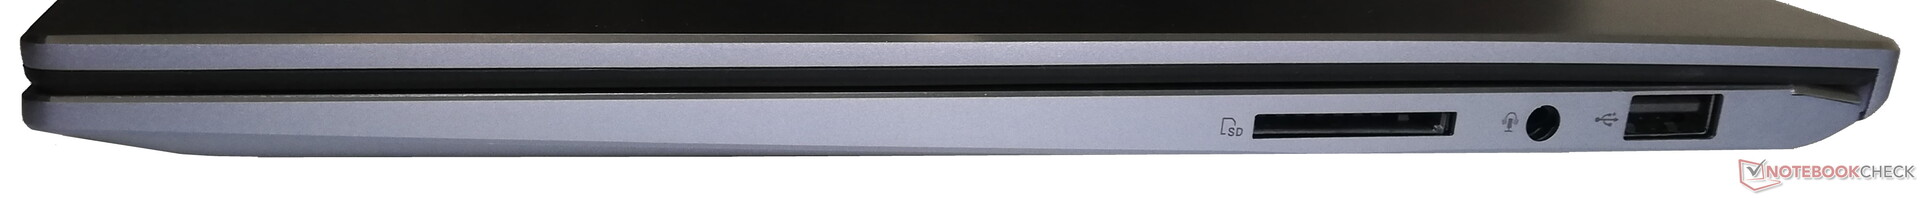
| SD Card Reader | |
| average JPG Copy Test (av. of 3 runs) | |
| Lenovo ThinkPad E595-20NF0000GE (Toshiba Exceria Pro M501 64 GB UHS-II) | |
| Média da turma Subnotebook (23.7 - 188, n=9, últimos 2 anos) | |
| Dell Inspiron 15 5000 5585 (Toshiba Exceria Pro SDXC 64 GB UHS-II) | |
| HP Pavilion 14-ce3040ng (Toshiba Exceria Pro SDXC 64 GB UHS-II) | |
| MSI Modern 14 A10RB-459US (Toshiba Exceria Pro SDXC 64 GB UHS-II) | |
| Asus ZenBook 14 UM431DA-AM020T (Toshiba Exceria Pro SDXC 64 GB UHS-II) | |
| maximum AS SSD Seq Read Test (1GB) | |
| Média da turma Subnotebook (24.9 - 195, n=8, últimos 2 anos) | |
| Lenovo ThinkPad E595-20NF0000GE (Toshiba Exceria Pro M501 64 GB UHS-II) | |
| Dell Inspiron 15 5000 5585 (Toshiba Exceria Pro SDXC 64 GB UHS-II) | |
| Asus ZenBook 14 UM431DA-AM020T (Toshiba Exceria Pro SDXC 64 GB UHS-II) | |
| HP Pavilion 14-ce3040ng (Toshiba Exceria Pro SDXC 64 GB UHS-II) | |
| MSI Modern 14 A10RB-459US (Toshiba Exceria Pro SDXC 64 GB UHS-II) | |
| |||||||||||||||||||||||||
iluminação: 78 %
iluminação com acumulador: 263 cd/m²
Contraste: 1124:1 (Preto: 0.225 cd/m²)
ΔE ColorChecker Calman: 8.89 | ∀{0.5-29.43 Ø4.71}
calibrated: 4.9
ΔE Greyscale Calman: 6.33 | ∀{0.09-98 Ø4.96}
91% sRGB (Argyll 1.6.3 3D)
60% AdobeRGB 1998 (Argyll 1.6.3 3D)
67.5% AdobeRGB 1998 (Argyll 3D)
92.3% sRGB (Argyll 3D)
66.7% Display P3 (Argyll 3D)
Gamma: 2.52
CCT: 6745 K
| Asus ZenBook 14 UM431DA-AM020T CEC PA LM140LF-3L03, IPS, 1920x1080, 14" | Lenovo ThinkPad E595-20NF0000GE NV156FHM-N49, IPS, 1920x1080, 15.6" | Dell Inspiron 15 5000 5585 LG Philips 156WFC, IPS, 1920x1080, 15.6" | MSI Modern 14 A10RB-459US Chi Mei N140HCE-EN2, IPS, 1920x1080, 14" | HP Pavilion 14-ce3040ng AUO543D, IPS, 1920x1080, 14" | |
|---|---|---|---|---|---|
| Display | -39% | -42% | -1% | 3% | |
| Display P3 Coverage (%) | 66.7 | 39.88 -40% | 37.31 -44% | 64.2 -4% | 66.5 0% |
| sRGB Coverage (%) | 92.3 | 58.6 -37% | 56.2 -39% | 94.8 3% | 98.4 7% |
| AdobeRGB 1998 Coverage (%) | 67.5 | 41.2 -39% | 38.55 -43% | 65.4 -3% | 68.2 1% |
| Response Times | -20% | 8% | -23% | -42% | |
| Response Time Grey 50% / Grey 80% * (ms) | 36 ? | 41.2 ? -14% | 28.4 ? 21% | 39.2 ? -9% | 60.8 ? -69% |
| Response Time Black / White * (ms) | 26 ? | 32.8 ? -26% | 27.2 ? -5% | 35.6 ? -37% | 29.6 ? -14% |
| PWM Frequency (Hz) | 44 ? | 1220 ? | 25000 ? | ||
| Screen | -16% | -22% | 30% | 14% | |
| Brightness middle (cd/m²) | 253 | 318 26% | 253.6 0% | 324.1 28% | 395 56% |
| Brightness (cd/m²) | 245 | 297 21% | 227 -7% | 301 23% | 375 53% |
| Brightness Distribution (%) | 78 | 89 14% | 84 8% | 87 12% | 91 17% |
| Black Level * (cd/m²) | 0.225 | 0.17 24% | 0.27 -20% | 0.22 2% | 0.26 -16% |
| Contrast (:1) | 1124 | 1871 66% | 939 -16% | 1473 31% | 1519 35% |
| Colorchecker dE 2000 * | 8.89 | 5.5 38% | 6.05 32% | 1.63 82% | 5.92 33% |
| Colorchecker dE 2000 max. * | 4.56 | 21 -361% | 14.03 -208% | 4.25 7% | 9.79 -115% |
| Colorchecker dE 2000 calibrated * | 4.9 | 5.1 -4% | 4.97 -1% | 1.42 71% | 0.91 81% |
| Greyscale dE 2000 * | 6.33 | 1.8 72% | 3.2 49% | 2.2 65% | 6.69 -6% |
| Gamma | 2.52 87% | 2.12 104% | 2 110% | 2.26 97% | 2.78 79% |
| CCT | 6745 96% | 6257 104% | 6820 95% | 6887 94% | 7596 86% |
| Color Space (Percent of AdobeRGB 1998) (%) | 60 | 37.6 -37% | 35.5 -41% | 60.2 0% | 63 5% |
| Color Space (Percent of sRGB) (%) | 91 | 58.2 -36% | 55.6 -39% | 95 4% | 98 8% |
| Média Total (Programa/Configurações) | -25% /
-21% | -19% /
-22% | 2% /
17% | -8% /
5% |
* ... menor é melhor
Exibir tempos de resposta
| ↔ Tempo de resposta preto para branco | ||
|---|---|---|
| 26 ms ... ascensão ↗ e queda ↘ combinadas | ↗ 15 ms ascensão | 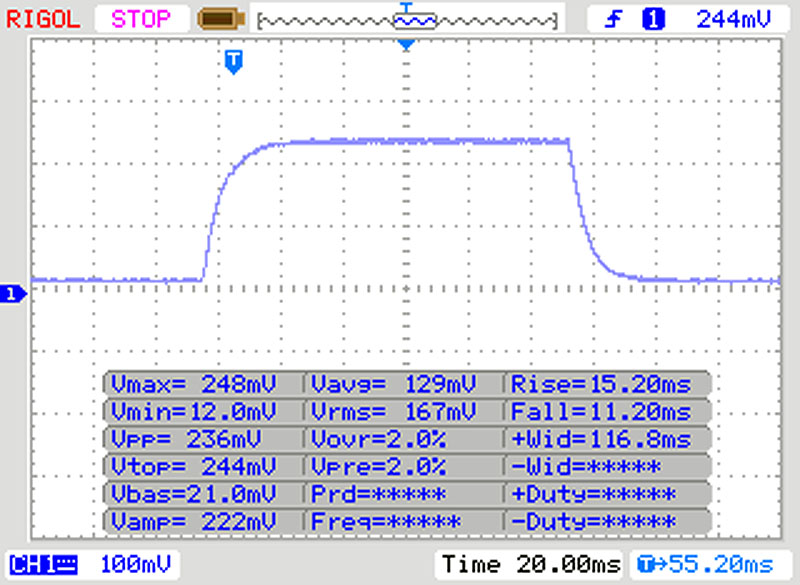 |
| ↘ 11 ms queda | ||
| A tela mostra taxas de resposta relativamente lentas em nossos testes e pode ser muito lenta para os jogadores. Em comparação, todos os dispositivos testados variam de 0.1 (mínimo) a 240 (máximo) ms. » 63 % de todos os dispositivos são melhores. Isso significa que o tempo de resposta medido é pior que a média de todos os dispositivos testados (19.8 ms). | ||
| ↔ Tempo de resposta 50% cinza a 80% cinza | ||
| 36 ms ... ascensão ↗ e queda ↘ combinadas | ↗ 19 ms ascensão | 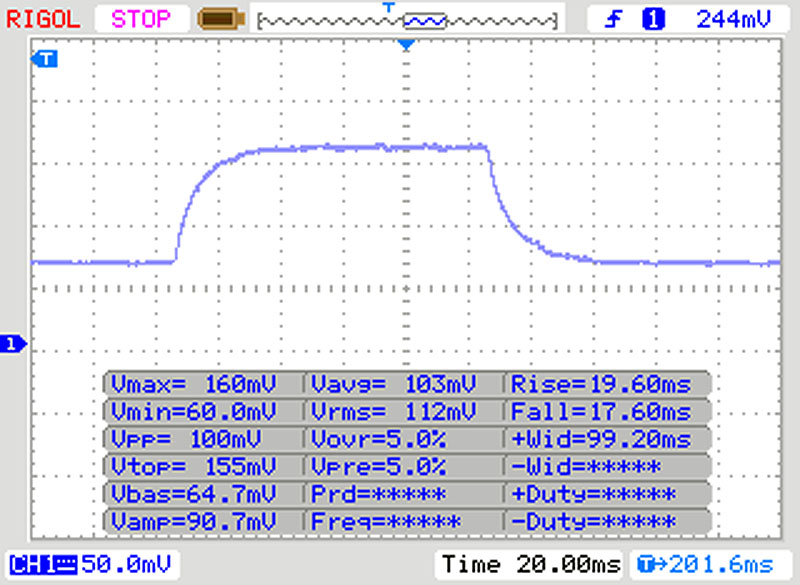 |
| ↘ 17 ms queda | ||
| A tela mostra taxas de resposta lentas em nossos testes e será insatisfatória para os jogadores. Em comparação, todos os dispositivos testados variam de 0.165 (mínimo) a 636 (máximo) ms. » 51 % de todos os dispositivos são melhores. Isso significa que o tempo de resposta medido é pior que a média de todos os dispositivos testados (31 ms). | ||
Cintilação da tela / PWM (modulação por largura de pulso)
| Tela tremeluzindo/PWM detectado | 44 Hz | ≤ 20 % configuração de brilho | 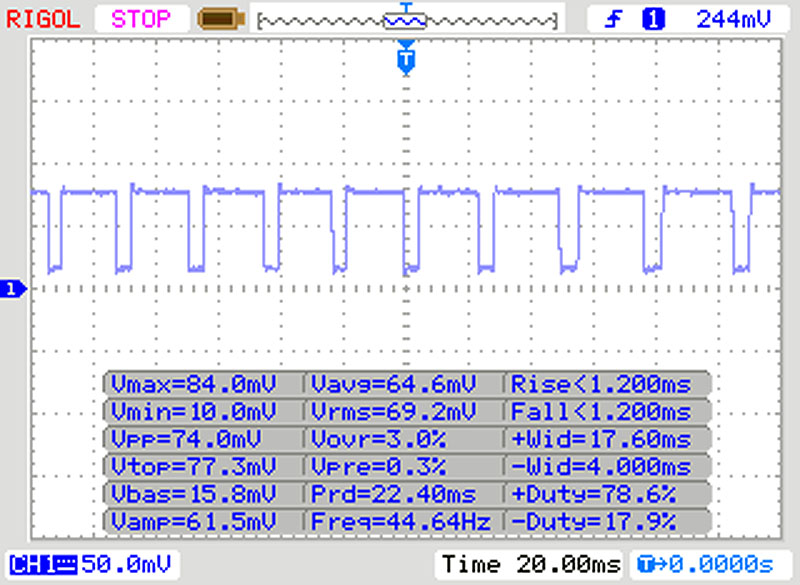 |
A luz de fundo da tela pisca em 44 Hz (pior caso, por exemplo, utilizando PWM) Cintilação detectada em uma configuração de brilho de 20 % e abaixo. Não deve haver cintilação ou PWM acima desta configuração de brilho. A frequência de 44 Hz é muito baixa, portanto a oscilação pode causar fadiga ocular e dores de cabeça após uso prolongado. [pwm_comparison] Em comparação: 52 % de todos os dispositivos testados não usam PWM para escurecer a tela. Se PWM foi detectado, uma média de 7757 (mínimo: 5 - máximo: 343500) Hz foi medida. | |||


| PCMark 8 Home Score Accelerated v2 | 3604 pontos | |
| PCMark 8 Work Score Accelerated v2 | 4842 pontos | |
| PCMark 10 Score | 3851 pontos | |
Ajuda | ||
| Asus ZenBook 14 UM431DA-AM020T SK hynix BC501 HFM512GDHTNG-8310A | Lenovo ThinkPad E595-20NF0000GE SK Hynix BC501 HFM512GDJTNG | Dell Inspiron 15 5000 5585 WDC PC SN520 SDAPNUW-512G | MSI Modern 14 A10RB-459US Kingston RBUSNS8154P3512GJ | HP Pavilion 14-ce3040ng Toshiba XG6 KXG60ZNV1T02 | Média SK hynix BC501 HFM512GDHTNG-8310A | |
|---|---|---|---|---|---|---|
| CrystalDiskMark 5.2 / 6 | 11% | -3% | 15% | 108% | 10% | |
| Write 4K (MB/s) | 118.8 | 129.5 9% | 105.9 -11% | 107.7 -9% | 181.6 53% | 110 ? -7% |
| Read 4K (MB/s) | 41.62 | 41.23 -1% | 36.56 -12% | 39.73 -5% | 57.4 38% | 40.6 ? -2% |
| Write Seq (MB/s) | 796 | 811 2% | 1165 46% | 926 16% | 1982 149% | 677 ? -15% |
| Read Seq (MB/s) | 1101 | 1145 4% | 423.2 -62% | 1014 -8% | 1899 72% | 1104 ? 0% |
| Write 4K Q32T1 (MB/s) | 234.7 | 314.1 34% | 332.1 41% | 343.6 46% | 509 117% | 438 ? 87% |
| Read 4K Q32T1 (MB/s) | 313.8 | 356.2 14% | 229.3 -27% | 499.1 59% | 545 74% | 338 ? 8% |
| Write Seq Q32T1 (MB/s) | 842 | 839 0% | 1460 73% | 1033 23% | 3072 265% | 860 ? 2% |
| Read Seq Q32T1 (MB/s) | 1645 | 2042 24% | 472.5 -71% | 1604 -2% | 3281 99% | 1786 ? 9% |
| AS SSD | 5% | -9% | -25% | 79% | 6% | |
| Seq Read (MB/s) | 1417 | 1698 20% | 398.9 -72% | 1061 -25% | 2762 95% | 1471 ? 4% |
| Seq Write (MB/s) | 781 | 740 -5% | 884 13% | 953 22% | 2493 219% | 612 ? -22% |
| 4K Read (MB/s) | 37.03 | 39.18 6% | 34.54 -7% | 35.59 -4% | 52.1 41% | 40.2 ? 9% |
| 4K Write (MB/s) | 80.1 | 87.7 9% | 82.1 2% | 87 9% | 147.5 84% | 108.8 ? 36% |
| 4K-64 Read (MB/s) | 740 | 764 3% | 647 -13% | 769 4% | 1473 99% | 794 ? 7% |
| 4K-64 Write (MB/s) | 748 | 669 -11% | 985 32% | 733 -2% | 1456 95% | 764 ? 2% |
| Access Time Read * (ms) | 0.047 | 0.04 15% | 0.072 -53% | 0.084 -79% | 0.094 -100% | 0.046 ? 2% |
| Access Time Write * (ms) | 0.045 | 0.036 20% | 0.047 -4% | 0.136 -202% | 0.03 33% | 0.03533 ? 21% |
| Score Read (Points) | 918 | 973 6% | 721 -21% | 911 -1% | 1801 96% | 981 ? 7% |
| Score Write (Points) | 906 | 831 -8% | 1155 27% | 916 1% | 1853 105% | 867 ? -4% |
| Score Total (Points) | 2270 | 2261 0% | 2279 0% | 2294 1% | 4568 101% | 2315 ? 2% |
| Média Total (Programa/Configurações) | 8% /
7% | -6% /
-6% | -5% /
-8% | 94% /
91% | 8% /
8% |
* ... menor é melhor

| 3DMark 11 Performance | 3449 pontos | |
| 3DMark Cloud Gate Standard Score | 11126 pontos | |
| 3DMark Fire Strike Score | 2028 pontos | |
Ajuda | ||
| baixo | média | alto | ultra | |
|---|---|---|---|---|
| BioShock Infinite (2013) | 93.8 | 60.7 | 49.72 | 17.4 |
| Dota 2 Reborn (2015) | 68.7 | 58.6 | 36 | 30.2 |
| Final Fantasy XV Benchmark (2018) | 16.1 | 8.1 |
Barulho
| Ocioso |
| 28 / 28 / 28 dB |
| Carga |
| 36.8 / 39 dB |
 | ||
30 dB silencioso 40 dB(A) audível 50 dB(A) ruidosamente alto |
||
min: | ||
(+) A temperatura máxima no lado superior é 37 °C / 99 F, em comparação com a média de 35.9 °C / 97 F , variando de 21.4 a 59 °C para a classe Subnotebook.
(+) A parte inferior aquece até um máximo de 36.3 °C / 97 F, em comparação com a média de 39.2 °C / 103 F
(+) Em uso inativo, a temperatura média para o lado superior é 23.4 °C / 74 F, em comparação com a média do dispositivo de 30.8 °C / ### class_avg_f### F.
(+) Os apoios para as mãos e o touchpad são mais frios que a temperatura da pele, com um máximo de 29.4 °C / 84.9 F e, portanto, são frios ao toque.
(±) A temperatura média da área do apoio para as mãos de dispositivos semelhantes foi 28.2 °C / 82.8 F (-1.2 °C / -2.1 F).
Asus ZenBook 14 UM431DA-AM020T análise de áudio
(-) | alto-falantes não muito altos (###valor### dB)
Graves 100 - 315Hz
(±) | graves reduzidos - em média 11% menor que a mediana
(±) | a linearidade dos graves é média (14% delta para a frequência anterior)
Médios 400 - 2.000 Hz
(±) | médios mais altos - em média 6.4% maior que a mediana
(+) | médios são lineares (3.7% delta para frequência anterior)
Altos 2 - 16 kHz
(+) | agudos equilibrados - apenas 3.3% longe da mediana
(+) | os máximos são lineares (6% delta da frequência anterior)
Geral 100 - 16.000 Hz
(±) | a linearidade do som geral é média (18.4% diferença em relação à mediana)
Comparado com a mesma classe
» 54% de todos os dispositivos testados nesta classe foram melhores, 7% semelhantes, 39% piores
» O melhor teve um delta de 5%, a média foi 18%, o pior foi 53%
Comparado com todos os dispositivos testados
» 41% de todos os dispositivos testados foram melhores, 8% semelhantes, 51% piores
» O melhor teve um delta de 4%, a média foi 23%, o pior foi 134%
Apple MacBook 12 (Early 2016) 1.1 GHz análise de áudio
(+) | os alto-falantes podem tocar relativamente alto (###valor### dB)
Graves 100 - 315Hz
(±) | graves reduzidos - em média 11.3% menor que a mediana
(±) | a linearidade dos graves é média (14.2% delta para a frequência anterior)
Médios 400 - 2.000 Hz
(+) | médios equilibrados - apenas 2.4% longe da mediana
(+) | médios são lineares (5.5% delta para frequência anterior)
Altos 2 - 16 kHz
(+) | agudos equilibrados - apenas 2% longe da mediana
(+) | os máximos são lineares (4.5% delta da frequência anterior)
Geral 100 - 16.000 Hz
(+) | o som geral é linear (10.2% diferença em relação à mediana)
Comparado com a mesma classe
» 7% de todos os dispositivos testados nesta classe foram melhores, 2% semelhantes, 90% piores
» O melhor teve um delta de 5%, a média foi 18%, o pior foi 53%
Comparado com todos os dispositivos testados
» 5% de todos os dispositivos testados foram melhores, 1% semelhantes, 94% piores
» O melhor teve um delta de 4%, a média foi 23%, o pior foi 134%
| desligado | |
| Ocioso | |
| Carga |
|
Key:
min: | |
| Asus ZenBook 14 UM431DA-AM020T R7 3700U, Vega 10, SK hynix BC501 HFM512GDHTNG-8310A, IPS, 1920x1080, 14" | Lenovo ThinkPad E595-20NF0000GE R7 3700U, Vega 10, SK Hynix BC501 HFM512GDJTNG, IPS, 1920x1080, 15.6" | Dell Inspiron 15 5000 5585 R7 3700U, Vega 10, WDC PC SN520 SDAPNUW-512G, IPS, 1920x1080, 15.6" | MSI Modern 14 A10RB-459US i5-10210U, GeForce MX250, Kingston RBUSNS8154P3512GJ, IPS, 1920x1080, 14" | HP Pavilion 14-ce3040ng i7-1065G7, GeForce MX250, Toshiba XG6 KXG60ZNV1T02, IPS, 1920x1080, 14" | Média AMD Radeon RX Vega 10 | Média da turma Subnotebook | |
|---|---|---|---|---|---|---|---|
| Power Consumption | 6% | 6% | -16% | -21% | -3% | -4% | |
| Idle Minimum * (Watt) | 3.6 | 4.2 -17% | 4.2 -17% | 4.2 -17% | 4 -11% | 4.73 ? -31% | 3.76 ? -4% |
| Idle Average * (Watt) | 7.2 | 7.92 -10% | 6.8 6% | 5.9 18% | 7 3% | 7.61 ? -6% | 6.54 ? 9% |
| Idle Maximum * (Watt) | 10.8 | 8.16 24% | 7 35% | 7.2 33% | 10 7% | 9.63 ? 11% | 7.89 ? 27% |
| Load Average * (Watt) | 38 | 29 24% | 36.5 4% | 63.4 -67% | 62 -63% | 33.3 ? 12% | 42 ? -11% |
| Load Maximum * (Watt) | 45.2 | 42.2 7% | 44 3% | 67.4 -49% | 64 -42% | 45.1 ? -0% | 64.8 ? -43% |
| Witcher 3 ultra * (Watt) | 37.9 | 53.5 | 58 |
* ... menor é melhor
| Asus ZenBook 14 UM431DA-AM020T R7 3700U, Vega 10, 47 Wh | Lenovo ThinkPad E595-20NF0000GE R7 3700U, Vega 10, 45 Wh | Dell Inspiron 15 5000 5585 R7 3700U, Vega 10, 42 Wh | MSI Modern 14 A10RB-459US i5-10210U, GeForce MX250, 50 Wh | HP Pavilion 14-ce3040ng i7-1065G7, GeForce MX250, 41 Wh | Média da turma Subnotebook | |
|---|---|---|---|---|---|---|
| Duração da bateria | -9% | -16% | 2% | -29% | 55% | |
| Reader / Idle (h) | 17.8 | 15.7 -12% | 14.3 -20% | 16.4 -8% | 11.6 -35% | 28.6 ? 61% |
| WiFi v1.3 (h) | 6.7 | 7.7 15% | 7 4% | 8.6 28% | 6.1 -9% | 14 ? 109% |
| Load (h) | 2.1 | 1.5 -29% | 1.4 -33% | 1.8 -14% | 1.2 -43% | 1.969 ? -6% |
Pro
Contra
Veredicto - Design bonito com CPU mais lenta
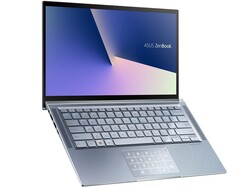
Com o Asus ZenBook 14 UM431DA, os compradores adquirem um portátil com um ótimo design e fácil de transportar por um preço comparativamente baixo. A carcaça parece de alta qualidade e vários elementos decorativos dão a impressão de que é mais caro. Além disso, há o recurso do teclado numérico integrado, que acabou sendo uma adição útil ao teclado. A configuração de portas é sólida e, embora o Wi-Fi 5 não seja um grande salto, as conexões sem fio ainda são rápidas e atualizadas.
O ZenBook 14 é um portátil sólido com um design atraente. Infelizmente, ele só pode explorar o poder de sua CPU moderadamente.
No entanto, os possíveis compradores não devem se limitar a esse modelo com a Ryzen 7 3700U, mas podem optar com confiança pela próxima CPU mais fraca. Como o sistema de resfriamento pode suportar o desempenho pleno apenas durante um curto período, o desempenho a longo prazo está bem abaixo das expectativas que estabelecemos para este processador. Como a memória não pode ser atualizada, seu tamanho também precisa ser levado em consideração na determinação de um modelo adequado antes da compra. Se você está interessado principalmente no design e nos números, e não necessariamente no desempenho real, ainda pode comprar este portátil sem hesitar.
Asus ZenBook 14 UM431DA-AM020T
- 02/11/2020 v7 (old)
Mike Wobker