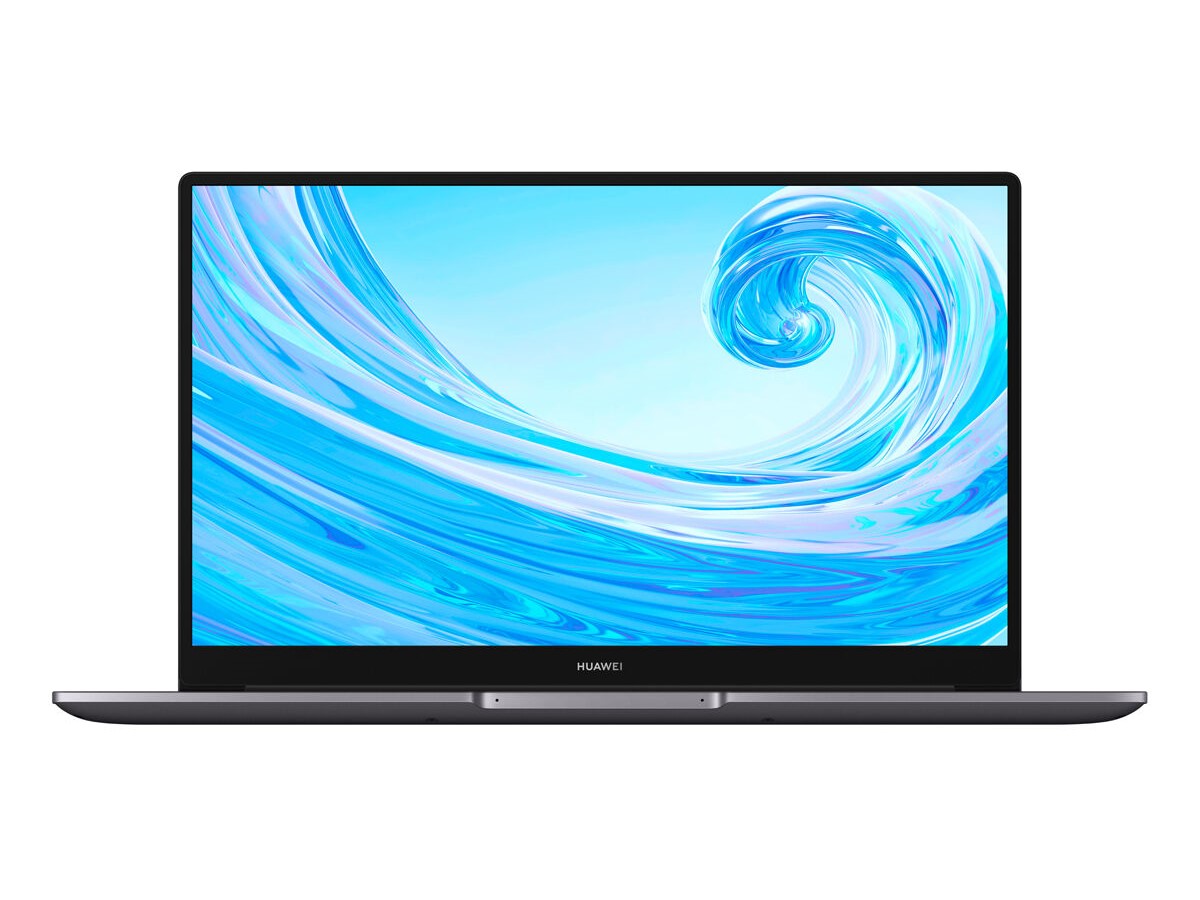
Breve Análise do Portátil Huawei MateBook D 15: Ainda um bom portátil com AMD
Avaliação | Data | Modelo | Peso | Altura | Size | Resolução | Preço |
|---|---|---|---|---|---|---|---|
| 85.2 % v7 (old) | 03/2020 | Huawei MateBook D 15-53010TUY R5 3500U, Vega 8 | 1.5 kg | 16.9 mm | 15.60" | 1920x1080 | |
| 78.4 % v7 (old) | 11/2019 | Acer Aspire 5 A515-43-R6WW R5 3500U, Vega 8 | 1.8 kg | 18 mm | 15.60" | 1920x1080 | |
| 81.8 % v7 (old) | 02/2020 | Lenovo ThinkBook 15 i5-10210U, UHD Graphics 620 | 1.9 kg | 18.9 mm | 15.60" | 1920x1080 | |
| 78.5 % v7 (old) | 02/2020 | HP 15s-fq1556ng i5-1035G1, UHD Graphics G1 (Ice Lake 32 EU) | 1.7 kg | 18 mm | 15.60" | 1920x1080 | |
| 87.3 % v7 (old) | 03/2020 | Huawei MateBook D 14-53010TVS R5 3500U, Vega 8 | 1.4 kg | 16 mm | 14.00" | 1920x1080 |


| |||||||||||||||||||||||||
iluminação: 90 %
iluminação com acumulador: 271 cd/m²
Contraste: 1807:1 (Preto: 0.15 cd/m²)
ΔE ColorChecker Calman: 4.7 | ∀{0.5-29.43 Ø4.73}
calibrated: 4.6
ΔE Greyscale Calman: 1.6 | ∀{0.09-98 Ø4.97}
60.6% sRGB (Argyll 1.6.3 3D)
38.5% AdobeRGB 1998 (Argyll 1.6.3 3D)
41.84% AdobeRGB 1998 (Argyll 3D)
60.9% sRGB (Argyll 3D)
40.49% Display P3 (Argyll 3D)
Gamma: 2.17
CCT: 6649 K
| Huawei MateBook D 15-53010TUY AU Optronics AUO28ED, IPS, 1920x1080, 15.6" | Acer Aspire 5 A515-43-R6WW CEC PANDA LM156LF-CL07, IPS, 1920x1080, 15.6" | Huawei MateBook D 14 W50F BOE0764 / TV140FHM-NH0, IPS, 1920x1080, 14" | Lenovo ThinkBook 15 LP156WFC-SPD1, IPS, 1920x1080, 15.6" | HP 15s-fq1556ng AU Optronics B156HW02, IPS, 1920x1080, 15.6" | |
|---|---|---|---|---|---|
| Display | -2% | 6% | -5% | -7% | |
| Display P3 Coverage (%) | 40.49 | 39.53 -2% | 43.19 7% | 38.38 -5% | 37.66 -7% |
| sRGB Coverage (%) | 60.9 | 59.5 -2% | 64 5% | 57.7 -5% | 56.4 -7% |
| AdobeRGB 1998 Coverage (%) | 41.84 | 40.84 -2% | 44.62 7% | 39.67 -5% | 38.91 -7% |
| Response Times | 19% | -7% | 12% | -10% | |
| Response Time Grey 50% / Grey 80% * (ms) | 43.6 ? | 36 ? 17% | 41 ? 6% | 37.6 ? 14% | 51 ? -17% |
| Response Time Black / White * (ms) | 31.2 ? | 25 ? 20% | 37 ? -19% | 28 ? 10% | 32 ? -3% |
| PWM Frequency (Hz) | 178 ? | 200 ? | |||
| Screen | -38% | -29% | -24% | -23% | |
| Brightness middle (cd/m²) | 271 | 250 -8% | 291 7% | 245 -10% | 254 -6% |
| Brightness (cd/m²) | 256 | 228 -11% | 276 8% | 239 -7% | 234 -9% |
| Brightness Distribution (%) | 90 | 83 -8% | 85 -6% | 82 -9% | 86 -4% |
| Black Level * (cd/m²) | 0.15 | 0.205 -37% | 0.46 -207% | 0.25 -67% | 0.18 -20% |
| Contrast (:1) | 1807 | 1220 -32% | 633 -65% | 980 -46% | 1411 -22% |
| Colorchecker dE 2000 * | 4.7 | 5.65 -20% | 4.3 9% | 5.6 -19% | 5.58 -19% |
| Colorchecker dE 2000 max. * | 20.4 | 13.7 33% | 10.01 51% | 15.6 24% | 9.83 52% |
| Colorchecker dE 2000 calibrated * | 4.6 | 3.18 31% | 4.8 -4% | 4.53 2% | |
| Greyscale dE 2000 * | 1.6 | 6.32 -295% | 4.21 -163% | 3.4 -113% | 5.02 -214% |
| Gamma | 2.17 101% | 2.45 90% | 2.46 89% | 2.3 96% | 2.83 78% |
| CCT | 6649 98% | 7287 89% | 6867 95% | 7156 91% | 6570 99% |
| Color Space (Percent of AdobeRGB 1998) (%) | 38.5 | 38 -1% | 41 6% | 36.5 -5% | 36 -6% |
| Color Space (Percent of sRGB) (%) | 60.6 | 59 -3% | 64 6% | 57.5 -5% | 56 -8% |
| Média Total (Programa/Configurações) | -7% /
-23% | -10% /
-20% | -6% /
-16% | -13% /
-18% |
* ... menor é melhor
Exibir tempos de resposta
| ↔ Tempo de resposta preto para branco | ||
|---|---|---|
| 31.2 ms ... ascensão ↗ e queda ↘ combinadas | ↗ 18 ms ascensão | 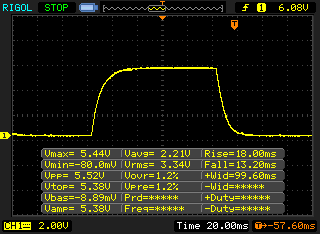 |
| ↘ 13.2 ms queda | ||
| A tela mostra taxas de resposta lentas em nossos testes e será insatisfatória para os jogadores. Em comparação, todos os dispositivos testados variam de 0.1 (mínimo) a 240 (máximo) ms. » 84 % de todos os dispositivos são melhores. Isso significa que o tempo de resposta medido é pior que a média de todos os dispositivos testados (19.9 ms). | ||
| ↔ Tempo de resposta 50% cinza a 80% cinza | ||
| 43.6 ms ... ascensão ↗ e queda ↘ combinadas | ↗ 20.4 ms ascensão | 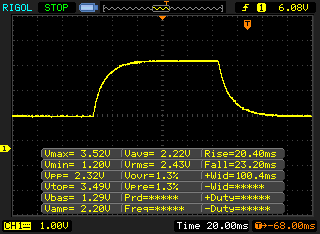 |
| ↘ 23.2 ms queda | ||
| A tela mostra taxas de resposta lentas em nossos testes e será insatisfatória para os jogadores. Em comparação, todos os dispositivos testados variam de 0.165 (mínimo) a 636 (máximo) ms. » 73 % de todos os dispositivos são melhores. Isso significa que o tempo de resposta medido é pior que a média de todos os dispositivos testados (31.1 ms). | ||
Cintilação da tela / PWM (modulação por largura de pulso)
| Tela tremeluzindo / PWM não detectado | 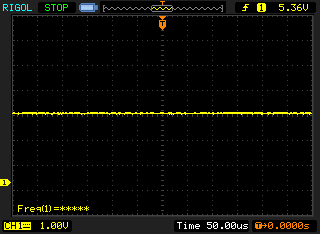 | ||
[pwm_comparison] Em comparação: 52 % de todos os dispositivos testados não usam PWM para escurecer a tela. Se PWM foi detectado, uma média de 7784 (mínimo: 5 - máximo: 343500) Hz foi medida. | |||
| PCMark 8 Home Score Accelerated v2 | 3641 pontos | |
| PCMark 8 Work Score Accelerated v2 | 4699 pontos | |
| PCMark 10 Score | 3743 pontos | |
Ajuda | ||
| Huawei MateBook D 15-53010TUY Samsung SSD PM981 MZVLB256HAHQ | Acer Aspire 5 A515-43-R6WW Intel SSD 660p 1TB SSDPEKNW010T8 | Lenovo ThinkBook 15 Samsung SSD PM981 MZVLB512HAJQ | HP 15s-fq1556ng Intel SSD 660p SSDPEKNW512G8 | Média Samsung SSD PM981 MZVLB256HAHQ | |
|---|---|---|---|---|---|
| CrystalDiskMark 5.2 / 6 | -17% | 30% | 7% | 43% | |
| Write 4K (MB/s) | 134.8 | 114.9 -15% | 176.3 31% | 203.1 51% | 116.1 ? -14% |
| Read 4K (MB/s) | 41.68 | 52.7 26% | 48.98 18% | 65.3 57% | 189.5 ? 355% |
| Write Seq (MB/s) | 1651 | 1361 -18% | 1789 8% | 973 -41% | 1409 ? -15% |
| Read Seq (MB/s) | 2300 | 1385 -40% | 1671 -27% | 1651 -28% | 1624 ? -29% |
| Write 4K Q32T1 (MB/s) | 260 | 181.1 -30% | 433.5 67% | 526 102% | 360 ? 38% |
| Read 4K Q32T1 (MB/s) | 335.1 | 340.5 2% | 526 57% | 345.2 3% | 396 ? 18% |
| Write Seq Q32T1 (MB/s) | 1641 | 1519 -7% | 2983 82% | 980 -40% | 1492 ? -9% |
| Read Seq Q32T1 (MB/s) | 3452 | 1515 -56% | 3555 3% | 1883 -45% | 3313 ? -4% |
| Write 4K Q8T8 (MB/s) | 1688 | 1152 ? | |||
| Read 4K Q8T8 (MB/s) | 1036 | 736 ? | |||
| AS SSD | -30% | 34% | -19% | -12% | |
| Seq Read (MB/s) | 2613 | 1358 -48% | 2564 -2% | 1705 -35% | 2032 ? -22% |
| Seq Write (MB/s) | 1549 | 1300 -16% | 2268 46% | 904 -42% | 1339 ? -14% |
| 4K Read (MB/s) | 47.15 | 44.88 -5% | 57 21% | 58.5 24% | 46.1 ? -2% |
| 4K Write (MB/s) | 111.6 | 77.5 -31% | 141.4 27% | 165.4 48% | 107.4 ? -4% |
| 4K-64 Read (MB/s) | 748 | 586 -22% | 1175 57% | 323.1 -57% | 712 ? -5% |
| 4K-64 Write (MB/s) | 1275 | 738 -42% | 1665 31% | 827 -35% | 999 ? -22% |
| Access Time Read * (ms) | 0.062 | 0.032 48% | 0.056 10% | 0.07076 ? -14% | |
| Access Time Write * (ms) | 0.042 | 0.057 -36% | 0.025 40% | 0.044 -5% | 0.04352 ? -4% |
| Score Read (Points) | 1057 | 767 -27% | 1488 41% | 522 -51% | 961 ? -9% |
| Score Write (Points) | 1542 | 945 -39% | 2033 32% | 1083 -30% | 1240 ? -20% |
| Score Total (Points) | 3097 | 2115 -32% | 4279 38% | 1901 -39% | 2671 ? -14% |
| Média Total (Programa/Configurações) | -24% /
-24% | 32% /
33% | -6% /
-8% | 16% /
11% |
* ... menor é melhor

| 3DMark 11 Performance | 3950 pontos | |
| 3DMark Cloud Gate Standard Score | 13455 pontos | |
| 3DMark Fire Strike Score | 2339 pontos | |
Ajuda | ||
| BioShock Infinite - 1920x1080 Ultra Preset, DX11 (DDOF) | |
| Huawei MateBook D 14-53010TVS | |
| Huawei MateBook D 15-53010TUY | |
| Média AMD Radeon RX Vega 8 (Ryzen 2000/3000) (7.6 - 28, n=30) | |
| Acer Aspire 5 A515-43-R6WW | |
| HP 15s-fq1556ng | |
| Lenovo ThinkBook 15 | |
| Huawei MateBook D 14 W50F | |
| Final Fantasy XV Benchmark | |
| 1920x1080 Standard Quality | |
| Média da turma Subnotebook (15.1 - 75.2, n=54, últimos 2 anos) | |
| Huawei MateBook D 15-53010TUY | |
| Média AMD Radeon RX Vega 8 (Ryzen 2000/3000) (6.22 - 14, n=10) | |
| HP 15s-fq1556ng | |
| 1280x720 Lite Quality | |
| Média da turma Subnotebook (21.4 - 129.8, n=55, últimos 2 anos) | |
| Huawei MateBook D 15-53010TUY | |
| Média AMD Radeon RX Vega 8 (Ryzen 2000/3000) (13.4 - 27.8, n=11) | |
| HP 15s-fq1556ng | |
| baixo | média | alto | ultra | |
|---|---|---|---|---|
| BioShock Infinite (2013) | 118.8 | 21.01 | ||
| Dota 2 Reborn (2015) | 70.5 | 58.3 | 38.8 | 36.2 |
| Final Fantasy XV Benchmark (2018) | 22.96 | 11.42 | ||
| X-Plane 11.11 (2018) | 26.3 | 19.4 | 16.3 |
Barulho
| Ocioso |
| 29.6 / 29.6 / 29.6 dB |
| Carga |
| 30.6 / 33.8 dB |
 | ||
30 dB silencioso 40 dB(A) audível 50 dB(A) ruidosamente alto |
||
min: | ||
(+) A temperatura máxima no lado superior é 39.3 °C / 103 F, em comparação com a média de 35.9 °C / 97 F , variando de 21.4 a 59 °C para a classe Subnotebook.
(-) A parte inferior aquece até um máximo de 45.6 °C / 114 F, em comparação com a média de 39.2 °C / 103 F
(+) Em uso inativo, a temperatura média para o lado superior é 24.2 °C / 76 F, em comparação com a média do dispositivo de 30.8 °C / ### class_avg_f### F.
(+) Os apoios para as mãos e o touchpad estão atingindo a temperatura máxima da pele (32.5 °C / 90.5 F) e, portanto, não estão quentes.
(-) A temperatura média da área do apoio para as mãos de dispositivos semelhantes foi 28.2 °C / 82.8 F (-4.3 °C / -7.7 F).
Huawei MateBook D 15-53010TUY análise de áudio
(-) | alto-falantes não muito altos (###valor### dB)
Graves 100 - 315Hz
(±) | graves reduzidos - em média 13.5% menor que a mediana
(±) | a linearidade dos graves é média (13.5% delta para a frequência anterior)
Médios 400 - 2.000 Hz
(+) | médios equilibrados - apenas 4% longe da mediana
(+) | médios são lineares (4.5% delta para frequência anterior)
Altos 2 - 16 kHz
(+) | agudos equilibrados - apenas 3.7% longe da mediana
(±) | a linearidade dos máximos é média (7.2% delta para frequência anterior)
Geral 100 - 16.000 Hz
(±) | a linearidade do som geral é média (22.1% diferença em relação à mediana)
Comparado com a mesma classe
» 75% de todos os dispositivos testados nesta classe foram melhores, 6% semelhantes, 19% piores
» O melhor teve um delta de 5%, a média foi 18%, o pior foi 53%
Comparado com todos os dispositivos testados
» 64% de todos os dispositivos testados foram melhores, 6% semelhantes, 30% piores
» O melhor teve um delta de 4%, a média foi 24%, o pior foi 134%
Lenovo ThinkBook 15 análise de áudio
(-) | alto-falantes não muito altos (###valor### dB)
Graves 100 - 315Hz
(-) | quase nenhum baixo - em média 18.4% menor que a mediana
(±) | a linearidade dos graves é média (7.3% delta para a frequência anterior)
Médios 400 - 2.000 Hz
(±) | médios mais altos - em média 8.1% maior que a mediana
(±) | a linearidade dos médios é média (12.5% delta para frequência anterior)
Altos 2 - 16 kHz
(±) | máximos mais altos - em média 6.1% maior que a mediana
(±) | a linearidade dos máximos é média (13.1% delta para frequência anterior)
Geral 100 - 16.000 Hz
(-) | o som geral não é linear (38.1% diferença em relação à mediana)
Comparado com a mesma classe
» 98% de todos os dispositivos testados nesta classe foram melhores, 1% semelhantes, 1% piores
» O melhor teve um delta de 7%, a média foi 21%, o pior foi 53%
Comparado com todos os dispositivos testados
» 95% de todos os dispositivos testados foram melhores, 1% semelhantes, 5% piores
» O melhor teve um delta de 4%, a média foi 24%, o pior foi 134%
| desligado | |
| Ocioso | |
| Carga |
|
Key:
min: | |
| Huawei MateBook D 15-53010TUY R5 3500U, Vega 8, Samsung SSD PM981 MZVLB256HAHQ, IPS, 1920x1080, 15.6" | Acer Aspire 5 A515-43-R6WW R5 3500U, Vega 8, Intel SSD 660p 1TB SSDPEKNW010T8, IPS, 1920x1080, 15.6" | Lenovo ThinkBook 15 i5-10210U, UHD Graphics 620, Samsung SSD PM981 MZVLB512HAJQ, IPS, 1920x1080, 15.6" | HP 15s-fq1556ng i5-1035G1, UHD Graphics G1 (Ice Lake 32 EU), Intel SSD 660p SSDPEKNW512G8, IPS, 1920x1080, 15.6" | Huawei MateBook D 14 W50F i5-8250U, UHD Graphics 620, SanDisk SD9SN8W256G1027, IPS, 1920x1080, 14" | Média AMD Radeon RX Vega 8 (Ryzen 2000/3000) | Média da turma Subnotebook | |
|---|---|---|---|---|---|---|---|
| Power Consumption | 22% | 9% | 26% | 24% | 0% | 7% | |
| Idle Minimum * (Watt) | 5.2 | 3.7 29% | 3.5 33% | 3.3 37% | 3.7 29% | 5.68 ? -9% | 3.82 ? 27% |
| Idle Average * (Watt) | 8.8 | 6.2 30% | 7.1 19% | 6.4 27% | 6.9 22% | 8.75 ? 1% | 6.61 ? 25% |
| Idle Maximum * (Watt) | 10.2 | 8.4 18% | 7.8 24% | 6.8 33% | 8.4 18% | 10.1 ? 1% | 7.99 ? 22% |
| Load Average * (Watt) | 37.5 | 31.1 17% | 38.9 -4% | 29 23% | 32 15% | 37.8 ? -1% | 41.9 ? -12% |
| Load Maximum * (Watt) | 50.9 | 43.1 15% | 65.4 -28% | 46 10% | 32.6 36% | 46.2 ? 9% | 64.1 ? -26% |
* ... menor é melhor
| Huawei MateBook D 15-53010TUY R5 3500U, Vega 8, 42 Wh | Acer Aspire 5 A515-43-R6WW R5 3500U, Vega 8, 48 Wh | Lenovo ThinkBook 15 i5-10210U, UHD Graphics 620, 45 Wh | HP 15s-fq1556ng i5-1035G1, UHD Graphics G1 (Ice Lake 32 EU), 41 Wh | Huawei MateBook D 14 W50F i5-8250U, UHD Graphics 620, 57 Wh | Média da turma Subnotebook | |
|---|---|---|---|---|---|---|
| Duração da bateria | 35% | 1% | 4% | 49% | 65% | |
| WiFi v1.3 (h) | 7.8 | 7.8 0% | 6.8 -13% | 6 -23% | 10 28% | 14 ? 79% |
| Load (h) | 1.3 | 2.2 69% | 1.5 15% | 1.7 31% | 2.2 69% | 1.946 ? 50% |
Pro
Contra
Veredicto - Uma CPU de portátil deveria funcionar assim
Com o MateBook D 15, a Huawei obteve sucesso onde muitos outros fabricantes falham por um grande número de razões. A CPU do D 15 não se afoga mesmo quando está funcionando com a energia da bateria. Aqui, o processador continuará funcionando a toda velocidade até a bateria acabar. Por isso, o consumo de energia aumentou um pouco. No entanto, por que você compraria um processador poderoso se nunca pretendeu usá-lo? Além disso, a Huawei implementou uma solução de refrigeração adaptada especificamente a esse tipo de hardware, e é por isso que o sistema produz tão pouco ruído.
O Huawei MateBook D 15 oferece uma CPU que não se afoga e produz muito pouco ruído do ventilador.
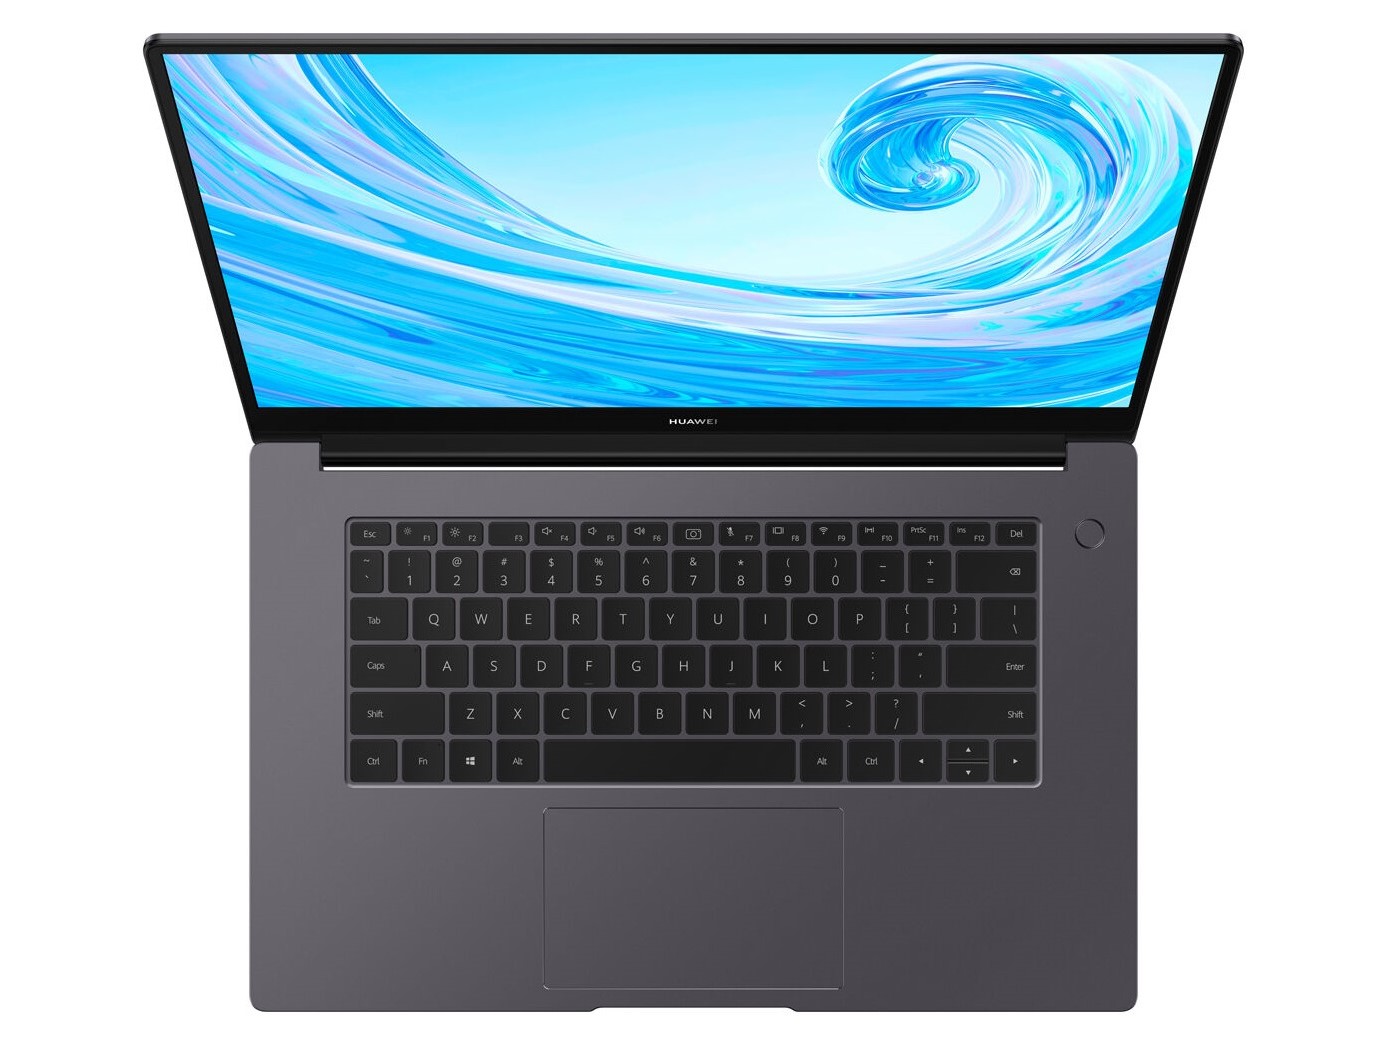
O restante do hardware é bastante padrão e a única coisa que podemos criticar é o teclado. É adequado para longas sessões de digitação, mas aqueles que costumam usar as teclas "home" e "fim" sentirão muita falta delas. Além disso, também esperávamos ver pelo menos uma simples luz de fundo do teclado com um dispositivo como este. No final das contas, os compradores que estão no mercado por um portátil fino e poderoso não ficarão desapontados com o Huawei MateBook D 15.
Huawei MateBook D 15-53010TUY
- 03/05/2020 v7 (old)
Mike Wobker