Breve Análise do Portátil Huawei MateBook D (i7-7500U, GeForce 940MX)
Os Top 10
» Os Top 10 Portáteis Multimídia
» Os Top 10 Portáteis de Jogos
» Os Top 10 Portáteis Leves para Jogos
» Os Top 10 Portáteis Acessíveis de Escritório/Empresariais
» Os Top 10 Portáteis Premium de Escritório/Empresariais
» Os Top 10 dos Portáteis Workstation
» Os Top 10 Subportáteis
» Os Top 10 Ultrabooks
» Os Top 10 Conversíveis
» Os Top 10 Tablets
» Os Top 10 Smartphones
» A melhores Telas de Portáteis Analisadas Pela Notebookcheck
» Top 10 dos portáteis abaixo dos 500 Euros da Notebookcheck
» Top 10 dos Portáteis abaixo dos 300 Euros
| |||||||||||||||||||||||||
iluminação: 92 %
iluminação com acumulador: 268 cd/m²
Contraste: 570:1 (Preto: 0.47 cd/m²)
ΔE ColorChecker Calman: 5.7 | ∀{0.5-29.43 Ø4.77}
ΔE Greyscale Calman: 4.2 | ∀{0.09-98 Ø5}
61.5% sRGB (Argyll 1.6.3 3D)
43.2% AdobeRGB 1998 (Argyll 1.6.3 3D)
43.17% AdobeRGB 1998 (Argyll 3D)
61.5% sRGB (Argyll 3D)
41.79% Display P3 (Argyll 3D)
Gamma: 2.3
CCT: 6820 K
| Huawei MateBook D 15, i7-7500U 940MX BOE070C, IPS, 15.6", 1920x1080 | Asus VivoBook S15 S510UA ID: LGD0573, Name: LG Display LP156WF9-SPK2, IPS, 15.6", 1920x1080 | HP Envy 15-as133cl Chi Mei CMN15D8, IPS, 15.6", 1920x1080 | Dell XPS 15 9560 (i7-7700HQ, UHD) IGZO IPS, 15.6", 3840x2160 | Lenovo ThinkPad T570-20H90002GE N156HCA-EAA, IPS, 15.6", 1920x1080 | |
|---|---|---|---|---|---|
| Display | -4% | 4% | 103% | 6% | |
| Display P3 Coverage (%) | 41.79 | 39.9 -5% | 42.95 3% | 89.7 115% | 44.08 5% |
| sRGB Coverage (%) | 61.5 | 59.5 -3% | 64.3 5% | 100 63% | 65.6 7% |
| AdobeRGB 1998 Coverage (%) | 43.17 | 41.11 -5% | 44.41 3% | 100 132% | 45.66 6% |
| Response Times | 23% | 11% | -15% | 27% | |
| Response Time Grey 50% / Grey 80% * (ms) | 46.4 ? | 38.4 ? 17% | 44.4 ? 4% | 57.2 ? -23% | 41.6 ? 10% |
| Response Time Black / White * (ms) | 36.8 ? | 26.4 ? 28% | 30 ? 18% | 39.2 ? -7% | 20.8 ? 43% |
| PWM Frequency (Hz) | 21190 | 1000 ? | 962 | 26040 ? | |
| Screen | 13% | 16% | 39% | 22% | |
| Brightness middle (cd/m²) | 268 | 277.5 4% | 262.3 -2% | 370.1 38% | 262 -2% |
| Brightness (cd/m²) | 258 | 265 3% | 240 -7% | 356 38% | 245 -5% |
| Brightness Distribution (%) | 92 | 89 -3% | 83 -10% | 87 -5% | 89 -3% |
| Black Level * (cd/m²) | 0.47 | 0.35 26% | 0.24 49% | 0.37 21% | 0.24 49% |
| Contrast (:1) | 570 | 793 39% | 1093 92% | 1000 75% | 1092 92% |
| Colorchecker dE 2000 * | 5.7 | 4.8 16% | 5 12% | 5.3 7% | 4.5 21% |
| Colorchecker dE 2000 max. * | 21.7 | 17.8 18% | 20.6 5% | 9.9 54% | 10.5 52% |
| Greyscale dE 2000 * | 4.2 | 3 29% | 3.2 24% | 4.6 -10% | 3.5 17% |
| Gamma | 2.3 96% | 2.39 92% | 2.45 90% | 2.31 95% | 2.32 95% |
| CCT | 6820 95% | 6854 95% | 6817 95% | 6284 103% | 6524 100% |
| Color Space (Percent of AdobeRGB 1998) (%) | 43.2 | 37.7 -13% | 40.5 -6% | 88.3 104% | 42.04 -3% |
| Color Space (Percent of sRGB) (%) | 61.5 | 69.3 13% | 63.5 3% | 100 63% | 65.4 6% |
| Média Total (Programa/Configurações) | 11% /
11% | 10% /
13% | 42% /
44% | 18% /
20% |
* ... menor é melhor
Exibir tempos de resposta
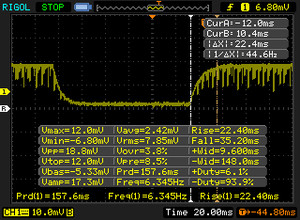
| ↔ Tempo de resposta preto para branco | ||
|---|---|---|
| 36.8 ms ... ascensão ↗ e queda ↘ combinadas | ↗ 22.4 ms ascensão | |
| ↘ 14.4 ms queda | ||
| A tela mostra taxas de resposta lentas em nossos testes e será insatisfatória para os jogadores. Em comparação, todos os dispositivos testados variam de 0.1 (mínimo) a 240 (máximo) ms. » 95 % de todos os dispositivos são melhores. Isso significa que o tempo de resposta medido é pior que a média de todos os dispositivos testados (20.2 ms). | ||
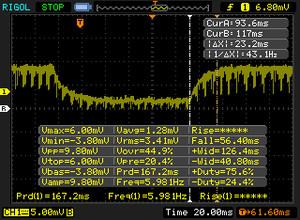
| ↔ Tempo de resposta 50% cinza a 80% cinza | ||
| 46.4 ms ... ascensão ↗ e queda ↘ combinadas | ↗ 23.2 ms ascensão | |
| ↘ 23.2 ms queda | ||
| A tela mostra taxas de resposta lentas em nossos testes e será insatisfatória para os jogadores. Em comparação, todos os dispositivos testados variam de 0.165 (mínimo) a 636 (máximo) ms. » 80 % de todos os dispositivos são melhores. Isso significa que o tempo de resposta medido é pior que a média de todos os dispositivos testados (31.5 ms). | ||
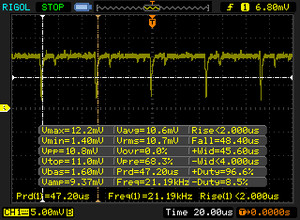
Cintilação da tela / PWM (modulação por largura de pulso)
| Tela tremeluzindo/PWM detectado | 21190 Hz | ||
A luz de fundo da tela pisca em 21190 Hz (pior caso, por exemplo, utilizando PWM) . A frequência de 21190 Hz é bastante alta, então a maioria dos usuários sensíveis ao PWM não deve notar nenhuma oscilação. [pwm_comparison] Em comparação: 53 % de todos os dispositivos testados não usam PWM para escurecer a tela. Se PWM foi detectado, uma média de 8070 (mínimo: 5 - máximo: 343500) Hz foi medida. | |||
| Cinebench R15 | |
| CPU Single 64Bit | |
| Dell XPS 15 9560 (i7-7700HQ, UHD) | |
| Huawei MateBook D 15, i7-7500U 940MX | |
| Acer TravelMate P658-G2-MG-7327 | |
| HP Envy 15-as133cl | |
| Asus VivoBook S15 S510UA | |
| Lenovo ThinkPad T570-20H90002GE | |
| CPU Multi 64Bit | |
| Dell XPS 15 9560 (i7-7700HQ, UHD) | |
| Acer TravelMate P658-G2-MG-7327 | |
| HP Envy 15-as133cl | |
| Huawei MateBook D 15, i7-7500U 940MX | |
| Asus VivoBook S15 S510UA | |
| Lenovo ThinkPad T570-20H90002GE | |
| Cinebench R10 | |
| Rendering Multiple CPUs 32Bit | |
| Dell XPS 15 9560 (i7-7700HQ, UHD) | |
| Acer TravelMate P658-G2-MG-7327 | |
| HP Envy 15-as133cl | |
| Huawei MateBook D 15, i7-7500U 940MX | |
| Asus VivoBook S15 S510UA | |
| Rendering Single 32Bit | |
| Dell XPS 15 9560 (i7-7700HQ, UHD) | |
| Huawei MateBook D 15, i7-7500U 940MX | |
| Acer TravelMate P658-G2-MG-7327 | |
| HP Envy 15-as133cl | |
| Asus VivoBook S15 S510UA | |
| wPrime 2.10 - 1024m | |
| Huawei MateBook D 15, i7-7500U 940MX | |
| Asus VivoBook S15 S510UA | |
| HP Envy 15-as133cl | |
| Dell XPS 15 9560 (i7-7700HQ, UHD) | |
* ... menor é melhor
| PCMark 8 Home Score Accelerated v2 | 3721 pontos | |
| PCMark 8 Creative Score Accelerated v2 | 4615 pontos | |
| PCMark 8 Work Score Accelerated v2 | 4860 pontos | |
| PCMark 10 Score | 3081 pontos | |
Ajuda | ||
| Huawei MateBook D 15, i7-7500U 940MX SanDisk SD8SN8U128G1027 | Asus VivoBook S15 S510UA Toshiba HG6 THNSNJ128G8NY | HP Envy 15-as133cl HGST Travelstar 5K1000 HTS541010A7E630 | Dell XPS 15 9560 (i7-7700HQ, UHD) Lite-On CX2-8B512-Q11 | Lenovo ThinkPad T570-20H90002GE Samsung PM961 MZVLW256HEHP | Acer TravelMate P658-G2-MG-7327 Liteonit CV3-8D512 | |
|---|---|---|---|---|---|---|
| CrystalDiskMark 3.0 | 3% | -88% | 195% | 175% | 6% | |
| Write 4k QD32 (MB/s) | 123.2 | 94.3 -23% | 1.015 -99% | 398.1 223% | 426.4 246% | 248.8 102% |
| Read 4k QD32 (MB/s) | 368.5 | 250.3 -32% | 0.828 -100% | 509 38% | 510 38% | 354.8 -4% |
| Write 4k (MB/s) | 82.7 | 64.6 -22% | 1.008 -99% | 134.1 62% | 130.6 58% | 68.8 -17% |
| Read 4k (MB/s) | 36.84 | 19.48 -47% | 0.366 -99% | 45.14 23% | 56.6 54% | 25.74 -30% |
| Write 512 (MB/s) | 181.4 | 342 89% | 46.3 -74% | 1119 517% | 860 374% | 246.3 36% |
| Read 512 (MB/s) | 331.2 | 417.7 26% | 31.46 -91% | 977 195% | 933 182% | 227.1 -31% |
| Write Seq (MB/s) | 314.9 | 396 26% | 102.6 -67% | 1106 251% | 1166 270% | 256.9 -18% |
| Read Seq (MB/s) | 478.4 | 503 5% | 103.2 -78% | 1684 252% | 1318 176% | 526 10% |
| 3DMark 11 | |
| 1280x720 Performance GPU | |
| Huawei MateBook D 15, i7-7500U 940MX | |
| HP Spectre x360 15-bl002xx | |
| Acer TravelMate P658-G2-MG-7327 | |
| HP Envy 15-as133cl | |
| Asus VivoBook S15 S510UA | |
| Lenovo ThinkPad T570-20H90002GE | |
| 1280x720 Performance Combined | |
| Huawei MateBook D 15, i7-7500U 940MX | |
| HP Spectre x360 15-bl002xx | |
| Acer TravelMate P658-G2-MG-7327 | |
| HP Envy 15-as133cl | |
| Asus VivoBook S15 S510UA | |
| Lenovo ThinkPad T570-20H90002GE | |
| 3DMark 11 Performance | 3072 pontos | |
| 3DMark Cloud Gate Standard Score | 8715 pontos | |
| 3DMark Fire Strike Score | 2189 pontos | |
Ajuda | ||
| Rise of the Tomb Raider | |
| 1920x1080 Very High Preset AA:FX AF:16x (classificar por valor) | |
| Huawei MateBook D 15, i7-7500U 940MX | |
| Dell XPS 15 9560 (i7-7700HQ, UHD) | |
| HP Spectre x360 15-bl002xx | |
| 1920x1080 High Preset AA:FX AF:4x (classificar por valor) | |
| Huawei MateBook D 15, i7-7500U 940MX | |
| Dell XPS 15 9560 (i7-7700HQ, UHD) | |
| HP Spectre x360 15-bl002xx | |
| 1366x768 Medium Preset AF:2x (classificar por valor) | |
| Huawei MateBook D 15, i7-7500U 940MX | |
| HP Envy 15-as133cl | |
| Dell XPS 15 9560 (i7-7700HQ, UHD) | |
| HP Spectre x360 15-bl002xx | |
| 1024x768 Lowest Preset (classificar por valor) | |
| Huawei MateBook D 15, i7-7500U 940MX | |
| HP Envy 15-as133cl | |
| Lenovo ThinkPad T570-20H90002GE | |
| HP Spectre x360 15-bl002xx | |
| baixo | média | alto | ultra | |
|---|---|---|---|---|
| Hitman: Absolution (2012) | 53 | 42 | 27.2 | 12.5 |
| BioShock Infinite (2013) | 101.6 | 64.5 | 54.4 | 23.4 |
| The Witcher 3 (2015) | 35.3 | 23.6 | 14 | 7.1 |
| Rise of the Tomb Raider (2016) | 29 | 26 | 13.9 | 11.6 |
Barulho
| Ocioso |
| 30 / 30.2 / 30.2 dB |
| Carga |
| 39 / 39 dB |
 | ||
30 dB silencioso 40 dB(A) audível 50 dB(A) ruidosamente alto |
||
min: | ||
| Huawei MateBook D 15, i7-7500U 940MX GeForce 940MX, i7-7500U, SanDisk SD8SN8U128G1027 | Asus VivoBook S15 S510UA HD Graphics 620, i5-7200U, Toshiba HG6 THNSNJ128G8NY | HP Envy 15-as133cl HD Graphics 620, i7-7500U, HGST Travelstar 5K1000 HTS541010A7E630 | Lenovo ThinkPad T570-20H90002GE HD Graphics 620, i5-7200U, Samsung PM961 MZVLW256HEHP | Acer TravelMate P658-G2-MG-7327 GeForce 940MX, i7-7500U, Liteonit CV3-8D512 | HP Spectre x360 15-bl002xx GeForce 940MX, i7-7500U, Toshiba XG4 NVMe (THNSN5512GPUK) | |
|---|---|---|---|---|---|---|
| Noise | 2% | -2% | 2% | 1% | -4% | |
| desligado / ambiente * (dB) | 28.8 | 28.2 2% | 30 -4% | 29.3 -2% | 30 -4% | 28.5 1% |
| Idle Minimum * (dB) | 30 | 30.2 -1% | 32.5 -8% | 29.3 2% | 30 -0% | 28.5 5% |
| Idle Average * (dB) | 30.2 | 30.2 -0% | 32.5 -8% | 29.3 3% | 30 1% | 28.5 6% |
| Idle Maximum * (dB) | 30.2 | 30.2 -0% | 32.5 -8% | 31.2 -3% | 30 1% | 36.3 -20% |
| Load Average * (dB) | 39 | 36.9 5% | 38.7 1% | 35.1 10% | 37.3 4% | 42.7 -9% |
| Witcher 3 ultra * (dB) | 38.7 | |||||
| Load Maximum * (dB) | 39 | 37 5% | 32.5 17% | 38.7 1% | 38 3% | 42.7 -9% |
* ... menor é melhor
(±) A temperatura máxima no lado superior é 44.8 °C / 113 F, em comparação com a média de 34.3 °C / 94 F , variando de 21.2 a 62.5 °C para a classe Office.
(-) A parte inferior aquece até um máximo de 50.4 °C / 123 F, em comparação com a média de 36.8 °C / 98 F
(+) Em uso inativo, a temperatura média para o lado superior é 28 °C / 82 F, em comparação com a média do dispositivo de 29.5 °C / ### class_avg_f### F.
(±) Jogando The Witcher 3, a temperatura média para o lado superior é 35.2 °C / 95 F, em comparação com a média do dispositivo de 29.5 °C / ## #class_avg_f### F.
(+) Os apoios para as mãos e o touchpad estão atingindo a temperatura máxima da pele (34 °C / 93.2 F) e, portanto, não estão quentes.
(-) A temperatura média da área do apoio para as mãos de dispositivos semelhantes foi 27.5 °C / 81.5 F (-6.5 °C / -11.7 F).
Huawei MateBook D 15, i7-7500U 940MX análise de áudio
(±) | o volume do alto-falante é médio, mas bom (###valor### dB)
Graves 100 - 315Hz
(±) | graves reduzidos - em média 11.9% menor que a mediana
(±) | a linearidade dos graves é média (14.9% delta para a frequência anterior)
Médios 400 - 2.000 Hz
(±) | médios mais altos - em média 8.9% maior que a mediana
(±) | a linearidade dos médios é média (10.8% delta para frequência anterior)
Altos 2 - 16 kHz
(+) | agudos equilibrados - apenas 1.3% longe da mediana
(+) | os máximos são lineares (4.1% delta da frequência anterior)
Geral 100 - 16.000 Hz
(±) | a linearidade do som geral é média (25.5% diferença em relação à mediana)
Comparado com a mesma classe
» 77% de todos os dispositivos testados nesta classe foram melhores, 6% semelhantes, 16% piores
» O melhor teve um delta de 7%, a média foi 21%, o pior foi 53%
Comparado com todos os dispositivos testados
» 78% de todos os dispositivos testados foram melhores, 5% semelhantes, 18% piores
» O melhor teve um delta de 4%, a média foi 24%, o pior foi 134%
Apple MacBook 12 (Early 2016) 1.1 GHz análise de áudio
(+) | os alto-falantes podem tocar relativamente alto (###valor### dB)
Graves 100 - 315Hz
(±) | graves reduzidos - em média 11.3% menor que a mediana
(±) | a linearidade dos graves é média (14.2% delta para a frequência anterior)
Médios 400 - 2.000 Hz
(+) | médios equilibrados - apenas 2.4% longe da mediana
(+) | médios são lineares (5.5% delta para frequência anterior)
Altos 2 - 16 kHz
(+) | agudos equilibrados - apenas 2% longe da mediana
(+) | os máximos são lineares (4.5% delta da frequência anterior)
Geral 100 - 16.000 Hz
(+) | o som geral é linear (10.2% diferença em relação à mediana)
Comparado com a mesma classe
» 7% de todos os dispositivos testados nesta classe foram melhores, 2% semelhantes, 91% piores
» O melhor teve um delta de 5%, a média foi 18%, o pior foi 53%
Comparado com todos os dispositivos testados
» 4% de todos os dispositivos testados foram melhores, 1% semelhantes, 94% piores
» O melhor teve um delta de 4%, a média foi 24%, o pior foi 134%
| desligado | |
| Ocioso | |
| Carga |
|
Key:
min: | |
| Huawei MateBook D 15, i7-7500U 940MX i7-7500U, GeForce 940MX, SanDisk SD8SN8U128G1027, IPS, 1920x1080, 15.6" | Asus VivoBook S15 S510UA i5-7200U, HD Graphics 620, Toshiba HG6 THNSNJ128G8NY, IPS, 1920x1080, 15.6" | HP Envy 15-as133cl i7-7500U, HD Graphics 620, HGST Travelstar 5K1000 HTS541010A7E630, IPS, 1920x1080, 15.6" | Lenovo ThinkPad T570-20H90002GE i5-7200U, HD Graphics 620, Samsung PM961 MZVLW256HEHP, IPS, 1920x1080, 15.6" | Acer TravelMate P658-G2-MG-7327 i7-7500U, GeForce 940MX, Liteonit CV3-8D512, IPS, 1920x1080, 15.6" | HP Spectre x360 15-bl002xx i7-7500U, GeForce 940MX, Toshiba XG4 NVMe (THNSN5512GPUK), IPS, 3840x2160, 15.6" | |
|---|---|---|---|---|---|---|
| Power Consumption | 17% | 25% | 17% | -6% | -37% | |
| Idle Minimum * (Watt) | 5.14 | 4.6 11% | 4.6 11% | 3.6 30% | 3.9 24% | 8.14 -58% |
| Idle Average * (Watt) | 9.07 | 7.6 16% | 7.7 15% | 7.7 15% | 7.9 13% | 10.91 -20% |
| Idle Maximum * (Watt) | 9.33 | 7.7 17% | 7.8 16% | 8.2 12% | 11.3 -21% | 12.26 -31% |
| Load Average * (Watt) | 46.76 | 35.1 25% | 30.5 35% | 30.8 34% | 47 -1% | 45.67 2% |
| Witcher 3 ultra * (Watt) | 40.18 | |||||
| Load Maximum * (Watt) | 42.59 | 36.2 15% | 22.7 47% | 46.1 -8% | 62 -46% | 74.94 -76% |
* ... menor é melhor
| Huawei MateBook D 15, i7-7500U 940MX i7-7500U, GeForce 940MX, 43.3 Wh | Asus VivoBook S15 S510UA i5-7200U, HD Graphics 620, 42 Wh | HP Envy 15-as133cl i7-7500U, HD Graphics 620, 52 Wh | Dell XPS 15 9560 (i7-7700HQ, UHD) i7-7700HQ, GeForce GTX 1050 Mobile, 97 Wh | Lenovo ThinkPad T570-20H90002GE i5-7200U, HD Graphics 620, 56 Wh | Acer TravelMate P658-G2-MG-7327 i7-7500U, GeForce 940MX, 55 Wh | HP Spectre x360 15-bl002xx i7-7500U, GeForce 940MX, 79.2 Wh | |
|---|---|---|---|---|---|---|---|
| Duração da bateria | -34% | -24% | -3% | 46% | 14% | 22% | |
| Reader / Idle (h) | 15.9 | 10.2 -36% | 9.6 -40% | 13.9 -13% | 19.5 23% | 14.4 -9% | |
| WiFi v1.3 (h) | 7.4 | 4.3 -42% | 6.8 -8% | 7.2 -3% | 7.6 3% | 8.4 14% | 8.9 20% |
| Load (h) | 1.6 | 1.2 -25% | 1.2 -25% | 1.7 6% | 3.4 113% | 2.5 56% |
Pro
Contra
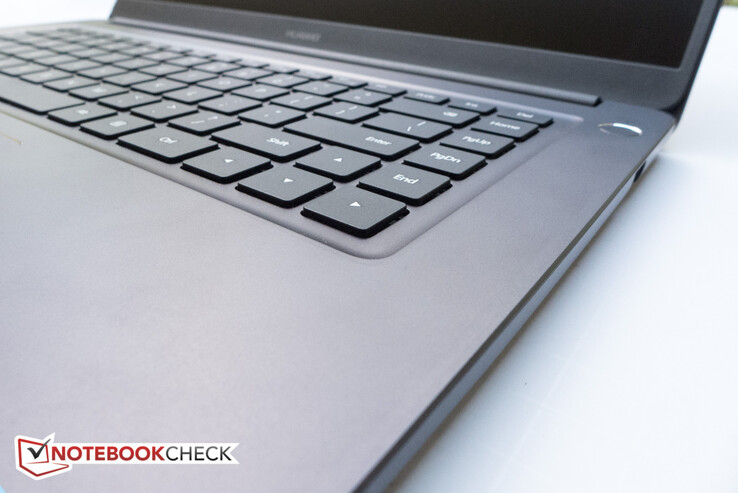
O MateBook D é um portátil convencional cem tela convencional de 15,6 polegadas, que é voltado para usuários domésticos e - se tomarmos o slogan da Huawei para o portátil com valor nominal - as empresas também. Graças ao marco estreito, o design de alumínio tem um formato pequeno e é funcional, robusto e também tem um visual agradável. O desempenho do mundo real é bastante aceitável graças ao processador i7, ao SSD primário e à placa gráfica dedicada, embora não particularmente poderosa. A duração da bateria também é decente e a tela anti refletiva é suficientemente brilhante para permitir que o usuário se arrisque em exteriores ocasionalmente.
O portátil tem duas deficiências principais: cargas mais pesadas e prolongadas resultam a um extenso afogamento da GPU - e apesar disso, as temperaturas da superfície aumentam até níveis quase incômodos. A Huawei precisa voltar ao quadro de desenho e redesenhar o sistema de resfriamento ou modificar o mecanismo de controle da ventoinha. Como vem, os usuários avançados provavelmente estarão muito decepcionados com as características de desempenho e temperatura do MateBook D.
Como um portátil poli funcional de 15,6 polegadas em um mercado muito saturado, pode ser uma escolha bastante decente, mas é improvável que os potenciais compradores tenham uma experiência informática verdadeiramente satisfatória.
Huawei MateBook D 15, i7-7500U 940MX
- 09/26/2017 v6 (old)
Bernie Pechlaner


