Breve Análise do Portátil Lenovo Ideapad 530S-15IKB (i5-8250U, FHD)
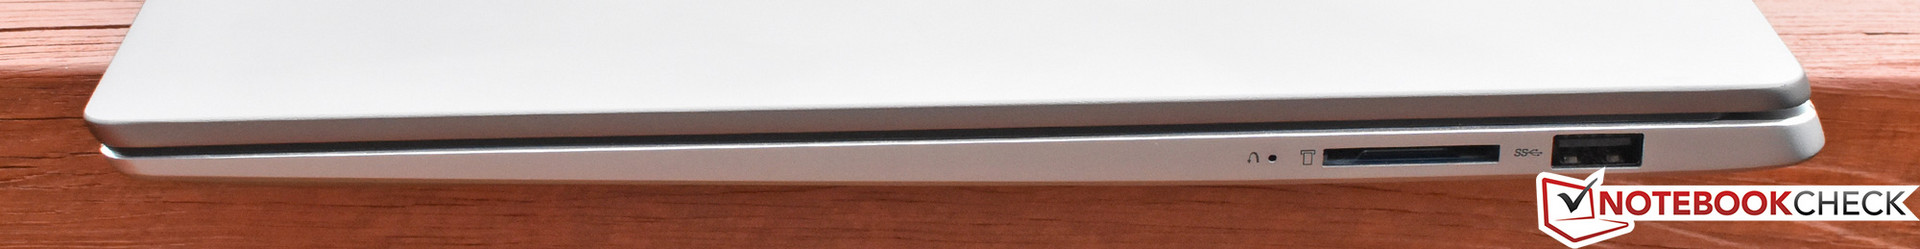
| SD Card Reader | |
| average JPG Copy Test (av. of 3 runs) | |
| Média da turma Multimedia (23 - 531, n=37, últimos 2 anos) | |
| Dell XPS 15 2018 i5 FHD 97Wh | |
| Acer Aspire 3 A315-41-R7BM (Toshiba Exceria Pro SDXC 64 GB UHS-II) | |
| Asus VivoBook 15 X570UD (Toshiba Exceria Pro M501 UHS-II) | |
| HP Pavilion 15-cs0053cl (Toshiba Exceria Pro SDXC 64 GB UHS-II) | |
| Lenovo Ideapad 530S-15IKB (Toshiba Exceria Pro SDXC 64 GB UHS-II) | |
| Dell Inspiron 15 5579-9672 (Toshiba Exceria Pro SDXC 64 GB UHS-II) | |
| maximum AS SSD Seq Read Test (1GB) | |
| Dell XPS 15 2018 i5 FHD 97Wh | |
| Média da turma Multimedia (37.3 - 1455, n=36, últimos 2 anos) | |
| Acer Aspire 3 A315-41-R7BM (Toshiba Exceria Pro SDXC 64 GB UHS-II) | |
| Asus VivoBook 15 X570UD (Toshiba Exceria Pro M501 UHS-II) | |
| HP Pavilion 15-cs0053cl (Toshiba Exceria Pro SDXC 64 GB UHS-II) | |
| Dell Inspiron 15 5579-9672 (Toshiba Exceria Pro SDXC 64 GB UHS-II) | |
| Lenovo Ideapad 530S-15IKB (Toshiba Exceria Pro SDXC 64 GB UHS-II) | |
| Networking | |
| iperf3 transmit AX12 | |
| Dell Inspiron 15 5579-9672 | |
| Asus VivoBook 15 X570UD | |
| Dell XPS 15 2018 i5 FHD 97Wh | |
| Lenovo Ideapad 530S-15IKB | |
| Acer Aspire 3 A315-41-R7BM | |
| HP Pavilion 15-cs0053cl | |
| iperf3 receive AX12 | |
| Lenovo Ideapad 530S-15IKB | |
| Asus VivoBook 15 X570UD | |
| Dell Inspiron 15 5579-9672 | |
| Dell XPS 15 2018 i5 FHD 97Wh | |
| Acer Aspire 3 A315-41-R7BM | |
| HP Pavilion 15-cs0053cl | |
| |||||||||||||||||||||||||
iluminação: 88 %
iluminação com acumulador: 285.1 cd/m²
Contraste: 1018:1 (Preto: 0.28 cd/m²)
ΔE ColorChecker Calman: 4.38 | ∀{0.5-29.43 Ø4.71}
calibrated: 3.95
ΔE Greyscale Calman: 3.1 | ∀{0.09-98 Ø4.96}
62% sRGB (Argyll 1.6.3 3D)
40% AdobeRGB 1998 (Argyll 1.6.3 3D)
43.32% AdobeRGB 1998 (Argyll 3D)
62.4% sRGB (Argyll 3D)
41.84% Display P3 (Argyll 3D)
Gamma: 2.24
CCT: 6705 K
| Lenovo Ideapad 530S-15IKB N156HCA-EAB, IPS, 15.6", 1920x1080 | HP Pavilion 15-cs0053cl AU Optronics B156XW02 V0, TN LED, 15.6", 1366x768 | Asus VivoBook 15 X570UD AU Optronics B156HAN06.1, IPS, 15.6", 1920x1080 | Dell Inspiron 15 5579-9672 AUO, B156HW01, IPS, 15.6", 1920x1080 | Acer Aspire 3 A315-41-R7BM Chi Mei CMN15D5, TN LED, 15.6", 1920x1080 | Dell XPS 15 2018 i5 FHD 97Wh Sharp SHP149A LQ156M1, LED IGZO IPS InfinityEdge, 15.6", 1920x1080 | |
|---|---|---|---|---|---|---|
| Display | -8% | -8% | -12% | -4% | 56% | |
| Display P3 Coverage (%) | 41.84 | 38.37 -8% | 38.66 -8% | 37 -12% | 40.09 -4% | 66 58% |
| sRGB Coverage (%) | 62.4 | 57.7 -8% | 57.9 -7% | 55.6 -11% | 59.7 -4% | 96.5 55% |
| AdobeRGB 1998 Coverage (%) | 43.32 | 39.65 -8% | 39.94 -8% | 38.23 -12% | 41.47 -4% | 66.7 54% |
| Response Times | 18% | 12% | 0% | 20% | -13% | |
| Response Time Grey 50% / Grey 80% * (ms) | 37.2 ? | 43.6 ? -17% | 32 ? 14% | 41 ? -10% | 44 ? -18% | 49 ? -32% |
| Response Time Black / White * (ms) | 32.4 ? | 15.2 ? 53% | 29.2 ? 10% | 29 ? 10% | 14 ? 57% | 30 ? 7% |
| PWM Frequency (Hz) | 25770 ? | 25000 ? | 961 ? | |||
| Screen | -49% | 2% | 3% | -56% | 37% | |
| Brightness middle (cd/m²) | 285.1 | 220.1 -23% | 240.1 -16% | 251 -12% | 234 -18% | 413 45% |
| Brightness (cd/m²) | 271 | 210 -23% | 233 -14% | 240 -11% | 211 -22% | 378 39% |
| Brightness Distribution (%) | 88 | 93 6% | 91 3% | 84 -5% | 83 -6% | 86 -2% |
| Black Level * (cd/m²) | 0.28 | 0.29 -4% | 0.23 18% | 0.2 29% | 0.43 -54% | 0.29 -4% |
| Contrast (:1) | 1018 | 759 -25% | 1044 3% | 1255 23% | 544 -47% | 1424 40% |
| Colorchecker dE 2000 * | 4.38 | 11.4 -160% | 4.25 3% | 5.25 -20% | 11.27 -157% | 2.44 44% |
| Colorchecker dE 2000 max. * | 24.07 | 25.96 -8% | 17.84 26% | 10.04 58% | 18.03 25% | 4.46 81% |
| Colorchecker dE 2000 calibrated * | 3.95 | 4.09 -4% | 4 -1% | 2.48 37% | ||
| Greyscale dE 2000 * | 3.1 | 12 -287% | 2.8 10% | 3.28 -6% | 11.54 -272% | 2.48 20% |
| Gamma | 2.24 98% | 2.09 105% | 2.3 96% | 2.15 102% | 2.09 105% | 2.43 91% |
| CCT | 6705 97% | 12625 51% | 6503 100% | 6502 100% | 11607 56% | 7006 93% |
| Color Space (Percent of AdobeRGB 1998) (%) | 40 | 36.5 -9% | 36.8 -8% | 35 -12% | 38 -5% | 62 55% |
| Color Space (Percent of sRGB) (%) | 62 | 57.5 -7% | 57.8 -7% | 55 -11% | 60 -3% | 96 55% |
| Média Total (Programa/Configurações) | -13% /
-33% | 2% /
1% | -3% /
-0% | -13% /
-35% | 27% /
35% |
* ... menor é melhor
Exibir tempos de resposta
| ↔ Tempo de resposta preto para branco | ||
|---|---|---|
| 32.4 ms ... ascensão ↗ e queda ↘ combinadas | ↗ 18.4 ms ascensão | 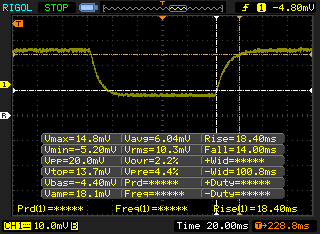 |
| ↘ 14 ms queda | ||
| A tela mostra taxas de resposta lentas em nossos testes e será insatisfatória para os jogadores. Em comparação, todos os dispositivos testados variam de 0.1 (mínimo) a 240 (máximo) ms. » 88 % de todos os dispositivos são melhores. Isso significa que o tempo de resposta medido é pior que a média de todos os dispositivos testados (19.8 ms). | ||
| ↔ Tempo de resposta 50% cinza a 80% cinza | ||
| 37.2 ms ... ascensão ↗ e queda ↘ combinadas | ↗ 19.6 ms ascensão | 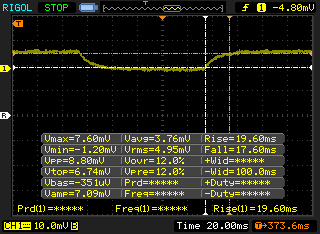 |
| ↘ 17.6 ms queda | ||
| A tela mostra taxas de resposta lentas em nossos testes e será insatisfatória para os jogadores. Em comparação, todos os dispositivos testados variam de 0.165 (mínimo) a 636 (máximo) ms. » 54 % de todos os dispositivos são melhores. Isso significa que o tempo de resposta medido é pior que a média de todos os dispositivos testados (31 ms). | ||
Cintilação da tela / PWM (modulação por largura de pulso)
| Tela tremeluzindo/PWM detectado | 25770 Hz | ≤ 67 % configuração de brilho | 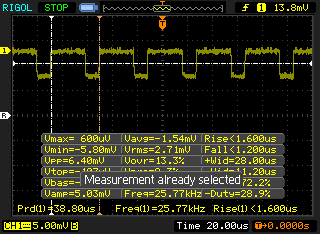 |
A luz de fundo da tela pisca em 25770 Hz (pior caso, por exemplo, utilizando PWM) Cintilação detectada em uma configuração de brilho de 67 % e abaixo. Não deve haver cintilação ou PWM acima desta configuração de brilho. A frequência de 25770 Hz é bastante alta, então a maioria dos usuários sensíveis ao PWM não deve notar nenhuma oscilação. [pwm_comparison] Em comparação: 52 % de todos os dispositivos testados não usam PWM para escurecer a tela. Se PWM foi detectado, uma média de 7754 (mínimo: 5 - máximo: 343500) Hz foi medida. | |||
| PCMark 8 | |
| Home Score Accelerated v2 | |
| Média da turma Multimedia (n=1últimos 2 anos) | |
| Asus VivoBook 15 X570UD | |
| Dell XPS 15 2018 i5 FHD 97Wh | |
| HP Pavilion 15-cs0053cl | |
| Lenovo Ideapad 530S-15IKB | |
| Média Intel Core i5-8250U, Intel UHD Graphics 620 (2986 - 4458, n=69) | |
| Acer Aspire 3 A315-41-R7BM | |
| Dell Inspiron 15 5579-9672 | |
| Work Score Accelerated v2 | |
| Dell XPS 15 2018 i5 FHD 97Wh | |
| Lenovo Ideapad 530S-15IKB | |
| HP Pavilion 15-cs0053cl | |
| Média Intel Core i5-8250U, Intel UHD Graphics 620 (2699 - 5106, n=58) | |
| Acer Aspire 3 A315-41-R7BM | |
| Dell Inspiron 15 5579-9672 | |
| PCMark 8 Home Score Accelerated v2 | 3585 pontos | |
| PCMark 8 Work Score Accelerated v2 | 4762 pontos | |
| PCMark 10 Score | 3643 pontos | |
Ajuda | ||
| Lenovo Ideapad 530S-15IKB SK hynix PC401 HFS256GD9TNG | Asus VivoBook 15 X570UD SK hynix PC300 HFS512GD9MND | Dell Inspiron 15 5579-9672 SK hynix SC311 SATA | Acer Aspire 3 A315-41-R7BM SK Hynix HFS256G39TND-N210A | Dell XPS 15 2018 i5 FHD 97Wh Lite-On CA3-8D256-Q11 | Média SK hynix PC401 HFS256GD9TNG | |
|---|---|---|---|---|---|---|
| AS SSD | 38% | -45% | -83% | -155% | -7% | |
| Copy Game MB/s (MB/s) | 301.1 | 792 163% | 231.6 -23% | 145.4 -52% | 465.9 55% | 423 ? 40% |
| Copy Program MB/s (MB/s) | 233.5 | 334.3 43% | 166.4 -29% | 94 -60% | 117.2 -50% | 358 ? 53% |
| Copy ISO MB/s (MB/s) | 868 | 1265 46% | 301.3 -65% | 199.8 -77% | 632 -27% | 748 ? -14% |
| Score Total (Points) | 1387 | 2249 62% | 910 -34% | 594 -57% | 750 -46% | 1423 ? 3% |
| Score Write (Points) | 415 | 836 101% | 330 -20% | 210 -49% | 58 -86% | 450 ? 8% |
| Score Read (Points) | 690 | 968 40% | 383 -44% | 256 -63% | 492 -29% | 679 ? -2% |
| Access Time Write * (ms) | 0.051 | 0.127 -149% | 0.075 -47% | 0.225 -341% | 0.889 -1643% | 0.1111 ? -118% |
| Access Time Read * (ms) | 0.06 | 0.059 2% | 0.142 -137% | 0.136 -127% | 0.086 -43% | 0.1118 ? -86% |
| 4K-64 Write (MB/s) | 271.6 | 677 149% | 247 -9% | 145 -47% | 19.19 -93% | 290 ? 7% |
| 4K-64 Read (MB/s) | 431.3 | 756 75% | 309.7 -28% | 187.9 -56% | 301.8 -30% | 452 ? 5% |
| 4K Write (MB/s) | 88.4 | 85.8 -3% | 47.64 -46% | 40.46 -54% | 5.12 -94% | 100.2 ? 13% |
| 4K Read (MB/s) | 38.69 | 30.78 -20% | 23.71 -39% | 22.24 -43% | 32.5 -16% | 38.9 ? 1% |
| Seq Write (MB/s) | 550 | 735 34% | 356.2 -35% | 241.8 -56% | 340.3 -38% | 593 ? 8% |
| Seq Read (MB/s) | 2205 | 1817 -18% | 497.5 -77% | 457.6 -79% | 1574 -29% | 1882 ? -15% |
* ... menor é melhor

| 3DMark 11 | |
| 1280x720 Performance GPU | |
| Média da turma Multimedia (3749 - 60002, n=55, últimos 2 anos) | |
| Dell XPS 15 2018 i5 FHD 97Wh | |
| Asus VivoBook 15 X570UD | |
| Acer Aspire 3 A315-41-R7BM | |
| Média Intel UHD Graphics 620 (1144 - 3432, n=244) | |
| HP Pavilion 15-cs0053cl | |
| Lenovo Ideapad 530S-15IKB | |
| Dell Inspiron 15 5579-9672 | |
| 1280x720 Performance Combined | |
| Média da turma Multimedia (2326 - 26308, n=55, últimos 2 anos) | |
| Dell XPS 15 2018 i5 FHD 97Wh | |
| Asus VivoBook 15 X570UD | |
| Acer Aspire 3 A315-41-R7BM | |
| Média Intel UHD Graphics 620 (927 - 2505, n=244) | |
| HP Pavilion 15-cs0053cl | |
| Lenovo Ideapad 530S-15IKB | |
| Dell Inspiron 15 5579-9672 | |
| 3DMark | |
| 1280x720 Cloud Gate Standard Graphics | |
| Média da turma Multimedia (16765 - 143501, n=32, últimos 2 anos) | |
| Dell XPS 15 2018 i5 FHD 97Wh | |
| Acer Aspire 3 A315-41-R7BM | |
| Média Intel UHD Graphics 620 (6205 - 16400, n=225) | |
| HP Pavilion 15-cs0053cl | |
| Dell Inspiron 15 5579-9672 | |
| Lenovo Ideapad 530S-15IKB | |
| 1920x1080 Fire Strike Graphics | |
| Média da turma Multimedia (2328 - 48907, n=58, últimos 2 anos) | |
| Dell XPS 15 2018 i5 FHD 97Wh | |
| Acer Aspire 3 A315-41-R7BM | |
| Média Intel UHD Graphics 620 (557 - 2608, n=213) | |
| Lenovo Ideapad 530S-15IKB | |
| Dell Inspiron 15 5579-9672 | |
| 1920x1080 Ice Storm Extreme Graphics | |
| Média da turma Multimedia (162458 - 237569, n=2, últimos 2 anos) | |
| Acer Aspire 3 A315-41-R7BM | |
| Média Intel UHD Graphics 620 (26409 - 59483, n=71) | |
| Dell Inspiron 15 5579-9672 | |
| 3DMark 11 Performance | 1690 pontos | |
| 3DMark Cloud Gate Standard Score | 6844 pontos | |
| 3DMark Fire Strike Score | 936 pontos | |
Ajuda | ||
| BioShock Infinite | |
| 1920x1080 Ultra Preset, DX11 (DDOF) (classificar por valor) | |
| Lenovo Ideapad 530S-15IKB | |
| Asus VivoBook 15 X570UD | |
| Dell Inspiron 15 5579-9672 | |
| Acer Aspire 3 A315-41-R7BM | |
| Dell XPS 15 2018 i5 FHD 97Wh | |
| Média Intel UHD Graphics 620 (4.5 - 17, n=176) | |
| 1366x768 High Preset (classificar por valor) | |
| Lenovo Ideapad 530S-15IKB | |
| HP Pavilion 15-cs0053cl | |
| Asus VivoBook 15 X570UD | |
| Dell Inspiron 15 5579-9672 | |
| Acer Aspire 3 A315-41-R7BM | |
| Média Intel UHD Graphics 620 (8.1 - 35.9, n=187) | |
| 1366x768 Medium Preset (classificar por valor) | |
| Lenovo Ideapad 530S-15IKB | |
| HP Pavilion 15-cs0053cl | |
| Asus VivoBook 15 X570UD | |
| Dell Inspiron 15 5579-9672 | |
| Acer Aspire 3 A315-41-R7BM | |
| Média Intel UHD Graphics 620 (11.5 - 45.5, n=187) | |
| 1280x720 Very Low Preset (classificar por valor) | |
| Lenovo Ideapad 530S-15IKB | |
| HP Pavilion 15-cs0053cl | |
| Asus VivoBook 15 X570UD | |
| Dell Inspiron 15 5579-9672 | |
| Acer Aspire 3 A315-41-R7BM | |
| Média Intel UHD Graphics 620 (18.3 - 90.2, n=187) | |
| Rise of the Tomb Raider | |
| 1920x1080 Very High Preset AA:FX AF:16x (classificar por valor) | |
| Dell XPS 15 2018 i5 FHD 97Wh | |
| Média Intel UHD Graphics 620 (3 - 14.5, n=11) | |
| 1920x1080 High Preset AA:FX AF:4x (classificar por valor) | |
| Lenovo Ideapad 530S-15IKB | |
| Dell Inspiron 15 5579-9672 | |
| Acer Aspire 3 A315-41-R7BM | |
| Dell XPS 15 2018 i5 FHD 97Wh | |
| Média Intel UHD Graphics 620 (4.9 - 32, n=42) | |
| 1366x768 Medium Preset AF:2x (classificar por valor) | |
| Lenovo Ideapad 530S-15IKB | |
| HP Pavilion 15-cs0053cl | |
| Dell Inspiron 15 5579-9672 | |
| Acer Aspire 3 A315-41-R7BM | |
| Dell XPS 15 2018 i5 FHD 97Wh | |
| Média Intel UHD Graphics 620 (6.5 - 49.3, n=62) | |
| 1024x768 Lowest Preset (classificar por valor) | |
| Lenovo Ideapad 530S-15IKB | |
| HP Pavilion 15-cs0053cl | |
| Dell Inspiron 15 5579-9672 | |
| Acer Aspire 3 A315-41-R7BM | |
| Média Intel UHD Graphics 620 (10.4 - 110.7, n=82) | |
| Metro: Last Light | |
| 1920x1080 Very High (DX11) AF:16x (classificar por valor) | |
| Lenovo Ideapad 530S-15IKB | |
| Média Intel UHD Graphics 620 (6 - 8, n=3) | |
| 1366x768 High (DX11) AF:16x (classificar por valor) | |
| Lenovo Ideapad 530S-15IKB | |
| Média Intel UHD Graphics 620 (13 - 16, n=3) | |
| 1366x768 Medium (DX10) AF:4x (classificar por valor) | |
| Lenovo Ideapad 530S-15IKB | |
| HP Pavilion 15-cs0053cl | |
| Média Intel UHD Graphics 620 (16.4 - 28, n=4) | |
| 1024x768 Low (DX10) AF:4x (classificar por valor) | |
| Lenovo Ideapad 530S-15IKB | |
| HP Pavilion 15-cs0053cl | |
| Média Intel UHD Graphics 620 (23.3 - 41, n=5) | |
| baixo | média | alto | ultra | |
|---|---|---|---|---|
| BioShock Infinite (2013) | 47 | 21 | 19 | 7 |
| Metro: Last Light (2013) | 25 | 22 | 13 | 6 |
| Rise of the Tomb Raider (2016) | 17 | 11 | 6 |
Barulho
| Ocioso |
| 28 / 28 / 30.1 dB |
| Carga |
| 30.2 / 33.2 dB |
 | ||
30 dB silencioso 40 dB(A) audível 50 dB(A) ruidosamente alto |
||
min: | ||
| Lenovo Ideapad 530S-15IKB UHD Graphics 620, i5-8250U, SK hynix PC401 HFS256GD9TNG | HP Pavilion 15-cs0053cl UHD Graphics 620, i5-8250U, Toshiba MQ04ABF100 | Asus VivoBook 15 X570UD GeForce GTX 1050 Mobile, i5-8550U, SK hynix PC300 HFS512GD9MND | Dell Inspiron 15 5579-9672 UHD Graphics 620, i5-8250U, SK hynix SC311 SATA | Acer Aspire 3 A315-41-R7BM Vega 3, R3 2200U, SK Hynix HFS256G39TND-N210A | Dell XPS 15 2018 i5 FHD 97Wh GeForce GTX 1050 Mobile, i5-8300H, Lite-On CA3-8D256-Q11 | |
|---|---|---|---|---|---|---|
| Noise | -8% | -16% | -5% | -12% | -13% | |
| desligado / ambiente * (dB) | 28 | 28.2 -1% | 29.2 -4% | 30.4 -9% | 30.3 -8% | 30.3 -8% |
| Idle Minimum * (dB) | 28 | 31.7 -13% | 29.3 -5% | 30.4 -9% | 30.3 -8% | 30.3 -8% |
| Idle Average * (dB) | 28 | 31.7 -13% | 29.5 -5% | 30.4 -9% | 30.3 -8% | 30.3 -8% |
| Idle Maximum * (dB) | 30.1 | 32 -6% | 30.5 -1% | 31.2 -4% | 30.9 -3% | 30.3 -1% |
| Load Average * (dB) | 30.2 | 32.8 -9% | 41.2 -36% | 31.5 -4% | 37.8 -25% | 37.1 -23% |
| Load Maximum * (dB) | 33.2 | 35 -5% | 47.2 -42% | 31.5 5% | 40.6 -22% | 43 -30% |
| Witcher 3 ultra * (dB) | 44 | 34.3 | 43.3 |
* ... menor é melhor
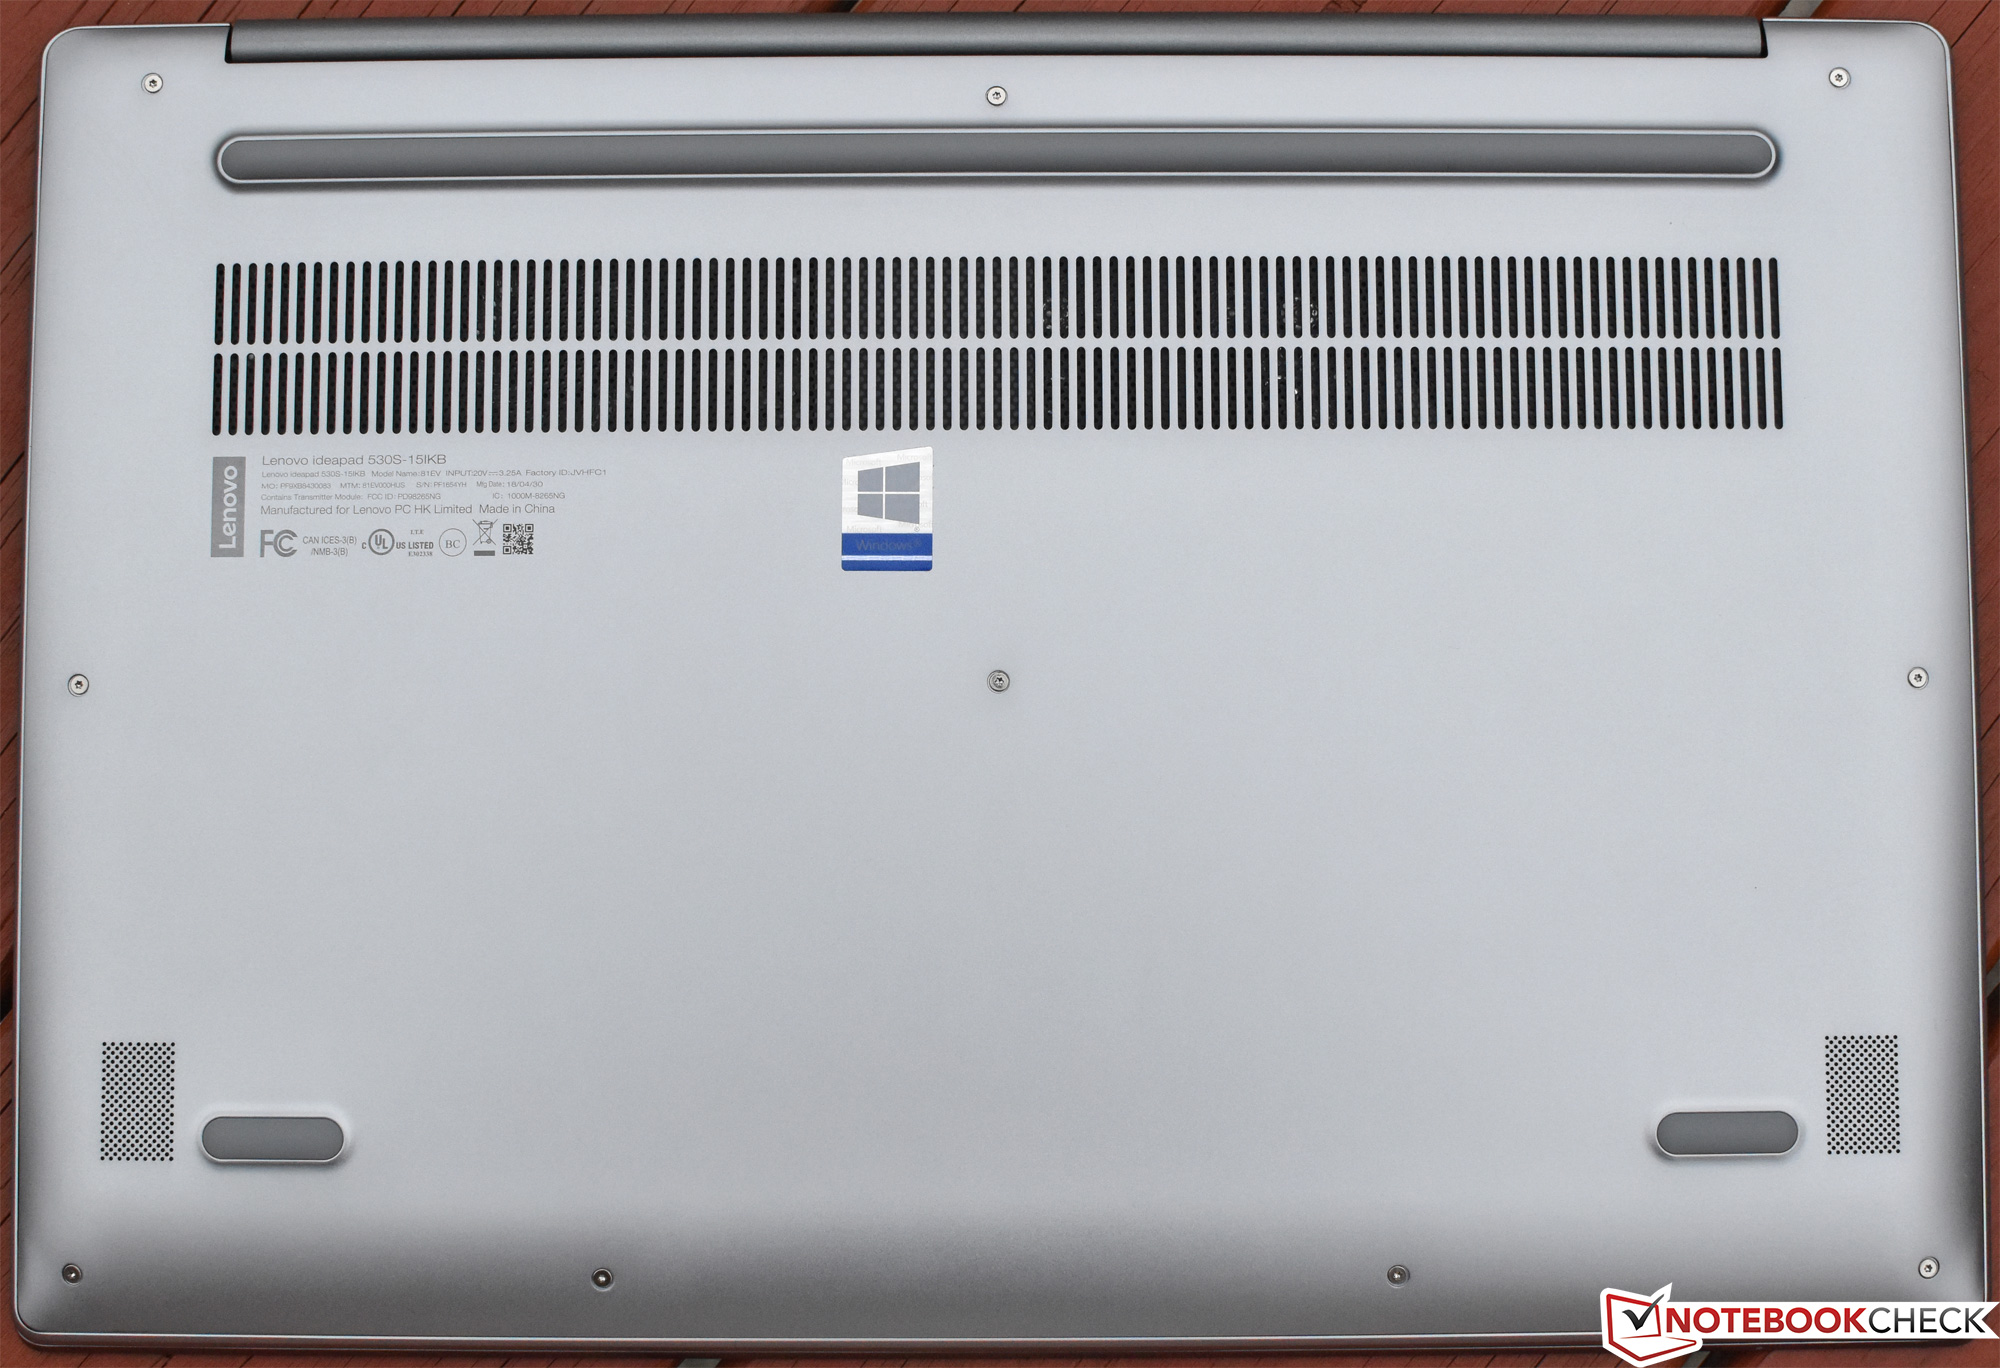
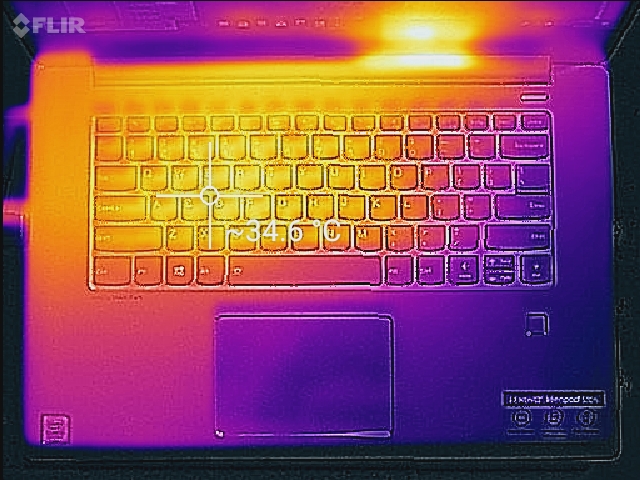
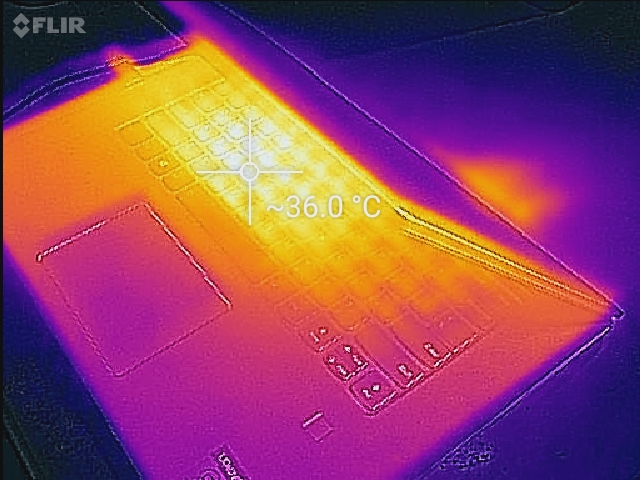
(+) A temperatura máxima no lado superior é 33.8 °C / 93 F, em comparação com a média de 36.8 °C / 98 F , variando de 21 a 71 °C para a classe Multimedia.
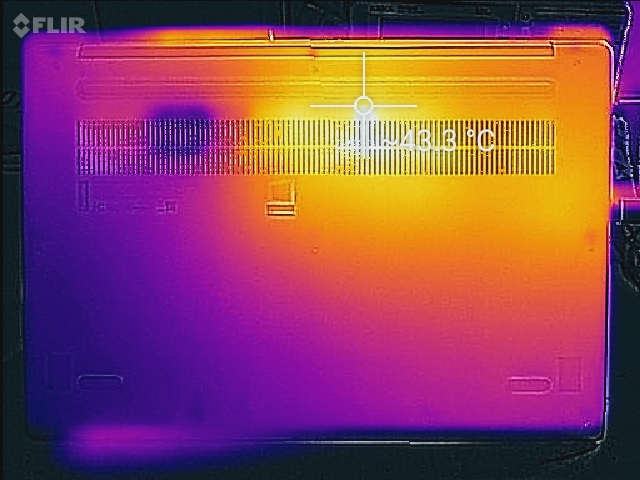
(±) A parte inferior aquece até um máximo de 43 °C / 109 F, em comparação com a média de 39.1 °C / 102 F
(+) Em uso inativo, a temperatura média para o lado superior é 26.1 °C / 79 F, em comparação com a média do dispositivo de 31.3 °C / ### class_avg_f### F.
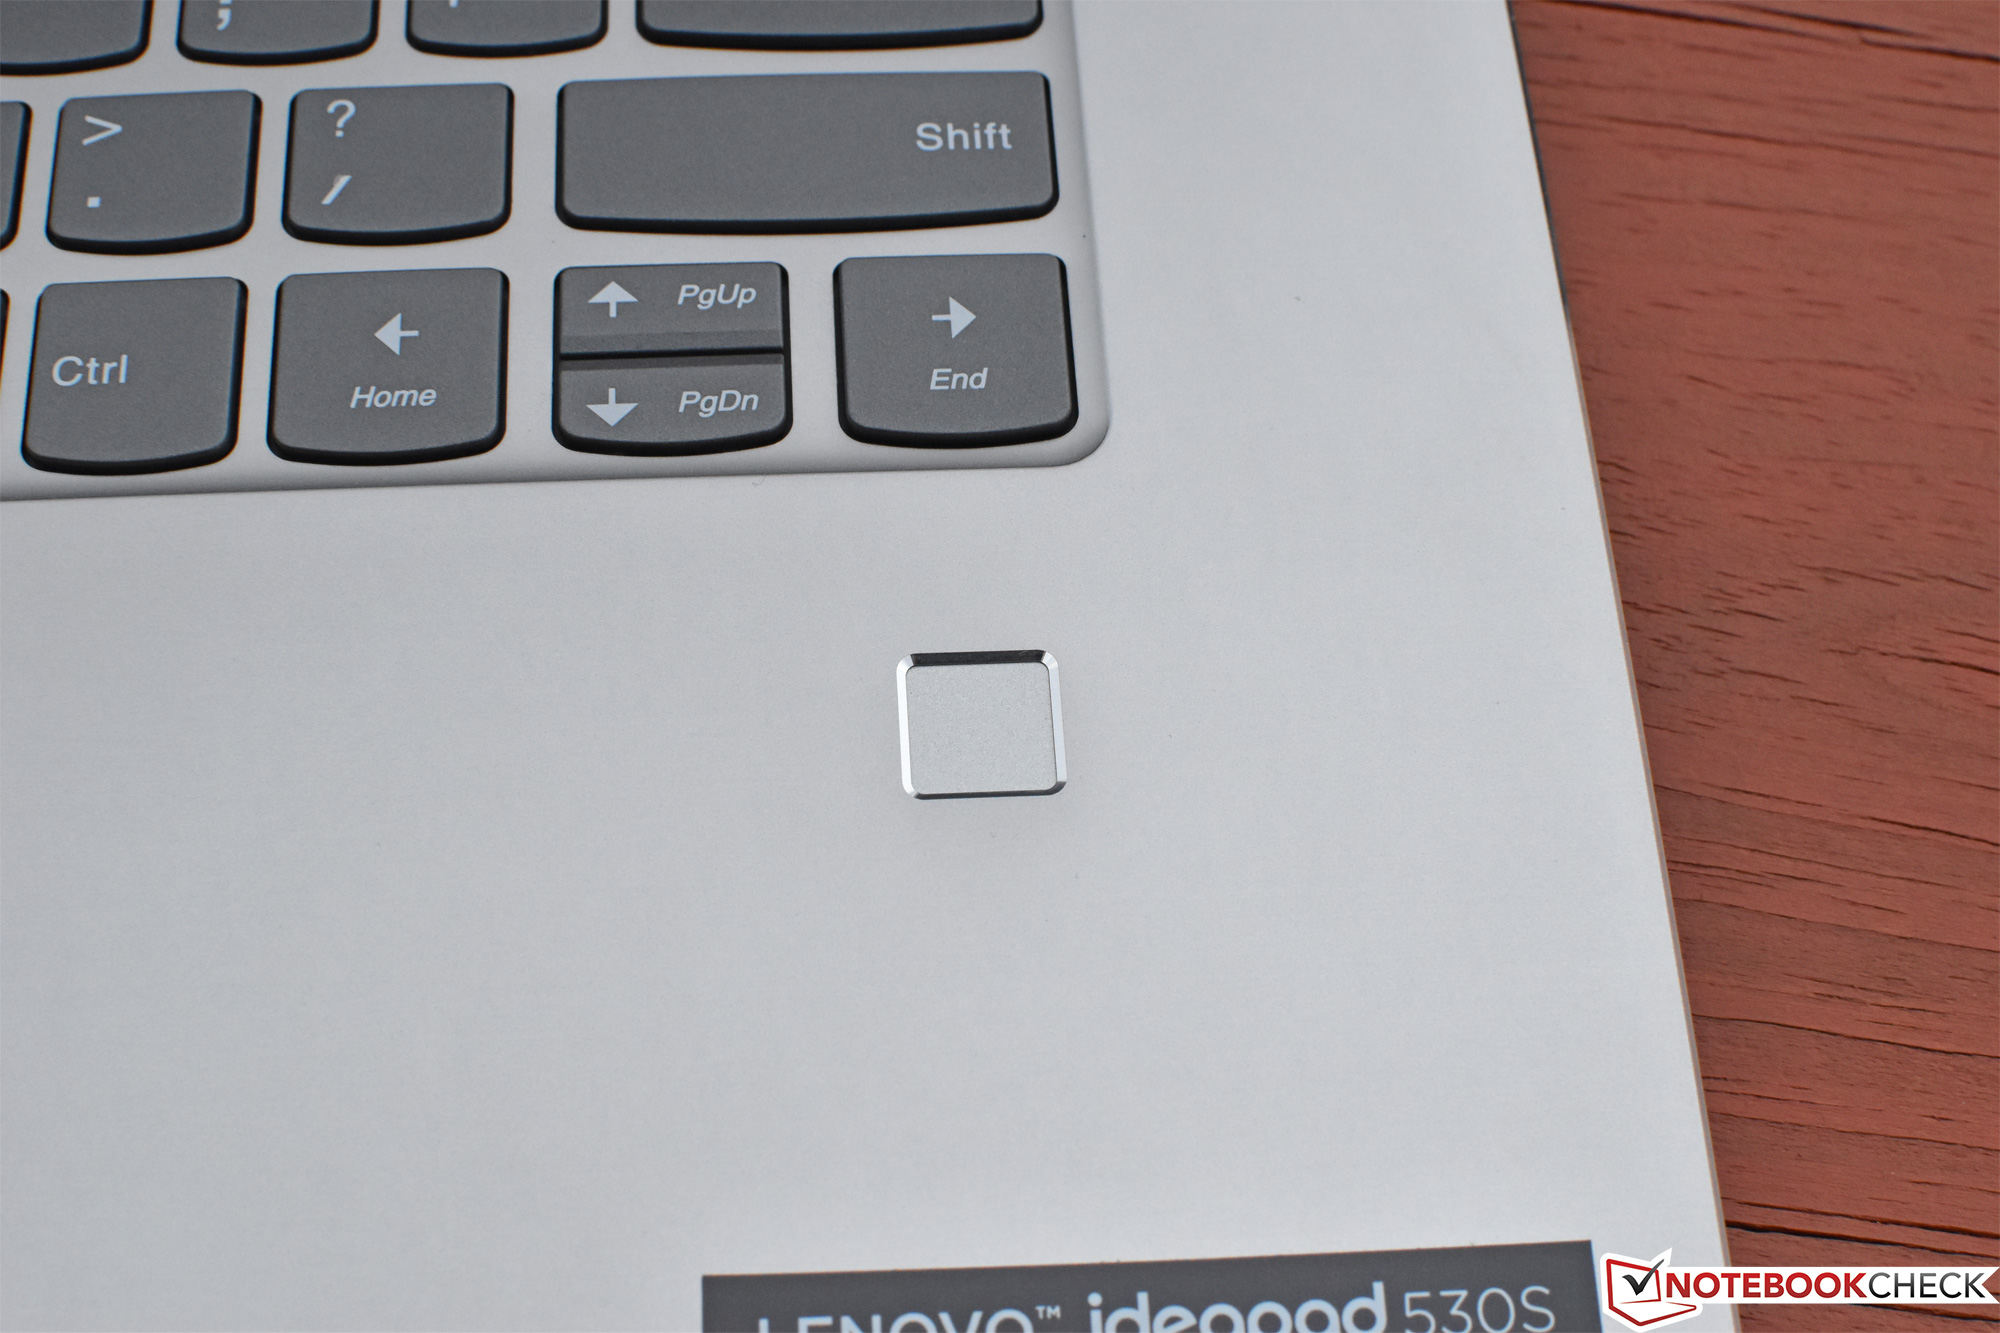
(+) Os apoios para as mãos e o touchpad são mais frios que a temperatura da pele, com um máximo de 28.2 °C / 82.8 F e, portanto, são frios ao toque.
(±) A temperatura média da área do apoio para as mãos de dispositivos semelhantes foi 28.7 °C / 83.7 F (+0.5 °C / 0.9 F).
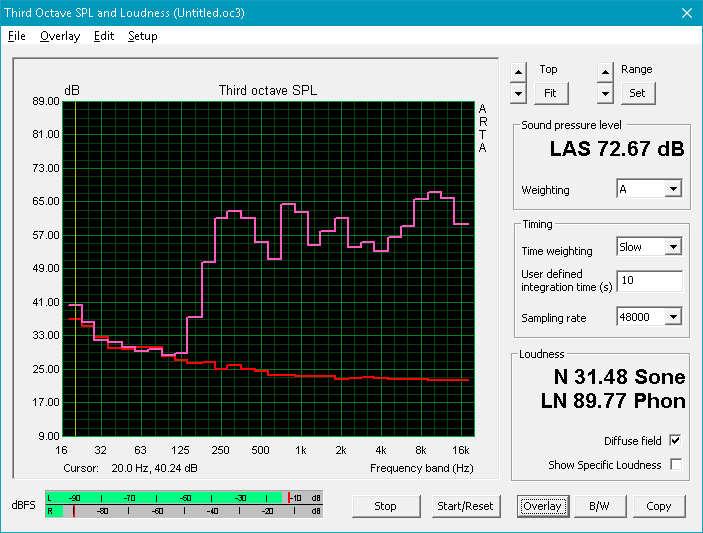
Lenovo Ideapad 530S-15IKB análise de áudio
(±) | o volume do alto-falante é médio, mas bom (###valor### dB)
Graves 100 - 315Hz
(-) | quase nenhum baixo - em média 15.7% menor que a mediana
(-) | graves não são lineares (17.3% delta para frequência anterior)
Médios 400 - 2.000 Hz
(+) | médios equilibrados - apenas 3.7% longe da mediana
(±) | a linearidade dos médios é média (14.7% delta para frequência anterior)
Altos 2 - 16 kHz
(+) | agudos equilibrados - apenas 4.4% longe da mediana
(±) | a linearidade dos máximos é média (9.9% delta para frequência anterior)
Geral 100 - 16.000 Hz
(±) | a linearidade do som geral é média (23.8% diferença em relação à mediana)
Comparado com a mesma classe
» 84% de todos os dispositivos testados nesta classe foram melhores, 6% semelhantes, 10% piores
» O melhor teve um delta de 5%, a média foi 17%, o pior foi 45%
Comparado com todos os dispositivos testados
» 71% de todos os dispositivos testados foram melhores, 6% semelhantes, 22% piores
» O melhor teve um delta de 4%, a média foi 23%, o pior foi 134%
HP Pavilion 15-cs0053cl análise de áudio
(±) | o volume do alto-falante é médio, mas bom (###valor### dB)
Graves 100 - 315Hz
(-) | quase nenhum baixo - em média 19.7% menor que a mediana
(-) | graves não são lineares (15.7% delta para frequência anterior)
Médios 400 - 2.000 Hz
(+) | médios equilibrados - apenas 4.1% longe da mediana
(±) | a linearidade dos médios é média (7.9% delta para frequência anterior)
Altos 2 - 16 kHz
(+) | agudos equilibrados - apenas 2.1% longe da mediana
(±) | a linearidade dos máximos é média (7.3% delta para frequência anterior)
Geral 100 - 16.000 Hz
(±) | a linearidade do som geral é média (21.8% diferença em relação à mediana)
Comparado com a mesma classe
» 77% de todos os dispositivos testados nesta classe foram melhores, 5% semelhantes, 18% piores
» O melhor teve um delta de 5%, a média foi 17%, o pior foi 45%
Comparado com todos os dispositivos testados
» 62% de todos os dispositivos testados foram melhores, 7% semelhantes, 31% piores
» O melhor teve um delta de 4%, a média foi 23%, o pior foi 134%
| desligado | |
| Ocioso | |
| Carga |
|
Key:
min: | |
| Lenovo Ideapad 530S-15IKB i5-8250U, UHD Graphics 620, SK hynix PC401 HFS256GD9TNG, IPS, 1920x1080, 15.6" | HP Pavilion 15-cs0053cl i5-8250U, UHD Graphics 620, Toshiba MQ04ABF100, TN LED, 1366x768, 15.6" | Asus VivoBook 15 X570UD i5-8550U, GeForce GTX 1050 Mobile, SK hynix PC300 HFS512GD9MND, IPS, 1920x1080, 15.6" | Dell Inspiron 15 5579-9672 i5-8250U, UHD Graphics 620, SK hynix SC311 SATA, IPS, 1920x1080, 15.6" | Acer Aspire 3 A315-41-R7BM R3 2200U, Vega 3, SK Hynix HFS256G39TND-N210A, TN LED, 1920x1080, 15.6" | Dell XPS 15 2018 i5 FHD 97Wh i5-8300H, GeForce GTX 1050 Mobile, Lite-On CA3-8D256-Q11, LED IGZO IPS InfinityEdge, 1920x1080, 15.6" | |
|---|---|---|---|---|---|---|
| Power Consumption | -12% | -87% | -3% | -32% | -66% | |
| Idle Minimum * (Watt) | 3.5 | 5.6 -60% | 5.1 -46% | 3.9 -11% | 5.6 -60% | 2.9 17% |
| Idle Average * (Watt) | 5.6 | 7.1 -27% | 6.3 -13% | 6.6 -18% | 8.5 -52% | 5.8 -4% |
| Idle Maximum * (Watt) | 10.3 | 7.9 23% | 10.5 -2% | 9.3 10% | 8.4 18% | 7.5 27% |
| Load Average * (Watt) | 30.5 | 32.8 -8% | 82.2 -170% | 30.2 1% | 41 -34% | 77.5 -154% |
| Load Maximum * (Watt) | 33.8 | 30.5 10% | 103.2 -205% | 33.2 2% | 44.2 -31% | 107 -217% |
| Witcher 3 ultra * (Watt) | 85.9 | 32 | 84 |
* ... menor é melhor
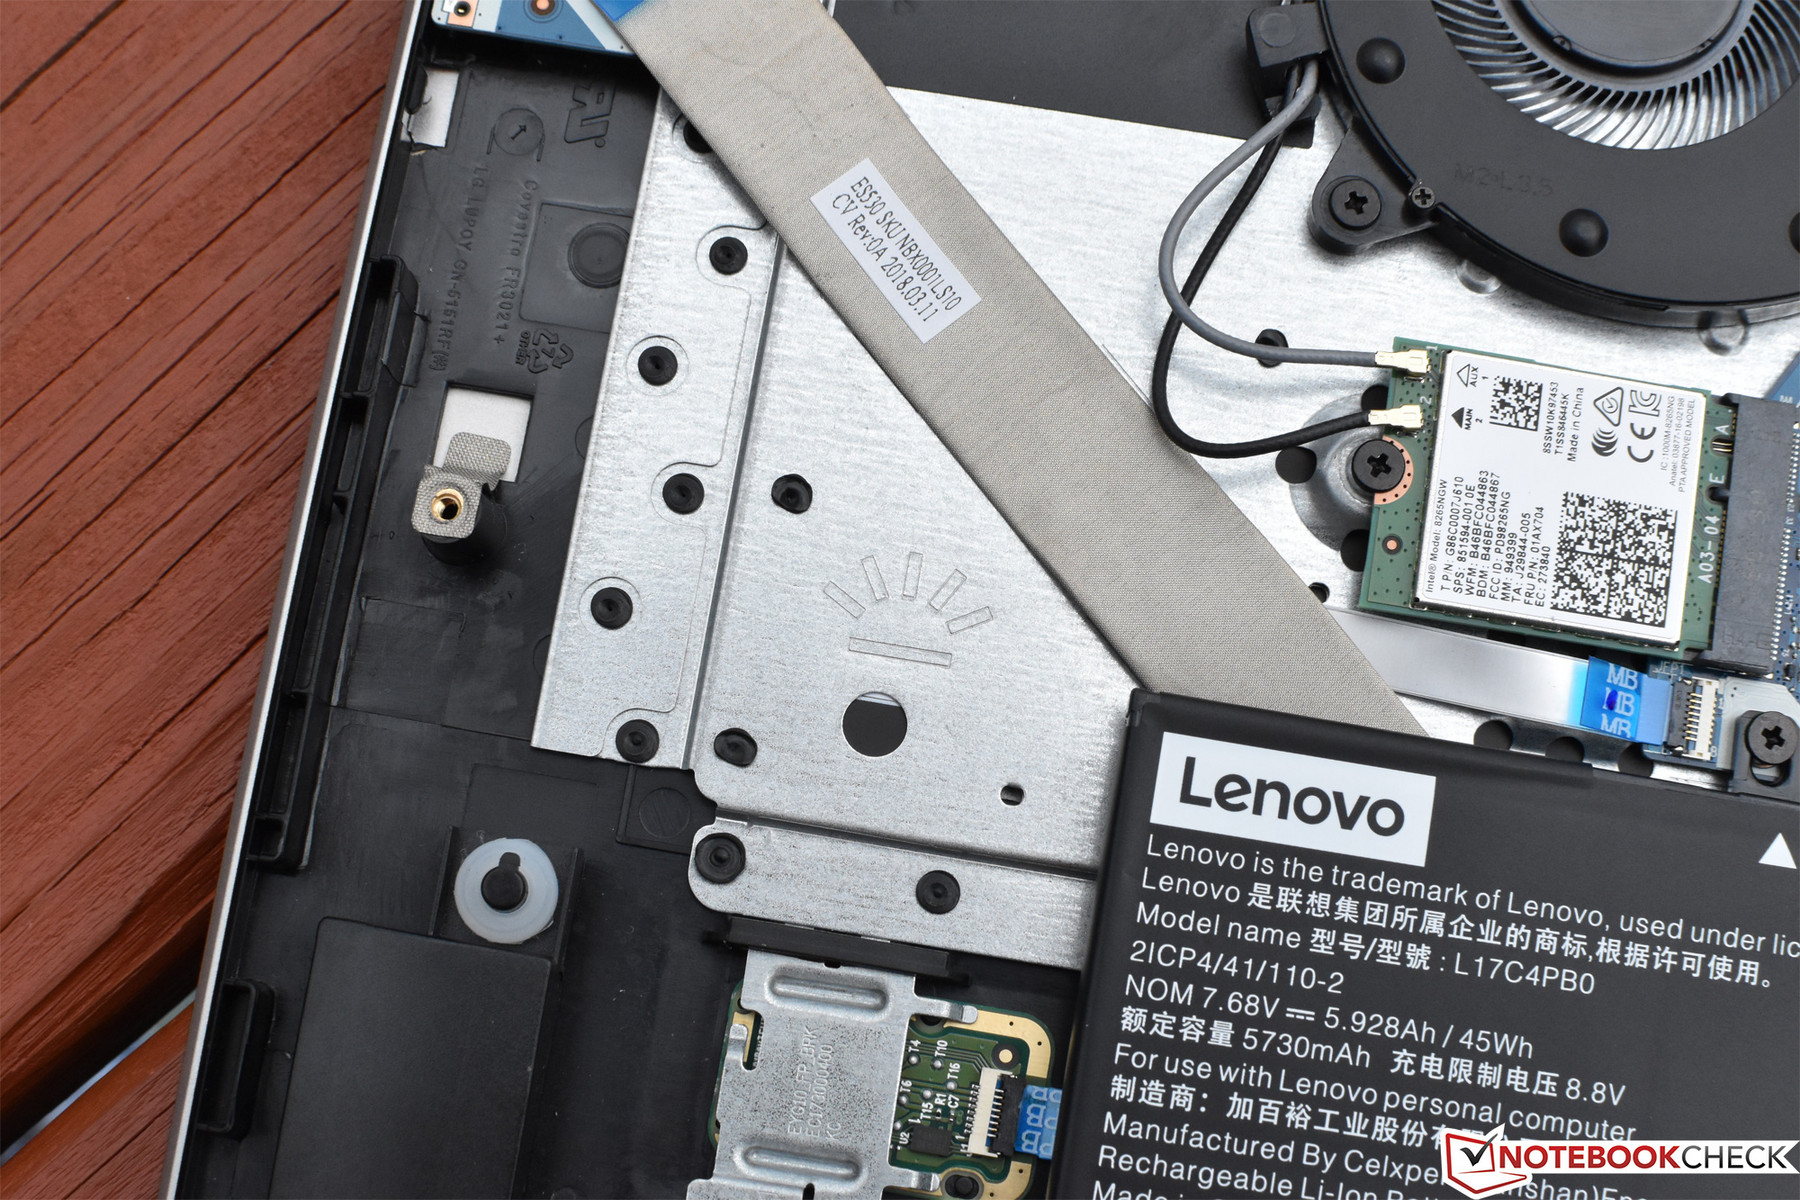
| Lenovo Ideapad 530S-15IKB i5-8250U, UHD Graphics 620, 45 Wh | HP Pavilion 15-cs0053cl i5-8250U, UHD Graphics 620, 41 Wh | Asus VivoBook 15 X570UD i5-8550U, GeForce GTX 1050 Mobile, 48 Wh | Dell Inspiron 15 5579-9672 i5-8250U, UHD Graphics 620, 42 Wh | Acer Aspire 3 A315-41-R7BM R3 2200U, Vega 3, 37 Wh | Dell XPS 15 2018 i5 FHD 97Wh i5-8300H, GeForce GTX 1050 Mobile, 97 Wh | |
|---|---|---|---|---|---|---|
| Duração da bateria | 8% | -18% | 12% | -12% | 142% | |
| WiFi v1.3 (h) | 6.5 | 7 8% | 5.3 -18% | 7.3 12% | 5.7 -12% | 15.7 142% |
| Reader / Idle (h) | 12 | 11.2 | 8.9 | |||
| Load (h) | 2.2 | 1.8 | 1.4 | 1.9 | ||
| Witcher 3 ultra (h) | 1 |
Pro
Contra
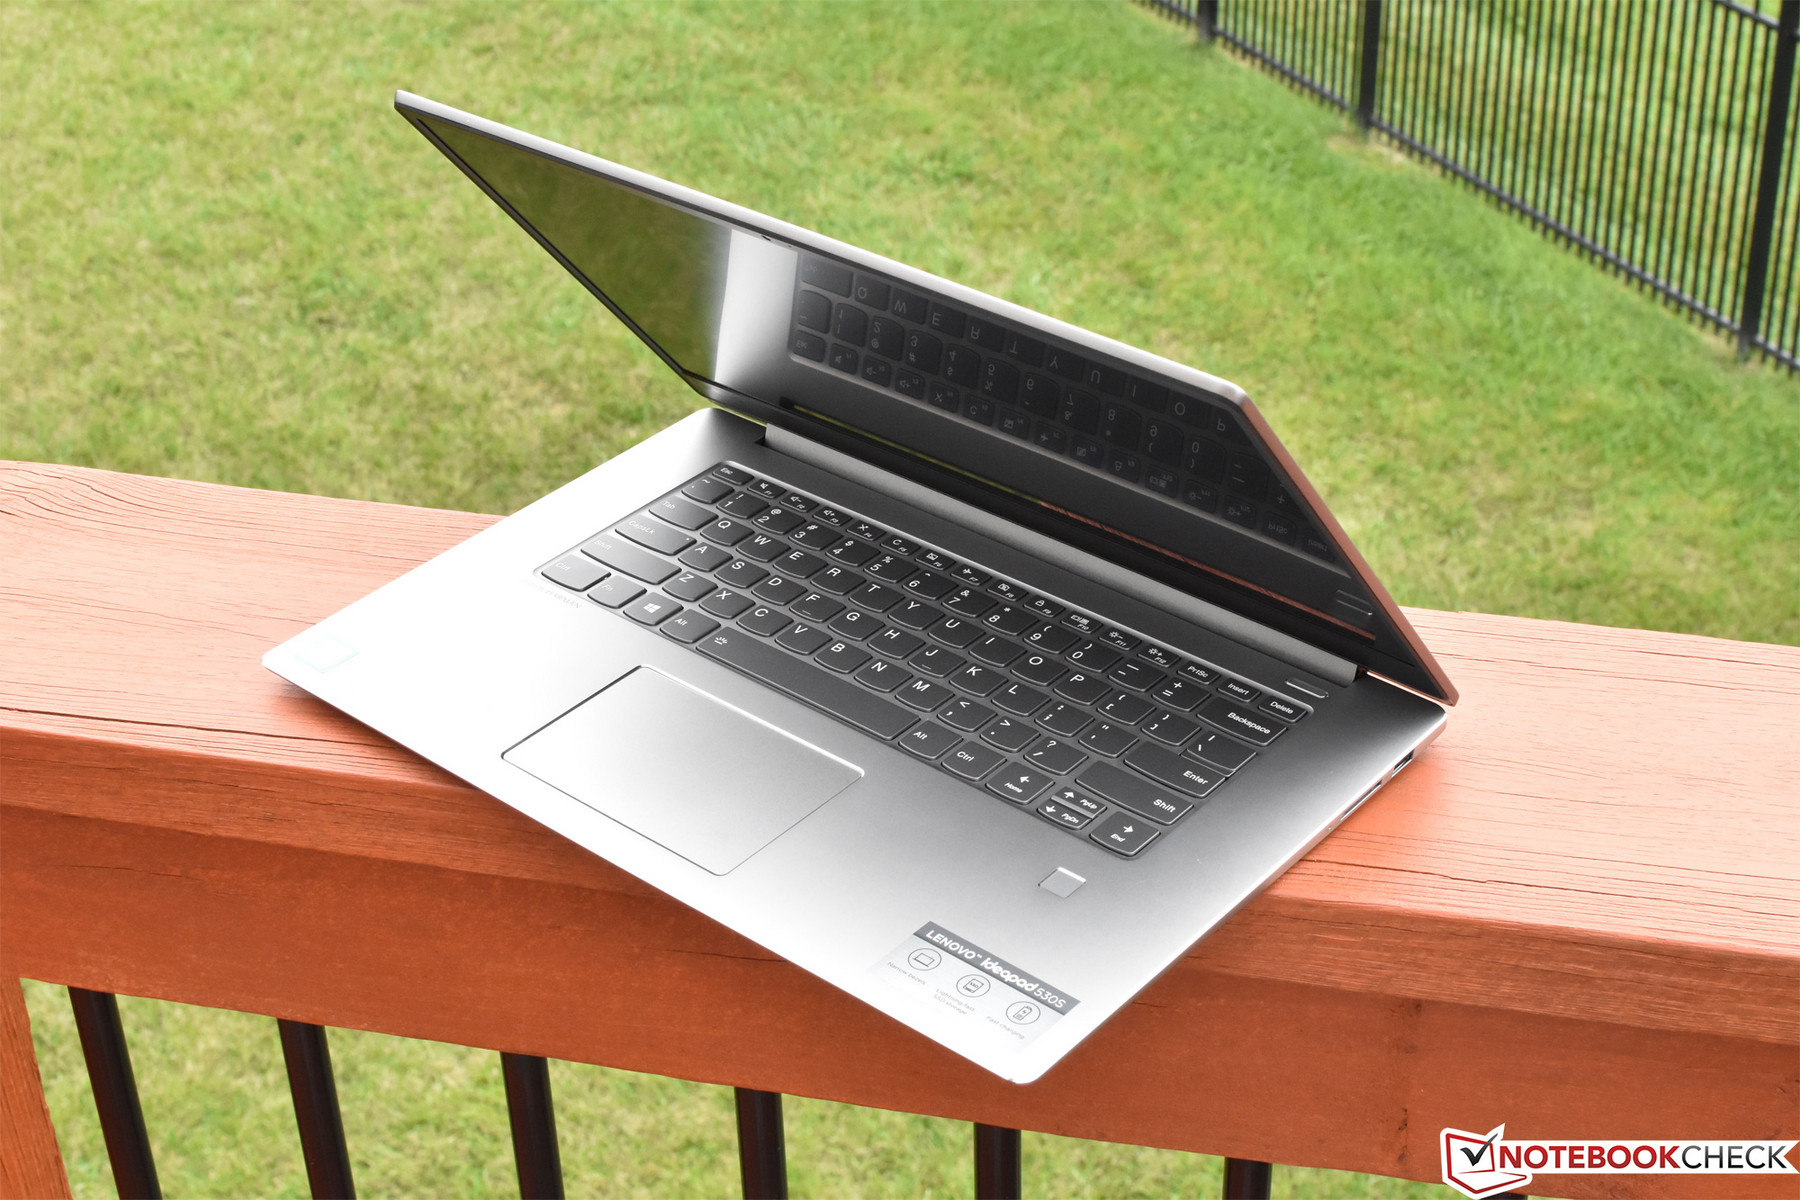
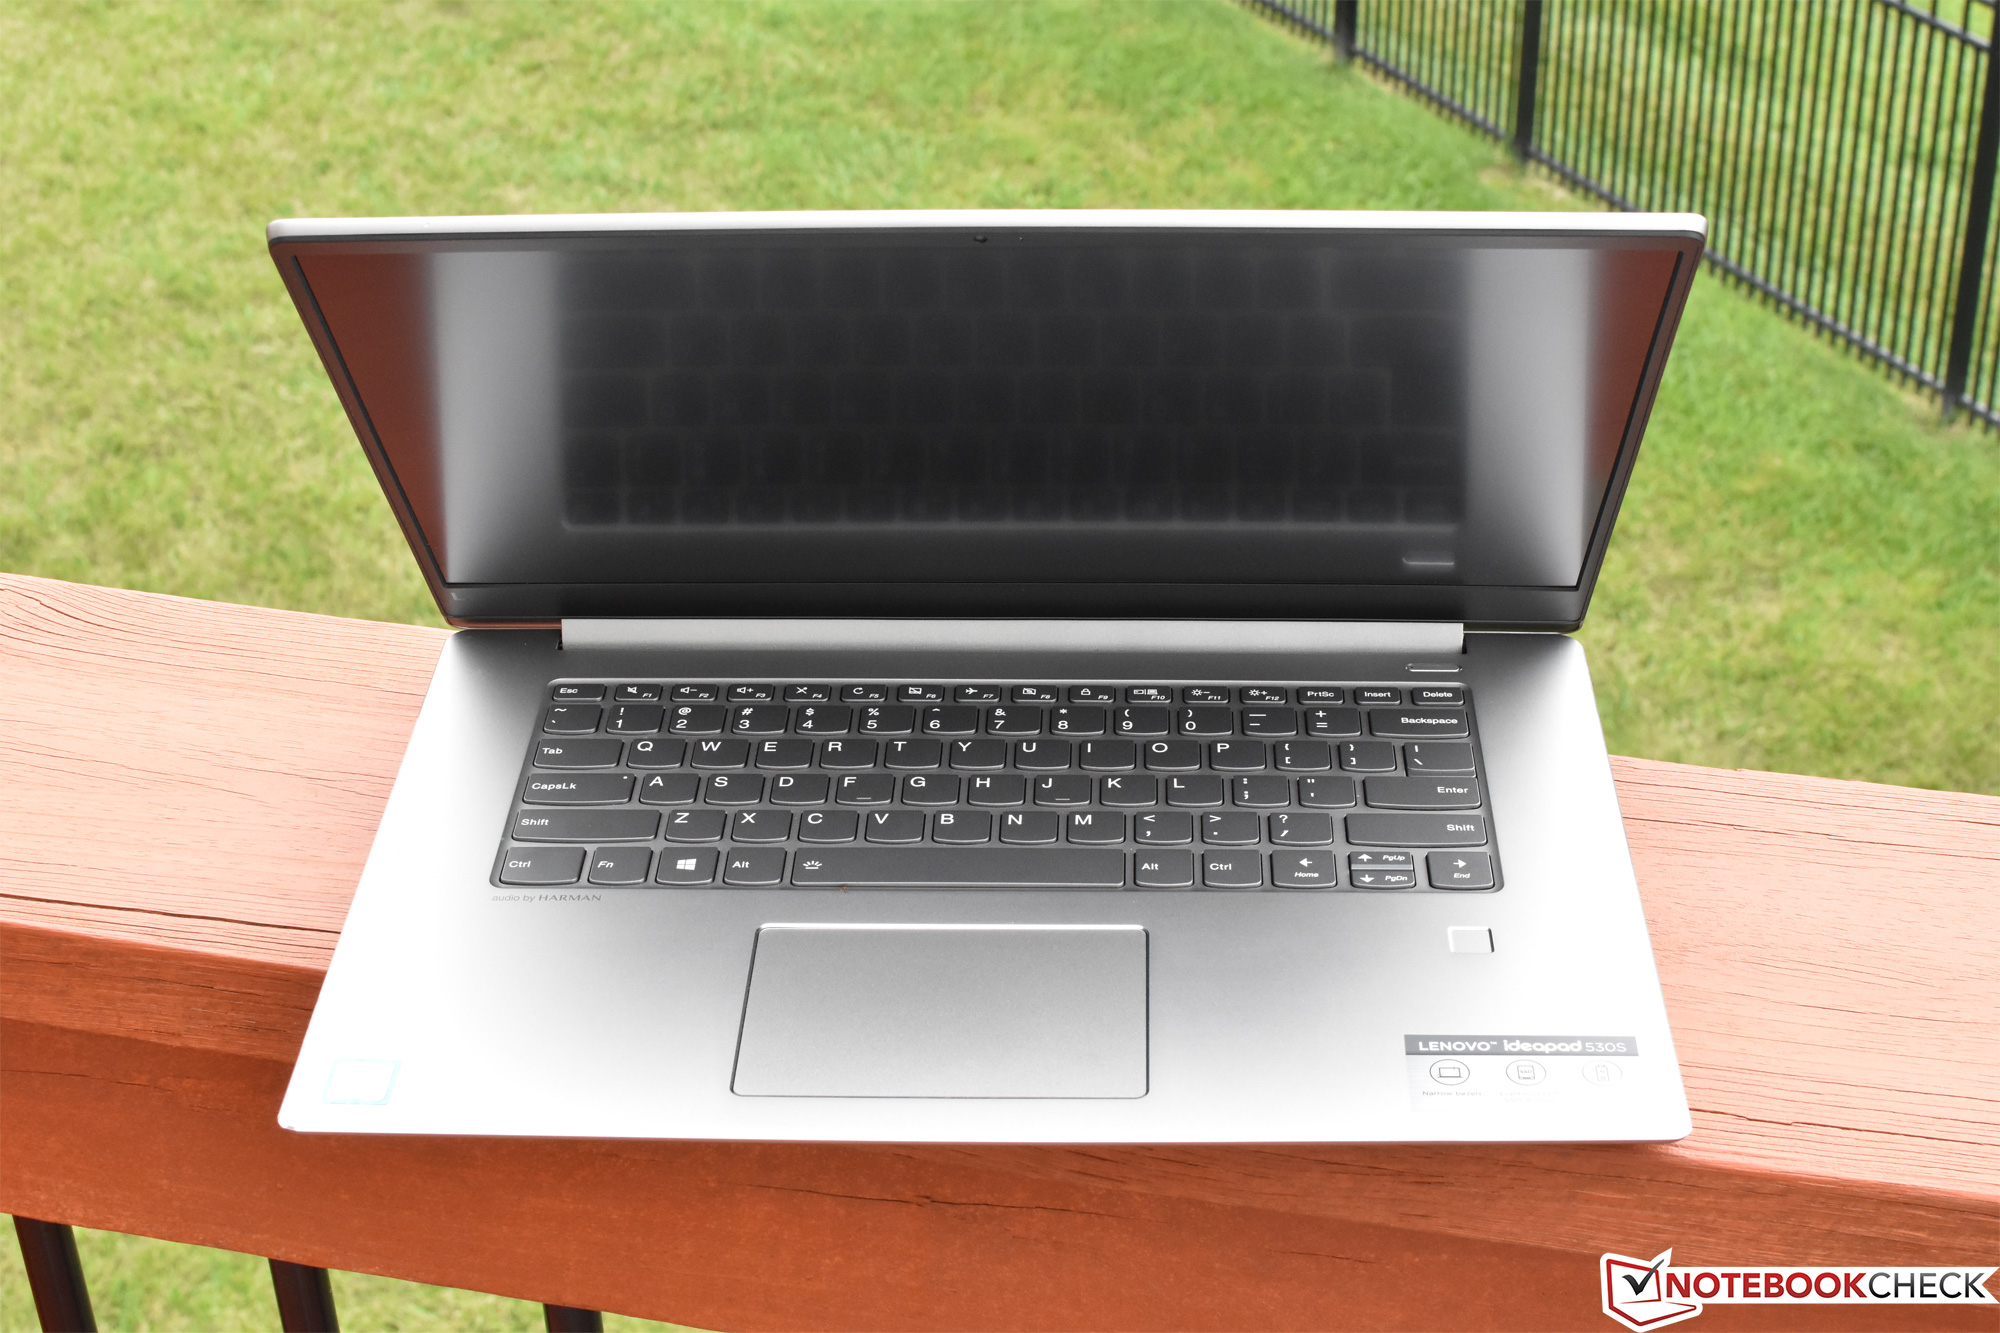
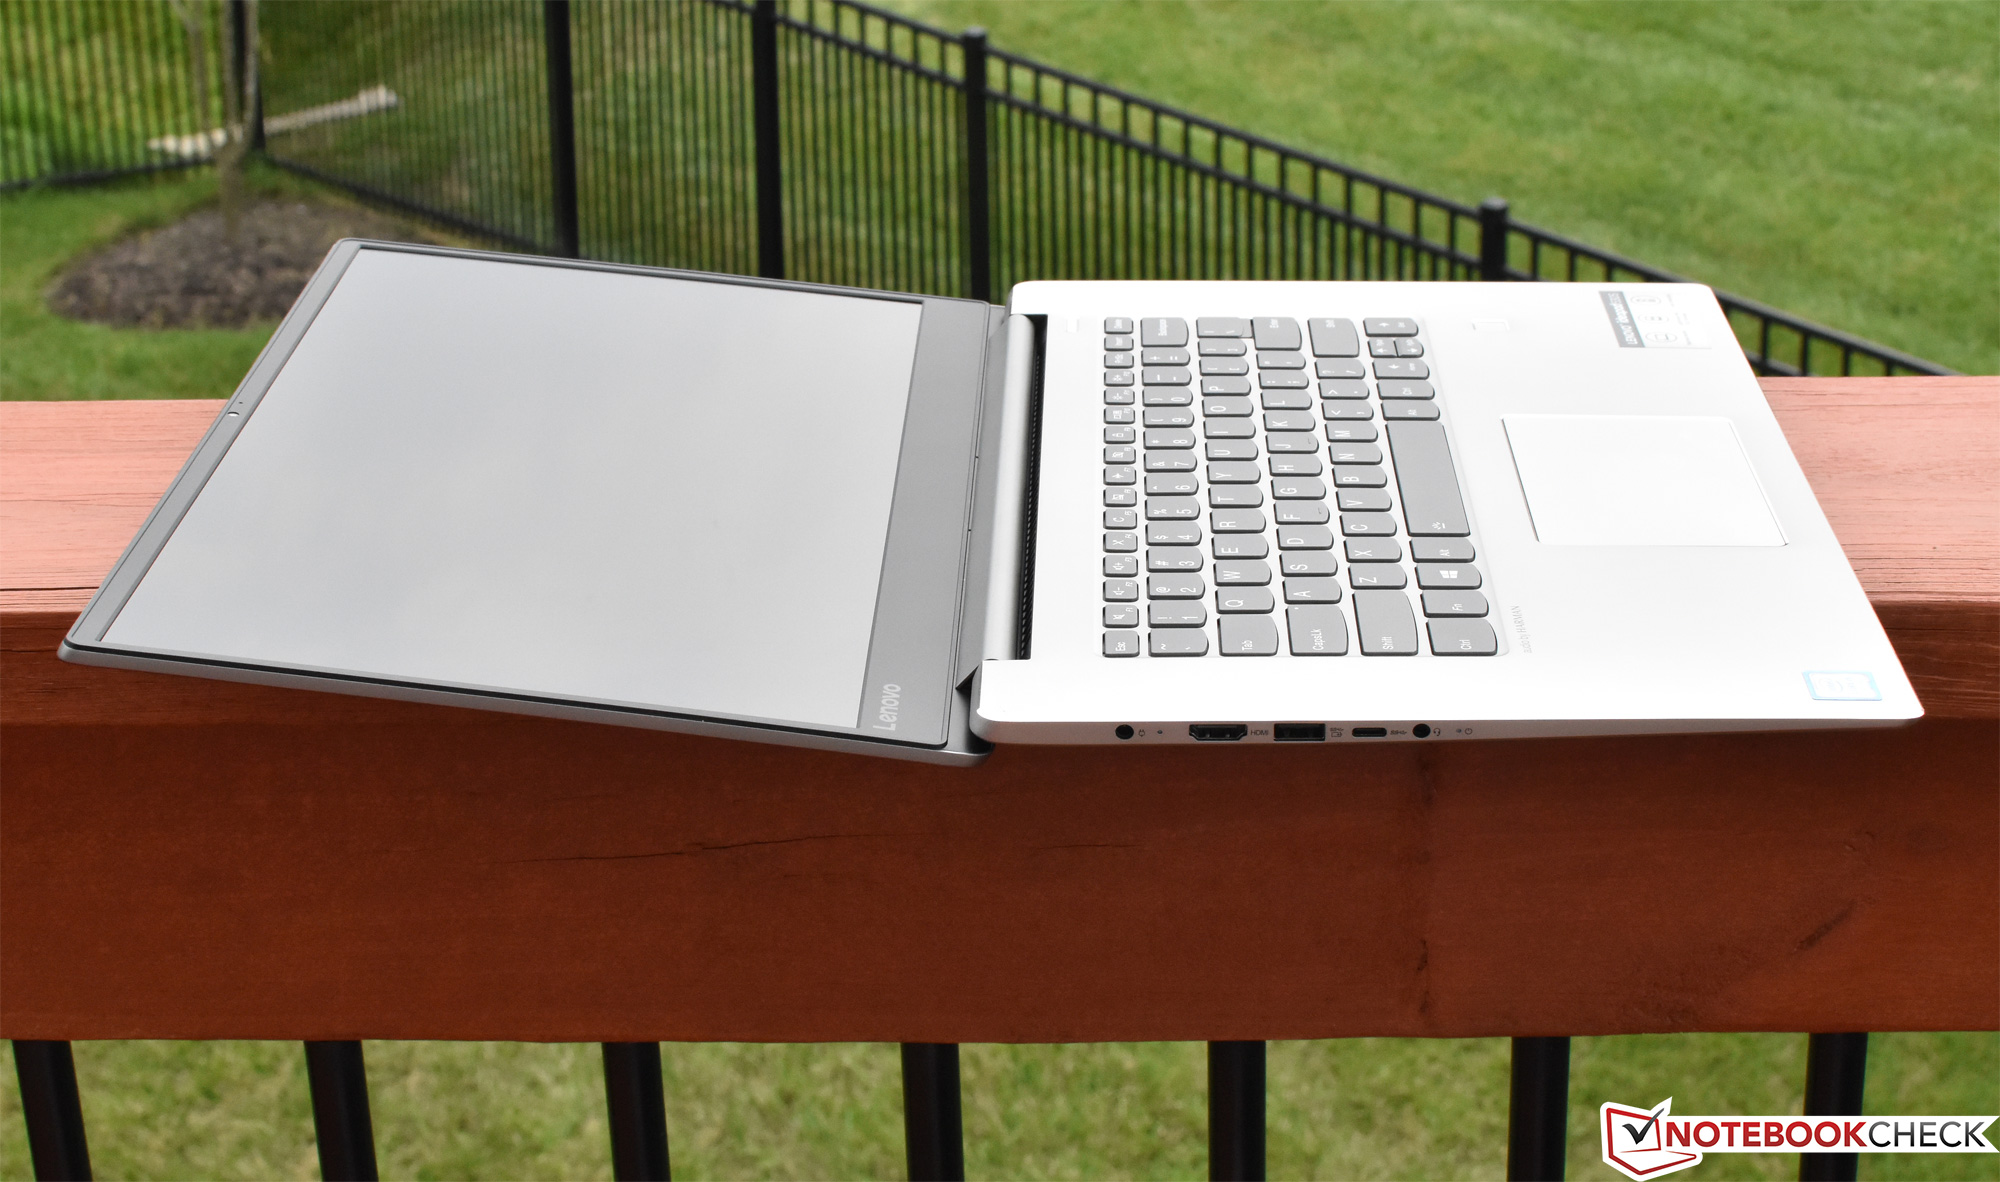
Para quem estiver interessado em um portátil de entretenimento atraente, relativamente robusto e muito versátil, que não esvazie a carteira, vale a pena dar uma olhada no IdeaPad 530S de $699. Graças à sua capaz CPU quad-core i5-8250U, muita memória RAM e rápido armazenamento NVMe, nossa unidade de análise gerenciou um desempenho geral muito bom em nossos testes. Embora nossos benchmarks de CPU tenham ficado aquém dos concorrentes equipados de forma similar, as margens eram pequenas, e os baixos níveis de ruído do ventilador e o desenvolvimento de temperatura provavelmente compensariam a discrepância nos olhos da maioria dos usuários.
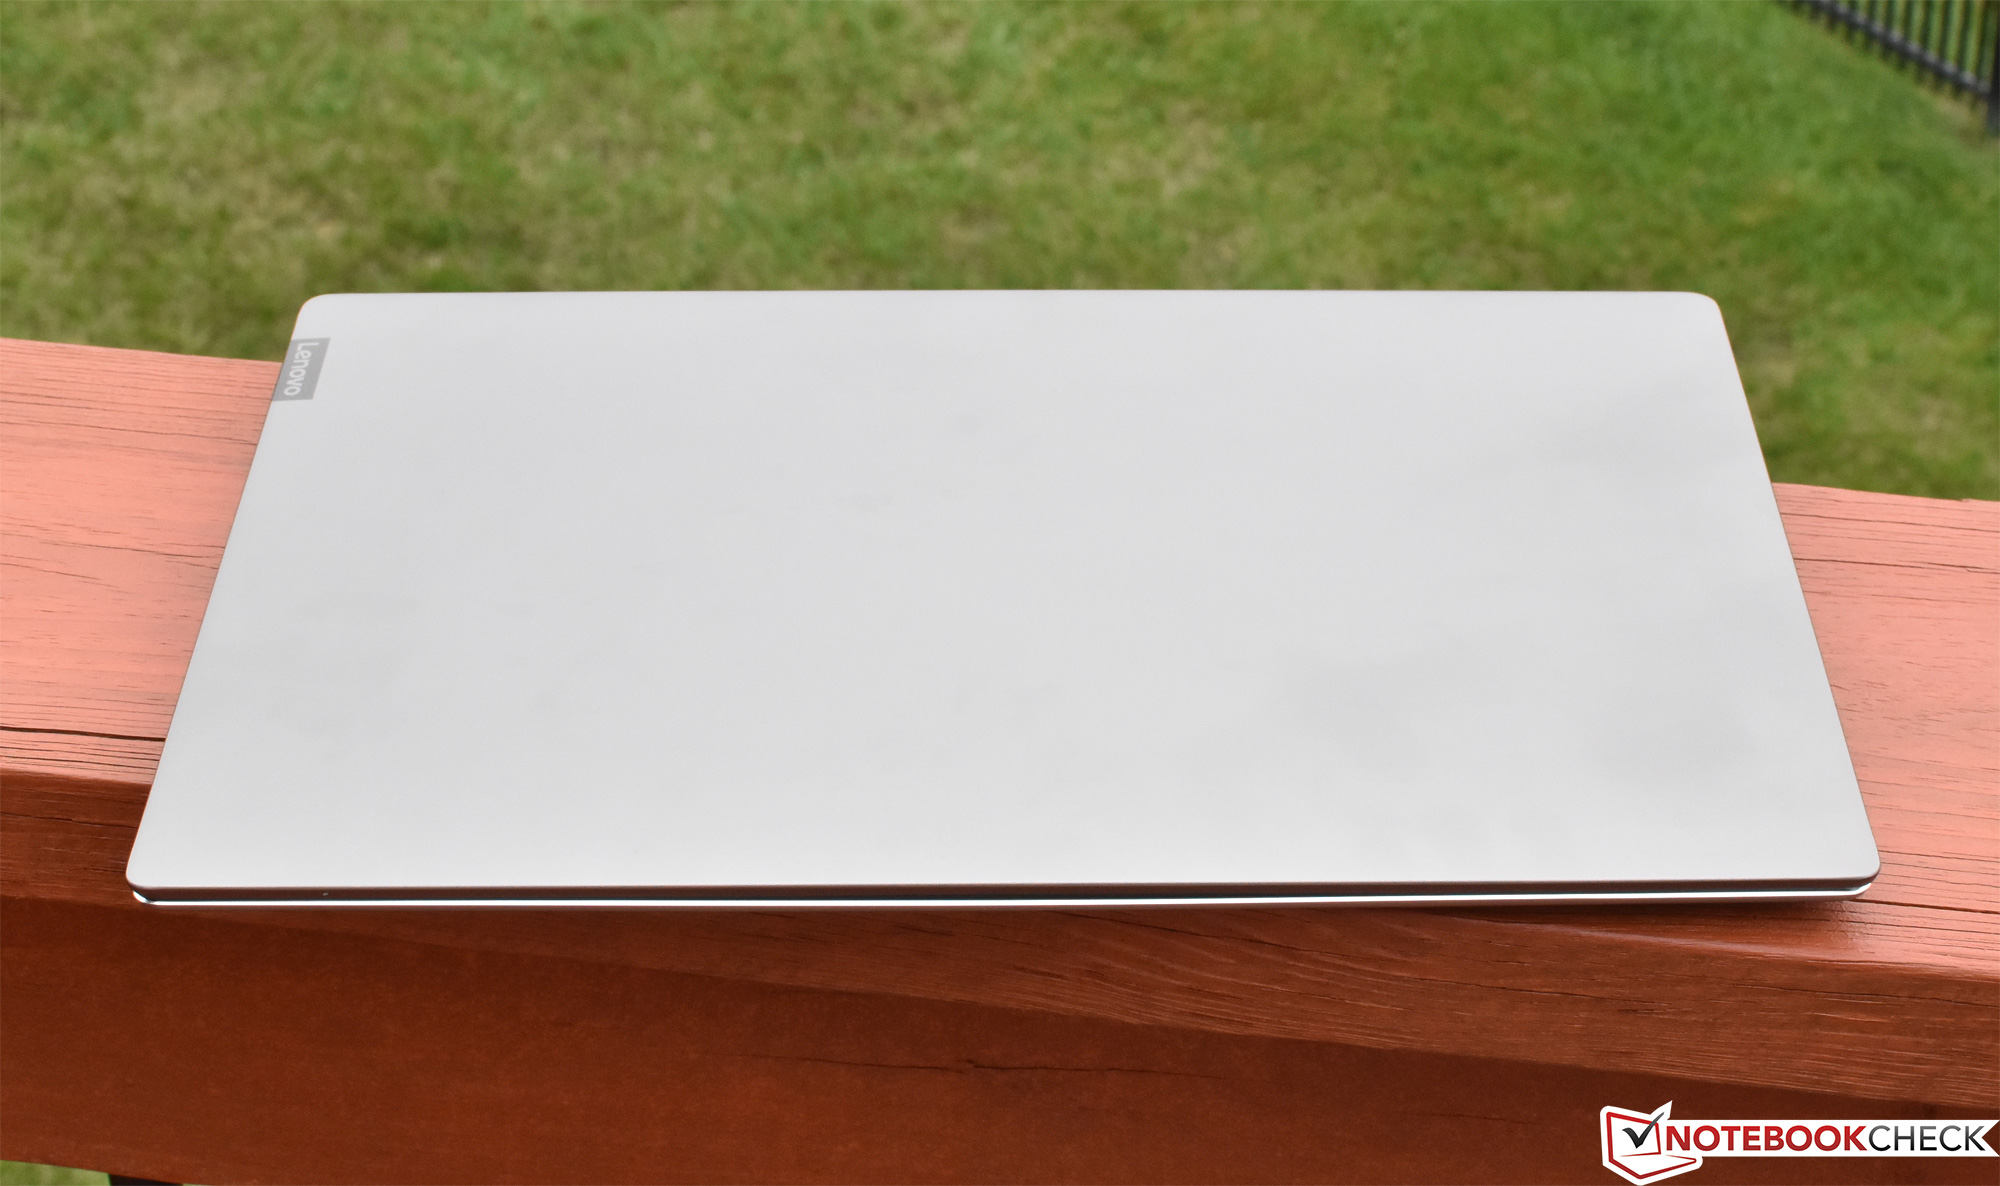
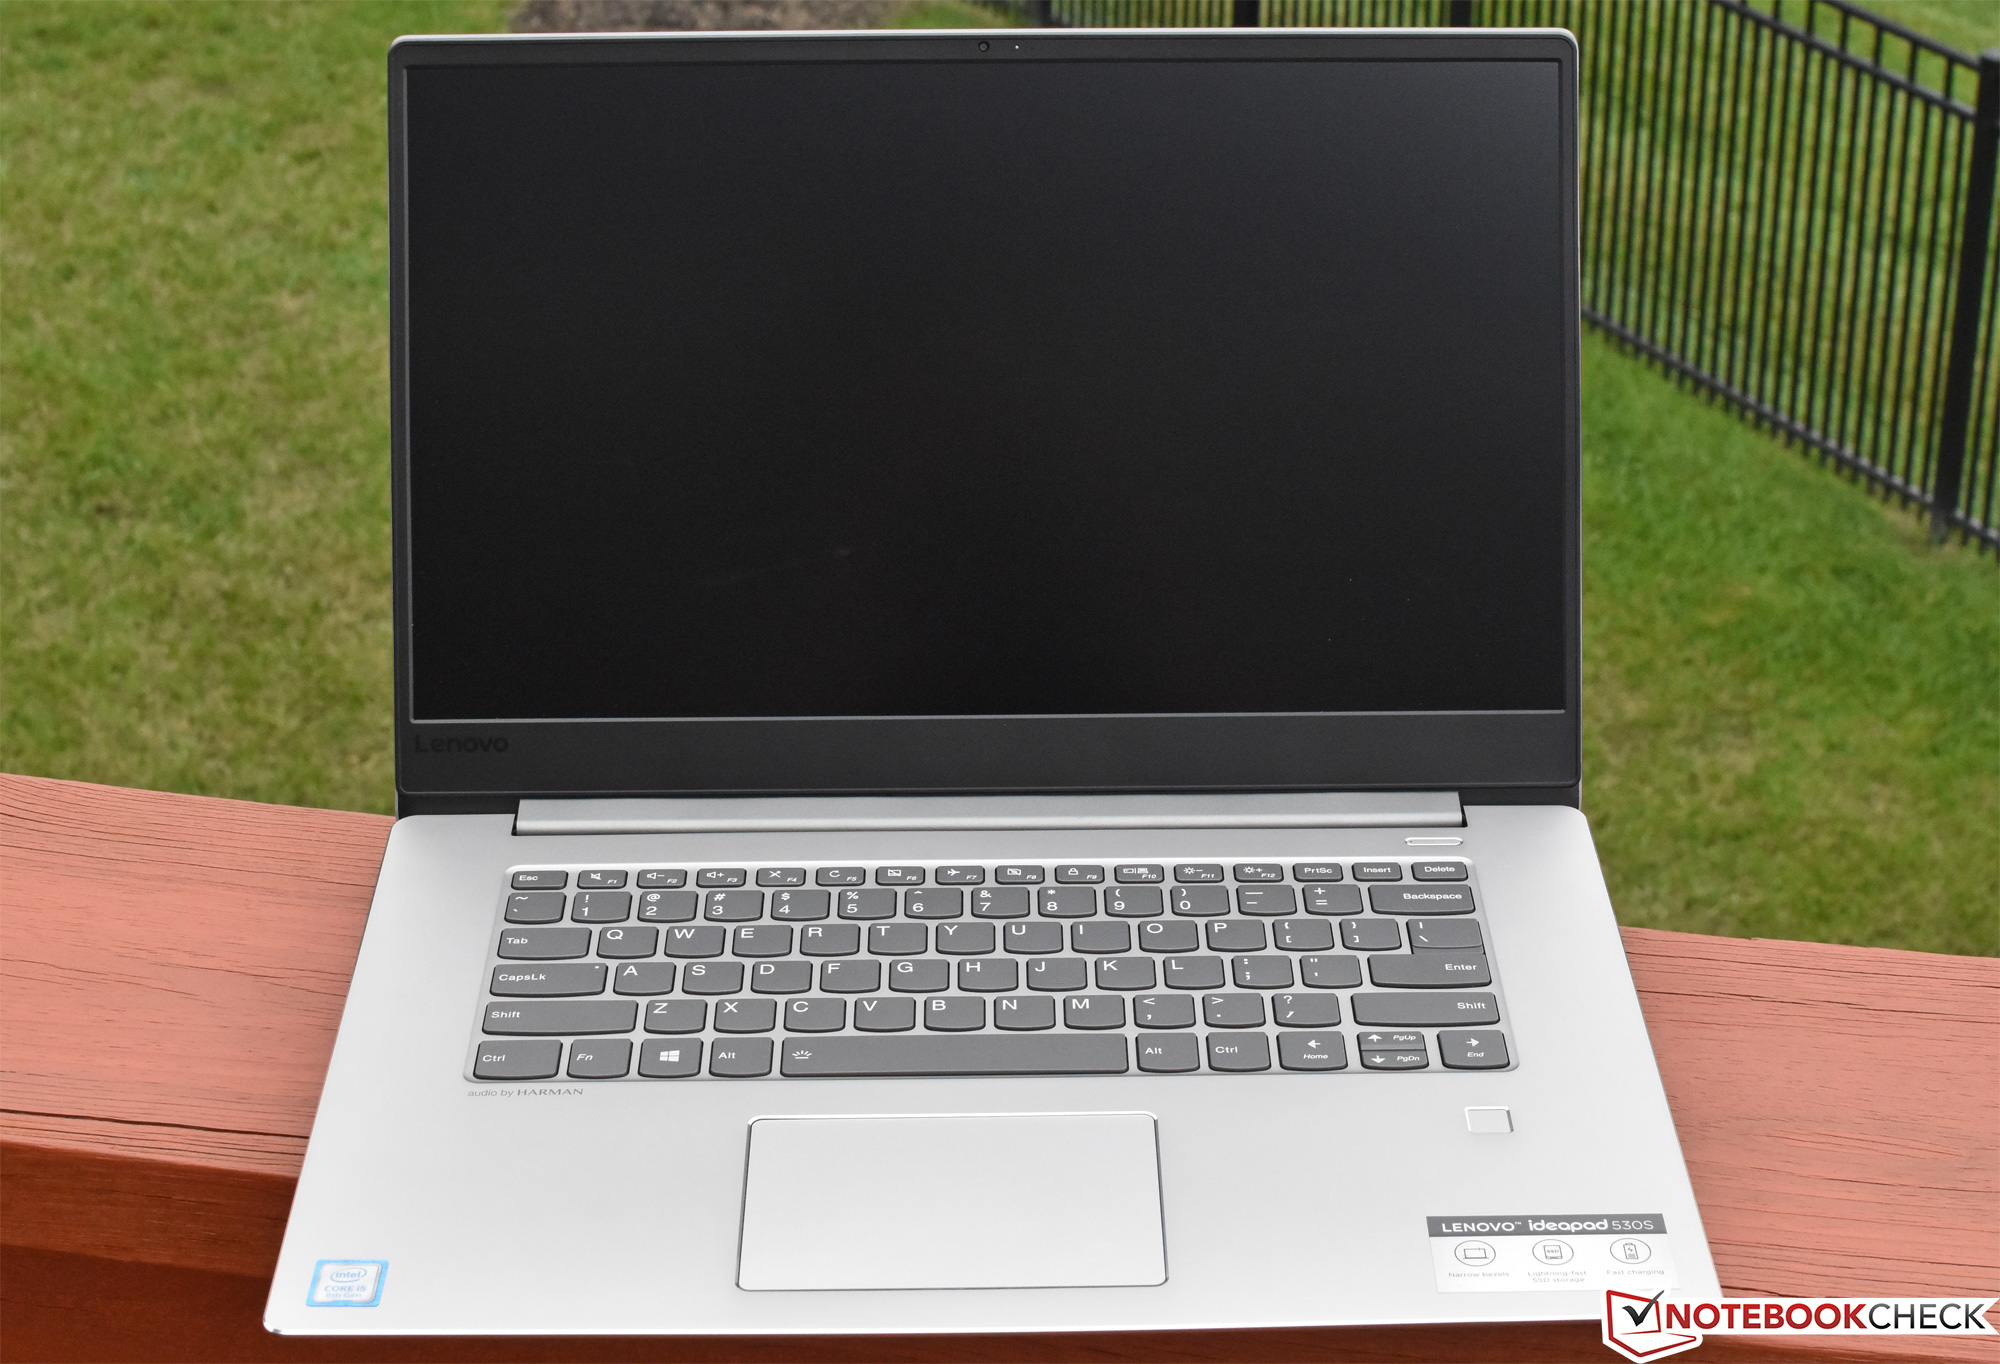
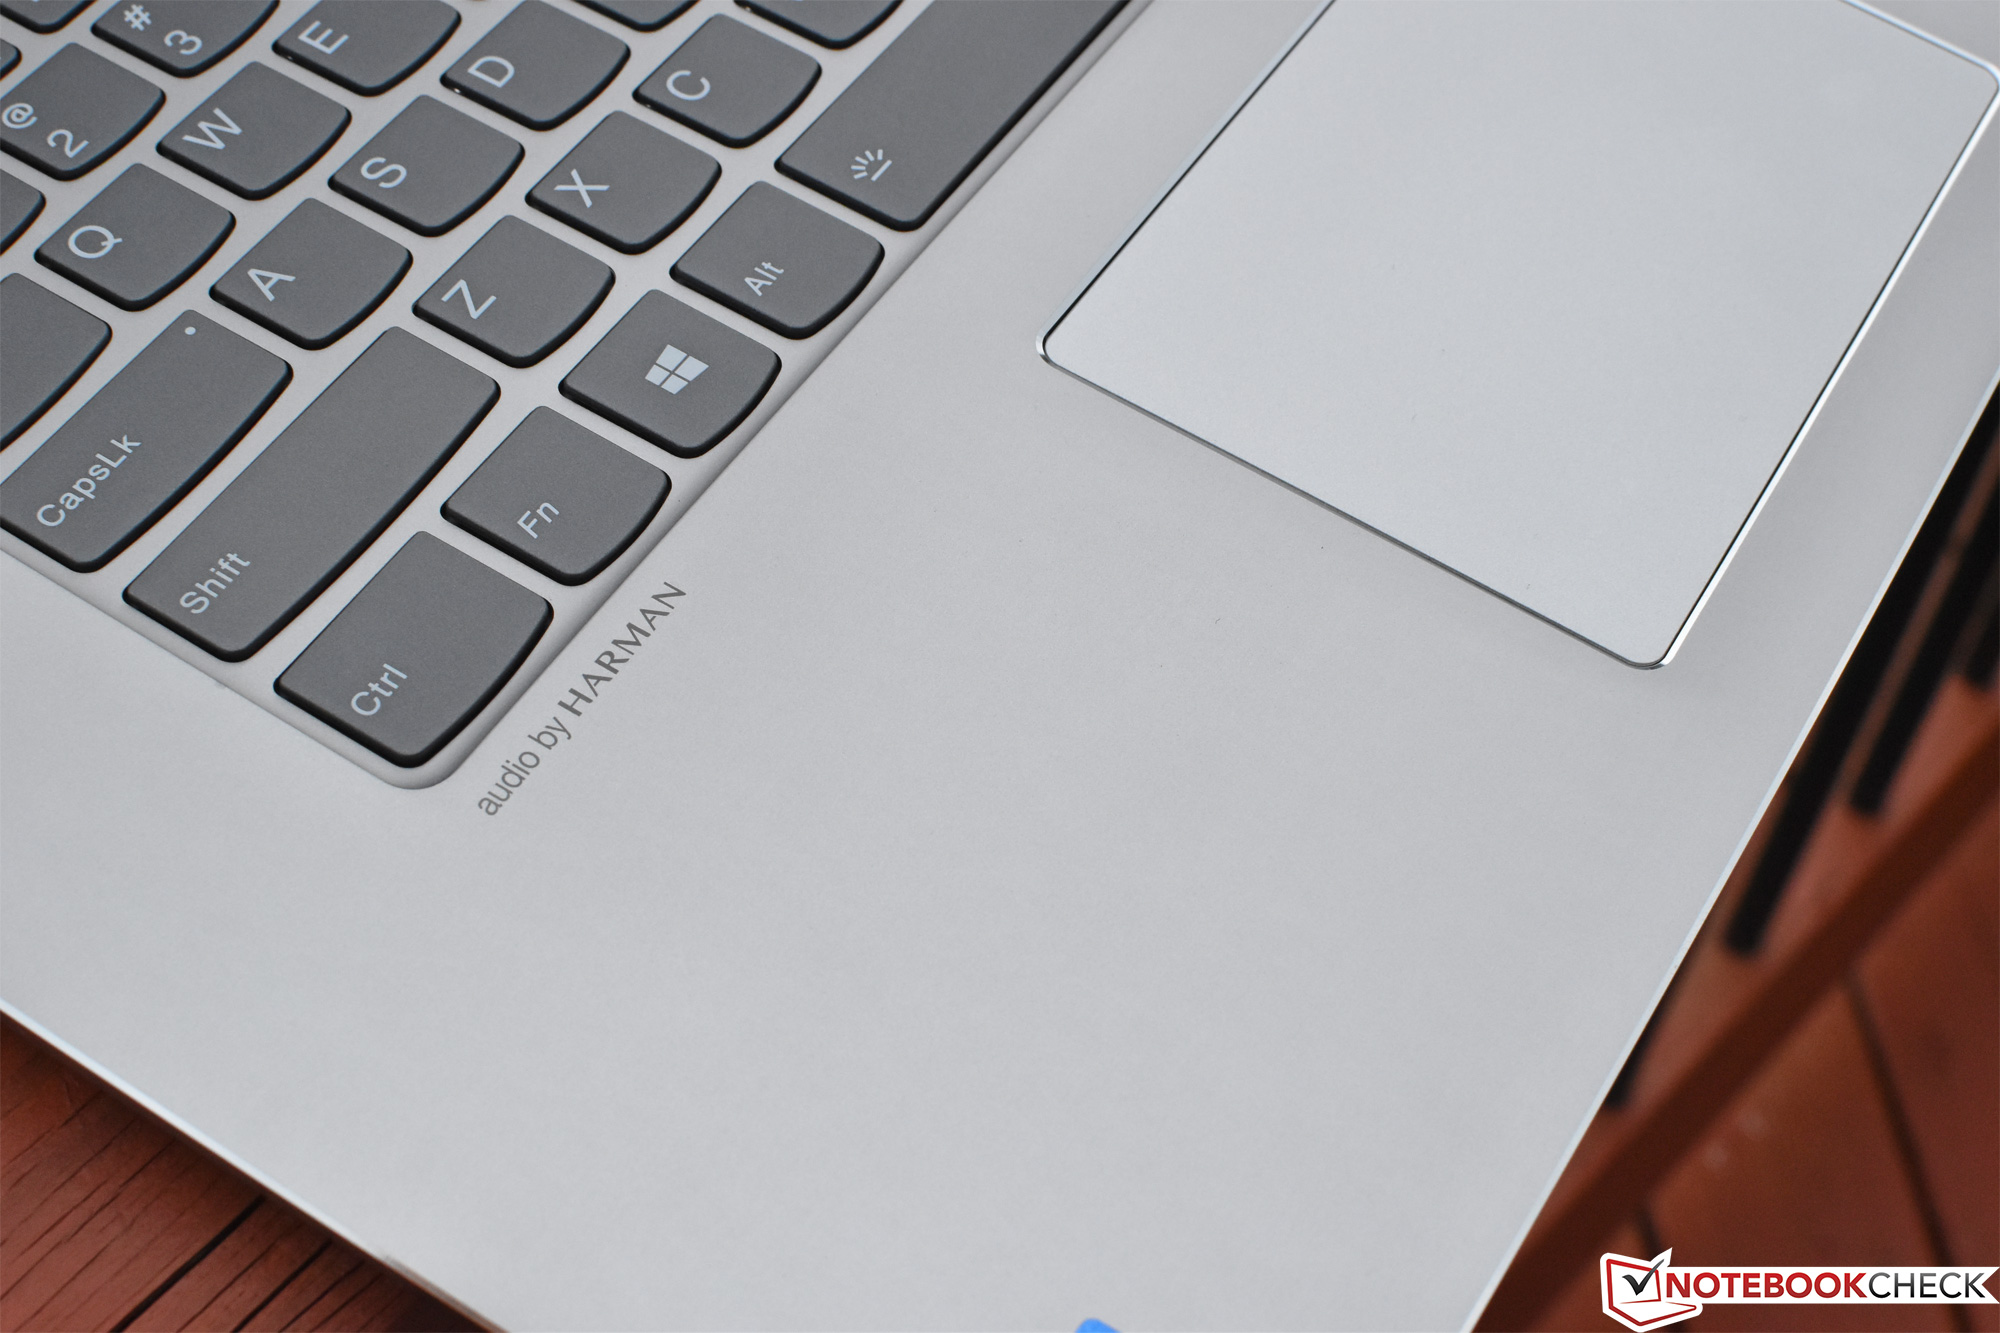
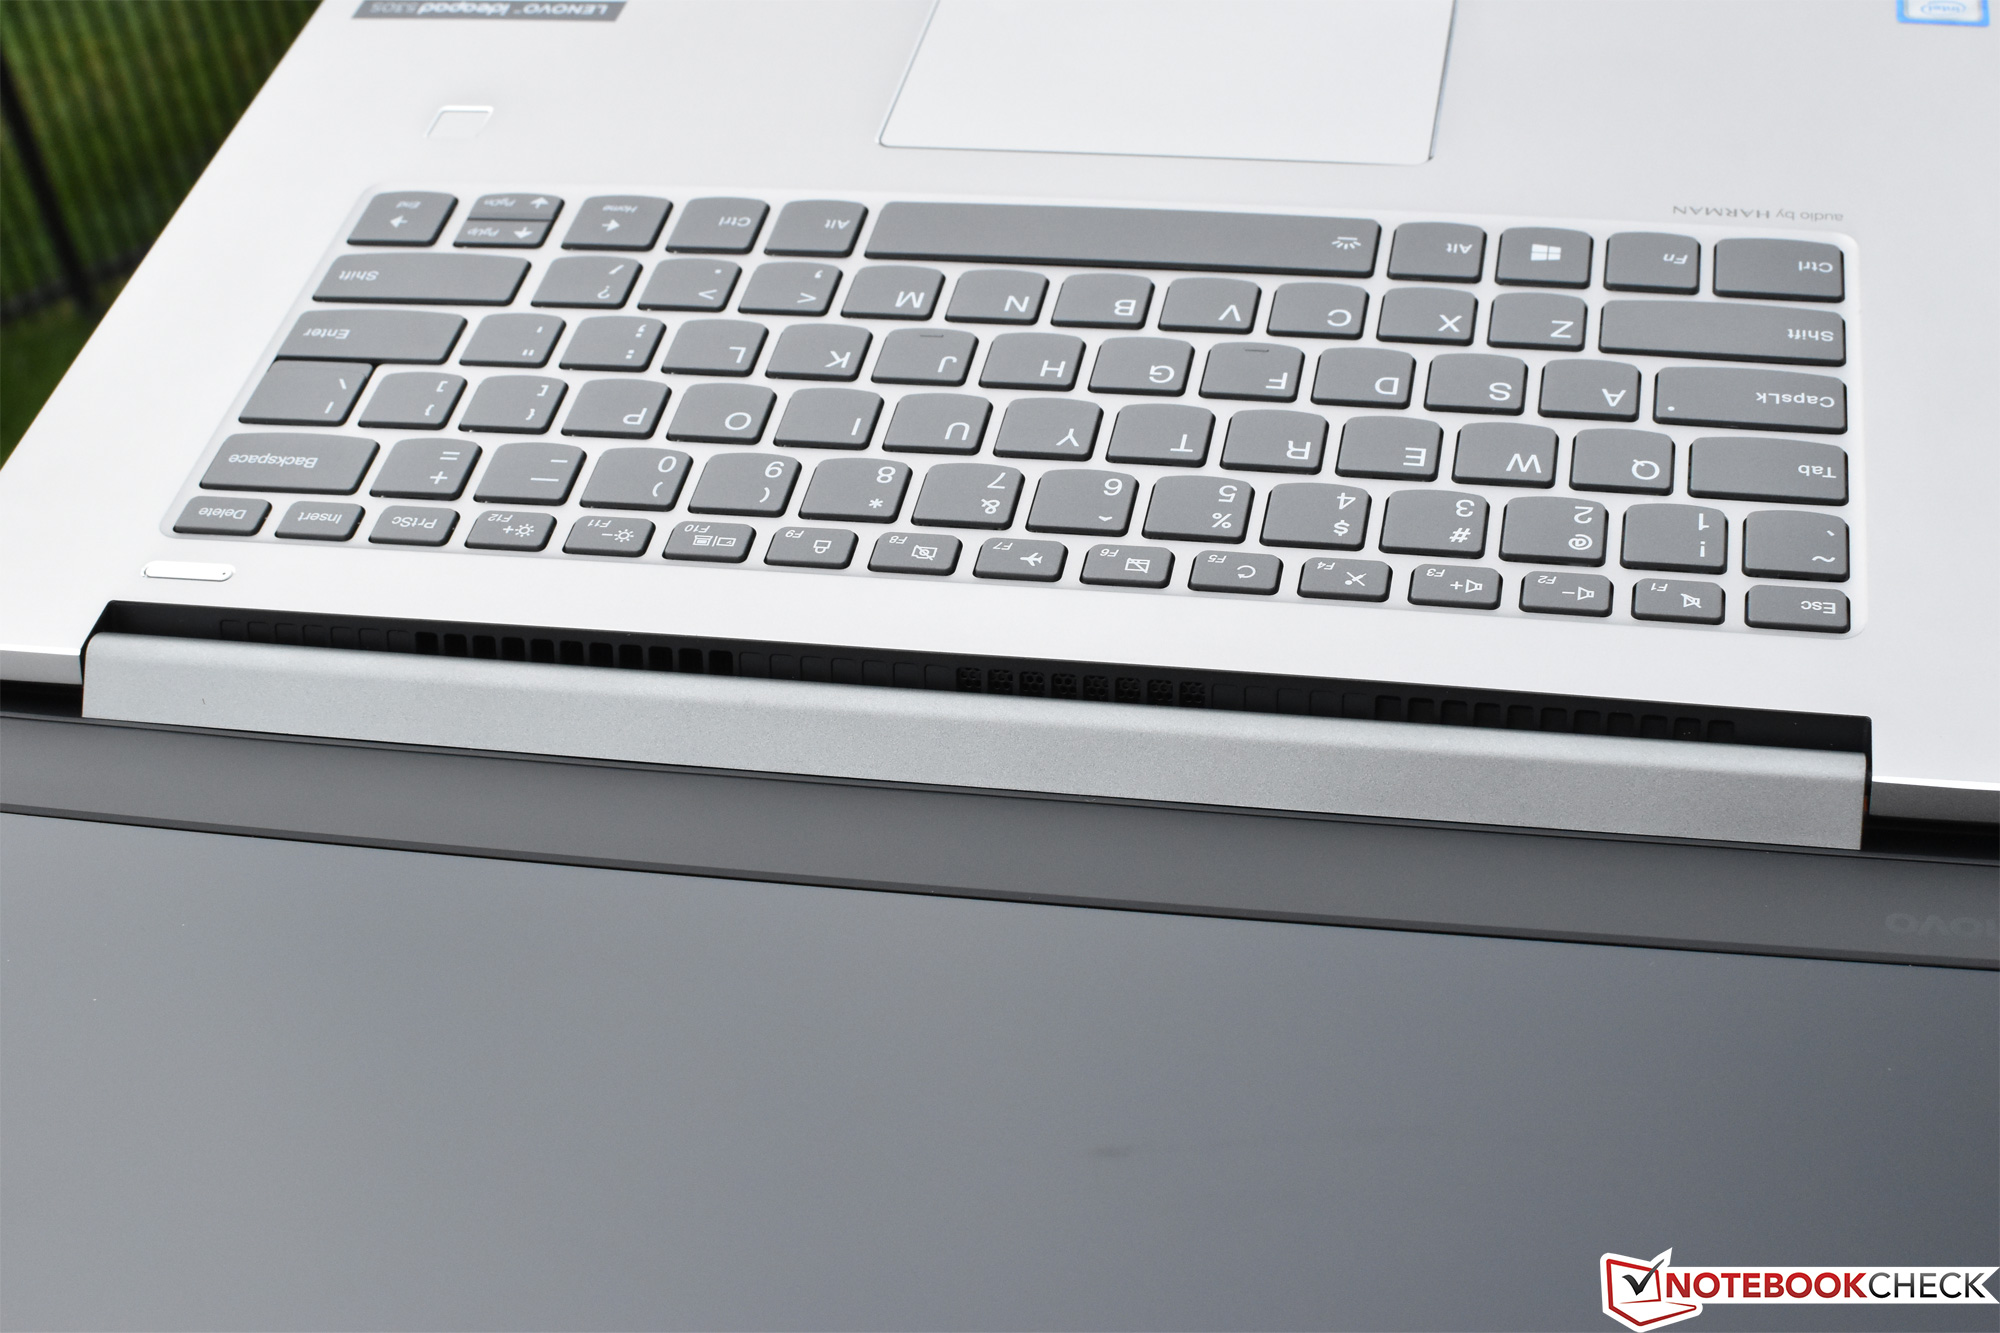
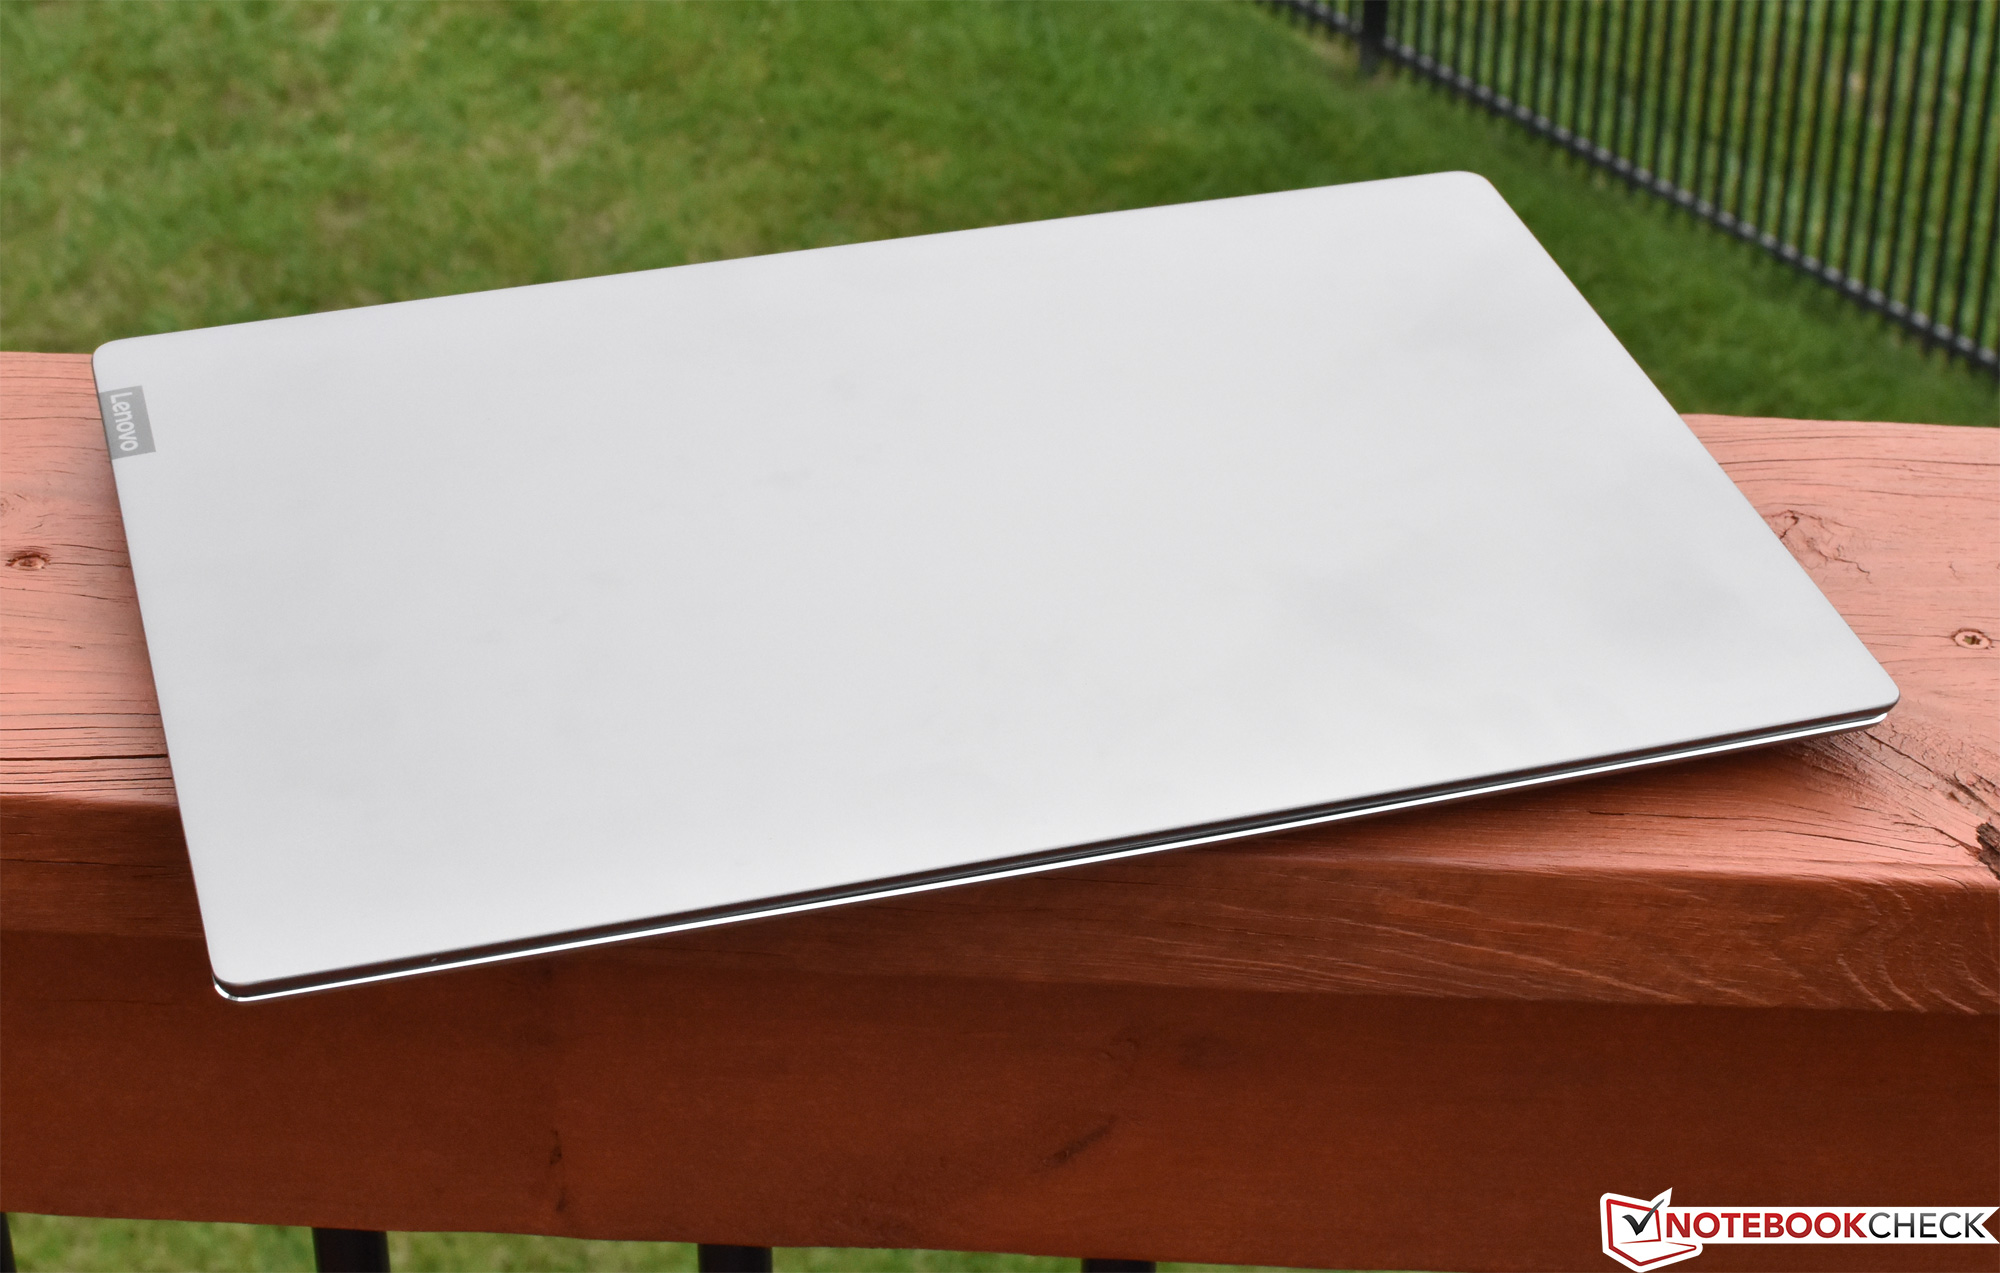
A qualidade da construção também é de alto nível, aproveitando superfícies de alumínio usinadas CNC e marcos super finos para evocar os pensamentos dos portáteis HP Spectre e Dell XPS - a uma fração do custo. Os dispositivos de entrada também são bastante bons no geral, embora os líderes da categoria estejam acima do IdeaPad aqui.
O que o IdeaPad 530S realiza é bastante valioso. Se nada mais, representa um passo perfeitamente adequado da linha de máquinas ultra-premium de hoje para um lugar um pouco mais humilde onde a perfeição é trocada cuidadosamente por valor.
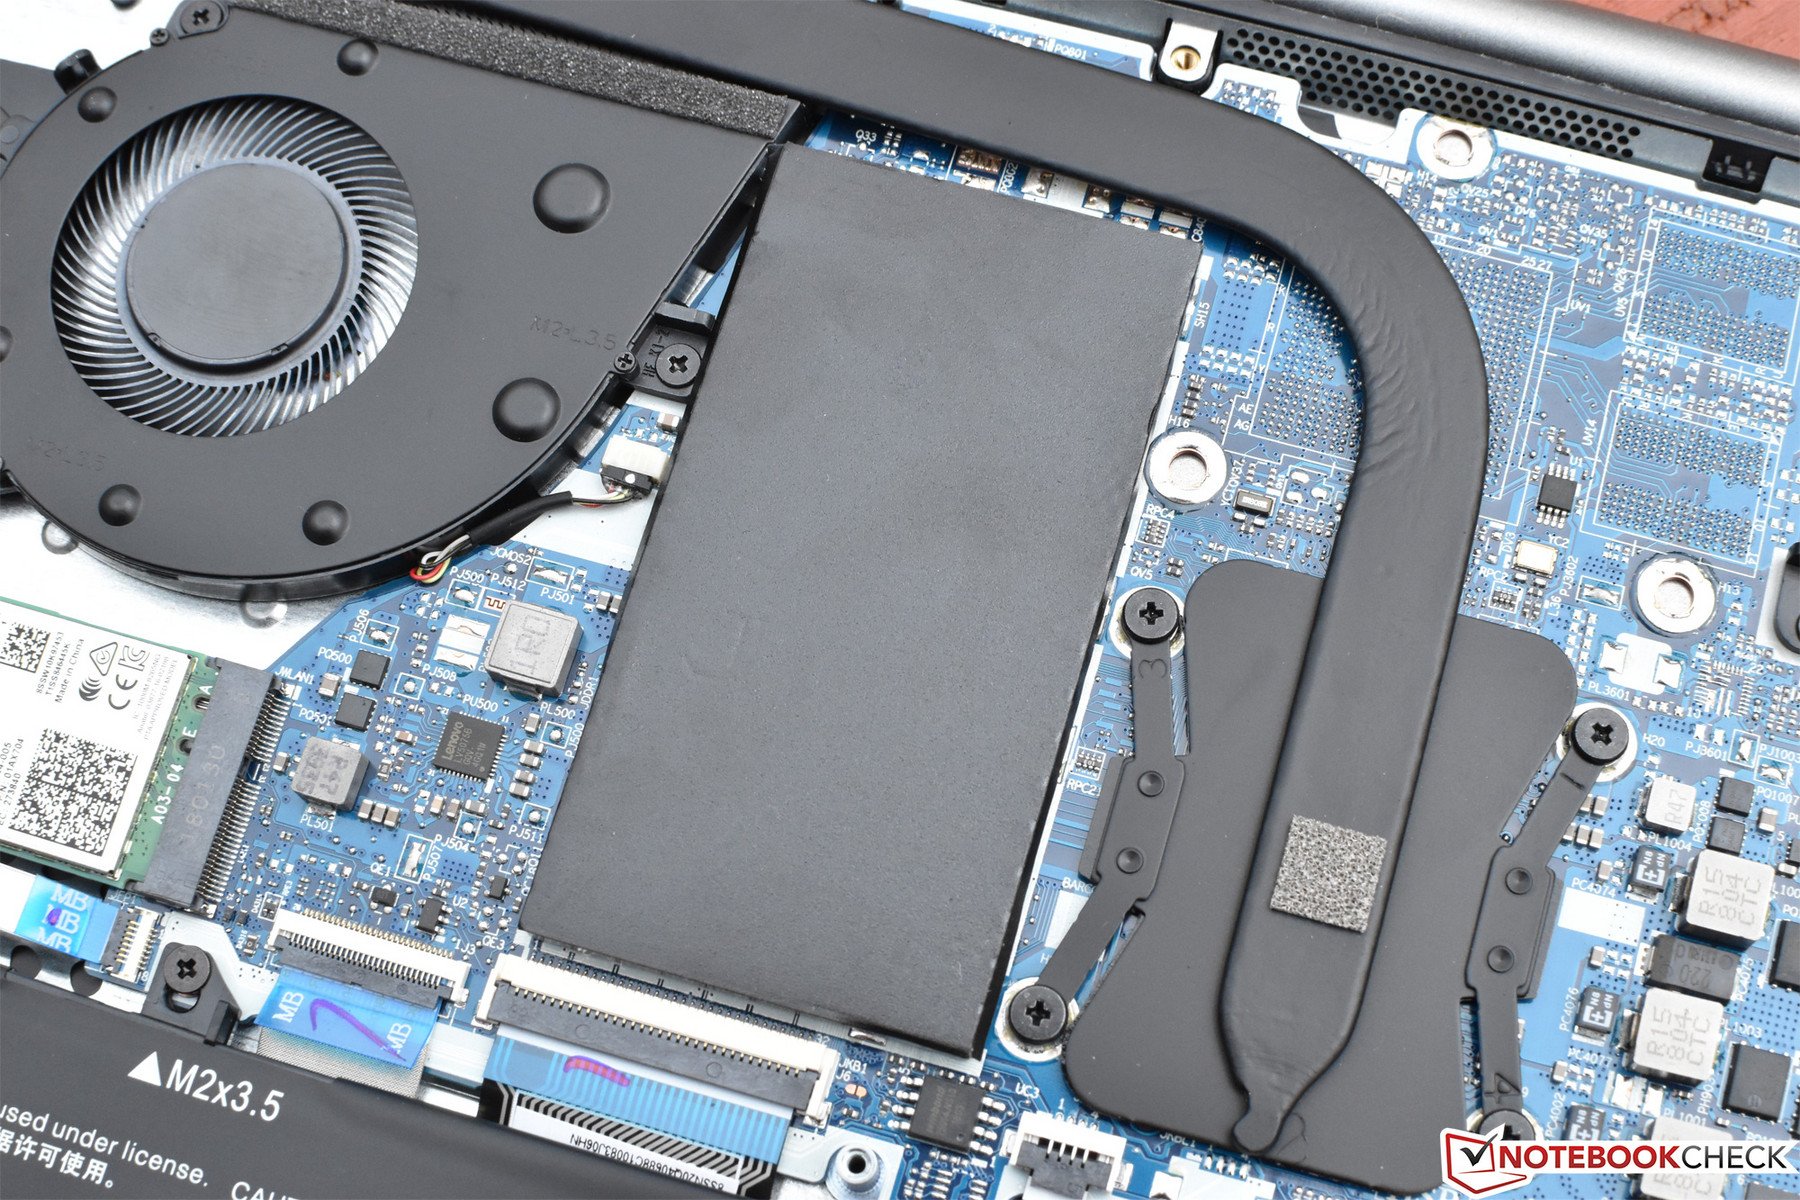
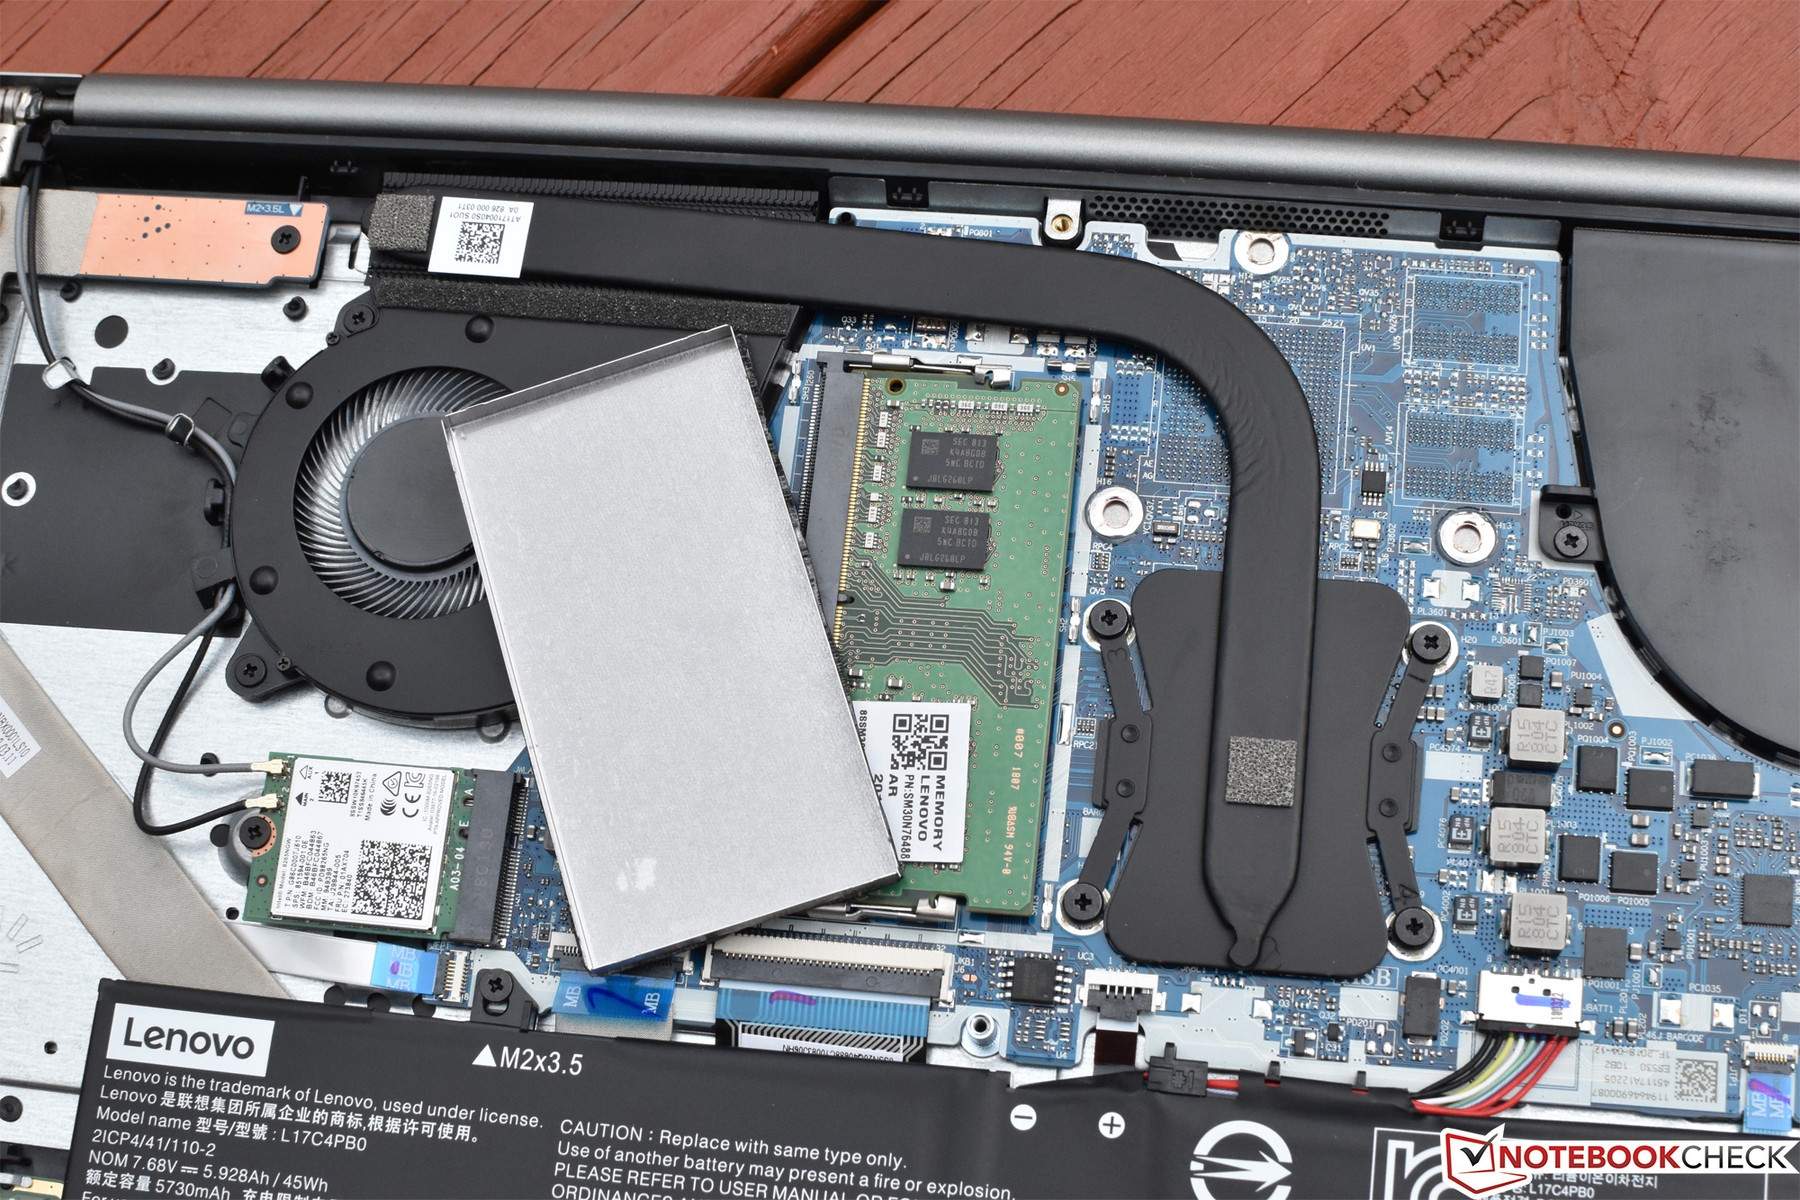
É claro que a cortina não pode ficar esticada para sempre e, eventualmente, a fachada de uma máquina de $ 1K+ começa a se desgastar um pouco. Embora construídas em metal, as superfícies são visivelmente mais finas do que as que adornam o XPS 15, por exemplo, e isso é mais evidente na flexão presente em toda a unidade base. Os dispositivos de entrada são bons, mas não excelentes O desempenho gráfico obviamente não é uma ênfase da unidade de teste de hoje, mas o áudio também não tem o equilíbrio e o impacto do XPS 15, e a tela (apesar de boa no geral) não pode competir. Não há opção para armazenamento duplo ou RAM de canal duplo, e o leitor de cartões está entre os mais lentos que vimos. Nenhuma dessas deficiências é algo fatal e, de fato, a maioria pode ser considerada relativamente pequena, especialmente no contexto do preço. Mas, tomados em conjunto, eles de certa forma comprovam a economia de preços, servindo como um lembrete de que há recortes em algum lugar. Tendo isso em mente (e as expectativas sob controle), o que o IdeaPad 530S realiza aqui é, no entanto, bastante valioso.
Lenovo Ideapad 530S-15IKB
- 08/27/2018 v6 (old)
Steve Schardein
Price comparison
