Breve Análise do Portátil Asus VivoBook 15 K570UD (i7-8550U, GTX 1050)
| SD Card Reader | |
| average JPG Copy Test (av. of 3 runs) | |
| Dell XPS 15 2018 i5 FHD 97Wh | |
| Gigabyte Sabre 15G (Toshiba Exceria Pro SDXC 64 GB UHS-II) | |
| Asus VivoBook 15 X570UD (Toshiba Exceria Pro M501 UHS-II) | |
| Lenovo Legion Y520-15IKBA-80WY001VGE (Toshiba Exceria Pro SDXC 64 GB UHS-II) | |
| maximum AS SSD Seq Read Test (1GB) | |
| Dell XPS 15 2018 i5 FHD 97Wh | |
| Gigabyte Sabre 15G (Toshiba Exceria Pro SDXC 64 GB UHS-II) | |
| Asus VivoBook 15 X570UD (Toshiba Exceria Pro M501 UHS-II) | |
| Lenovo Legion Y520-15IKBA-80WY001VGE (Toshiba Exceria Pro SDXC 64 GB UHS-II) | |
| Networking | |
| iperf3 transmit AX12 | |
| Asus VivoBook 15 X570UD | |
| Dell G5 15 5587 | |
| Dell XPS 15 2018 i5 FHD 97Wh | |
| Gigabyte Sabre 15G | |
| iperf3 receive AX12 | |
| Asus VivoBook 15 X570UD | |
| Dell XPS 15 2018 i5 FHD 97Wh | |
| Dell G5 15 5587 | |
| Gigabyte Sabre 15G | |
| |||||||||||||||||||||||||
iluminação: 91 %
iluminação com acumulador: 240.1 cd/m²
Contraste: 1044:1 (Preto: 0.23 cd/m²)
ΔE ColorChecker Calman: 4.25 | ∀{0.5-29.43 Ø4.71}
calibrated: 4
ΔE Greyscale Calman: 2.8 | ∀{0.09-98 Ø4.96}
57.8% sRGB (Argyll 1.6.3 3D)
36.8% AdobeRGB 1998 (Argyll 1.6.3 3D)
39.94% AdobeRGB 1998 (Argyll 3D)
57.9% sRGB (Argyll 3D)
38.66% Display P3 (Argyll 3D)
Gamma: 2.3
CCT: 6503 K
| Asus VivoBook 15 X570UD AU Optronics B156HAN06.1, IPS, 15.6", 1920x1080 | Dell G5 15 5587 LGD053F, 156WF6, IPS, 15.6", 1920x1080 | Gigabyte Sabre 15G ID: LGD0533, Name: LG Display LP156WF6-SPK3, IPS, 15.6", 1920x1080 | MSI GL63 8RC-069US LG Philips LP156WF6-SPK6, IPS, 15.6", 1920x1080 | Lenovo Legion Y520-15IKBA-80WY001VGE LG Philips LGD0533, IPS, 15.6", 1920x1080 | |
|---|---|---|---|---|---|
| Display | -1% | 1% | 2% | 2% | |
| Display P3 Coverage (%) | 38.66 | 38.13 -1% | 38.97 1% | 39.4 2% | 39.53 2% |
| sRGB Coverage (%) | 57.9 | 56.8 -2% | 58.2 1% | 59.2 2% | 59.2 2% |
| AdobeRGB 1998 Coverage (%) | 39.94 | 39.47 -1% | 40.3 1% | 40.72 2% | 40.86 2% |
| Response Times | 8% | 6% | 7% | -12% | |
| Response Time Grey 50% / Grey 80% * (ms) | 32 ? | 33 ? -3% | 32 ? -0% | 33.6 ? -5% | 42 ? -31% |
| Response Time Black / White * (ms) | 29.2 ? | 24 ? 18% | 25.6 ? 12% | 24 ? 18% | 27 ? 8% |
| PWM Frequency (Hz) | 20000 ? | 24900 ? | |||
| Screen | -21% | -30% | -12% | -17% | |
| Brightness middle (cd/m²) | 240.1 | 229 -5% | 248.4 3% | 286.5 19% | 243 1% |
| Brightness (cd/m²) | 233 | 224 -4% | 241 3% | 258 11% | 231 -1% |
| Brightness Distribution (%) | 91 | 87 -4% | 84 -8% | 82 -10% | 87 -4% |
| Black Level * (cd/m²) | 0.23 | 0.28 -22% | 0.3 -30% | 0.34 -48% | 0.24 -4% |
| Contrast (:1) | 1044 | 818 -22% | 828 -21% | 843 -19% | 1013 -3% |
| Colorchecker dE 2000 * | 4.25 | 6.1 -44% | 7.5 -76% | 5.57 -31% | 6.36 -50% |
| Colorchecker dE 2000 max. * | 17.84 | 12.2 32% | 25.2 -41% | 16.8 6% | 12.76 28% |
| Colorchecker dE 2000 calibrated * | 4 | 6.12 -53% | 4.16 -4% | 6.51 -63% | |
| Greyscale dE 2000 * | 2.8 | 5.68 -103% | 6.5 -132% | 4.6 -64% | 5.63 -101% |
| Gamma | 2.3 96% | 2.4 92% | 2.19 100% | 2.15 102% | 2.47 89% |
| CCT | 6503 100% | 6989 93% | 7852 83% | 7564 86% | 7411 88% |
| Color Space (Percent of AdobeRGB 1998) (%) | 36.8 | 36 -2% | 37 1% | 37.4 2% | 38 3% |
| Color Space (Percent of sRGB) (%) | 57.8 | 57 -1% | 57.9 0% | 58.9 2% | 59 2% |
| Média Total (Programa/Configurações) | -5% /
-14% | -8% /
-19% | -1% /
-7% | -9% /
-13% |
* ... menor é melhor
Exibir tempos de resposta
| ↔ Tempo de resposta preto para branco | ||
|---|---|---|
| 29.2 ms ... ascensão ↗ e queda ↘ combinadas | ↗ 17.2 ms ascensão | 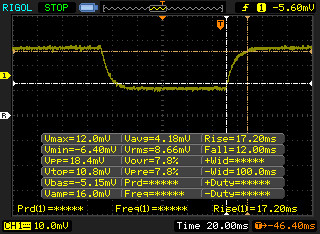 |
| ↘ 12 ms queda | ||
| A tela mostra taxas de resposta relativamente lentas em nossos testes e pode ser muito lenta para os jogadores. Em comparação, todos os dispositivos testados variam de 0.1 (mínimo) a 240 (máximo) ms. » 78 % de todos os dispositivos são melhores. Isso significa que o tempo de resposta medido é pior que a média de todos os dispositivos testados (19.8 ms). | ||
| ↔ Tempo de resposta 50% cinza a 80% cinza | ||
| 32 ms ... ascensão ↗ e queda ↘ combinadas | ↗ 19.2 ms ascensão | 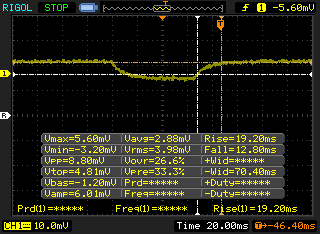 |
| ↘ 12.8 ms queda | ||
| A tela mostra taxas de resposta lentas em nossos testes e será insatisfatória para os jogadores. Em comparação, todos os dispositivos testados variam de 0.165 (mínimo) a 636 (máximo) ms. » 43 % de todos os dispositivos são melhores. Isso significa que o tempo de resposta medido é semelhante à média de todos os dispositivos testados (30.9 ms). | ||
Cintilação da tela / PWM (modulação por largura de pulso)
| Tela tremeluzindo / PWM não detectado | 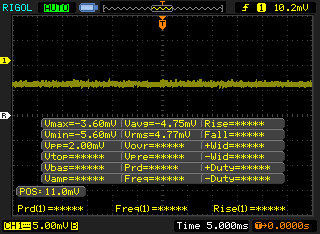 | ||
[pwm_comparison] Em comparação: 52 % de todos os dispositivos testados não usam PWM para escurecer a tela. Se PWM foi detectado, uma média de 7741 (mínimo: 5 - máximo: 343500) Hz foi medida. | |||

| Cinebench R15 | |
| CPU Single 64Bit | |
| MSI GT63 Titan 8RG-046 | |
| Asus VivoBook 15 X570UD | |
| MSI GV62 8RE-016US | |
| Média Intel Core i7-8550U (108 - 172, n=76) | |
| Asus FX503VM-EH73 | |
| Lenovo ThinkPad 13 20J1005TPB | |
| Asus VivoBook 15 X542UF-DM143T | |
| Acer Swift 3 SF315-41-R6J9 | |
| Xiaomi Mi Gaming Laptop 7300HQ 1060 | |
| Asus Zenbook UX310UQ-GL011T | |
| CPU Multi 64Bit | |
| MSI GT63 Titan 8RG-046 | |
| MSI GV62 8RE-016US | |
| Asus FX503VM-EH73 | |
| Asus VivoBook 15 X542UF-DM143T | |
| Asus VivoBook 15 X570UD | |
| Média Intel Core i7-8550U (301 - 761, n=78) | |
| Acer Swift 3 SF315-41-R6J9 | |
| Xiaomi Mi Gaming Laptop 7300HQ 1060 | |
| Lenovo ThinkPad 13 20J1005TPB | |
| Asus Zenbook UX310UQ-GL011T | |
| Cinebench R10 | |
| Rendering Multiple CPUs 32Bit | |
| Asus VivoBook 15 X542UF-DM143T | |
| Asus FX503VM-EH73 | |
| MSI GV62 8RE-016US | |
| Média Intel Core i7-8550U (11694 - 24180, n=31) | |
| Acer Swift 3 SF315-41-R6J9 | |
| Asus Zenbook UX310UQ-GL011T | |
| Rendering Single 32Bit | |
| Média Intel Core i7-8550U (4202 - 8211, n=31) | |
| MSI GV62 8RE-016US | |
| Asus FX503VM-EH73 | |
| Asus VivoBook 15 X542UF-DM143T | |
| Asus Zenbook UX310UQ-GL011T | |
| Acer Swift 3 SF315-41-R6J9 | |
| wPrime 2.10 - 1024m | |
| Lenovo ThinkPad 13 20J1005TPB | |
| Média Intel Core i7-8550U (258 - 435, n=11) | |
| Acer Swift 3 SF315-41-R6J9 | |
| Asus FX503VM-EH73 | |
| MSI GV62 8RE-016US | |
* ... menor é melhor
| PCMark 8 - Home Score Accelerated v2 | |
| Asus FX503VM-EH73 | |
| Dell G5 15 5587 | |
| Lenovo Legion Y520-15IKBA-80WY001VGE | |
| Asus VivoBook 15 X570UD | |
| Média Intel Core i7-8550U, NVIDIA GeForce GTX 1050 Mobile (3505 - 4245, n=6) | |
| MSI GL63 8RC-069US | |
| Gigabyte Sabre 15G | |
| PCMark 10 - Score | |
| Dell G5 15 5587 | |
| Asus FX503VM-EH73 | |
| Asus VivoBook 15 X570UD | |
| Gigabyte Sabre 15G | |
| Média Intel Core i7-8550U, NVIDIA GeForce GTX 1050 Mobile (3835 - 4488, n=6) | |
| MSI GL63 8RC-069US | |
| Lenovo Legion Y520-15IKBA-80WY001VGE | |
| PCMark 8 Home Score Accelerated v2 | 4188 pontos | |
| PCMark 10 Score | 4458 pontos | |
Ajuda | ||
| Asus VivoBook 15 X570UD SK hynix PC300 HFS512GD9MND | Dell G5 15 5587 SK hynix SC311 M.2 | Gigabyte Sabre 15G Liteonit CV3-8D128 | MSI GL63 8RC-069US Toshiba HG6 THNSNJ256G8NY | Razer Blade 15 2018 Samsung PM961 NVMe MZVLW512HMJP | |
|---|---|---|---|---|---|
| AS SSD | -63% | -55% | -66% | 58% | |
| Copy Game MB/s (MB/s) | 792 | 130.9 -83% | 323.5 -59% | 202.6 -74% | |
| Copy Program MB/s (MB/s) | 334.3 | 95.7 -71% | 195.3 -42% | 84.8 -75% | |
| Copy ISO MB/s (MB/s) | 1265 | 146.6 -88% | 446.8 -65% | 325.6 -74% | |
| Score Total (Points) | 2249 | 557 -75% | 752 -67% | 850 -62% | 3806 69% |
| Score Write (Points) | 836 | 199 -76% | 234 -72% | 230 -72% | 1450 73% |
| Score Read (Points) | 968 | 240 -75% | 337 -65% | 410 -58% | 1584 64% |
| Access Time Write * (ms) | 0.127 | 0.066 48% | 0.073 43% | 0.061 52% | 0.038 70% |
| Access Time Read * (ms) | 0.059 | 0.128 -117% | 0.141 -139% | 0.197 -234% | 0.051 14% |
| 4K-64 Write (MB/s) | 677 | 112.4 -83% | 132.2 -80% | 127.3 -81% | 1204 78% |
| 4K-64 Read (MB/s) | 756 | 164.1 -78% | 257 -66% | 342.3 -55% | 1300 72% |
| 4K Write (MB/s) | 85.8 | 62.2 -28% | 53.8 -37% | 57.1 -33% | 93.6 9% |
| 4K Read (MB/s) | 30.78 | 24.44 -21% | 28.3 -8% | 16.18 -47% | 46.45 51% |
| Seq Write (MB/s) | 735 | 243.7 -67% | 479.8 -35% | 456.4 -38% | 1521 107% |
| Seq Read (MB/s) | 1817 | 511 -72% | 516 -72% | 512 -72% | 2376 31% |
* ... menor é melhor

| 3DMark 11 Performance | 7625 pontos | |
Ajuda | ||
| baixo | média | alto | ultra | |
|---|---|---|---|---|
| BioShock Infinite (2013) | 227 | 172.2 | 152.9 | 61.3 |
| The Witcher 3 (2015) | 19 |
Barulho
| Ocioso |
| 29.3 / 29.5 / 30.5 dB |
| Carga |
| 41.2 / 47.2 dB |
 | ||
30 dB silencioso 40 dB(A) audível 50 dB(A) ruidosamente alto |
||
min: | ||
| Asus VivoBook 15 X570UD GeForce GTX 1050 Mobile, i5-8550U, SK hynix PC300 HFS512GD9MND | Dell G5 15 5587 GeForce GTX 1060 Max-Q, i5-8300H, SK hynix SC311 M.2 | HP Pavilion 15 Power 1GK62AV GeForce GTX 1050 Mobile, i7-7700HQ, SK Hynix HFS256G39TND-N210A | Gigabyte Sabre 15G GeForce GTX 1050 Mobile, i7-7700HQ, Liteonit CV3-8D128 | Asus FX503VM-EH73 GeForce GTX 1060 Mobile, i7-7700HQ, SanDisk SD8SN8U128G1002 | MSI GL63 8RC-069US GeForce GTX 1050 Mobile, i5-8300H, Toshiba HG6 THNSNJ256G8NY | |
|---|---|---|---|---|---|---|
| Noise | -0% | -5% | -10% | -2% | -2% | |
| desligado / ambiente * (dB) | 29.2 | 30.3 -4% | 27.8 5% | 28.2 3% | 27.8 5% | 28.6 2% |
| Idle Minimum * (dB) | 29.3 | 31.1 -6% | 32.1 -10% | 33 -13% | 29.6 -1% | 28.6 2% |
| Idle Average * (dB) | 29.5 | 31.1 -5% | 32.2 -9% | 33.3 -13% | 29.6 -0% | 31.6 -7% |
| Idle Maximum * (dB) | 30.5 | 34.2 -12% | 32.2 -6% | 34.7 -14% | 29.6 3% | 31.6 -4% |
| Load Average * (dB) | 41.2 | 34.9 15% | 43.3 -5% | 44.5 -8% | 37.3 9% | 38.6 6% |
| Witcher 3 ultra * (dB) | 44 | 42.7 3% | 45 -2% | 49.2 -12% | 49.8 -13% | 40.6 8% |
| Load Maximum * (dB) | 47.2 | 44 7% | 49.6 -5% | 52.8 -12% | 53.7 -14% | 56.8 -20% |
* ... menor é melhor
(+) A temperatura máxima no lado superior é 39.8 °C / 104 F, em comparação com a média de 36.8 °C / 98 F , variando de 21 a 71 °C para a classe Multimedia.
(-) A parte inferior aquece até um máximo de 53.4 °C / 128 F, em comparação com a média de 39.1 °C / 102 F
(+) Em uso inativo, a temperatura média para o lado superior é 24.7 °C / 76 F, em comparação com a média do dispositivo de 31.3 °C / ### class_avg_f### F.
(+) Jogando The Witcher 3, a temperatura média para o lado superior é 30.5 °C / 87 F, em comparação com a média do dispositivo de 31.3 °C / ## #class_avg_f### F.
(+) Os apoios para as mãos e o touchpad são mais frios que a temperatura da pele, com um máximo de 28 °C / 82.4 F e, portanto, são frios ao toque.
(±) A temperatura média da área do apoio para as mãos de dispositivos semelhantes foi 28.7 °C / 83.7 F (+0.7 °C / 1.3 F).
Asus VivoBook 15 X570UD análise de áudio
(-) | alto-falantes não muito altos (###valor### dB)
Graves 100 - 315Hz
(±) | graves reduzidos - em média 12.7% menor que a mediana
(±) | a linearidade dos graves é média (14.7% delta para a frequência anterior)
Médios 400 - 2.000 Hz
(+) | médios equilibrados - apenas 3.9% longe da mediana
(±) | a linearidade dos médios é média (9.3% delta para frequência anterior)
Altos 2 - 16 kHz
(±) | máximos mais altos - em média 5.5% maior que a mediana
(±) | a linearidade dos máximos é média (11% delta para frequência anterior)
Geral 100 - 16.000 Hz
(±) | a linearidade do som geral é média (23.5% diferença em relação à mediana)
Comparado com a mesma classe
» 83% de todos os dispositivos testados nesta classe foram melhores, 6% semelhantes, 11% piores
» O melhor teve um delta de 5%, a média foi 17%, o pior foi 45%
Comparado com todos os dispositivos testados
» 70% de todos os dispositivos testados foram melhores, 6% semelhantes, 24% piores
» O melhor teve um delta de 4%, a média foi 23%, o pior foi 134%
Apple MacBook 12 (Early 2016) 1.1 GHz análise de áudio
(+) | os alto-falantes podem tocar relativamente alto (###valor### dB)
Graves 100 - 315Hz
(±) | graves reduzidos - em média 11.3% menor que a mediana
(±) | a linearidade dos graves é média (14.2% delta para a frequência anterior)
Médios 400 - 2.000 Hz
(+) | médios equilibrados - apenas 2.4% longe da mediana
(+) | médios são lineares (5.5% delta para frequência anterior)
Altos 2 - 16 kHz
(+) | agudos equilibrados - apenas 2% longe da mediana
(+) | os máximos são lineares (4.5% delta da frequência anterior)
Geral 100 - 16.000 Hz
(+) | o som geral é linear (10.2% diferença em relação à mediana)
Comparado com a mesma classe
» 7% de todos os dispositivos testados nesta classe foram melhores, 2% semelhantes, 90% piores
» O melhor teve um delta de 5%, a média foi 18%, o pior foi 53%
Comparado com todos os dispositivos testados
» 5% de todos os dispositivos testados foram melhores, 1% semelhantes, 94% piores
» O melhor teve um delta de 4%, a média foi 23%, o pior foi 134%
| desligado | |
| Ocioso | |
| Carga |
|
Key:
min: | |
| Asus VivoBook 15 X570UD i5-8550U, GeForce GTX 1050 Mobile, SK hynix PC300 HFS512GD9MND, IPS, 1920x1080, 15.6" | Dell G5 15 5587 i5-8300H, GeForce GTX 1060 Max-Q, SK hynix SC311 M.2, IPS, 1920x1080, 15.6" | Gigabyte Sabre 15G i7-7700HQ, GeForce GTX 1050 Mobile, Liteonit CV3-8D128, IPS, 1920x1080, 15.6" | MSI GL63 8RC-069US i5-8300H, GeForce GTX 1050 Mobile, Toshiba HG6 THNSNJ256G8NY, IPS, 1920x1080, 15.6" | Asus FX503VM-EH73 i7-7700HQ, GeForce GTX 1060 Mobile, SanDisk SD8SN8U128G1002, IPS, 1920x1080, 15.6" | Razer Blade 15 GTX 1060 i7-8750H, GeForce GTX 1060 Max-Q, Samsung SSD PM981 MZVLB512HAJQ, IPS, 1920x1080, 15.6" | |
|---|---|---|---|---|---|---|
| Power Consumption | -16% | -24% | -23% | -68% | -92% | |
| Idle Minimum * (Watt) | 5.1 | 4.9 4% | 8 -57% | 7.1 -39% | 12.8 -151% | 14.9 -192% |
| Idle Average * (Watt) | 6.3 | 8.5 -35% | 10.9 -73% | 9.8 -56% | 15.4 -144% | 17.5 -178% |
| Idle Maximum * (Watt) | 10.5 | 9.1 13% | 11 -5% | 10.4 1% | 15.9 -51% | 19.2 -83% |
| Load Average * (Watt) | 82.2 | 90.7 -10% | 76.7 7% | 88.8 -8% | 78 5% | 103.2 -26% |
| Witcher 3 ultra * (Watt) | 85.9 | 110 -28% | 94.9 -10% | 93.3 -9% | 107.3 -25% | 123.1 -43% |
| Load Maximum * (Watt) | 103.2 | 144 -40% | 106.4 -3% | 132.5 -28% | 143.4 -39% | 132.7 -29% |
* ... menor é melhor
| Asus VivoBook 15 X570UD i5-8550U, GeForce GTX 1050 Mobile, 48 Wh | Dell G5 15 5587 i5-8300H, GeForce GTX 1060 Max-Q, 56 Wh | Gigabyte Sabre 15G i7-7700HQ, GeForce GTX 1050 Mobile, 47 Wh | MSI GL63 8RC-069US i5-8300H, GeForce GTX 1050 Mobile, 41 Wh | Acer Swift 3 SF315-41-R6J9 R7 2700U, Vega 10, 49 Wh | Asus ZenBook UX530UX-FY070T i7-7500U, GeForce GTX 950M, 50 Wh | |
|---|---|---|---|---|---|---|
| Duração da bateria | 23% | -17% | -19% | 0% | 17% | |
| WiFi v1.3 (h) | 5.3 | 6.5 23% | 4.4 -17% | 4.3 -19% | 5.3 0% | 6.2 17% |
| Reader / Idle (h) | 11.8 | 8.2 | 7.3 | 13.3 | 8.8 | |
| Load (h) | 2.2 | 1.3 | 0.7 | 1.3 | 1.8 |
Pro
Contra
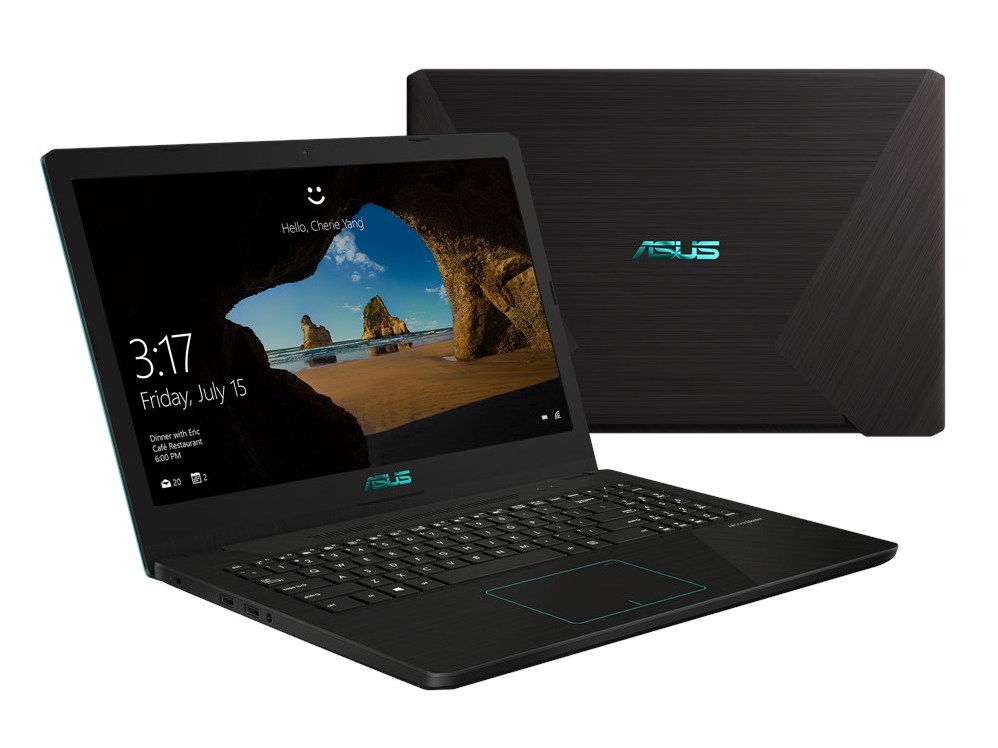

O Asus X570UD prova que você não precisa de uma CPU Intel HQ para jogar os jogos mais recentes. A série 15 W Kaby Lake-R oferece um nível de desempenho entre o do Core i5-7300HQ de 45 W e i7-7700HQ comumente encontrado em portáteis de jogos econômicos. Os requisitos de resfriamento mais baixos significam um sistema mais leve e mais portátil sem sacrificar o desempenho dos jogos ou temperaturas do núcleo desconfortavelmente altas. A combinação i7-8550U e GTX 1050 é algo que gostaríamos de ver em portáteis de jogos mais finos e leves, ao contrário dos antigos Blade 14 e seus i7-7500U e GTX 960M.
Naturalmente, há alguns recortes a serem observados, já que o Vivobook é uma oferta convencional de orçamento. O teclado e o trackpad fracos deixam uma impressão barata e a baixa capacidade de manutenção é um obstáculo para os usuários que desejam atualizar o armazenamento ou a RAM. Fora estes inconvenientes, o X570UD/K570UD é um bom equilíbrio para os estudantes em movimento que desejam algo acessível, leve e também capaz de rodar os jogos mais recentes.
Mais leve que o Dell G5, Lenovo Legion Y520, e Gigabyte Sabre 15 enquanto é igual de poderoso e econômico. O Asus Vivobook K570UD/X570UD ignora os luxos para uma experiência adequada e proeza respeitável nos jogos.
Asus VivoBook 15 X570UD
- 07/22/2018 v6 (old)
Allen Ngo
Price comparison
