Breve Análise do Portátil Dell Inspiron 15 7000 7567 Gaming (i5-7300HQ, GTX 1050)


| |||||||||||||||||||||||||
iluminação: 88 %
iluminação com acumulador: 242.2 cd/m²
Contraste: 351:1 (Preto: 0.69 cd/m²)
ΔE ColorChecker Calman: 11.6 | ∀{0.5-29.43 Ø4.71}
ΔE Greyscale Calman: 15.7 | ∀{0.09-98 Ø4.96}
57.55% sRGB (Argyll 1.6.3 3D)
39.47% AdobeRGB 1998 (Argyll 1.6.3 3D)
39.47% AdobeRGB 1998 (Argyll 3D)
57.5% sRGB (Argyll 3D)
38.2% Display P3 (Argyll 3D)
Gamma: 1.57
CCT: 11662 K
| Dell Inspiron 15 7000 7567 Gaming (Core i5-7300HQ, GTX 1050) AU Optronics AUO38ED B156HTN , TN, 15.6", 1920x1080 | Dell Inspiron 15 7000 7567 LG Philips LGD053F (156WF6), , 15.6", 1920x1080 | Lenovo Legion Y520-15IKBN-80WK001KUS LP156WF6-SPK3, IPS, 15.6", 1920x1080 | Samsung Odyssey NP800G5M-X01US IPS, 15.6", 1920x1080 | Asus ROG Strix GL553VD-DS71 BOE HF NV156FHM-N43, IPS, 15.6", 1920x1080 | Gigabyte Sabre 15G ID: LGD0533, Name: LG Display LP156WF6-SPK3, IPS, 15.6", 1920x1080 | Acer Aspire VX15 VX5-591G-589S BOE CQ NV156HFM-N42, IPS, 15.6", 1920x1080 | |
|---|---|---|---|---|---|---|---|
| Display | 8% | 23% | 68% | 2% | 5% | ||
| Display P3 Coverage (%) | 38.2 | 41.49 9% | 47.11 23% | 67.6 77% | 38.97 2% | 40.56 6% | |
| sRGB Coverage (%) | 57.5 | 61.7 7% | 70.4 22% | 90.8 58% | 58.2 1% | 59.4 3% | |
| AdobeRGB 1998 Coverage (%) | 39.47 | 42.98 9% | 48.71 23% | 66.4 68% | 40.3 2% | 41.9 6% | |
| Response Times | -2% | -45% | -14% | -46% | 10% | -24% | |
| Response Time Grey 50% / Grey 80% * (ms) | 36.8 ? | 37.6 ? -2% | 58.8 ? -60% | 38.8 ? -5% | 57.6 ? -57% | 32 ? 13% | 46 ? -25% |
| Response Time Black / White * (ms) | 27.6 ? | 28 ? -1% | 36 ? -30% | 33.6 ? -22% | 37.2 ? -35% | 25.6 ? 7% | 34 ? -23% |
| PWM Frequency (Hz) | 21550 ? | 19230 ? | 20000 ? | 20000 ? | |||
| Screen | 46% | 21% | 25% | 62% | 25% | 49% | |
| Brightness middle (cd/m²) | 242.2 | 272 12% | 239 -1% | 255.9 6% | 289.3 19% | 248.4 3% | 277 14% |
| Brightness (cd/m²) | 235 | 251 7% | 244 4% | 249 6% | 280 19% | 241 3% | 268 14% |
| Brightness Distribution (%) | 88 | 85 -3% | 88 0% | 90 2% | 93 6% | 84 -5% | 91 3% |
| Black Level * (cd/m²) | 0.69 | 0.23 67% | 0.35 49% | 0.48 30% | 0.29 58% | 0.3 57% | 0.26 62% |
| Contrast (:1) | 351 | 1183 237% | 683 95% | 533 52% | 998 184% | 828 136% | 1065 203% |
| Colorchecker dE 2000 * | 11.6 | 6.7 42% | 7.3 37% | 5.9 49% | 3.1 73% | 7.5 35% | 5.05 56% |
| Colorchecker dE 2000 max. * | 19.4 | 13.5 30% | 24.7 -27% | 18.9 3% | 7.1 63% | 25.2 -30% | 8.93 54% |
| Greyscale dE 2000 * | 15.7 | 6.8 57% | 4.9 69% | 5.6 64% | 2.1 87% | 6.5 59% | 2.97 81% |
| Gamma | 1.57 140% | 2.18 101% | 2.19 100% | 2.21 100% | 2.22 99% | 2.19 100% | 2.39 92% |
| CCT | 11662 56% | 6476 100% | 7332 89% | 7250 90% | 6226 104% | 7852 83% | 6466 101% |
| Color Space (Percent of AdobeRGB 1998) (%) | 39.47 | 39.5 0% | 35 -11% | 44.8 14% | 59 49% | 37 -6% | 38 -4% |
| Color Space (Percent of sRGB) (%) | 57.55 | 61.4 7% | 55 -4% | 70.1 22% | 91 58% | 57.9 1% | 59 3% |
| Média Total (Programa/Configurações) | 17% /
32% | -12% /
10% | 11% /
19% | 28% /
48% | 12% /
19% | 10% /
30% |
* ... menor é melhor
Exibir tempos de resposta
| ↔ Tempo de resposta preto para branco | ||
|---|---|---|
| 27.6 ms ... ascensão ↗ e queda ↘ combinadas | ↗ 24.4 ms ascensão | 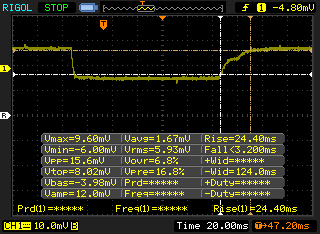 |
| ↘ 3.2 ms queda | ||
| A tela mostra taxas de resposta relativamente lentas em nossos testes e pode ser muito lenta para os jogadores. Em comparação, todos os dispositivos testados variam de 0.1 (mínimo) a 240 (máximo) ms. » 70 % de todos os dispositivos são melhores. Isso significa que o tempo de resposta medido é pior que a média de todos os dispositivos testados (19.8 ms). | ||
| ↔ Tempo de resposta 50% cinza a 80% cinza | ||
| 36.8 ms ... ascensão ↗ e queda ↘ combinadas | ↗ 17.2 ms ascensão | 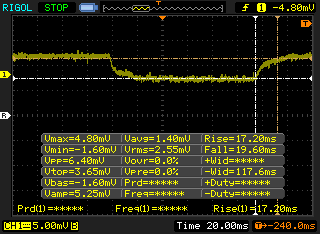 |
| ↘ 19.6 ms queda | ||
| A tela mostra taxas de resposta lentas em nossos testes e será insatisfatória para os jogadores. Em comparação, todos os dispositivos testados variam de 0.165 (mínimo) a 636 (máximo) ms. » 53 % de todos os dispositivos são melhores. Isso significa que o tempo de resposta medido é pior que a média de todos os dispositivos testados (31 ms). | ||
Cintilação da tela / PWM (modulação por largura de pulso)
| Tela tremeluzindo / PWM não detectado | 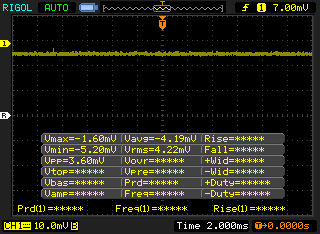 | ||
[pwm_comparison] Em comparação: 52 % de todos os dispositivos testados não usam PWM para escurecer a tela. Se PWM foi detectado, uma média de 7754 (mínimo: 5 - máximo: 343500) Hz foi medida. | |||
| wPrime 2.10 - 1024m | |
| Dell Inspiron 15 7000 7567 Gaming (Core i5-7300HQ, GTX 1050) | |
| Asus ROG Strix GL553VD-DS71 | |
| Gigabyte Sabre 15G | |
| Samsung Odyssey NP800G5M-X01US | |
* ... menor é melhor
| PCMark 8 Home Score Accelerated v2 | 3638 pontos | |
| PCMark 8 Creative Score Accelerated v2 | 4334 pontos | |
| PCMark 8 Work Score Accelerated v2 | 4749 pontos | |
| PCMark 10 Score | 3618 pontos | |
Ajuda | ||
| Dell Inspiron 15 7000 7567 Gaming (Core i5-7300HQ, GTX 1050) Toshiba MQ02ABD100H | Lenovo Legion Y520-15IKBN-80WK001KUS Samsung PM961 MZVLW256HEHP | Samsung Odyssey NP800G5M-X01US Samsung PM961 NVMe MZVLW128HEGR | Asus ROG Strix GL553VD-DS71 HGST Travelstar 7K1000 HTS721010A9E630 | Acer Aspire VX15 VX5-591G-589S Hynix HFS128G39TND | |
|---|---|---|---|---|---|
| CrystalDiskMark 3.0 | 21400% | 15742% | 56% | 11511% | |
| Read Seq (MB/s) | 84.7 | 2170 2462% | 1518 1692% | 93.5 10% | 510 502% |
| Write Seq (MB/s) | 65.4 | 1202 1738% | 798 1120% | 89.6 37% | 137.6 110% |
| Read 512 (MB/s) | 19.86 | 786 3858% | 460.5 2219% | 39.06 97% | 362.1 1723% |
| Write 512 (MB/s) | 28.43 | 822 2791% | 195.8 589% | 51.1 80% | 137.2 383% |
| Read 4k (MB/s) | 0.531 | 58.9 10992% | 47.16 8781% | 0.57 7% | 35.18 6525% |
| Write 4k (MB/s) | 0.481 | 146.4 30337% | 143.1 29651% | 1.05 118% | 104.8 21688% |
| Read 4k QD32 (MB/s) | 1.105 | 457.7 41321% | 521 47049% | 1.06 -4% | 375.8 33909% |
| Write 4k QD32 (MB/s) | 0.505 | 392.9 77702% | 176.4 34831% | 1.04 106% | 138.1 27247% |

| 3DMark 11 Performance | 7170 pontos | |
| 3DMark Cloud Gate Standard Score | 13473 pontos | |
| 3DMark Fire Strike Score | 5085 pontos | |
| 3DMark Fire Strike Extreme Score | 2512 pontos | |
Ajuda | ||
| The Witcher 3 | |
| 1024x768 Low Graphics & Postprocessing (classificar por valor) | |
| Dell Inspiron 15 7000 7567 Gaming (Core i5-7300HQ, GTX 1050) | |
| Dell XPS 15 2017 9560 (7300HQ, Full-HD) | |
| 1366x768 Medium Graphics & Postprocessing (classificar por valor) | |
| Dell Inspiron 15 7000 7567 Gaming (Core i5-7300HQ, GTX 1050) | |
| Dell XPS 15 2017 9560 (7300HQ, Full-HD) | |
| 1920x1080 High Graphics & Postprocessing (Nvidia HairWorks Off) (classificar por valor) | |
| Dell Inspiron 15 7000 7567 Gaming (Core i5-7300HQ, GTX 1050) | |
| Samsung Odyssey NP800G5M-X01US | |
| Gigabyte Sabre 15G | |
| Dell XPS 15 2017 9560 (7300HQ, Full-HD) | |
| Acer Aspire VX5-591G-75C4 VX15 | |
| 1920x1080 Ultra Graphics & Postprocessing (HBAO+) (classificar por valor) | |
| Dell Inspiron 15 7000 7567 Gaming (Core i5-7300HQ, GTX 1050) | |
| Lenovo Legion Y520-15IKBN-80WK001KUS | |
| Samsung Odyssey NP800G5M-X01US | |
| Gigabyte Sabre 15G | |
| Dell XPS 15 2017 9560 (7300HQ, Full-HD) | |
| Acer Aspire VX5-591G-75C4 VX15 | |
| baixo | média | alto | ultra | |
|---|---|---|---|---|
| Metro 2033 (2010) | 85.5 | 80.7 | 72.7 | 44.6 |
| Dirt 3 (2011) | 194.4 | 106.9 | 127.4 | 101 |
| Sleeping Dogs (2012) | 174.9 | 135.8 | 114.6 | 98.5 |
| Hitman: Absolution (2012) | 79.1 | 73.9 | 66.8 | 41.8 |
| Tomb Raider (2013) | 252.5 | 208.6 | 167.7 | 79.9 |
| BioShock Infinite (2013) | 173.5 | 149.6 | 139.2 | 64.9 |
| GRID 2 (2013) | 120.4 | 103 | 96.2 | 75.3 |
| Company of Heroes 2 (2013) | 52.4 | 50.7 | 47.4 | 26 |
| Thief (2014) | 58 | 56.6 | 53.8 | 41.8 |
| GRID: Autosport (2014) | 141.6 | 98.7 | 87 | 71.3 |
| Middle-earth: Shadow of Mordor (2014) | 122.8 | 99 | 58.8 | 45.8 |
| The Witcher 3 (2015) | 95.9 | 69.2 | 39 | 21.9 |
| Batman: Arkham Knight (2015) | 80 | 76 | 50 | 32 |
| Rise of the Tomb Raider (2016) | 105.5 | 64.5 | 35.8 | 30.9 |
| Ashes of the Singularity (2016) | 37.1 | 31 | 28.6 |
Barulho
| Ocioso |
| 31.6 / 31.8 / 31.8 dB |
| Carga |
| 36.3 / 49 dB |
 | ||
30 dB silencioso 40 dB(A) audível 50 dB(A) ruidosamente alto |
||
min: | ||
| Dell Inspiron 15 7000 7567 Gaming (Core i5-7300HQ, GTX 1050) GeForce GTX 1050 Mobile, i5-7300HQ, Toshiba MQ02ABD100H | Lenovo Legion Y520-15IKBN-80WK001KUS GeForce GTX 1050 Ti Mobile, i7-7700HQ, Samsung PM961 MZVLW256HEHP | Samsung Odyssey NP800G5M-X01US GeForce GTX 1050 Mobile, i7-7700HQ, Samsung PM961 NVMe MZVLW128HEGR | Asus ROG Strix GL553VD-DS71 GeForce GTX 1050 Mobile, i7-7700HQ, HGST Travelstar 7K1000 HTS721010A9E630 | Acer Aspire VX15 VX5-591G-589S GeForce GTX 1050 Mobile, i5-7300HQ, Hynix HFS128G39TND | Gigabyte Sabre 15G GeForce GTX 1050 Mobile, i7-7700HQ, Liteonit CV3-8D128 | Dell XPS 15 2017 9560 (7300HQ, Full-HD) GeForce GTX 1050 Mobile, i5-7300HQ, WDC WD10SPCX-75KHST0 + SanDisk Z400s M.2 2242 32 GB Cache | |
|---|---|---|---|---|---|---|---|
| Noise | 4% | -2% | -9% | 7% | -8% | -7% | |
| desligado / ambiente * (dB) | 28 | 27.7 1% | 28.1 -0% | 30.6 -9% | 30 -7% | 28.2 -1% | 30.3 -8% |
| Idle Minimum * (dB) | 31.6 | 30.5 3% | 28.1 11% | 33.4 -6% | 30 5% | 33 -4% | 31.6 -0% |
| Idle Average * (dB) | 31.8 | 30.5 4% | 29.1 8% | 33.4 -5% | 30 6% | 33.3 -5% | 31.6 1% |
| Idle Maximum * (dB) | 31.8 | 30.6 4% | 29.1 8% | 33.4 -5% | 31.1 2% | 34.7 -9% | 33.4 -5% |
| Load Average * (dB) | 36.3 | 40 -10% | 49.2 -36% | 46.5 -28% | 31.3 14% | 44.5 -23% | 47.8 -32% |
| Witcher 3 ultra * (dB) | 46.3 | 40 14% | 49.2 -6% | ||||
| Load Maximum * (dB) | 49 | 42.6 13% | 49.2 -0% | 49.6 -1% | 38.9 21% | 52.8 -8% | 47.8 2% |
* ... menor é melhor
(-) A temperatura máxima no lado superior é 47.2 °C / 117 F, em comparação com a média de 40.4 °C / 105 F , variando de 21.2 a 68.8 °C para a classe Gaming.
(±) A parte inferior aquece até um máximo de 43.2 °C / 110 F, em comparação com a média de 43.2 °C / 110 F
(+) Em uso inativo, a temperatura média para o lado superior é 26.4 °C / 80 F, em comparação com a média do dispositivo de 33.9 °C / ### class_avg_f### F.
(+) Jogando The Witcher 3, a temperatura média para o lado superior é 29.5 °C / 85 F, em comparação com a média do dispositivo de 33.9 °C / ## #class_avg_f### F.
(±) Os apoios para as mãos e o touchpad podem ficar muito quentes ao toque, com um máximo de 36.6 °C / 97.9 F.
(-) A temperatura média da área do apoio para as mãos de dispositivos semelhantes foi 28.8 °C / 83.8 F (-7.8 °C / -14.1 F).
Dell Inspiron 15 7000 7567 Gaming (Core i5-7300HQ, GTX 1050) análise de áudio
(±) | o volume do alto-falante é médio, mas bom (###valor### dB)
Graves 100 - 315Hz
(±) | graves reduzidos - em média 11.4% menor que a mediana
(±) | a linearidade dos graves é média (11.2% delta para a frequência anterior)
Médios 400 - 2.000 Hz
(+) | médios equilibrados - apenas 2.4% longe da mediana
(±) | a linearidade dos médios é média (7.8% delta para frequência anterior)
Altos 2 - 16 kHz
(+) | agudos equilibrados - apenas 4.1% longe da mediana
(+) | os máximos são lineares (6.7% delta da frequência anterior)
Geral 100 - 16.000 Hz
(±) | a linearidade do som geral é média (16.6% diferença em relação à mediana)
Comparado com a mesma classe
» 43% de todos os dispositivos testados nesta classe foram melhores, 7% semelhantes, 50% piores
» O melhor teve um delta de 6%, a média foi 18%, o pior foi 132%
Comparado com todos os dispositivos testados
» 29% de todos os dispositivos testados foram melhores, 6% semelhantes, 65% piores
» O melhor teve um delta de 4%, a média foi 23%, o pior foi 134%
Apple MacBook 12 (Early 2016) 1.1 GHz análise de áudio
(+) | os alto-falantes podem tocar relativamente alto (###valor### dB)
Graves 100 - 315Hz
(±) | graves reduzidos - em média 11.3% menor que a mediana
(±) | a linearidade dos graves é média (14.2% delta para a frequência anterior)
Médios 400 - 2.000 Hz
(+) | médios equilibrados - apenas 2.4% longe da mediana
(+) | médios são lineares (5.5% delta para frequência anterior)
Altos 2 - 16 kHz
(+) | agudos equilibrados - apenas 2% longe da mediana
(+) | os máximos são lineares (4.5% delta da frequência anterior)
Geral 100 - 16.000 Hz
(+) | o som geral é linear (10.2% diferença em relação à mediana)
Comparado com a mesma classe
» 7% de todos os dispositivos testados nesta classe foram melhores, 2% semelhantes, 90% piores
» O melhor teve um delta de 5%, a média foi 18%, o pior foi 53%
Comparado com todos os dispositivos testados
» 5% de todos os dispositivos testados foram melhores, 1% semelhantes, 94% piores
» O melhor teve um delta de 4%, a média foi 23%, o pior foi 134%
| desligado | |
| Ocioso | |
| Carga |
|
Key:
min: | |
| Dell Inspiron 15 7000 7567 Gaming (Core i5-7300HQ, GTX 1050) i5-7300HQ, GeForce GTX 1050 Mobile, Toshiba MQ02ABD100H, TN, 1920x1080, 15.6" | Dell Inspiron 15 7000 7567 i7-7700HQ, GeForce GTX 1050 Ti Mobile, Intel SSDSCKKF256H6, TN, 1920x1080, 15.6" | Lenovo Legion Y520-15IKBN-80WK001KUS i7-7700HQ, GeForce GTX 1050 Ti Mobile, Samsung PM961 MZVLW256HEHP, IPS, 1920x1080, 15.6" | Samsung Odyssey NP800G5M-X01US i7-7700HQ, GeForce GTX 1050 Mobile, Samsung PM961 NVMe MZVLW128HEGR, IPS, 1920x1080, 15.6" | Asus ROG Strix GL553VD-DS71 i7-7700HQ, GeForce GTX 1050 Mobile, HGST Travelstar 7K1000 HTS721010A9E630, IPS, 1920x1080, 15.6" | Acer Aspire VX15 VX5-591G-589S i5-7300HQ, GeForce GTX 1050 Mobile, Hynix HFS128G39TND, IPS, 1920x1080, 15.6" | Gigabyte Sabre 15G i7-7700HQ, GeForce GTX 1050 Mobile, Liteonit CV3-8D128, IPS, 1920x1080, 15.6" | |
|---|---|---|---|---|---|---|---|
| Power Consumption | 21% | 3% | 5% | -2% | 2% | 3% | |
| Idle Minimum * (Watt) | 9.1 | 4.4 52% | 8.5 7% | 6.7 26% | 7.7 15% | 8.4 8% | 8 12% |
| Idle Average * (Watt) | 10.3 | 6.8 34% | 9.1 12% | 8.9 14% | 11.7 -14% | 13.1 -27% | 10.9 -6% |
| Idle Maximum * (Watt) | 13 | 8.3 36% | 9.7 25% | 10.8 17% | 12 8% | 14.2 -9% | 11 15% |
| Load Average * (Watt) | 75.6 | 81 -7% | 79.9 -6% | 81.8 -8% | 80.5 -6% | 50 34% | 76.7 -1% |
| Witcher 3 ultra * (Watt) | 83.8 | 97.7 -17% | 92.2 -10% | 94.9 -13% | |||
| Load Maximum * (Watt) | 115.2 | 127 -10% | 121.5 -5% | 122.7 -7% | 128.4 -11% | 111 4% | 106.4 8% |
* ... menor é melhor
| Dell Inspiron 15 7000 7567 Gaming (Core i5-7300HQ, GTX 1050) i5-7300HQ, GeForce GTX 1050 Mobile, 74 Wh | Dell Inspiron 15 7000 7567 i7-7700HQ, GeForce GTX 1050 Ti Mobile, 74 Wh | Lenovo Legion Y520-15IKBN-80WK001KUS i7-7700HQ, GeForce GTX 1050 Ti Mobile, 45 Wh | Samsung Odyssey NP800G5M-X01US i7-7700HQ, GeForce GTX 1050 Mobile, 43 Wh | Asus ROG Strix GL553VD-DS71 i7-7700HQ, GeForce GTX 1050 Mobile, 48 Wh | Acer Aspire VX15 VX5-591G-589S i5-7300HQ, GeForce GTX 1050 Mobile, 52.5 Wh | Gigabyte Sabre 15G i7-7700HQ, GeForce GTX 1050 Mobile, 47 Wh | |
|---|---|---|---|---|---|---|---|
| Duração da bateria | -4% | -57% | -44% | -57% | -42% | -48% | |
| Reader / Idle (h) | 18.2 | 19.6 8% | 8.5 -53% | 10.2 -44% | 7.3 -60% | 8.2 -55% | |
| WiFi v1.3 (h) | 9.5 | 10.4 9% | 4 -58% | 4.4 -54% | 4.6 -52% | 5.5 -42% | 4.4 -54% |
| Load (h) | 2 | 1.4 -30% | 0.8 -60% | 1.3 -35% | 0.8 -60% | 1.3 -35% |
Pro
Contra
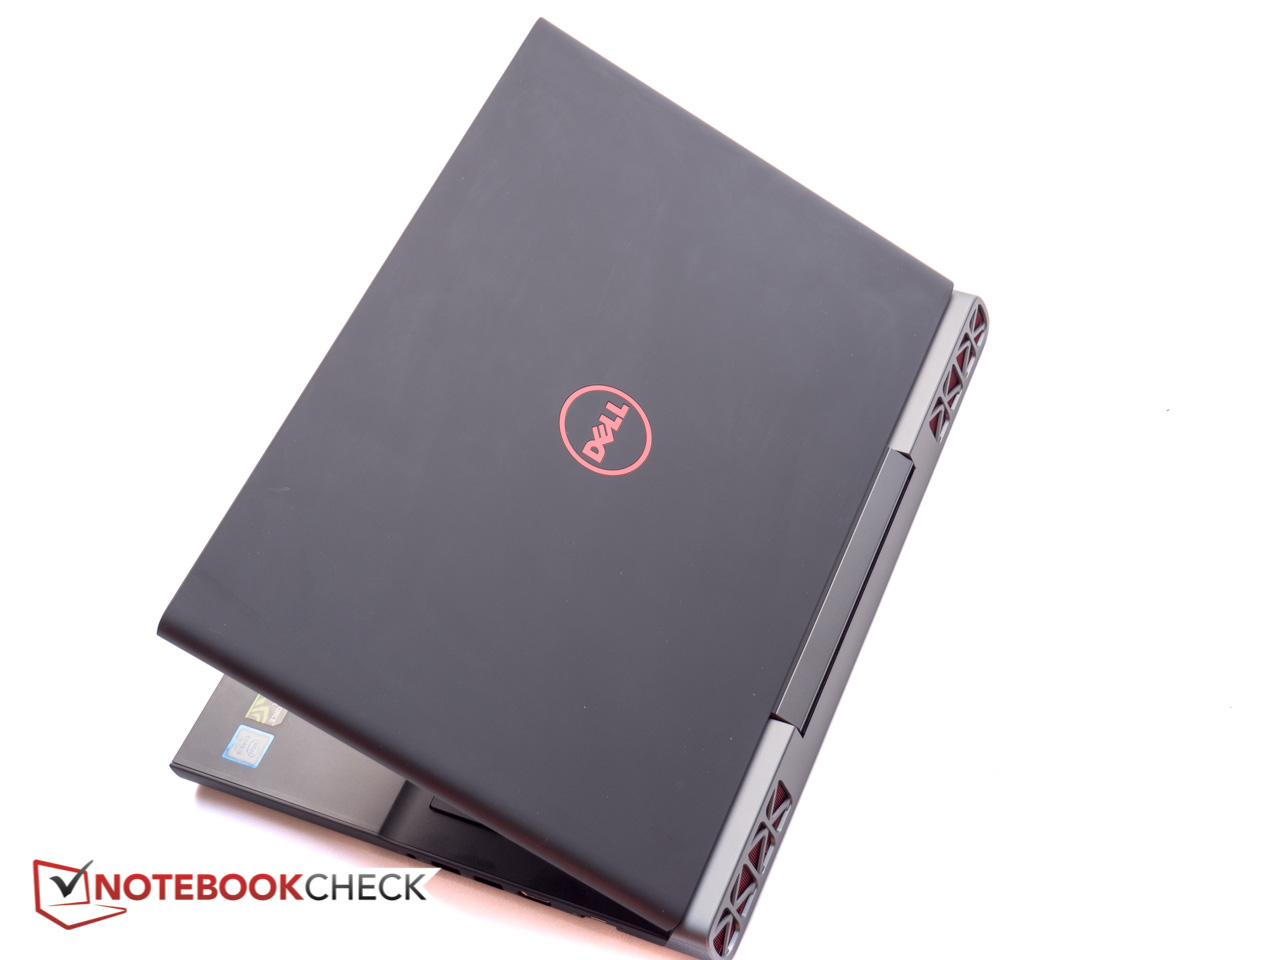
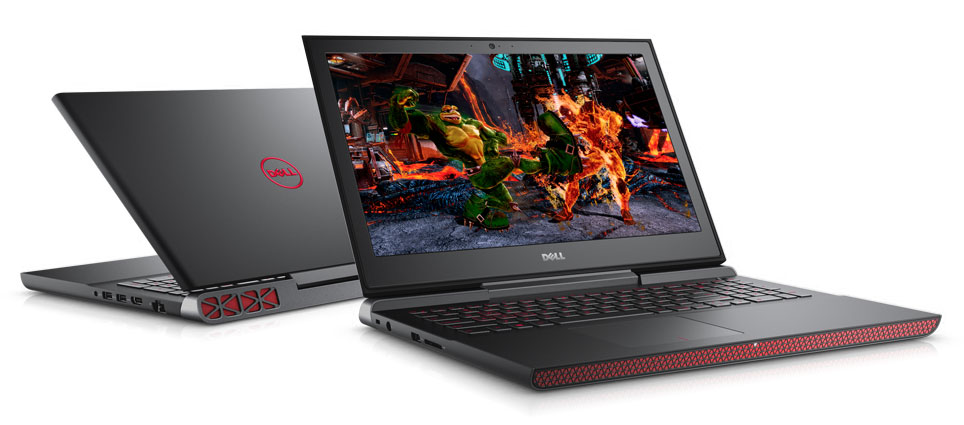
De certa forma, a nossa análise do Dell Inspiron 15 7000 7567 Gaming com i5-7300HQ e GTX 1050 não foi tão simples como esperávamos que fosse: no papel, o portátil em análise é simplesmente uma versão menos poderosa do irmão de gama mais alta. Embora o desempenho seja realmente mais baixo e está onde esperávamos que esteja, é desconcertante que o sistema seja mais barulhento, funcione mais quente e também tenha uma duração de bateria ligeiramente mais curta. Esta lista pode soar como se fosse decisivo, mas não é realmente: o Inspiron é bem construído, robusto, bom visual, oferece um desempenho decente e dura facilmente um dia inteiro ao executar tarefas de todos os dias. A única desvantagem real é a tela TN que é razoavelmente brilhante, mas sofre de contraste fraco, cores imprecisas e ângulos de visão muito fracos.
O Inspiron 15 7000 Gaming é um dos sistemas de jogos de orçamento mais duradouros lá fora. O preço é de $750 também parece mais do que justo.
Por $850 no momento, o Inspiron 15 7000 Gaming pode ser pedido com um SSD de 256 GB além da GTX 1050 Ti e uma tela IPS FHD de 15,6-polegadas (1920 x 1080). Dada a tela TN inferior do portátil de teste, seria fácil permitir a despesa adicional.
Dell Inspiron 15 7000 7567 Gaming (Core i5-7300HQ, GTX 1050)
- 08/07/2017 v6 (old)
Bernie Pechlaner
Price comparison
