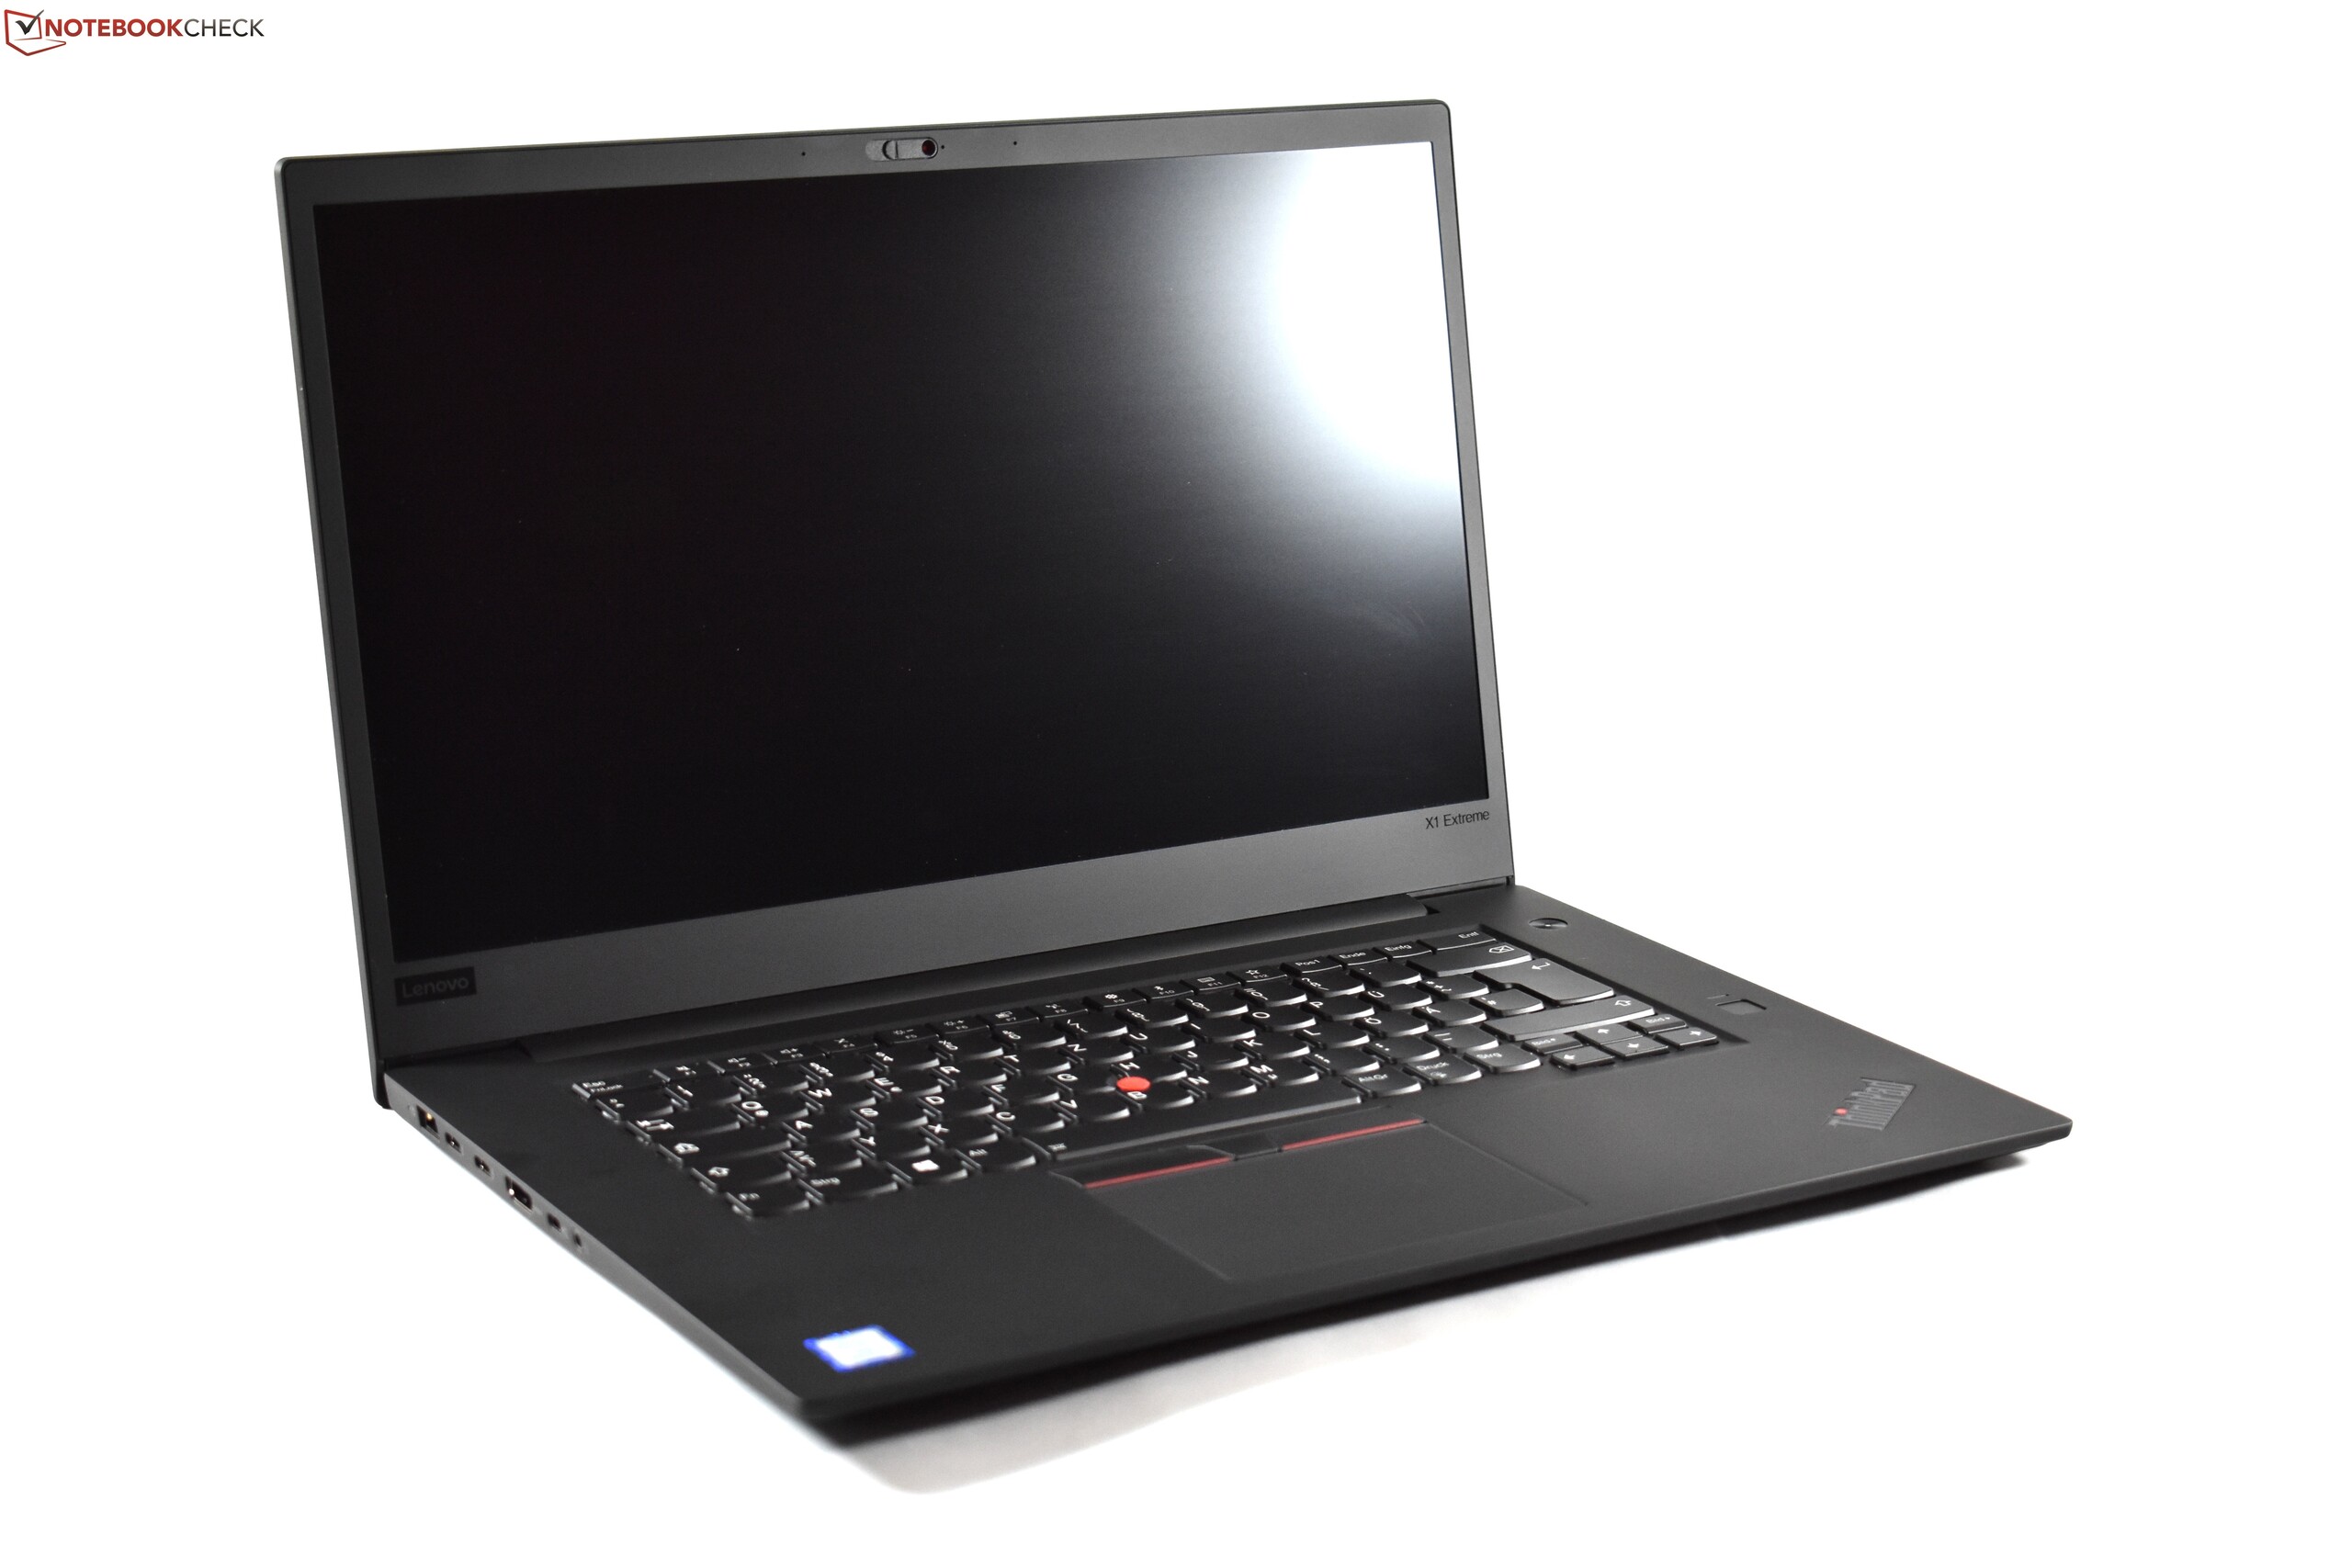
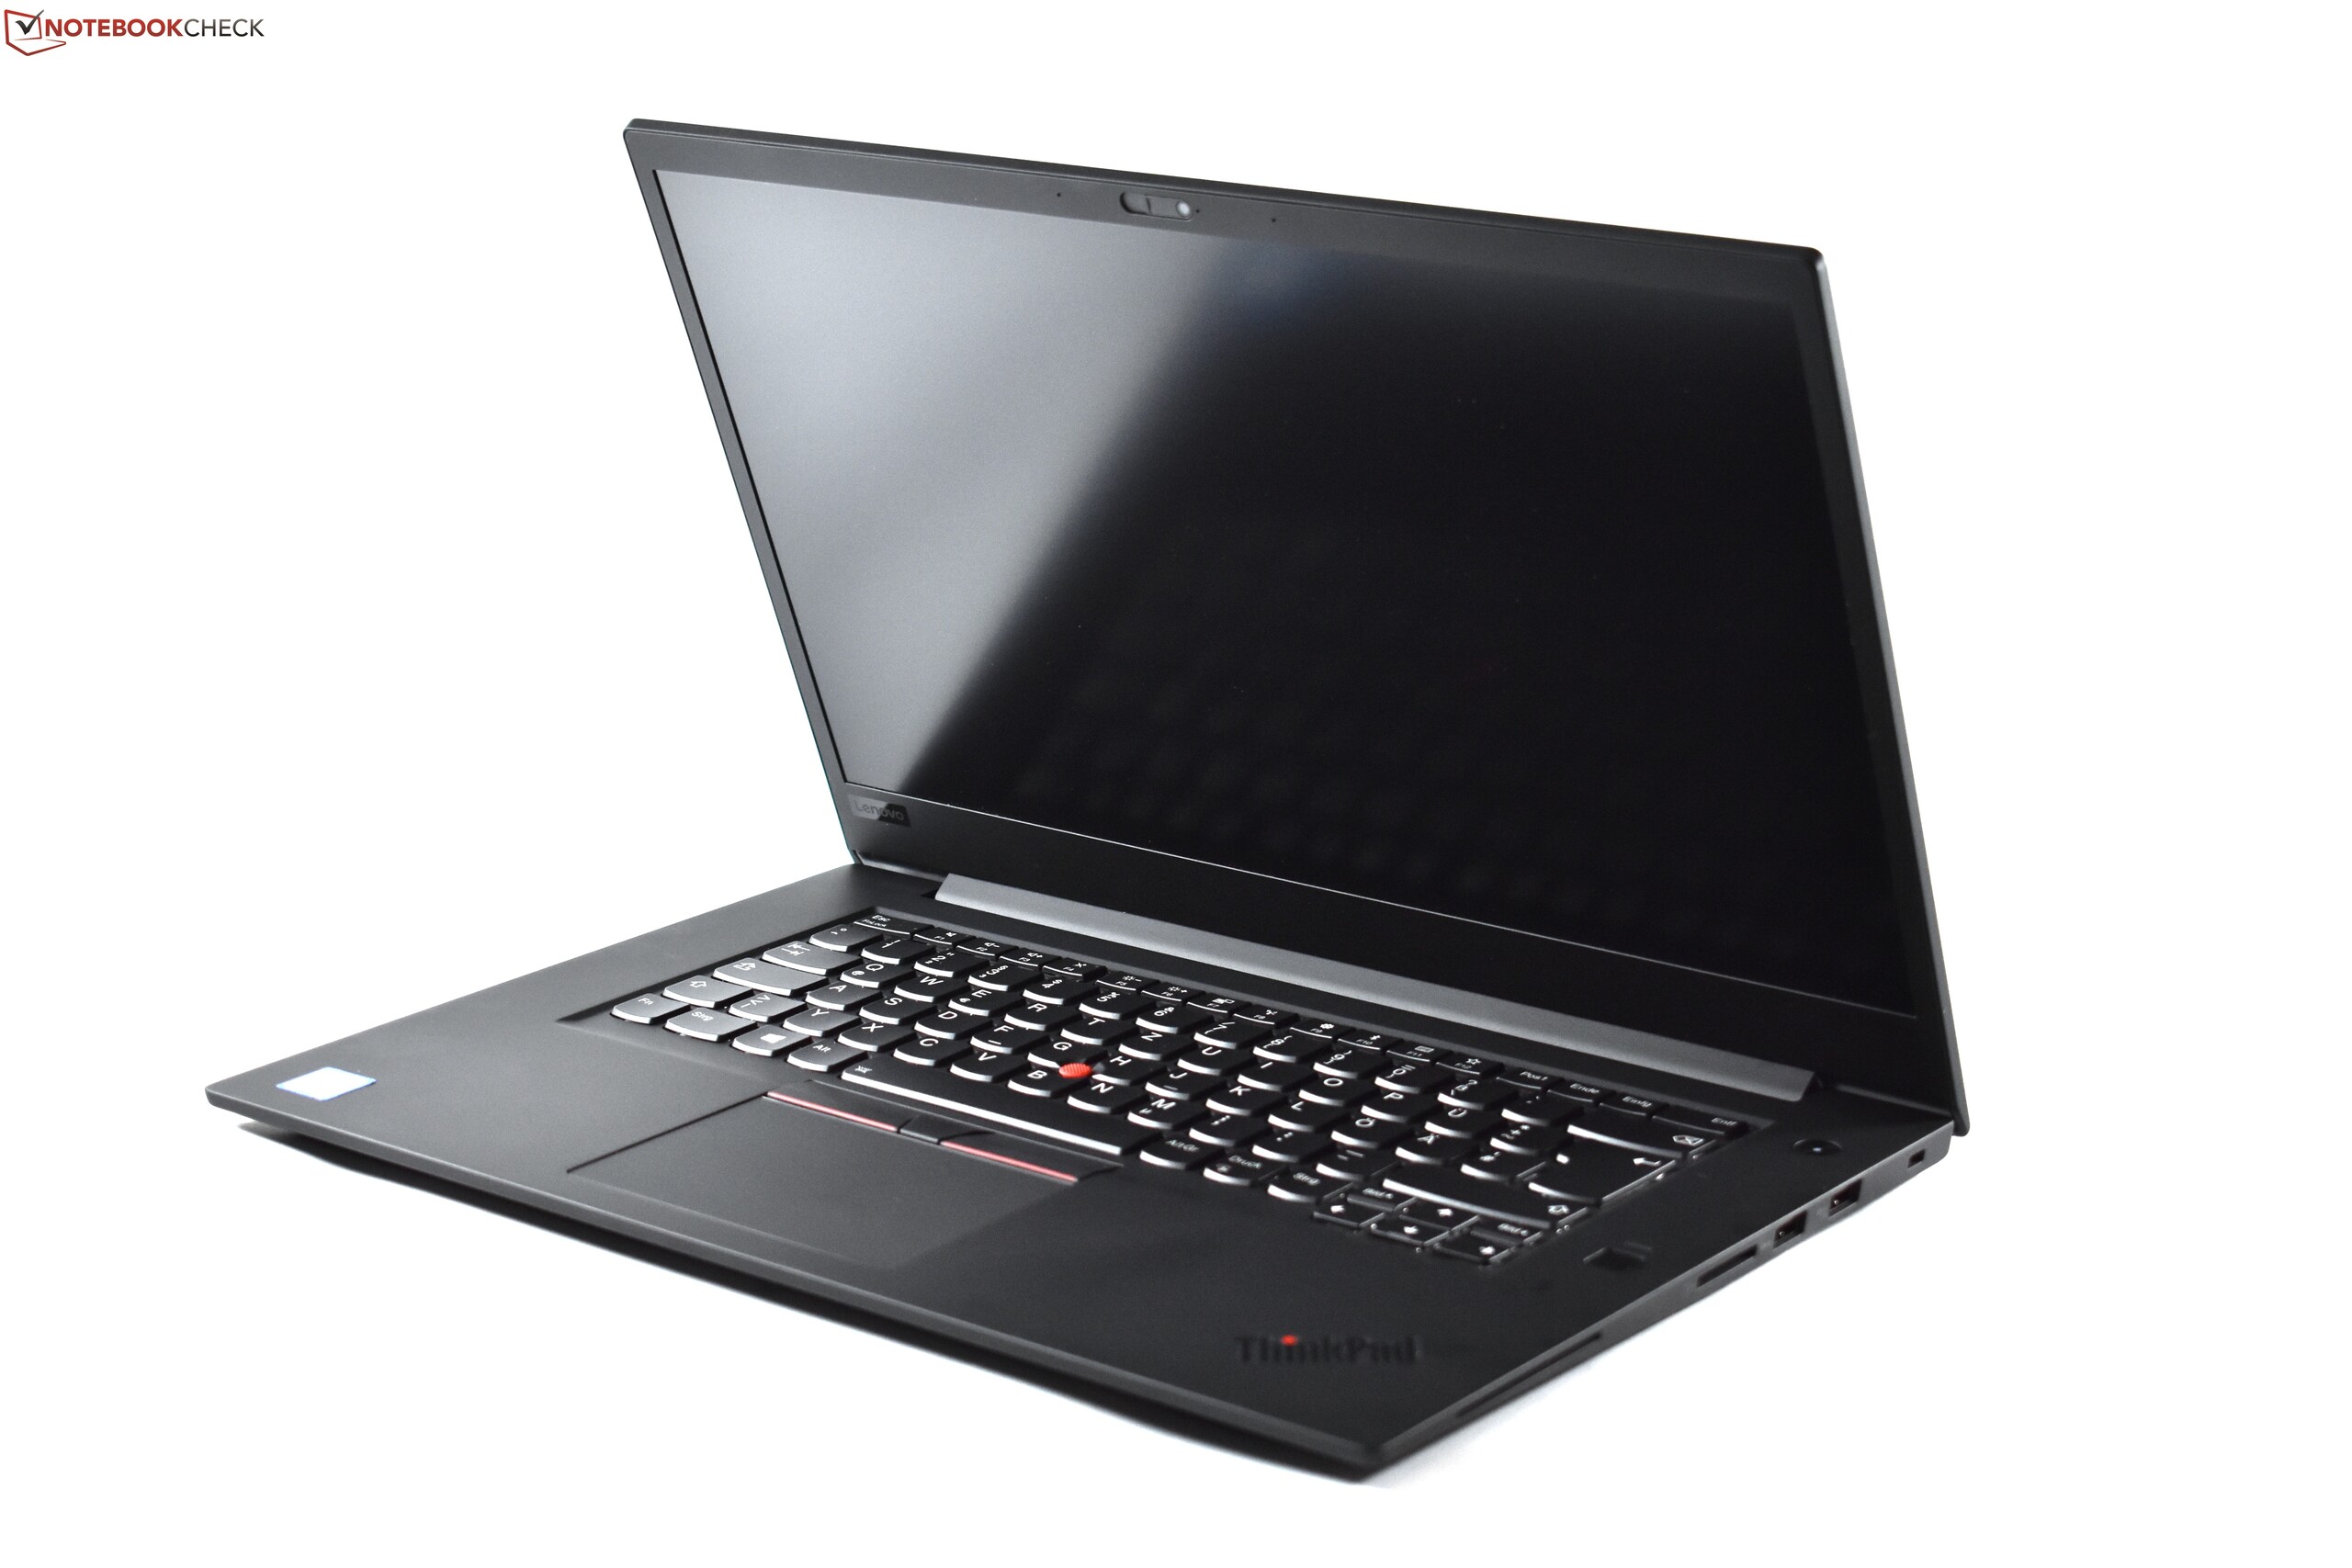
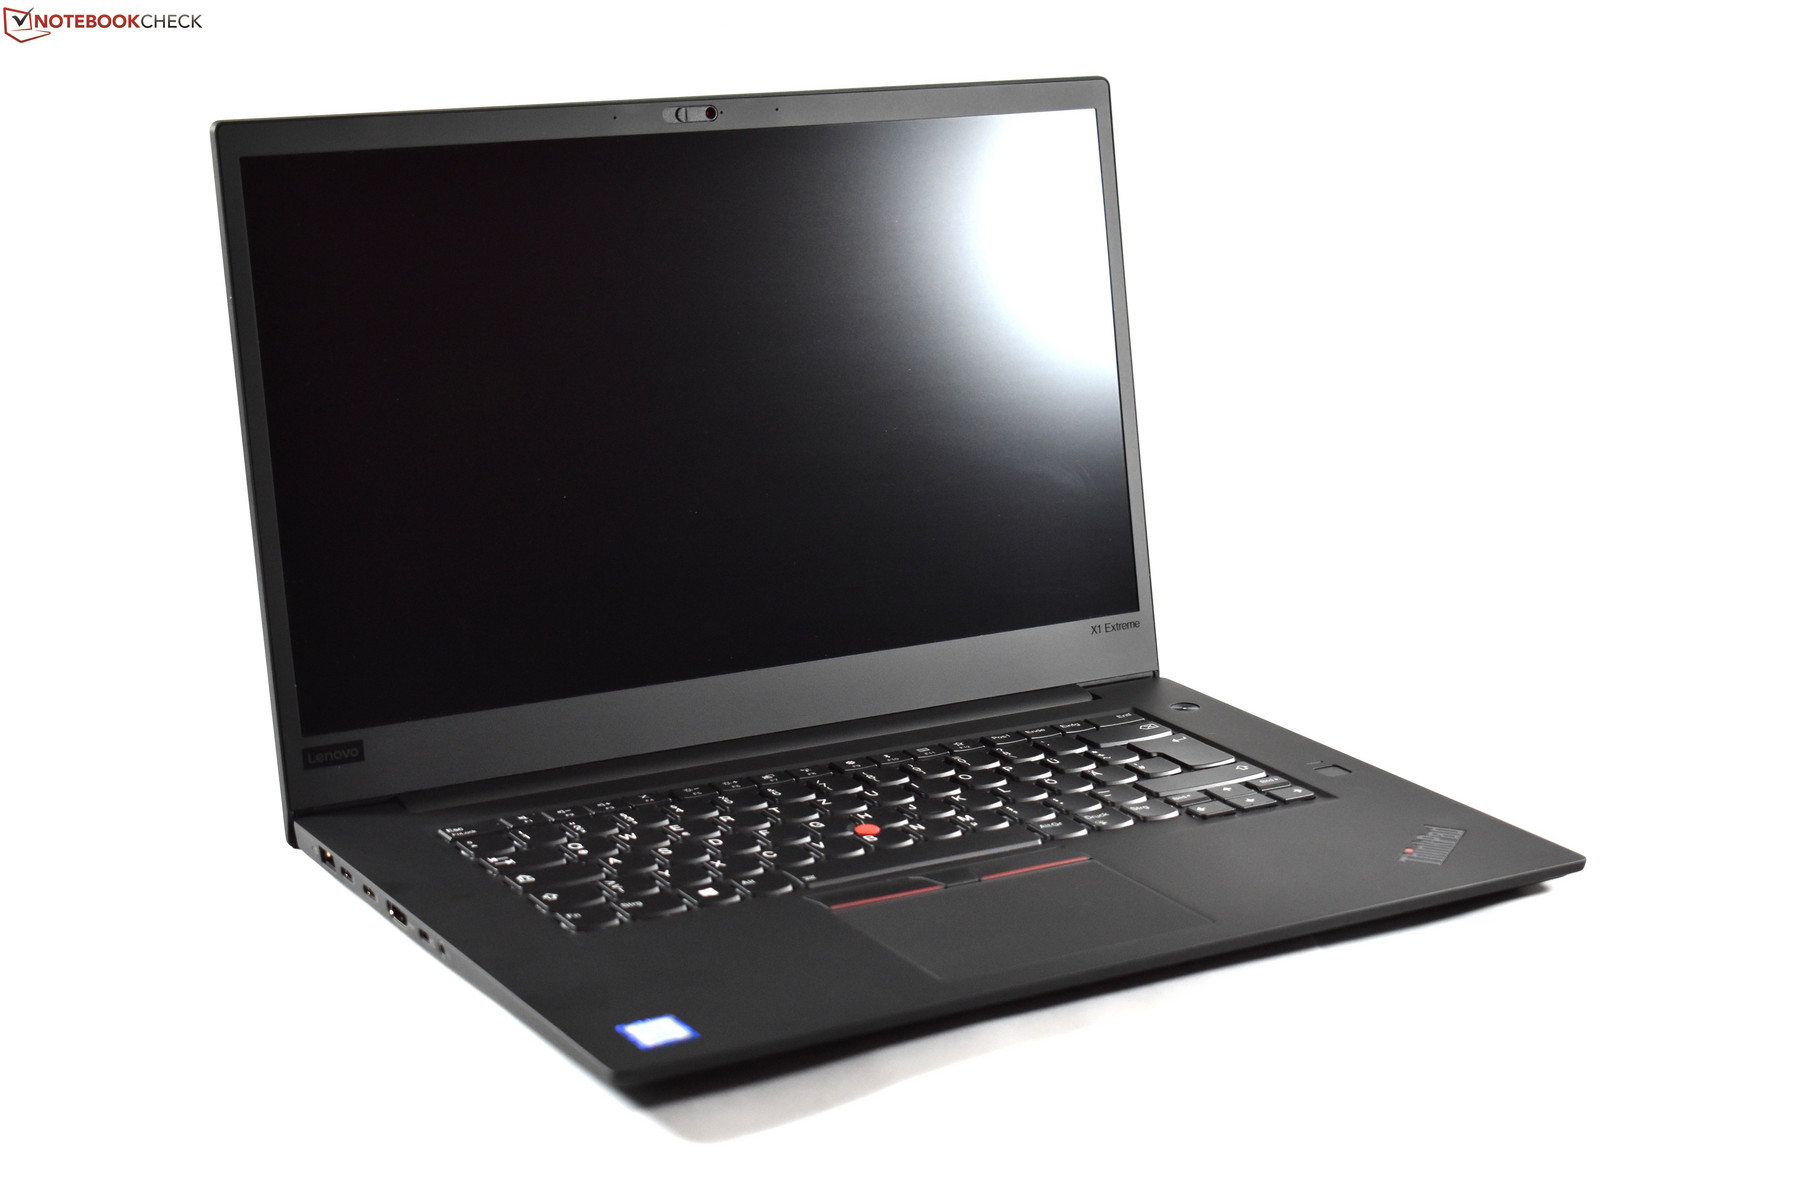
Breve Análise do Portátil Lenovo ThinkPad X1 Extreme (i5, FHD, GTX 1050 Ti Max-Q)
| SD Card Reader | |
| average JPG Copy Test (av. of 3 runs) | |
| Lenovo ThinkPad X1 Extreme-20MF000RGE (Toshiba Exceria Pro SDXC 64 GB UHS-II) | |
| Lenovo ThinkPad P52 20MAS03N00 (Toshiba Exceria Pro SDXC 64 GB UHS-II) | |
| Média da turma Multimedia (23 - 531, n=40, últimos 2 anos) | |
| Dell XPS 15 2018 i5 FHD 97Wh | |
| Lenovo ThinkPad T580-20L9001AUS (Toshiba Exceria Pro SDXC 64 GB UHS-II) | |
| maximum AS SSD Seq Read Test (1GB) | |
| Lenovo ThinkPad X1 Extreme-20MF000RGE (Toshiba Exceria Pro SDXC 64 GB UHS-II) | |
| Dell XPS 15 2018 i5 FHD 97Wh | |
| Média da turma Multimedia (37.3 - 1455, n=39, últimos 2 anos) | |
| Lenovo ThinkPad P52 20MAS03N00 (Toshiba Exceria Pro SDXC 64 GB UHS-II) | |
| Lenovo ThinkPad T580-20L9001AUS (Toshiba Exceria Pro SDXC 64 GB UHS-II) | |
| Networking | |
| iperf3 receive AX12 | |
| Lenovo ThinkPad X1 Extreme-20MF000RGE (iperf 3.1.3) | |
| Dell XPS 15 2018 i5 FHD 97Wh (I210-T1) | |
| HP EliteBook 1050 G1-4QY20EA (I210-T1) | |
| iperf3 transmit AX12 | |
| HP EliteBook 1050 G1-4QY20EA (I210-T1) | |
| Lenovo ThinkPad X1 Extreme-20MF000RGE (iperf 3.1.3) | |
| Dell XPS 15 2018 i5 FHD 97Wh (I210-T1) | |
| |||||||||||||||||||||||||
iluminação: 84 %
iluminação com acumulador: 332 cd/m²
Contraste: 1379:1 (Preto: 0.24 cd/m²)
ΔE ColorChecker Calman: 5.6 | ∀{0.5-29.43 Ø4.71}
calibrated: 3
ΔE Greyscale Calman: 6.3 | ∀{0.09-98 Ø4.96}
88.6% sRGB (Argyll 1.6.3 3D)
58% AdobeRGB 1998 (Argyll 1.6.3 3D)
64.8% AdobeRGB 1998 (Argyll 3D)
88.7% sRGB (Argyll 3D)
68.6% Display P3 (Argyll 3D)
Gamma: 2.33
CCT: 7152 K
| Lenovo ThinkPad X1 Extreme-20MF000RGE NV156FHM-N61, , 1920x1080, 15.6" | Dell XPS 15 2018 i5 FHD 97Wh Sharp SHP149A LQ156M1, , 1920x1080, 15.6" | Lenovo ThinkPad P52 20MAS03N00 N156HCE-EN1, , 1920x1080, 15.6" | Lenovo ThinkPad X1 Extreme-20MF000XGE B156ZAN03.2, , 3840x2160, 15.6" | Lenovo ThinkPad T580-20L9001AUS B156HAK02.0, , 1920x1080, 15.6" | HP EliteBook 850 G5 3JX58EA AUO24ED, , 1920x1080, 15.6" | |
|---|---|---|---|---|---|---|
| Display | 3% | 0% | 31% | -42% | -3% | |
| Display P3 Coverage (%) | 68.6 | 66 -4% | 65.6 -4% | 86.3 26% | 36.94 -46% | 63.4 -8% |
| sRGB Coverage (%) | 88.7 | 96.5 9% | 90.3 2% | 100 13% | 55.3 -38% | 88.8 0% |
| AdobeRGB 1998 Coverage (%) | 64.8 | 66.7 3% | 65.9 2% | 99.4 53% | 38.16 -41% | 64.4 -1% |
| Response Times | 12% | 27% | -3% | 30% | 26% | |
| Response Time Grey 50% / Grey 80% * (ms) | 52.8 ? | 49 ? 7% | 39.2 ? 26% | 61.6 ? -17% | 33.2 ? 37% | 42 ? 20% |
| Response Time Black / White * (ms) | 36 ? | 30 ? 17% | 26 ? 28% | 32 ? 11% | 27.6 ? 23% | 25 ? 31% |
| PWM Frequency (Hz) | 21370 ? | 961 ? | 25250 ? | |||
| Screen | 22% | 4% | 21% | -20% | -6% | |
| Brightness middle (cd/m²) | 331 | 413 25% | 304 -8% | 396 20% | 254.5 -23% | 402 21% |
| Brightness (cd/m²) | 305 | 378 24% | 293 -4% | 380 25% | 238 -22% | 383 26% |
| Brightness Distribution (%) | 84 | 86 2% | 88 5% | 90 7% | 87 4% | 88 5% |
| Black Level * (cd/m²) | 0.24 | 0.29 -21% | 0.26 -8% | 0.28 -17% | 0.27 -13% | 0.41 -71% |
| Contrast (:1) | 1379 | 1424 3% | 1169 -15% | 1414 3% | 943 -32% | 980 -29% |
| Colorchecker dE 2000 * | 5.6 | 2.44 56% | 4.5 20% | 4 29% | 4.58 18% | 5.25 6% |
| Colorchecker dE 2000 max. * | 9.9 | 4.46 55% | 7.7 22% | 7.6 23% | 17.99 -82% | 8.65 13% |
| Colorchecker dE 2000 calibrated * | 3 | 2.48 17% | 2.4 20% | 0.9 70% | 4.34 -45% | 5.19 -73% |
| Greyscale dE 2000 * | 6.3 | 2.48 61% | 5.2 17% | 6.1 3% | 3.3 48% | 4 37% |
| Gamma | 2.33 94% | 2.43 91% | 2.26 97% | 2.25 98% | 2.403 92% | 2.68 82% |
| CCT | 7152 91% | 7006 93% | 6789 96% | 7786 83% | 6355 102% | 6756 96% |
| Color Space (Percent of AdobeRGB 1998) (%) | 58 | 62 7% | 53.8 -7% | 88.5 53% | 35 -40% | 58 0% |
| Color Space (Percent of sRGB) (%) | 88.6 | 96 8% | 90.1 2% | 100 13% | 55 -38% | 89 0% |
| Média Total (Programa/Configurações) | 12% /
17% | 10% /
6% | 16% /
20% | -11% /
-18% | 6% /
-1% |
* ... menor é melhor
Exibir tempos de resposta
| ↔ Tempo de resposta preto para branco | ||
|---|---|---|
| 36 ms ... ascensão ↗ e queda ↘ combinadas | ↗ 19.6 ms ascensão | 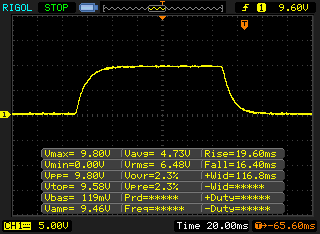 |
| ↘ 16.4 ms queda | ||
| A tela mostra taxas de resposta lentas em nossos testes e será insatisfatória para os jogadores. Em comparação, todos os dispositivos testados variam de 0.1 (mínimo) a 240 (máximo) ms. » 94 % de todos os dispositivos são melhores. Isso significa que o tempo de resposta medido é pior que a média de todos os dispositivos testados (19.8 ms). | ||
| ↔ Tempo de resposta 50% cinza a 80% cinza | ||
| 52.8 ms ... ascensão ↗ e queda ↘ combinadas | ↗ 27.6 ms ascensão | 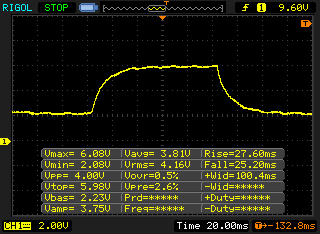 |
| ↘ 25.2 ms queda | ||
| A tela mostra taxas de resposta lentas em nossos testes e será insatisfatória para os jogadores. Em comparação, todos os dispositivos testados variam de 0.165 (mínimo) a 636 (máximo) ms. » 89 % de todos os dispositivos são melhores. Isso significa que o tempo de resposta medido é pior que a média de todos os dispositivos testados (31 ms). | ||
Cintilação da tela / PWM (modulação por largura de pulso)
| Tela tremeluzindo/PWM detectado | 21370 Hz | ≤ 99 % configuração de brilho | 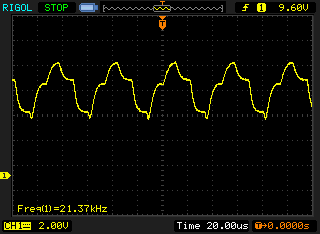 |
A luz de fundo da tela pisca em 21370 Hz (pior caso, por exemplo, utilizando PWM) Cintilação detectada em uma configuração de brilho de 99 % e abaixo. Não deve haver cintilação ou PWM acima desta configuração de brilho. A frequência de 21370 Hz é bastante alta, então a maioria dos usuários sensíveis ao PWM não deve notar nenhuma oscilação. [pwm_comparison] Em comparação: 52 % de todos os dispositivos testados não usam PWM para escurecer a tela. Se PWM foi detectado, uma média de 7747 (mínimo: 5 - máximo: 343500) Hz foi medida. | |||
| PCMark 8 Home Score Accelerated v2 | 4150 pontos | |
| PCMark 8 Work Score Accelerated v2 | 5357 pontos | |
| PCMark 10 Score | 4467 pontos | |
Ajuda | ||
| Lenovo ThinkPad X1 Extreme-20MF000RGE Samsung SSD PM981 MZVLB256HAHQ | Dell XPS 15 2018 i5 FHD 97Wh Lite-On CA3-8D256-Q11 | HP EliteBook 850 G5 3JX58EA Toshiba XG5 KXG50ZNV256G | HP EliteBook 1050 G1-4QY20EA Toshiba XG5-P KXG50PNV2T04 | Lenovo ThinkPad P52 20MAS03N00 Samsung SSD PM981 MZVLB512HAJQ | Lenovo ThinkPad X1 Extreme-20MF000XGE Samsung SSD PM981 MZVLB1T0HALR | Média Samsung SSD PM981 MZVLB256HAHQ | |
|---|---|---|---|---|---|---|---|
| CrystalDiskMark 5.2 / 6 | -14% | -26% | -11% | 22% | 24% | 41% | |
| Write 4K (MB/s) | 109.4 | 89.4 -18% | 95.9 -12% | 94.8 -13% | 108.5 -1% | 123.7 13% | 116.1 ? 6% |
| Read 4K (MB/s) | 41.5 | 44.64 8% | 30.91 -26% | 26.45 -36% | 42.78 3% | 44.07 6% | 189.5 ? 357% |
| Write Seq (MB/s) | 1460 | 830 -43% | 312.5 -79% | 1037 -29% | 1645 13% | 2215 52% | 1409 ? -3% |
| Read Seq (MB/s) | 1561 | 1774 14% | 1966 26% | 1280 -18% | 1485 -5% | 2242 44% | 1624 ? 4% |
| Write 4K Q32T1 (MB/s) | 278.4 | 310.6 12% | 308.8 11% | 277.6 0% | 269.2 -3% | 313.9 13% | 360 ? 29% |
| Read 4K Q32T1 (MB/s) | 354.9 | 266.4 -25% | 248.6 -30% | 333.9 -6% | 348.7 -2% | 359.8 1% | 396 ? 12% |
| Write Seq Q32T1 (MB/s) | 1461 | 831 -43% | 292.2 -80% | 1037 -29% | 1877 28% | 2404 65% | 1492 ? 2% |
| Read Seq Q32T1 (MB/s) | 3452 | 2962 -14% | 2718 -21% | 3135 -9% | 3419 -1% | 3333 -3% | 3313 ? -4% |
| Write 4K Q8T8 (MB/s) | 1415 | 1044 -26% | 1523 8% | 1152 ? -19% | |||
| Read 4K Q8T8 (MB/s) | 572 | 914 60% | 1614 182% | 736 ? 29% |

| 3DMark 11 Performance | 8349 pontos | |
| 3DMark Cloud Gate Standard Score | 22522 pontos | |
| 3DMark Fire Strike Score | 6380 pontos | |
Ajuda | ||
| baixo | média | alto | ultra | |
|---|---|---|---|---|
| BioShock Infinite (2013) | 244.3 | 194.6 | 175.8 | 71.3 |
| The Witcher 3 (2015) | 130.7 | 80.9 | 45.1 | 25.2 |
| Civilization 6 (2016) | 112.5 | 85.8 | 51 | 43 |
Barulho
| Ocioso |
| 28.9 / 28.9 / 30.7 dB |
| Carga |
| 36.7 / 39.5 dB |
 | ||
30 dB silencioso 40 dB(A) audível 50 dB(A) ruidosamente alto |
||
min: | ||
(±) A temperatura máxima no lado superior é 43.4 °C / 110 F, em comparação com a média de 36.8 °C / 98 F , variando de 21 a 71 °C para a classe Multimedia.
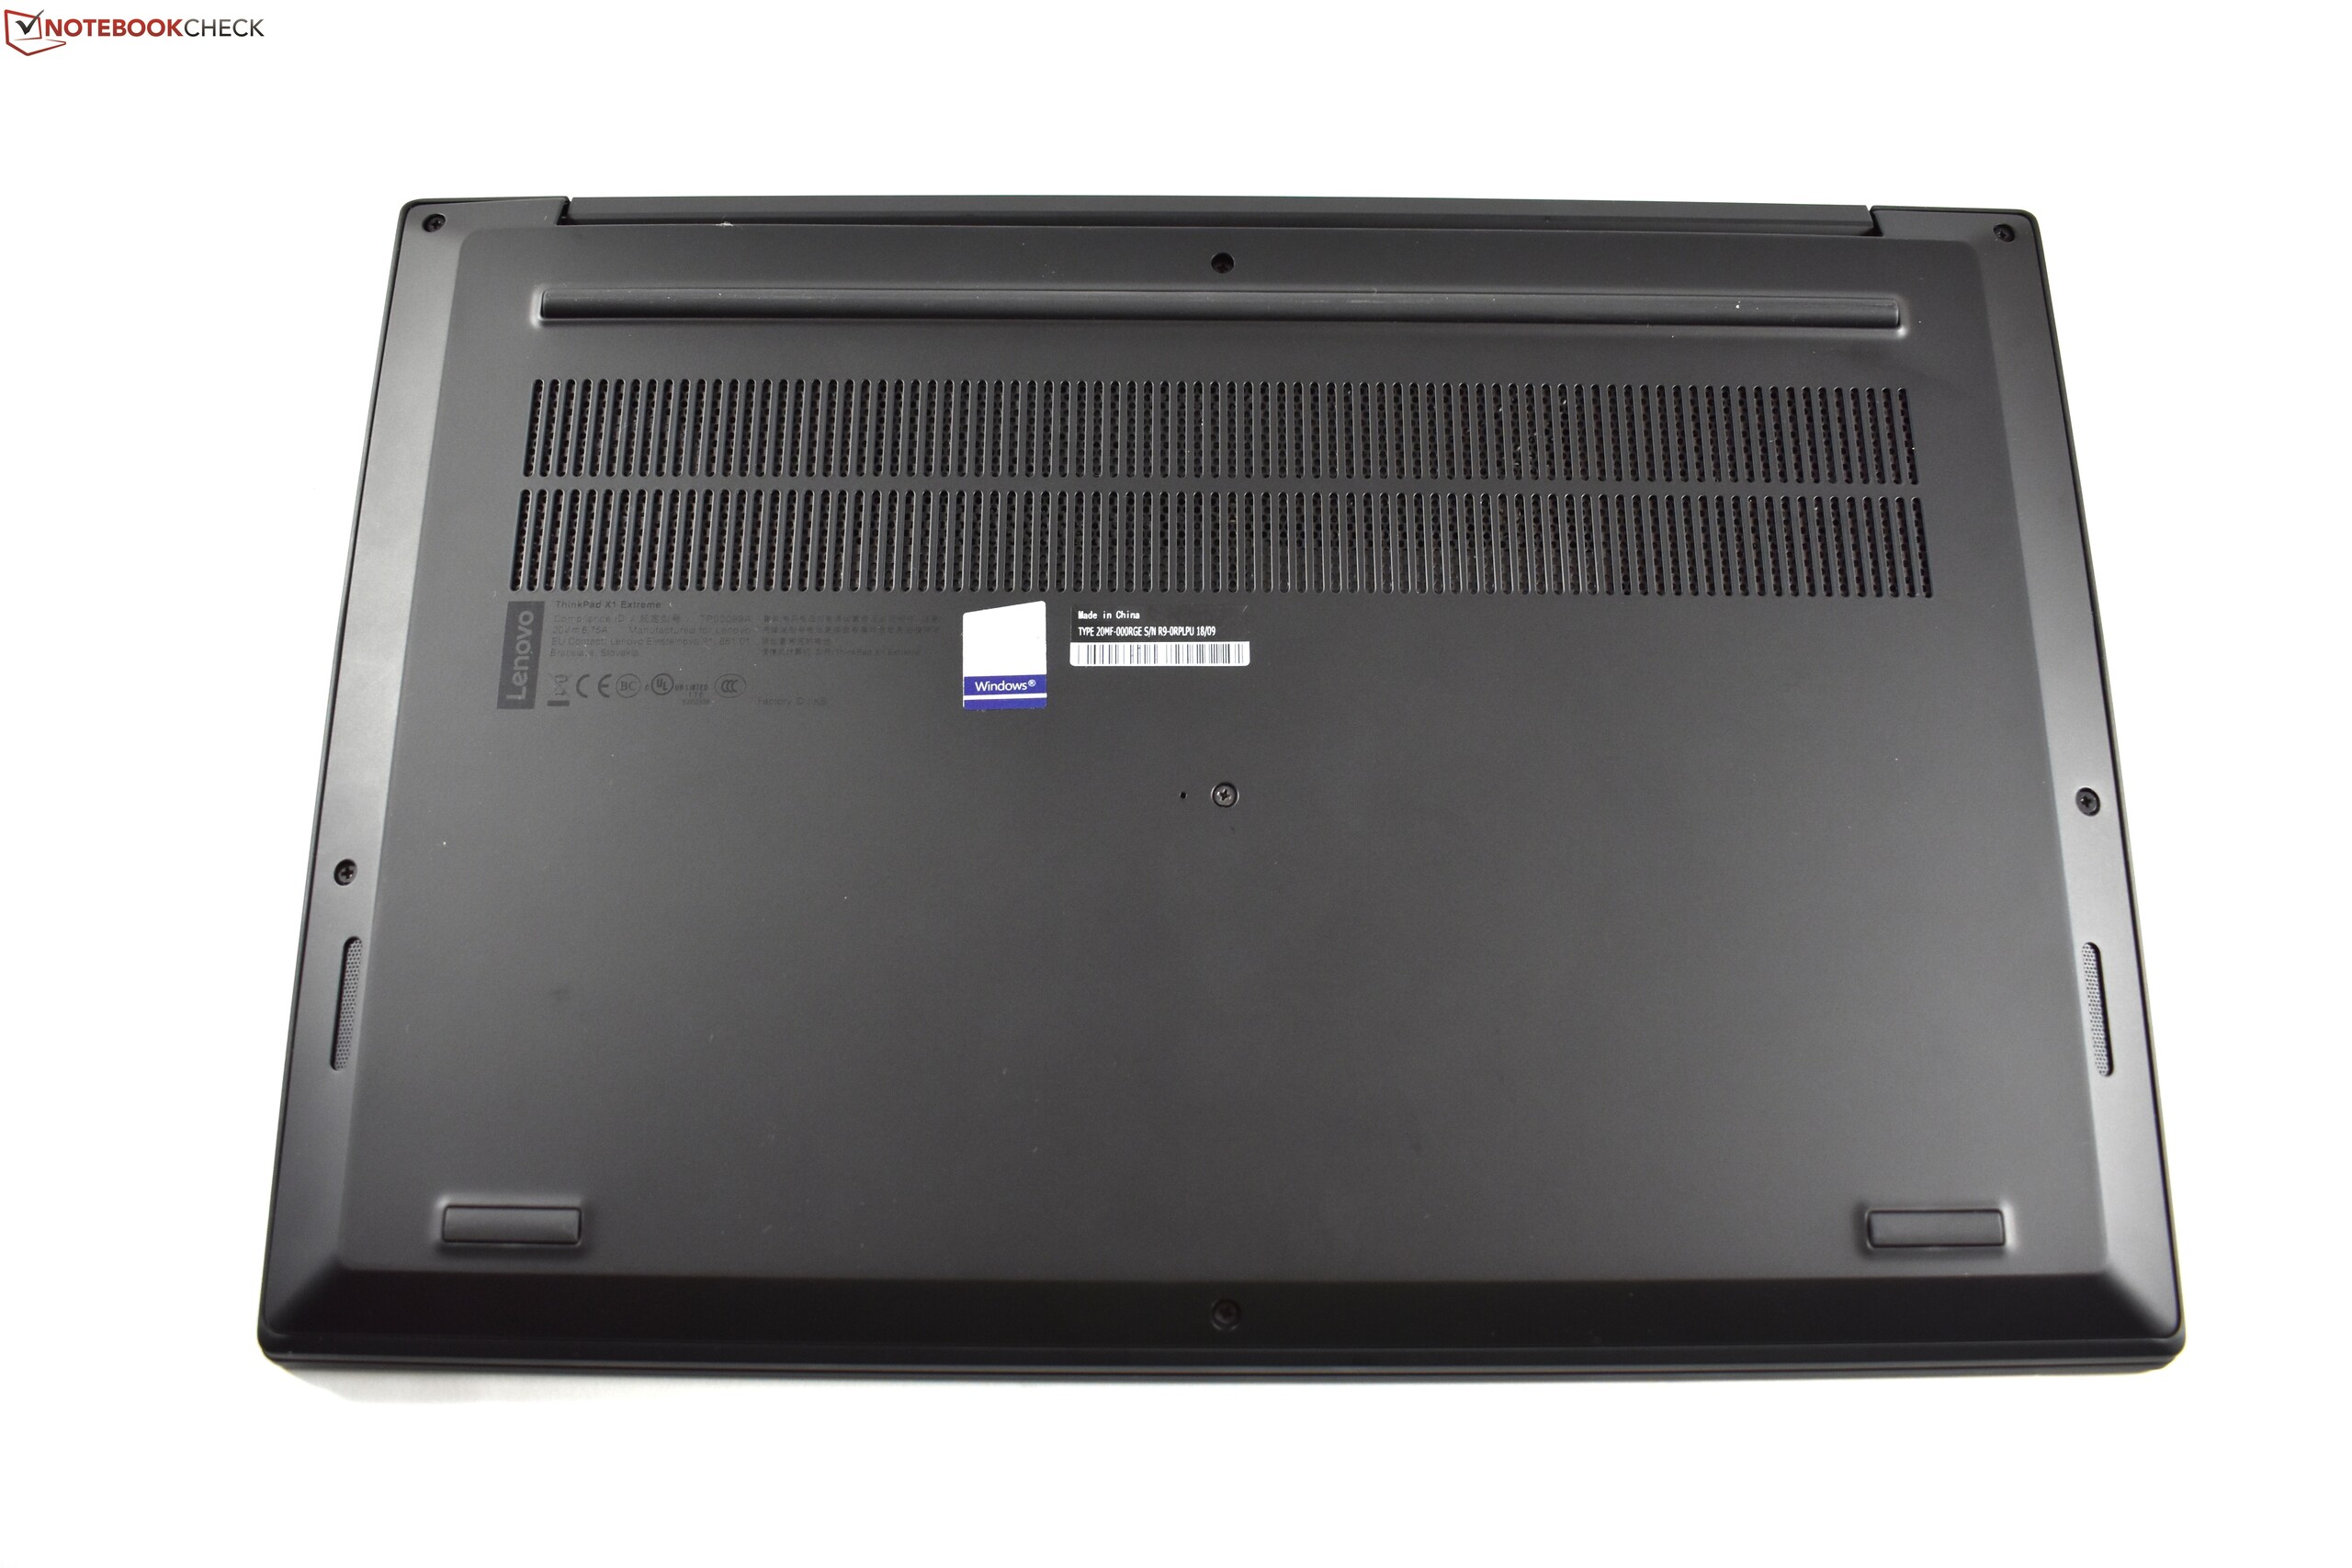
(-) A parte inferior aquece até um máximo de 50.9 °C / 124 F, em comparação com a média de 39.1 °C / 102 F
(+) Em uso inativo, a temperatura média para o lado superior é 24.5 °C / 76 F, em comparação com a média do dispositivo de 31.3 °C / ### class_avg_f### F.
(±) Jogando The Witcher 3, a temperatura média para o lado superior é 35.6 °C / 96 F, em comparação com a média do dispositivo de 31.3 °C / ## #class_avg_f### F.
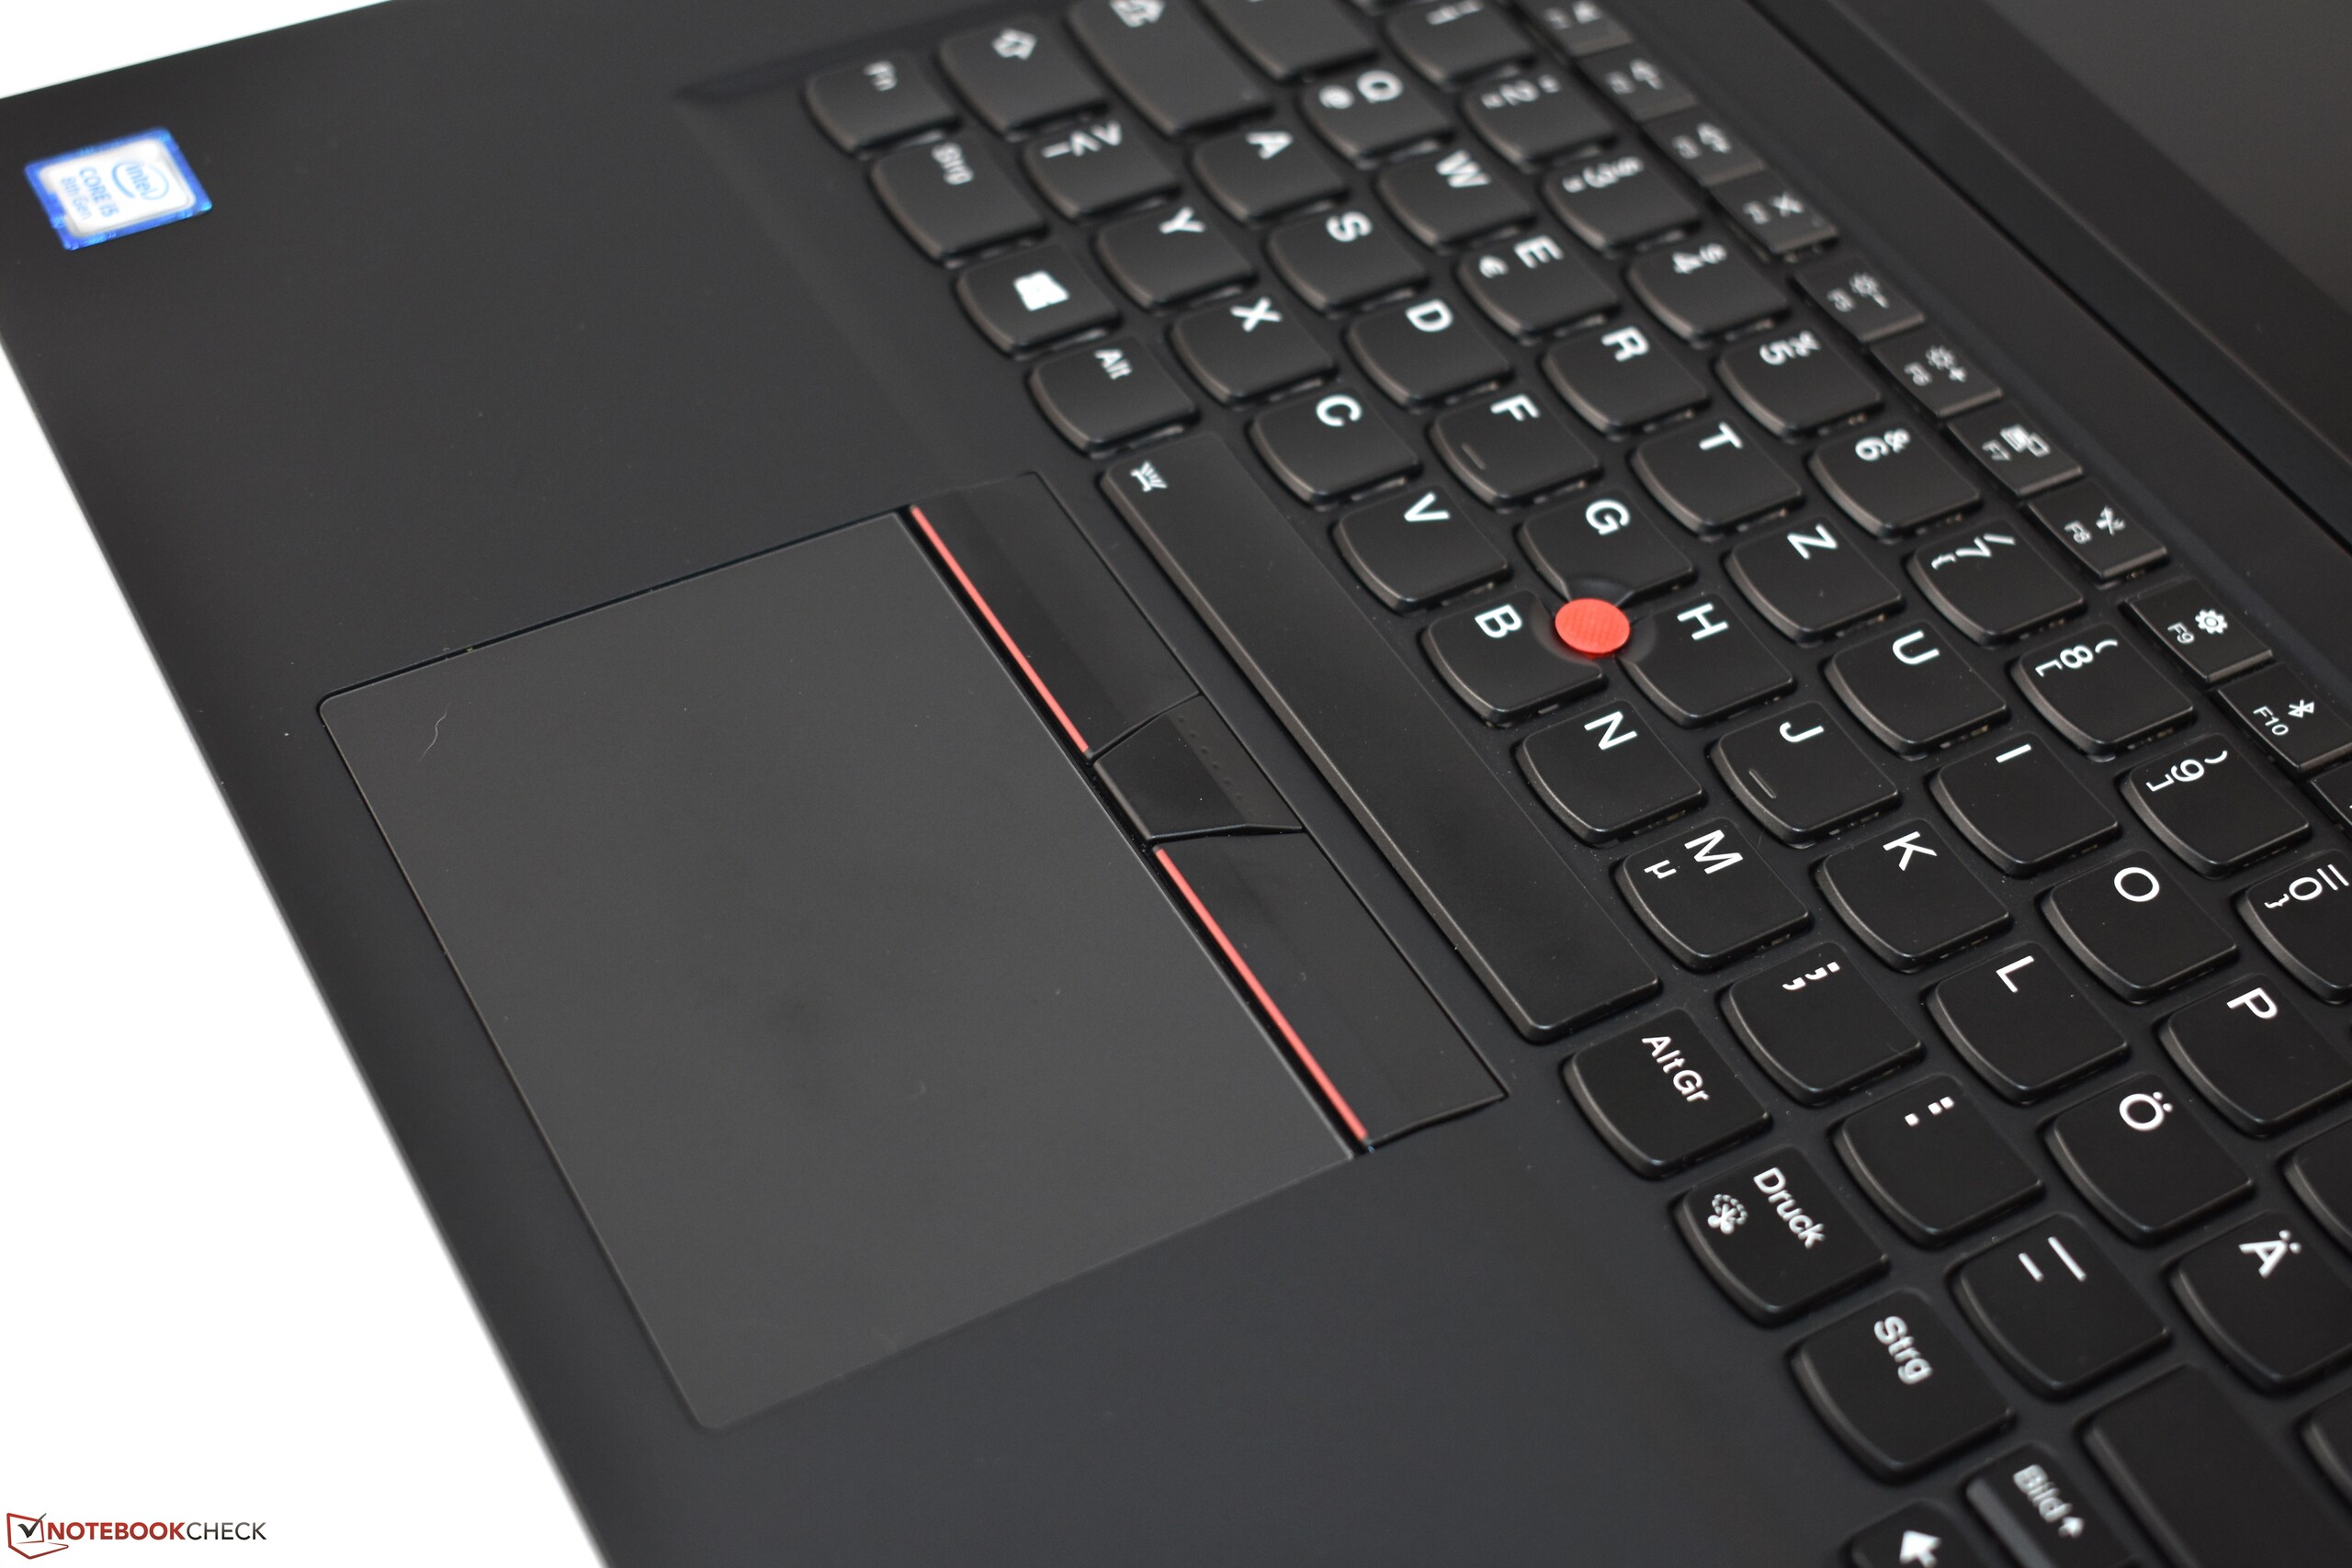
(+) Os apoios para as mãos e o touchpad são mais frios que a temperatura da pele, com um máximo de 29.5 °C / 85.1 F e, portanto, são frios ao toque.
(±) A temperatura média da área do apoio para as mãos de dispositivos semelhantes foi 28.7 °C / 83.7 F (-0.8 °C / -1.4 F).
| desligado | |
| Ocioso | |
| Carga |
|
Key:
min: | |
| Lenovo ThinkPad X1 Extreme-20MF000RGE i5-8300H, GeForce GTX 1050 Ti Max-Q, Samsung SSD PM981 MZVLB256HAHQ, IPS LED, 1920x1080, 15.6" | Dell XPS 15 2018 i5 FHD 97Wh i5-8300H, GeForce GTX 1050 Mobile, Lite-On CA3-8D256-Q11, LED IGZO IPS InfinityEdge, 1920x1080, 15.6" | Lenovo ThinkPad X1 Extreme-20MF000XGE i7-8750H, GeForce GTX 1050 Ti Max-Q, Samsung SSD PM981 MZVLB1T0HALR, IPS, 3840x2160, 15.6" | Lenovo ThinkPad P52 20MAS03N00 i7-8750H, Quadro P1000, Samsung SSD PM981 MZVLB512HAJQ, IPS LED, 1920x1080, 15.6" | Lenovo ThinkPad T580-20L9001AUS i7-8650U, UHD Graphics 620, Samsung SSD PM981 MZVLB512HAJQ, IPS, 1920x1080, 15.6" | HP EliteBook 850 G5 3JX58EA i5-8250U, UHD Graphics 620, Toshiba XG5 KXG50ZNV256G, IPS LED, 1920x1080, 15.6" | HP EliteBook 1050 G1-4QY20EA i7-8750H, GeForce GTX 1050 Max-Q, Toshiba XG5-P KXG50PNV2T04, IPS LED, 3840x2160, 15.6" | Média NVIDIA GeForce GTX 1050 Ti Max-Q | Média da turma Multimedia | |
|---|---|---|---|---|---|---|---|---|---|
| Power Consumption | 16% | -42% | -2% | 16% | 31% | -22% | -25% | -13% | |
| Idle Minimum * (Watt) | 4.14 | 2.9 30% | 7.6 -84% | 4.02 3% | 4.7 -14% | 2.7 35% | 6.1 -47% | 5.8 ? -40% | 5.72 ? -38% |
| Idle Average * (Watt) | 7.3 | 5.8 21% | 14.8 -103% | 7.2 1% | 7.9 -8% | 8.1 -11% | 10.2 -40% | 11.2 ? -53% | 10.2 ? -40% |
| Idle Maximum * (Watt) | 11.5 | 7.5 35% | 17.6 -53% | 11.46 -0% | 11.4 1% | 10.1 12% | 13.4 -17% | 13.5 ? -17% | 12.4 ? -8% |
| Load Average * (Watt) | 78.8 | 77.5 2% | 86 -9% | 76.3 3% | 47.2 40% | 39 51% | 82 -4% | 86.9 ? -10% | 65.5 ? 17% |
| Witcher 3 ultra * (Watt) | 82 | 84 -2% | 85 -4% | 74 10% | |||||
| Load Maximum * (Watt) | 118 | 107 9% | 118.9 -1% | 154 -31% | 48.1 59% | 37.2 68% | 122 -3% | 122.4 ? -4% | 114 ? 3% |
* ... menor é melhor
| Lenovo ThinkPad X1 Extreme-20MF000RGE i5-8300H, GeForce GTX 1050 Ti Max-Q, 80 Wh | Dell XPS 15 2018 i5 FHD 97Wh i5-8300H, GeForce GTX 1050 Mobile, 97 Wh | Lenovo ThinkPad X1 Extreme-20MF000XGE i7-8750H, GeForce GTX 1050 Ti Max-Q, 80 Wh | Lenovo ThinkPad P52 20MAS03N00 i7-8750H, Quadro P1000, 96 Wh | HP EliteBook 1050 G1-4QY20EA i7-8750H, GeForce GTX 1050 Max-Q, 96 Wh | HP EliteBook 850 G5 3JX58EA i5-8250U, UHD Graphics 620, 56 Wh | Média da turma Multimedia | |
|---|---|---|---|---|---|---|---|
| Duração da bateria | 37% | -25% | 8% | -2% | 22% | 28% | |
| Reader / Idle (h) | 21 | 11.5 -45% | 25.3 20% | 17.1 -19% | 17.8 -15% | 24.9 ? 19% | |
| H.264 (h) | 9.6 | 6.2 -35% | 12.2 27% | 9.7 1% | 10.5 9% | 16.4 ? 71% | |
| WiFi v1.3 (h) | 9.4 | 15.7 67% | 6.4 -32% | 10.6 13% | 8.7 -7% | 9.3 -1% | 12.2 ? 30% |
| Load (h) | 1.8 | 1.9 6% | 2 11% | 1.3 -28% | 2.1 17% | 3.5 94% | 1.668 ? -7% |
| Witcher 3 ultra (h) | 1 | 1.1 |
Pro
Contra
A primeira unidade de análise do Lenovo ThinkPad X1 Extreme conseguiu nos conquistar de muitas maneiras, alcançando assim uma pontuação de 91%. O modelo mais barato com tela FHD e CPU i5, que analisamos hoje, teve um desempenho ainda melhor, com uma avaliação rara de 92%.
O principal motivo para este resultado surpreendente é a tela FHD, que é ao mesmo tempo uma maldição e uma bênção. Sua qualidade é boa, embora talvez não seja boa o suficiente para uma máquina na seção premium do mercado. O valor do brilho não atinge os valores da tela do Dell XPS 15 FHD e a gama de cores está muito longe da excelente tela 4K-UHD no mais caro X1 Extreme. Isso pode ser visto como um problema de primeiro mundo por alguns, embora nós gostaríamos de ver uma cobertura sRGB de 100% ou perto de 100% - 88% está, infelizmente, um pouco longe demais. Mas a tela não é do todo ruim: Por exemplo, ele oferece uma superfície de tela mate que minimiza reflexos irritantes, o que facilita o trabalho em ambientes claros. A vantagem mais importante dessa tela é seu menor consumo de energia, que resulta em três horas de duração adicional de bateria no teste Wi-Fi. Além disso, o som rangente que nos incomodou no modelo de tela táctil não é encontrado no modelo FHD não táctil.
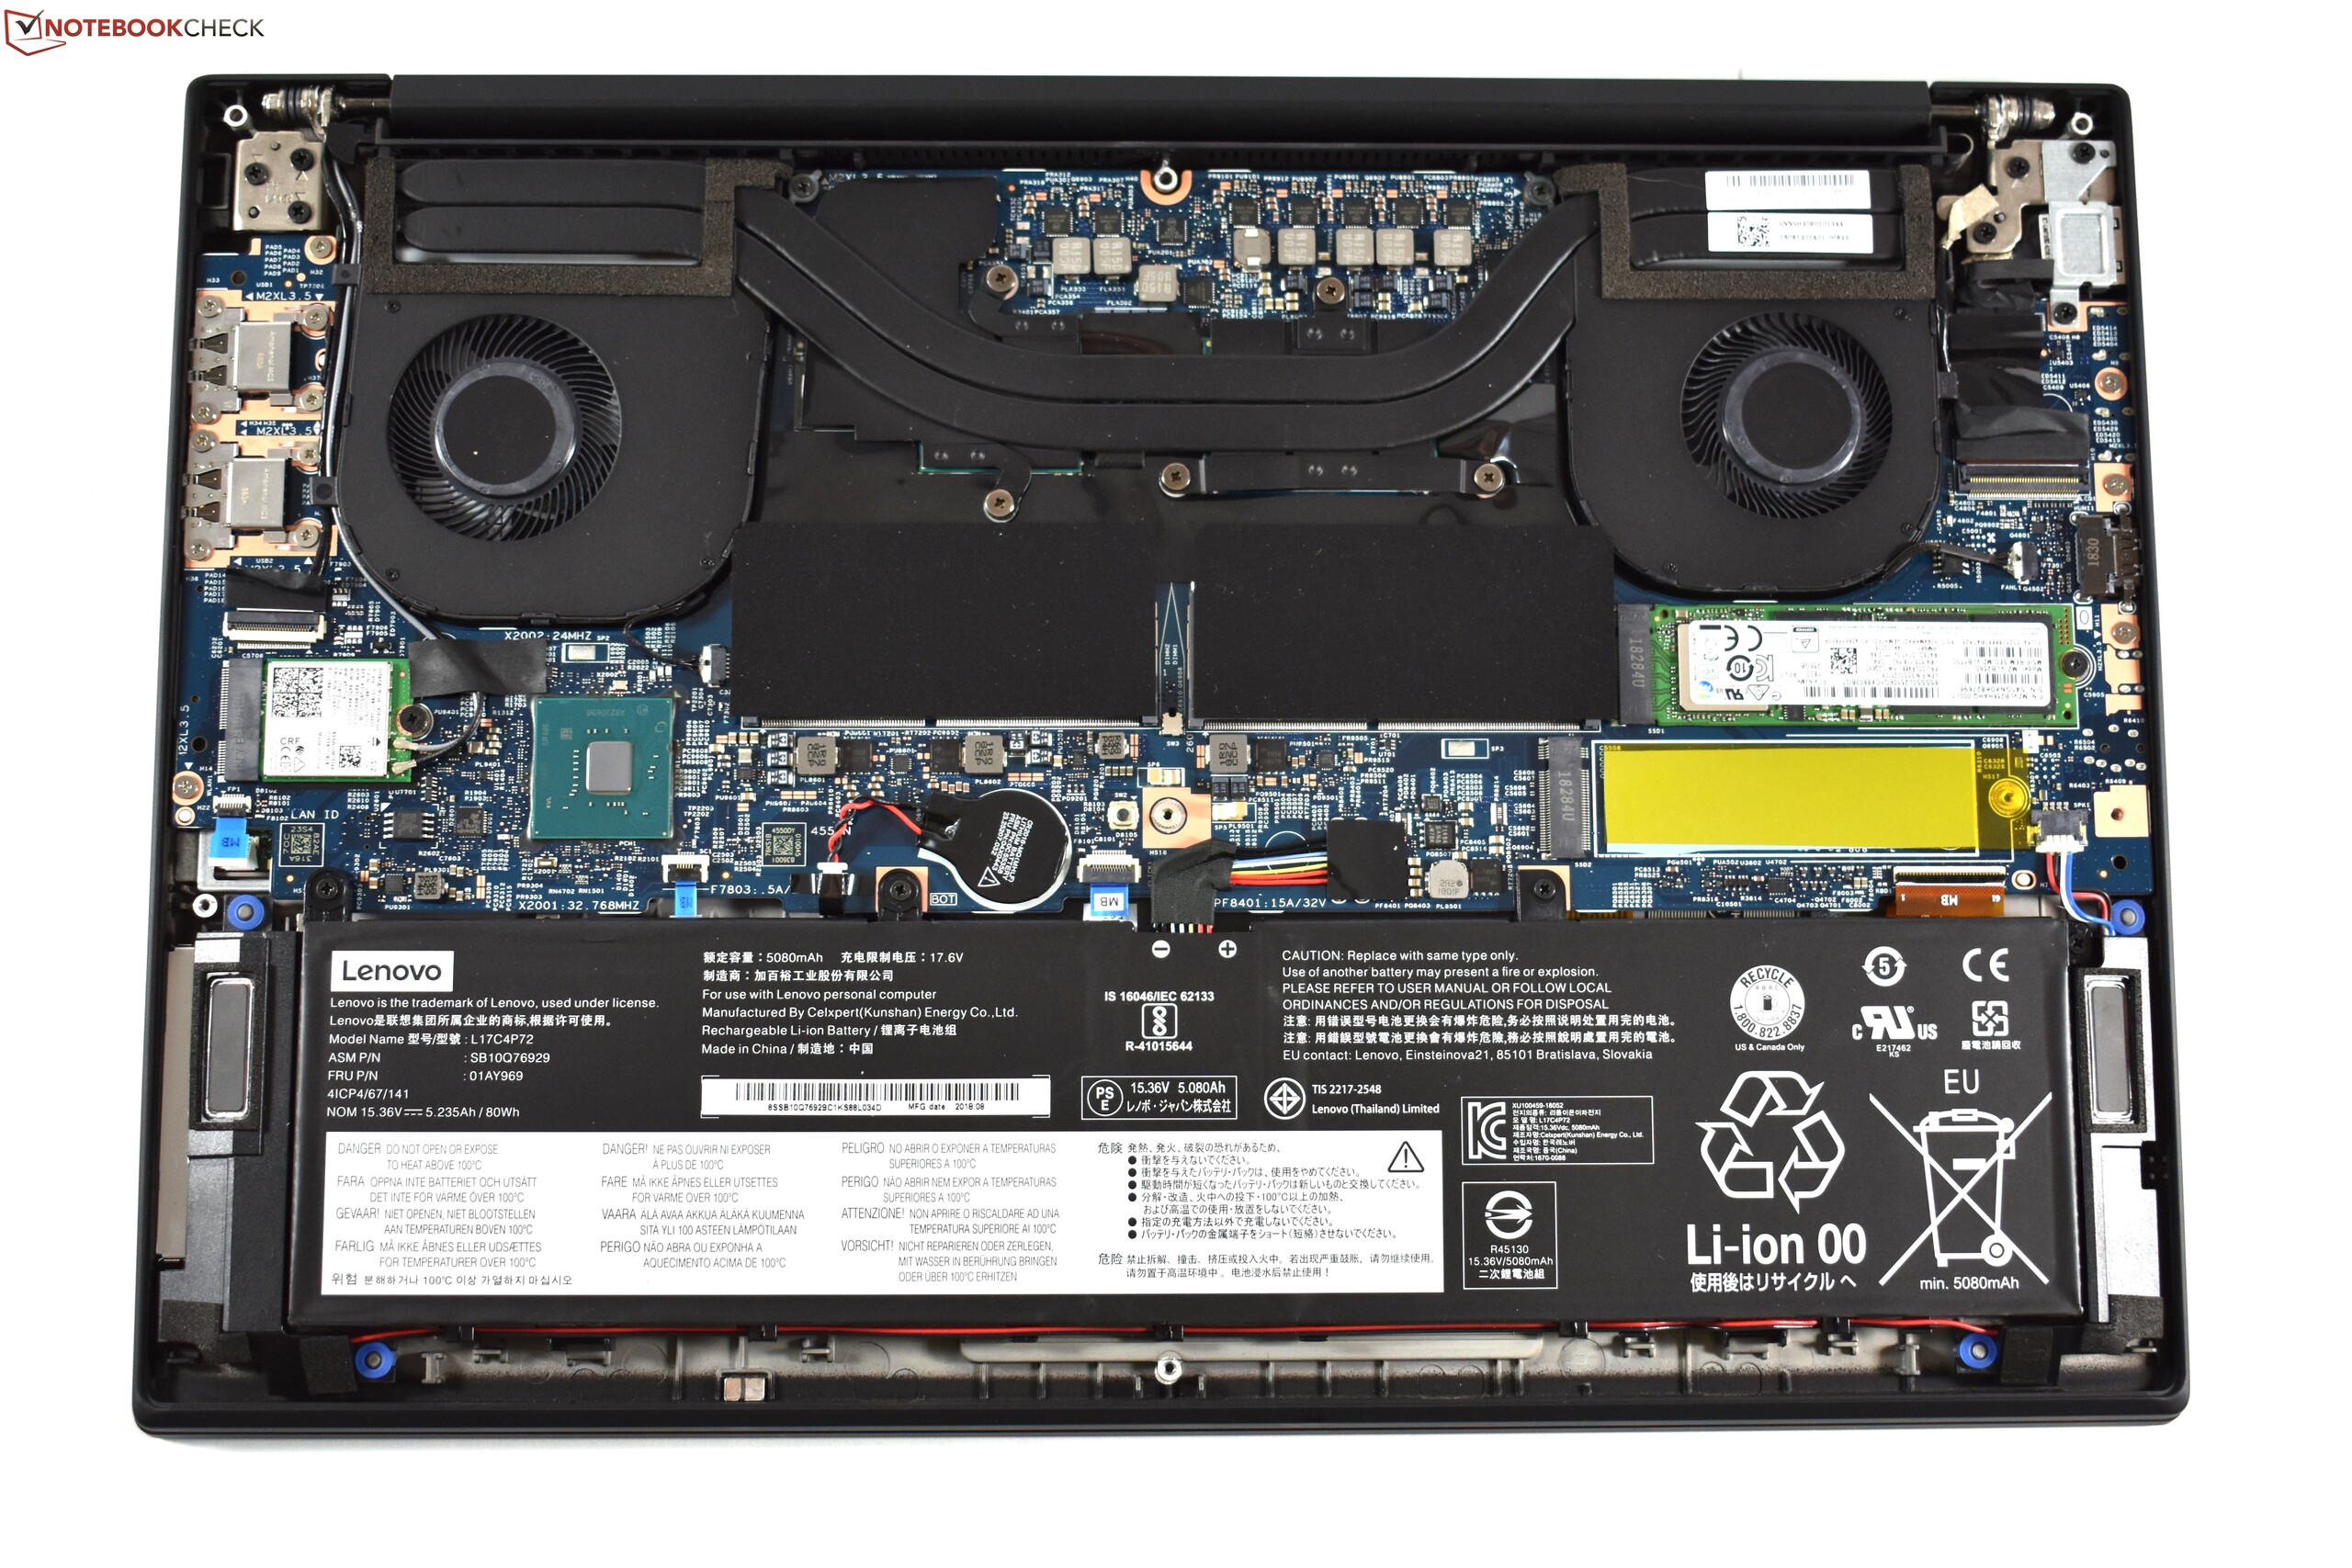
Esses pontos foram os principais fatores na pontuação um pouco melhor. No geral, preferimos o modelo menos caro do Lenovo ThinkPad X1 Extreme - a RAM e o SSD podem ser facilmente atualizados e a escolha do processador i5 menos potente também reduz o preço já alto do X1 Extreme. A tela FHD deve satisfazer a maioria dos usuários no uso diário, o que é mais livre de problemas graças à superfície mate da tela e à maior duração da bateria. Embora deva ser mencionado, é claro, que para pessoas que trabalham com cores, a tela 4K-UHD ainda é a melhor opção. A tela de gama alta também oferece o recurso táctil e HDR, que provavelmente influenciarão alguns usuários a preferirem a opção FHD.
Mais barato é melhor: A versão básica do Lenovo ThinkPad X1 Extreme nos convenceu um pouco mais do que sua contraparte mais cara.
É claro que é chato escolher entre a qualidade da tela, a superfície da tela mate e melhor duração da bateria ao comprar o X1 Extreme. Essas são áreas em que a Lenovo deve trabalhar com uma possível atualização futura do ThinkPad X1 Extreme. O fabricante deve dar uma olhada na Dell e na HP aqui: O Dell XPS 9570 inclui uma bateria muito maior e a HP oferece seu HP EliteBook 1050 G1 com uma tela mate 4K-UHD não táctil.
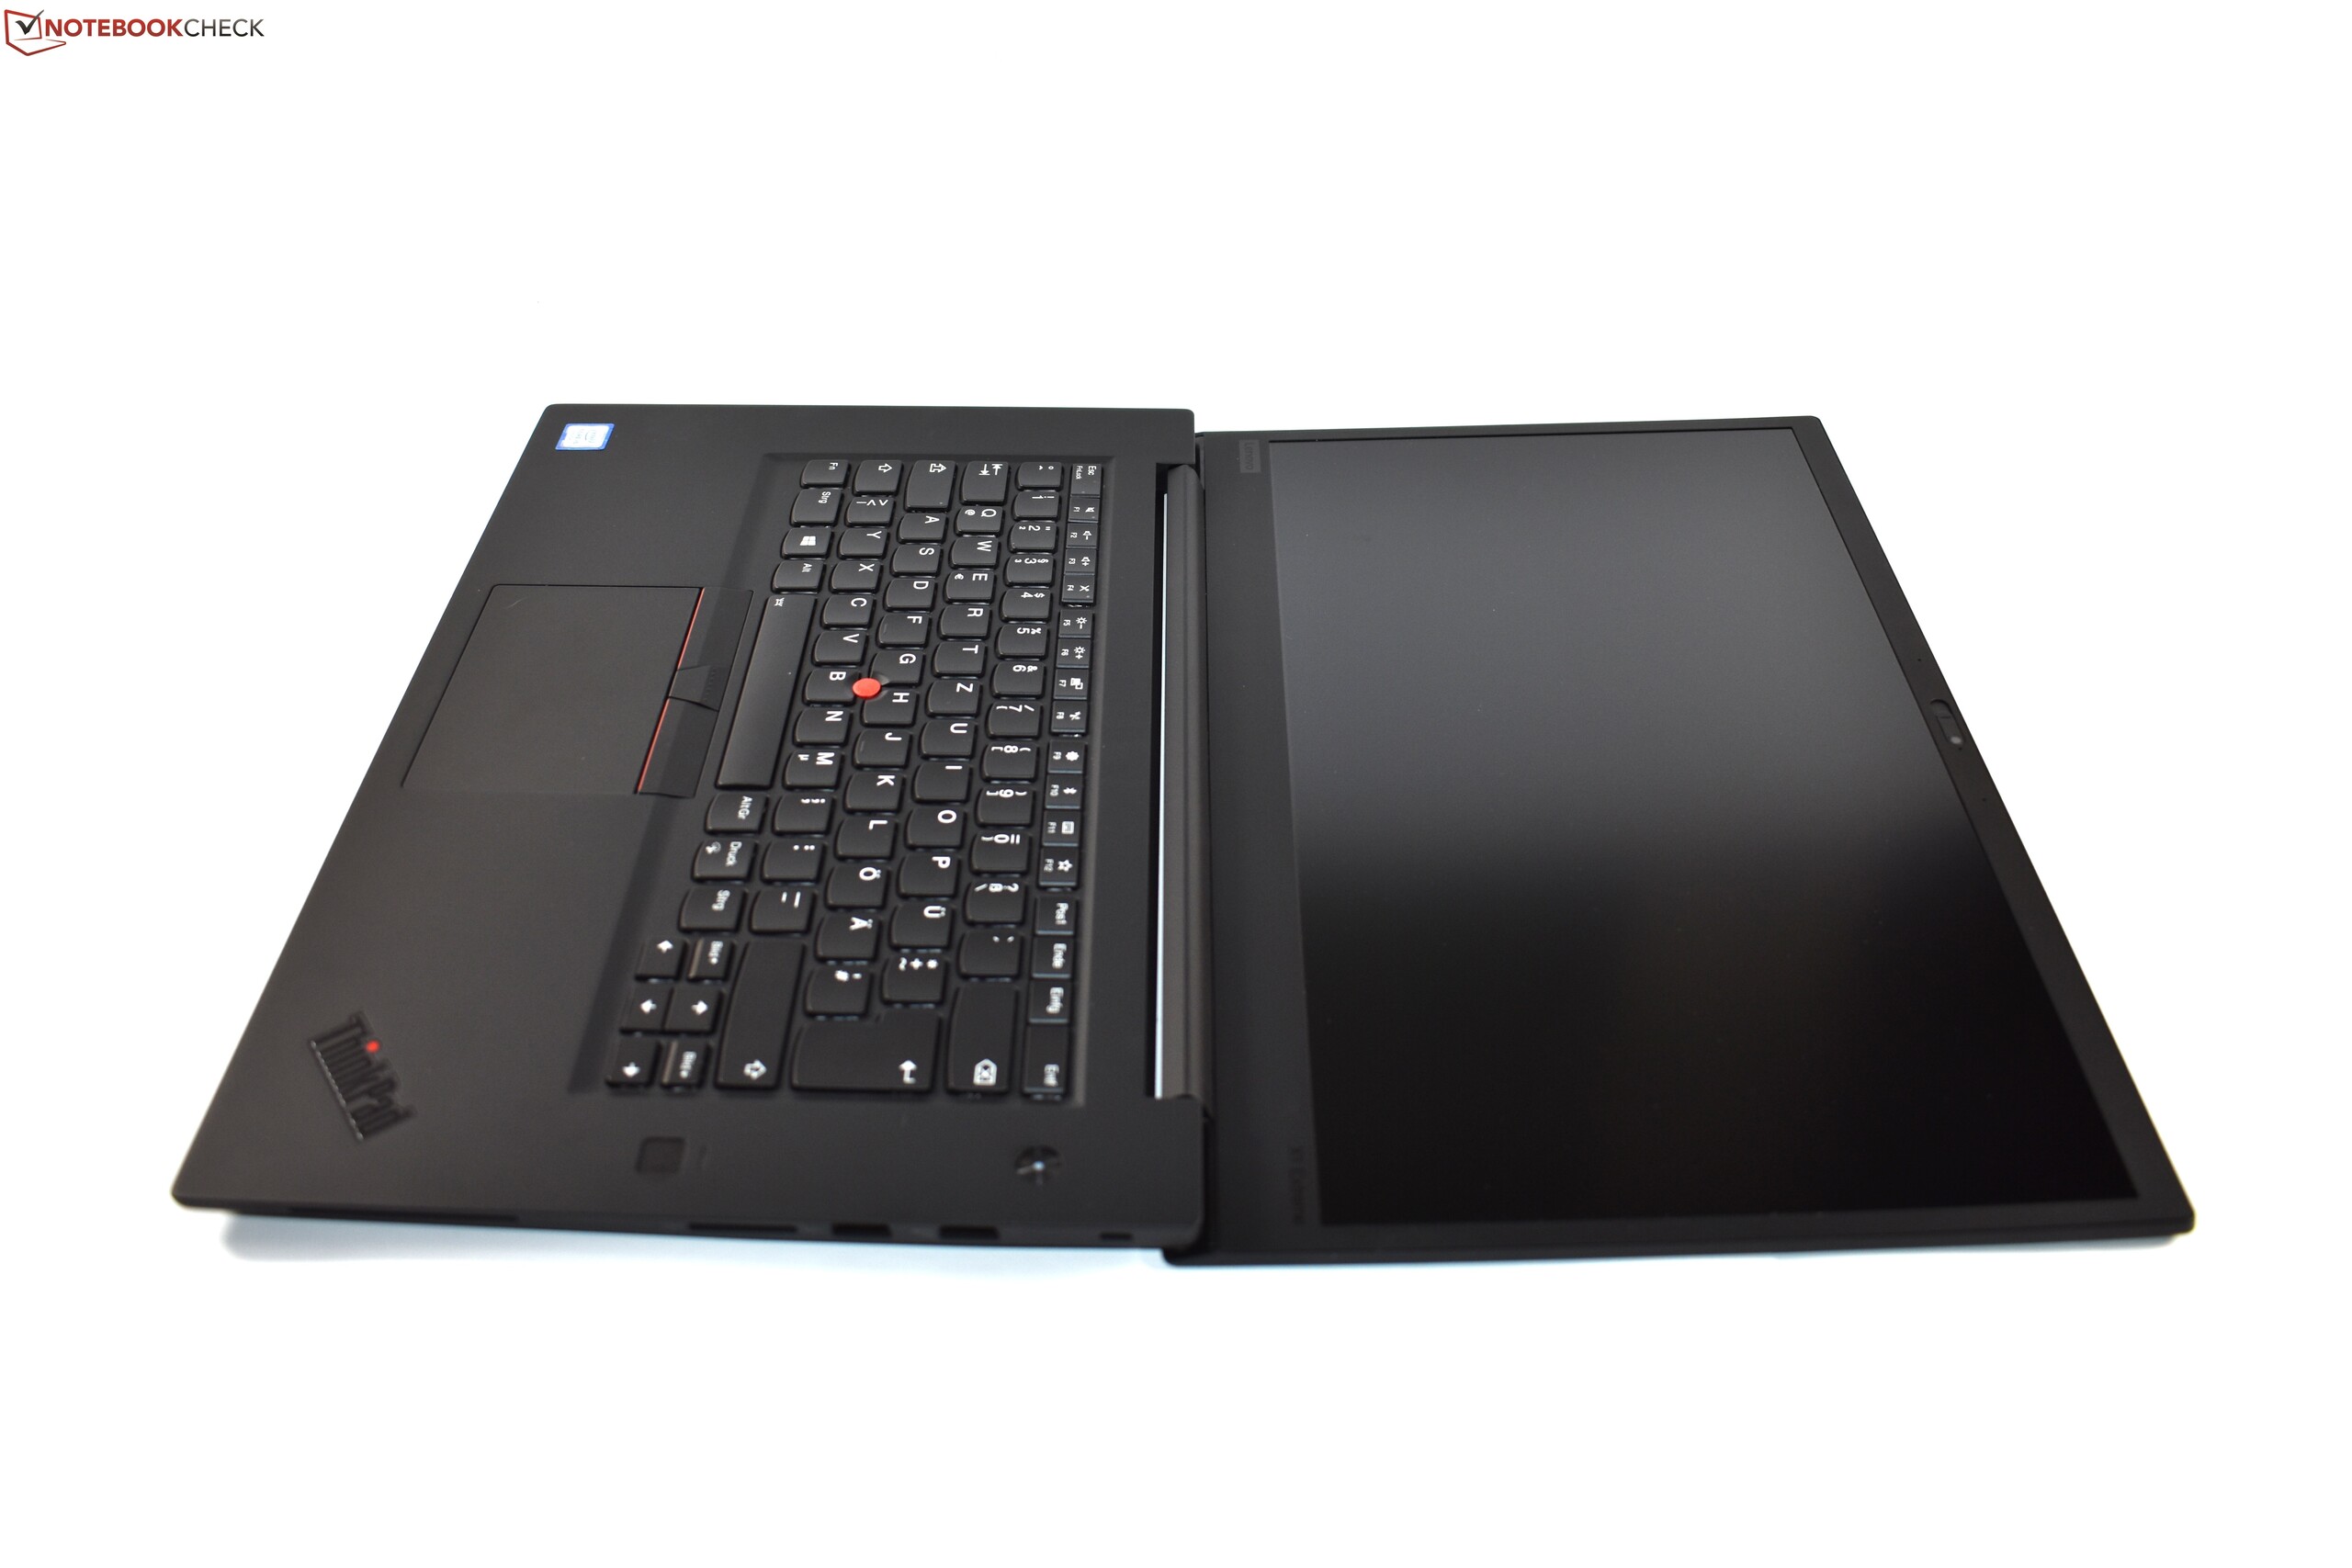
No que diz respeito à comparação direta com o Dell XPS 15: Dell certamente tem alguns argumentos fortes para o seu dispositivo, que tem a tela mais brilhante, a bateria maior, bem como o preço mais baixo. Também existem alguns argumentos para o ThinkPad X1 Extreme, como sua GPU mais potente no modelo básico, o segundo slot SSD, bem como o menor peso e alguns recursos extras de negócios para grandes corporações (cartão inteligente, mini-Ethernet). Também possui o teclado ThinkPad e o TrackPoint, embora as preferências a esse respeito sejam obviamente subjetivas. Qual modelo é o preferido é principalmente uma questão de gosto, dos recursos necessários e do orçamento. Em qualquer caso, o ThinkPad X1 Extreme é um adversário digno para o Dell XPS 15, embora seja caro.
Lenovo ThinkPad X1 Extreme-20MF000RGE
- 10/17/2018 v6 (old)
Benjamin Herzig
Price comparison
