Breve Análise do Workstation HP ZBook 15 G4 (Xeon, Quadro M2200, Full-HD)
| SD Card Reader | |
| average JPG Copy Test (av. of 3 runs) | |
| HP ZBook 15 G4-Y4E80AV (Toshiba Exceria Pro SDXC 64 GB UHS-II) | |
| Lenovo ThinkPad P51 20HH0016GE (Toshiba Exceria Pro SDXC 64 GB UHS-II) | |
| HP ZBook 15 G3 (Toshiba Exceria Pro SDXC 64 GB UHS-II) | |
| Lenovo ThinkPad P50 (Toshiba Exceria Pro SDXC 64 GB UHS-II) | |
| MSI WE72 7RJ (Toshiba Exceria Pro SDXC 64 GB UHS-II) | |
| maximum AS SSD Seq Read Test (1GB) | |
| Lenovo ThinkPad P51 20HH0016GE (Toshiba Exceria Pro SDXC 64 GB UHS-II) | |
| HP ZBook 15 G4-Y4E80AV (Toshiba Exceria Pro SDXC 64 GB UHS-II) | |
| HP ZBook 15 G3 (Toshiba Exceria Pro SDXC 64 GB UHS-II) | |
| Lenovo ThinkPad P50 (Toshiba Exceria Pro SDXC 64 GB UHS-II) | |
| MSI WE72 7RJ (Toshiba Exceria Pro SDXC 64 GB UHS-II) | |
| Networking | |
| iperf3 transmit AX12 | |
| Lenovo ThinkPad P51 20HH0016GE | |
| HP ZBook 15 G4-Y4E80AV | |
| MSI WE72 7RJ | |
| iperf3 receive AX12 | |
| Lenovo ThinkPad P51 20HH0016GE | |
| HP ZBook 15 G4-Y4E80AV | |
| MSI WE72 7RJ | |
| |||||||||||||||||||||||||
iluminação: 89 %
iluminação com acumulador: 319 cd/m²
Contraste: 1107:1 (Preto: 0.29 cd/m²)
ΔE ColorChecker Calman: 4.5 | ∀{0.5-29.43 Ø4.71}
ΔE Greyscale Calman: 2.9 | ∀{0.09-98 Ø4.96}
82.6% sRGB (Argyll 1.6.3 3D)
54.2% AdobeRGB 1998 (Argyll 1.6.3 3D)
60.4% AdobeRGB 1998 (Argyll 3D)
82.7% sRGB (Argyll 3D)
64% Display P3 (Argyll 3D)
Gamma: 2.27
CCT: 6519 K
| HP ZBook 15 G4-Y4E80AV LG Philips LGD057E, , 1920x1080, 15.6" | Lenovo ThinkPad P51 20HH0016GE LEN40BD, B156ZAN02.1, , 3840x2160, 15.6" | MSI WE72 7RJ LP173WF4-SPF1, , 1920x1080, 17.3" | HP ZBook 15 G3 Samsung SDC5344, , 1920x1080, 15.6" | |
|---|---|---|---|---|
| Display | 40% | 4% | 11% | |
| Display P3 Coverage (%) | 64 | 86.3 35% | 67.4 5% | 66.8 4% |
| sRGB Coverage (%) | 82.7 | 99.5 20% | 85.3 3% | 95.5 15% |
| AdobeRGB 1998 Coverage (%) | 60.4 | 99.3 64% | 62.4 3% | 69 14% |
| Response Times | -1% | -9% | -39% | |
| Response Time Grey 50% / Grey 80% * (ms) | 39.2 ? | 40.8 ? -4% | 45.2 ? -15% | 54 ? -38% |
| Response Time Black / White * (ms) | 25.6 ? | 25.2 ? 2% | 26.4 ? -3% | 35.6 ? -39% |
| PWM Frequency (Hz) | 20830 ? | 198 ? | ||
| Screen | 13% | -22% | -20% | |
| Brightness middle (cd/m²) | 321 | 317 -1% | 302 -6% | 306 -5% |
| Brightness (cd/m²) | 320 | 309 -3% | 306 -4% | 289 -10% |
| Brightness Distribution (%) | 89 | 89 0% | 93 4% | 85 -4% |
| Black Level * (cd/m²) | 0.29 | 0.36 -24% | 0.31 -7% | 0.34 -17% |
| Contrast (:1) | 1107 | 881 -20% | 974 -12% | 900 -19% |
| Colorchecker dE 2000 * | 4.5 | 2.7 40% | 6.2 -38% | 5.1 -13% |
| Colorchecker dE 2000 max. * | 9.5 | 4.1 57% | 10.6 -12% | 9.9 -4% |
| Greyscale dE 2000 * | 2.9 | 3 -3% | 7.3 -152% | 7.4 -155% |
| Gamma | 2.27 97% | 2.27 97% | 2.08 106% | 2.37 93% |
| CCT | 6519 100% | 6077 107% | 7020 93% | 7263 89% |
| Color Space (Percent of AdobeRGB 1998) (%) | 54.2 | 87.6 62% | 56 3% | 63 16% |
| Color Space (Percent of sRGB) (%) | 82.6 | 99.5 20% | 85.2 3% | 95 15% |
| Média Total (Programa/Configurações) | 17% /
16% | -9% /
-15% | -16% /
-16% |
* ... menor é melhor
Exibir tempos de resposta
| ↔ Tempo de resposta preto para branco | ||
|---|---|---|
| 25.6 ms ... ascensão ↗ e queda ↘ combinadas | ↗ 14.8 ms ascensão | 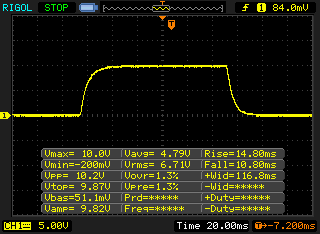 |
| ↘ 10.8 ms queda | ||
| A tela mostra taxas de resposta relativamente lentas em nossos testes e pode ser muito lenta para os jogadores. Em comparação, todos os dispositivos testados variam de 0.1 (mínimo) a 240 (máximo) ms. » 61 % de todos os dispositivos são melhores. Isso significa que o tempo de resposta medido é pior que a média de todos os dispositivos testados (19.8 ms). | ||
| ↔ Tempo de resposta 50% cinza a 80% cinza | ||
| 39.2 ms ... ascensão ↗ e queda ↘ combinadas | ↗ 20.4 ms ascensão | 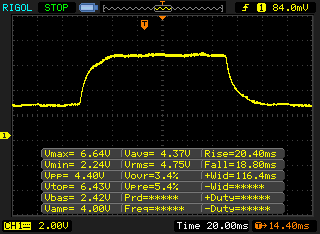 |
| ↘ 18.8 ms queda | ||
| A tela mostra taxas de resposta lentas em nossos testes e será insatisfatória para os jogadores. Em comparação, todos os dispositivos testados variam de 0.165 (mínimo) a 636 (máximo) ms. » 60 % de todos os dispositivos são melhores. Isso significa que o tempo de resposta medido é pior que a média de todos os dispositivos testados (31 ms). | ||
Cintilação da tela / PWM (modulação por largura de pulso)
| Tela tremeluzindo/PWM detectado | 20830 Hz | ≤ 80 % configuração de brilho | 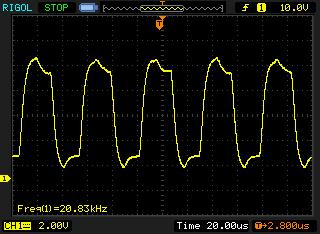 |
A luz de fundo da tela pisca em 20830 Hz (pior caso, por exemplo, utilizando PWM) Cintilação detectada em uma configuração de brilho de 80 % e abaixo. Não deve haver cintilação ou PWM acima desta configuração de brilho. A frequência de 20830 Hz é bastante alta, então a maioria dos usuários sensíveis ao PWM não deve notar nenhuma oscilação. [pwm_comparison] Em comparação: 52 % de todos os dispositivos testados não usam PWM para escurecer a tela. Se PWM foi detectado, uma média de 7754 (mínimo: 5 - máximo: 343500) Hz foi medida. | |||
| Cinebench R15 | |
| CPU Single 64Bit | |
| HP ZBook 15 G4-Y4E80AV | |
| Lenovo ThinkPad P51 20HH0016GE | |
| Fujitsu Celsius H970 | |
| MSI WE72 7RJ | |
| HP ZBook 15 G3 | |
| Lenovo ThinkPad P50 | |
| Lenovo ThinkPad P50 20ENV509PB | |
| CPU Multi 64Bit | |
| HP ZBook 15 G4-Y4E80AV | |
| Lenovo ThinkPad P51 20HH0016GE | |
| Lenovo ThinkPad P50 20ENV509PB | |
| MSI WE72 7RJ | |
| HP ZBook 15 G3 | |
| Lenovo ThinkPad P50 | |
| Fujitsu Celsius H970 | |
| PCMark 8 | |
| Home Score Accelerated v2 | |
| HP ZBook 15 G4-Y4E80AV | |
| MSI WE72 7RJ | |
| Lenovo ThinkPad P50 | |
| HP ZBook 15 G3 | |
| Lenovo ThinkPad P51 20HH0016GE | |
| Work Score Accelerated v2 | |
| HP ZBook 15 G4-Y4E80AV | |
| HP ZBook 15 G3 | |
| MSI WE72 7RJ | |
| Lenovo ThinkPad P50 | |
| Lenovo ThinkPad P51 20HH0016GE | |
| PCMark 10 | |
| Score | |
| HP ZBook 15 G4-Y4E80AV | |
| Essentials | |
| HP ZBook 15 G4-Y4E80AV | |
| Productivity | |
| HP ZBook 15 G4-Y4E80AV | |
| Digital Content Creation | |
| HP ZBook 15 G4-Y4E80AV | |
| PCMark 8 Home Score Accelerated v2 | 4375 pontos | |
| PCMark 8 Creative Score Accelerated v2 | 5663 pontos | |
| PCMark 8 Work Score Accelerated v2 | 5423 pontos | |
| PCMark 10 Score | 4834 pontos | |
Ajuda | ||
| HP ZBook 15 G4-Y4E80AV Samsung SSD SM961 1TB M.2 MZVKW1T0HMLH | Lenovo ThinkPad P51 20HH0016GE Samsung PM961 NVMe MZVLW512HMJP | HP ZBook 15 G3 Samsung SM951 MZVPV512HDGL m.2 PCI-e | MSI WE72 7RJ Samsung SM961 MZVPW256 m.2 PCI-e | Lenovo ThinkPad P50 Samsung SM951 MZVPV256HDGL m.2 PCI-e | |
|---|---|---|---|---|---|
| CrystalDiskMark 3.0 | 13% | 19% | -6% | 30% | |
| Read Seq (MB/s) | 2166 | 1705 -21% | 1502 -31% | 1492 -31% | 1771 -18% |
| Write Seq (MB/s) | 1682 | 1541 -8% | 1538 -9% | 1512 -10% | 1304 -22% |
| Read 512 (MB/s) | 411.6 | 1038 152% | 1164 183% | 312.6 -24% | 1364 231% |
| Write 512 (MB/s) | 1175 | 1157 -2% | 1432 22% | 1483 26% | 1291 10% |
| Read 4k (MB/s) | 57.5 | 61.3 7% | 59.1 3% | 59.9 4% | 60.2 5% |
| Write 4k (MB/s) | 187.6 | 176 -6% | 207.3 11% | 184.2 -2% | 256.7 37% |
| Read 4k QD32 (MB/s) | 733 | 664 -9% | 798 9% | 681 -7% | 953 30% |
| Write 4k QD32 (MB/s) | 619 | 560 -10% | 393.8 -36% | 590 -5% | 389.6 -37% |

| SPECviewperf 11 | |
| 1920x1080 Siemens NX | |
| HP ZBook 15 G4-Y4E80AV | |
| MSI WE72 7RJ | |
| HP ZBook 15 G3 | |
| Saelic Veni G422 G7TPK4 | |
| 1920x1080 Tcvis | |
| HP ZBook 15 G4-Y4E80AV | |
| MSI WE72 7RJ | |
| HP ZBook 15 G3 | |
| Saelic Veni G422 G7TPK4 | |
| 1920x1080 SolidWorks | |
| HP ZBook 15 G4-Y4E80AV | |
| HP ZBook 15 G3 | |
| MSI WE72 7RJ | |
| Saelic Veni G422 G7TPK4 | |
| 1920x1080 Pro/ENGINEER | |
| HP ZBook 15 G4-Y4E80AV | |
| HP ZBook 15 G3 | |
| MSI WE72 7RJ | |
| Saelic Veni G422 G7TPK4 | |
| 1920x1080 Maya | |
| HP ZBook 15 G3 | |
| HP ZBook 15 G4-Y4E80AV | |
| MSI WE72 7RJ | |
| Saelic Veni G422 G7TPK4 | |
| 1920x1080 Lightwave | |
| HP ZBook 15 G4-Y4E80AV | |
| HP ZBook 15 G3 | |
| MSI WE72 7RJ | |
| Saelic Veni G422 G7TPK4 | |
| 1920x1080 Ensight | |
| HP ZBook 15 G4-Y4E80AV | |
| MSI WE72 7RJ | |
| Saelic Veni G422 G7TPK4 | |
| HP ZBook 15 G3 | |
| 1920x1080 Catia | |
| HP ZBook 15 G3 | |
| HP ZBook 15 G4-Y4E80AV | |
| MSI WE72 7RJ | |
| Saelic Veni G422 G7TPK4 | |
| SPECviewperf 12 | |
| 1900x1060 Solidworks (sw-03) | |
| HP ZBook 15 G4-Y4E80AV | |
| MSI WE72 7RJ | |
| HP ZBook 15 G3 | |
| 1900x1060 Siemens NX (snx-02) | |
| HP ZBook 15 G4-Y4E80AV | |
| MSI WE72 7RJ | |
| HP ZBook 15 G3 | |
| 1900x1060 Showcase (showcase-01) | |
| MSI WE72 7RJ | |
| HP ZBook 15 G4-Y4E80AV | |
| HP ZBook 15 G3 | |
| 1900x1060 Medical (medical-01) | |
| HP ZBook 15 G4-Y4E80AV | |
| MSI WE72 7RJ | |
| HP ZBook 15 G3 | |
| 1900x1060 Maya (maya-04) | |
| HP ZBook 15 G4-Y4E80AV | |
| MSI WE72 7RJ | |
| HP ZBook 15 G3 | |
| 1900x1060 Energy (energy-01) | |
| HP ZBook 15 G4-Y4E80AV | |
| MSI WE72 7RJ | |
| HP ZBook 15 G3 | |
| 1900x1060 Creo (creo-01) | |
| HP ZBook 15 G4-Y4E80AV | |
| MSI WE72 7RJ | |
| HP ZBook 15 G3 | |
| 1900x1060 Catia (catia-04) | |
| MSI WE72 7RJ | |
| HP ZBook 15 G4-Y4E80AV | |
| HP ZBook 15 G3 | |
| SiSoft Sandra 2016 | |
| GP Financial Analysis (FP High/Double Precision) | |
| Lenovo ThinkPad P51 20HH0016GE | |
| HP ZBook 15 G4-Y4E80AV | |
| HP ZBook 15 G3 | |
| Lenovo ThinkPad P50 | |
| GP Cryptography (Higher Security AES256+SHA2-512) | |
| HP ZBook 15 G4-Y4E80AV | |
| Lenovo ThinkPad P51 20HH0016GE | |
| HP ZBook 15 G3 | |
| Lenovo ThinkPad P50 | |
| Image Processing | |
| Lenovo ThinkPad P51 20HH0016GE | |
| HP ZBook 15 G4-Y4E80AV | |
| HP ZBook 15 G3 | |
| Lenovo ThinkPad P50 | |
| 3DMark | |
| 1280x720 Cloud Gate Standard Graphics | |
| Saelic Veni G422 G7TPK4 | |
| MSI WE72 7RJ | |
| HP ZBook 15 G4-Y4E80AV | |
| Lenovo ThinkPad P51 20HH0016GE | |
| HP ZBook 15 G3 | |
| Asus G752VL-T7023T | |
| 1920x1080 Fire Strike Graphics | |
| Saelic Veni G422 G7TPK4 | |
| MSI WE72 7RJ | |
| Lenovo ThinkPad P51 20HH0016GE | |
| HP ZBook 15 G4-Y4E80AV | |
| Asus G752VL-T7023T | |
| HP ZBook 15 G3 | |
| Unigine Valley 1.0 | |
| 1920x1080 Extreme HD Preset OpenGL AA:x8 | |
| Lenovo ThinkPad P51 20HH0016GE | |
| HP ZBook 15 G4-Y4E80AV | |
| MSI WE72 7RJ | |
| HP ZBook 15 G3 | |
| 1920x1080 Extreme HD DirectX AA:x8 | |
| MSI WE72 7RJ | |
| HP ZBook 15 G4-Y4E80AV | |
| Lenovo ThinkPad P51 20HH0016GE | |
| HP ZBook 15 G3 | |
| Unigine Heaven 4.0 | |
| Extreme Preset DX11 | |
| MSI WE72 7RJ | |
| Lenovo ThinkPad P51 20HH0016GE | |
| HP ZBook 15 G4-Y4E80AV | |
| Extreme Preset OpenGL | |
| Lenovo ThinkPad P51 20HH0016GE | |
| HP ZBook 15 G4-Y4E80AV | |
| MSI WE72 7RJ | |
| 3DMark Ice Storm Standard Score | 144957 pontos | |
| 3DMark Cloud Gate Standard Score | 22003 pontos | |
| 3DMark Fire Strike Score | 5232 pontos | |
| 3DMark Time Spy Score | 1903 pontos | |
Ajuda | ||
| The Witcher 3 | |
| 1366x768 Medium Graphics & Postprocessing | |
| Lenovo ThinkPad P51 20HH0016GE | |
| MSI GE72 965M Ti | |
| HP ZBook 15 G4-Y4E80AV | |
| Lenovo ThinkPad P50 | |
| HP ZBook 15 G3 | |
| 1920x1080 High Graphics & Postprocessing (Nvidia HairWorks Off) | |
| Gigabyte Sabre 15G | |
| Lenovo ThinkPad P51 20HH0016GE | |
| MSI GE72 965M Ti | |
| HP ZBook 15 G4-Y4E80AV | |
| Lenovo ThinkPad P50 | |
| HP ZBook 15 G3 | |
| baixo | média | alto | ultra | |
|---|---|---|---|---|
| BioShock Infinite (2013) | 270.9 | 174.1 | 149.1 | 56.8 |
| The Witcher 3 (2015) | 104.6 | 63.4 | 30.3 | 18 |
| Rise of the Tomb Raider (2016) | 123 | 68.5 | 37.4 | 33 |
Barulho
| Ocioso |
| 29.5 / 29.5 / 30 dB |
| Carga |
| 39.5 / 36 dB |
 | ||
30 dB silencioso 40 dB(A) audível 50 dB(A) ruidosamente alto |
||
min: | ||
(-) A temperatura máxima no lado superior é 50.8 °C / 123 F, em comparação com a média de 38.2 °C / 101 F , variando de 22.2 a 69.8 °C para a classe Workstation.
(-) A parte inferior aquece até um máximo de 57.4 °C / 135 F, em comparação com a média de 41.1 °C / 106 F
(+) Em uso inativo, a temperatura média para o lado superior é 25.5 °C / 78 F, em comparação com a média do dispositivo de 32 °C / ### class_avg_f### F.
(±) Jogando The Witcher 3, a temperatura média para o lado superior é 33.5 °C / 92 F, em comparação com a média do dispositivo de 32 °C / ## #class_avg_f### F.
(+) Os apoios para as mãos e o touchpad são mais frios que a temperatura da pele, com um máximo de 29 °C / 84.2 F e, portanto, são frios ao toque.
(±) A temperatura média da área do apoio para as mãos de dispositivos semelhantes foi 27.8 °C / 82 F (-1.2 °C / -2.2 F).
HP ZBook 15 G4-Y4E80AV análise de áudio
(±) | o volume do alto-falante é médio, mas bom (###valor### dB)
Graves 100 - 315Hz
(±) | graves reduzidos - em média 13.6% menor que a mediana
(±) | a linearidade dos graves é média (9.7% delta para a frequência anterior)
Médios 400 - 2.000 Hz
(+) | médios equilibrados - apenas 3.8% longe da mediana
(+) | médios são lineares (5.8% delta para frequência anterior)
Altos 2 - 16 kHz
(±) | máximos mais altos - em média 7% maior que a mediana
(+) | os máximos são lineares (5.8% delta da frequência anterior)
Geral 100 - 16.000 Hz
(±) | a linearidade do som geral é média (19.2% diferença em relação à mediana)
Comparado com a mesma classe
» 67% de todos os dispositivos testados nesta classe foram melhores, 5% semelhantes, 28% piores
» O melhor teve um delta de 7%, a média foi 17%, o pior foi 35%
Comparado com todos os dispositivos testados
» 46% de todos os dispositivos testados foram melhores, 7% semelhantes, 46% piores
» O melhor teve um delta de 4%, a média foi 23%, o pior foi 134%
Lenovo ThinkPad P51 20HH0016GE análise de áudio
(-) | alto-falantes não muito altos (###valor### dB)
Graves 100 - 315Hz
(±) | graves reduzidos - em média 12.3% menor que a mediana
(±) | a linearidade dos graves é média (10.4% delta para a frequência anterior)
Médios 400 - 2.000 Hz
(+) | médios equilibrados - apenas 3.9% longe da mediana
(+) | médios são lineares (6.4% delta para frequência anterior)
Altos 2 - 16 kHz
(+) | agudos equilibrados - apenas 2.7% longe da mediana
(±) | a linearidade dos máximos é média (13.3% delta para frequência anterior)
Geral 100 - 16.000 Hz
(±) | a linearidade do som geral é média (24.7% diferença em relação à mediana)
Comparado com a mesma classe
» 86% de todos os dispositivos testados nesta classe foram melhores, 2% semelhantes, 12% piores
» O melhor teve um delta de 7%, a média foi 17%, o pior foi 35%
Comparado com todos os dispositivos testados
» 75% de todos os dispositivos testados foram melhores, 5% semelhantes, 19% piores
» O melhor teve um delta de 4%, a média foi 23%, o pior foi 134%
| desligado | |
| Ocioso | |
| Carga |
|
Key:
min: | |
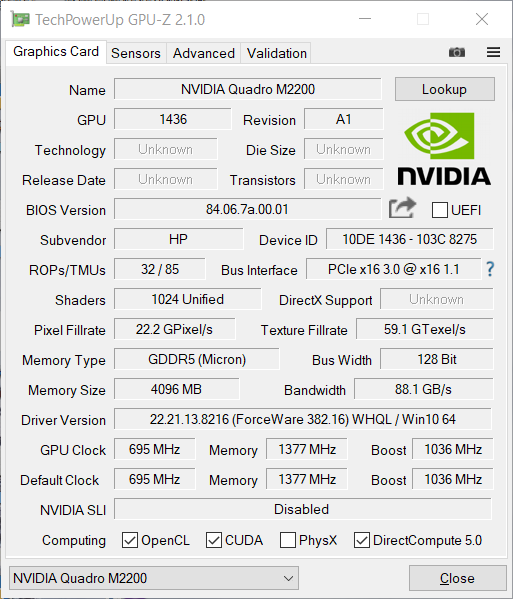
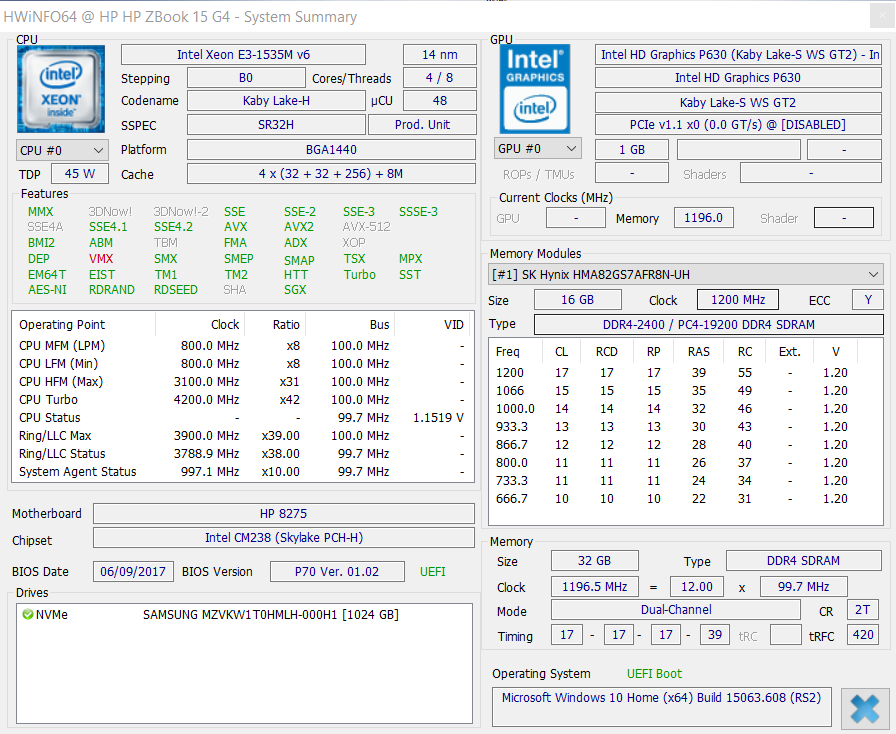
| HP ZBook 15 G4-Y4E80AV E3-1535M v6, Quadro M2200, Samsung SSD SM961 1TB M.2 MZVKW1T0HMLH, IPS, 1920x1080, 15.6" | Lenovo ThinkPad P51 20HH0016GE E3-1505M v6, Quadro M2200, Samsung PM961 NVMe MZVLW512HMJP, IPS, 3840x2160, 15.6" | MSI WE72 7RJ i7-7700HQ, Quadro M2200, Samsung SM961 MZVPW256 m.2 PCI-e, IPS, 1920x1080, 17.3" | HP ZBook 15 G3 E3-1505M v5, Quadro M2000M, Samsung SM951 MZVPV512HDGL m.2 PCI-e, UWVA-IPS, 1920x1080, 15.6" | |
|---|---|---|---|---|
| Power Consumption | -35% | -68% | -2% | |
| Idle Minimum * (Watt) | 5.9 | 8.6 -46% | 15 -154% | 5.7 3% |
| Idle Average * (Watt) | 8.9 | 15.9 -79% | 20.1 -126% | 12.2 -37% |
| Idle Maximum * (Watt) | 12.7 | 22.1 -74% | 23.8 -87% | 12.6 1% |
| Load Average * (Watt) | 95.2 | 84.4 11% | 85.6 10% | 83.1 13% |
| Witcher 3 ultra * (Watt) | 87.7 | |||
| Load Maximum * (Watt) | 154 | 130.6 15% | 128 17% | 138.2 10% |
* ... menor é melhor
| HP ZBook 15 G4-Y4E80AV E3-1535M v6, Quadro M2200, 90 Wh | Lenovo ThinkPad P51 20HH0016GE E3-1505M v6, Quadro M2200, 90 Wh | MSI WE72 7RJ i7-7700HQ, Quadro M2200, 51 Wh | HP ZBook 15 G3 E3-1505M v5, Quadro M2000M, 90 Wh | Lenovo ThinkPad P50 E3-1505M v5, Quadro M2000M, 90 Wh | |
|---|---|---|---|---|---|
| Duração da bateria | -20% | -69% | -22% | -41% | |
| Reader / Idle (h) | 18.3 | 16.4 -10% | 4.5 -75% | 13.7 -25% | 9 -51% |
| H.264 (h) | 10.5 | 7.6 -28% | 3 -71% | 7.5 -29% | 5.5 -48% |
| WiFi v1.3 (h) | 9.1 | 6.9 -24% | 3 -67% | 6.4 -30% | 4.8 -47% |
| Load (h) | 1.9 | 1.6 -16% | 0.7 -63% | 1.8 -5% | 1.6 -16% |
Pro
Contra
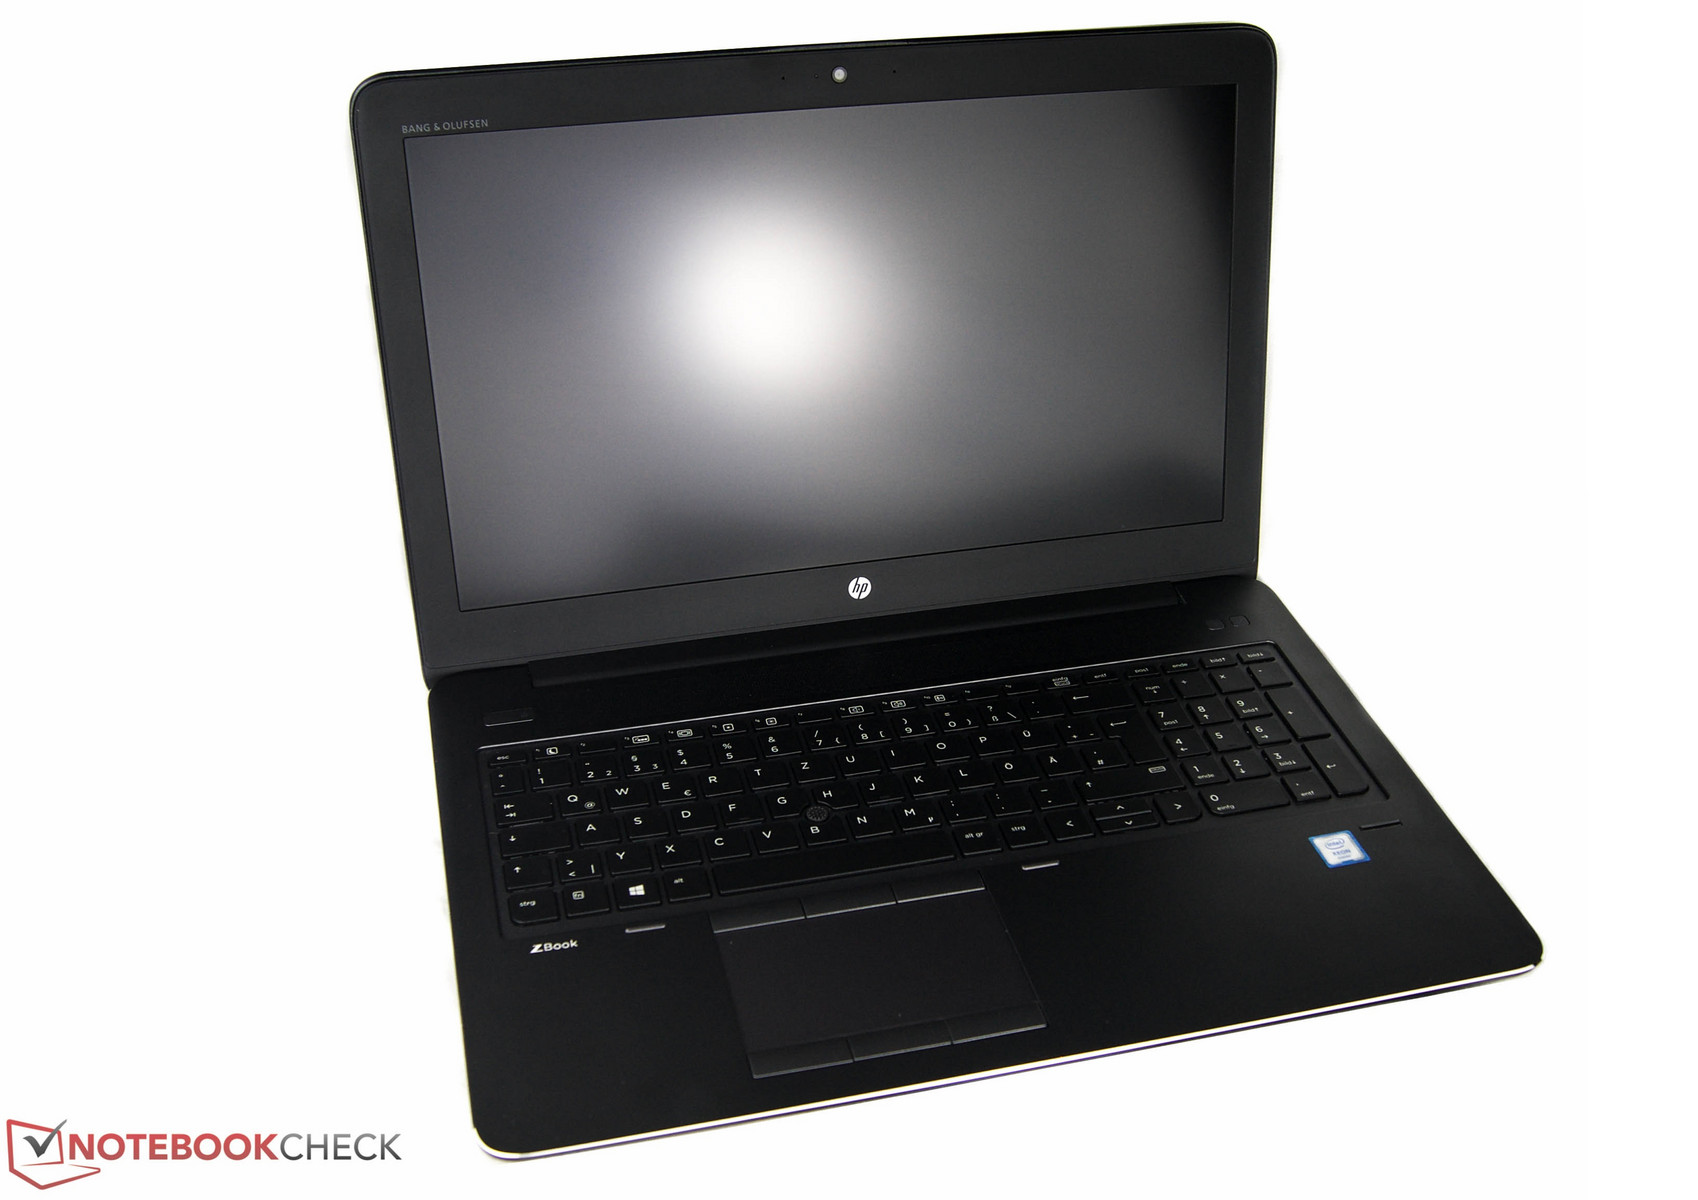
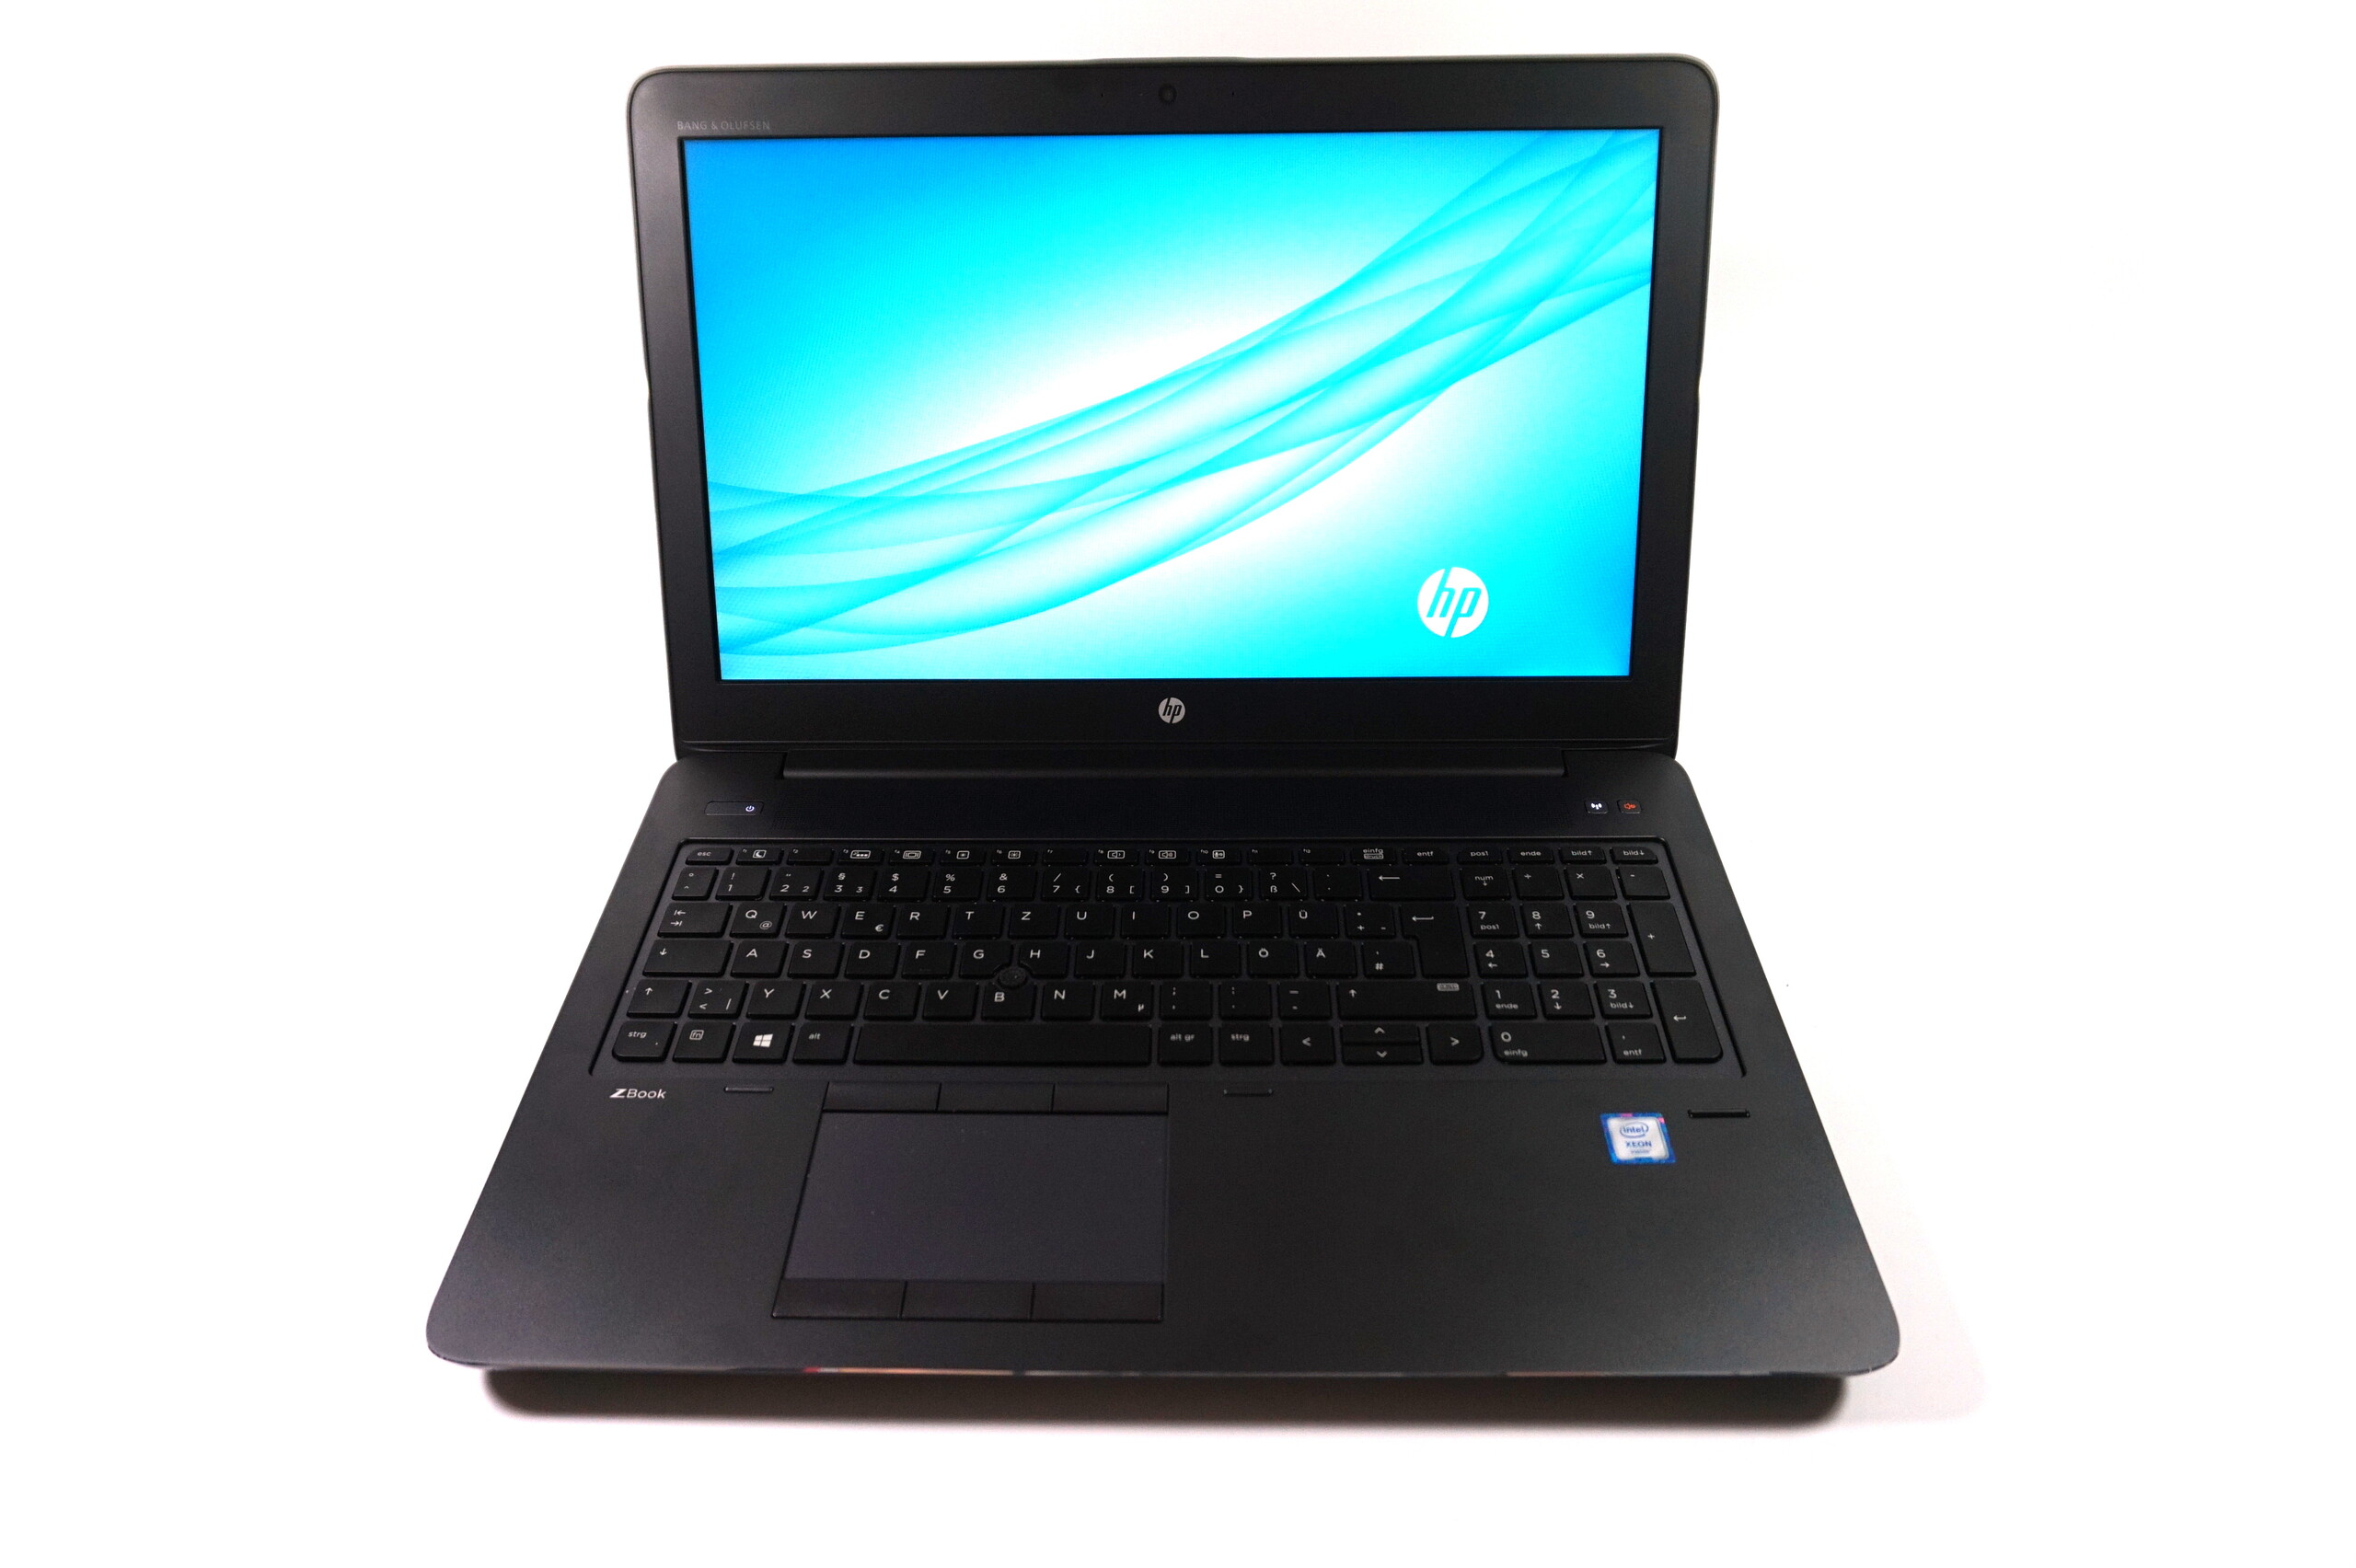
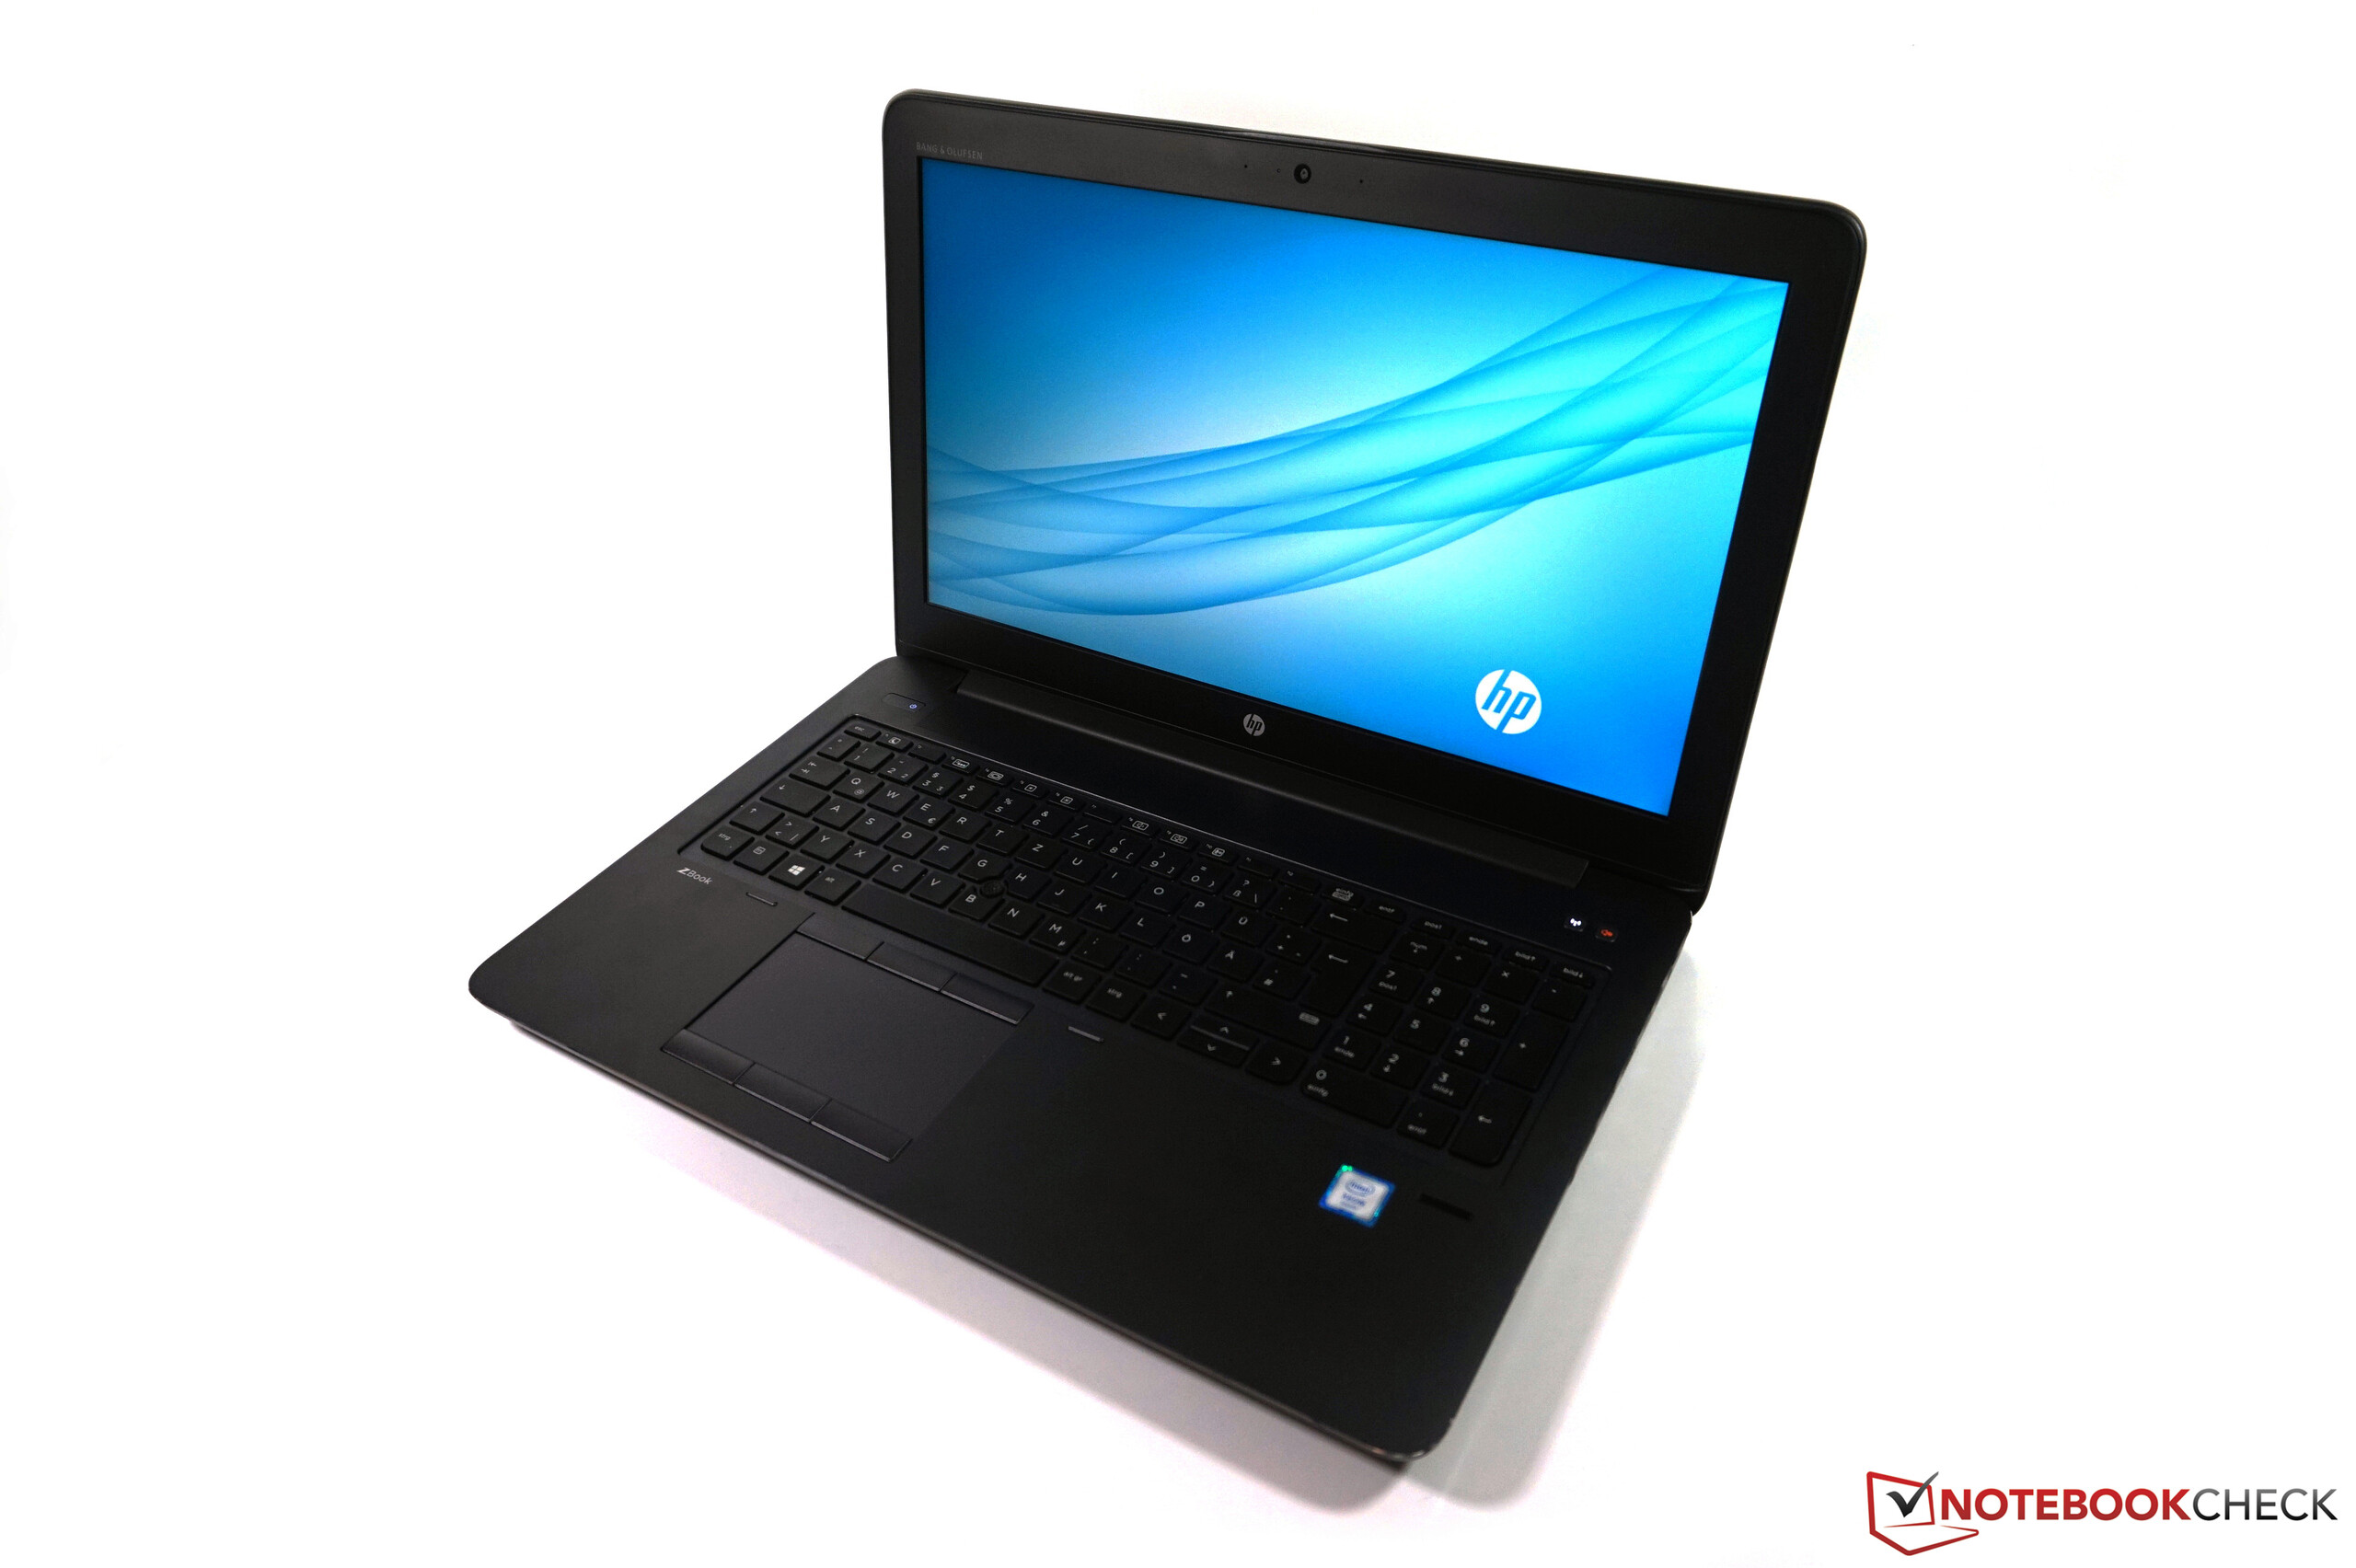
O ZBook entra na próxima rodada com um aumento persuasivo no poder de desempenho. Em nossa análise da última geração, tudo o que tivemos foram palavras de louvor pelo design e estabilidade da carcaça. Nós também ficamos impressionados com a escolha abrangente de portas e boa capacidade atualização. O atual ZBook G4 está mais uma vez disponível em várias configurações diferentes. Tivemos o prazer de testar o modelo top. Somente no campo da tela, vimos muito espaço para melhorias. Ficamos particularmente decepcionados com o fato de que a cobertura do espaço de cores da tela seja menor que a geração anterior. Mas em todos os outros aspectos, o G4 é melhor do que o seu antecessor, especialmente devido ao grande poder que está dormente dentro. O potente processador Xeon e a atualização da GPU, em conjunto, produzem um aumento acentuado no desempenho gráfico e de. Apesar deste aumento no desempenho, as temperaturas do portátil permanecem um pouco mais frias, e seu gerenciamento de energia é melhor equilibrado. Mas como se isso não bastasse: A duração da bateria é agora forte o suficiente para um dia de trabalho um tanto prolongado. Infelizmente, a imagem geral é um pouco manchada pelos alto-falantes fracos. Esperamos ver melhorias nas próximas gerações.
Em suma, o mais novo ZBook da HP prova mais uma vez que é um workstation móvel muito bom.
O ZBook está disponível na Alemanha a partir de 2200 Euros (~$2600, versão americana disponível por $1929). Nosso dispositivo de teste custa altos 4650 Euros (~$5500, versão similar disponível nos EUA por $3630). No entanto, uma configuração com um processador ligeiramente mais fraco e mais barato pode ser mais sensata. Antes de tomar uma decisão, certamente pode valer a pena dar uma olhada na concorrência - como o Lenovo ThinkPad P51.
HP ZBook 15 G4-Y4E80AV
- 09/27/2017 v6 (old)
Nino Ricchizzi