Notebookcheck Logo

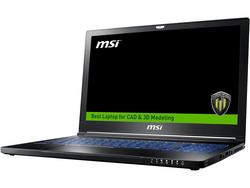
Breve Análise do Portátil MSI WS63VR (i7-7700HQ, 4K, Quadro P4000 Max-Q)

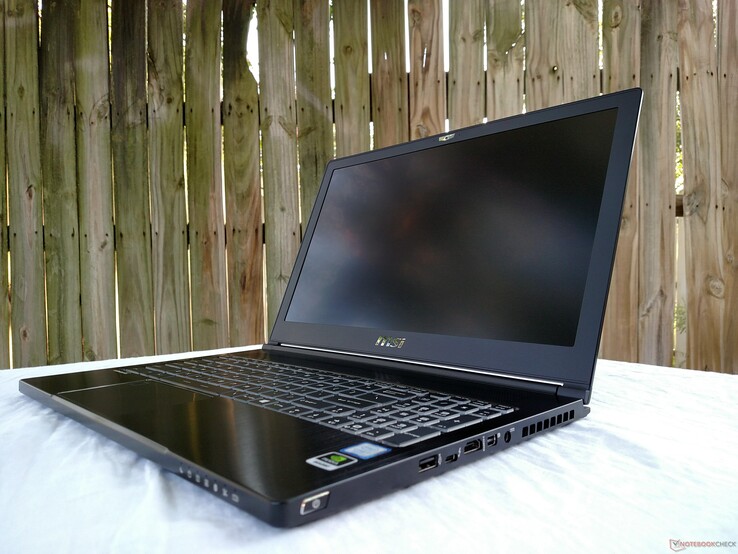
Max-Q vai ao trabalho. O WS63VR 7RL atualizado da MSI traz o novo design Max-Q da Nvidia para a linha Quadro gigante da GPU. Quão bem a filosofia Max-Q beneficia uma poderosa placa gráfica de nível profissional, especialmente no que diz respeito ao gerenciamento de calor e energia?
MSI WS63VR 7RL-023US
Processador
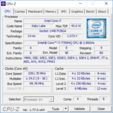
Intel Core i7-7700HQ 4 x 2.8 - 3.8 GHz, Kaby Lake
Placa gráfica
NVIDIA Quadro P4000 Max-Q - 8 GB VRAM, Análises do: 1114 MHz, Memoría: 1502 MHz, Nvidia ODE R384 U3 (385.41), Nvidia Optimus
Memória
32 GB 
, Dual-channel, DDR4-2400 / PC4-19200
Pantalha
15.60 polegadas 16:9, 3840 x 2160 pixel 282 PPI, No, SAMSUNG LƒFL156FL02-101 , IPS, Brilhante: não
placa mãe
Intel HM175 (Skylake PCH-H)
Disco rígido
Toshiba NVMe THNSN5512GPU7, 512 GB 
, 512 GB PCIe NVMe SSD + 2 TB 5400 RPM HDD (Seagate ST2000LM015-2E8174), 475 GB livre
Placa de Som
Realtek ALC899 @ Intel Skylake PCH-H - High Definition Audio Controller
Conexões
1 USB 2.0, 3 USB 3.0, 1 USB 3.1 Gen2, 1 Thunderbolt, 1 HDMI, 2 DisplayPort, 1 Kensington Lock, Conexões Audio: HiFi Audio out + Microphone in, Card Reader: 4-in-1 SD / SDHC / SDXC Card Reader, 1 Leitor de Impressões Digitais, Brightness Sensor
Funcionamento em rede
Qualcomm Atheros AR8171/8175 PCI-E Gigabit Ethernet (10/100/1000MBit/s), Intel Dual Band Wireless-AC 8265 (a/b/g/n = Wi-Fi 4/ac = Wi-Fi 5/)
Tamanho
altura x largura x profundidade (em mm): 18 x 380 x 249
Bateria
48 Wh Lítio-Ion
Sistema Operativo
Microsoft Windows 10 Pro 64 Bit
Camera
Webcam: HD
Características adicionais
Alto falantes: 2 x 2 Watt, Teclado: Steelseries-branded chiclet, Iluminação do Teclado: sim, 36 Meses Garantia
peso
1.92 kg, Suprimento de energia: 585 g
Preço
3400 USD
Note: The manufacturer may use components from different suppliers including display panels, drives or memory sticks with similar specifications.


Networking
iperf3 transmit AX12
MSI GS63VR 7RF-228US
Killer Wireless-n/a/ac 1535 Wireless Network Adapter
594 MBit/s +26%
MSI WS63 7RF-290US
Intel Dual Band Wireless-AC 8265
531 MBit/s +13%
Lenovo ThinkPad P51s 20HB000SGE
Intel Dual Band Wireless-AC 8265
508 MBit/s +8%
Lenovo ThinkPad P51 20HH0016GE
Intel Dual Band Wireless-AC 8265
508 MBit/s +8%
Dell Precision 5520 UHD
Intel Dual Band Wireless-AC 8265
506 (622min) MBit/s +7%
HP ZBook 15 G4-Y4E80AV
Intel Dual Band Wireless-AC 8265
475 MBit/s +1%
MSI WS63VR 7RL-023US
Intel Dual Band Wireless-AC 8265
472 MBit/s
iperf3 receive AX12
Lenovo ThinkPad P51s 20HB000SGE
Intel Dual Band Wireless-AC 8265
672 MBit/s +3%
MSI GS63VR 7RF-228US
Killer Wireless-n/a/ac 1535 Wireless Network Adapter
662 MBit/s +1%
MSI WS63VR 7RL-023US
Intel Dual Band Wireless-AC 8265
655 MBit/s
Lenovo ThinkPad P51 20HH0016GE
Intel Dual Band Wireless-AC 8265
643 MBit/s -2%
MSI WS63 7RF-290US
Intel Dual Band Wireless-AC 8265
638 MBit/s -3%
Dell Precision 5520 UHD
Intel Dual Band Wireless-AC 8265
622 MBit/s -5%
HP ZBook 15 G4-Y4E80AV
Intel Dual Band Wireless-AC 8265
559 MBit/s -15%
250
cd/m²
249.2
cd/m²
247.5
cd/m²
256.5
cd/m²
259.4
cd/m²
248.7
cd/m²
243.6
cd/m²
251.9
cd/m²
220.6
cd/m²
Distribuição do brilho
SAMSUNG LƒFL156FL02-101 tested with X-Rite i1Pro 2
Máximo: 259.4 cd/m² (Nits) Médio: 247.5 cd/m² Minimum: 14.45 cd/m²
iluminação: 85 %
iluminação com acumulador: 259.4 cd/m²
Contraste: 603:1 (Preto: 0.43 cd/m²)
ΔE Color 5.5 | 0.5-29.43 Ø5
ΔE Greyscale 3.6 | 0.57-98 Ø5.3
71% sRGB (Argyll 1.6.3 3D)
45% AdobeRGB 1998 (Argyll 1.6.3 3D)
49% AdobeRGB 1998 (Argyll 2.2.0 3D)
71.4% sRGB (Argyll 2.2.0 3D)
47.43% Display P3 (Argyll 2.2.0 3D)
Gamma: 2.24
MSI WS63VR 7RL-023US
SAMSUNG LƒFL156FL02-101 , IPS, 15.60, 3840x2160
HP ZBook 15 G4-Y4E80AV
LG Philips LGD057E, IPS, 15.60, 1920x1080
MSI WS63 7RF-290US
ID: LGD046F, Name: LG Philips LP156W6, Dell P/N: 3874Y, IPS, 15.60, 1920x1080
Lenovo ThinkPad P51 20HH0016GE
LEN40BD, B156ZAN02.1, IPS, 15.60, 3840x2160
Lenovo ThinkPad P51s 20HB000SGE
BOE NV156QUM-N44, IPS, 15.60, 3840x2160
Dell Precision 5520 UHD
SHP1476, IPS, 15.60, 3840x2160
MSI GS63VR 7RF-228US
IPS, 15.60, 3840x2160
MSI WT72-6QM
LG Philips LP173WF4-SPF1, IPS, 17.30, 1920x1080
Display
25%
26%
75%
37%
40%
2%
30%
Display P3 Coverage
47.43
64
35%
63.6
34%
86.3
82%
69.7
47%
67.4
42%
48.21
2%
67.3
42%
sRGB Coverage
71.4
82.7
16%
84.2
18%
99.5
39%
91.2
28%
98.5
38%
72.6
2%
85.4
20%
AdobeRGB 1998 Coverage
49
60.4
23%
61.5
26%
99.3
103%
66.8
36%
68.9
41%
49.81
2%
62.5
28%
Response Times
482%
497%
0%
-6%
-54%
14%
-33%
Response Time Grey 50% / Grey 80% *
36.8 ?(21.2, 15.6)
39.2 ?(20.4, 18.8)
-7%
38 ?(20, 18)
-3%
40.8 ?(20.8, 20)
-11%
38.4 ?(20.4, 18)
-4%
59.2 ?(27.6, 31.6)
-61%
28 ?(15.6, 12.4)
24%
42 ?(13, 29)
-14%
Response Time Black / White *
28.4 ?(19.6, 8.8)
25.6 ?(14.8, 10.8)
10%
33 ?(20, 13)
-16%
25.2 ?(14, 11.2)
11%
24.8 ?(13.6, 11.2)
13%
41.6 ?(26.8, 14.8)
-46%
23.6 ?(15.2, 8.4)
17%
26 ?(7, 19)
8%
PWM Frequency
1351 ?(30)
20830 ?(80)
1442%
21740 ?(100)
1509%
980 ?(90)
-27%
1351 ?(39)
0%
86 ?(10, 15)
-94%
Screen
27%
24%
39%
26%
30%
-19%
6%
Brightness middle
259.4
321
24%
302.5
17%
317
22%
317
22%
372.4
44%
274.2
6%
303
17%
Brightness
247
320
30%
295
19%
309
25%
290
17%
368
49%
263
6%
298
21%
Brightness Distribution
85
89
5%
92
8%
89
5%
85
0%
90
6%
92
8%
94
11%
Black Level *
0.43
0.29
33%
0.31
28%
0.36
16%
0.32
26%
0.48
-12%
0.44
-2%
0.46
-7%
Contrast
603
1107
84%
976
62%
881
46%
991
64%
776
29%
623
3%
659
9%
Colorchecker dE 2000 *
5.5
4.5
18%
4.3
22%
2.7
51%
3.6
35%
2.6
53%
8
-45%
5.77
-5%
Colorchecker dE 2000 max. *
12.7
9.5
25%
9.4
26%
4.1
68%
6.6
48%
5.6
56%
14.6
-15%
Greyscale dE 2000 *
3.6
2.9
19%
3.1
14%
3
17%
4.2
-17%
3.7
-3%
9.1
-153%
4.87
-35%
Gamma
2.24 98%
2.27 97%
2.16 102%
2.27 97%
2.24 98%
2.14 103%
2.24 98%
1.99 111%
CCT
7163 91%
6519 100%
7071 92%
6077 107%
6740 96%
7096 92%
5020 129%
7363 88%
Color Space (Percent of AdobeRGB 1998)
45
54.2
20%
55
22%
87.6
95%
59.5
32%
63
40%
45.7
2%
56.04
25%
Color Space (Percent of sRGB)
71
82.6
16%
84.3
19%
99.5
40%
91.1
28%
99
39%
72.1
2%
85.27
20%
Total Average (Program / Settings)
178% / 112%
182% / 113%
38% / 41%
19% / 22%
5% / 21%
-1% / -9%
1% / 3%

* ... smaller is better

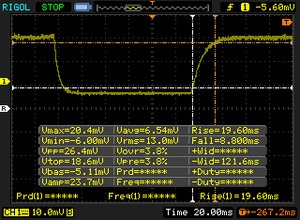
Display Response Times

Display response times show how fast the screen is able to change from one color to the next. Slow response times can lead to afterimages and can cause moving objects to appear blurry (ghosting). Gamers of fast-paced 3D titles should pay special attention to fast response times.
       Response Time Black to White
28.4 ms ... rise ↗ and fall ↘ combined↗ 19.6 ms rise
↘ 8.8 ms fall
The screen shows relatively slow response rates in our tests and may be too slow for gamers.
In comparison, all tested devices range from 0.1 (minimum) to 240 (maximum) ms. » 72 % of all devices are better.
This means that the measured response time is worse than the average of all tested devices (21.5 ms).
       Response Time 50% Grey to 80% Grey
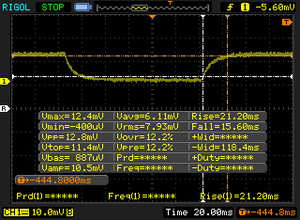
36.8 ms ... rise ↗ and fall ↘ combined↗ 21.2 ms rise
↘ 15.6 ms fall
The screen shows slow response rates in our tests and will be unsatisfactory for gamers.
In comparison, all tested devices range from 0.2 (minimum) to 636 (maximum) ms. » 47 % of all devices are better.
This means that the measured response time is similar to the average of all tested devices (33.7 ms).

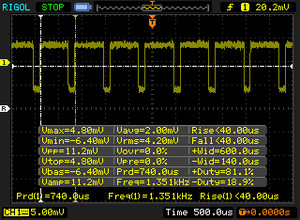
Screen Flickering / PWM (Pulse-Width Modulation)

To dim the screen, some notebooks will simply cycle the backlight on and off in rapid succession - a method called Pulse Width Modulation (PWM) . This cycling frequency should ideally be undetectable to the human eye. If said frequency is too low, users with sensitive eyes may experience strain or headaches or even notice the flickering altogether.
Screen flickering / PWM detected 1351 Hz ≤ 30 % brightness setting

The display backlight flickers at 1351 Hz (worst case, e.g., utilizing PWM) Flickering detected at a brightness setting of 30 % and below. There should be no flickering or PWM above this brightness setting.

The frequency of 1351 Hz is quite high, so most users sensitive to PWM should not notice any flickering.

In comparison: 53 % of all tested devices do not use PWM to dim the display. If PWM was detected, an average of 17900 (minimum: 5 - maximum: 3846000) Hz was measured.

CPU-Z: CPU
CPU-Z: CPU
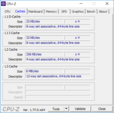
CPU-Z: Caches
CPU-Z: Caches
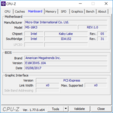
CPU-Z: Mainboard
CPU-Z: Mainboard
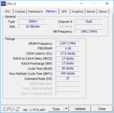
CPU-Z: Memory
CPU-Z: Memory
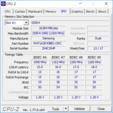
CPU-Z: SPD
CPU-Z: SPD
HWiNFO64
HWiNFO64
0102030405060708090100110120130140150160170180190200210220230240250260270280290300310320330340350360370380390400410420430440450460470480490500510520530540550560570580590600610620630640650660670680690700710720730Tooltip
Cinebench R15 CPU Multi 64 Bit
Cinebench R15
CPU Single 64Bit
HP ZBook 15 G4-Y4E80AV
Intel Xeon E3-1535M v6
176 Points +13%
Lenovo ThinkPad P51 20HH0016GE
Intel Xeon E3-1505M v6
171 Points +10%
Dell Precision 5520 UHD
Intel Xeon E3-1505M v6
170 Points +9%
MSI GS63VR 7RF-228US
Intel Core i7-7700HQ
162 Points +4%
Lenovo ThinkPad P51s 20HB000SGE
Intel Core i7-7600U
162 Points +4%
MSI WS63 7RF-290US
Intel Core i7-7700HQ
162 Points +4%
MSI WT72-6QM
Intel Xeon E3-1505M v5
157 Points +1%
MSI WS63VR 7RL-023US
Intel Core i7-7700HQ
156 Points
CPU Multi 64Bit
HP ZBook 15 G4-Y4E80AV
Intel Xeon E3-1535M v6
806 Points +9%
Lenovo ThinkPad P51 20HH0016GE
Intel Xeon E3-1505M v6
792 Points +7%
MSI WS63 7RF-290US
Intel Core i7-7700HQ
743 Points 0%
MSI GS63VR 7RF-228US
Intel Core i7-7700HQ
742 Points 0%
MSI WS63VR 7RL-023US
Intel Core i7-7700HQ
740 Points
MSI WT72-6QM
Intel Xeon E3-1505M v5
724 Points -2%
Dell Precision 5520 UHD
Intel Xeon E3-1505M v6
654 Points -12%
Lenovo ThinkPad P51s 20HB000SGE
Intel Core i7-7600U
379 Points -49%
Cinebench R11.5
CPU Single 64Bit
Dell Precision 5520 UHD
Intel Xeon E3-1505M v6
1.92 Points +10%
Lenovo ThinkPad P51 20HH0016GE
Intel Xeon E3-1505M v6
1.92 Points +10%
Lenovo ThinkPad P51s 20HB000SGE
Intel Core i7-7600U
1.85 Points +6%
MSI WS63 7RF-290US
Intel Core i7-7700HQ
1.82 Points +5%
MSI WT72-6QM
Intel Xeon E3-1505M v5
1.77 Points +2%
MSI GS63VR 7RF-228US
Intel Core i7-7700HQ
1.77 Points +2%
MSI WS63VR 7RL-023US
Intel Core i7-7700HQ
1.74 Points
CPU Multi 64Bit
Lenovo ThinkPad P51 20HH0016GE
Intel Xeon E3-1505M v6
8.61 Points +6%
MSI GS63VR 7RF-228US
Intel Core i7-7700HQ
8.18 Points 0%
MSI WS63 7RF-290US
Intel Core i7-7700HQ
8.17 Points 0%
MSI WS63VR 7RL-023US
Intel Core i7-7700HQ
8.14 Points
Dell Precision 5520 UHD
Intel Xeon E3-1505M v6
7.89 Points -3%
MSI WT72-6QM
Intel Xeon E3-1505M v5
7.85 Points -4%
Lenovo ThinkPad P51s 20HB000SGE
Intel Core i7-7600U
4.03 Points -50%
Cinebench R10
Rendering Multiple CPUs 32Bit
MSI WS63VR 7RL-023US
Intel Core i7-7700HQ
28975 Points
Lenovo ThinkPad P51 20HH0016GE
Intel Xeon E3-1505M v6
23780 Points -18%
MSI WS63 7RF-290US
Intel Core i7-7700HQ
22444 Points -23%
MSI GS63VR 7RF-228US
Intel Core i7-7700HQ
22217 Points -23%
MSI WT72-6QM
Intel Xeon E3-1505M v5
21475 Points -26%
Lenovo ThinkPad P51s 20HB000SGE
Intel Core i7-7600U
13170 Points -55%
Rendering Single 32Bit
Lenovo ThinkPad P51 20HH0016GE
Intel Xeon E3-1505M v6
6332 Points
Lenovo ThinkPad P51s 20HB000SGE
Intel Core i7-7600U
6263 Points
MSI WS63 7RF-290US
Intel Core i7-7700HQ
5929 Points
MSI GS63VR 7RF-228US
Intel Core i7-7700HQ
5747 Points
MSI WT72-6QM
Intel Xeon E3-1505M v5
5627 Points
wPrime 2.10 - 1024m
Lenovo ThinkPad P51 20HH0016GE
Intel Xeon E3-1505M v6
335.3 s * -55%
Dell Precision 5520 UHD
Intel Xeon E3-1505M v6
319 s * -47%
MSI GS63VR 7RF-228US
Intel Core i7-7700HQ
236 s * -9%
MSI WS63 7RF-290US
Intel Core i7-7700HQ
216.8 s * -0%
MSI WS63VR 7RL-023US
Intel Core i7-7700HQ
216.4 s *

* ... smaller is better

Cinebench R10 Rendering Multiple CPUs 32Bit
28975
Cinebench R10 Shading 32Bit
12498
Cinebench R11.5 CPU Single 64Bit
1.74 Points
Cinebench R11.5 CPU Multi 64Bit
8.14 Points
Cinebench R11.5 OpenGL 64Bit
90 fps
Cinebench R15 CPU Single 64Bit
156 Points
Cinebench R15 CPU Multi 64Bit
740 Points
Cinebench R15 OpenGL 64Bit
105 fps
Cinebench R15 Ref. Match 64Bit
99.6 %
Ajuda
PCMark 8
Home Score Accelerated v2
MSI WT72-6QM
Quadro M5000M, E3-1505M v5, Toshiba NVMe THNSN5256GPU7
4731 Points +27%
HP ZBook 15 G4-Y4E80AV
Quadro M2200, E3-1535M v6, Samsung SSD SM961 1TB M.2 MZVKW1T0HMLH
4375 Points +17%
MSI WS63 7RF-290US
Quadro P3000, i7-7700HQ, Samsung SM961 MZVKW512HMJP m.2 PCI-e
4284 Points +15%
MSI GS63VR 7RF-228US
GeForce GTX 1060 Mobile, i7-7700HQ, Samsung SM961 MZVKW512HMJP m.2 PCI-e
4141 Points +11%
MSI WS63VR 7RL-023US
Quadro P4000 Max-Q, i7-7700HQ, Toshiba NVMe THNSN5512GPU7
3739 Points
Lenovo ThinkPad P51 20HH0016GE
Quadro M2200, E3-1505M v6, Samsung PM961 NVMe MZVLW512HMJP
3641 Points -3%
Dell Precision 5520 UHD
Quadro M1200, E3-1505M v6, Samsung SM961 MZVKW512HMJP m.2 PCI-e
3504 Points -6%
Lenovo ThinkPad P51s 20HB000SGE
Quadro M520, i7-7600U, Samsung SSD PM961 1TB M.2 PCIe 3.0 x4 NVMe (MZVLW1T0)
3232 Points -14%
Work Score Accelerated v2
MSI WT72-6QM
Quadro M5000M, E3-1505M v5, Toshiba NVMe THNSN5256GPU7
5655 Points +29%
HP ZBook 15 G4-Y4E80AV
Quadro M2200, E3-1535M v6, Samsung SSD SM961 1TB M.2 MZVKW1T0HMLH
5423 Points +24%
MSI WS63 7RF-290US
Quadro P3000, i7-7700HQ, Samsung SM961 MZVKW512HMJP m.2 PCI-e
5331 Points +21%
MSI GS63VR 7RF-228US
GeForce GTX 1060 Mobile, i7-7700HQ, Samsung SM961 MZVKW512HMJP m.2 PCI-e
5268 Points +20%
MSI WS63VR 7RL-023US
Quadro P4000 Max-Q, i7-7700HQ, Toshiba NVMe THNSN5512GPU7
4390 Points
Dell Precision 5520 UHD
Quadro M1200, E3-1505M v6, Samsung SM961 MZVKW512HMJP m.2 PCI-e
4291 Points -2%
Lenovo ThinkPad P51 20HH0016GE
Quadro M2200, E3-1505M v6, Samsung PM961 NVMe MZVLW512HMJP
4256 Points -3%
Lenovo ThinkPad P51s 20HB000SGE
Quadro M520, i7-7600U, Samsung SSD PM961 1TB M.2 PCIe 3.0 x4 NVMe (MZVLW1T0)
4193 Points -4%
Creative Score Accelerated v2
Lenovo ThinkPad P51 20HH0016GE
Quadro M2200, E3-1505M v6, Samsung PM961 NVMe MZVLW512HMJP
6301 Points +18%
HP ZBook 15 G4-Y4E80AV
Quadro M2200, E3-1535M v6, Samsung SSD SM961 1TB M.2 MZVKW1T0HMLH
5663 Points +6%
MSI WS63 7RF-290US
Quadro P3000, i7-7700HQ, Samsung SM961 MZVKW512HMJP m.2 PCI-e
5348 Points 0%
MSI WS63VR 7RL-023US
Quadro P4000 Max-Q, i7-7700HQ, Toshiba NVMe THNSN5512GPU7
5328 Points
MSI GS63VR 7RF-228US
GeForce GTX 1060 Mobile, i7-7700HQ, Samsung SM961 MZVKW512HMJP m.2 PCI-e
5318 Points 0%
Dell Precision 5520 UHD
Quadro M1200, E3-1505M v6, Samsung SM961 MZVKW512HMJP m.2 PCI-e
5086 Points -5%
Lenovo ThinkPad P51s 20HB000SGE
Quadro M520, i7-7600U, Samsung SSD PM961 1TB M.2 PCIe 3.0 x4 NVMe (MZVLW1T0)
4640 Points -13%
PCMark 8 Home Score Accelerated v2
3739 pontos
PCMark 8 Creative Score Accelerated v2
5328 pontos
PCMark 8 Work Score Accelerated v2
4390 pontos
PCMark 10 Score
4751 pontos
Ajuda
MSI WS63VR 7RL-023US
Toshiba NVMe THNSN5512GPU7
MSI WS63 7RF-290US
Samsung SM961 MZVKW512HMJP m.2 PCI-e
Lenovo ThinkPad P51 20HH0016GE
Samsung PM961 NVMe MZVLW512HMJP
Lenovo ThinkPad P51s 20HB000SGE
Samsung SSD PM961 1TB M.2 PCIe 3.0 x4 NVMe (MZVLW1T0)
Dell Precision 5520 UHD
Samsung SM961 MZVKW512HMJP m.2 PCI-e
MSI GS63VR 7RF-228US
Samsung SM961 MZVKW512HMJP m.2 PCI-e
MSI WT72-6QM
Toshiba NVMe THNSN5256GPU7
AS SSD
75%
55%
43%
76%
75%
11%
Copy Game MB/s
1121
1140
721
921
1082
1025
Copy Program MB/s
447.3
425.6
411.5
372.8
401.9
554
Copy ISO MB/s
1760
1607
1200
1659
1666
1777
Score Total
1979
3759
90%
3424
73%
2771
40%
3681
86%
3756
90%
2433
23%
Score Write
557
1440
159%
917
65%
1271
128%
1379
148%
1468
164%
651
17%
Score Read
962
1568
63%
1690
76%
990
3%
1554
62%
1549
61%
1237
29%
Access Time Write *
0.033
0.028
15%
0.025
24%
0.027
18%
0.023
30%
0.029
12%
0.04
-21%
Access Time Read *
0.128
0.036
72%
0.032
75%
0.082
36%
0.038
70%
0.041
68%
0.092
28%
4K-64 Write
314
1151
267%
623
98%
1018
224%
1055
236%
1185
277%
473.5
51%
4K-64 Read
710
1244
75%
1372
93%
792
12%
1223
72%
1229
73%
935
32%
4K Write
114.6
128.5
12%
143.1
25%
130.8
14%
155.3
36%
127.6
11%
96.4
-16%
4K Read
40.2
49.02
22%
55.6
38%
52.8
31%
51.5
28%
48.01
19%
37.5
-7%
Seq Write
1287
1603
25%
1506
17%
1217
-5%
1694
32%
1550
20%
810
-37%
Seq Read
2133
2750
29%
2624
23%
1450
-32%
2799
31%
2719
27%
2638
24%

* ... smaller is better

Toshiba NVMe THNSN5512GPU7
CDM 5/6 Read Seq Q32T1: 2635 MB/s
CDM 5/6 Write Seq Q32T1: 1558 MB/s
CDM 5/6 Read 4K Q32T1: 563 MB/s
CDM 5/6 Write 4K Q32T1: 361.3 MB/s
CDM 5 Read Seq: 1162 MB/s
CDM 5 Write Seq: 1110 MB/s
CDM 5/6 Read 4K: 43.82 MB/s
CDM 5/6 Write 4K: 157.1 MB/s
012345678910111213141516171819202122232425262728293031323334353637383940414243444546Tooltip
The Witcher 3 ultra
SPECviewperf 12
1900x1060 Solidworks (sw-03)
no name
NVIDIA Quadro P5000, i5-7440HQ
153 fps +28%
no name
NVIDIA Quadro P4000 Max-Q,
121 fps +1%
MSI WS63VR 7RL-023US
NVIDIA Quadro P4000 Max-Q, i7-7700HQ
119.9 fps
Fujitsu Celsius H970
NVIDIA Quadro P4000, E3-1535M v6
117.1 fps -2%
Lenovo ThinkPad P71-20HK0004GE
NVIDIA Quadro P3000, i7-7820HQ
107.3 fps -11%
MSI WS63 7RF-290US
NVIDIA Quadro P3000, i7-7700HQ
102.9 fps -14%
MSI WT72-6QM
NVIDIA Quadro M5000M, E3-1505M v5
101 fps -16%
HP ZBook 15 G4-Y4E80AV
NVIDIA Quadro M2200, E3-1535M v6
99.5 fps -17%
Lenovo ThinkPad P70-20ER000XUS
NVIDIA Quadro M4000M, E3-1505M v5
97.1 fps -19%
Lenovo ThinkPad P51 20HH0016GE
NVIDIA Quadro M2200, E3-1505M v6
86.2 fps -28%
Dell Precision 5520 UHD
NVIDIA Quadro M1200, E3-1505M v6
69 fps -42%
Lenovo ThinkPad P51s 20HB000SGE
NVIDIA Quadro M520, i7-7600U
45.9 fps -62%
1900x1060 Siemens NX (snx-02)
no name
NVIDIA Quadro P5000, i5-7440HQ
155 fps +39%
Lenovo ThinkPad P70-20ER000XUS
NVIDIA Quadro M4000M, E3-1505M v5
127.8 fps +14%
MSI WS63VR 7RL-023US
NVIDIA Quadro P4000 Max-Q, i7-7700HQ
111.7 fps
no name
NVIDIA Quadro P4000 Max-Q,
106 fps -5%
MSI WT72-6QM
NVIDIA Quadro M5000M, E3-1505M v5
86.9 fps -22%
Fujitsu Celsius H970
NVIDIA Quadro P4000, E3-1535M v6
83.1 fps -26%
Lenovo ThinkPad P71-20HK0004GE
NVIDIA Quadro P3000, i7-7820HQ
73.3 fps -34%
MSI WS63 7RF-290US
NVIDIA Quadro P3000, i7-7700HQ
71.8 fps -36%
HP ZBook 15 G4-Y4E80AV
NVIDIA Quadro M2200, E3-1535M v6
59 fps -47%
Lenovo ThinkPad P51 20HH0016GE
NVIDIA Quadro M2200, E3-1505M v6
57.7 fps -48%
Dell Precision 5520 UHD
NVIDIA Quadro M1200, E3-1505M v6
34.18 fps -69%
Lenovo ThinkPad P51s 20HB000SGE
NVIDIA Quadro M520, i7-7600U
24.13 fps -78%
1900x1060 Showcase (showcase-01)
no name
NVIDIA Quadro P5000, i5-7440HQ
73 fps +17%
no name
NVIDIA Quadro P4000 Max-Q,
67.4 fps +8%
Fujitsu Celsius H970
NVIDIA Quadro P4000, E3-1535M v6
67.2 fps +7%
MSI WS63VR 7RL-023US
NVIDIA Quadro P4000 Max-Q, i7-7700HQ
62.6 fps
MSI WS63 7RF-290US
NVIDIA Quadro P3000, i7-7700HQ
54.8 fps -12%
Lenovo ThinkPad P71-20HK0004GE
NVIDIA Quadro P3000, i7-7820HQ
54 fps -14%
MSI WT72-6QM
NVIDIA Quadro M5000M, E3-1505M v5
44.14 fps -29%
Lenovo ThinkPad P70-20ER000XUS
NVIDIA Quadro M4000M, E3-1505M v5
40.33 fps -36%
Lenovo ThinkPad P51 20HH0016GE
NVIDIA Quadro M2200, E3-1505M v6
32.8 fps -48%
HP ZBook 15 G4-Y4E80AV
NVIDIA Quadro M2200, E3-1535M v6
31.14 fps -50%
Dell Precision 5520 UHD
NVIDIA Quadro M1200, E3-1505M v6
26.2 fps -58%
Lenovo ThinkPad P51s 20HB000SGE
NVIDIA Quadro M520, i7-7600U
11.8 fps -81%
1900x1060 Medical (medical-01)
no name
NVIDIA Quadro P5000, i5-7440HQ
55.6 fps +33%
no name
NVIDIA Quadro P4000 Max-Q,
48.5 fps +16%
MSI WS63VR 7RL-023US
NVIDIA Quadro P4000 Max-Q, i7-7700HQ
41.8 fps
Fujitsu Celsius H970
NVIDIA Quadro P4000, E3-1535M v6
39.4 fps -6%
MSI WT72-6QM
NVIDIA Quadro M5000M, E3-1505M v5
31.35 fps -25%
MSI WS63 7RF-290US
NVIDIA Quadro P3000, i7-7700HQ
29.82 fps -29%
Lenovo ThinkPad P71-20HK0004GE
NVIDIA Quadro P3000, i7-7820HQ
29.32 fps -30%
Lenovo ThinkPad P70-20ER000XUS
NVIDIA Quadro M4000M, E3-1505M v5
26.06 fps -38%
Lenovo ThinkPad P51 20HH0016GE
NVIDIA Quadro M2200, E3-1505M v6
25.66 fps -39%
HP ZBook 15 G4-Y4E80AV
NVIDIA Quadro M2200, E3-1535M v6
24.64 fps -41%
Dell Precision 5520 UHD
NVIDIA Quadro M1200, E3-1505M v6
17.49 fps -58%
Lenovo ThinkPad P51s 20HB000SGE
NVIDIA Quadro M520, i7-7600U
8.29 fps -80%
1900x1060 Maya (maya-04)
no name
NVIDIA Quadro P5000, i5-7440HQ
95 fps +30%
Fujitsu Celsius H970
NVIDIA Quadro P4000, E3-1535M v6
77.9 fps +7%
MSI WS63VR 7RL-023US
NVIDIA Quadro P4000 Max-Q, i7-7700HQ
73 fps
MSI WT72-6QM
NVIDIA Quadro M5000M, E3-1505M v5
69.6 fps -5%
no name
NVIDIA Quadro P4000 Max-Q,
68 fps -7%
MSI WS63 7RF-290US
NVIDIA Quadro P3000, i7-7700HQ
67.7 fps -7%
Lenovo ThinkPad P71-20HK0004GE
NVIDIA Quadro P3000, i7-7820HQ
64.6 fps -12%
Lenovo ThinkPad P70-20ER000XUS
NVIDIA Quadro M4000M, E3-1505M v5
64 fps -12%
HP ZBook 15 G4-Y4E80AV
NVIDIA Quadro M2200, E3-1535M v6
48.34 fps -34%
Lenovo ThinkPad P51 20HH0016GE
NVIDIA Quadro M2200, E3-1505M v6
46.93 fps -36%
Dell Precision 5520 UHD
NVIDIA Quadro M1200, E3-1505M v6
32.07 fps -56%
Lenovo ThinkPad P51s 20HB000SGE
NVIDIA Quadro M520, i7-7600U
19.51 fps -73%
1900x1060 Energy (energy-01)
no name
NVIDIA Quadro P4000 Max-Q,
12.2 fps +15%
no name
NVIDIA Quadro P5000, i5-7440HQ
12 fps +13%
MSI WS63VR 7RL-023US
NVIDIA Quadro P4000 Max-Q, i7-7700HQ
10.6 fps
Fujitsu Celsius H970
NVIDIA Quadro P4000, E3-1535M v6
10.29 fps -3%
MSI WS63 7RF-290US
NVIDIA Quadro P3000, i7-7700HQ
7.7 fps -27%
Lenovo ThinkPad P71-20HK0004GE
NVIDIA Quadro P3000, i7-7820HQ
7.6 fps -28%
MSI WT72-6QM
NVIDIA Quadro M5000M, E3-1505M v5
6.86 fps -35%
Lenovo ThinkPad P70-20ER000XUS
NVIDIA Quadro M4000M, E3-1505M v5
6.04 fps -43%
Lenovo ThinkPad P51 20HH0016GE
NVIDIA Quadro M2200, E3-1505M v6
5.26 fps -50%
HP ZBook 15 G4-Y4E80AV
NVIDIA Quadro M2200, E3-1535M v6
5.15 fps -51%
Dell Precision 5520 UHD
NVIDIA Quadro M1200, E3-1505M v6
3.78 fps -64%
Lenovo ThinkPad P51s 20HB000SGE
NVIDIA Quadro M520, i7-7600U
0.53 fps -95%
1900x1060 Creo (creo-01)
no name
NVIDIA Quadro P5000, i5-7440HQ
126 fps +37%
Fujitsu Celsius H970
NVIDIA Quadro P4000, E3-1535M v6
97.1 fps +6%
no name
NVIDIA Quadro P4000 Max-Q,
93 fps +1%
MSI WS63VR 7RL-023US
NVIDIA Quadro P4000 Max-Q, i7-7700HQ
91.9 fps
MSI WS63 7RF-290US
NVIDIA Quadro P3000, i7-7700HQ
87 fps -5%
Lenovo ThinkPad P71-20HK0004GE
NVIDIA Quadro P3000, i7-7820HQ
85.6 fps -7%
MSI WT72-6QM
NVIDIA Quadro M5000M, E3-1505M v5
81.3 fps -12%
Lenovo ThinkPad P70-20ER000XUS
NVIDIA Quadro M4000M, E3-1505M v5
78.4 fps -15%
HP ZBook 15 G4-Y4E80AV
NVIDIA Quadro M2200, E3-1535M v6
71.2 fps -23%
Lenovo ThinkPad P51 20HH0016GE
NVIDIA Quadro M2200, E3-1505M v6
68.2 fps -26%
Dell Precision 5520 UHD
NVIDIA Quadro M1200, E3-1505M v6
46.12 fps -50%
Lenovo ThinkPad P51s 20HB000SGE
NVIDIA Quadro M520, i7-7600U
27.98 fps -70%
1900x1060 Catia (catia-04)
no name
NVIDIA Quadro P5000, i5-7440HQ
145 fps +32%
Fujitsu Celsius H970
NVIDIA Quadro P4000, E3-1535M v6
115.2 fps +5%
no name
NVIDIA Quadro P4000 Max-Q,
111 fps +1%
MSI WS63VR 7RL-023US
NVIDIA Quadro P4000 Max-Q, i7-7700HQ
110 fps
MSI WS63 7RF-290US
NVIDIA Quadro P3000, i7-7700HQ
96.5 fps -12%
MSI WT72-6QM
NVIDIA Quadro M5000M, E3-1505M v5
94.4 fps -14%
Lenovo ThinkPad P71-20HK0004GE
NVIDIA Quadro P3000, i7-7820HQ
92.3 fps -16%
Lenovo ThinkPad P70-20ER000XUS
NVIDIA Quadro M4000M, E3-1505M v5
88.1 fps -20%
Lenovo ThinkPad P51 20HH0016GE
NVIDIA Quadro M2200, E3-1505M v6
72 fps -35%
HP ZBook 15 G4-Y4E80AV
NVIDIA Quadro M2200, E3-1535M v6
71.4 fps -35%
Dell Precision 5520 UHD
NVIDIA Quadro M1200, E3-1505M v6
45.75 fps -58%
Lenovo ThinkPad P51s 20HB000SGE
NVIDIA Quadro M520, i7-7600U
26.22 fps -76%
1900x1060 3ds Max (3dsmax-05)
no name
NVIDIA Quadro P5000, i5-7440HQ
125 fps
no name
NVIDIA Quadro P4000 Max-Q,
105 fps
Fujitsu Celsius H970
NVIDIA Quadro P4000, E3-1535M v6
93.6 fps
Lenovo ThinkPad P51s 20HB000SGE
NVIDIA Quadro M520, i7-7600U
19.73 fps
LuxMark v2.0 64Bit
Room GPUs-only
MSI WS63VR 7RL-023US
NVIDIA Quadro P4000 Max-Q, i7-7700HQ
2319 Samples/s
Fujitsu Celsius H970
NVIDIA Quadro P4000, E3-1535M v6
1847 Samples/s -20%
Lenovo ThinkPad P71-20HK0004GE
NVIDIA Quadro P3000, i7-7820HQ
1824 Samples/s -21%
MSI WS63 7RF-290US
NVIDIA Quadro P3000, i7-7700HQ
1805 Samples/s -22%
MSI WT72-6QM
NVIDIA Quadro M5000M, E3-1505M v5
1331 Samples/s -43%
Lenovo ThinkPad P51 20HH0016GE
NVIDIA Quadro M2200, E3-1505M v6
1318 Samples/s -43%
HP ZBook 15 G4-Y4E80AV
NVIDIA Quadro M2200, E3-1535M v6
1306 Samples/s -44%
Dell Precision 5520 UHD
NVIDIA Quadro M1200, E3-1505M v6
979 Samples/s -58%
Lenovo ThinkPad P51s 20HB000SGE
NVIDIA Quadro M520, i7-7600U
405 Samples/s -83%
Sala GPUs-only
MSI WS63VR 7RL-023US
NVIDIA Quadro P4000 Max-Q, i7-7700HQ
4369 Samples/s
Fujitsu Celsius H970
NVIDIA Quadro P4000, E3-1535M v6
3564 Samples/s -18%
Lenovo ThinkPad P71-20HK0004GE
NVIDIA Quadro P3000, i7-7820HQ
3386 Samples/s -22%
MSI WS63 7RF-290US
NVIDIA Quadro P3000, i7-7700HQ
3317 Samples/s -24%
MSI WT72-6QM
NVIDIA Quadro M5000M, E3-1505M v5
2179 Samples/s -50%
Lenovo ThinkPad P51 20HH0016GE
NVIDIA Quadro M2200, E3-1505M v6
2107 Samples/s -52%
HP ZBook 15 G4-Y4E80AV
NVIDIA Quadro M2200, E3-1535M v6
2099 Samples/s -52%
Dell Precision 5520 UHD
NVIDIA Quadro M1200, E3-1505M v6
1562 Samples/s -64%
Lenovo ThinkPad P51s 20HB000SGE
NVIDIA Quadro M520, i7-7600U
708 Samples/s -84%
3DMark 11
1280x720 Performance GPU
Aorus X7 v7
NVIDIA GeForce GTX 1070 Mobile, i7-7820HK
22190 Points +40%
Asus Zephyrus GX501VS
NVIDIA GeForce GTX 1070 Max-Q, i7-7700HQ
20240 Points +28%
MSI WS63VR 7RL-023US
NVIDIA Quadro P4000 Max-Q, i7-7700HQ
15837 Points
Fujitsu Celsius H970
NVIDIA Quadro P4000, E3-1535M v6
15433 Points -3%
Acer Aspire 7 A717-71G-72VY
NVIDIA GeForce GTX 1060 Mobile, i7-7700HQ
14846 Points -6%
MSI GS63VR 7RF-228US
NVIDIA GeForce GTX 1060 Mobile, i7-7700HQ
14450 Points -9%
Lenovo Legion Y520-15IKBM 80YY001APB
NVIDIA GeForce GTX 1060 Max-Q, i5-7300HQ
13388 Points -15%
MSI WS63 7RF-290US
NVIDIA Quadro P3000, i7-7700HQ
12105 Points -24%
MSI WT72-6QM
NVIDIA Quadro M5000M, E3-1505M v5
11820 Points -25%
Lenovo ThinkPad P71-20HK0004GE
NVIDIA Quadro P3000, i7-7820HQ
11162 Points -30%
Lenovo ThinkPad P70-20ER000XUS
NVIDIA Quadro M4000M, E3-1505M v5
10259 Points -35%
Lenovo ThinkPad P51 20HH0016GE
NVIDIA Quadro M2200, E3-1505M v6
7425 Points -53%
Dell Precision 5520 UHD
NVIDIA Quadro M1200, E3-1505M v6
5105 Points -68%
Lenovo ThinkPad P51s 20HB000SGE
NVIDIA Quadro M520, i7-7600U
2658 Points -83%
1280x720 Performance Combined
Aorus X7 v7
NVIDIA GeForce GTX 1070 Mobile, i7-7820HK
10303 Points +11%
Lenovo ThinkPad P71-20HK0004GE
NVIDIA Quadro P3000, i7-7820HQ
9490 Points +2%
MSI WT72-6QM
NVIDIA Quadro M5000M, E3-1505M v5
9356 Points +1%
MSI WS63VR 7RL-023US
NVIDIA Quadro P4000 Max-Q, i7-7700HQ
9296 Points
Asus Zephyrus GX501VS
NVIDIA GeForce GTX 1070 Max-Q, i7-7700HQ
9065 Points -2%
MSI WS63 7RF-290US
NVIDIA Quadro P3000, i7-7700HQ
9063 Points -3%
MSI GS63VR 7RF-228US
NVIDIA GeForce GTX 1060 Mobile, i7-7700HQ
8873 Points -5%
Lenovo ThinkPad P70-20ER000XUS
NVIDIA Quadro M4000M, E3-1505M v5
7892 Points -15%
Fujitsu Celsius H970
NVIDIA Quadro P4000, E3-1535M v6
7662 Points -18%
Lenovo ThinkPad P51 20HH0016GE
NVIDIA Quadro M2200, E3-1505M v6
7118 Points -23%
Acer Aspire 7 A717-71G-72VY
NVIDIA GeForce GTX 1060 Mobile, i7-7700HQ
6389 Points -31%
Lenovo Legion Y520-15IKBM 80YY001APB
NVIDIA GeForce GTX 1060 Max-Q, i5-7300HQ
6212 Points -33%
Dell Precision 5520 UHD
NVIDIA Quadro M1200, E3-1505M v6
5312 Points -43%
Lenovo ThinkPad P51s 20HB000SGE
NVIDIA Quadro M520, i7-7600U
2912 Points -69%
3DMark
1280x720 Cloud Gate Standard Graphics
Aorus X7 v7
NVIDIA GeForce GTX 1070 Mobile, i7-7820HK
116901 Points +56%
Asus Zephyrus GX501VS
NVIDIA GeForce GTX 1070 Max-Q, i7-7700HQ
107807 Points +44%
MSI WS63VR 7RL-023US
NVIDIA Quadro P4000 Max-Q, i7-7700HQ
74933 Points
Acer Aspire 7 A717-71G-72VY
NVIDIA GeForce GTX 1060 Mobile, i7-7700HQ
68143 Points -9%
MSI WS63 7RF-290US
NVIDIA Quadro P3000, i7-7700HQ
65089 Points -13%
MSI WT72-6QM
NVIDIA Quadro M5000M, E3-1505M v5
61789 Points -18%
Lenovo ThinkPad P71-20HK0004GE
NVIDIA Quadro P3000, i7-7820HQ
61574 Points -18%
Lenovo Legion Y520-15IKBM 80YY001APB
NVIDIA GeForce GTX 1060 Max-Q, i5-7300HQ
57208 Points -24%
Fujitsu Celsius H970
NVIDIA Quadro P4000, E3-1535M v6
53834 Points -28%
Lenovo ThinkPad P70-20ER000XUS
NVIDIA Quadro M4000M, E3-1505M v5
49204 Points -34%
HP ZBook 15 G4-Y4E80AV
NVIDIA Quadro M2200, E3-1535M v6
37796 Points -50%
Lenovo ThinkPad P51 20HH0016GE
NVIDIA Quadro M2200, E3-1505M v6
36877 Points -51%
MSI GS63VR 7RF-228US
NVIDIA GeForce GTX 1060 Mobile, i7-7700HQ
32344 Points -57%
Dell Precision 5520 UHD
NVIDIA Quadro M1200, E3-1505M v6
28254 Points -62%
Lenovo ThinkPad P51s 20HB000SGE
NVIDIA Quadro M520, i7-7600U
13394 Points -82%
1920x1080 Fire Strike Graphics
Aorus X7 v7
NVIDIA GeForce GTX 1070 Mobile, i7-7820HK
17433 Points +42%
Asus Zephyrus GX501VS
NVIDIA GeForce GTX 1070 Max-Q, i7-7700HQ
16165 Points +31%
MSI WS63VR 7RL-023US
NVIDIA Quadro P4000 Max-Q, i7-7700HQ
12312 Points
Fujitsu Celsius H970
NVIDIA Quadro P4000, E3-1535M v6
12259 Points 0%
Acer Aspire 7 A717-71G-72VY
NVIDIA GeForce GTX 1060 Mobile, i7-7700HQ
11502 Points -7%
MSI GS63VR 7RF-228US
NVIDIA GeForce GTX 1060 Mobile, i7-7700HQ
11261 Points -9%
Lenovo Legion Y520-15IKBM 80YY001APB
NVIDIA GeForce GTX 1060 Max-Q, i5-7300HQ
10338 Points -16%
MSI WS63 7RF-290US
NVIDIA Quadro P3000, i7-7700HQ
9489 Points -23%
MSI WT72-6QM
NVIDIA Quadro M5000M, E3-1505M v5
9087 Points -26%
Lenovo ThinkPad P71-20HK0004GE
NVIDIA Quadro P3000, i7-7820HQ
9022 Points -27%
Lenovo ThinkPad P70-20ER000XUS
NVIDIA Quadro M4000M, E3-1505M v5
7723 Points -37%
Lenovo ThinkPad P51 20HH0016GE
NVIDIA Quadro M2200, E3-1505M v6
5850 Points -52%
HP ZBook 15 G4-Y4E80AV
NVIDIA Quadro M2200, E3-1535M v6
5786 Points -53%
Dell Precision 5520 UHD
NVIDIA Quadro M1200, E3-1505M v6
4165 Points -66%
Lenovo ThinkPad P51s 20HB000SGE
NVIDIA Quadro M520, i7-7600U
2342 Points -81%
1920x1080 Ice Storm Extreme Graphics
Aorus X7 v7
NVIDIA GeForce GTX 1070 Mobile, i7-7820HK
309248 Points
MSI WT72-6QM
NVIDIA Quadro M5000M, E3-1505M v5
251633 Points
Asus Zephyrus GX501VS
NVIDIA GeForce GTX 1070 Max-Q, i7-7700HQ
244900 Points
Lenovo ThinkPad P70-20ER000XUS
NVIDIA Quadro M4000M, E3-1505M v5
176003 Points
MSI WS63 7RF-290US
NVIDIA Quadro P3000, i7-7700HQ
121766 Points
Lenovo Legion Y520-15IKBM 80YY001APB
NVIDIA GeForce GTX 1060 Max-Q, i5-7300HQ
71289 Points
Dell Precision 5520 UHD
NVIDIA Quadro M1200, E3-1505M v6
42129 Points
Lenovo ThinkPad P51s 20HB000SGE
NVIDIA Quadro M520, i7-7600U
20741 Points
3DMark 06 Standard Score
28211 pontos
3DMark 11 Performance
13482 pontos
3DMark Cloud Gate Standard Score
25528 pontos
3DMark Fire Strike Score
10473 pontos
Ajuda
The Witcher 3
1920x1080 Ultra Graphics & Postprocessing (HBAO+)
Aorus X7 v7
GeForce GTX 1070 Mobile, i7-7820HK, Samsung SM961 MZVPW256HEGL
61.3 fps +46%
Asus Zephyrus GX501VS
GeForce GTX 1070 Max-Q, i7-7700HQ, Samsung SM961 MZVPW256HEGL
51 fps +21%
MSI WS63VR 7RL-023US
Quadro P4000 Max-Q, i7-7700HQ, Toshiba NVMe THNSN5512GPU7
42 fps
Fujitsu Celsius H970
Quadro P4000, E3-1535M v6, Samsung SM961 MZVKW512HMJP m.2 PCI-e
41.09 fps -2%
MSI GS63VR 7RF-228US
GeForce GTX 1060 Mobile, i7-7700HQ, Samsung SM961 MZVKW512HMJP m.2 PCI-e
39.4 fps -6%
Acer Aspire 7 A717-71G-72VY
GeForce GTX 1060 Mobile, i7-7700HQ, Toshiba MQ01ABD100
38.5 fps -8%
Lenovo Legion Y520-15IKBM 80YY001APB
GeForce GTX 1060 Max-Q, i5-7300HQ, ADATA SX7000NP 256 GB
35.1 fps -16%
MSI WS63 7RF-290US
Quadro P3000, i7-7700HQ, Samsung SM961 MZVKW512HMJP m.2 PCI-e
33 fps -21%
Lenovo ThinkPad P71-20HK0004GE
Quadro P3000, i7-7820HQ, Samsung PM961 NVMe MZVLW512HMJP
31.2 fps -26%
Lenovo ThinkPad P51 20HH0016GE
Quadro M2200, E3-1505M v6, Samsung PM961 NVMe MZVLW512HMJP
20 fps -52%
HP ZBook 15 G4-Y4E80AV
Quadro M2200, E3-1535M v6, Samsung SSD SM961 1TB M.2 MZVKW1T0HMLH
18 fps -57%
3840x2160 High Graphics & Postprocessing (Nvidia HairWorks Off)
MSI WS63VR 7RL-023US
Quadro P4000 Max-Q, i7-7700HQ, Toshiba NVMe THNSN5512GPU7
29 fps
MSI GS63VR 7RF-228US
GeForce GTX 1060 Mobile, i7-7700HQ, Samsung SM961 MZVKW512HMJP m.2 PCI-e
26.3 fps -9%
Lenovo ThinkPad P71-20HK0004GE
Quadro P3000, i7-7820HQ, Samsung PM961 NVMe MZVLW512HMJP
21.8 fps -25%
Lenovo ThinkPad P51 20HH0016GE
Quadro M2200, E3-1505M v6, Samsung PM961 NVMe MZVLW512HMJP
12.7 fps -56%
Batman: Arkham Knight
3840x2160 High / On (Interactive Smoke & Paper Debris Off) AA:SM AF:8x
MSI WS63VR 7RL-023US
Quadro P4000 Max-Q, i7-7700HQ, Toshiba NVMe THNSN5512GPU7
32 fps
MSI GS63VR 7RF-228US
GeForce GTX 1060 Mobile, i7-7700HQ, Samsung SM961 MZVKW512HMJP m.2 PCI-e
29 fps -9%
Dell Precision 5520 UHD
Quadro M1200, E3-1505M v6, Samsung SM961 MZVKW512HMJP m.2 PCI-e
11 fps -66%
1920x1080 High / On AA:SM AF:16x
MSI WS63VR 7RL-023US
Quadro P4000 Max-Q, i7-7700HQ, Toshiba NVMe THNSN5512GPU7
94 fps
Asus Zephyrus GX501VS
GeForce GTX 1070 Max-Q, i7-7700HQ, Samsung SM961 MZVPW256HEGL
79 fps -16%
MSI GS63VR 7RF-228US
GeForce GTX 1060 Mobile, i7-7700HQ, Samsung SM961 MZVKW512HMJP m.2 PCI-e
58 fps -38%
MSI WS63 7RF-290US
Quadro P3000, i7-7700HQ, Samsung SM961 MZVKW512HMJP m.2 PCI-e
49 fps -48%
Lenovo Legion Y520-15IKBM 80YY001APB
GeForce GTX 1060 Max-Q, i5-7300HQ, ADATA SX7000NP 256 GB
48 fps -49%
Dell Precision 5520 UHD
Quadro M1200, E3-1505M v6, Samsung SM961 MZVKW512HMJP m.2 PCI-e
29 fps -69%
BioShock Infinite - 1920x1080 Ultra Preset, DX11 (DDOF)
Aorus X7 v7
GeForce GTX 1070 Mobile, i7-7820HK, Samsung SM961 MZVPW256HEGL
145.8 fps +29%
Asus Zephyrus GX501VS
GeForce GTX 1070 Max-Q, i7-7700HQ, Samsung SM961 MZVPW256HEGL
131.6 fps +16%
MSI WS63VR 7RL-023US
Quadro P4000 Max-Q, i7-7700HQ, Toshiba NVMe THNSN5512GPU7
113 fps
MSI GS63VR 7RF-228US
GeForce GTX 1060 Mobile, i7-7700HQ, Samsung SM961 MZVKW512HMJP m.2 PCI-e
100.6 fps -11%
Fujitsu Celsius H970
Quadro P4000, E3-1535M v6, Samsung SM961 MZVKW512HMJP m.2 PCI-e
96 fps -15%
MSI WS63 7RF-290US
Quadro P3000, i7-7700HQ, Samsung SM961 MZVKW512HMJP m.2 PCI-e
92.1 fps -18%
Lenovo ThinkPad P71-20HK0004GE
Quadro P3000, i7-7820HQ, Samsung PM961 NVMe MZVLW512HMJP
89.8 fps -21%
Lenovo Legion Y520-15IKBM 80YY001APB
GeForce GTX 1060 Max-Q, i5-7300HQ, ADATA SX7000NP 256 GB
87.2 fps -23%
Lenovo ThinkPad P70-20ER000XUS
Quadro M4000M, E3-1505M v5, Samsung SSD SM951a 512GB M.2 PCIe 3.0 x4 NVMe (MZVKV512)
85 fps -25%
HP ZBook 15 G4-Y4E80AV
Quadro M2200, E3-1535M v6, Samsung SSD SM961 1TB M.2 MZVKW1T0HMLH
56.8 fps -50%
Dell Precision 5520 UHD
Quadro M1200, E3-1505M v6, Samsung SM961 MZVKW512HMJP m.2 PCI-e
47 fps -58%
Lenovo ThinkPad P51s 20HB000SGE
Quadro M520, i7-7600U, Samsung SSD PM961 1TB M.2 PCIe 3.0 x4 NVMe (MZVLW1T0)
24.2 fps -79%
Metro: Last Light - 1920x1080 Very High (DX11) AF:16x
Asus Zephyrus GX501VS
GeForce GTX 1070 Max-Q, i7-7700HQ, Samsung SM961 MZVPW256HEGL
108.4 fps +29%
MSI WS63VR 7RL-023US
Quadro P4000 Max-Q, i7-7700HQ, Toshiba NVMe THNSN5512GPU7
84 fps
MSI GS63VR 7RF-228US
GeForce GTX 1060 Mobile, i7-7700HQ, Samsung SM961 MZVKW512HMJP m.2 PCI-e
78.1 fps -7%
MSI WS63 7RF-290US
Quadro P3000, i7-7700HQ, Samsung SM961 MZVKW512HMJP m.2 PCI-e
67.5 fps -20%
MSI WT72-6QM
Quadro M5000M, E3-1505M v5, Toshiba NVMe THNSN5256GPU7
60.8 fps -28%
Rise of the Tomb Raider
3840x2160 High Preset AA:FX AF:4x
MSI WS63VR 7RL-023US
Quadro P4000 Max-Q, i7-7700HQ, Toshiba NVMe THNSN5512GPU7
28 fps
MSI GS63VR 7RF-228US
GeForce GTX 1060 Mobile, i7-7700HQ, Samsung SM961 MZVKW512HMJP m.2 PCI-e
25.5 fps -9%
Lenovo ThinkPad P71-20HK0004GE
Quadro P3000, i7-7820HQ, Samsung PM961 NVMe MZVLW512HMJP
21 fps -25%
Lenovo ThinkPad P70-20ER000XUS
Quadro M4000M, E3-1505M v5, Samsung SSD SM951a 512GB M.2 PCIe 3.0 x4 NVMe (MZVKV512)
20 fps -29%
Lenovo ThinkPad P51 20HH0016GE
Quadro M2200, E3-1505M v6, Samsung PM961 NVMe MZVLW512HMJP
13.7 fps -51%
1920x1080 Very High Preset AA:FX AF:16x
Asus Zephyrus GX501VS
GeForce GTX 1070 Max-Q, i7-7700HQ, Samsung SM961 MZVPW256HEGL
85.9 fps +32%
Fujitsu Celsius H970
Quadro P4000, E3-1535M v6, Samsung SM961 MZVKW512HMJP m.2 PCI-e
65.5 fps +1%
MSI WS63VR 7RL-023US
Quadro P4000 Max-Q, i7-7700HQ, Toshiba NVMe THNSN5512GPU7
65 fps
MSI GS63VR 7RF-228US
GeForce GTX 1060 Mobile, i7-7700HQ, Samsung SM961 MZVKW512HMJP m.2 PCI-e
64.1 fps -1%
MSI WS63 7RF-290US
Quadro P3000, i7-7700HQ, Samsung SM961 MZVKW512HMJP m.2 PCI-e
53.6 fps -18%
Lenovo ThinkPad P71-20HK0004GE
Quadro P3000, i7-7820HQ, Samsung PM961 NVMe MZVLW512HMJP
50.3 fps -23%
Lenovo ThinkPad P70-20ER000XUS
Quadro M4000M, E3-1505M v5, Samsung SSD SM951a 512GB M.2 PCIe 3.0 x4 NVMe (MZVKV512)
48 fps -26%
Lenovo ThinkPad P51 20HH0016GE
Quadro M2200, E3-1505M v6, Samsung PM961 NVMe MZVLW512HMJP
35.2 fps -46%
HP ZBook 15 G4-Y4E80AV
Quadro M2200, E3-1535M v6, Samsung SSD SM961 1TB M.2 MZVKW1T0HMLH
33 fps -49%
Lenovo ThinkPad P51s 20HB000SGE
Quadro M520, i7-7600U, Samsung SSD PM961 1TB M.2 PCIe 3.0 x4 NVMe (MZVLW1T0)
11.7 fps -82%
Ashes of the Singularity
1920x1080 high
Asus Zephyrus GX501VS
GeForce GTX 1070 Max-Q, i7-7700HQ, Samsung SM961 MZVPW256HEGL
72.8 fps +17%
MSI WS63VR 7RL-023US
Quadro P4000 Max-Q, i7-7700HQ, Toshiba NVMe THNSN5512GPU7
62 fps
MSI WS63 7RF-290US
Quadro P3000, i7-7700HQ, Samsung SM961 MZVKW512HMJP m.2 PCI-e
47.8 fps -23%
Lenovo ThinkPad P51s 20HB000SGE
Quadro M520, i7-7600U, Samsung SSD PM961 1TB M.2 PCIe 3.0 x4 NVMe (MZVLW1T0)
12 fps -81%
3840x2160 extreme
MSI WS63VR 7RL-023US
Quadro P4000 Max-Q, i7-7700HQ, Toshiba NVMe THNSN5512GPU7
32 fps
3840x2160 crazy
MSI WS63VR 7RL-023US
Quadro P4000 Max-Q, i7-7700HQ, Toshiba NVMe THNSN5512GPU7
26 fps
Civilization VI
3840x2160 High Preset
MSI WS63VR 7RL-023US
Quadro P4000 Max-Q, i7-7700HQ, Toshiba NVMe THNSN5512GPU7
44 fps
1920x1080 Ultra Preset AA:4xMS
MSI WS63VR 7RL-023US
Quadro P4000 Max-Q, i7-7700HQ, Toshiba NVMe THNSN5512GPU7
60 fps
Fujitsu Celsius H970
Quadro P4000, E3-1535M v6, Samsung SM961 MZVKW512HMJP m.2 PCI-e
43.7 fps -27%
Lenovo ThinkPad P51s 20HB000SGE
Quadro M520, i7-7600U, Samsung SSD PM961 1TB M.2 PCIe 3.0 x4 NVMe (MZVLW1T0)
11.7 fps -80%
baixo média alto ultra4K
Batman: Arkham City (2011) 195 170 144 106
BioShock Infinite (2013) 256 218 202 113
Metro: Last Light (2013) 129 79 78 84
Company of Heroes 2 (2013) 69 63 62 50
Batman: Arkham Origins (2013) 330 270 177 82
Thief (2014) 96 94 93 79
Middle-earth: Shadow of Mordor (2014) 123 112 107 90
Alien: Isolation (2014) 250 212 192 148
Ryse: Son of Rome (2014) 121 111 88 82
The Witcher 3 (2015) 162 119 79 42 29
Batman: Arkham Knight (2015) 171 152 96 94 32
Metal Gear Solid V (2015) 60 60 60 60 50
Call of Duty: Black Ops 3 (2015) 145 133 85 82 32
Fallout 4 (2015) 156 151 93 76 30
Just Cause 3 (2015) 140 133 89 77 35
Rise of the Tomb Raider (2016) 176 144 77 65 28
Ashes of the Singularity (2016) 76 67 62 26
Doom (2016) 130 121 97 92 35
Deus Ex Mankind Divided (2016) 129 106 60 32 21
Mafia 3 (2016) 84 104 43 17
Civilization VI (2016) 80 76 63 60 44
Resident Evil 7 (2017) 354 195 161 135 60
Prey (2017) 142 129 125 109 38
Rocket League (2017) 244 223 163
Dirt 4 (2017) 220 164 93 55 34
F1 2017 (2017) 193 140 105 72 34
Ark Survival Evolved (2017) 92 52 51 27 27

Barulho

Ocioso
33.2 / 33.2 / 33.2 dB
Carga
41.4 / 43.5 dB
  red to green bar
 
 
30 dB
silencioso
40 dB(A)
audível
50 dB(A)
ruidosamente alto
 
min: dark, med: mid, max: light   BK Precision 732A (15 cm de distância)   environment noise: 28 dB(A)
MSI WS63VR 7RL-023US
Quadro P4000 Max-Q, i7-7700HQ, Toshiba NVMe THNSN5512GPU7
HP ZBook 15 G4-Y4E80AV
Quadro M2200, E3-1535M v6, Samsung SSD SM961 1TB M.2 MZVKW1T0HMLH
MSI WS63 7RF-290US
Quadro P3000, i7-7700HQ, Samsung SM961 MZVKW512HMJP m.2 PCI-e
Lenovo ThinkPad P51 20HH0016GE
Quadro M2200, E3-1505M v6, Samsung PM961 NVMe MZVLW512HMJP
Lenovo ThinkPad P51s 20HB000SGE
Quadro M520, i7-7600U, Samsung SSD PM961 1TB M.2 PCIe 3.0 x4 NVMe (MZVLW1T0)
Dell Precision 5520 UHD
Quadro M1200, E3-1505M v6, Samsung SM961 MZVKW512HMJP m.2 PCI-e
MSI GS63VR 7RF-228US
GeForce GTX 1060 Mobile, i7-7700HQ, Samsung SM961 MZVKW512HMJP m.2 PCI-e
MSI WT72-6QM
Quadro M5000M, E3-1505M v5, Toshiba NVMe THNSN5256GPU7
Noise
7%
6%
11%
8%
-1%
-3%
2%
off / environment *
28
29.5
-5%
28.1
-0%
29.6
-6%
29.2
-4%
28.7
-3%
28.8
-3%
Idle Minimum *
33.2
29.5
11%
28.1
15%
29.6
11%
29.2
12%
28.7
14%
33.1
-0%
33.3
-0%
Idle Average *
33.2
29.5
11%
28.1
15%
29.6
11%
29.2
12%
32.1
3%
33.1
-0%
33.4
-1%
Idle Maximum *
33.2
30
10%
32
4%
29.6
11%
31.1
6%
32.1
3%
34
-2%
33.5
-1%
Load Average *
41.4
39.5
5%
38
8%
32.2
22%
36.7
11%
41.3
-0%
37.2
10%
38.8
6%
Witcher 3 ultra *
38.4
39.5
-3%
35.8
7%
45.5
-18%
46.1
-20%
Load Maximum *
43.5
36
17%
47.2
-9%
36.6
16%
39.4
9%
45.5
-5%
47.1
-8%
40.2
8%

* ... smaller is better

 35.2 °C41 °C39.6 °C 
 34 °C37.4 °C45 °C 
 28.6 °C29.6 °C34.2 °C 
Máximo: 45 °C
Médio: 36.1 °C
42.4 °C56.8 °C37.4 °C
40.4 °C47 °C36.4 °C
35 °C34.8 °C31.8 °C
Máximo: 56.8 °C
Médio: 40.2 °C
alimentação elétrica  40.2 °C | Temperatura do quarto 22.4 °C | Fluke 62 Mini
(±) The average temperature for the upper side under maximal load is 36.1 °C / 97 F, compared to the average of 32 °C / 90 F for the devices in the class Workstation.
(±) The maximum temperature on the upper side is 45 °C / 113 F, compared to the average of 38.1 °C / 101 F, ranging from 22.2 to 69.8 °C for the class Workstation.
(-) The bottom heats up to a maximum of 56.8 °C / 134 F, compared to the average of 41.3 °C / 106 F
(+) In idle usage, the average temperature for the upper side is 25.9 °C / 79 F, compared to the device average of 32 °C / 90 F.
(±) Playing The Witcher 3, the average temperature for the upper side is 37.1 °C / 99 F, compared to the device average of 32 °C / 90 F.
(+) The palmrests and touchpad are reaching skin temperature as a maximum (35.4 °C / 95.7 F) and are therefore not hot.
(-) The average temperature of the palmrest area of similar devices was 27.8 °C / 82 F (-7.6 °C / -13.7 F).
dB(A) 0102030405060708090Deep BassMiddle BassHigh BassLower RangeMidsHigher MidsLower HighsMid HighsUpper HighsSuper Highs2036.437.82537.736.73139.139.74037.839.75035.237.46334.438.18033.638.810032.93912531.738.916030.339.420029.642.425028.445.431528.148.740027.650.25002751.563027.454.480028.260.8100027.266.6125025.669.316002561.4200024.558.2250024.455.3315024.453.9400024.256.1500023.956.7630023.855.7800023.854.41000023.7531250023.753.11600023.848.9SPL37.573.2N328median 25.6median 53.9Delta2.24.326.928.126.531.926.427.724.326.821.824.92425.422.326.72126.221.132.118.434.719.64017.742.517.345.516.946.217.250.316.550.516.252.116.754.517.256.417.553.117.755.117.851.617.949.217.853.51847.717.352.817.251.716.644.516.139.315.632.729.564.51.218.6median 17.3median 49.20.86.745.64345.638.335.938.336.535.936.535.734.235.735.433.235.433.934.333.936.835.136.846.732.646.753.731.153.758.23058.254.229.154.249.627.649.65427.95457.527.157.556.826.856.866.625.766.668.325.268.366.725.166.765.524.765.56925.16958.824.558.862.524.262.569.223.969.27223.97266.423.866.463.323.763.37123.67166.823.666.869.523.769.566.323.766.379.636.879.646.82.946.8median 65.5median 25.1median 65.56.31.36.3hearing rangehide median Pink NoiseMSI WS63VR 7RL-023USLenovo ThinkPad P51 20HH0016GEDell Precision 5520 UHD
MSI WS63VR 7RL-023US audio analysis

(±) | speaker loudness is average but good (73.2 dB)
Bass 100 - 315 Hz
(±) | reduced bass - on average 11.6% lower than median
(+) | bass is linear (6% delta to prev. frequency)
Mids 400 - 2000 Hz
(±) | higher mids - on average 6.7% higher than median
(±) | linearity of mids is average (14% delta to prev. frequency)
Highs 2 - 16 kHz
(+) | balanced highs - only 1.4% away from median
(+) | highs are linear (5.5% delta to prev. frequency)
Overall 100 - 16.000 Hz
(±) | linearity of overall sound is average (26% difference to median)
Compared to same class
» 84% of all tested devices in this class were better, 8% similar, 8% worse
» The best had a delta of 7%, average was 18%, worst was 35%
Compared to all devices tested
» 77% of all tested devices were better, 5% similar, 19% worse
» The best had a delta of 4%, average was 25%, worst was 134%

Lenovo ThinkPad P51 20HH0016GE audio analysis

(-) | not very loud speakers (64.5 dB)
Bass 100 - 315 Hz
(±) | reduced bass - on average 12.3% lower than median
(±) | linearity of bass is average (10.4% delta to prev. frequency)
Mids 400 - 2000 Hz
(+) | balanced mids - only 3.9% away from median
(+) | mids are linear (6.4% delta to prev. frequency)
Highs 2 - 16 kHz
(+) | balanced highs - only 2.7% away from median
(±) | linearity of highs is average (13.3% delta to prev. frequency)
Overall 100 - 16.000 Hz
(±) | linearity of overall sound is average (24.7% difference to median)
Compared to same class
» 82% of all tested devices in this class were better, 3% similar, 15% worse
» The best had a delta of 7%, average was 18%, worst was 35%
Compared to all devices tested
» 71% of all tested devices were better, 6% similar, 23% worse
» The best had a delta of 4%, average was 25%, worst was 134%

Dell Precision 5520 UHD audio analysis

(±) | speaker loudness is average but good (79.6 dB)
Bass 100 - 315 Hz
(±) | reduced bass - on average 12.8% lower than median
(±) | linearity of bass is average (14.2% delta to prev. frequency)
Mids 400 - 2000 Hz
(+) | balanced mids - only 4% away from median
(±) | linearity of mids is average (9.9% delta to prev. frequency)
Highs 2 - 16 kHz
(+) | balanced highs - only 3.3% away from median
(±) | linearity of highs is average (12% delta to prev. frequency)
Overall 100 - 16.000 Hz
(±) | linearity of overall sound is average (16.7% difference to median)
Compared to same class
» 37% of all tested devices in this class were better, 10% similar, 53% worse
» The best had a delta of 7%, average was 18%, worst was 35%
Compared to all devices tested
» 24% of all tested devices were better, 7% similar, 69% worse
» The best had a delta of 4%, average was 25%, worst was 134%

Consumo de energia
desligadodarklight 0.75 / 1.31 Watt
Ociosodarkmidlight 13.3 / 17.2 / 17.9 Watt
Carga midlight 83.7 / 114.3 Watt
 color bar
Key: min: dark, med: mid, max: light        Metrahit Energy
Currently we use the Metrahit Energy, a professional single phase power quality and energy measurement digital multimeter, for our measurements. Find out more about it here. All of our test methods can be found here.
MSI WS63VR 7RL-023US
i7-7700HQ, Quadro P4000 Max-Q, Toshiba NVMe THNSN5512GPU7, IPS, 3840x2160, 15.60
Fujitsu Celsius H970
E3-1535M v6, Quadro P4000, Samsung SM961 MZVKW512HMJP m.2 PCI-e, IPS LED, 1920x1080, 17.30
MSI WS63 7RF-290US
i7-7700HQ, Quadro P3000, Samsung SM961 MZVKW512HMJP m.2 PCI-e, IPS, 1920x1080, 15.60
MSI GS63VR 7RF-228US
i7-7700HQ, GeForce GTX 1060 Mobile, Samsung SM961 MZVKW512HMJP m.2 PCI-e, IPS, 3840x2160, 15.60
MSI WT72-6QM
E3-1505M v5, Quadro M5000M, Toshiba NVMe THNSN5256GPU7, IPS, 1920x1080, 17.30
HP ZBook 15 G4-Y4E80AV
E3-1535M v6, Quadro M2200, Samsung SSD SM961 1TB M.2 MZVKW1T0HMLH, IPS, 1920x1080, 15.60
Lenovo ThinkPad P51 20HH0016GE
E3-1505M v6, Quadro M2200, Samsung PM961 NVMe MZVLW512HMJP, IPS, 3840x2160, 15.60
Lenovo ThinkPad P51s 20HB000SGE
i7-7600U, Quadro M520, Samsung SSD PM961 1TB M.2 PCIe 3.0 x4 NVMe (MZVLW1T0), IPS, 3840x2160, 15.60
Dell Precision 5520 UHD
E3-1505M v6, Quadro M1200, Samsung SM961 MZVKW512HMJP m.2 PCI-e, IPS, 3840x2160, 15.60
Power Consumption
-0%
5%
-9%
-64%
16%
1%
36%
8%
Idle Minimum *
13.3
10.7
20%
11
17%
14.5
-9%
24.8
-86%
5.9
56%
8.6
35%
5.8
56%
8.9
33%
Idle Average *
17.2
15.8
8%
14.2
17%
17.3
-1%
29.7
-73%
8.9
48%
15.9
8%
10.4
40%
13.6
21%
Idle Maximum *
17.9
17.8
1%
14.6
18%
17.4
3%
30.1
-68%
12.7
29%
22.1
-23%
13.5
25%
14.1
21%
Load Average *
83.7
92
-10%
77.7
7%
93
-11%
105.2
-26%
95.2
-14%
84.4
-1%
62.4
25%
100.3
-20%
Witcher 3 ultra *
101.9
89.1
13%
128.8
-26%
87.7
14%
100.2
2%
Load Maximum *
114.3
137
-20%
161.7
-41%
192.2
-68%
154
-35%
130.6
-14%
73.1
36%
126.3
-10%

* ... smaller is better

Tempo de Execução da Bateria
Ocioso (sem WLAN, min brilho)
3h 55min
WiFi Websurfing
2h 55min
Carga (máximo brilho)
0h 54min
MSI WS63VR 7RL-023US
i7-7700HQ, Quadro P4000 Max-Q, 48 Wh
MSI WS63 7RF-290US
i7-7700HQ, Quadro P3000, 65 Wh
Lenovo ThinkPad P51 20HH0016GE
E3-1505M v6, Quadro M2200, 90 Wh
Lenovo ThinkPad P51s 20HB000SGE
i7-7600U, Quadro M520, 104 Wh
Dell Precision 5520 UHD
E3-1505M v6, Quadro M1200, 97 Wh
MSI GS63VR 7RF-228US
i7-7700HQ, GeForce GTX 1060 Mobile, 65 Wh
MSI WT72-6QM
E3-1505M v5, Quadro M5000M,  Wh
Battery Runtime
58%
176%
459%
89%
45%
52%
Reader / Idle
235
427
82%
981
317%
1581
573%
724
208%
386
64%
413
76%
WiFi v1.3
175
284
62%
413
136%
712
307%
254
45%
232
33%
245
40%
Load
54
70
30%
95
76%
323
498%
61
13%
75
39%
76
41%

Pro

+ O design Max-Q melhora muito o gerenciamento térmico com perda mínima no desempenho
+ As velocidades do leitor de cartões SD estão muito melhores em relação às máquinas MSI anteriores
+ O ruído da ventoinha é razoavelmente baixo
+ Design fino, leve e atraente da carcaça design
+ 3 anos de garantia padrão
+ Teclado com excelente iluminação RGB
+ Sem afogamentos discerníveis da CPU ou GPU
+ Hi-Fi audio DAC
+ Seleção generosa de portas com Thunderbolt 3

Contra

- Os recursos comuns em um workstation estão ausentes (Smart Card, ExpressCard, SIM)
- O chassi pode se flexionar sob pressão, especialmente a tampa
- As ventoinhas emitem uma frequência alta e sempre presente
- Leve ruído da bobina
- A manutenção feita pelo usuário final pode anular a garantia
- Duração pobre da bateria
In review: MSI WS63VR 7RL-023US. Review unit courtesy of MSI.

MSI WS63VR é um excelente exemplo do que o Max-Q tem para oferecer para o segmento profissional. O Nvidia Quadro P4000 Max-Q oferece desempenho incrível considerando a baixa produção de calor e o TDP de 80 Watts; desempenho em par com o P4000 padrão e milhas à frente do Quadro M5000M do ano passado. O calor também é muito bem gerenciado, o qual é o maior destaque em um chassi tão fino e leve. Combine este desempenho com um teclado excelente, quase todos os tipos de conexão imagináveis, e um corpo maravilhosamente projetado e móvel, e a MSI tem um vencedor claro aqui.

As principais desvantagens continuam a partir de outras máquinas MSI: o trackpad intermédio é agravante e fará com que os usuários busquem um mouse externo, a tela é escura e não reproduz as cores de outras máquinas e a duração da bateria é quase inexcusável. Os fotógrafos profissionais que dependem de um espaço de cores preciso e amplo e uma longa duração da bateria para o trabalho de campo terão vontade de olhar além do WS63VR para outras máquinas, particularmente para o Lenovo ThinkPad P51. A perda de desempenho pode ser uma compensação digna para melhorar a duração da bateria e uma tela com cores incrivelmente precisas.

No entanto, os trabalhadores de escritório podem querer dar a uma repensada no MSI. Neste nível de preços (~ USD $3400), a escolha de um workstation móvel requer um investimento pesado. Engenheiros, cientistas, profissionais médicos e outros usuários que precisam de uma GPU poderosa, confiável e bom suporte  nunca tiveram uma decisão mais difícil antes deles. A MSI criou um concorrente difícil para os campeões reinantes da Lenovo, Dell e HP e certamente roubará alguma participação de mercado. Potenciais compradores podem querer considerar economizar algum dinheiro e optar por uma tela Full HD; um painel de resolução inferior provavelmente irá melhorar a vida útil da bateria e tirar uma carga adicional da GPU. Os gamers também irão querer manter seus olhos sobre o MSI GS63VR, que provavelmente será atualizado com GPUs Max-Q no futuro próximo. O Asus Zephyrus GX501 é outro aparelho leve e fino que também oferece uma GPU com design Max-Q. 

O MSX WS63VR é um exemplar dos benefícios trazidos pelo design Max-Q da Nvidia. Por um pequeno aumento no desempenho, as GPUs são mais capazes de gerenciar as temperaturas e exigem menos energia visivelmente. Se você pode comprometer-se com uma tela ligeiramente mais fraca, um trackpad um pouco menos preciso, e está perto de uma tomada a maior parte do dia, o WS63VR é uma estação de trabalho que vale a pena considerar. É um momento emocionante para máquinas finas e leves e Max-Q pode ser o primeiro passo para tornar o formato totalmente viável como um substituto de desktop.

MSI WS63VR 7RL-023US - 09/18/2017 v6(old)
Sam Medley
Acabamento
80 / 98 → 82%
Teclado
81%
Mouse
79%
Conectividade
68 / 81 → 84%
Peso
64 / 10-66 → 96%
Bateria
69%
Pantalha
85%
Desempenho do jogos
93%
Desempenho da aplicação
90%
Temperatura
84 / 95 → 89%
Ruído
80 / 90 → 89%
Audio
66%
Camera
55 / 85 → 65%
Médio
78%
86%
Workstation - Médio equilibrado

Pricecompare

Please share our article, every link counts!
> Análises e revisões de portáteis e celulares > Análises > Análises > Breve Análise do Portátil MSI WS63VR (i7-7700HQ, 4K, Quadro P4000 Max-Q)
Sam Medley, 2017-09-24 (Update: 2017-10- 4)