Breve Análise do Workstation Dell Precision 5520 (E3-1505M, UHD)


| SD Card Reader | |
| average JPG Copy Test (av. of 3 runs) | |
| Dell Precision 5520 UHD | |
| Dell Precision 3510 | |
| Dell Precision 7510 (4K IGZO) | |
| Lenovo ThinkPad P50 | |
| Fujitsu Celsius H760 | |
| maximum AS SSD Seq Read Test (1GB) | |
| Dell Precision 5520 UHD | |
| Dell Precision 3510 | |
| Lenovo ThinkPad P50 | |
| Fujitsu Celsius H760 | |
| Networking | |
| iperf3 transmit AX12 | |
| Dell Precision 5520 UHD | |
| iperf3 receive AX12 | |
| Dell Precision 5520 UHD | |
| |||||||||||||||||||||||||
iluminação: 90 %
iluminação com acumulador: 372.4 cd/m²
Contraste: 776:1 (Preto: 0.48 cd/m²)
ΔE ColorChecker Calman: 2.6 | ∀{0.5-29.43 Ø4.72}
ΔE Greyscale Calman: 3.7 | ∀{0.09-98 Ø4.97}
99% sRGB (Argyll 1.6.3 3D)
63% AdobeRGB 1998 (Argyll 1.6.3 3D)
68.9% AdobeRGB 1998 (Argyll 3D)
98.5% sRGB (Argyll 3D)
67.4% Display P3 (Argyll 3D)
Gamma: 2.14
CCT: 7096 K
| Dell Precision 5520 UHD SHP1476, IPS, 15.6", 3840x2160 | Dell Precision 5510 SHP143E, 7PHPT_LQ156D1, IGZO LED, 15.6", 3840x2160 | Fujitsu Celsius H760 LGD046F LP156WF6-SPP1, IPS LED, 15.6", 1920x1080 | Dell Precision 7510 (4K IGZO) Sharp LQ156D1, IGZO IPS, 15.6", 3840x2160 | Lenovo ThinkPad P50 LQ156D1JW05, IPS, 15.6", 3840x2160 | |
|---|---|---|---|---|---|
| Display | 26% | -11% | 24% | 23% | |
| Display P3 Coverage (%) | 67.4 | 88.4 31% | 63.9 -5% | 86.2 28% | 85.8 27% |
| sRGB Coverage (%) | 98.5 | 100 2% | 82.4 -16% | 99.7 1% | 98.6 0% |
| AdobeRGB 1998 Coverage (%) | 68.9 | 99.5 44% | 60.3 -12% | 99 44% | 98.2 43% |
| Response Times | 12% | 37% | 33% | 41% | |
| Response Time Grey 50% / Grey 80% * (ms) | 59.2 ? | 56.4 ? 5% | 38 ? 36% | 40.4 ? 32% | 39.2 ? 34% |
| Response Time Black / White * (ms) | 41.6 ? | 34 ? 18% | 26 ? 37% | 27.6 ? 34% | 22 ? 47% |
| PWM Frequency (Hz) | 198.4 ? | 217 | |||
| Screen | 0% | -10% | -1% | -23% | |
| Brightness middle (cd/m²) | 372.4 | 391 5% | 341 -8% | 279.2 -25% | 250 -33% |
| Brightness (cd/m²) | 368 | 361 -2% | 310 -16% | 271 -26% | 250 -32% |
| Brightness Distribution (%) | 90 | 87 -3% | 82 -9% | 83 -8% | 86 -4% |
| Black Level * (cd/m²) | 0.48 | 0.4 17% | 0.34 29% | 0.266 45% | 0.31 35% |
| Contrast (:1) | 776 | 978 26% | 1003 29% | 1050 35% | 806 4% |
| Colorchecker dE 2000 * | 2.6 | 4.85 -87% | 3.8 -46% | 4.14 -59% | 4.5 -73% |
| Colorchecker dE 2000 max. * | 5.6 | 10.8 -93% | 6.56 -17% | 9.3 -66% | |
| Greyscale dE 2000 * | 3.7 | 4.01 -8% | 2 46% | 3.26 12% | 7.2 -95% |
| Gamma | 2.14 103% | 2.18 101% | 2.17 101% | 2.19 100% | 2.31 95% |
| CCT | 7096 92% | 7340 89% | 6581 99% | 6375 102% | 6399 102% |
| Color Space (Percent of AdobeRGB 1998) (%) | 63 | 96 52% | 54 -14% | 85.68 36% | 85 35% |
| Color Space (Percent of sRGB) (%) | 99 | 100 1% | 82.2 -17% | 99.72 1% | 98.6 0% |
| Média Total (Programa/Configurações) | 13% /
7% | 5% /
-4% | 19% /
9% | 14% /
-5% |
* ... menor é melhor
Exibir tempos de resposta
| ↔ Tempo de resposta preto para branco | ||
|---|---|---|
| 41.6 ms ... ascensão ↗ e queda ↘ combinadas | ↗ 26.8 ms ascensão | 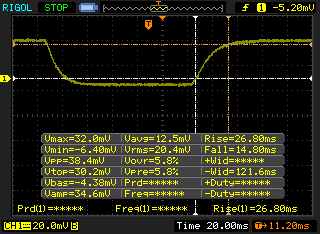 |
| ↘ 14.8 ms queda | ||
| A tela mostra taxas de resposta lentas em nossos testes e será insatisfatória para os jogadores. Em comparação, todos os dispositivos testados variam de 0.1 (mínimo) a 240 (máximo) ms. » 98 % de todos os dispositivos são melhores. Isso significa que o tempo de resposta medido é pior que a média de todos os dispositivos testados (19.8 ms). | ||
| ↔ Tempo de resposta 50% cinza a 80% cinza | ||
| 59.2 ms ... ascensão ↗ e queda ↘ combinadas | ↗ 27.6 ms ascensão | 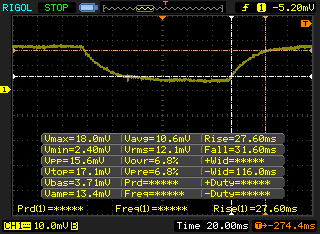 |
| ↘ 31.6 ms queda | ||
| A tela mostra taxas de resposta lentas em nossos testes e será insatisfatória para os jogadores. Em comparação, todos os dispositivos testados variam de 0.165 (mínimo) a 636 (máximo) ms. » 95 % de todos os dispositivos são melhores. Isso significa que o tempo de resposta medido é pior que a média de todos os dispositivos testados (31 ms). | ||
Cintilação da tela / PWM (modulação por largura de pulso)
| Tela tremeluzindo / PWM não detectado | 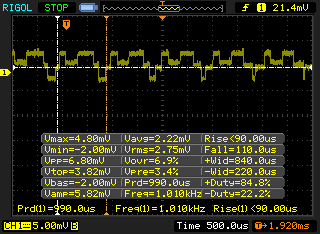 | ||
[pwm_comparison] Em comparação: 52 % de todos os dispositivos testados não usam PWM para escurecer a tela. Se PWM foi detectado, uma média de 7769 (mínimo: 5 - máximo: 343500) Hz foi medida. | |||
| wPrime 2.10 - 1024m | |
| Dell Precision 7510 (4K IGZO) | |
| Dell Precision 5520 UHD | |
| Dell Precision 5510 | |
| Dell XPS 15 9560 (i7-7700HQ, UHD) | |
* ... menor é melhor
| PCMark 8 Home Score Accelerated v2 | 3504 pontos | |
| PCMark 8 Creative Score Accelerated v2 | 5086 pontos | |
| PCMark 8 Work Score Accelerated v2 | 4291 pontos | |
Ajuda | ||
| Dell Precision 5520 UHD Samsung SM961 MZVKW512HMJP m.2 PCI-e | Dell Precision 7510 (4K IGZO) Samsung SSD SM951a 512GB M.2 PCIe 3.0 x4 NVMe (MZVKV512) | Lenovo ThinkPad P50 Samsung SM951 MZVPV256HDGL m.2 PCI-e | HP ZBook Studio G3 Samsung SM951 MZVPV512HDGL m.2 PCI-e | Dell XPS 15 9560 (i7-7700HQ, UHD) Lite-On CX2-8B512-Q11 | |
|---|---|---|---|---|---|
| CrystalDiskMark 3.0 | 11% | 28% | 22% | -7% | |
| Read Seq (MB/s) | 2253 | 1648 -27% | 1771 -21% | 1578 -30% | 1684 -25% |
| Write Seq (MB/s) | 1662 | 1575 -5% | 1304 -22% | 1557 -6% | 1106 -33% |
| Read 512 (MB/s) | 459.1 | 1155 152% | 1364 197% | 1234 169% | 977 113% |
| Write 512 (MB/s) | 1611 | 1561 -3% | 1291 -20% | 1391 -14% | 1119 -31% |
| Read 4k (MB/s) | 56.1 | 53 -6% | 60.2 7% | 59.9 7% | 45.14 -20% |
| Write 4k (MB/s) | 169.4 | 158.9 -6% | 256.7 52% | 225.6 33% | 134.1 -21% |
| Read 4k QD32 (MB/s) | 633 | 623 -2% | 953 51% | 946 49% | 509 -20% |
| Write 4k QD32 (MB/s) | 506 | 423 -16% | 389.6 -23% | 359 -29% | 398.1 -21% |

| 3DMark 11 | |
| 1280x720 Performance GPU | |
| Lenovo ThinkPad P50 | |
| Dell Precision 5520 UHD | |
| Dell Precision 7510 (4K IGZO) | |
| Dell Precision 5510 | |
| 1280x720 Performance Combined | |
| Dell Precision 5520 UHD | |
| Lenovo ThinkPad P50 | |
| Dell Precision 7510 (4K IGZO) | |
| Dell Precision 5510 | |
| 3DMark | |
| 1280x720 Cloud Gate Standard Graphics | |
| Dell XPS 15 9560 (i7-7700HQ, UHD) | |
| Fujitsu Celsius H760 | |
| Dell Precision 5520 UHD | |
| Dell Precision 7510 (4K IGZO) | |
| Lenovo ThinkPad P50 | |
| Dell Precision 5510 | |
| Dell Precision 3510 | |
| 1920x1080 Fire Strike Graphics | |
| Dell XPS 15 9560 (i7-7700HQ, UHD) | |
| Dell Precision 7510 (4K IGZO) | |
| Dell Precision 5520 UHD | |
| Lenovo ThinkPad P50 | |
| Fujitsu Celsius H760 | |
| Dell Precision 5510 | |
| Dell Precision 3510 | |
| 1920x1080 Ice Storm Extreme Graphics | |
| Dell XPS 15 9560 (i7-7700HQ, UHD) | |
| Dell Precision 5520 UHD | |
| 3DMark 06 Standard Score | 26109 pontos | |
| 3DMark 11 Performance | 5513 pontos | |
| 3DMark Ice Storm Standard Score | 57997 pontos | |
| 3DMark Cloud Gate Standard Score | 12632 pontos | |
| 3DMark Fire Strike Score | 3759 pontos | |
| 3DMark Fire Strike Extreme Score | 1919 pontos | |
Ajuda | ||
| Doom | |
| 3840x2160 High Preset AA:FX (classificar por valor) | |
| Dell Precision 5520 UHD | |
| Dell XPS 15 9560 (i7-7700HQ, UHD) | |
| 1920x1080 Ultra Preset AA:SM (classificar por valor) | |
| Dell Precision 5520 UHD | |
| Dell XPS 15 9560 (i7-7700HQ, UHD) | |
| 1920x1080 High Preset AA:FX (classificar por valor) | |
| Dell Precision 5520 UHD | |
| Dell XPS 15 9560 (i7-7700HQ, UHD) | |
| 1366x768 Medium Preset (classificar por valor) | |
| Dell Precision 5520 UHD | |
| 1280x720 Low Preset (classificar por valor) | |
| Dell Precision 5520 UHD | |
| Batman: Arkham Knight | |
| 3840x2160 High / On (Interactive Smoke & Paper Debris Off) AA:SM AF:8x (classificar por valor) | |
| Dell Precision 5520 UHD | |
| Dell XPS 15 9560 (i7-7700HQ, UHD) | |
| 1920x1080 High / On AA:SM AF:16x (classificar por valor) | |
| Dell Precision 5520 UHD | |
| Dell XPS 15 9560 (i7-7700HQ, UHD) | |
| 1920x1080 High / On (Interactive Smoke & Paper Debris Off) AA:SM AF:8x (classificar por valor) | |
| Dell Precision 5520 UHD | |
| Dell XPS 15 9560 (i7-7700HQ, UHD) | |
| 1366x768 Normal / Off AF:4x (classificar por valor) | |
| Dell Precision 5520 UHD | |
| Dell XPS 15 9560 (i7-7700HQ, UHD) | |
| 1280x720 Low / Off AF:Trilinear (classificar por valor) | |
| Dell Precision 5520 UHD | |
| baixo | média | alto | ultra | 4K | |
|---|---|---|---|---|---|
| BioShock Infinite (2013) | 189 | 137 | 125 | 47 | |
| The Witcher 3 (2015) | 29 | ||||
| Batman: Arkham Knight (2015) | 74 | 63 | 35 | 29 | 11 |
| Doom (2016) | 79 | 66 | 37 | 34 | 12 |
Barulho
| Ocioso |
| 28.7 / 32.1 / 32.1 dB |
| Carga |
| 41.3 / 45.5 dB |
 | ||
30 dB silencioso 40 dB(A) audível 50 dB(A) ruidosamente alto |
||
min: | ||
| Dell Precision 5520 UHD Quadro M1200, E3-1505M v6, Samsung SM961 MZVKW512HMJP m.2 PCI-e | Fujitsu Celsius H760 Quadro M2000M, E3-1505M v5, Samsung SM951 MZVPV512 m.2 PCI-e | Dell Precision 7510 (4K IGZO) Quadro M2000M, E3-1535M v5, Samsung SSD SM951a 512GB M.2 PCIe 3.0 x4 NVMe (MZVKV512) | Dell Precision 3510 FirePro W5130M, 6700HQ, Samsung SM951 MZVPV256HDGL m.2 PCI-e | Lenovo ThinkPad P50 Quadro M2000M, E3-1505M v5, Samsung SM951 MZVPV256HDGL m.2 PCI-e | Dell Precision 5510 Quadro M1000M, E3-1505M v5, SK hynix SC920 512 GB | |
|---|---|---|---|---|---|---|
| Noise | 1% | 2% | 2% | 2% | 1% | |
| desligado / ambiente * (dB) | 28.7 | 29 -1% | 28.2 2% | 30 -5% | 30 -5% | |
| Idle Minimum * (dB) | 28.7 | 29 -1% | 29.8 -4% | 30 -5% | 30 -5% | 30 -5% |
| Idle Average * (dB) | 32.1 | 29 10% | 29.8 7% | 30 7% | 30 7% | 30 7% |
| Idle Maximum * (dB) | 32.1 | 29 10% | 31.2 3% | 30 7% | 30 7% | 30 7% |
| Load Average * (dB) | 41.3 | 43.1 -4% | 37.2 10% | 38.1 8% | 42.1 -2% | 42.08 -2% |
| Witcher 3 ultra * (dB) | 45.5 | |||||
| Load Maximum * (dB) | 45.5 | 49.2 -8% | 49.4 -9% | 44.4 2% | 42.1 7% | 46.78 -3% |
* ... menor é melhor
(-) A temperatura máxima no lado superior é 51.6 °C / 125 F, em comparação com a média de 38.2 °C / 101 F , variando de 22.2 a 69.8 °C para a classe Workstation.
(±) A parte inferior aquece até um máximo de 43.6 °C / 110 F, em comparação com a média de 41.1 °C / 106 F
(+) Em uso inativo, a temperatura média para o lado superior é 25.3 °C / 78 F, em comparação com a média do dispositivo de 32 °C / ### class_avg_f### F.
(±) Jogando The Witcher 3, a temperatura média para o lado superior é 34.6 °C / 94 F, em comparação com a média do dispositivo de 32 °C / ## #class_avg_f### F.
(+) Os apoios para as mãos e o touchpad são mais frios que a temperatura da pele, com um máximo de 28.4 °C / 83.1 F e, portanto, são frios ao toque.
(±) A temperatura média da área do apoio para as mãos de dispositivos semelhantes foi 27.8 °C / 82 F (-0.6 °C / -1.1 F).
Dell Precision 5520 UHD análise de áudio
(±) | o volume do alto-falante é médio, mas bom (###valor### dB)
Graves 100 - 315Hz
(±) | graves reduzidos - em média 12.8% menor que a mediana
(±) | a linearidade dos graves é média (14.2% delta para a frequência anterior)
Médios 400 - 2.000 Hz
(+) | médios equilibrados - apenas 4% longe da mediana
(±) | a linearidade dos médios é média (9.9% delta para frequência anterior)
Altos 2 - 16 kHz
(+) | agudos equilibrados - apenas 3.3% longe da mediana
(±) | a linearidade dos máximos é média (12% delta para frequência anterior)
Geral 100 - 16.000 Hz
(±) | a linearidade do som geral é média (16.7% diferença em relação à mediana)
Comparado com a mesma classe
» 46% de todos os dispositivos testados nesta classe foram melhores, 9% semelhantes, 45% piores
» O melhor teve um delta de 7%, a média foi 17%, o pior foi 35%
Comparado com todos os dispositivos testados
» 29% de todos os dispositivos testados foram melhores, 7% semelhantes, 64% piores
» O melhor teve um delta de 4%, a média foi 24%, o pior foi 134%
Apple MacBook 12 (Early 2016) 1.1 GHz análise de áudio
(+) | os alto-falantes podem tocar relativamente alto (###valor### dB)
Graves 100 - 315Hz
(±) | graves reduzidos - em média 11.3% menor que a mediana
(±) | a linearidade dos graves é média (14.2% delta para a frequência anterior)
Médios 400 - 2.000 Hz
(+) | médios equilibrados - apenas 2.4% longe da mediana
(+) | médios são lineares (5.5% delta para frequência anterior)
Altos 2 - 16 kHz
(+) | agudos equilibrados - apenas 2% longe da mediana
(+) | os máximos são lineares (4.5% delta da frequência anterior)
Geral 100 - 16.000 Hz
(+) | o som geral é linear (10.2% diferença em relação à mediana)
Comparado com a mesma classe
» 7% de todos os dispositivos testados nesta classe foram melhores, 2% semelhantes, 91% piores
» O melhor teve um delta de 5%, a média foi 18%, o pior foi 53%
Comparado com todos os dispositivos testados
» 5% de todos os dispositivos testados foram melhores, 1% semelhantes, 94% piores
» O melhor teve um delta de 4%, a média foi 24%, o pior foi 134%
| desligado | |
| Ocioso | |
| Carga |
|
Key:
min: | |
| Dell Precision 5520 UHD E3-1505M v6, Quadro M1200, Samsung SM961 MZVKW512HMJP m.2 PCI-e, IPS, 3840x2160, 15.6" | Fujitsu Celsius H760 E3-1505M v5, Quadro M2000M, Samsung SM951 MZVPV512 m.2 PCI-e, IPS LED, 1920x1080, 15.6" | Dell Precision 7510 (4K IGZO) E3-1535M v5, Quadro M2000M, Samsung SSD SM951a 512GB M.2 PCIe 3.0 x4 NVMe (MZVKV512), IGZO IPS, 3840x2160, 15.6" | Dell Precision 3510 6700HQ, FirePro W5130M, Samsung SM951 MZVPV256HDGL m.2 PCI-e, TN LED, 1366x768, 15.6" | Lenovo ThinkPad P50 E3-1505M v5, Quadro M2000M, Samsung SM951 MZVPV256HDGL m.2 PCI-e, IPS, 3840x2160, 15.6" | Dell Precision 5510 E3-1505M v5, Quadro M1000M, SK hynix SC920 512 GB, IGZO LED, 3840x2160, 15.6" | |
|---|---|---|---|---|---|---|
| Power Consumption | 8% | -83% | 42% | -10% | -4% | |
| Idle Minimum * (Watt) | 8.9 | 7.7 13% | 23.9 -169% | 4.2 53% | 10.2 -15% | 8.6 3% |
| Idle Average * (Watt) | 13.6 | 11.8 13% | 28.9 -113% | 6.5 52% | 17.8 -31% | 16.2 -19% |
| Idle Maximum * (Watt) | 14.1 | 12.9 9% | 30 -113% | 7.1 50% | 18.3 -30% | 16.7 -18% |
| Load Average * (Watt) | 100.3 | 90.2 10% | 95.2 5% | 74.6 26% | 76.9 23% | 82.6 18% |
| Witcher 3 ultra * (Watt) | 100.2 | |||||
| Load Maximum * (Watt) | 126.3 | 130.8 -4% | 157.1 -24% | 92.2 27% | 123.5 2% | 131.8 -4% |
* ... menor é melhor
| Dell Precision 5520 UHD E3-1505M v6, Quadro M1200, 97 Wh | Fujitsu Celsius H760 E3-1505M v5, Quadro M2000M, 72 Wh | Dell Precision 7510 (4K IGZO) E3-1535M v5, Quadro M2000M, 91 Wh | Dell Precision 3510 6700HQ, FirePro W5130M, 84 Wh | Lenovo ThinkPad P50 E3-1505M v5, Quadro M2000M, 90 Wh | Dell XPS 15 9560 (i7-7700HQ, UHD) i7-7700HQ, GeForce GTX 1050 Mobile, 97 Wh | Dell Precision 5510 E3-1505M v5, Quadro M1000M, 56 Wh | |
|---|---|---|---|---|---|---|---|
| Duração da bateria | 30% | -16% | 96% | 16% | 52% | 18% | |
| Reader / Idle (h) | 12.1 | 9.3 -23% | 4.5 -63% | 19.5 61% | 9 -26% | 13.9 15% | 7.1 -41% |
| WiFi v1.3 (h) | 4.2 | 5.6 33% | 4 -5% | 9.9 136% | 4.8 14% | 7.2 71% | 4.8 14% |
| Load (h) | 1 | 1.8 80% | 1.2 20% | 1.9 90% | 1.6 60% | 1.7 70% | 1.8 80% |
| WiFi (h) | 5 |
Pro
Contra
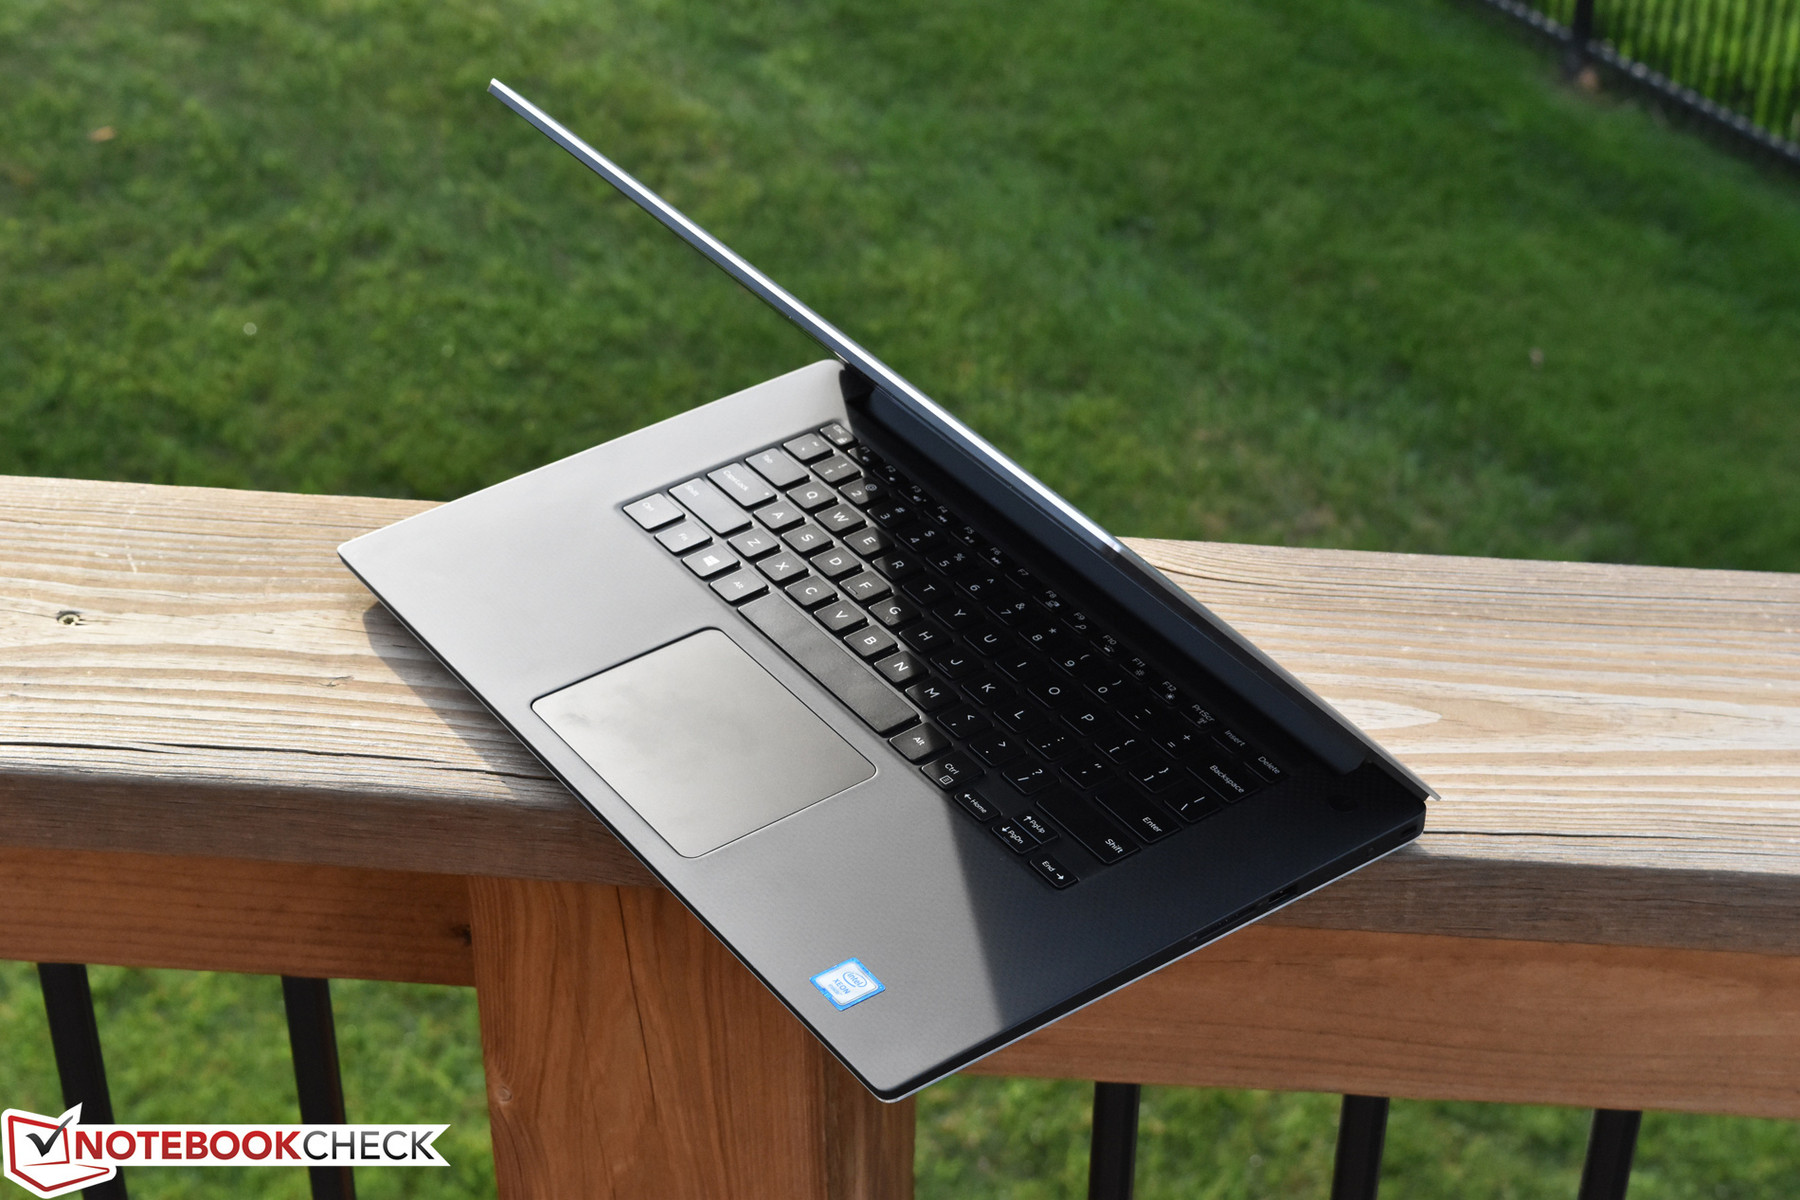
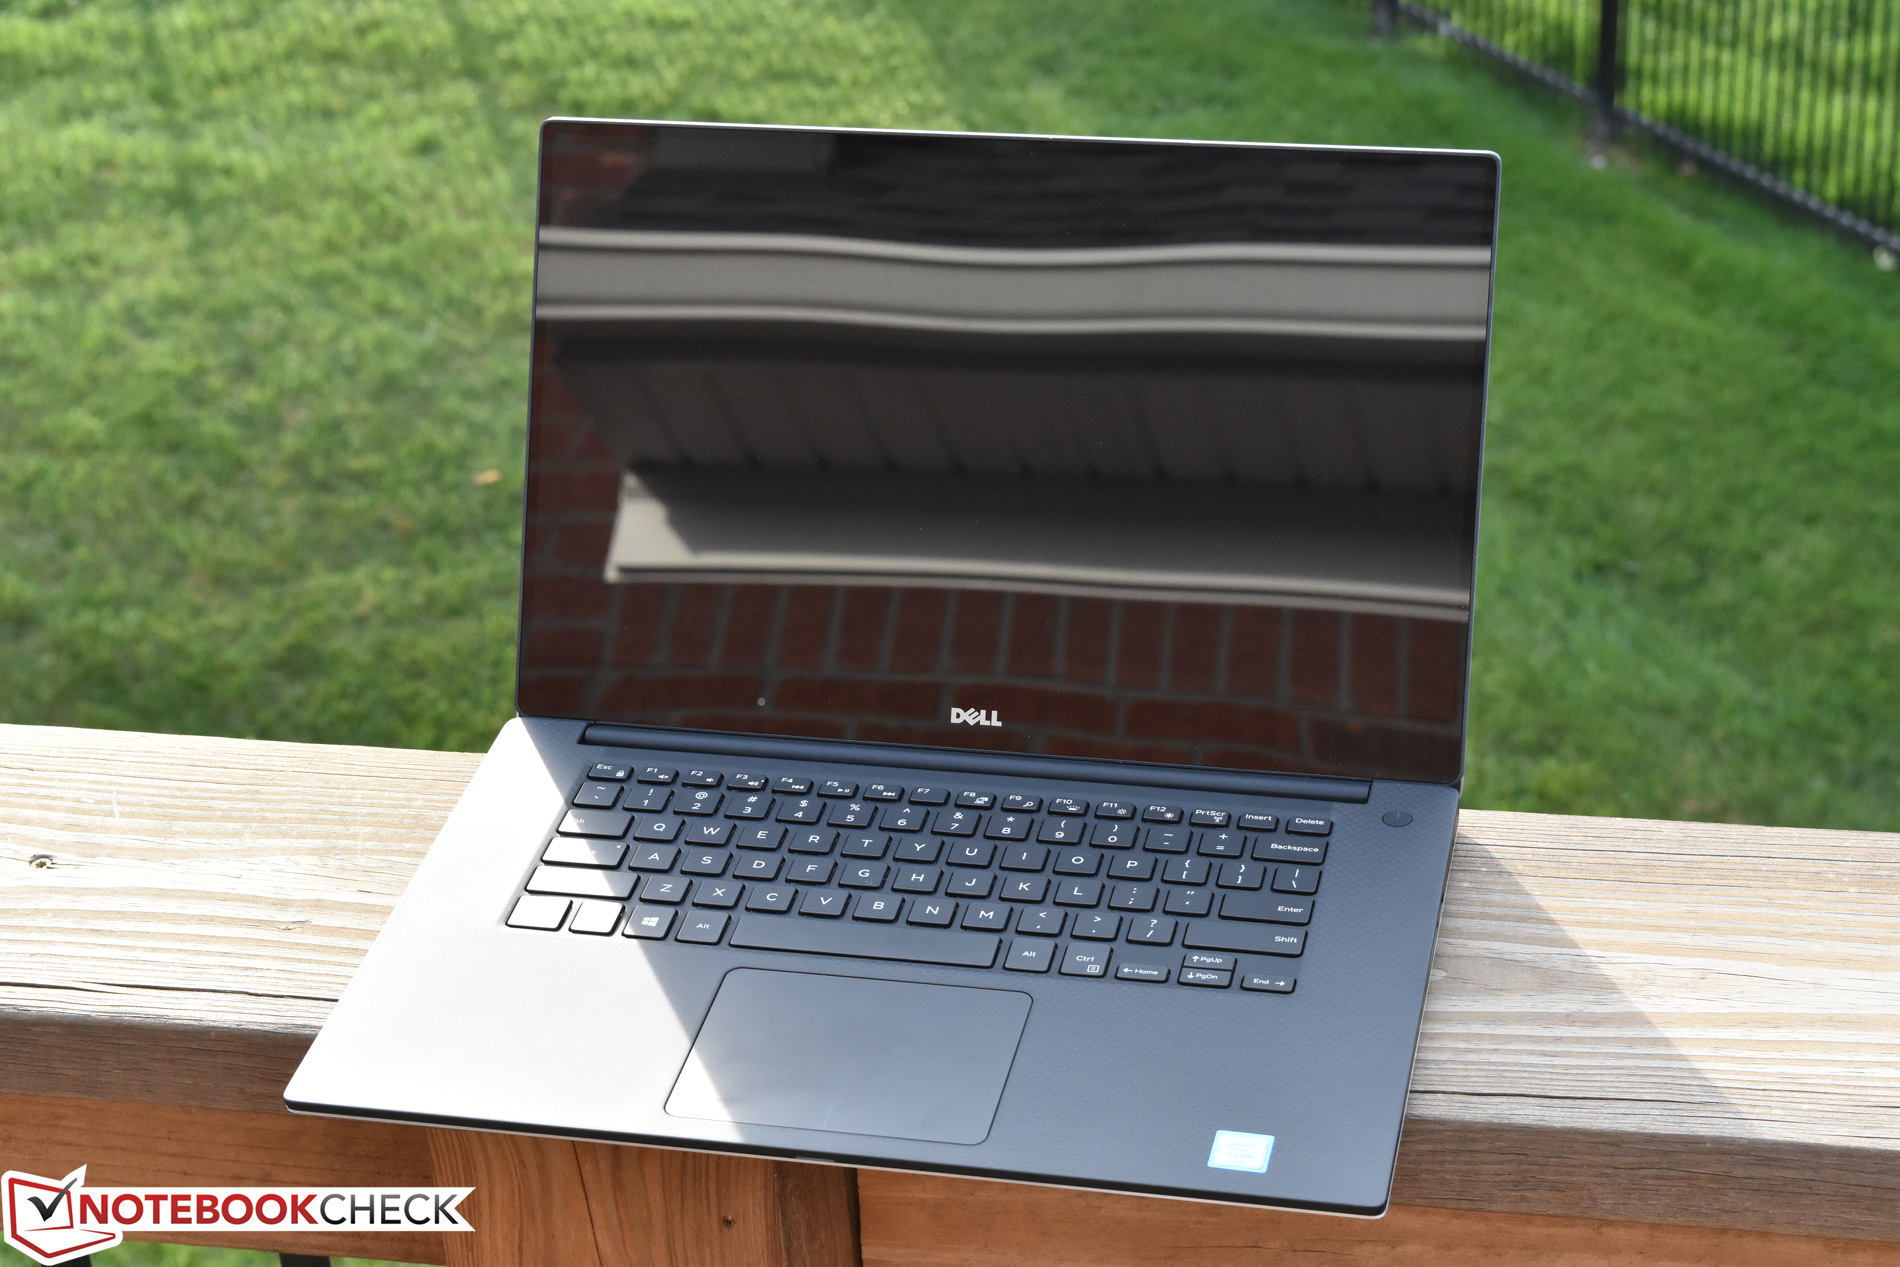
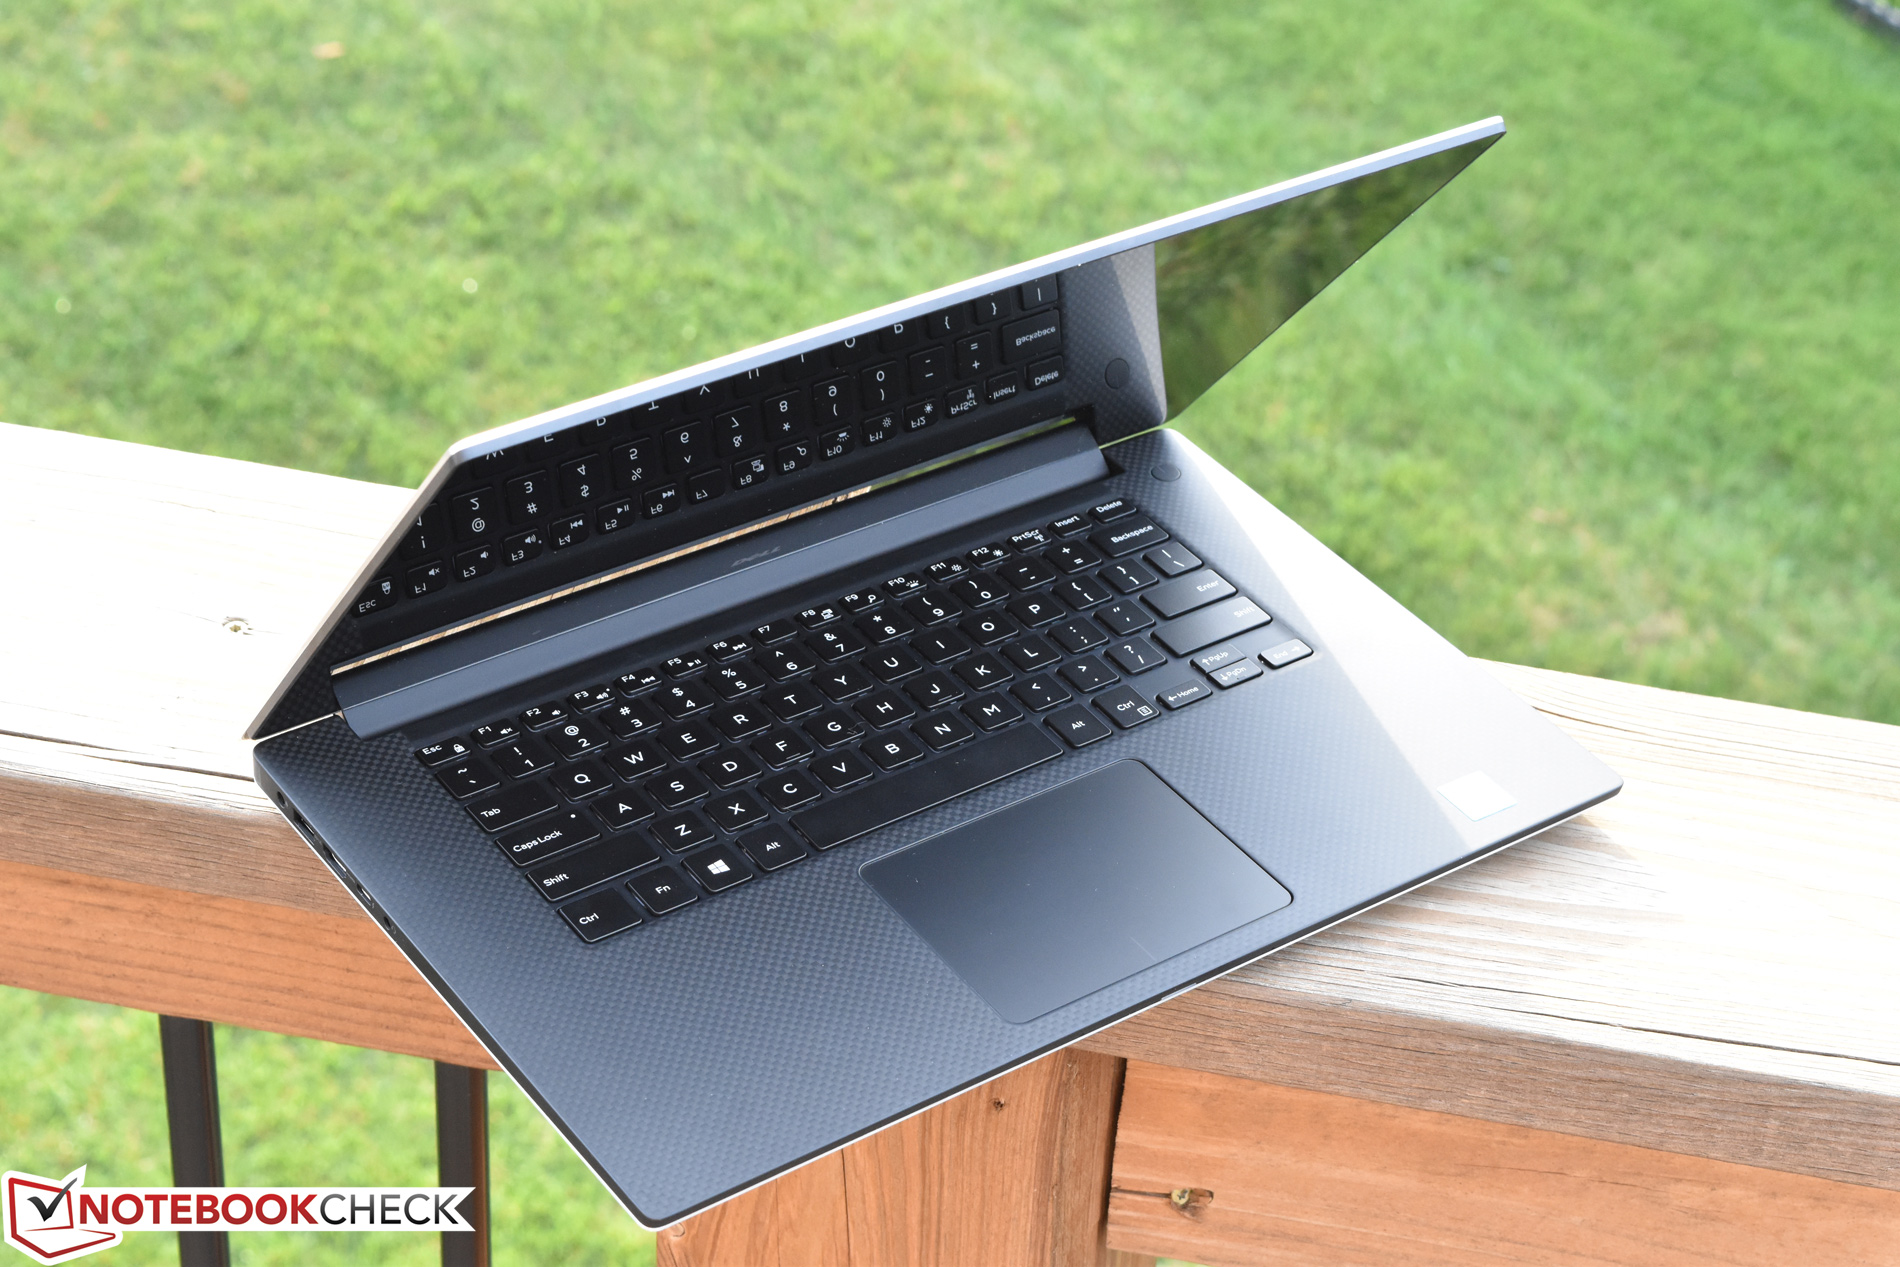
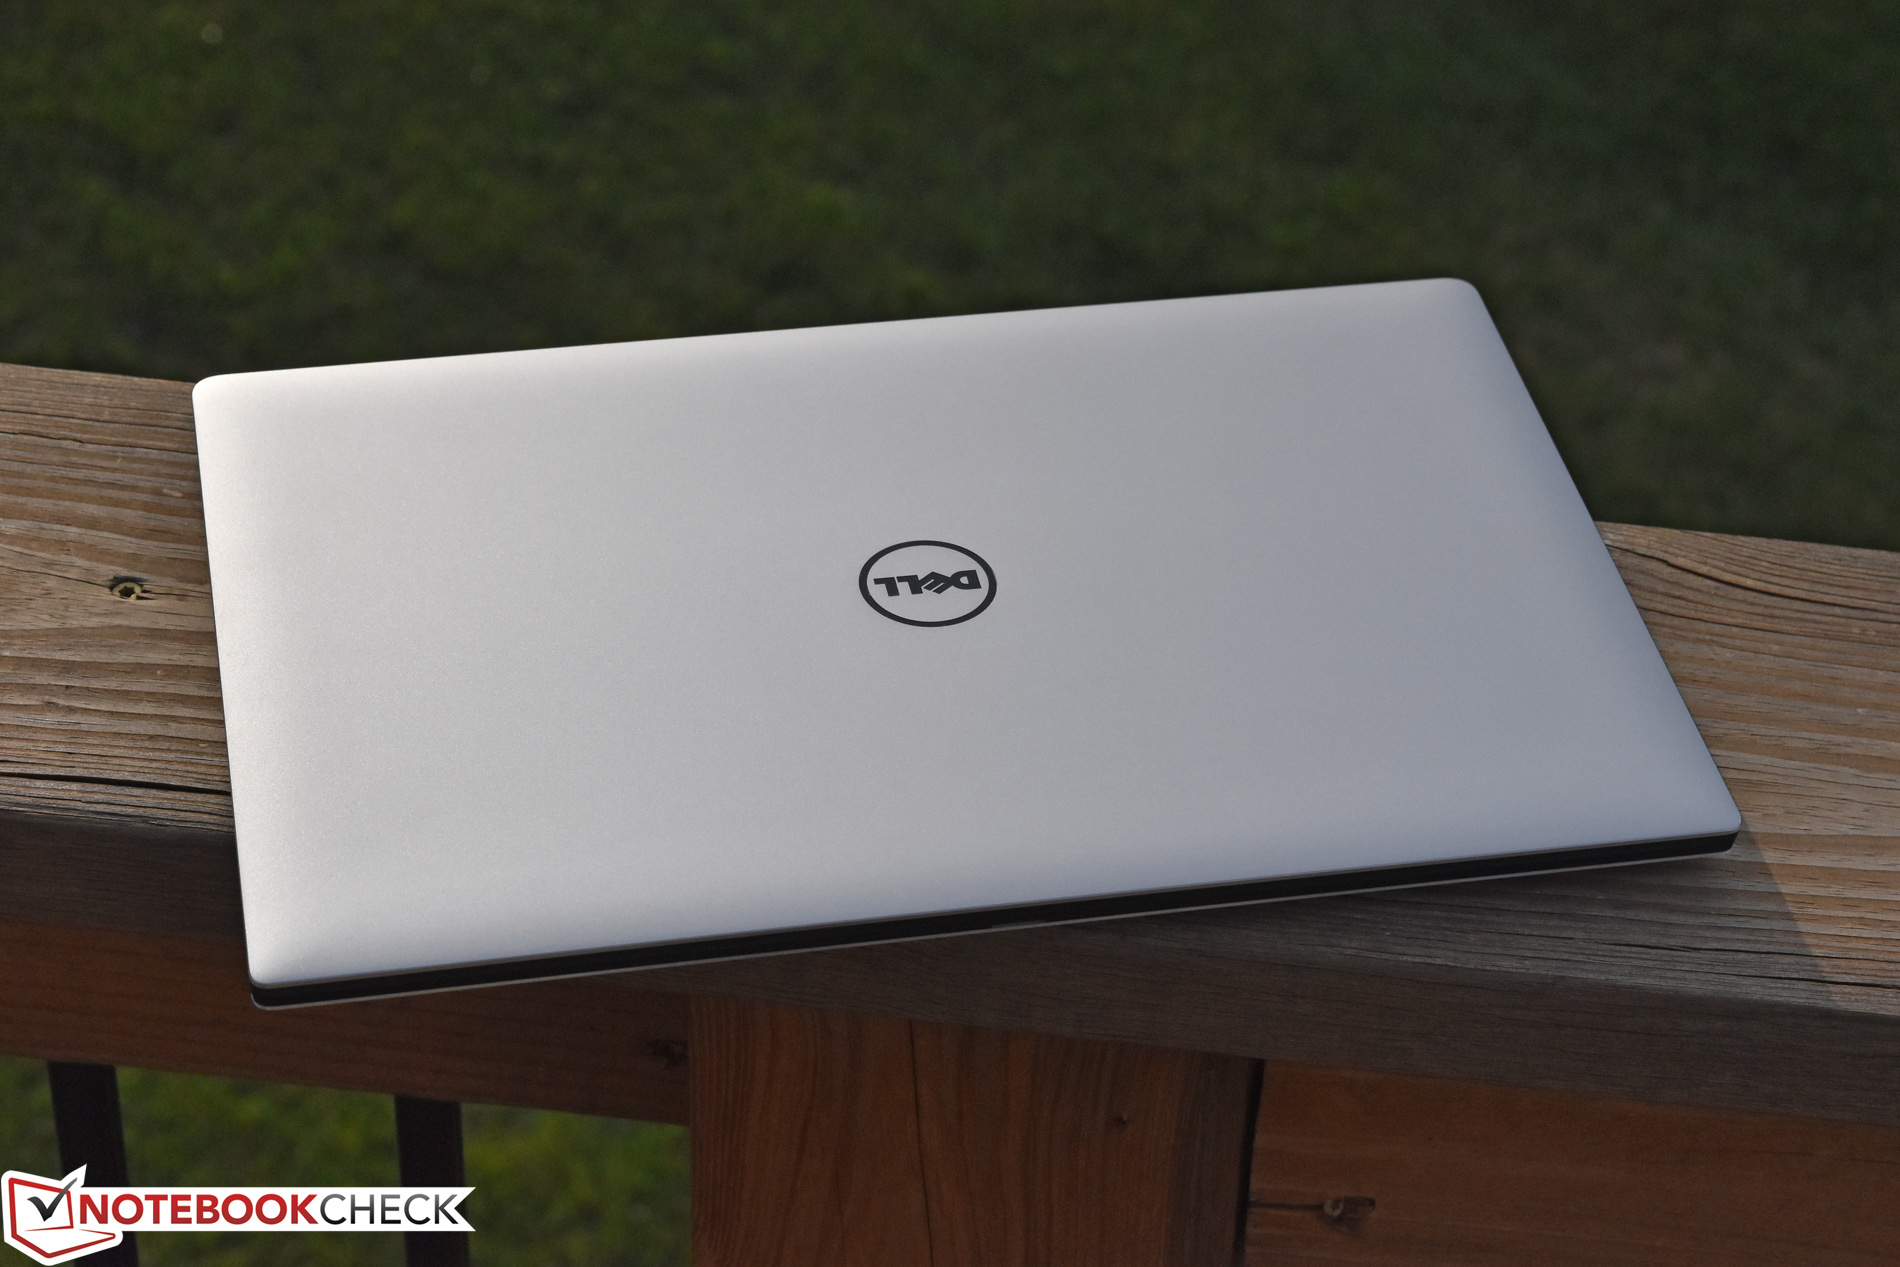
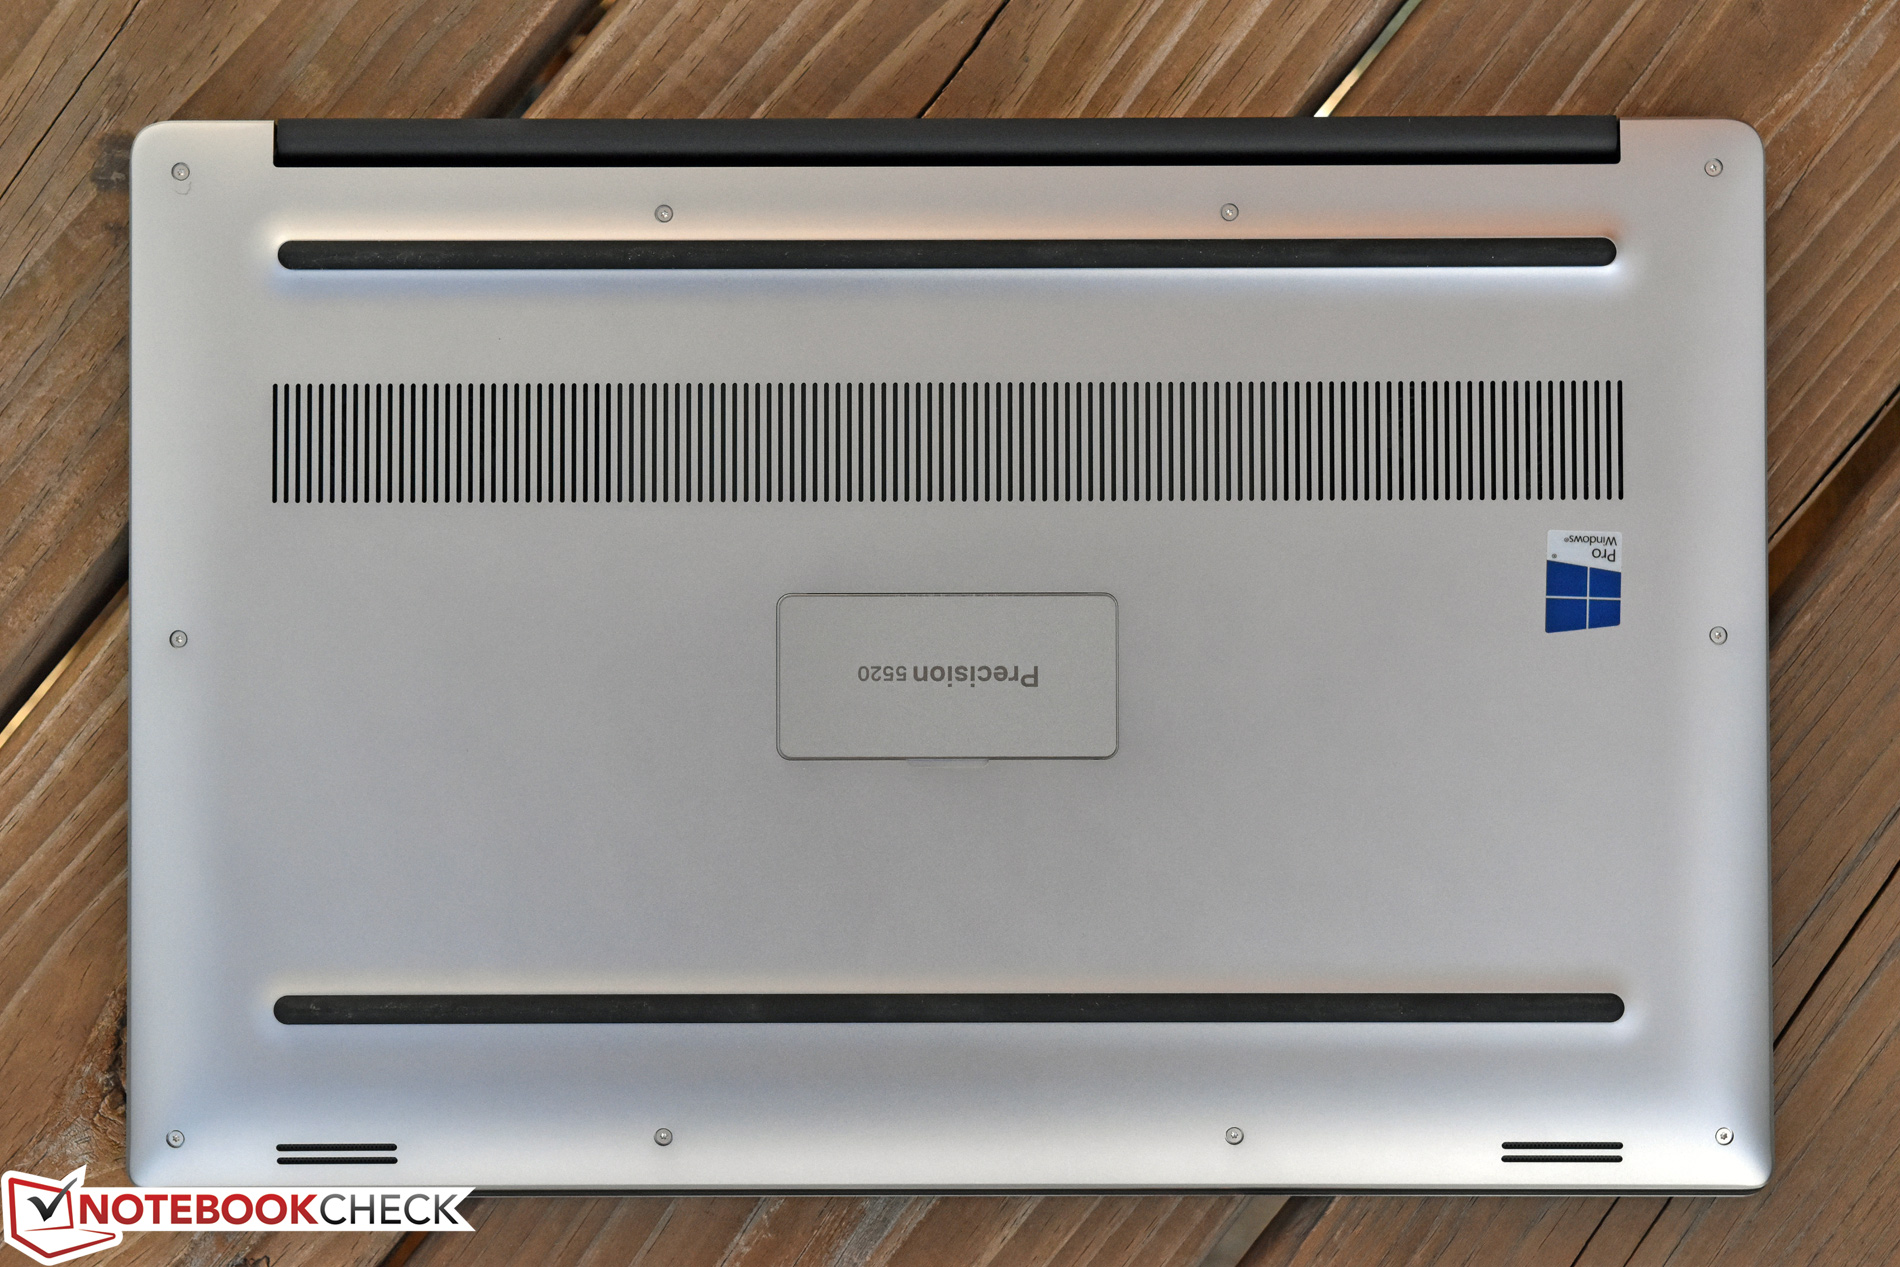
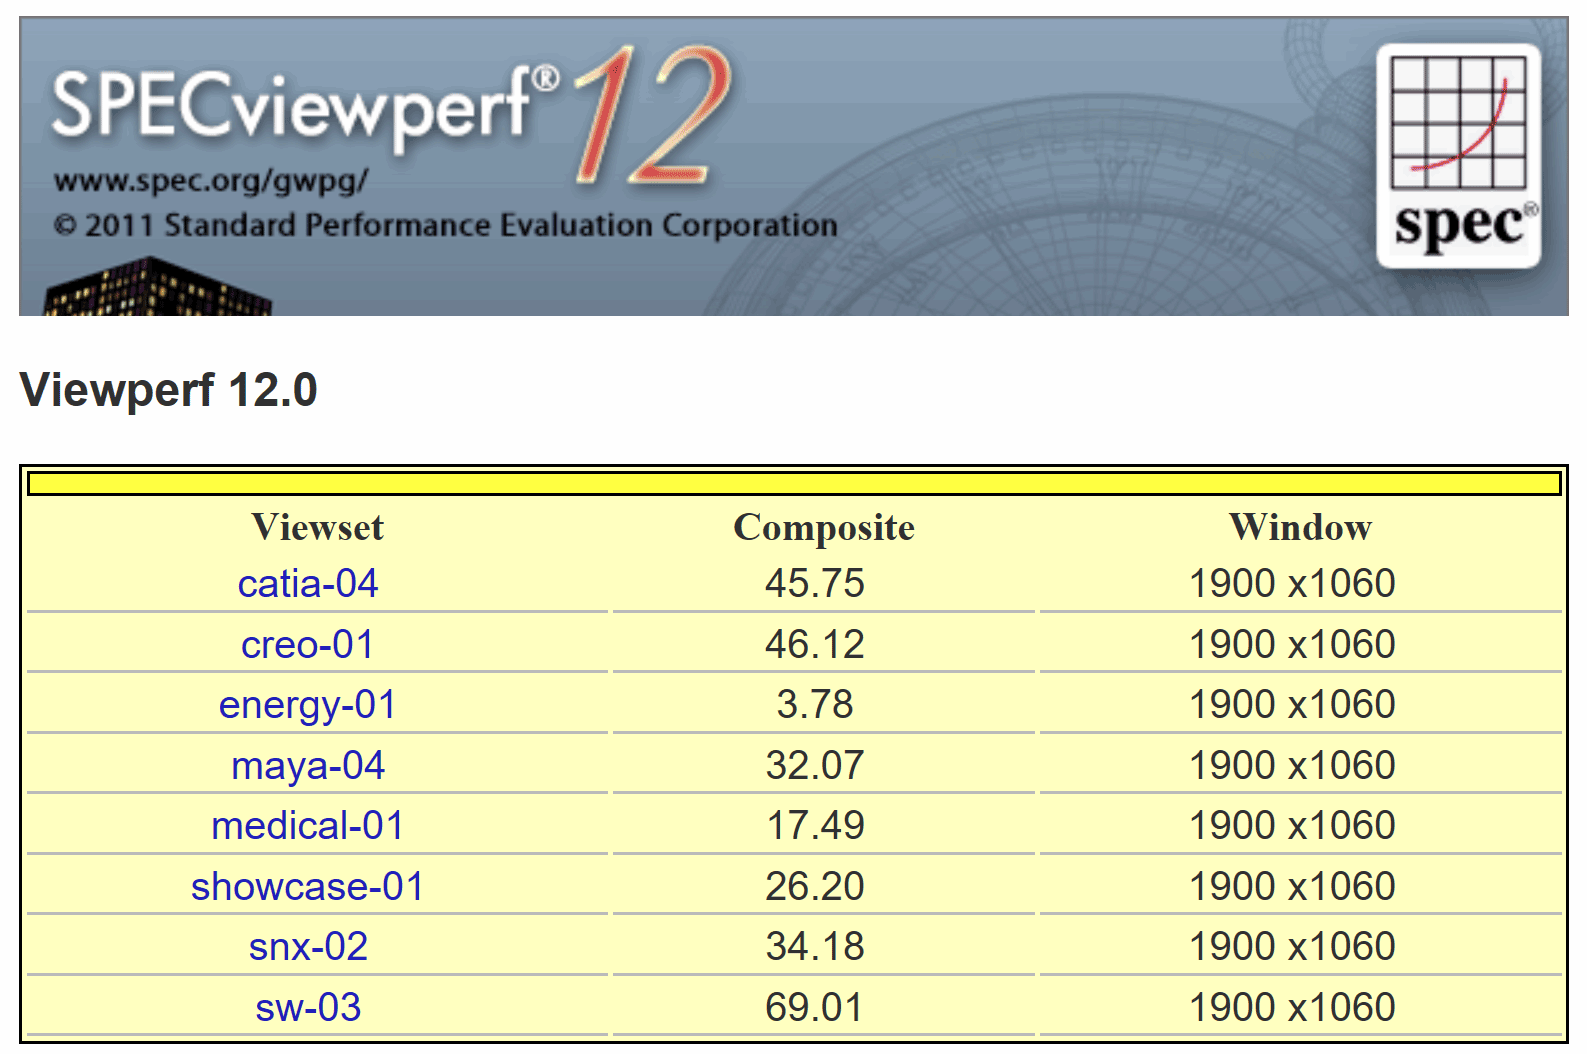
Embora não muito tenha mudado em termos de design básico, desde o Precision 5510 há cerca de uma ano atrás, o Dell Precision 5520 ainda é um dos workstations mais portáveis e atraentes que existe. O movimento para Kaby Lake vê resultados mistos, com limitações de desempenho da CPU sob carga contínua, impedindo que a máquina atinja seu potencial pleno em desempenho multi-core, mesmo sob condições de teste de estresse realistas. Mas a atualização para o armazenamento NVMe e a adoção da mais recente NVIDIA Quadro M1200 traz benefícios tangíveis para o desempenho do workstation do aparelho: registramos resultados respeitáveis em todos os nossos testes SPECviewperf e, em geral, bem acima dos do 5510, para inicializar.. O desempenho da GPU também parece ser bastante estável sob o nosso teste de estresse Witcher 3.
Alguns sacrifícios são esperados quando se lida com um workstation deste tamanho; afinal, o 5520 pesa pouco mais de 2 kg e tem um formato mais próximo do de uma máquina de 14 polegadas. Além das restrições da CPU, o Precision também esquenta bastante sob carga, e a duração da bateria não é absolutamente nada especial (pelo menos, com a tela UHD que recebemos em nossa unidade de teste). Assim, enquanto o sonho de um Ultrabook/workstation híbrido ainda não é realizado, para aqueles que ficarem contentes com um bom desempenho de GPU/workstation, e não se importam com decepcionantes capacidades da CPU multi-core, o Precision 5520 é um compromisso atraente em troca de maior portabilidade e estética mais agradável.
Para outros, um workstation maior provavelmente seja a única resposta — no entanto, sempre há outras opções ultra portáveis (grau de consumidor) como o XPS 15 e o Razer Blade se esses conseguirem qualificar. Por exemplo, embora a nossa unidade de teste XPS 15 não teve o mesmo poder de CPU que o nosso Precision, as velocidades e o desempenho foram estáveis no teste Cinebench loop — e, no geral, um desempenho contínuo é melhor.
Alguns sacrifícios são esperados quando se lida com um workstation deste tamanho; para aqueles cujas necessidades ele atende, o Precision 5520 é um compromisso atraente em troca de maior portabilidade e estética mais agradável.
Não há mais espaço para melhorias com a próxima revisão, mas para o que é, o Precision 5520 ainda é um dispositivo impressionante com um sólido desempenho de GPU profissional para o seu tamanho. A $ 2.867 (como configurado), não é um investimento pequeno, mas é também (ainda hoje) único em sua classe.
Dell Precision 5520 UHD
- 04/28/2017 v6 (old)
Steve Schardein
Price comparison
