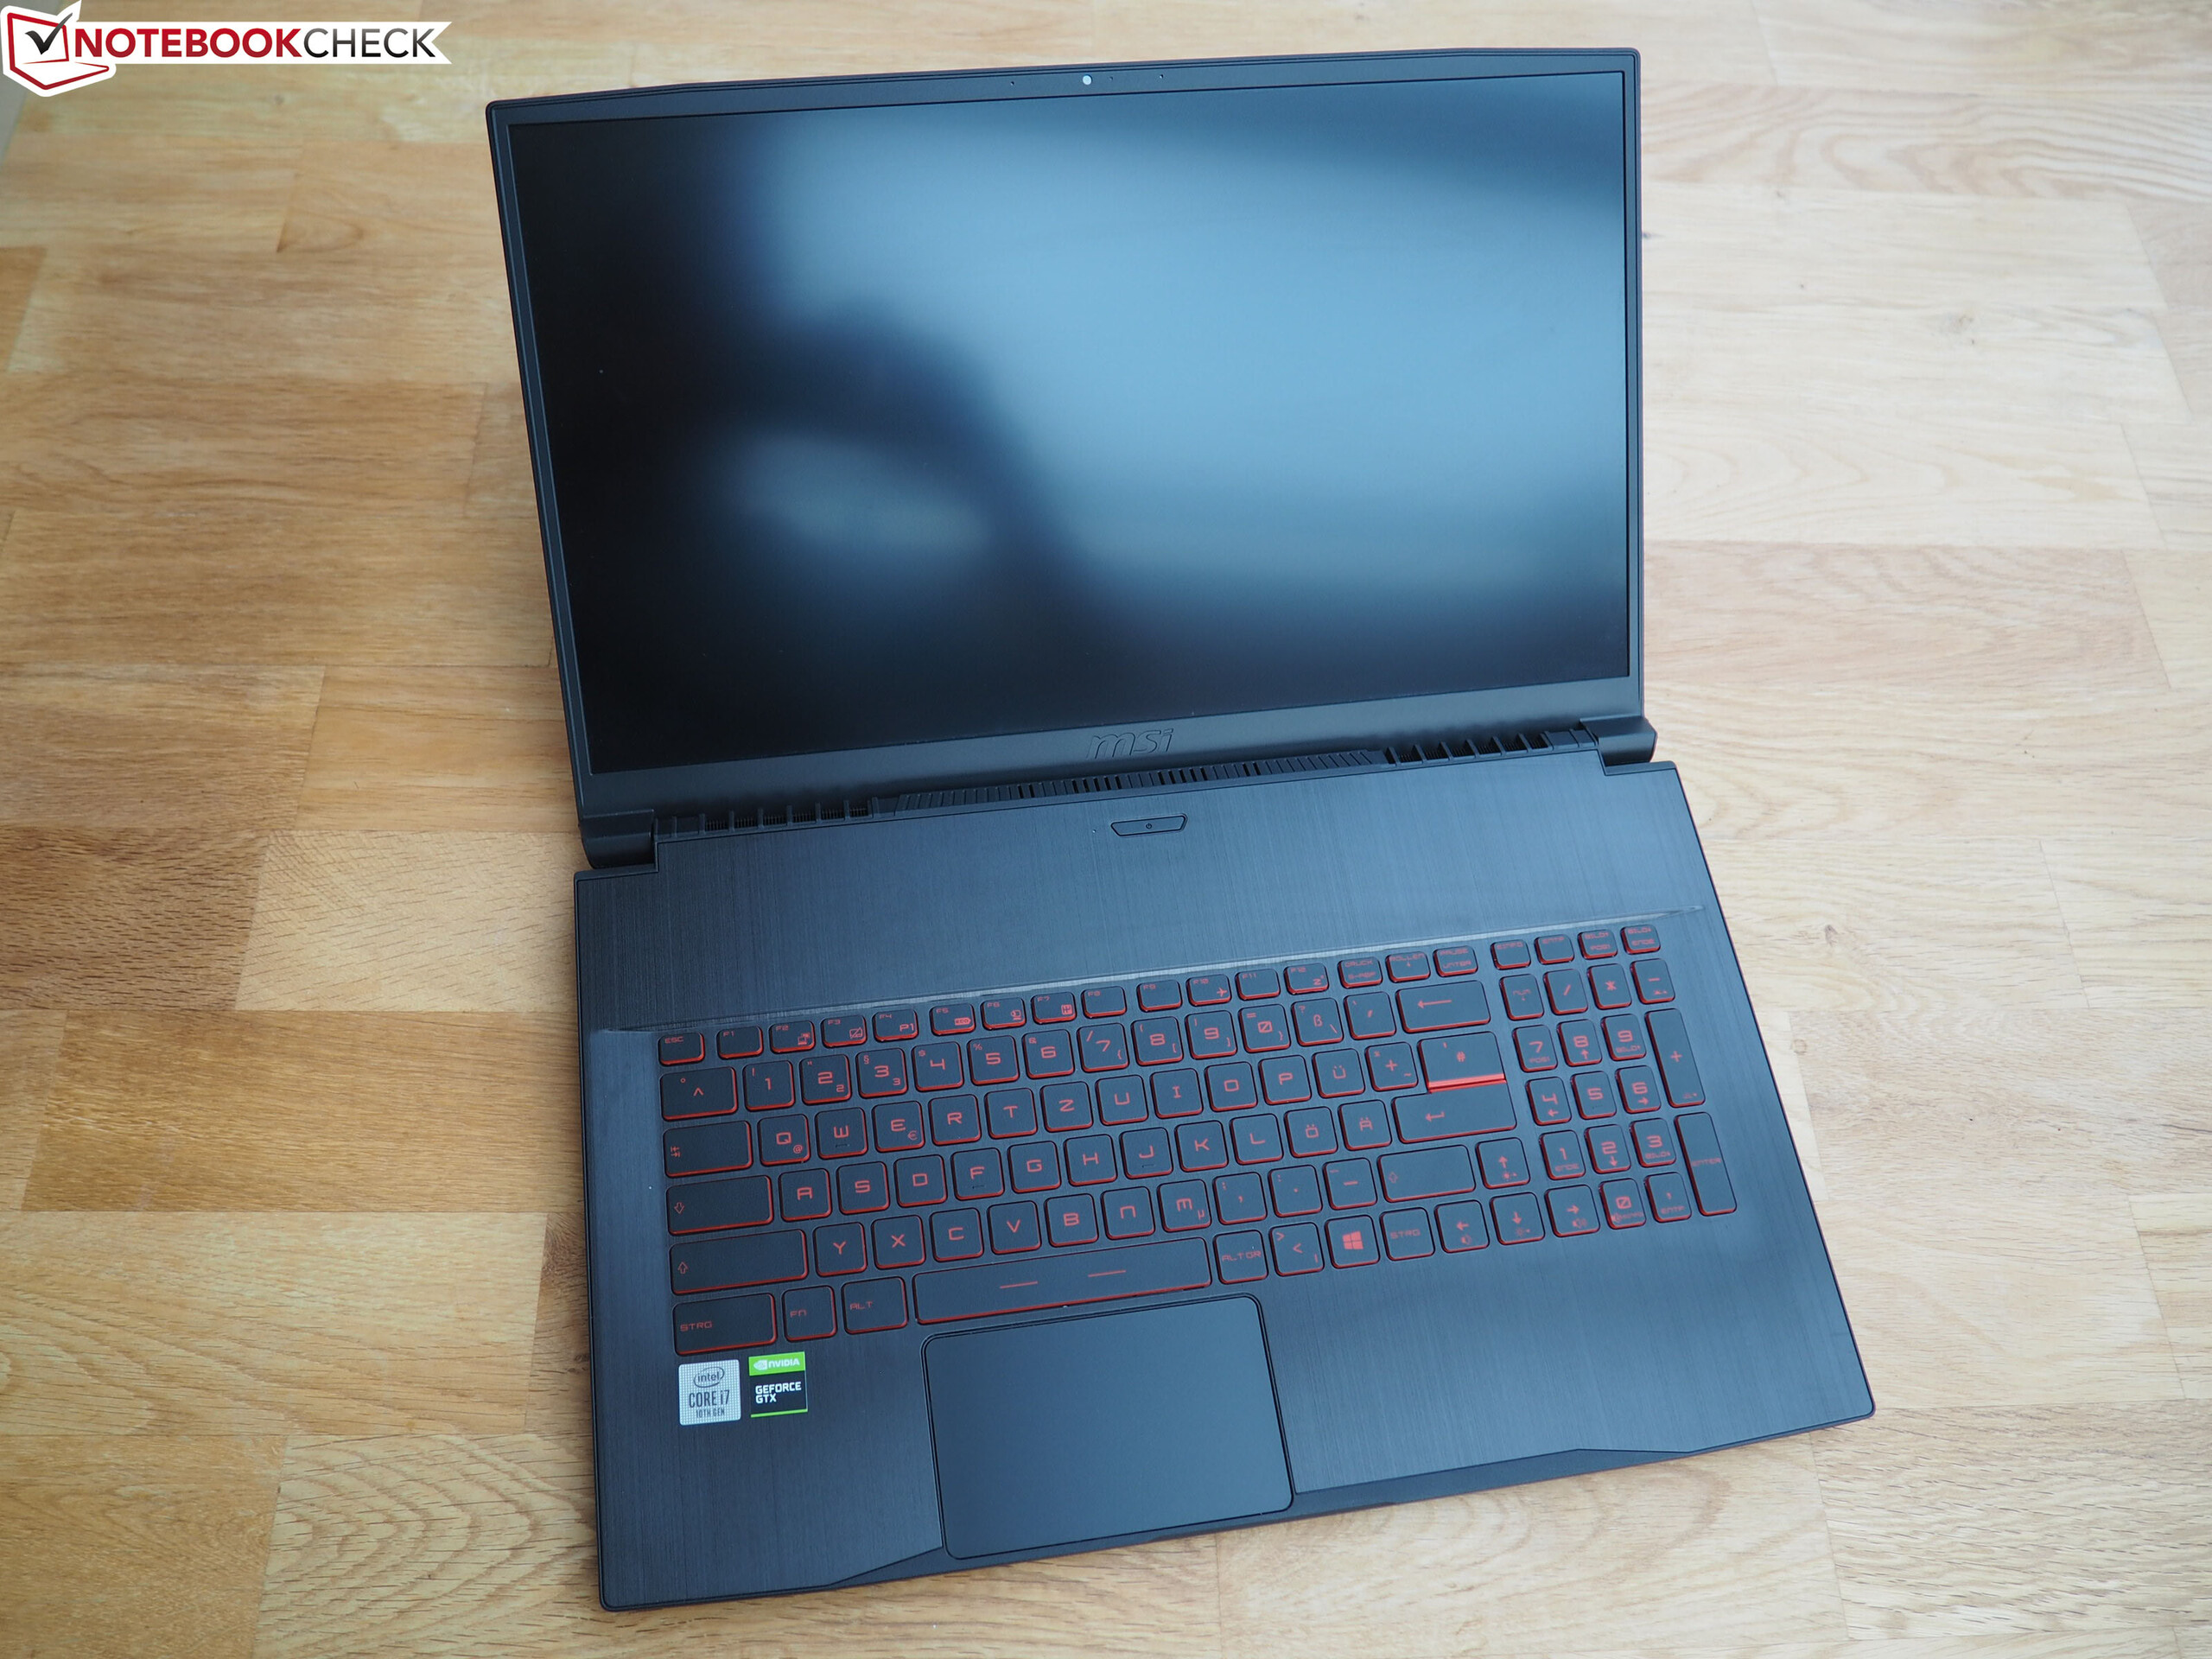
Breve Análise do Portátil MSI GF75 Thin 10SDR: Para jogadores econômicos
Avaliação | Data | Modelo | Peso | Altura | Size | Resolução | Preço |
|---|---|---|---|---|---|---|---|
| 79.8 % v7 (old) | 10/2020 | MSI GF75 Thin 10SDR i7-10750H, GeForce GTX 1660 Ti Mobile | 2.2 kg | 23 mm | 17.30" | 1920x1080 | |
| 78.5 % v7 (old) | 05/2020 | MSI GF75 Thin 10SCXR i5-10300H, GeForce GTX 1650 Mobile | 2.2 kg | 23.1 mm | 17.30" | 1920x1080 | |
| 82.9 % v7 (old) | 05/2020 | Asus TUF A17 FA706IU-AS76 R7 4800H, GeForce GTX 1660 Ti Mobile | 2.6 kg | 26 mm | 17.30" | 1920x1080 | |
| 80.6 % v7 (old) | 06/2020 | Acer Nitro 5 AN517-52-77DS i7-10750H, GeForce RTX 2060 Mobile | 2.2 kg | 24.9 mm | 17.30" | 1920x1080 | |
| 85.1 % v7 (old) | 07/2020 | MSI GE75 Raider 10SE-008US i7-10750H, GeForce RTX 2060 Mobile | 2.6 kg | 27.5 mm | 17.30" | 1920x1080 |


| |||||||||||||||||||||||||
iluminação: 92 %
iluminação com acumulador: 252 cd/m²
Contraste: 1096:1 (Preto: 0.23 cd/m²)
ΔE ColorChecker Calman: 4.24 | ∀{0.5-29.43 Ø4.71}
calibrated: 3.64
ΔE Greyscale Calman: 2.8 | ∀{0.09-98 Ø4.96}
59% sRGB (Argyll 1.6.3 3D)
41% AdobeRGB 1998 (Argyll 1.6.3 3D)
41.31% AdobeRGB 1998 (Argyll 3D)
59.9% sRGB (Argyll 3D)
39.98% Display P3 (Argyll 3D)
Gamma: 2.196
CCT: 7027 K
| MSI GF75 Thin 10SDR B173HAN04.9 (AUO978F), IPS, 1920x1080, 17.3" | MSI GF75 Thin 10SCXR AU Optronics B173HAN04.7, IPS, 1920x1080, 17.3" | Asus TUF A17 FA706IU-AS76 BOE NV173FHM-NX1, IPS, 1920x1080, 17.3" | Acer Nitro 5 AN517-52-77DS AU Optronics B173HAN04.7, IPS, 1920x1080, 17.3" | MSI GE75 Raider 10SE-008US Chi Mei N173HCE-G33, IPS, 1920x1080, 17.3" | |
|---|---|---|---|---|---|
| Display | -2% | 1% | -1% | 64% | |
| Display P3 Coverage (%) | 39.98 | 39.46 -1% | 40.55 1% | 39.47 -1% | 65.6 64% |
| sRGB Coverage (%) | 59.9 | 58.4 -3% | 59.7 0% | 58.9 -2% | 98.1 64% |
| AdobeRGB 1998 Coverage (%) | 41.31 | 40.77 -1% | 41.89 1% | 40.77 -1% | 67.8 64% |
| Response Times | 8% | 36% | 8% | 75% | |
| Response Time Grey 50% / Grey 80% * (ms) | 38.4 ? | 34 ? 11% | 22.4 ? 42% | 35 ? 9% | 6.8 ? 82% |
| Response Time Black / White * (ms) | 27.6 ? | 26.4 ? 4% | 19.2 ? 30% | 26 ? 6% | 8.8 ? 68% |
| PWM Frequency (Hz) | 25000 ? | ||||
| Screen | -13% | -3% | -19% | 31% | |
| Brightness middle (cd/m²) | 252 | 251.2 0% | 264.8 5% | 263 4% | 337.9 34% |
| Brightness (cd/m²) | 253 | 242 -4% | 253 0% | 246 -3% | 305 21% |
| Brightness Distribution (%) | 92 | 92 0% | 90 -2% | 85 -8% | 81 -12% |
| Black Level * (cd/m²) | 0.23 | 0.34 -48% | 0.31 -35% | 0.47 -104% | 0.29 -26% |
| Contrast (:1) | 1096 | 739 -33% | 854 -22% | 560 -49% | 1165 6% |
| Colorchecker dE 2000 * | 4.24 | 4.5 -6% | 4.73 -12% | 5.07 -20% | 2.18 49% |
| Colorchecker dE 2000 max. * | 21.4 | 20 7% | 18.89 12% | 20.5 4% | 3.9 82% |
| Colorchecker dE 2000 calibrated * | 3.64 | 3.91 -7% | 4.64 -27% | 4.9 -35% | 0.69 81% |
| Greyscale dE 2000 * | 2.8 | 4 -43% | 1.4 50% | 2.55 9% | 3.1 -11% |
| Gamma | 2.196 100% | 2.25 98% | 2.16 102% | 2.37 93% | 2.07 106% |
| CCT | 7027 93% | 5882 111% | 6641 98% | 6446 101% | 6882 94% |
| Color Space (Percent of AdobeRGB 1998) (%) | 41 | 37.3 -9% | 38.4 -6% | 37 -10% | 62 51% |
| Color Space (Percent of sRGB) (%) | 59 | 58.1 -2% | 59.3 1% | 59 0% | 98.2 66% |
| Média Total (Programa/Configurações) | -2% /
-8% | 11% /
2% | -4% /
-13% | 57% /
43% |
* ... menor é melhor
Exibir tempos de resposta
| ↔ Tempo de resposta preto para branco | ||
|---|---|---|
| 27.6 ms ... ascensão ↗ e queda ↘ combinadas | ↗ 14.8 ms ascensão | 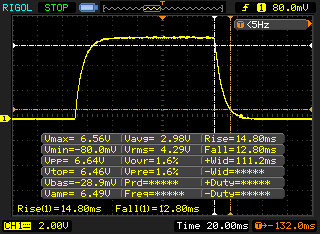 |
| ↘ 12.8 ms queda | ||
| A tela mostra taxas de resposta relativamente lentas em nossos testes e pode ser muito lenta para os jogadores. Em comparação, todos os dispositivos testados variam de 0.1 (mínimo) a 240 (máximo) ms. » 70 % de todos os dispositivos são melhores. Isso significa que o tempo de resposta medido é pior que a média de todos os dispositivos testados (19.8 ms). | ||
| ↔ Tempo de resposta 50% cinza a 80% cinza | ||
| 38.4 ms ... ascensão ↗ e queda ↘ combinadas | ↗ 18 ms ascensão | 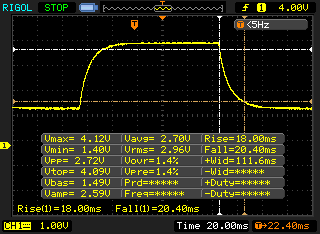 |
| ↘ 20.4 ms queda | ||
| A tela mostra taxas de resposta lentas em nossos testes e será insatisfatória para os jogadores. Em comparação, todos os dispositivos testados variam de 0.165 (mínimo) a 636 (máximo) ms. » 58 % de todos os dispositivos são melhores. Isso significa que o tempo de resposta medido é pior que a média de todos os dispositivos testados (31 ms). | ||
Cintilação da tela / PWM (modulação por largura de pulso)
| Tela tremeluzindo / PWM não detectado | 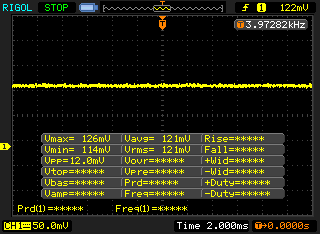 | ||
[pwm_comparison] Em comparação: 52 % de todos os dispositivos testados não usam PWM para escurecer a tela. Se PWM foi detectado, uma média de 7757 (mínimo: 5 - máximo: 343500) Hz foi medida. | |||
* ... menor é melhor
| DPC Latencies / LatencyMon - interrupt to process latency (max), Web, Youtube, Prime95 | |
| Asus TUF A17 FA706IU-AS76 | |
| MSI GF75 Thin 10SCXR | |
| MSI GE75 Raider 10SE-008US | |
| MSI GF75 Thin 10SDR | |
| Acer Nitro 5 AN517-52-77DS | |
* ... menor é melhor
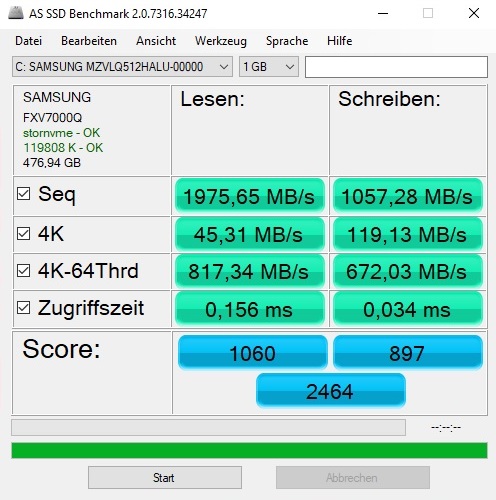
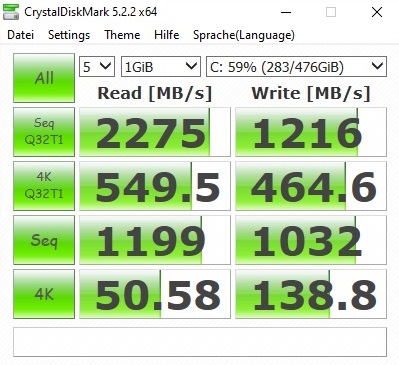
| MSI GF75 Thin 10SDR Samsung PM991 MZVLQ512HALU | MSI GF75 Thin 10SCXR WDC PC SN530 SDBPNPZ-512G | Asus TUF A17 FA706IU-AS76 Intel SSD 660p 1TB SSDPEKNW010T8 | Acer Nitro 5 AN517-52-77DS WDC PC SN530 SDBPNPZ-1T00 | MSI GE75 Raider 10SE-008US Samsung SSD PM981 MZVLB512HAJQ | |
|---|---|---|---|---|---|
| CrystalDiskMark 5.2 / 6 | 9% | 23% | 16% | 36% | |
| Write 4K (MB/s) | 138.8 | 140.7 1% | 189.7 37% | 140 1% | 139.2 0% |
| Read 4K (MB/s) | 50.6 | 43.18 -15% | 62.3 23% | 49.04 -3% | 53 5% |
| Write Seq (MB/s) | 1032 | 1829 77% | 1681 63% | 1963 90% | 1950 89% |
| Read Seq (MB/s) | 1199 | 1095 -9% | 1608 34% | 1455 21% | 2328 94% |
| Write 4K Q32T1 (MB/s) | 464.6 | 431.7 -7% | 468.6 1% | 398.2 -14% | 408.9 -12% |
| Read 4K Q32T1 (MB/s) | 550 | 527 -4% | 541 -2% | 461.9 -16% | 551 0% |
| Write Seq Q32T1 (MB/s) | 1216 | 1831 51% | 1770 46% | 1969 62% | 1938 59% |
| Read Seq Q32T1 (MB/s) | 2275 | 1708 -25% | 1898 -17% | 1927 -15% | 3467 52% |

Sustained Read Speed: DiskSpd Read Loop, Queue Depth 8
| 3DMark 11 Performance | 17704 pontos | |
| 3DMark Fire Strike Score | 13396 pontos | |
| 3DMark Time Spy Score | 5677 pontos | |
Ajuda | ||
| The Witcher 3 | |
| 1920x1080 High Graphics & Postprocessing (Nvidia HairWorks Off) | |
| Média da turma Gaming (341 - 404, n=2, últimos 2 anos) | |
| MSI GE75 Raider 10SE-008US | |
| Acer Nitro 5 AN517-52-77DS | |
| MSI GF75 Thin 10SDR | |
| Média NVIDIA GeForce GTX 1660 Ti Mobile (93 - 120.4, n=17) | |
| Asus TUF A17 FA706IU-AS76 | |
| MSI GF75 Thin 10SCXR | |
| 1920x1080 Ultra Graphics & Postprocessing (HBAO+) | |
| Média da turma Gaming (104.7 - 240, n=7, últimos 2 anos) | |
| MSI GE75 Raider 10SE-008US | |
| Acer Nitro 5 AN517-52-77DS | |
| MSI GF75 Thin 10SDR | |
| Média NVIDIA GeForce GTX 1660 Ti Mobile (51.6 - 65.1, n=21) | |
| Asus TUF A17 FA706IU-AS76 | |
| MSI GF75 Thin 10SCXR | |
| baixo | média | alto | ultra | |
|---|---|---|---|---|
| GTA V (2015) | 178 | 170 | 139 | 73.8 |
| The Witcher 3 (2015) | 106 | 56.6 | ||
| Dota 2 Reborn (2015) | 146 | 133 | 124 | 116 |
| X-Plane 11.11 (2018) | 108 | 92.1 | 78.4 | |
| Shadow of the Tomb Raider (2018) | 83 | 73 | ||
| Battlefield V (2018) | 104 | 95.7 | ||
| Hunt Showdown (2020) | 69.1 | |||
| Gears Tactics (2020) | 90.2 | 63.6 | ||
| F1 2020 (2020) | 122 | 87 | ||
| Death Stranding (2020) | 88.3 | 85.5 | ||
| Horizon Zero Dawn (2020) | 75 | 58 | ||
| Flight Simulator 2020 (2020) | 39.4 | 26.8 | ||
| Serious Sam 4 (2020) | 67.1 | 52.3 | ||
| Mafia Definitive Edition (2020) | 66.8 | |||
| Star Wars Squadrons (2020) | 159 | 156 |
Barulho
| Ocioso |
| 35 / 37 / 39 dB |
| Carga |
| 45 / 46 dB |
 | ||
30 dB silencioso 40 dB(A) audível 50 dB(A) ruidosamente alto |
||
min: | ||
| MSI GF75 Thin 10SDR i7-10750H, GeForce GTX 1660 Ti Mobile | MSI GF75 Thin 10SCXR i5-10300H, GeForce GTX 1650 Mobile | Asus TUF A17 FA706IU-AS76 R7 4800H, GeForce GTX 1660 Ti Mobile | Acer Nitro 5 AN517-52-77DS i7-10750H, GeForce RTX 2060 Mobile | MSI GE75 Raider 10SE-008US i7-10750H, GeForce RTX 2060 Mobile | Média da turma Gaming | |
|---|---|---|---|---|---|---|
| Noise | 6% | 2% | 6% | 2% | 11% | |
| desligado / ambiente * (dB) | 25 | 28.4 -14% | 28.7 -15% | 30.2 -21% | 28.4 -14% | 24.1 ? 4% |
| Idle Minimum * (dB) | 35 | 33 6% | 28.7 18% | 30.2 14% | 30.2 14% | 26 ? 26% |
| Idle Average * (dB) | 37 | 33 11% | 30.5 18% | 30.2 18% | 30.2 18% | 27.4 ? 26% |
| Idle Maximum * (dB) | 39 | 33.1 15% | 32.5 17% | 30.2 23% | 32 18% | 30.1 ? 23% |
| Load Average * (dB) | 45 | 37.7 16% | 42.5 6% | 41.5 8% | 33.2 26% | 43.6 ? 3% |
| Witcher 3 ultra * (dB) | 44 | 39.2 11% | 50.1 -14% | 44.5 -1% | 55 -25% | |
| Load Maximum * (dB) | 46 | 46 -0% | 53.4 -16% | 44.6 3% | 55 -20% | 54.2 ? -18% |
* ... menor é melhor
(-) A temperatura máxima no lado superior é 51 °C / 124 F, em comparação com a média de 40.4 °C / 105 F , variando de 21.2 a 68.8 °C para a classe Gaming.
(-) A parte inferior aquece até um máximo de 53 °C / 127 F, em comparação com a média de 43.2 °C / 110 F
(+) Em uso inativo, a temperatura média para o lado superior é 24.7 °C / 76 F, em comparação com a média do dispositivo de 33.9 °C / ### class_avg_f### F.
(-) Jogando The Witcher 3, a temperatura média para o lado superior é 40.2 °C / 104 F, em comparação com a média do dispositivo de 33.9 °C / ## #class_avg_f### F.
(+) Os apoios para as mãos e o touchpad estão atingindo a temperatura máxima da pele (35 °C / 95 F) e, portanto, não estão quentes.
(-) A temperatura média da área do apoio para as mãos de dispositivos semelhantes foi 28.8 °C / 83.8 F (-6.2 °C / -11.2 F).
| MSI GF75 Thin 10SDR i7-10750H, GeForce GTX 1660 Ti Mobile | MSI GF75 Thin 10SCXR i5-10300H, GeForce GTX 1650 Mobile | Asus TUF A17 FA706IU-AS76 R7 4800H, GeForce GTX 1660 Ti Mobile | Acer Nitro 5 AN517-52-77DS i7-10750H, GeForce RTX 2060 Mobile | MSI GE75 Raider 10SE-008US i7-10750H, GeForce RTX 2060 Mobile | Média da turma Gaming | |
|---|---|---|---|---|---|---|
| Heat | -18% | -9% | -5% | -18% | -10% | |
| Maximum Upper Side * (°C) | 51 | 42 18% | 47.6 7% | 50.6 1% | 44.2 13% | 45.2 ? 11% |
| Maximum Bottom * (°C) | 53 | 53.4 -1% | 50.8 4% | 53.8 -2% | 49 8% | 48.1 ? 9% |
| Idle Upper Side * (°C) | 25 | 34.2 -37% | 33 -32% | 26.6 -6% | 33.6 -34% | 31 ? -24% |
| Idle Bottom * (°C) | 25 | 37.4 -50% | 29 -16% | 27.8 -11% | 39.6 -58% | 34.2 ? -37% |
* ... menor é melhor
MSI GF75 Thin 10SDR análise de áudio
(±) | o volume do alto-falante é médio, mas bom (###valor### dB)
Graves 100 - 315Hz
(-) | quase nenhum baixo - em média 16.6% menor que a mediana
(-) | graves não são lineares (15.4% delta para frequência anterior)
Médios 400 - 2.000 Hz
(+) | médios equilibrados - apenas 2.6% longe da mediana
(+) | médios são lineares (5.5% delta para frequência anterior)
Altos 2 - 16 kHz
(+) | agudos equilibrados - apenas 2.2% longe da mediana
(+) | os máximos são lineares (6% delta da frequência anterior)
Geral 100 - 16.000 Hz
(+) | o som geral é linear (12.5% diferença em relação à mediana)
Comparado com a mesma classe
» 15% de todos os dispositivos testados nesta classe foram melhores, 3% semelhantes, 81% piores
» O melhor teve um delta de 6%, a média foi 18%, o pior foi 132%
Comparado com todos os dispositivos testados
» 11% de todos os dispositivos testados foram melhores, 2% semelhantes, 87% piores
» O melhor teve um delta de 4%, a média foi 23%, o pior foi 134%
Asus TUF A17 FA706IU-AS76 análise de áudio
(±) | o volume do alto-falante é médio, mas bom (###valor### dB)
Graves 100 - 315Hz
(±) | graves reduzidos - em média 12.7% menor que a mediana
(±) | a linearidade dos graves é média (11.5% delta para a frequência anterior)
Médios 400 - 2.000 Hz
(+) | médios equilibrados - apenas 4.8% longe da mediana
(±) | a linearidade dos médios é média (9.1% delta para frequência anterior)
Altos 2 - 16 kHz
(+) | agudos equilibrados - apenas 3.1% longe da mediana
(±) | a linearidade dos máximos é média (8.7% delta para frequência anterior)
Geral 100 - 16.000 Hz
(±) | a linearidade do som geral é média (23.5% diferença em relação à mediana)
Comparado com a mesma classe
» 85% de todos os dispositivos testados nesta classe foram melhores, 5% semelhantes, 10% piores
» O melhor teve um delta de 6%, a média foi 18%, o pior foi 132%
Comparado com todos os dispositivos testados
» 70% de todos os dispositivos testados foram melhores, 6% semelhantes, 24% piores
» O melhor teve um delta de 4%, a média foi 23%, o pior foi 134%
| desligado | |
| Ocioso | |
| Carga |
|
Key:
min: | |
| MSI GF75 Thin 10SDR i7-10750H, GeForce GTX 1660 Ti Mobile | MSI GF75 Thin 10SCXR i5-10300H, GeForce GTX 1650 Mobile | Asus TUF A17 FA706IU-AS76 R7 4800H, GeForce GTX 1660 Ti Mobile | Acer Nitro 5 AN517-52-77DS i7-10750H, GeForce RTX 2060 Mobile | MSI GE75 Raider 10SE-008US i7-10750H, GeForce RTX 2060 Mobile | Média da turma Gaming | |
|---|---|---|---|---|---|---|
| Power Consumption | -17% | -2% | 9% | -55% | -54% | |
| Idle Minimum * (Watt) | 8 | 13 -63% | 7.4 7% | 5.4 32% | 14.7 -84% | 13 ? -63% |
| Idle Average * (Watt) | 10 | 15.7 -57% | 10.5 -5% | 9.8 2% | 20.4 -104% | 19 ? -90% |
| Idle Maximum * (Watt) | 15 | 21 -40% | 17 -13% | 10.9 27% | 26.9 -79% | 24.6 ? -64% |
| Load Average * (Watt) | 95 | 87 8% | 103.7 -9% | 104 -9% | 93.2 2% | 110.7 ? -17% |
| Witcher 3 ultra * (Watt) | 133 | 96.4 28% | 128.1 4% | 134.3 -1% | 185.4 -39% | |
| Load Maximum * (Watt) | 193 | 145.8 24% | 183.2 5% | 193 -0% | 237.8 -23% | 259 ? -34% |
* ... menor é melhor
| MSI GF75 Thin 10SDR i7-10750H, GeForce GTX 1660 Ti Mobile, 51 Wh | MSI GF75 Thin 10SCXR i5-10300H, GeForce GTX 1650 Mobile, 51 Wh | Asus TUF A17 FA706IU-AS76 R7 4800H, GeForce GTX 1660 Ti Mobile, 90 Wh | Acer Nitro 5 AN517-52-77DS i7-10750H, GeForce RTX 2060 Mobile, 57.48 Wh | MSI GE75 Raider 10SE-008US i7-10750H, GeForce RTX 2060 Mobile, 65 Wh | Média da turma Gaming | |
|---|---|---|---|---|---|---|
| Duração da bateria | 11% | 123% | 72% | -7% | 47% | |
| Reader / Idle (h) | 7.3 | 7.7 5% | 9.1 25% | 11 51% | 8.27 ? 13% | |
| WiFi v1.3 (h) | 4 | 4.7 18% | 8.5 113% | 6.6 65% | 3.7 -7% | 7.11 ? 78% |
| Load (h) | 1 | 1.1 10% | 3.3 230% | 2 100% | 1.502 ? 50% | |
| H.264 (h) | 7.3 | 8.32 ? |
Pro
Contra
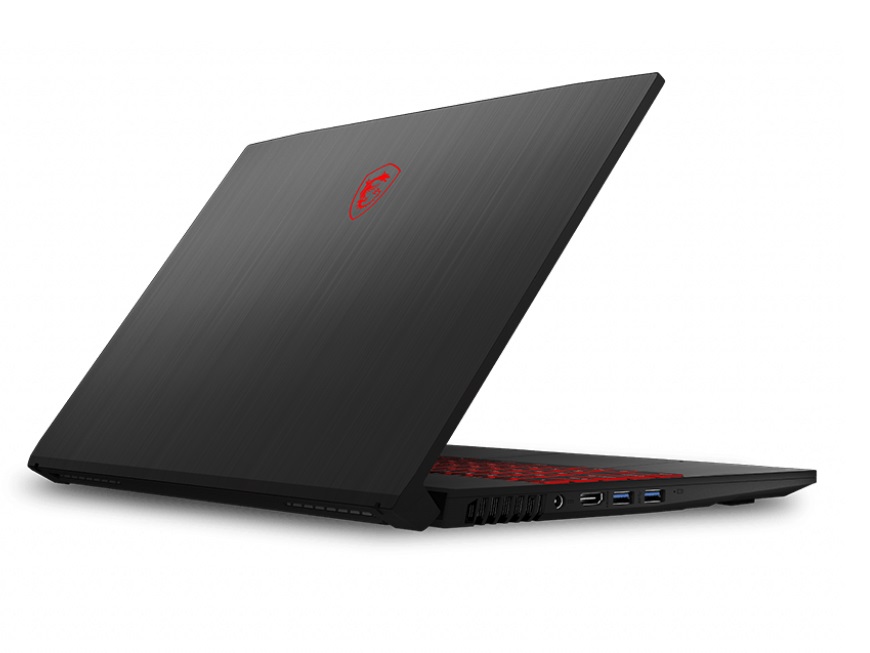
O GF75 10SDR-253 foi feito para jogadores que buscam o melhor desempenho por um preço inferior a US$ 1.200.
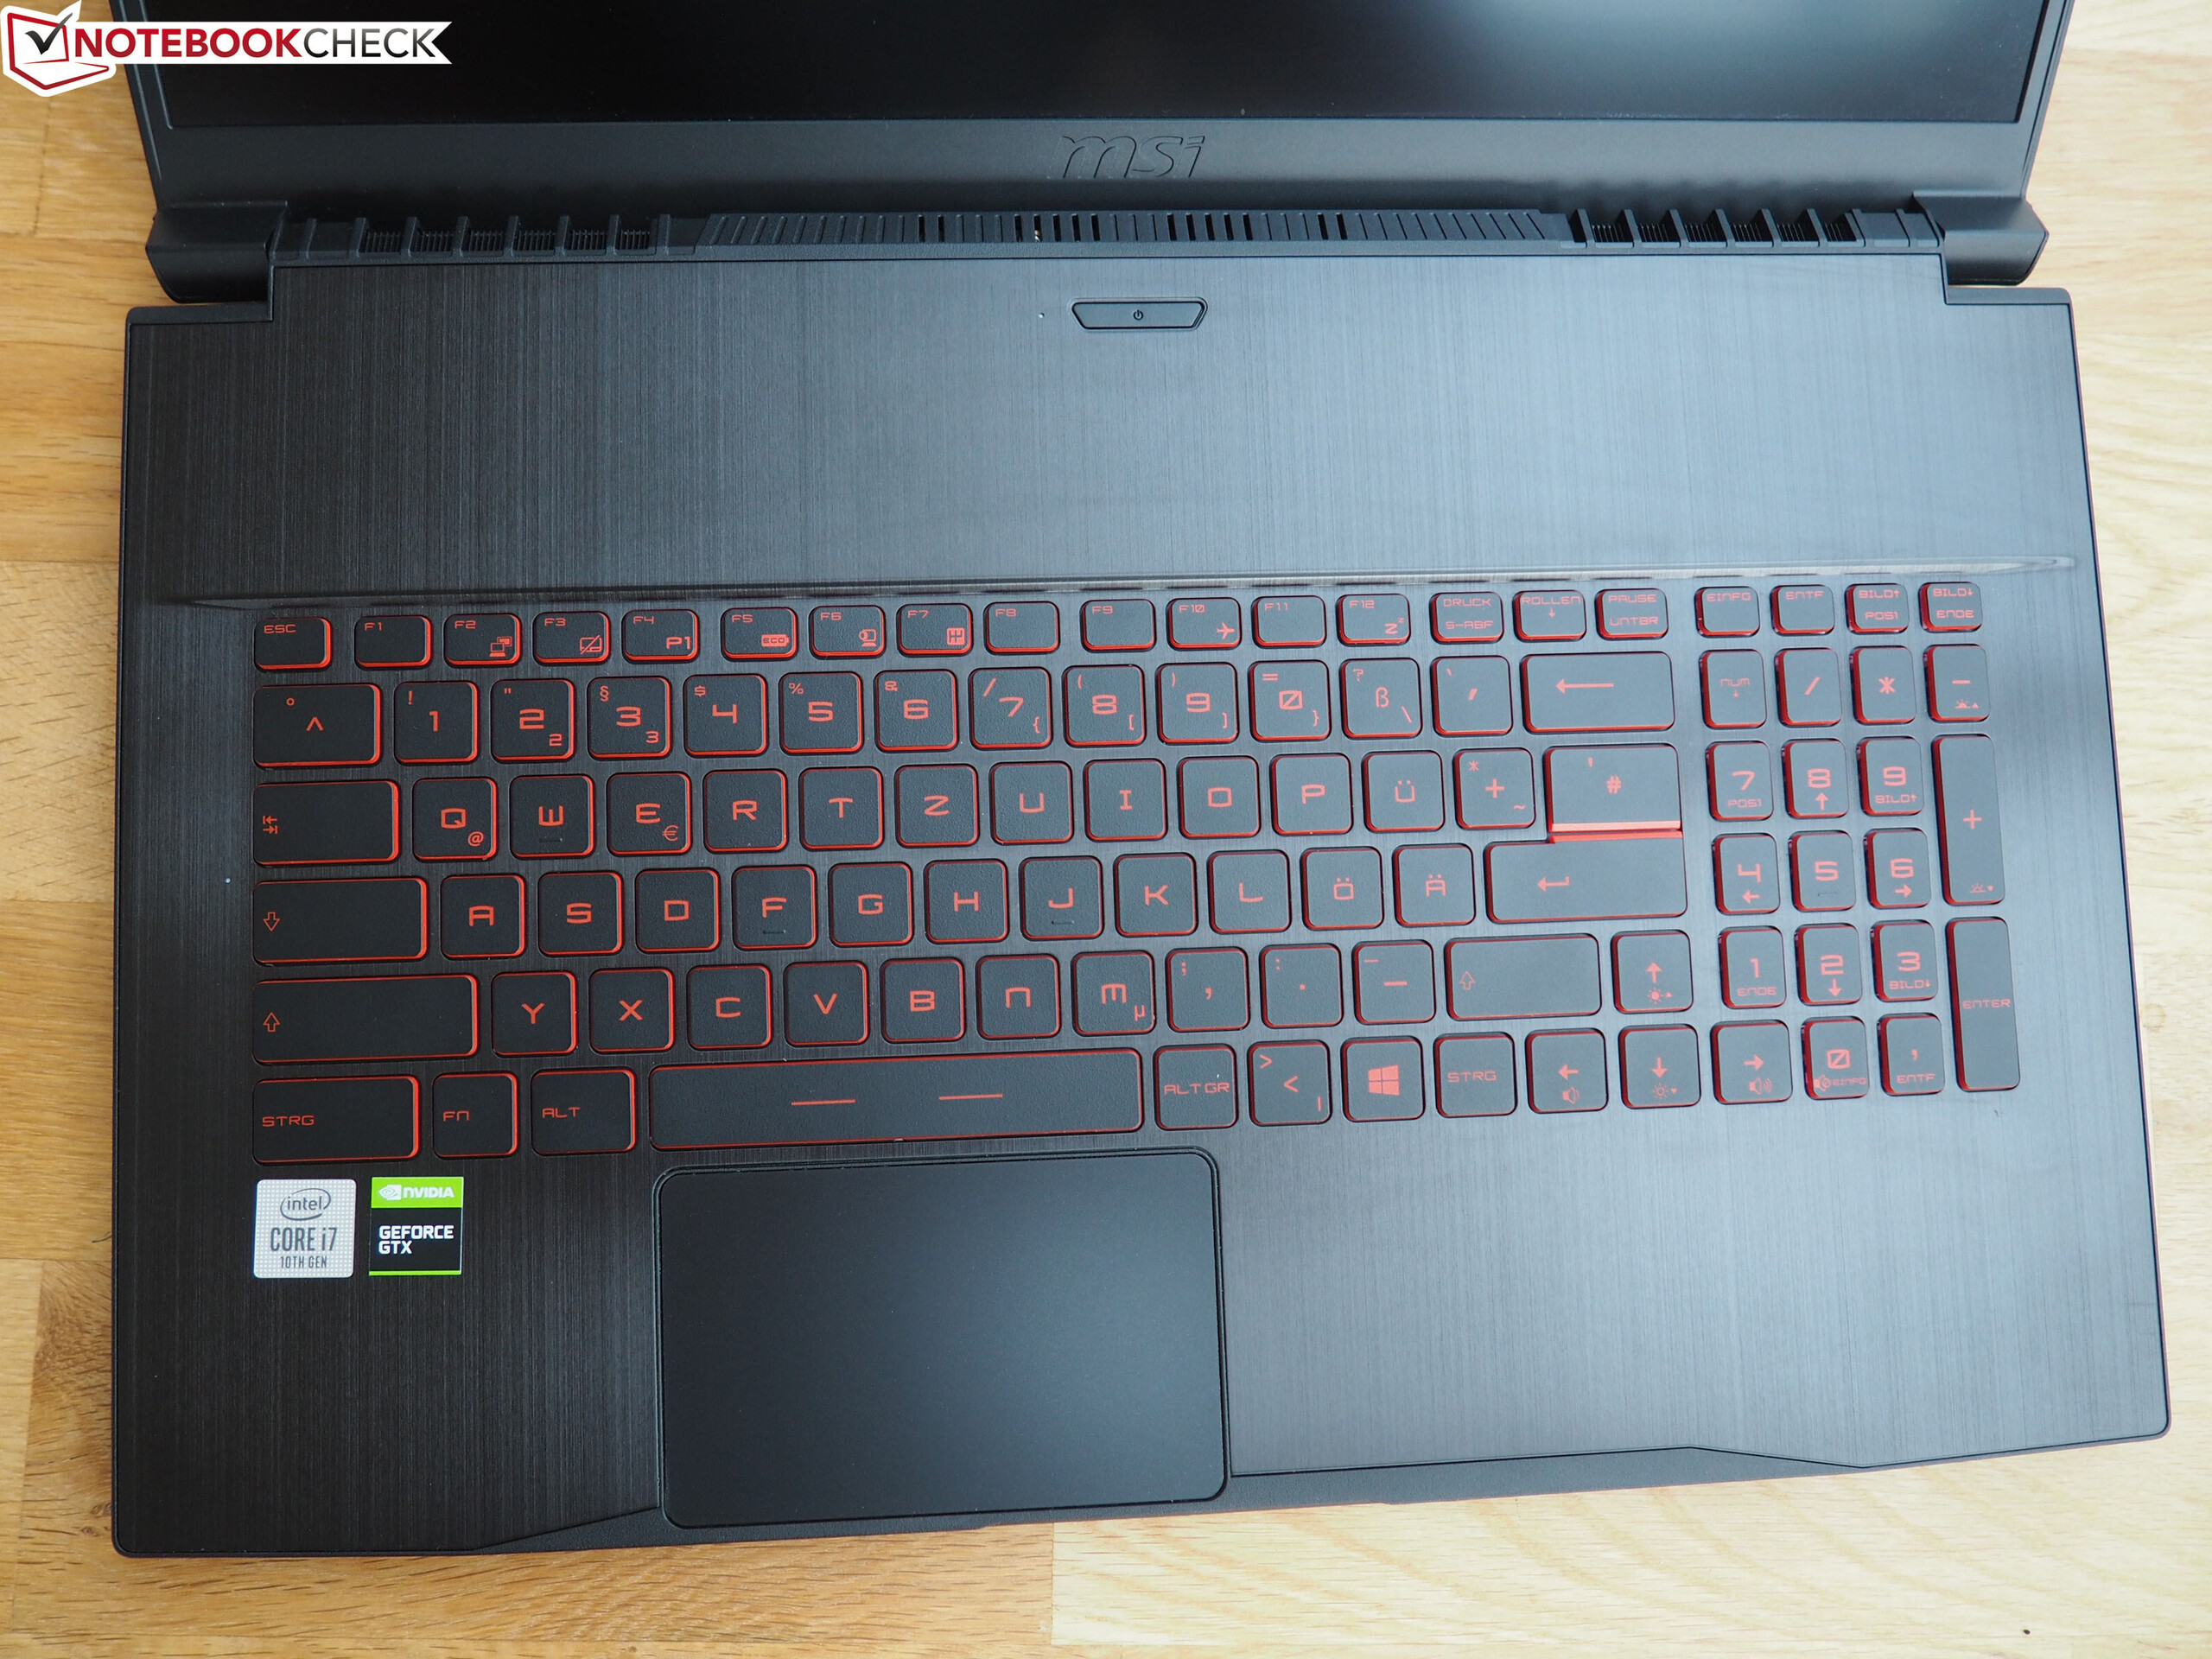
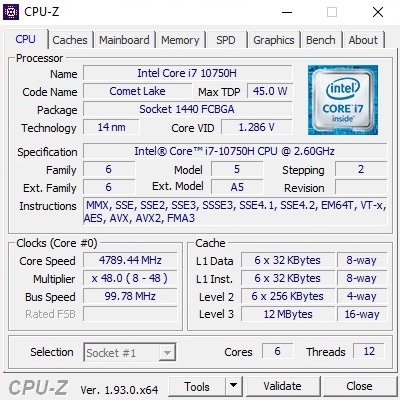
O GeForce GTX 1660 Ti é muito mais rápido que o GTX 1650 (Ti) que geralmente é encontrado em portáteis com preços semelhantes. O desempenho da CPU também é impressionante, embora tivéssemos desejado um Ryzen 5 4600H em vez do Core i7-10750H, o que teria sido não apenas potencialmente mais rápido, mas também mais eficiente, mais frio e, portanto, também mais silencioso graças ao seu processo de fabricação de 7 nm (em comparação com 14 nm). O resto do hardware era adequado. 16 GB of RAM, an M.2 PCIe SSD, and a 144 Hz panel are up to date.
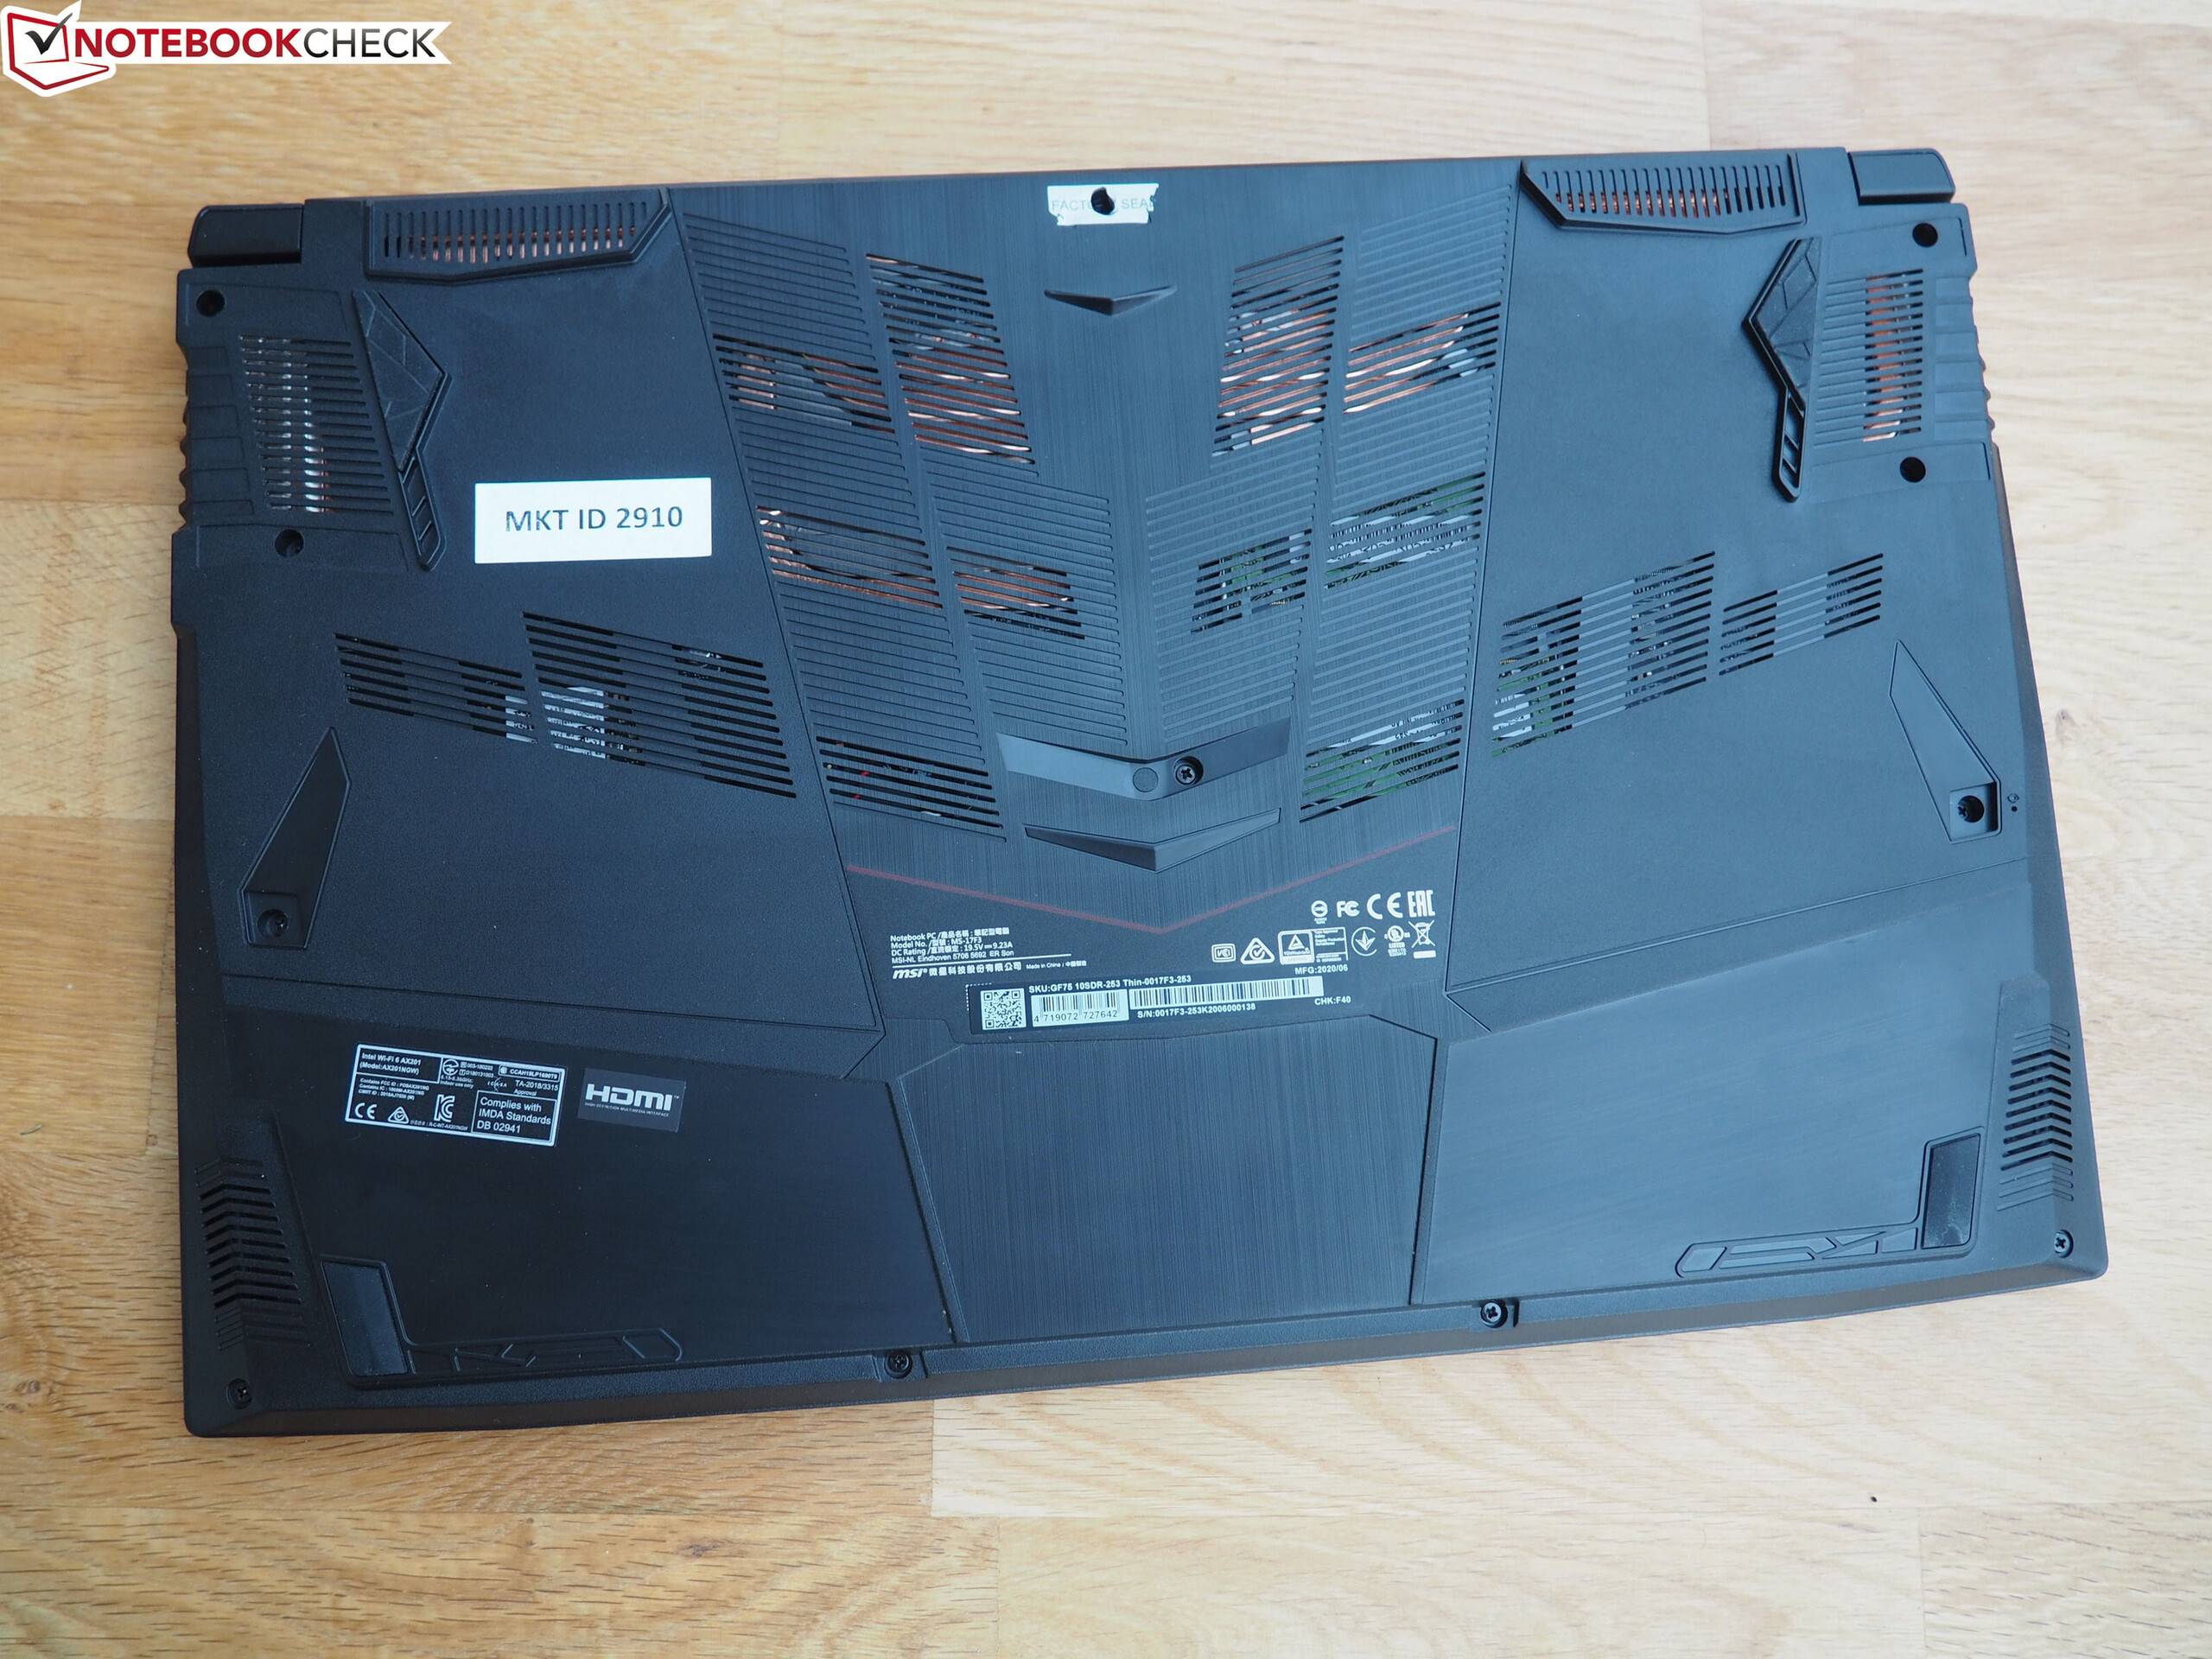
Uma pontuação mais alta poderia ter sido alcançada com melhor conectividade (sem Thunderbolt 3, sem leitor de cartão, sem DisplayPort), melhor gerenciamento do ventilador e uma bateria de maior capacidade. Os Patinhas entre nós ainda terão dificuldade em resistir. Considerando que uma licença do Windows 10 pode ser adquirida por cerca de US$ 50 já, o fato de o dispositivo ser vendido sem ela em alguns países só será problemático para iniciantes inexperientes.
MSI GF75 Thin 10SDR
- 10/06/2020 v7 (old)
Florian Glaser
Price comparison