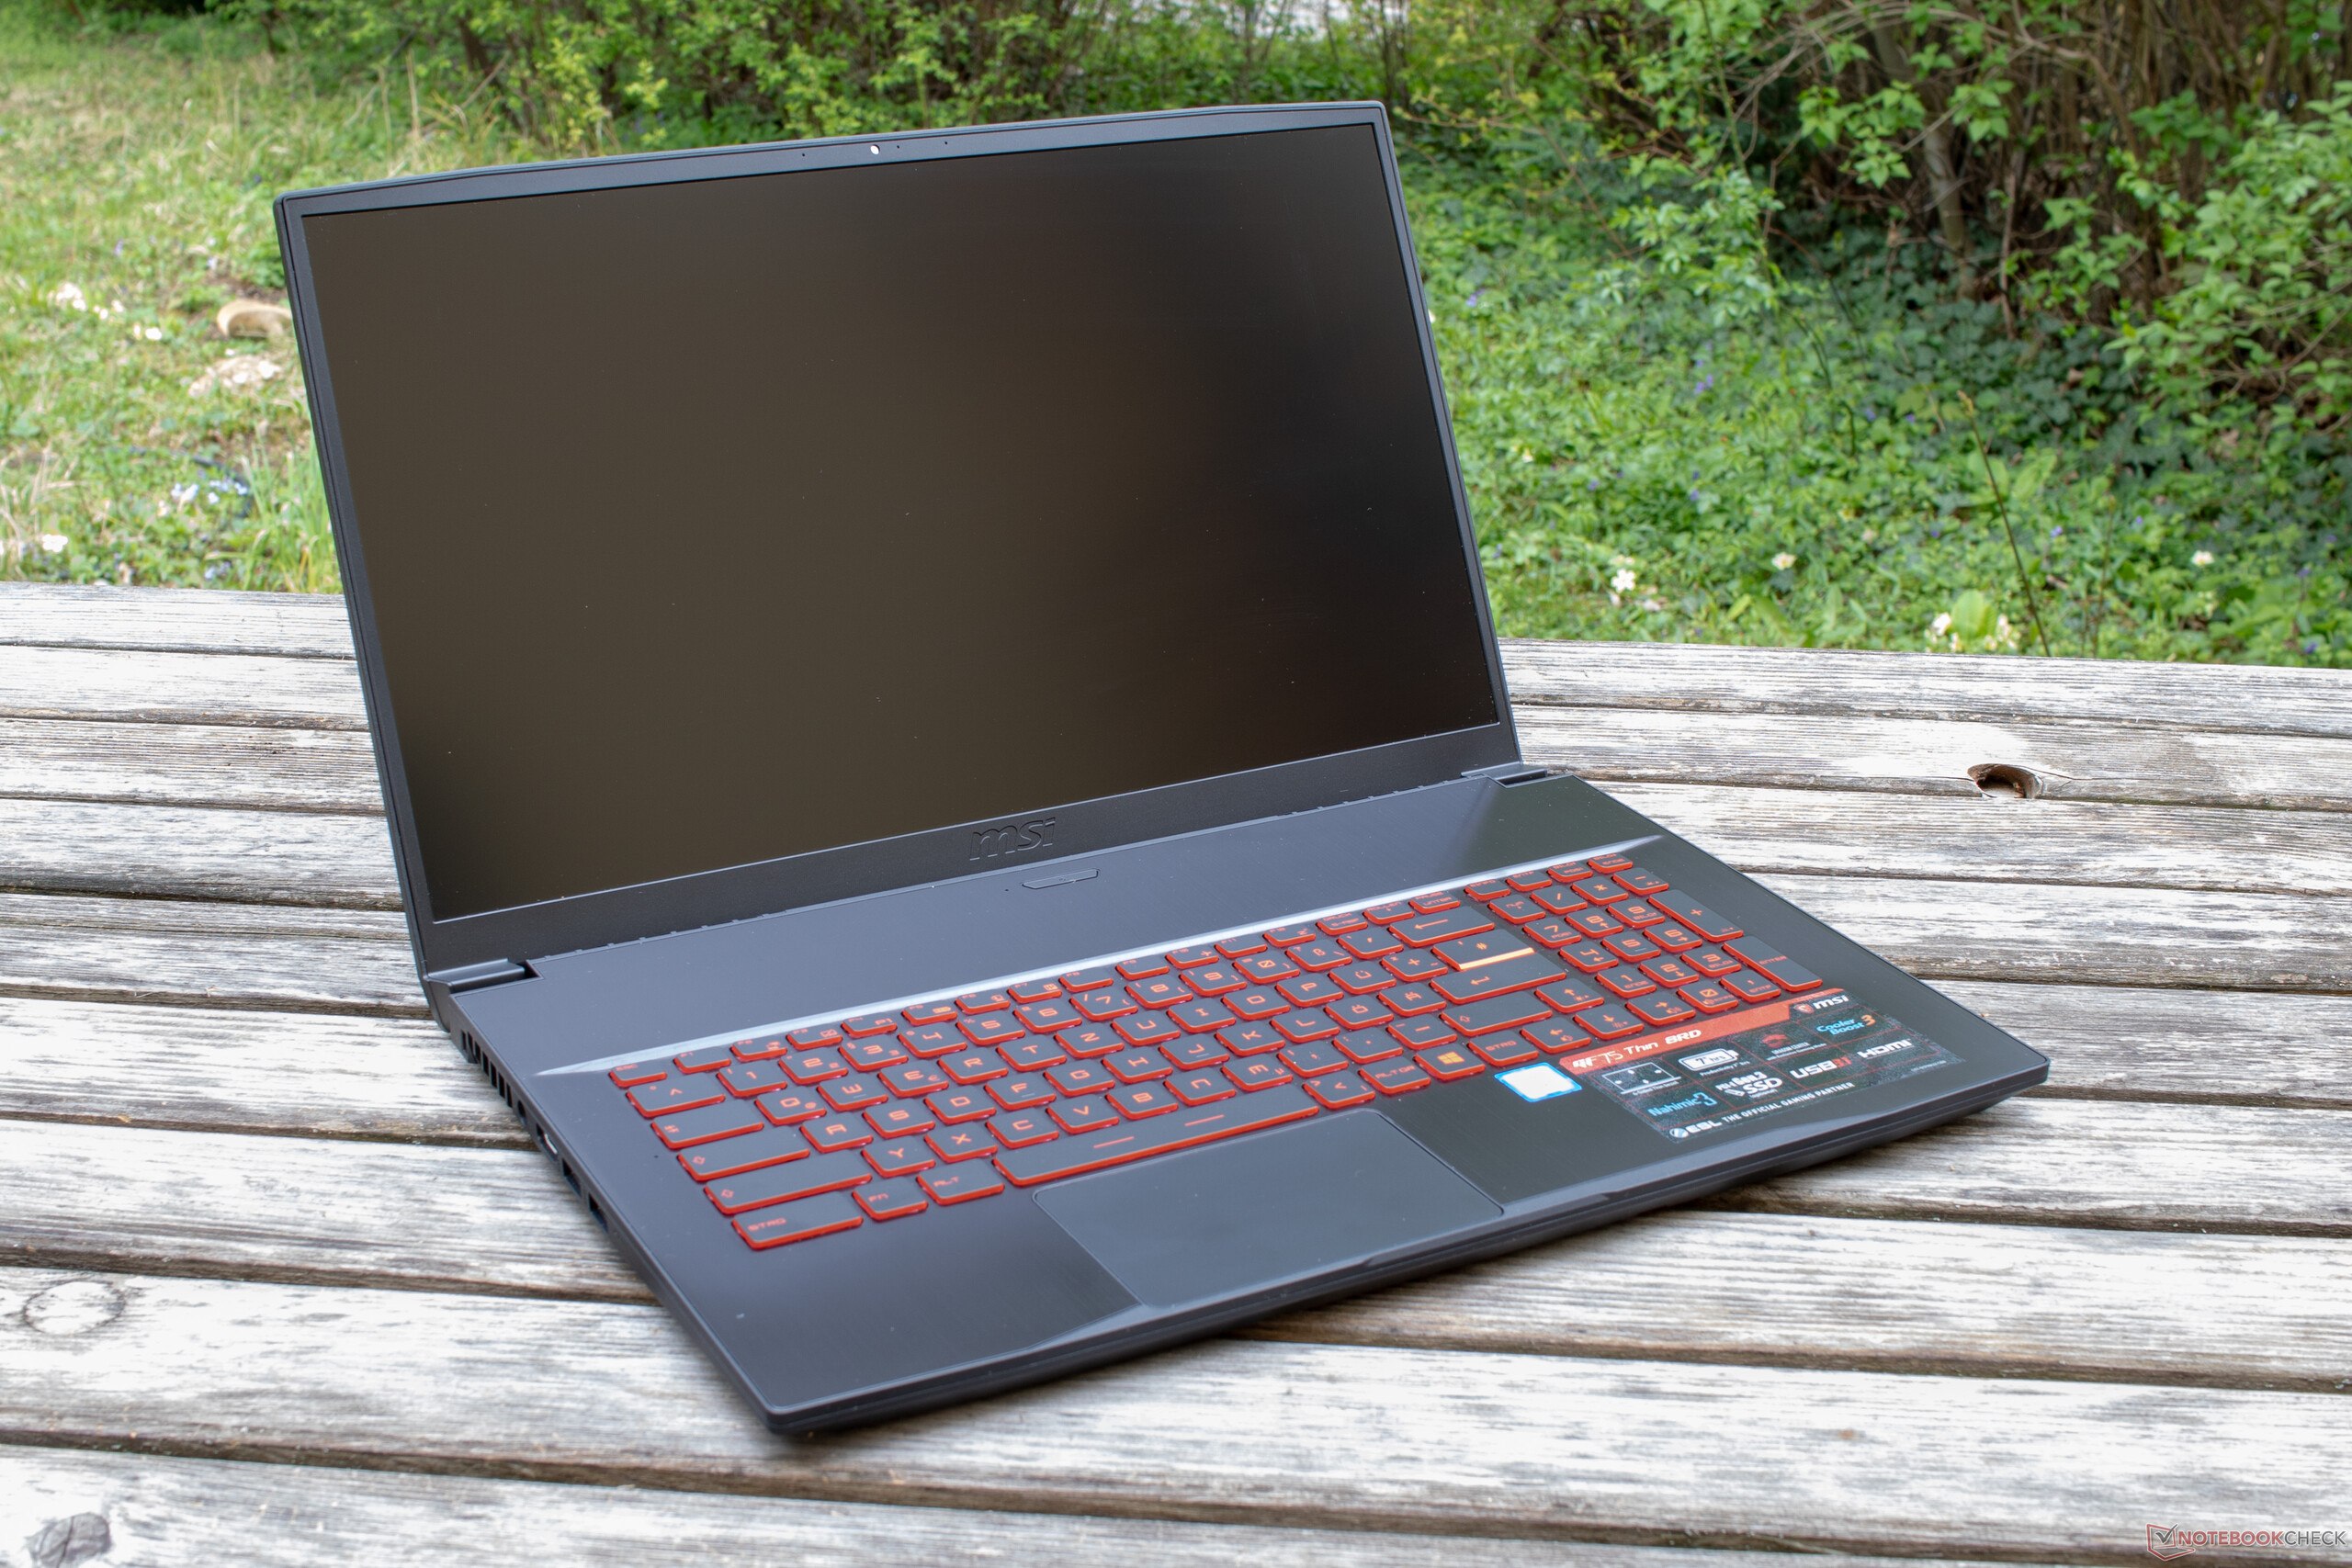
Breve Análise do Portátil MSI GF75 Thin 3RD (i7-8750H, GTX 1050Ti Max-Q)


| Networking | |
| iperf3 transmit AX12 | |
| HP Pavilion Gaming 15-cx0003ng | |
| Asus TUF FX705GE-EW096T | |
| Medion Erazer P6705-MD61131 | |
| Acer Aspire 7 A715-72G-704Q | |
| Lenovo Legion Y730-17ICH, i7-8750H | |
| MSI GF75 8RD-001 | |
| iperf3 receive AX12 | |
| Medion Erazer P6705-MD61131 | |
| Asus TUF FX705GE-EW096T | |
| Lenovo Legion Y730-17ICH, i7-8750H | |
| HP Pavilion Gaming 15-cx0003ng | |
| Acer Aspire 7 A715-72G-704Q | |
| MSI GF75 8RD-001 | |
| |||||||||||||||||||||||||
iluminação: 89 %
iluminação com acumulador: 356 cd/m²
Contraste: 1319:1 (Preto: 0.27 cd/m²)
ΔE ColorChecker Calman: 2.73 | ∀{0.5-29.43 Ø4.72}
calibrated: 2.14
ΔE Greyscale Calman: 2.38 | ∀{0.09-98 Ø4.97}
90% sRGB (Argyll 1.6.3 3D)
59% AdobeRGB 1998 (Argyll 1.6.3 3D)
65.2% AdobeRGB 1998 (Argyll 3D)
90.1% sRGB (Argyll 3D)
64% Display P3 (Argyll 3D)
Gamma: 2.48
CCT: 6643 K
| MSI GF75 8RD-001 B173HAN04.2, , 1920x1080, 17.3" | Asus TUF FX705GE-EW096T AU Optronics B173HAN04.2, , 1920x1080, 17.3" | Lenovo Legion Y730-17ICH, i7-8750H LP173WF4-SPF6, , 1920x1080, 17.3" | Medion Erazer P6705-MD61131 AU Optronics B156HTN03.8 (AUO38ED), , 1920x1080, 15.6" | HP Pavilion Gaming 15-cx0003ng BOE07A1, , 1920x1080, 15.6" | Acer Aspire 7 A715-72G-704Q LG Philips LP156WFC-SPP1, , 1920x1080, 15.6" | |
|---|---|---|---|---|---|---|
| Display | -3% | -2% | -41% | -36% | -38% | |
| Display P3 Coverage (%) | 64 | 63.1 -1% | 66.4 4% | 36.4 -43% | 39.72 -38% | 38.34 -40% |
| sRGB Coverage (%) | 90.1 | 86.8 -4% | 84.9 -6% | 54.8 -39% | 59.3 -34% | 57.5 -36% |
| AdobeRGB 1998 Coverage (%) | 65.2 | 63.5 -3% | 62.1 -5% | 37.61 -42% | 41.04 -37% | 39.65 -39% |
| Response Times | -2% | 9% | 13% | -18% | 11% | |
| Response Time Grey 50% / Grey 80% * (ms) | 38 ? | 39 ? -3% | 36.8 ? 3% | 44.8 ? -18% | 47 ? -24% | 35 ? 8% |
| Response Time Black / White * (ms) | 28 ? | 28 ? -0% | 24 ? 14% | 16 ? 43% | 31 ? -11% | 24 ? 14% |
| PWM Frequency (Hz) | 208 ? | |||||
| Screen | -9% | -47% | -124% | -36% | -55% | |
| Brightness middle (cd/m²) | 356 | 299 -16% | 328.7 -8% | 200 -44% | 241 -32% | 280 -21% |
| Brightness (cd/m²) | 332 | 291 -12% | 318 -4% | 186 -44% | 236 -29% | 248 -25% |
| Brightness Distribution (%) | 89 | 90 1% | 91 2% | 85 -4% | 75 -16% | 81 -9% |
| Black Level * (cd/m²) | 0.27 | 0.28 -4% | 0.51 -89% | 0.43 -59% | 0.15 44% | 0.56 -107% |
| Contrast (:1) | 1319 | 1068 -19% | 645 -51% | 465 -65% | 1607 22% | 500 -62% |
| Colorchecker dE 2000 * | 2.73 | 3.02 -11% | 4.91 -80% | 11.39 -317% | 4.85 -78% | 4.75 -74% |
| Colorchecker dE 2000 max. * | 4.7 | 5.27 -12% | 10.15 -116% | 19.36 -312% | 8.82 -88% | 8.04 -71% |
| Colorchecker dE 2000 calibrated * | 2.14 | 2.76 -29% | 4.27 -100% | 3.05 -43% | 4.93 -130% | |
| Greyscale dE 2000 * | 2.38 | 2.18 8% | 3.9 -64% | 11.73 -393% | 5.15 -116% | 3.21 -35% |
| Gamma | 2.48 89% | 2.48 89% | 2.13 103% | 1.97 112% | 2.49 88% | 2.59 85% |
| CCT | 6643 98% | 6392 102% | 6911 94% | 12614 52% | 7042 92% | 6601 98% |
| Color Space (Percent of AdobeRGB 1998) (%) | 59 | 57 -3% | 55.6 -6% | 35 -41% | 38 -36% | 36 -39% |
| Color Space (Percent of sRGB) (%) | 90 | 87 -3% | 84.7 -6% | 55 -39% | 59 -34% | 57 -37% |
| Média Total (Programa/Configurações) | -5% /
-7% | -13% /
-32% | -51% /
-91% | -30% /
-34% | -27% /
-44% |
* ... menor é melhor
Exibir tempos de resposta
| ↔ Tempo de resposta preto para branco | ||
|---|---|---|
| 28 ms ... ascensão ↗ e queda ↘ combinadas | ↗ 16 ms ascensão | 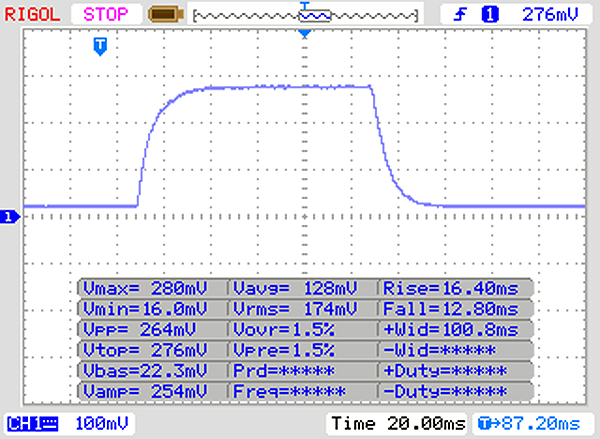 |
| ↘ 12 ms queda | ||
| A tela mostra taxas de resposta relativamente lentas em nossos testes e pode ser muito lenta para os jogadores. Em comparação, todos os dispositivos testados variam de 0.1 (mínimo) a 240 (máximo) ms. » 71 % de todos os dispositivos são melhores. Isso significa que o tempo de resposta medido é pior que a média de todos os dispositivos testados (19.8 ms). | ||
| ↔ Tempo de resposta 50% cinza a 80% cinza | ||
| 38 ms ... ascensão ↗ e queda ↘ combinadas | ↗ 18 ms ascensão | 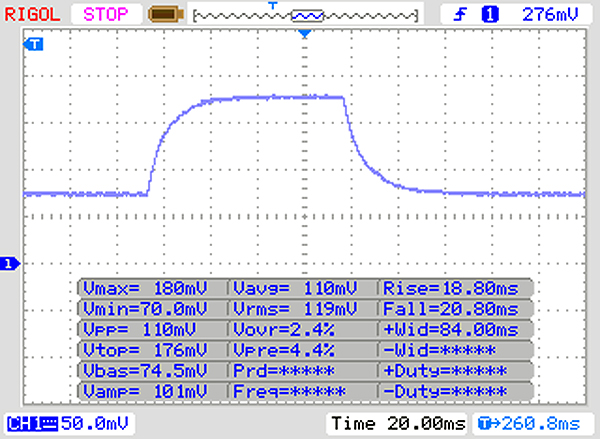 |
| ↘ 20 ms queda | ||
| A tela mostra taxas de resposta lentas em nossos testes e será insatisfatória para os jogadores. Em comparação, todos os dispositivos testados variam de 0.165 (mínimo) a 636 (máximo) ms. » 55 % de todos os dispositivos são melhores. Isso significa que o tempo de resposta medido é pior que a média de todos os dispositivos testados (31 ms). | ||
Cintilação da tela / PWM (modulação por largura de pulso)
| Tela tremeluzindo / PWM não detectado | 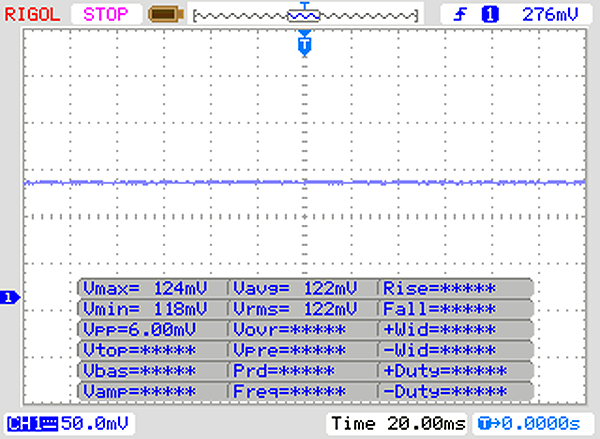 | ||
[pwm_comparison] Em comparação: 52 % de todos os dispositivos testados não usam PWM para escurecer a tela. Se PWM foi detectado, uma média de 7747 (mínimo: 5 - máximo: 343500) Hz foi medida. | |||
| PCMark 8 | |
| Home Score Accelerated v2 | |
| Média da turma Gaming (n=1últimos 2 anos) | |
| HP Pavilion Gaming 15-cx0003ng | |
| MSI GL73 8RD-418US | |
| Asus TUF FX705GE-EW096T | |
| Lenovo Legion Y730-17ICH, i7-8750H | |
| Acer Aspire 7 A715-72G-704Q | |
| Medion Erazer P6705-MD61131 | |
| MSI GF75 8RD-001 | |
| MSI GF63 8RC | |
| Média Intel Core i7-8750H, NVIDIA GeForce GTX 1050 Ti Max-Q (3494 - 3969, n=4) | |
| Work Score Accelerated v2 | |
| Asus TUF FX705GE-EW096T | |
| MSI GL73 8RD-418US | |
| Medion Erazer P6705-MD61131 | |
| Lenovo Legion Y730-17ICH, i7-8750H | |
| MSI GF75 8RD-001 | |
| Acer Aspire 7 A715-72G-704Q | |
| HP Pavilion Gaming 15-cx0003ng | |
| MSI GF63 8RC | |
| Média Intel Core i7-8750H, NVIDIA GeForce GTX 1050 Ti Max-Q (4316 - 5317, n=4) | |
| Média da turma Gaming (n=1últimos 2 anos) | |
| PCMark 8 Home Score Accelerated v2 | 3969 pontos | |
| PCMark 8 Work Score Accelerated v2 | 5317 pontos | |
| PCMark 10 Score | 4437 pontos | |
Ajuda | ||
| MSI GF75 8RD-001 Kingston RBUSNS8154P3256GJ1 | Asus TUF FX705GE-EW096T SK hynix BC501 HFM128GDJTNG-831 | Lenovo Legion Y730-17ICH, i7-8750H Toshiba KBG30ZMT128G | Medion Erazer P6705-MD61131 Samsung SSD PM981 MZVLB256HAHQ | HP Pavilion Gaming 15-cx0003ng Intel Optane 16 GB MEMPEK1J016GAH + HGST HTS721010A9E630 1 TB HDD | Acer Aspire 7 A715-72G-704Q Intel SSD 760p SSDPEKKW256G8 | Média Kingston RBUSNS8154P3256GJ1 | |
|---|---|---|---|---|---|---|---|
| CrystalDiskMark 5.2 / 6 | -13% | -39% | 62% | -7% | 37% | 47% | |
| Write 4K (MB/s) | 72.1 | 90.3 25% | 71.4 -1% | 107 48% | 59.2 -18% | 103.4 43% | 141.1 ? 96% |
| Read 4K (MB/s) | 28.12 | 37.03 32% | 29.98 7% | 39.91 42% | 91.3 225% | 56 99% | 82.4 ? 193% |
| Write Seq (MB/s) | 746 | 320.3 -57% | 129.6 -83% | 1439 93% | 158.3 -79% | 808 8% | 722 ? -3% |
| Read Seq (MB/s) | 834 | 1012 21% | 843 1% | 2011 141% | 880 6% | 1939 132% | 974 ? 17% |
| Write 4K Q32T1 (MB/s) | 313.7 | 196.8 -37% | 88.9 -72% | 282.1 -10% | 161.8 -48% | 281.3 -10% | 418 ? 33% |
| Read 4K Q32T1 (MB/s) | 348.7 | 271.5 -22% | 196.4 -44% | 326.6 -6% | 286.5 -18% | 326.5 -6% | 571 ? 64% |
| Write Seq Q32T1 (MB/s) | 854 | 268.8 -69% | 130.5 -85% | 1441 69% | 159.8 -81% | 474.1 -44% | 717 ? -16% |
| Read Seq Q32T1 (MB/s) | 1587 | 1595 1% | 1037 -35% | 3516 122% | 929 -41% | 2735 72% | 1413 ? -11% |
| AS SSD | -56% | -147% | 12% | -1524% | 4% | -11% | |
| Seq Read (MB/s) | 1416 | 878 -38% | 979 -31% | 2724 92% | 854 -40% | 2493 76% | 1195 ? -16% |
| Seq Write (MB/s) | 798 | 336.8 -58% | 125.4 -84% | 1365 71% | 147 -82% | 1241 56% | 668 ? -16% |
| 4K Read (MB/s) | 38.92 | 23.76 -39% | 19.73 -49% | 46.14 19% | 105.1 170% | 41.22 6% | 33.6 ? -14% |
| 4K Write (MB/s) | 100.1 | 92 -8% | 38.73 -61% | 102.6 2% | 59.5 -41% | 112.4 12% | 82.6 ? -17% |
| 4K-64 Read (MB/s) | 726 | 248.9 -66% | 168.6 -77% | 567 -22% | 42.09 -94% | 522 -28% | 667 ? -8% |
| 4K-64 Write (MB/s) | 584 | 112.5 -81% | 31.38 -95% | 459.8 -21% | 137.3 -76% | 470.7 -19% | 561 ? -4% |
| Access Time Read * (ms) | 0.072 | 0.141 -96% | 0.519 -621% | 0.08 -11% | 14.99 -20719% | 0.058 19% | 0.117 ? -63% |
| Access Time Write * (ms) | 0.044 | 0.054 -23% | 0.324 -636% | 0.037 16% | 0.043 2% | 0.099 -125% | 0.05571 ? -27% |
| Score Read (Points) | 907 | 360 -60% | 286 -68% | 886 -2% | 233 -74% | 812 -10% | 820 ? -10% |
| Score Write (Points) | 764 | 238 -69% | 86 -89% | 699 -9% | 211 -72% | 707 -7% | 710 ? -7% |
| Score Total (Points) | 2112 | 764 -64% | 479 -77% | 1983 -6% | 577 -73% | 1883 -11% | 1931 ? -9% |
| Copy ISO MB/s (MB/s) | 608 | 224.1 -63% | 272.7 -55% | 110.1 -82% | 968 59% | 773 ? 27% | |
| Copy Program MB/s (MB/s) | 350.7 | 111.9 -68% | 182.9 -48% | 94.1 -73% | 319.4 -9% | 375 ? 7% | |
| Copy Game MB/s (MB/s) | 478.7 | 229.2 -52% | 134.6 -72% | 81.7 -83% | 648 35% | 509 ? 6% | |
| Média Total (Programa/Configurações) | -35% /
-41% | -93% /
-108% | 37% /
33% | -766% /
-972% | 21% /
16% | 18% /
10% |
* ... menor é melhor

| 3DMark 11 - 1280x720 Performance GPU | |
| Média da turma Gaming (21841 - 80022, n=103, últimos 2 anos) | |
| Asus TUF FX705GE-EW096T | |
| Dell XPS 15 9570 i7 UHD | |
| HP Spectre x360 15-df0126ng | |
| Média NVIDIA GeForce GTX 1050 Ti Max-Q (8317 - 9079, n=7) | |
| MSI GF75 8RD-001 | |
| Medion Erazer P6705-MD61131 | |
| Lenovo ThinkPad X1 Extreme-20MF000XGE | |
| HP Pavilion Gaming 15-cx0003ng | |
| MSI GF63 8RC | |
| 3DMark 11 Performance | 9171 pontos | |
| 3DMark Cloud Gate Standard Score | 28253 pontos | |
| 3DMark Fire Strike Score | 6714 pontos | |
Ajuda | ||
| The Witcher 3 | |
| 1920x1080 High Graphics & Postprocessing (Nvidia HairWorks Off) | |
| Média da turma Gaming (n=1últimos 2 anos) | |
| Schenker XMG Neo 17 | |
| Gigabyte Aero 15-Y9 | |
| MSI GF75 8RD-001 | |
| Lenovo Legion Y730-17ICH, i7-8750H | |
| Acer Aspire 7 A715-72G-704Q | |
| Média NVIDIA GeForce GTX 1050 Ti Max-Q (42.6 - 60, n=6) | |
| Asus TUF FX705GE-EW096T | |
| HP Spectre x360 15-df0126ng | |
| Medion Erazer P6705-MD61131 | |
| HP Pavilion Gaming 15-cx0003ng | |
| Acer Aspire 5 A515-52G-723L | |
| 1920x1080 Ultra Graphics & Postprocessing (HBAO+) | |
| Média da turma Gaming (104.7 - 240, n=6, últimos 2 anos) | |
| MSI GS75 8SG Stealth | |
| Schenker XMG Neo 17 | |
| Gigabyte Aero 15-Y9 | |
| MSI GF75 8RD-001 | |
| Acer Aspire 7 A715-72G-704Q | |
| Média NVIDIA GeForce GTX 1050 Ti Max-Q (23.5 - 43, n=7) | |
| Lenovo Legion Y730-17ICH, i7-8750H | |
| Asus TUF FX705GE-EW096T | |
| HP Spectre x360 15-df0126ng | |
| Medion Erazer P6705-MD61131 | |
| HP Pavilion Gaming 15-cx0003ng | |
| Acer Aspire 5 A515-52G-723L | |
| Far Cry New Dawn | |
| 1920x1080 High Preset | |
| MSI GS75 8SG Stealth | |
| Schenker XMG Neo 17 | |
| Gigabyte Aero 15-Y9 | |
| MSI GF75 8RD-001 | |
| Média NVIDIA GeForce GTX 1050 Ti Max-Q (43 - 46, n=2) | |
| HP Spectre x360 15-df0126ng | |
| MSI GE72 7RE | |
| Acer Aspire 5 A515-52G-723L | |
| 1920x1080 Ultra Preset | |
| MSI GS75 8SG Stealth | |
| Schenker XMG Neo 17 | |
| Gigabyte Aero 15-Y9 | |
| MSI GF75 8RD-001 | |
| Média NVIDIA GeForce GTX 1050 Ti Max-Q (40 - 43, n=2) | |
| HP Spectre x360 15-df0126ng | |
| MSI GE72 7RE | |
| Acer Aspire 5 A515-52G-723L | |
| 2560x1440 Ultra Preset | |
| Schenker XMG Neo 17 | |
| MSI GF75 8RD-001 | |
| Média NVIDIA GeForce GTX 1050 Ti Max-Q (n=1) | |
| MSI GE72 7RE | |
| 3840x2160 Ultra Preset | |
| Schenker XMG Neo 17 | |
| Gigabyte Aero 15-Y9 | |
| MSI GF75 8RD-001 | |
| Média NVIDIA GeForce GTX 1050 Ti Max-Q (14 - 15, n=2) | |
| HP Spectre x360 15-df0126ng | |
| MSI GE72 7RE | |
| Metro Exodus | |
| 1920x1080 Medium Quality AF:4x | |
| Schenker XMG Neo 17 | |
| Gigabyte Aero 15-Y9 | |
| HP Spectre x360 15-df0126ng | |
| Média NVIDIA GeForce GTX 1050 Ti Max-Q (31.4 - 49.8, n=2) | |
| MSI GF75 8RD-001 | |
| MSI GE72 7RE | |
| Acer Aspire 5 A515-52G-723L | |
| Lenovo V145-15AST | |
| 1920x1080 High Quality AF:16x | |
| MSI GS75 8SG Stealth | |
| Schenker XMG Neo 17 | |
| Gigabyte Aero 15-Y9 | |
| HP Spectre x360 15-df0126ng | |
| Média NVIDIA GeForce GTX 1050 Ti Max-Q (23.5 - 36.5, n=2) | |
| MSI GF75 8RD-001 | |
| MSI GE72 7RE | |
| Acer Aspire 5 A515-52G-723L | |
| 1920x1080 Ultra Quality AF:16x | |
| Schenker XMG Neo 17 | |
| MSI GS75 8SG Stealth | |
| Gigabyte Aero 15-Y9 | |
| HP Spectre x360 15-df0126ng | |
| Média NVIDIA GeForce GTX 1050 Ti Max-Q (19.3 - 28.3, n=2) | |
| MSI GF75 8RD-001 | |
| MSI GE72 7RE | |
| Acer Aspire 5 A515-52G-723L | |
| baixo | média | alto | ultra | QHD | 4K | |
|---|---|---|---|---|---|---|
| The Witcher 3 (2015) | 145 | 99 | 60 | 43 | ||
| Final Fantasy XV Benchmark (2018) | 75.1 | 37.7 | 25 | |||
| Far Cry New Dawn (2019) | 89 | 50 | 46 | 43 | 29 | 15 |
| Metro Exodus (2019) | 60.4 | 31.4 | 23.5 | 19.3 |
Barulho
| Ocioso |
| 32 / 32 / 32.1 dB |
| Carga |
| 33.6 / 40.6 dB |
 | ||
30 dB silencioso 40 dB(A) audível 50 dB(A) ruidosamente alto |
||
min: | ||
(±) A temperatura máxima no lado superior é 44.2 °C / 112 F, em comparação com a média de 40.4 °C / 105 F , variando de 21.2 a 68.8 °C para a classe Gaming.
(+) A parte inferior aquece até um máximo de 39.1 °C / 102 F, em comparação com a média de 43.2 °C / 110 F
(+) Em uso inativo, a temperatura média para o lado superior é 23.3 °C / 74 F, em comparação com a média do dispositivo de 33.9 °C / ### class_avg_f### F.
(+) Os apoios para as mãos e o touchpad são mais frios que a temperatura da pele, com um máximo de 26.8 °C / 80.2 F e, portanto, são frios ao toque.
(±) A temperatura média da área do apoio para as mãos de dispositivos semelhantes foi 28.8 °C / 83.8 F (+2 °C / 3.6 F).
MSI GF75 8RD-001 análise de áudio
(-) | alto-falantes não muito altos (###valor### dB)
Graves 100 - 315Hz
(-) | quase nenhum baixo - em média 17.3% menor que a mediana
(±) | a linearidade dos graves é média (13.5% delta para a frequência anterior)
Médios 400 - 2.000 Hz
(±) | médios mais altos - em média 6.9% maior que a mediana
(-) | médios não são lineares (16.5% delta para frequência anterior)
Altos 2 - 16 kHz
(+) | agudos equilibrados - apenas 3.8% longe da mediana
(±) | a linearidade dos máximos é média (9.8% delta para frequência anterior)
Geral 100 - 16.000 Hz
(-) | o som geral não é linear (31.4% diferença em relação à mediana)
Comparado com a mesma classe
» 97% de todos os dispositivos testados nesta classe foram melhores, 1% semelhantes, 2% piores
» O melhor teve um delta de 6%, a média foi 18%, o pior foi 132%
Comparado com todos os dispositivos testados
» 90% de todos os dispositivos testados foram melhores, 2% semelhantes, 8% piores
» O melhor teve um delta de 4%, a média foi 23%, o pior foi 134%
Apple MacBook 12 (Early 2016) 1.1 GHz análise de áudio
(+) | os alto-falantes podem tocar relativamente alto (###valor### dB)
Graves 100 - 315Hz
(±) | graves reduzidos - em média 11.3% menor que a mediana
(±) | a linearidade dos graves é média (14.2% delta para a frequência anterior)
Médios 400 - 2.000 Hz
(+) | médios equilibrados - apenas 2.4% longe da mediana
(+) | médios são lineares (5.5% delta para frequência anterior)
Altos 2 - 16 kHz
(+) | agudos equilibrados - apenas 2% longe da mediana
(+) | os máximos são lineares (4.5% delta da frequência anterior)
Geral 100 - 16.000 Hz
(+) | o som geral é linear (10.2% diferença em relação à mediana)
Comparado com a mesma classe
» 7% de todos os dispositivos testados nesta classe foram melhores, 2% semelhantes, 90% piores
» O melhor teve um delta de 5%, a média foi 18%, o pior foi 53%
Comparado com todos os dispositivos testados
» 5% de todos os dispositivos testados foram melhores, 1% semelhantes, 94% piores
» O melhor teve um delta de 4%, a média foi 23%, o pior foi 134%
| desligado | |
| Ocioso | |
| Carga |
|
Key:
min: | |
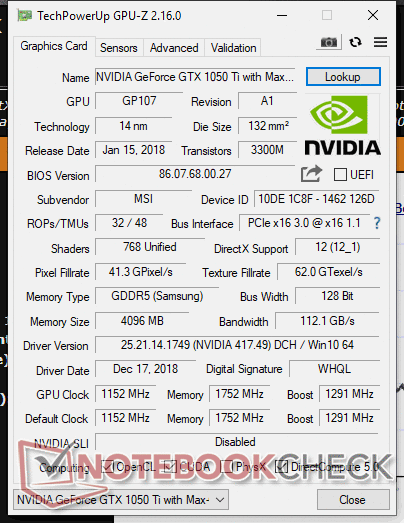
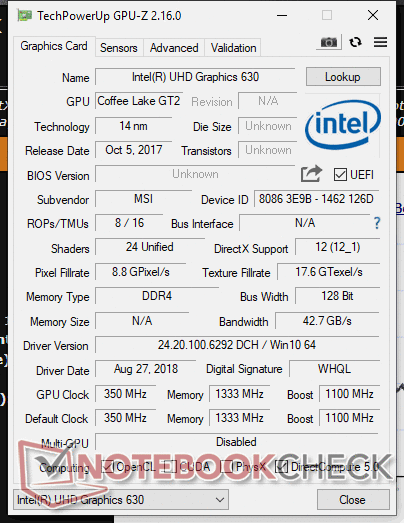
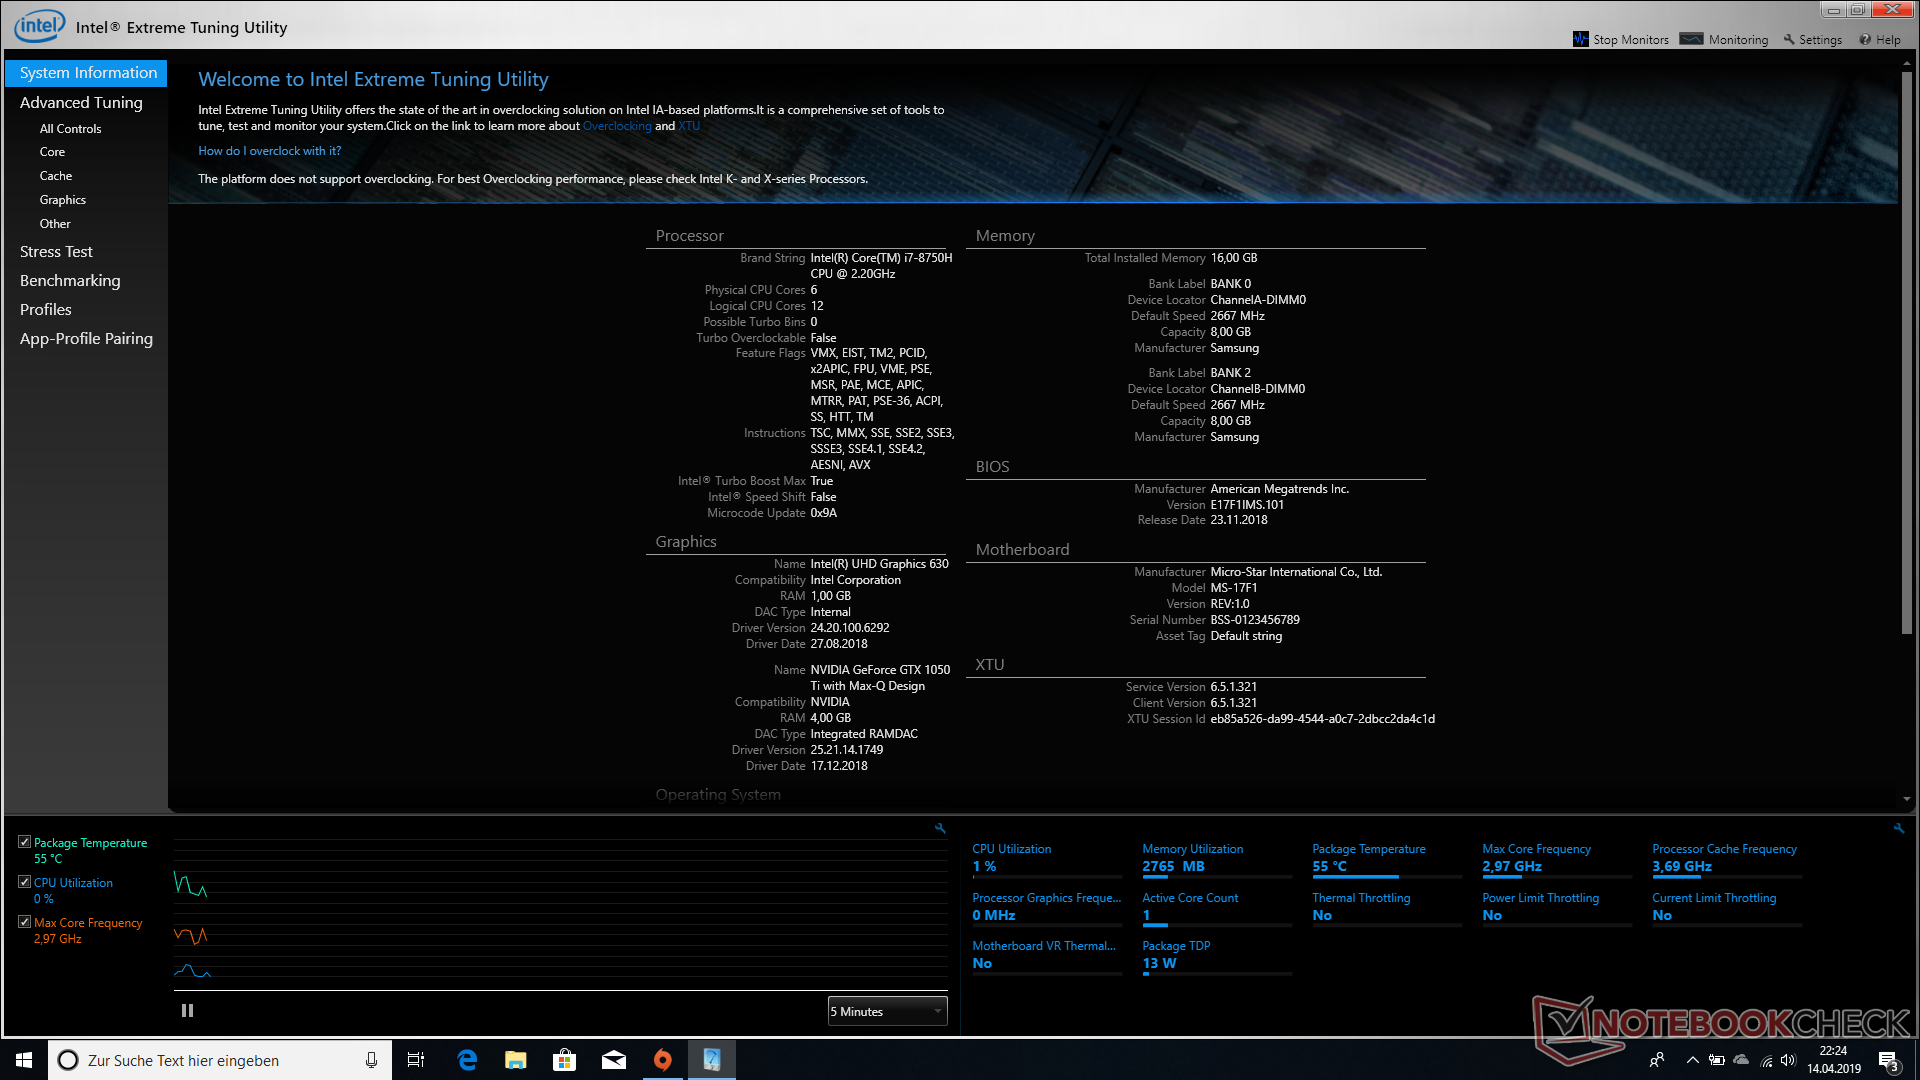
| MSI GF75 8RD-001 i7-8750H, GeForce GTX 1050 Ti Max-Q, Kingston RBUSNS8154P3256GJ1, IPS, 1920x1080, 17.3" | Asus TUF FX705GE-EW096T i7-8750H, GeForce GTX 1050 Ti Mobile, SK hynix BC501 HFM128GDJTNG-831, IPS, 1920x1080, 17.3" | Lenovo Legion Y730-17ICH, i7-8750H i7-8750H, GeForce GTX 1050 Ti Mobile, Toshiba KBG30ZMT128G, IPS, 1920x1080, 17.3" | Medion Erazer P6705-MD61131 i7-8750H, GeForce GTX 1050 Ti Mobile, Samsung SSD PM981 MZVLB256HAHQ, TN, 1920x1080, 15.6" | HP Pavilion Gaming 15-cx0003ng i7-8750H, GeForce GTX 1050 Ti Mobile, Intel Optane 16 GB MEMPEK1J016GAH + HGST HTS721010A9E630 1 TB HDD, IPS, 1920x1080, 15.6" | Acer Aspire 7 A715-72G-704Q i7-8750H, GeForce GTX 1050 Ti Mobile, Intel SSD 760p SSDPEKKW256G8, IPS, 1920x1080, 15.6" | Média NVIDIA GeForce GTX 1050 Ti Max-Q | Média da turma Gaming | |
|---|---|---|---|---|---|---|---|---|
| Power Consumption | 15% | 4% | 18% | 7% | 23% | 4% | -73% | |
| Idle Minimum * (Watt) | 6.5 | 3.8 42% | 6.3 3% | 4 38% | 5.5 15% | 3.9 40% | 5.8 ? 11% | 13 ? -100% |
| Idle Average * (Watt) | 11.9 | 9 24% | 11 8% | 7 41% | 8.5 29% | 6.6 45% | 11.2 ? 6% | 18.7 ? -57% |
| Idle Maximum * (Watt) | 13.1 | 11.2 15% | 11.5 12% | 11 16% | 11.9 9% | 8.5 35% | 13.5 ? -3% | 24.3 ? -85% |
| Load Average * (Watt) | 86 | 101 -17% | 89.8 -4% | 72 16% | 94 -9% | 89 -3% | 86.9 ? -1% | 110.2 ? -28% |
| Load Maximum * (Watt) | 131 | 119.7 9% | 130.7 -0% | 158 -21% | 144 -10% | 134 -2% | 122.4 ? 7% | 258 ? -97% |
| Witcher 3 ultra * (Watt) | 102 | 79 | 86 |
* ... menor é melhor
| MSI GF75 8RD-001 i7-8750H, GeForce GTX 1050 Ti Max-Q, 51 Wh | Lenovo ThinkPad X1 Extreme-20MF000XGE i7-8750H, GeForce GTX 1050 Ti Max-Q, 80 Wh | HP Spectre x360 15-df0126ng i7-8750H, GeForce GTX 1050 Ti Max-Q, 84 Wh | Acer Aspire 7 A715-72G-704Q i7-8750H, GeForce GTX 1050 Ti Mobile, 48.9 Wh | Asus Zephyrus S GX531GX i7-8750H, GeForce RTX 2080 Max-Q, 50 Wh | Medion Erazer P6705-MD61131 i7-8750H, GeForce GTX 1050 Ti Mobile, 62 Wh | Média da turma Gaming | |
|---|---|---|---|---|---|---|---|
| Duração da bateria | 71% | 130% | 54% | -36% | 70% | 70% | |
| Reader / Idle (h) | 6.3 | 11.5 83% | 18.8 198% | 12.3 95% | 8.9 41% | 8.71 ? 38% | |
| H.264 (h) | 3.4 | 6.2 82% | 7.7 126% | 6 76% | 8.64 ? 154% | ||
| WiFi v1.3 (h) | 4.7 | 6.4 36% | 8.8 87% | 6.4 36% | 3 -36% | 6.7 43% | 7.15 ? 52% |
| Load (h) | 1.1 | 2 82% | 2.3 109% | 1.2 9% | 2.5 127% | 1.502 ? 37% | |
| Witcher 3 ultra (h) | 1.1 |
Pro
Contra
A MSI tentou se concentrar no essencial para o GF75 e conseguiu criar um dispositivo decente. Ele tem desempenho suficiente para ser considerado um portátil de jogos, ao mesmo tempo em que oferece uma carcaça fina e uma construção leve. Embora a energeticamente eficiente GeForce 1050 Ti Max-Q com velocidade um pouco limitada não consiga exibir jogos atuais com detalhes altos, deve rodar a maioria dos títulos fluentemente com configurações médias
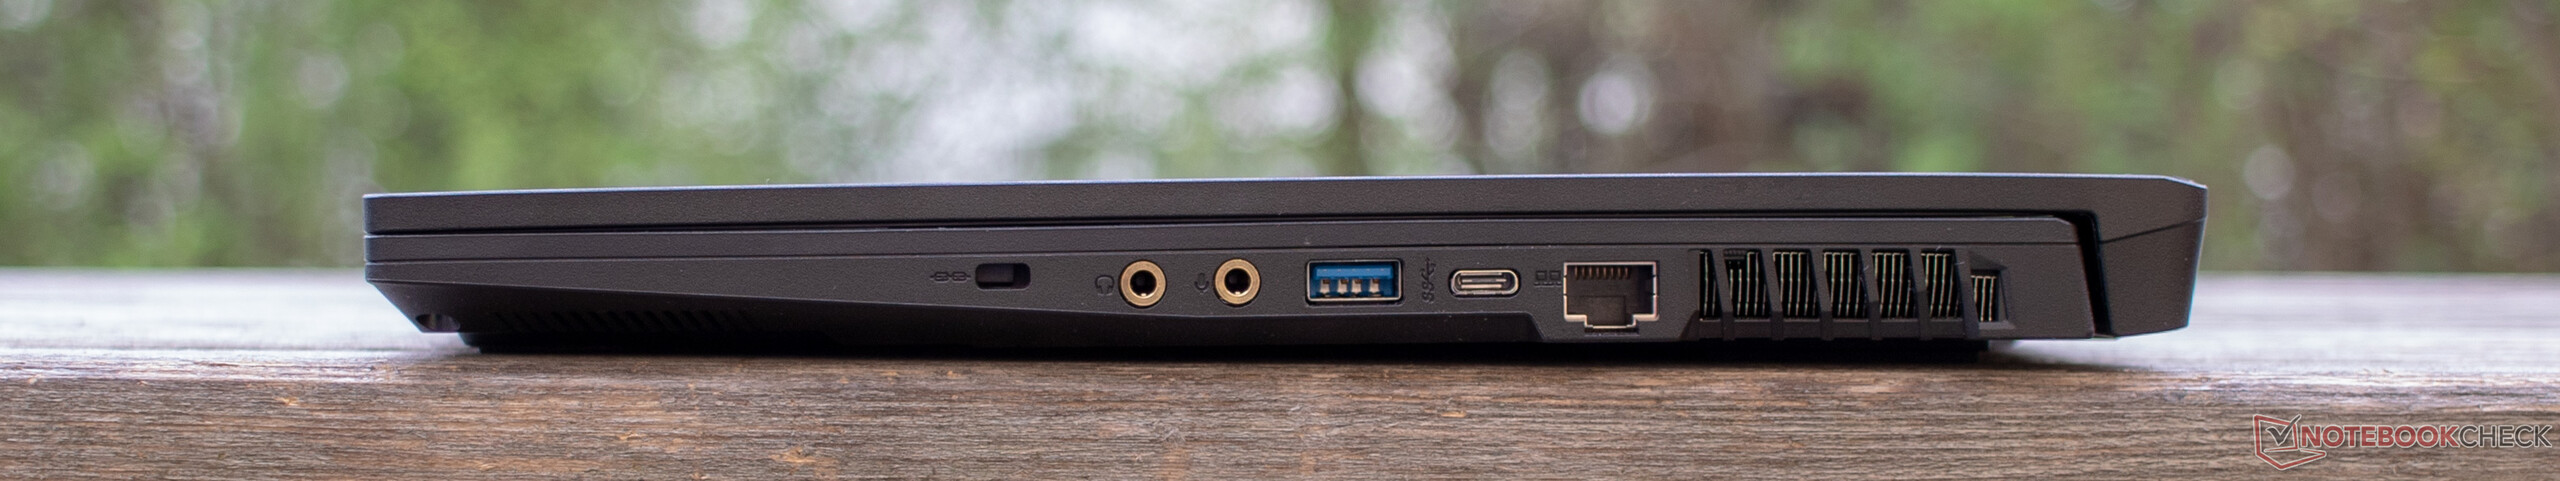
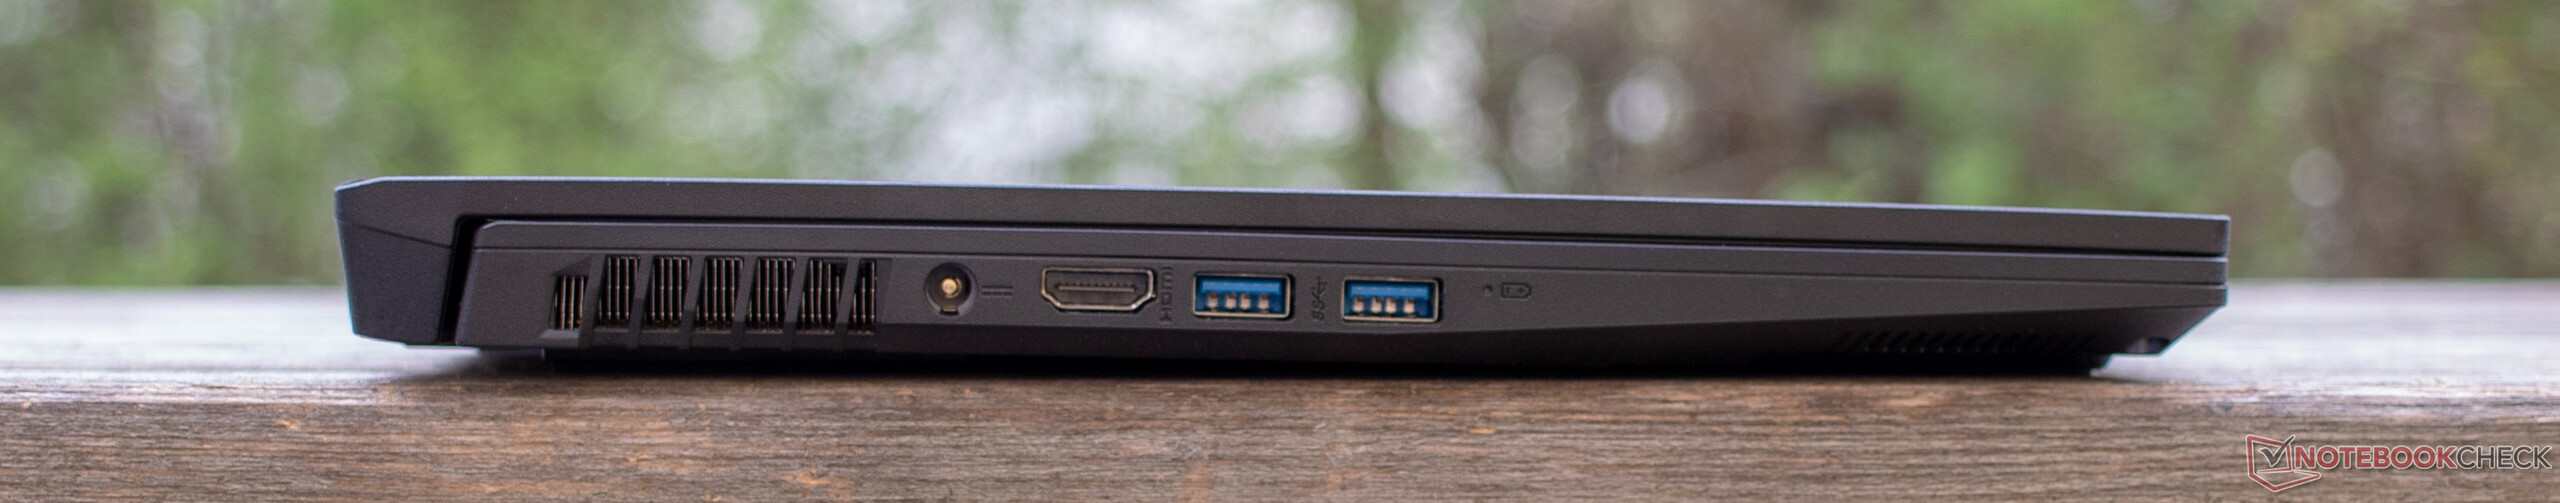
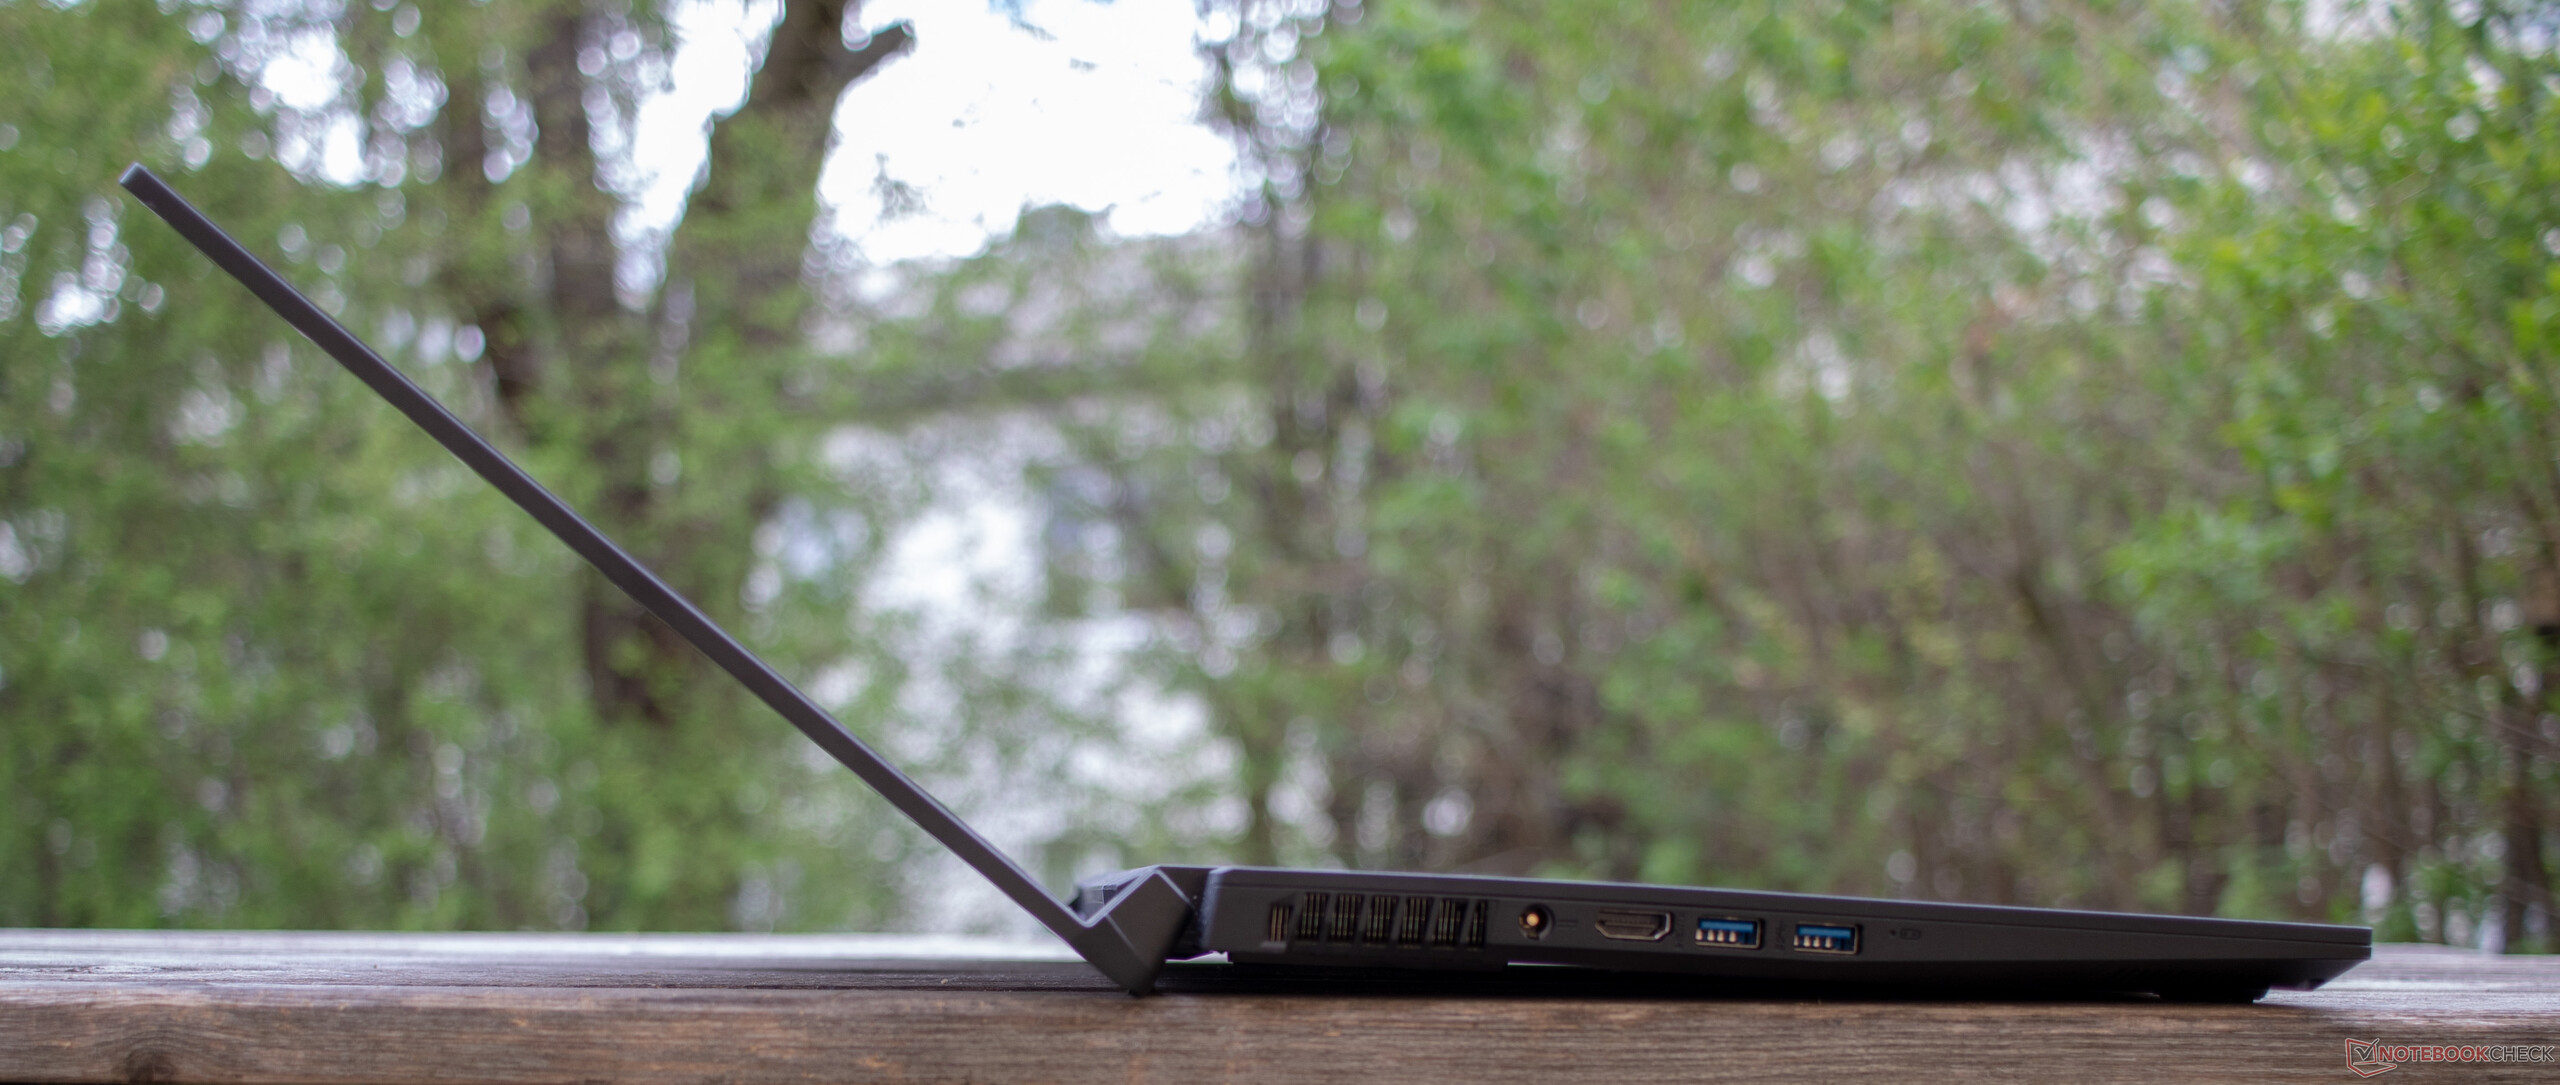
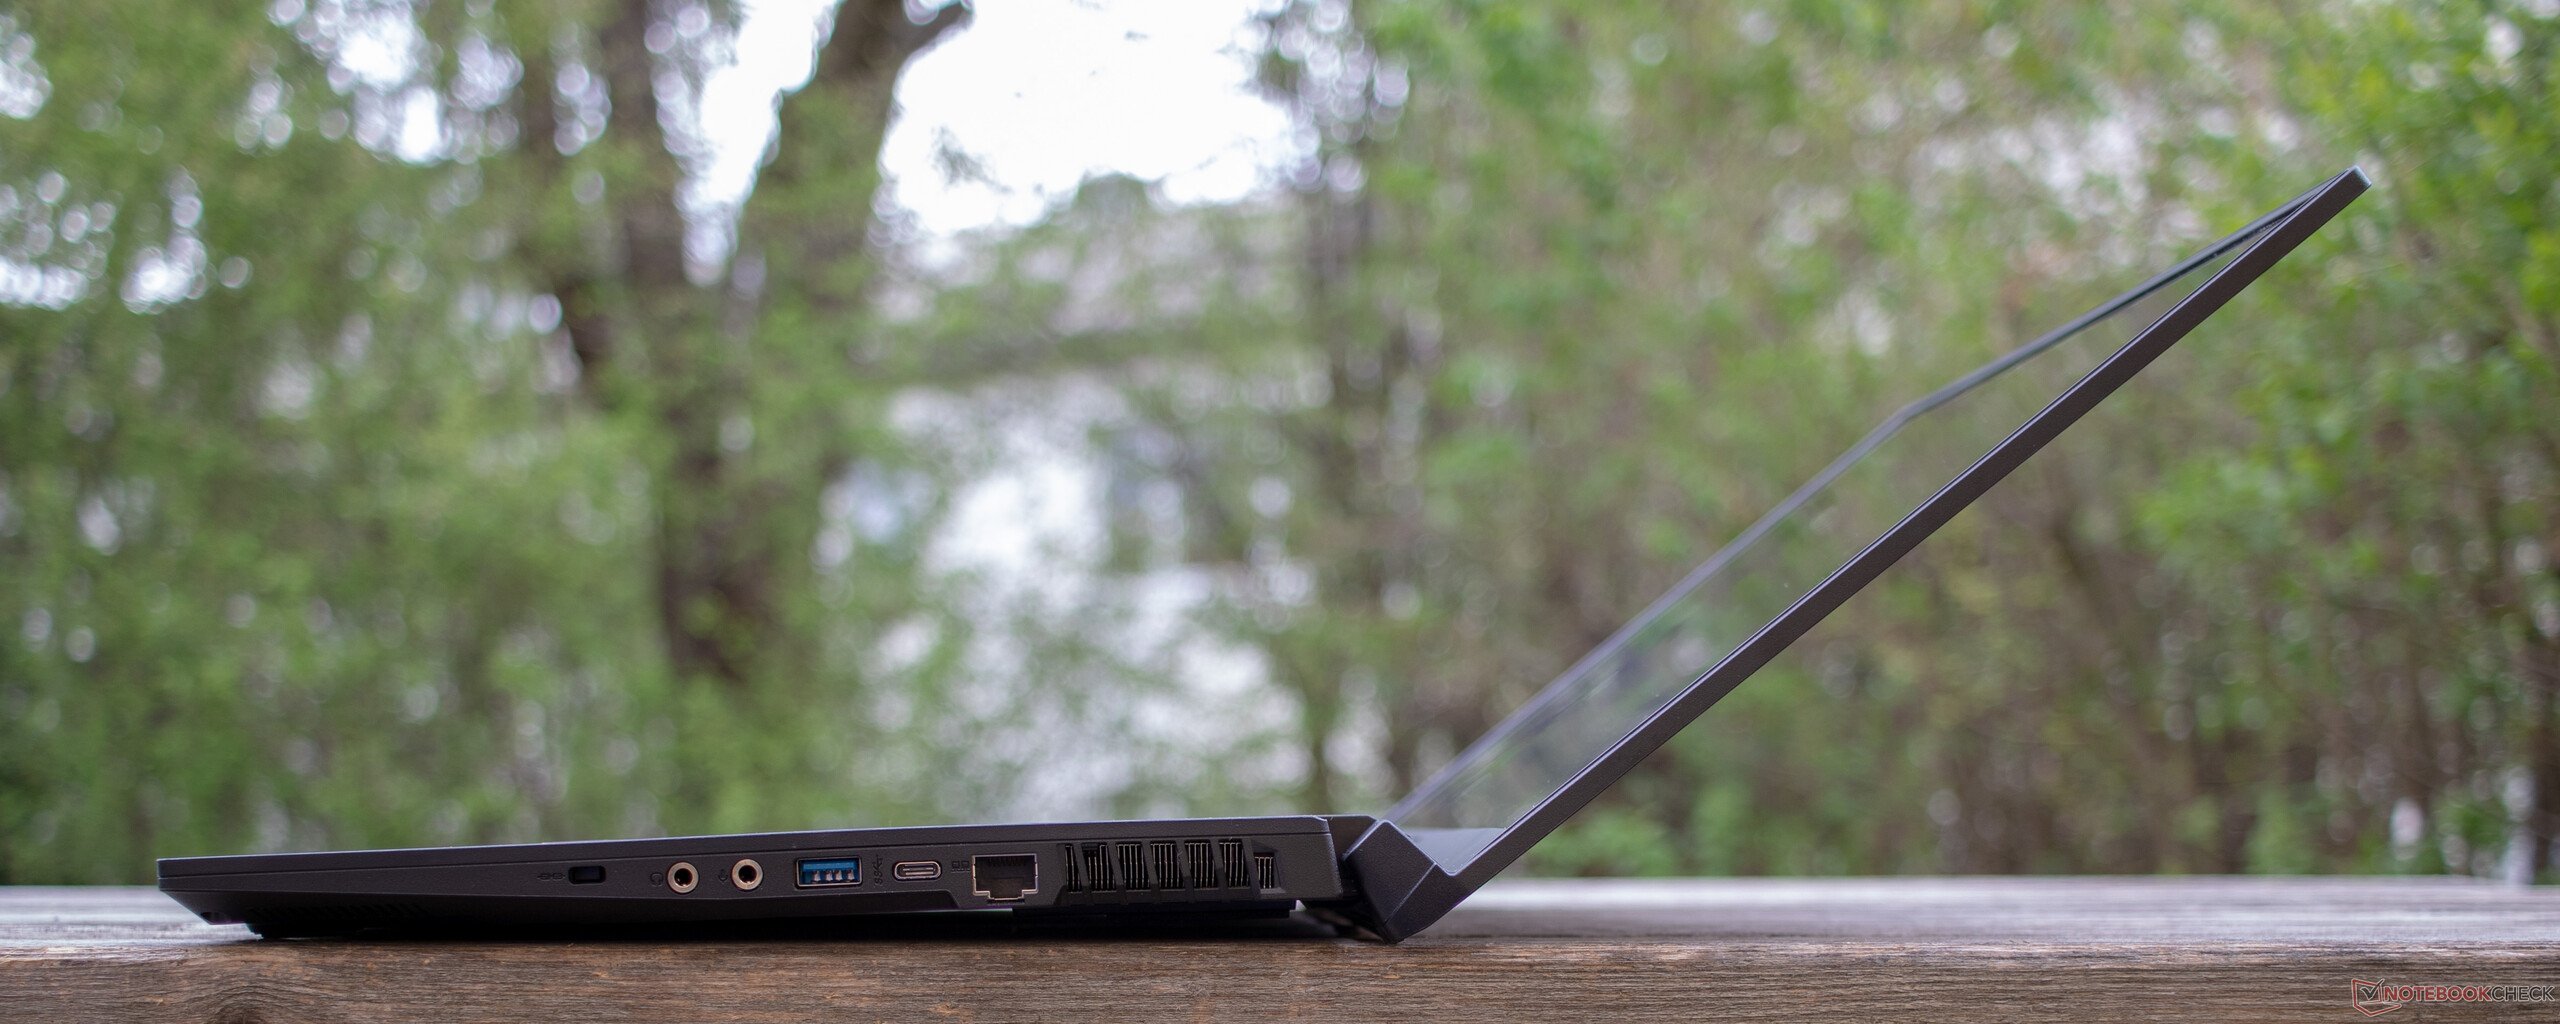
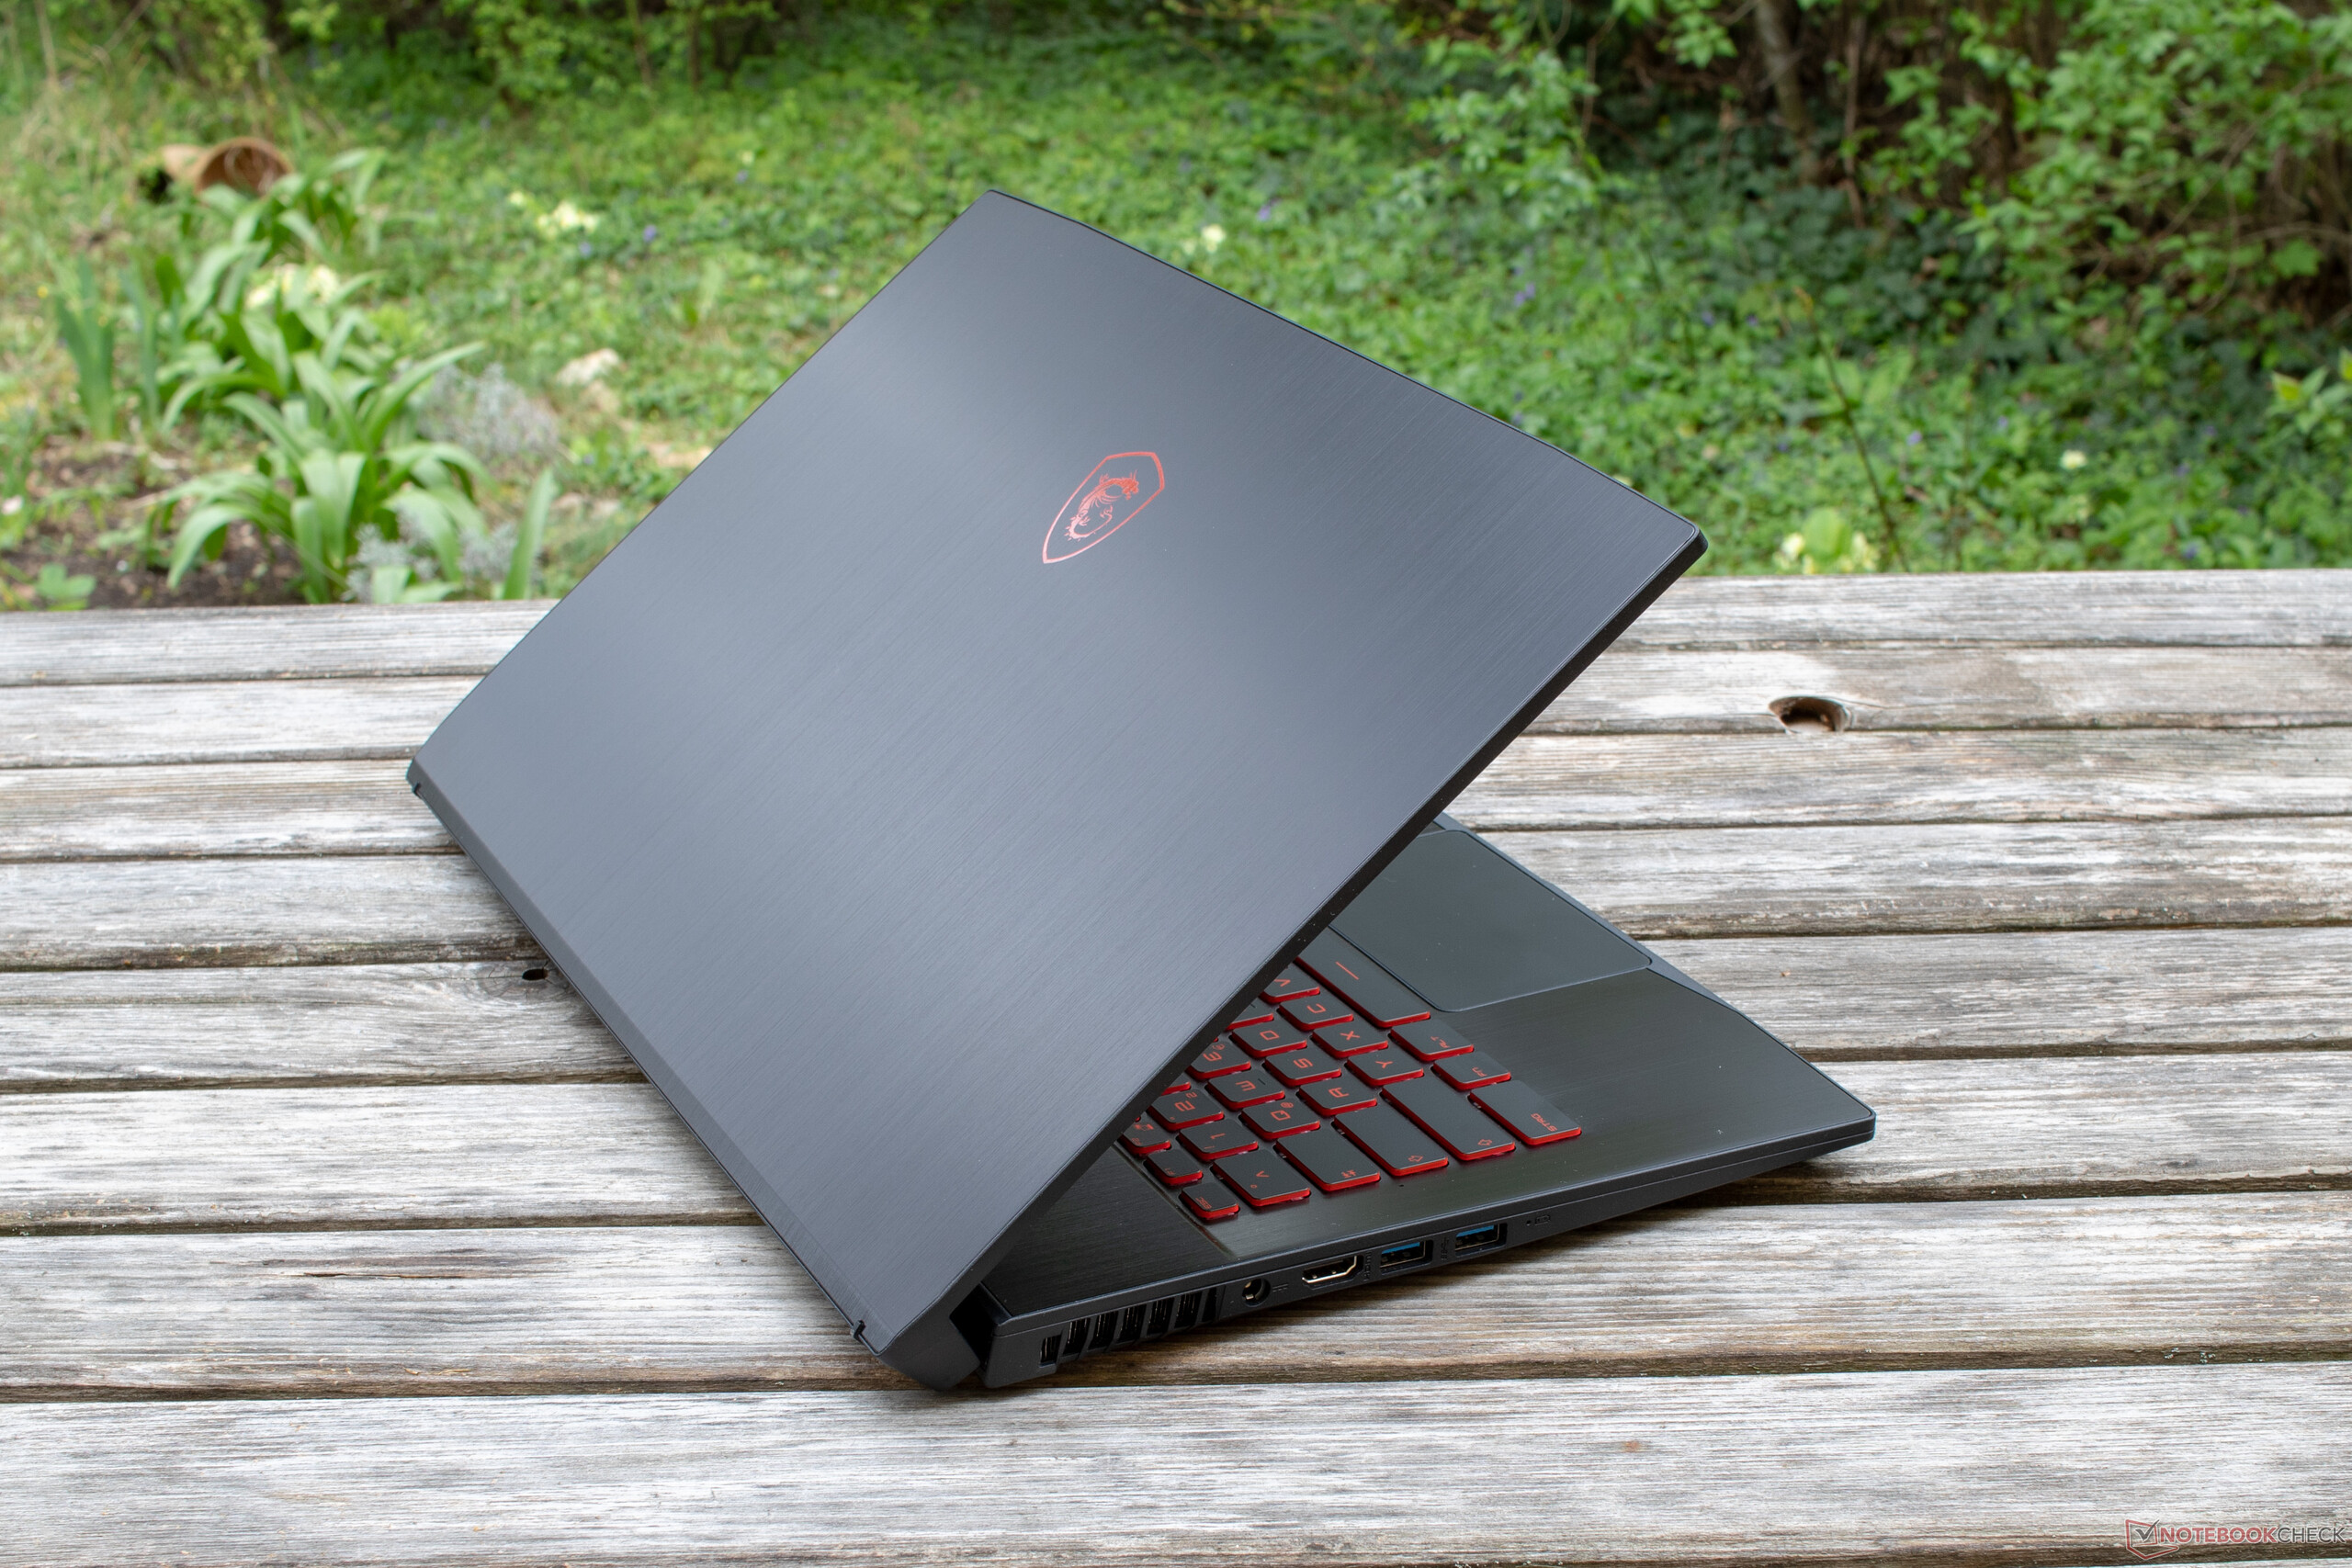
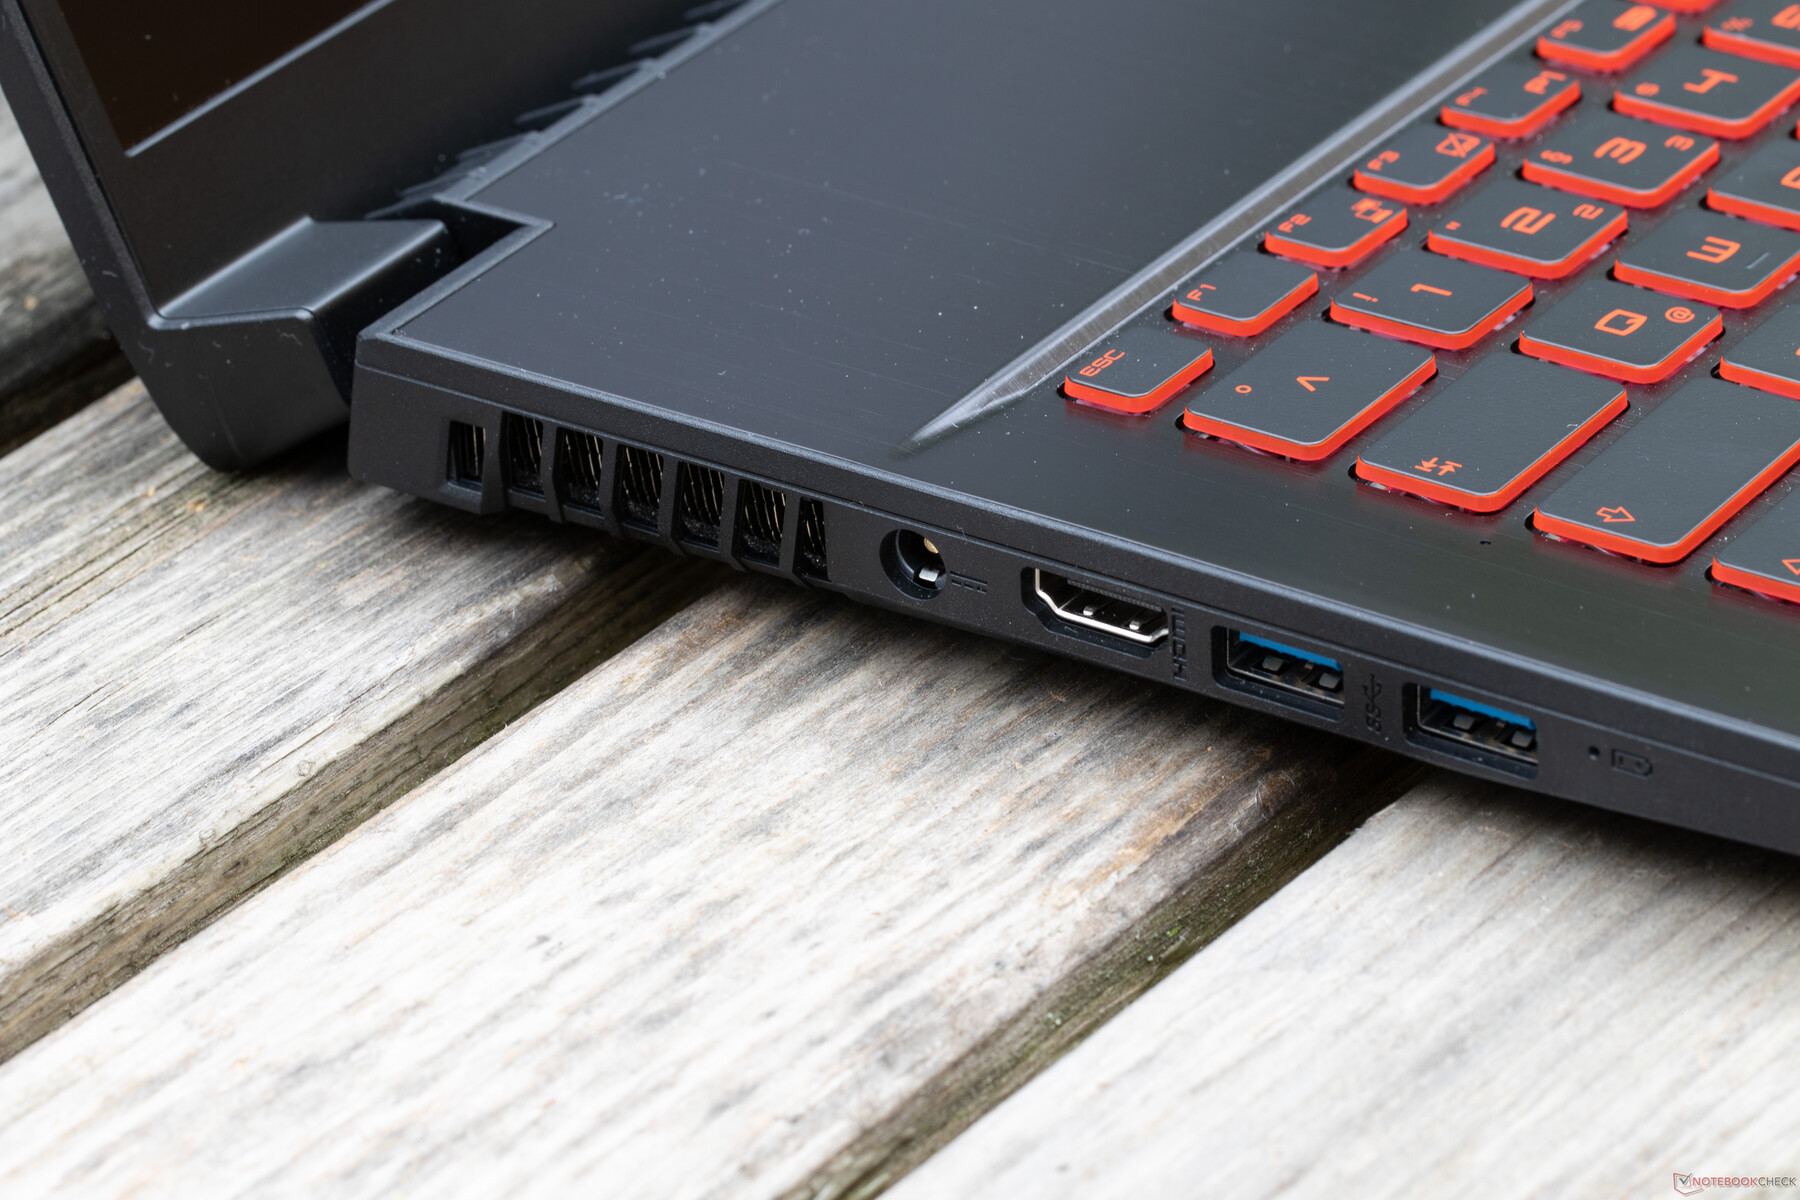
Em vez disso, a MSI optou por manter a seleção de portas no mínimo absoluto. Provavelmente isto se deve à construção fina, bem para manter o preço do dispositivo abaixo de um certo limite.
Se você pode viver sem thunderbolt e um conector DisplayPort e não precisa de um leitor de cartão SD ou recursos especiais de segurança, como um leitor de digitais, então você pode ficar muito feliz com este dispositivo acessível que inclui uma GTX 1050 Ti Max-Q.
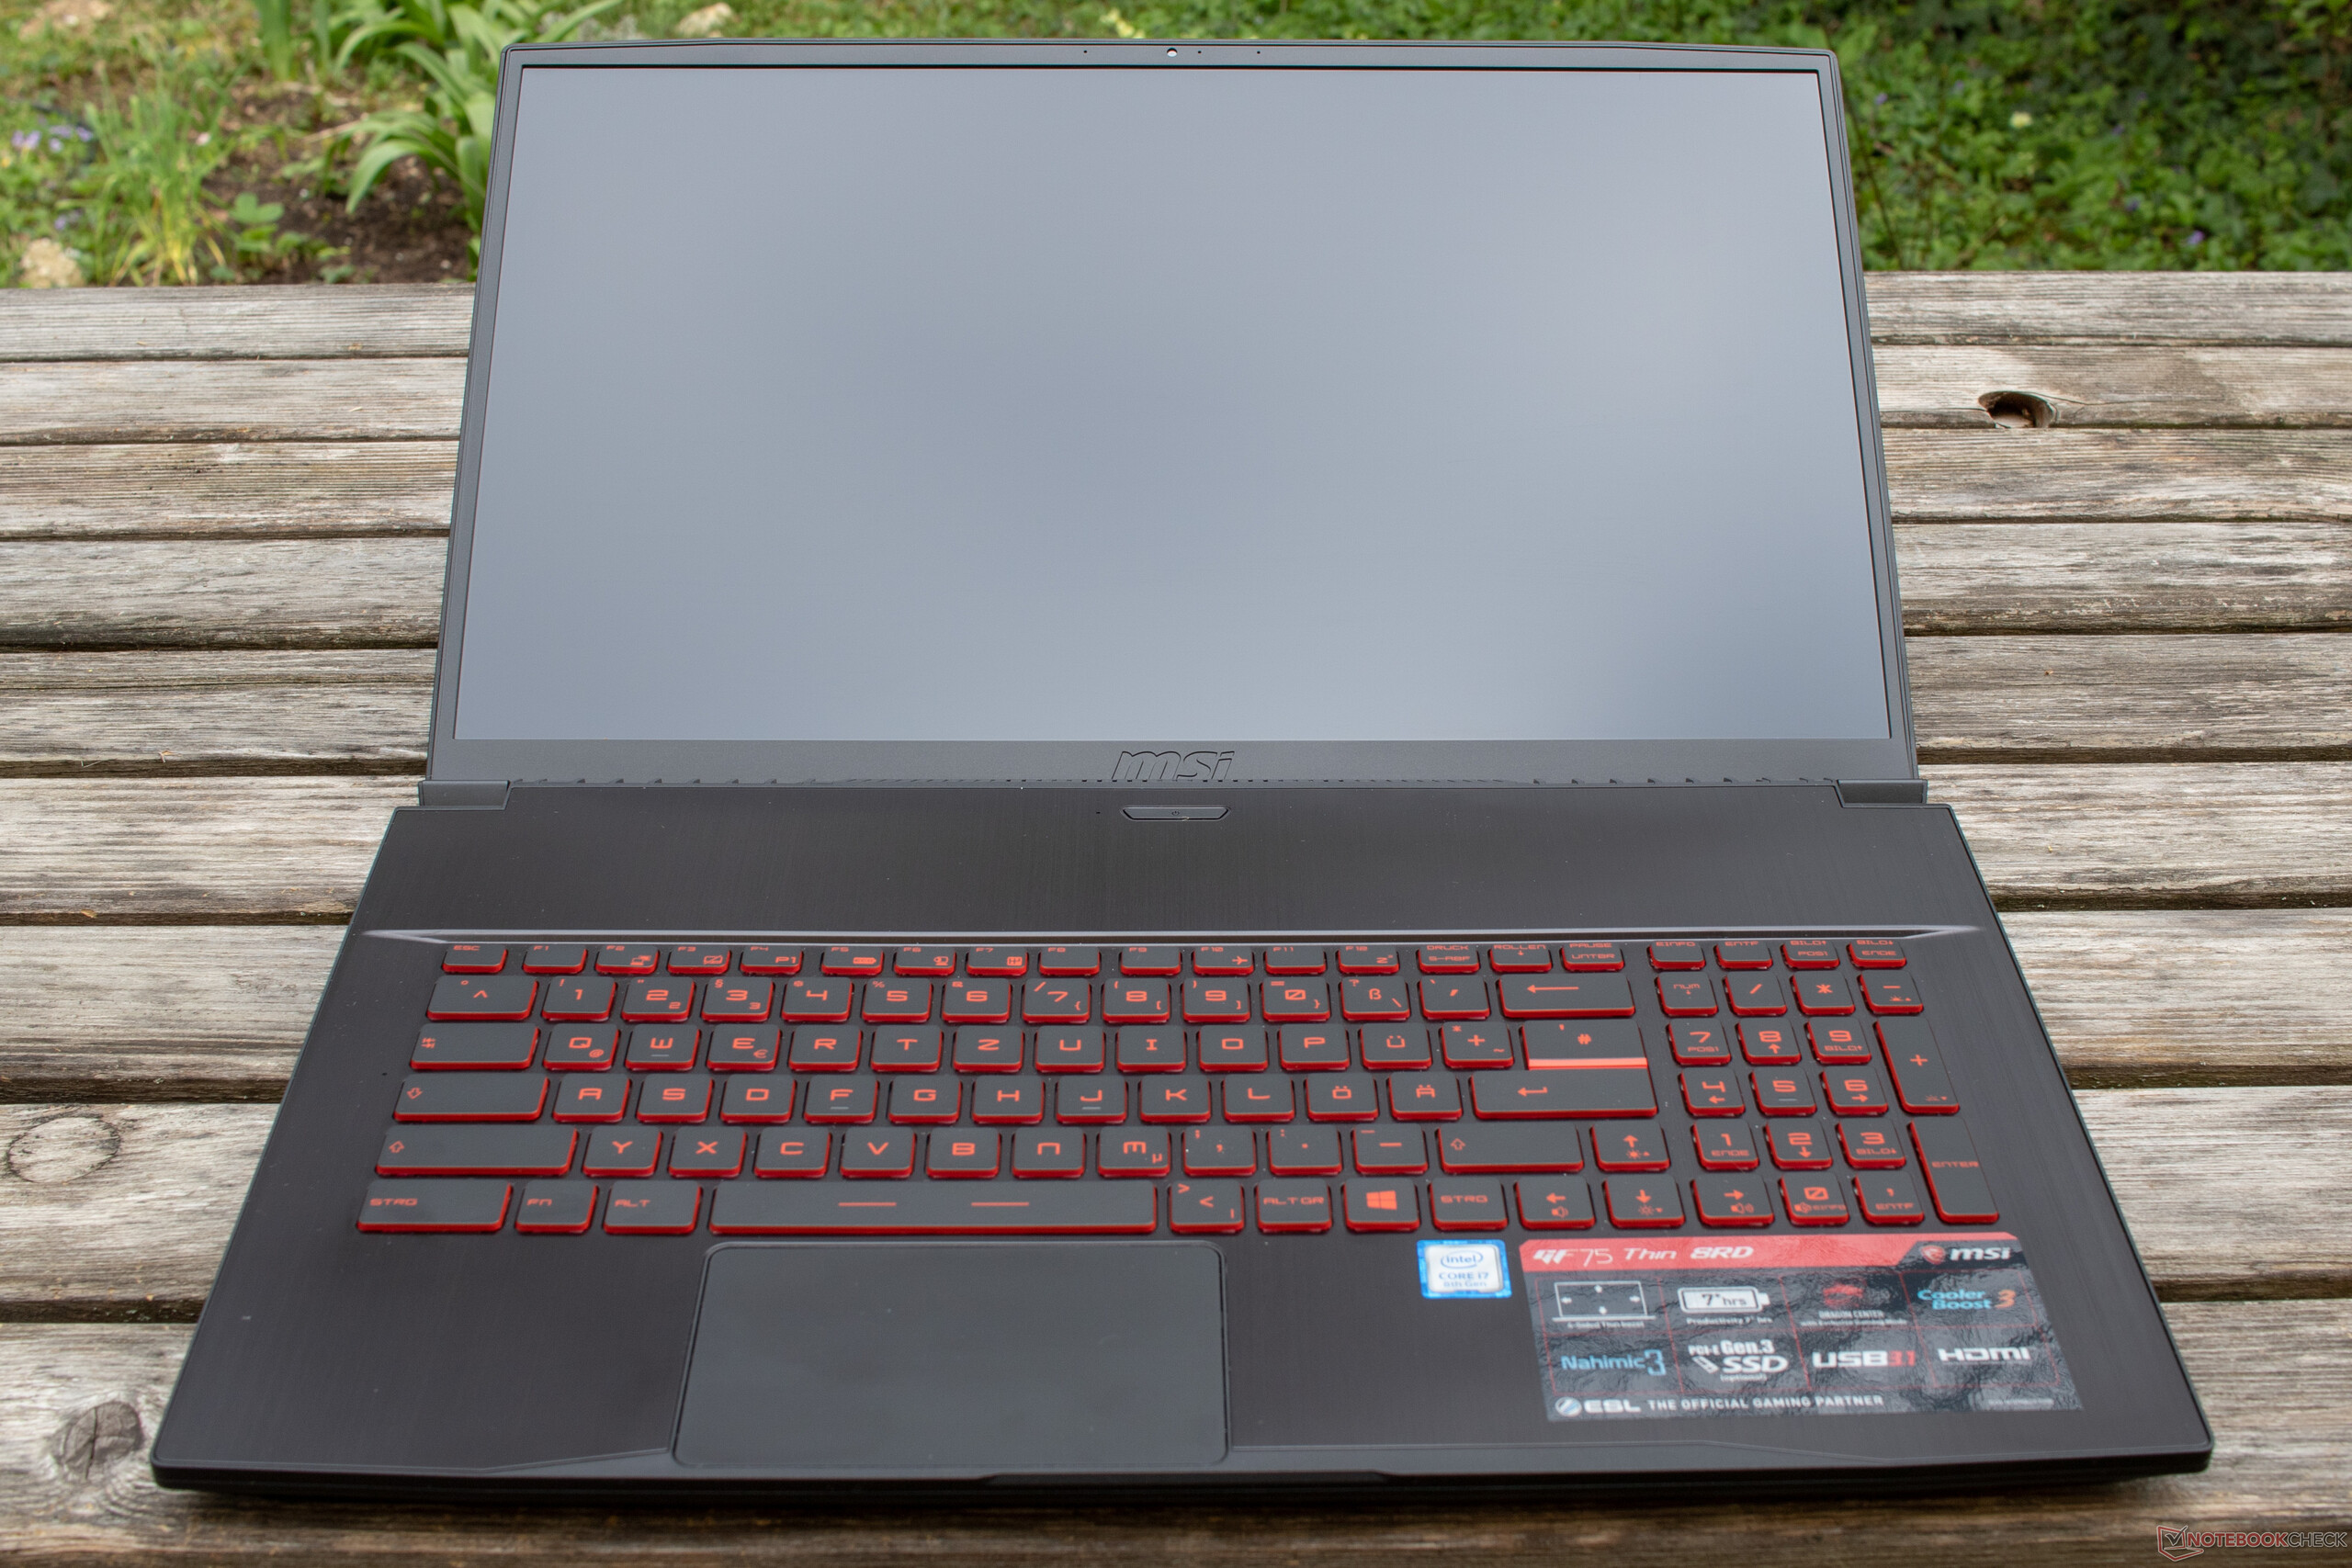
A tela IPS é muito boa e pode facilmente acompanhar a concorrência do GF75. Os resultados do Cinebench não são tão cor-de-rosa quanto o GF75. Temos a impressão de que o fabricante foi um pouco cuidadoso demais para manter o ruído do sistema baixo. O ventilador é muito silencioso e poderia ter atingido RPM mais altas. A bateria também poderia ter um aumento de energia. Embora as durações sejam suficientes para um gamer de 17 polegadas que está sempre conectado à fonte de alimentação em casa, as coisas podem ficar apertadas ao usar o dispositivo em movimento.
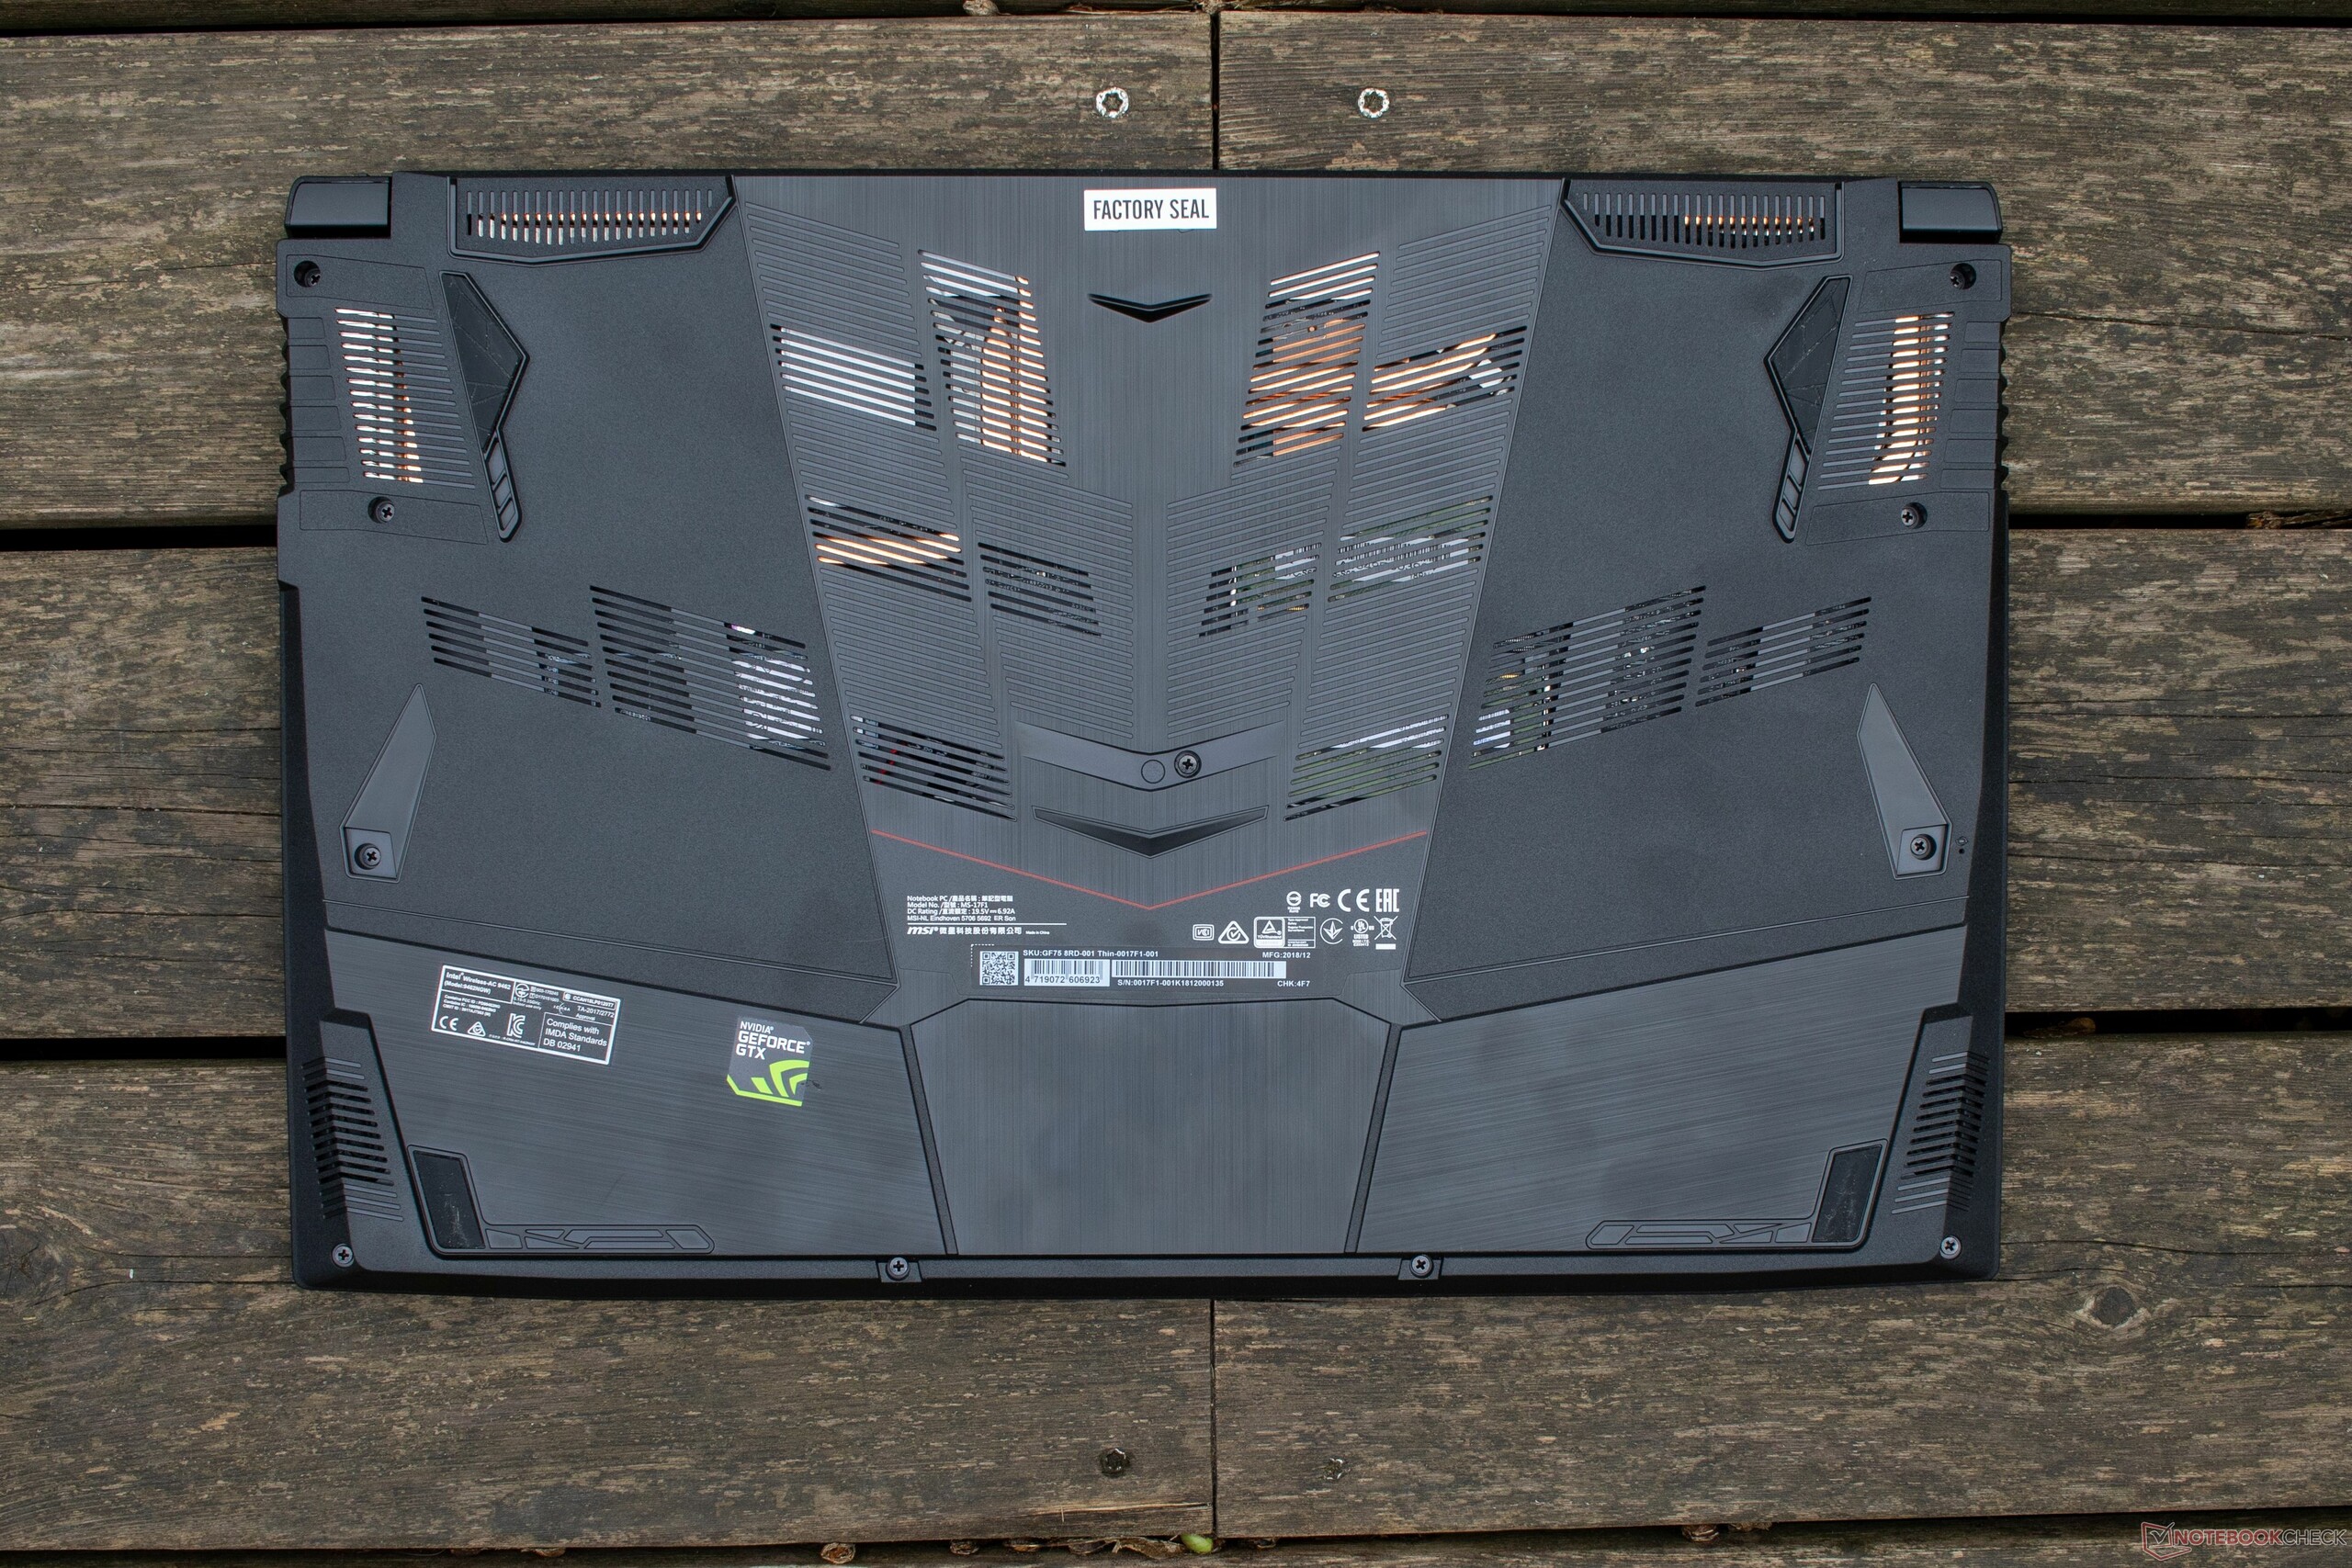
No geral, poderíamos dizer que os jogadores de gama média que jogam jogos atuais devem ficar muito felizes com a relação preço-desempenho que o MSI GF75 Thin oferece. E seu exterior é muito atraente. Compradores em potencial terão que decidir por si mesmos se podem aceitar as desvantagens, como o parte inferior de plástico barato. Se este for o caso, eles serão recompensados com um dispositivo razoavelmente rápido que oferece um desempenho sólido.
MSI GF75 8RD-001
- 04/30/2019 v7 (old)
Daniel Puschina
Price comparison
