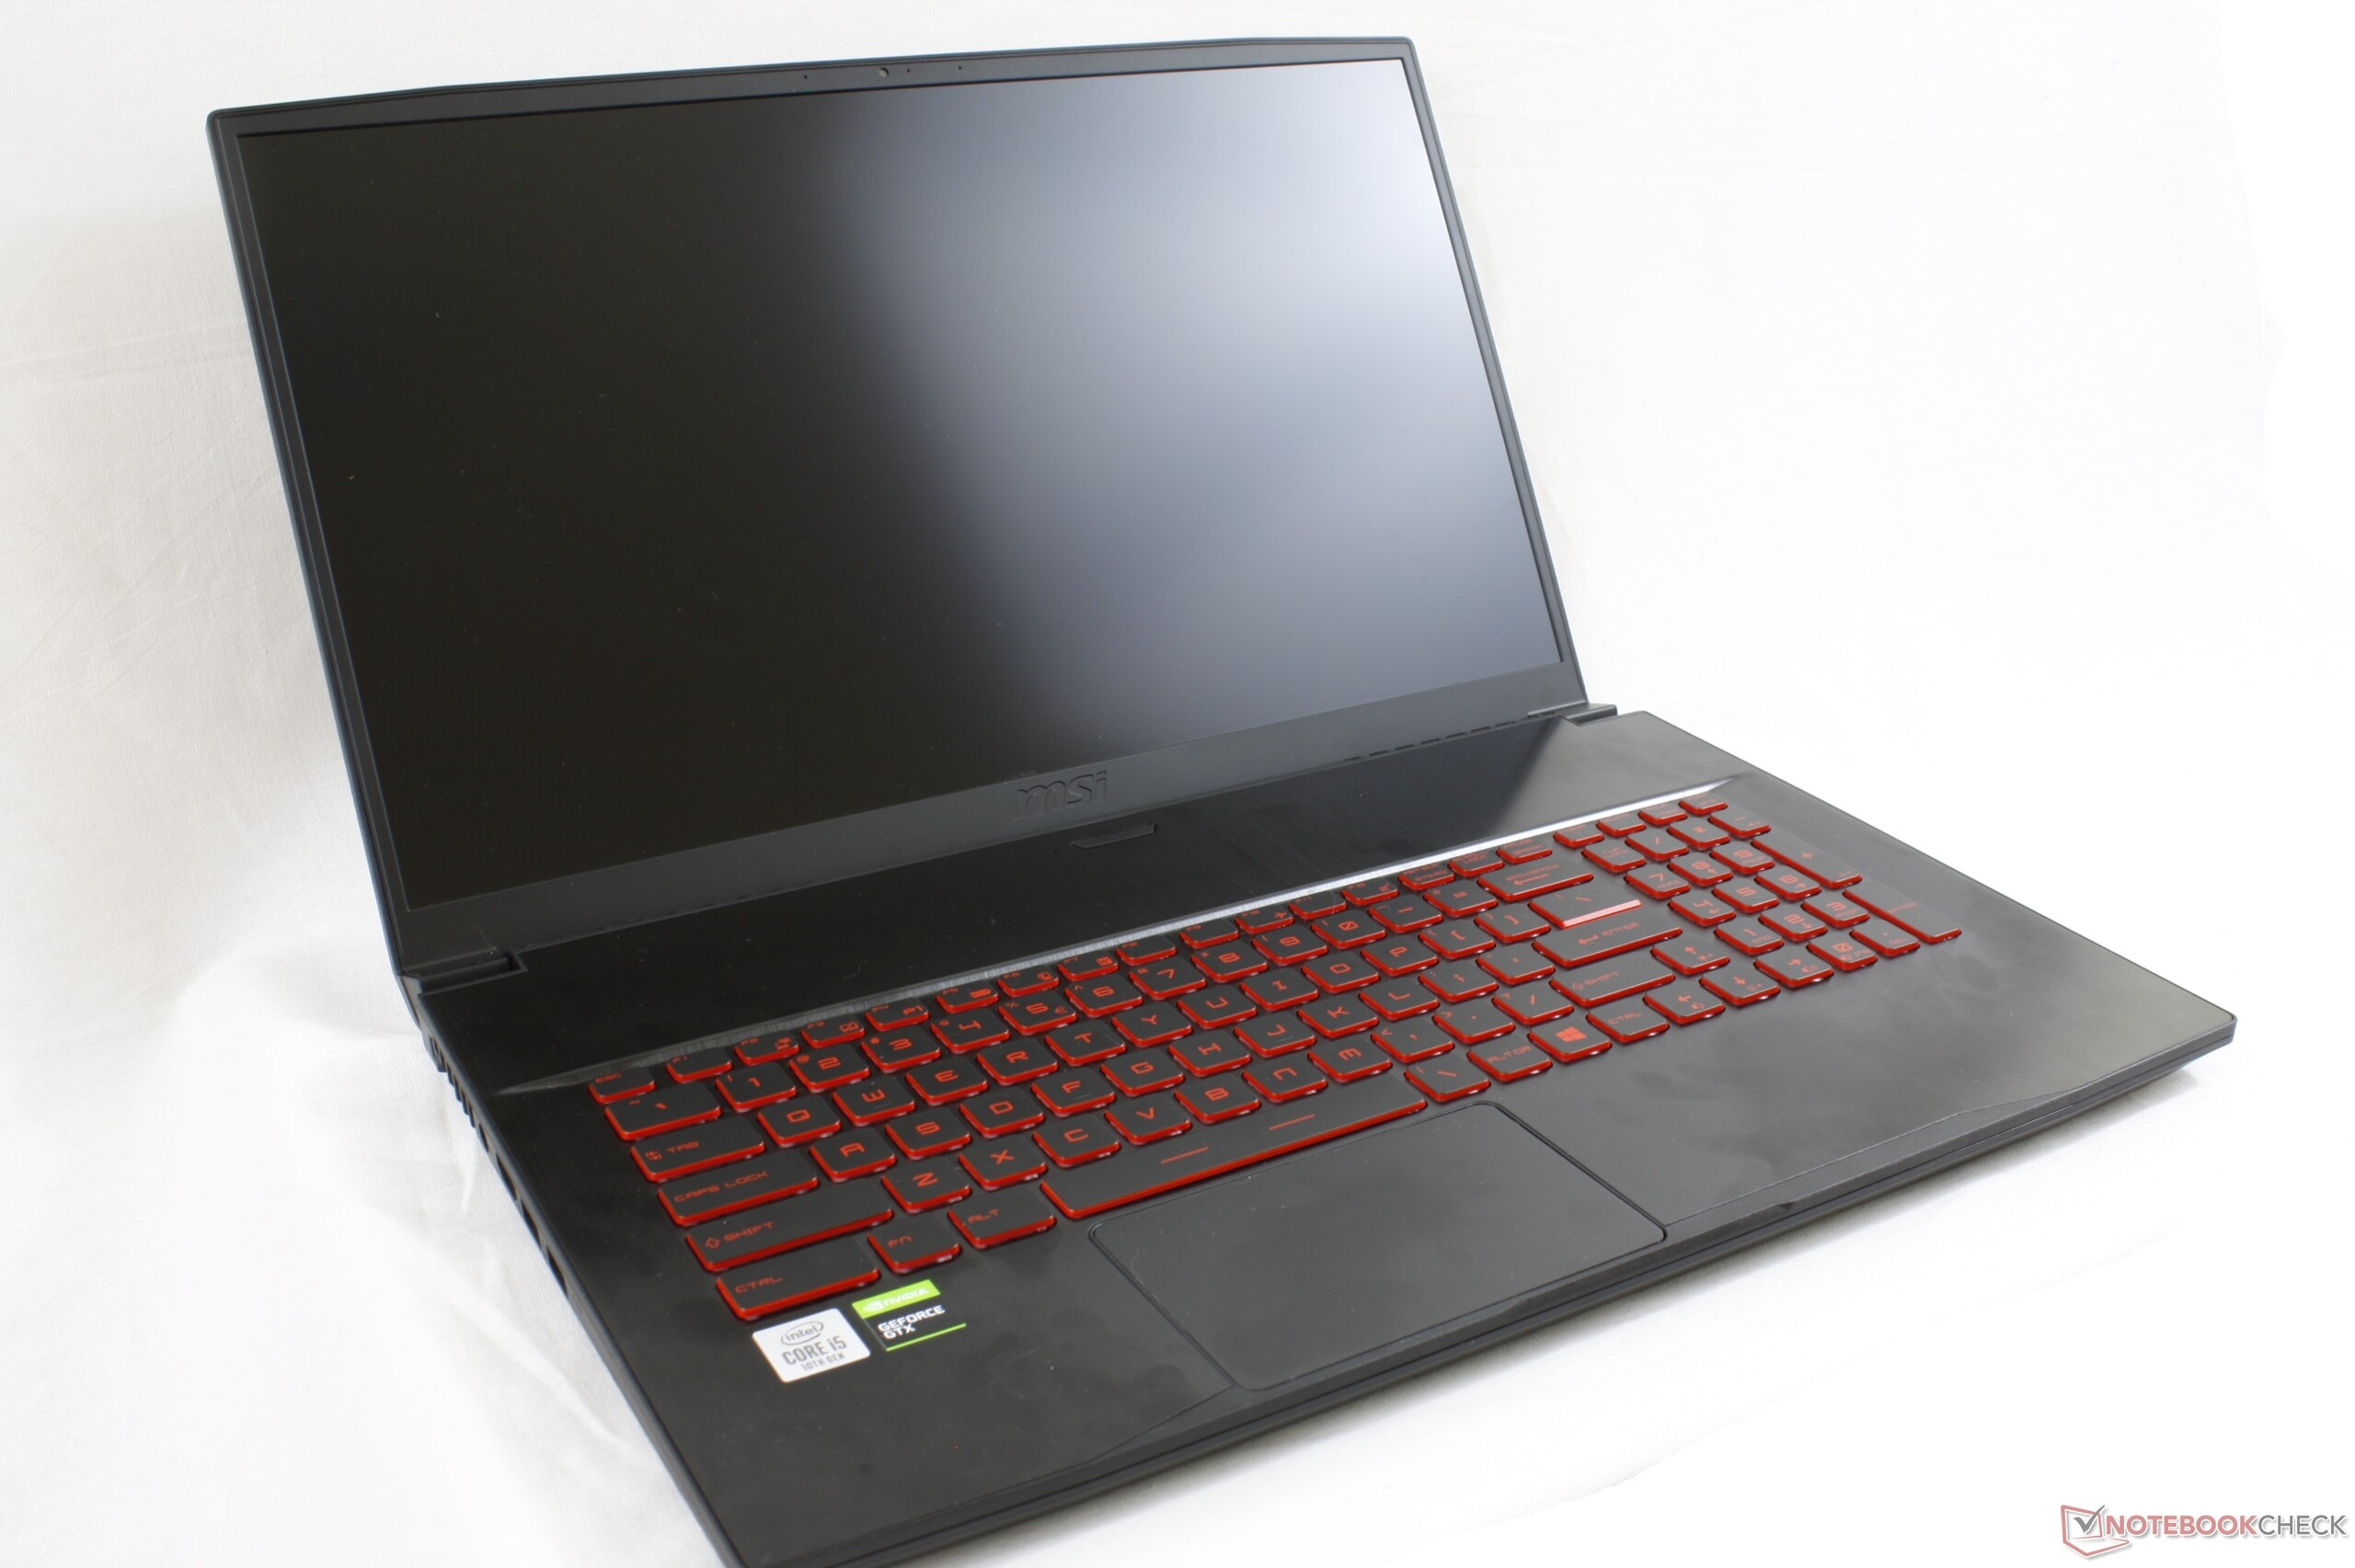
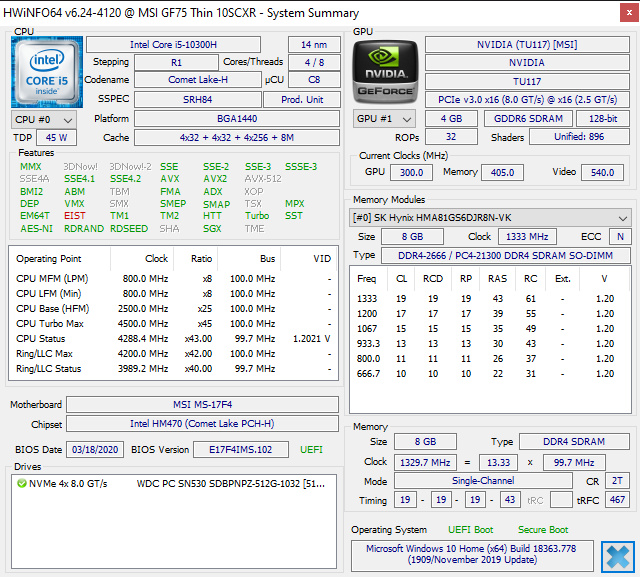
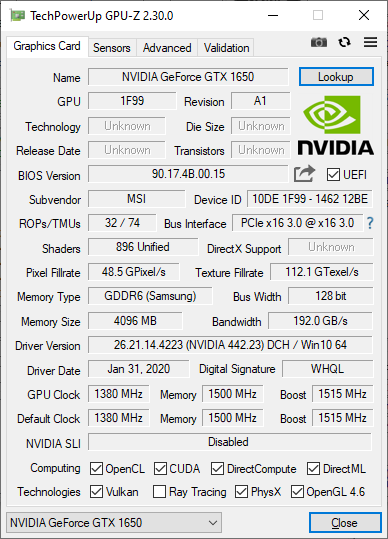
Debute do Core i5 Comet Lake-H de 10ma geração: Breve Análise do Portátil MSI GF75 Fino 10SCXR
Avaliação | Data | Modelo | Peso | Altura | Size | Resolução | Preço |
|---|---|---|---|---|---|---|---|
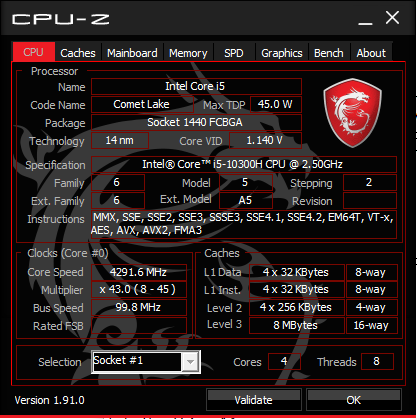
| 78.5 % v7 (old) | 05/2020 | MSI GF75 Thin 10SCXR i5-10300H, GeForce GTX 1650 Mobile | 2.2 kg | 23.1 mm | 17.30" | 1920x1080 | |
| 84.3 % v6 (old) | 08/2019 | Acer Aspire Nitro 5 AN517-51-7887 i7-9750H, GeForce GTX 1660 Ti Mobile | 2.8 kg | 26.9 mm | 17.30" | 1920x1080 | |
| 85.1 % v6 (old) | 11/2019 | MSI GP75 Leopard 9SD i7-9750H, GeForce GTX 1660 Ti Mobile | 2.6 kg | 29 mm | 17.30" | 1920x1080 | |
| 77.9 % v7 (old) | 09/2021 | Lenovo Ideapad L340-17IRH 81LL001YGE i5-9300H, GeForce GTX 1650 Mobile | 2.5 kg | 25.3 mm | 17.30" | 1920x1080 | |
| 81.6 % v7 (old) | 07/2019 | HP Pavilion Gaming 17-cd0085cl i7-9750H, GeForce GTX 1660 Ti Max-Q | 2.8 kg | 25 mm | 17.30" | 1920x1080 |
| Networking | |
| iperf3 transmit AX12 | |
| Asus Zephyrus G14 GA401IV | |
| Lenovo ThinkPad X1 Carbon G7 20R1-000YUS | |
| MSI GF75 Thin 10SCXR | |
| LG Gram 14T90N | |
| iperf3 receive AX12 | |
| MSI GF75 Thin 10SCXR | |
| Asus Zephyrus G14 GA401IV | |
| Lenovo ThinkPad X1 Carbon G7 20R1-000YUS | |
| LG Gram 14T90N | |


| |||||||||||||||||||||||||
iluminação: 92 %
iluminação com acumulador: 251.2 cd/m²
Contraste: 739:1 (Preto: 0.34 cd/m²)
ΔE ColorChecker Calman: 4.5 | ∀{0.5-29.43 Ø4.71}
calibrated: 3.91
ΔE Greyscale Calman: 4 | ∀{0.09-98 Ø4.96}
58.1% sRGB (Argyll 1.6.3 3D)
37.3% AdobeRGB 1998 (Argyll 1.6.3 3D)
40.77% AdobeRGB 1998 (Argyll 3D)
58.4% sRGB (Argyll 3D)
39.46% Display P3 (Argyll 3D)
Gamma: 2.25
CCT: 5882 K
| MSI GF75 Thin 10SCXR AU Optronics B173HAN04.7, IPS, 17.3", 1920x1080 | Acer Aspire Nitro 5 AN517-51-7887 LP173WF5-SPB3, IPS, 17.3", 1920x1080 | Asus ROG Strix G GL731GU-RB74 AU Optronics B173HAN04.0, IPS, 17.3", 1920x1080 | Lenovo Ideapad L340-17IRH 81LL001YGE Chi Mei N173HCE-E31, IPS, 17.3", 1920x1080 | MSI GP75 Leopard 9SD Chi Mei N173HCE-G33 (CMN175C), IPS, 17.3", 1920x1080 | HP Pavilion Gaming 17-cd0085cl BOE0825, IPS, 17.3", 1920x1080 | MSI GF75 Thin 9SC AU Optronics B173HAN04.2, IPS, 17.3", 1920x1080 | |
|---|---|---|---|---|---|---|---|
| Display | 58% | 55% | 63% | 61% | 57% | 56% | |
| Display P3 Coverage (%) | 39.46 | 62.7 59% | 61.9 57% | 66.3 68% | 63.4 61% | 63.3 60% | 62.5 58% |
| sRGB Coverage (%) | 58.4 | 92.5 58% | 89.4 53% | 92.7 59% | 94.9 63% | 90.2 54% | 90 54% |
| AdobeRGB 1998 Coverage (%) | 40.77 | 63.5 56% | 63.3 55% | 66.6 63% | 65.1 60% | 64.3 58% | 64 57% |
| Response Times | -4% | 70% | 10% | 72% | 17% | -8% | |
| Response Time Grey 50% / Grey 80% * (ms) | 34 ? | 37 ? -9% | 6.4 ? 81% | 32 ? 6% | 8 ? 76% | 31.6 ? 7% | 34 ? -0% |
| Response Time Black / White * (ms) | 26.4 ? | 26 ? 2% | 11.2 ? 58% | 23 ? 13% | 8.8 ? 67% | 19.6 ? 26% | 30.4 ? -15% |
| PWM Frequency (Hz) | 250 ? | 25510 ? | |||||
| Screen | 26% | 27% | 38% | 47% | 24% | 34% | |
| Brightness middle (cd/m²) | 251.2 | 407 62% | 294.3 17% | 318 27% | 420 67% | 299.6 19% | 344.7 37% |
| Brightness (cd/m²) | 242 | 364 50% | 289 19% | 292 21% | 393 62% | 285 18% | 332 37% |
| Brightness Distribution (%) | 92 | 84 -9% | 89 -3% | 85 -8% | 91 -1% | 86 -7% | 91 -1% |
| Black Level * (cd/m²) | 0.34 | 0.3 12% | 0.3 12% | 0.21 38% | 0.32 6% | 0.33 3% | 0.3 12% |
| Contrast (:1) | 739 | 1357 84% | 981 33% | 1514 105% | 1313 78% | 908 23% | 1149 55% |
| Colorchecker dE 2000 * | 4.5 | 4.55 -1% | 3.95 12% | 4.04 10% | 3.04 32% | 3.68 18% | 3.08 32% |
| Colorchecker dE 2000 max. * | 20 | 12.44 38% | 6.49 68% | 6.59 67% | 7.22 64% | 8.05 60% | 6.32 68% |
| Colorchecker dE 2000 calibrated * | 3.91 | 3.08 21% | 2.06 47% | 0.89 77% | 3.15 19% | 2.94 25% | |
| Greyscale dE 2000 * | 4 | 7.61 -90% | 3.7 7% | 4.21 -5% | 3.91 2% | 3.8 5% | 3.8 5% |
| Gamma | 2.25 98% | 2.51 88% | 2.07 106% | 2.5 88% | 2.26 97% | 2.12 104% | 2.17 101% |
| CCT | 5882 111% | 7212 90% | 7155 91% | 7189 90% | 7138 91% | 7240 90% | 7284 89% |
| Color Space (Percent of AdobeRGB 1998) (%) | 37.3 | 59 58% | 57.7 55% | 60 61% | 60 61% | 58.1 56% | 58 55% |
| Color Space (Percent of sRGB) (%) | 58.1 | 92 58% | 89 53% | 93 60% | 95 64% | 89.8 55% | 89.6 54% |
| Média Total (Programa/Configurações) | 27% /
29% | 51% /
37% | 37% /
40% | 60% /
52% | 33% /
30% | 27% /
33% |
* ... menor é melhor
Exibir tempos de resposta
| ↔ Tempo de resposta preto para branco | ||
|---|---|---|
| 26.4 ms ... ascensão ↗ e queda ↘ combinadas | ↗ 15.6 ms ascensão | 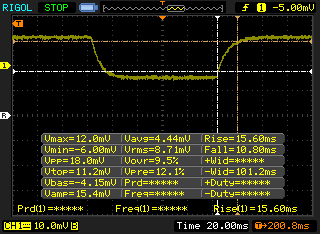 |
| ↘ 10.8 ms queda | ||
| A tela mostra taxas de resposta relativamente lentas em nossos testes e pode ser muito lenta para os jogadores. Em comparação, todos os dispositivos testados variam de 0.1 (mínimo) a 240 (máximo) ms. » 66 % de todos os dispositivos são melhores. Isso significa que o tempo de resposta medido é pior que a média de todos os dispositivos testados (19.8 ms). | ||
| ↔ Tempo de resposta 50% cinza a 80% cinza | ||
| 34 ms ... ascensão ↗ e queda ↘ combinadas | ↗ 18 ms ascensão | 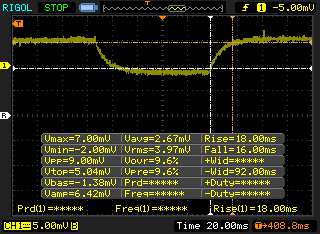 |
| ↘ 16 ms queda | ||
| A tela mostra taxas de resposta lentas em nossos testes e será insatisfatória para os jogadores. Em comparação, todos os dispositivos testados variam de 0.165 (mínimo) a 636 (máximo) ms. » 47 % de todos os dispositivos são melhores. Isso significa que o tempo de resposta medido é semelhante à média de todos os dispositivos testados (31 ms). | ||
Cintilação da tela / PWM (modulação por largura de pulso)
| Tela tremeluzindo / PWM não detectado | 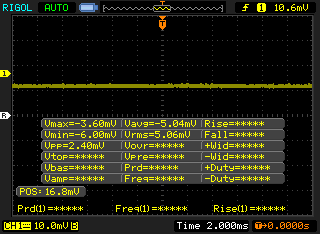 | ||
[pwm_comparison] Em comparação: 52 % de todos os dispositivos testados não usam PWM para escurecer a tela. Se PWM foi detectado, uma média de 7754 (mínimo: 5 - máximo: 343500) Hz foi medida. | |||
| wPrime 2.10 - 1024m | |
| MSI GF75 Thin 10SCXR | |
| Asus ROG Zephyrus G15 GA502DU | |
| Asus Zephyrus G14 GA401IV | |
* ... menor é melhor
| PCMark 8 Home Score Accelerated v2 | 3797 pontos | |
| PCMark 8 Work Score Accelerated v2 | 5276 pontos | |
| PCMark 10 Score | 5301 pontos | |
Ajuda | ||
| DPC Latencies / LatencyMon - interrupt to process latency (max), Web, Youtube, Prime95 | |
| MSI GF75 Thin 10SCXR | |
* ... menor é melhor
| MSI GF75 Thin 10SCXR WDC PC SN530 SDBPNPZ-512G | Acer Aspire Nitro 5 AN517-51-7887 WDC PC SN520 SDAPNUW-512G | MSI GF75 Thin 9SC Crucial P1 SSD CT1000P1SSD8 | MSI GP75 Leopard 9SD Kingston RBUSNS8154P3256GJ1 | Asus ROG Strix G GL731GU-RB74 Intel SSD 660p SSDPEKNW512G8 | |
|---|---|---|---|---|---|
| AS SSD | 42% | 30% | -45% | 22% | |
| Seq Read (MB/s) | 1007 | 1578 57% | 1079 7% | 748 -26% | 1319 31% |
| Seq Write (MB/s) | 1755 | 1381 -21% | 1566 -11% | 219 -88% | 930 -47% |
| 4K Read (MB/s) | 39.88 | 44.79 12% | 48.68 22% | 25.7 -36% | 49.43 24% |
| 4K Write (MB/s) | 111.6 | 108.7 -3% | 106.7 -4% | 82.4 -26% | 104.3 -7% |
| 4K-64 Read (MB/s) | 751 | 1045 39% | 656 -13% | 259.3 -65% | 321.9 -57% |
| 4K-64 Write (MB/s) | 402.6 | 1121 178% | 751 87% | 190.2 -53% | 774 92% |
| Access Time Read * (ms) | 0.084 | 0.083 1% | 0.044 48% | 0.159 -89% | 0.055 35% |
| Access Time Write * (ms) | 0.151 | 0.034 77% | 0.131 13% | 0.058 62% | 0.138 9% |
| Score Read (Points) | 892 | 1248 40% | 812 -9% | 360 -60% | 503 -44% |
| Score Write (Points) | 690 | 1368 98% | 1014 47% | 294 -57% | 971 41% |
| Score Total (Points) | 2085 | 3252 56% | 2281 9% | 821 -61% | 1731 -17% |
| Copy ISO MB/s (MB/s) | 1828 | 1254 -31% | 1414 -23% | 1707 -7% | |
| Copy Program MB/s (MB/s) | 307.2 | 443.8 44% | 531 73% | 852 177% | |
| Copy Game MB/s (MB/s) | 532 | 722 36% | 1483 179% | 930 75% | |
| CrystalDiskMark 5.2 / 6 | -15% | 7% | -41% | -6% | |
| Write 4K (MB/s) | 140.7 | 104.6 -26% | 133 -5% | 105.8 -25% | 127.6 -9% |
| Read 4K (MB/s) | 43.18 | 39.76 -8% | 55.6 29% | 27.89 -35% | 56 30% |
| Write Seq (MB/s) | 1829 | 1268 -31% | 1623 -11% | 270.8 -85% | 986 -46% |
| Read Seq (MB/s) | 1095 | 1414 29% | 1386 27% | 879 -20% | 1605 47% |
| Write 4K Q32T1 (MB/s) | 431.7 | 287.9 -33% | 501 16% | 273.3 -37% | 451.5 5% |
| Read 4K Q32T1 (MB/s) | 527 | 381.1 -28% | 584 11% | 361.2 -31% | 343.3 -35% |
| Write Seq Q32T1 (MB/s) | 1831 | 1319 -28% | 1696 -7% | 253 -86% | 983 -46% |
| Read Seq Q32T1 (MB/s) | 1708 | 1735 2% | 1572 -8% | 1505 -12% | 1810 6% |
| Write 4K Q8T8 (MB/s) | 768 | ||||
| Read 4K Q8T8 (MB/s) | 1090 | ||||
| Média Total (Programa/Configurações) | 14% /
21% | 19% /
22% | -43% /
-44% | 8% /
12% |
* ... menor é melhor

| 3DMark 11 | |
| 1280x720 Performance GPU | |
| Eurocom Nightsky RX17 | |
| Walmart EVOO Gaming 17 | |
| MSI GP75 Leopard 9SD | |
| MSI Alpha 15 A3DDK-034 | |
| Gainward GeForce GTX 1650 4 GB | |
| MSI GF75 Thin 10SCXR | |
| Média NVIDIA GeForce GTX 1650 Mobile (10885 - 13575, n=30) | |
| Asus Zephyrus S GX531GM | |
| Lenovo IdeaPad S740-15IRH | |
| HP Pavilion Gaming 15-ec0002ng | |
| Asus ZenBook Flip 15 UX563FD-A1027T | |
| 1280x720 Performance Combined | |
| Eurocom Nightsky RX17 | |
| Walmart EVOO Gaming 17 | |
| MSI GP75 Leopard 9SD | |
| Gainward GeForce GTX 1650 4 GB | |
| Lenovo IdeaPad S740-15IRH | |
| Média NVIDIA GeForce GTX 1650 Mobile (5870 - 12662, n=28) | |
| MSI GF75 Thin 10SCXR | |
| MSI Alpha 15 A3DDK-034 | |
| Asus ZenBook Flip 15 UX563FD-A1027T | |
| HP Pavilion Gaming 15-ec0002ng | |
| Asus Zephyrus S GX531GM | |
| 3DMark 06 Standard Score | 34955 pontos | |
| 3DMark 11 Performance | 11727 pontos | |
| 3DMark Ice Storm Standard Score | 77860 pontos | |
| 3DMark Cloud Gate Standard Score | 25707 pontos | |
| 3DMark Fire Strike Score | 8581 pontos | |
| 3DMark Time Spy Score | 3554 pontos | |
Ajuda | ||
| Shadow of the Tomb Raider | |
| 1280x720 Lowest Preset | |
| HP Omen 15-dc0015ng | |
| MSI GF75 Thin 9SC | |
| Dell G3 3590 | |
| Média NVIDIA GeForce GTX 1650 Mobile (57 - 128, n=13) | |
| MSI GF75 Thin 10SCXR | |
| HP Pavilion Gaming 15-ec0017ng | |
| HP Pavilion Gaming 15-ec0002ng | |
| MSI PS63 Modern 8RC | |
| 1920x1080 Medium Preset | |
| HP Omen 15-dc0015ng | |
| Dell G3 3590 | |
| MSI GF75 Thin 10SCXR | |
| MSI GF75 Thin 9SC | |
| Média NVIDIA GeForce GTX 1650 Mobile (42 - 63, n=14) | |
| HP Pavilion Gaming 15-ec0017ng | |
| HP Pavilion Gaming 15-ec0002ng | |
| MSI PS63 Modern 8RC | |
| 1920x1080 High Preset AA:SM | |
| HP Omen 15-dc0015ng | |
| MSI Alpha 15 A3DDK | |
| Asus TUF FX705GM | |
| HP Pavilion Gaming 15-ec0017ng | |
| MSI GF75 Thin 9SC | |
| Dell G3 3590 | |
| MSI GF75 Thin 10SCXR | |
| Média NVIDIA GeForce GTX 1650 Mobile (38 - 53, n=15) | |
| HP Pavilion Gaming 15-ec0002ng | |
| MSI PS63 Modern 8RC | |
| 1920x1080 Highest Preset AA:T | |
| HP Omen 15-dc0015ng | |
| MSI Alpha 15 A3DDK | |
| HP Pavilion Gaming 15-ec0017ng | |
| Asus TUF FX705GM | |
| MSI GF75 Thin 9SC | |
| MSI GF75 Thin 10SCXR | |
| Média NVIDIA GeForce GTX 1650 Mobile (34 - 47, n=15) | |
| HP Pavilion Gaming 15-ec0002ng | |
| MSI PS63 Modern 8RC | |
| The Witcher 3 | |
| 1024x768 Low Graphics & Postprocessing | |
| HP Omen 15-dc0015ng | |
| MSI GF75 Thin 9SC | |
| HP Pavilion Gaming 15-ec0017ng | |
| Dell G3 3590 | |
| MSI GF75 Thin 10SCXR | |
| Média NVIDIA GeForce GTX 1650 Mobile (127 - 209, n=22) | |
| MSI Alpha 15 A3DDK | |
| HP Pavilion Gaming 15-ec0002ng | |
| 1920x1080 Ultra Graphics & Postprocessing (HBAO+) | |
| HP Omen 15-dc0015ng | |
| HP Pavilion Gaming 15-ec0017ng | |
| MSI Alpha 15 A3DDK | |
| MSI GF75 Thin 9SC | |
| MSI GF75 Thin 10SCXR | |
| Asus TUF FX705GM | |
| Dell G3 3590 | |
| Média NVIDIA GeForce GTX 1650 Mobile (29.9 - 40.3, n=31) | |
| HP Pavilion Gaming 15-ec0002ng | |
| Rocket League | |
| 1280x720 Performance | |
| MSI GF75 Thin 10SCXR | |
| HP Pavilion Gaming 15-ec0017ng | |
| Dell G3 3590 | |
| Média NVIDIA GeForce GTX 1650 Mobile (214 - 249, n=5) | |
| 1920x1080 Performance | |
| MSI GF75 Thin 10SCXR | |
| Média NVIDIA GeForce GTX 1650 Mobile (189.8 - 228, n=3) | |
| 1920x1080 Quality AA:Medium FX | |
| HP Pavilion Gaming 15-ec0017ng | |
| MSI GF75 Thin 10SCXR | |
| Média NVIDIA GeForce GTX 1650 Mobile (152.5 - 229, n=6) | |
| Dell G3 3590 | |
| 1920x1080 High Quality AA:High FX | |
| MSI Alpha 15 A3DDK | |
| HP Pavilion Gaming 15-ec0017ng | |
| MSI GF75 Thin 10SCXR | |
| Dell G3 3590 | |
| Média NVIDIA GeForce GTX 1650 Mobile (96.4 - 162.2, n=6) | |
| baixo | média | alto | ultra | |
|---|---|---|---|---|
| BioShock Infinite (2013) | 241.5 | 212.7 | 200.1 | 93.6 |
| The Witcher 3 (2015) | 169.4 | 116.6 | 70.4 | 37.7 |
| Dota 2 Reborn (2015) | 117 | 104 | 93.7 | 87.5 |
| Rocket League (2017) | 248.4 | 198.5 | 162.2 | |
| X-Plane 11.11 (2018) | 75.7 | 65.1 | 57.4 | |
| Shadow of the Tomb Raider (2018) | 88 | 60 | 51 | 44 |
| MSI GF75 Thin 10SCXR GeForce GTX 1650 Mobile, i5-10300H, WDC PC SN530 SDBPNPZ-512G | Acer Aspire Nitro 5 AN517-51-7887 GeForce GTX 1660 Ti Mobile, i7-9750H, WDC PC SN520 SDAPNUW-512G | MSI GF75 Thin 9SC GeForce GTX 1650 Mobile, i7-9750H, Crucial P1 SSD CT1000P1SSD8 | MSI GP75 Leopard 9SD GeForce GTX 1660 Ti Mobile, i7-9750H, Kingston RBUSNS8154P3256GJ1 | Asus ROG Strix G GL731GU-RB74 GeForce GTX 1660 Ti Mobile, i7-9750H, Intel SSD 660p SSDPEKNW512G8 | Lenovo Ideapad L340-17IRH 81LL001YGE GeForce GTX 1650 Mobile, i5-9300H, WDC PC SN520 SDAPMUW-512 | |
|---|---|---|---|---|---|---|
| Noise | -3% | -1% | -14% | -11% | 2% | |
| desligado / ambiente * (dB) | 28.4 | 30 -6% | 28.2 1% | 29 -2% | 28.2 1% | 30 -6% |
| Idle Minimum * (dB) | 33 | 30.2 8% | 33.6 -2% | 29 12% | 31.8 4% | 30 9% |
| Idle Average * (dB) | 33 | 30.2 8% | 33.6 -2% | 34 -3% | 32 3% | 30 9% |
| Idle Maximum * (dB) | 33.1 | 31 6% | 33.8 -2% | 37 -12% | 40.6 -23% | 30.4 8% |
| Load Average * (dB) | 37.7 | 43.4 -15% | 37.2 1% | 53 -41% | 48 -27% | 40.9 -8% |
| Witcher 3 ultra * (dB) | 39.2 | 48.5 -24% | 40.6 -4% | 51 -30% | 48 -22% | 43.8 -12% |
| Load Maximum * (dB) | 46 | 45.5 1% | 44.4 3% | 55 -20% | 51.5 -12% | 40.9 11% |
* ... menor é melhor
Barulho
| Ocioso |
| 33 / 33 / 33.1 dB |
| Carga |
| 37.7 / 46 dB |
 | ||
30 dB silencioso 40 dB(A) audível 50 dB(A) ruidosamente alto |
||
min: | ||
(±) A temperatura máxima no lado superior é 42 °C / 108 F, em comparação com a média de 40.4 °C / 105 F , variando de 21.2 a 68.8 °C para a classe Gaming.
(-) A parte inferior aquece até um máximo de 53.4 °C / 128 F, em comparação com a média de 43.2 °C / 110 F
(+) Em uso inativo, a temperatura média para o lado superior é 31.5 °C / 89 F, em comparação com a média do dispositivo de 33.9 °C / ### class_avg_f### F.
(+) Jogando The Witcher 3, a temperatura média para o lado superior é 31.3 °C / 88 F, em comparação com a média do dispositivo de 33.9 °C / ## #class_avg_f### F.
(+) Os apoios para as mãos e o touchpad são mais frios que a temperatura da pele, com um máximo de 29 °C / 84.2 F e, portanto, são frios ao toque.
(±) A temperatura média da área do apoio para as mãos de dispositivos semelhantes foi 28.8 °C / 83.8 F (-0.2 °C / -0.4 F).
MSI GF75 Thin 10SCXR análise de áudio
(+) | os alto-falantes podem tocar relativamente alto (###valor### dB)
Graves 100 - 315Hz
(-) | quase nenhum baixo - em média 18.5% menor que a mediana
(±) | a linearidade dos graves é média (14.2% delta para a frequência anterior)
Médios 400 - 2.000 Hz
(+) | médios equilibrados - apenas 2.2% longe da mediana
(±) | a linearidade dos médios é média (7.7% delta para frequência anterior)
Altos 2 - 16 kHz
(+) | agudos equilibrados - apenas 3.4% longe da mediana
(±) | a linearidade dos máximos é média (9.4% delta para frequência anterior)
Geral 100 - 16.000 Hz
(±) | a linearidade do som geral é média (18.2% diferença em relação à mediana)
Comparado com a mesma classe
» 57% de todos os dispositivos testados nesta classe foram melhores, 8% semelhantes, 35% piores
» O melhor teve um delta de 6%, a média foi 18%, o pior foi 132%
Comparado com todos os dispositivos testados
» 39% de todos os dispositivos testados foram melhores, 8% semelhantes, 53% piores
» O melhor teve um delta de 4%, a média foi 23%, o pior foi 134%
Apple MacBook 12 (Early 2016) 1.1 GHz análise de áudio
(+) | os alto-falantes podem tocar relativamente alto (###valor### dB)
Graves 100 - 315Hz
(±) | graves reduzidos - em média 11.3% menor que a mediana
(±) | a linearidade dos graves é média (14.2% delta para a frequência anterior)
Médios 400 - 2.000 Hz
(+) | médios equilibrados - apenas 2.4% longe da mediana
(+) | médios são lineares (5.5% delta para frequência anterior)
Altos 2 - 16 kHz
(+) | agudos equilibrados - apenas 2% longe da mediana
(+) | os máximos são lineares (4.5% delta da frequência anterior)
Geral 100 - 16.000 Hz
(+) | o som geral é linear (10.2% diferença em relação à mediana)
Comparado com a mesma classe
» 7% de todos os dispositivos testados nesta classe foram melhores, 2% semelhantes, 90% piores
» O melhor teve um delta de 5%, a média foi 18%, o pior foi 53%
Comparado com todos os dispositivos testados
» 5% de todos os dispositivos testados foram melhores, 1% semelhantes, 94% piores
» O melhor teve um delta de 4%, a média foi 23%, o pior foi 134%
| desligado | |
| Ocioso | |
| Carga |
|
Key:
min: | |
| MSI GF75 Thin 10SCXR i5-10300H, GeForce GTX 1650 Mobile, WDC PC SN530 SDBPNPZ-512G, IPS, 1920x1080, 17.3" | Acer Aspire Nitro 5 AN517-51-7887 i7-9750H, GeForce GTX 1660 Ti Mobile, WDC PC SN520 SDAPNUW-512G, IPS, 1920x1080, 17.3" | MSI GF75 Thin 9SC i7-9750H, GeForce GTX 1650 Mobile, Crucial P1 SSD CT1000P1SSD8, IPS, 1920x1080, 17.3" | MSI GP75 Leopard 9SD i7-9750H, GeForce GTX 1660 Ti Mobile, Kingston RBUSNS8154P3256GJ1, IPS, 1920x1080, 17.3" | Asus ROG Strix G GL731GU-RB74 i7-9750H, GeForce GTX 1660 Ti Mobile, Intel SSD 660p SSDPEKNW512G8, IPS, 1920x1080, 17.3" | Lenovo Ideapad L340-17IRH 81LL001YGE i5-9300H, GeForce GTX 1650 Mobile, WDC PC SN520 SDAPMUW-512, IPS, 1920x1080, 17.3" | HP Pavilion Gaming 17-cd0085cl i7-9750H, GeForce GTX 1660 Ti Max-Q, Samsung SSD PM981 MZVLB256HAHQ, IPS, 1920x1080, 17.3" | |
|---|---|---|---|---|---|---|---|
| Power Consumption | 18% | 2% | -15% | -41% | 34% | 17% | |
| Idle Minimum * (Watt) | 13 | 3.9 70% | 6.1 53% | 10 23% | 13.6 -5% | 3.4 74% | 5.4 58% |
| Idle Average * (Watt) | 15.7 | 8.9 43% | 11.2 29% | 15 4% | 26.2 -67% | 7.7 51% | 9.2 41% |
| Idle Maximum * (Watt) | 21 | 12.2 42% | 24.5 -17% | 22 -5% | 35 -67% | 9.6 54% | 13 38% |
| Load Average * (Watt) | 87 | 83 5% | 94.7 -9% | 92 -6% | 113.6 -31% | 75 14% | 85.9 1% |
| Witcher 3 ultra * (Watt) | 96.4 | 130 -35% | 105.8 -10% | 153 -59% | 134.1 -39% | 92 5% | 107.9 -12% |
| Load Maximum * (Watt) | 145.8 | 168 -15% | 192.2 -32% | 216 -48% | 200.2 -37% | 135 7% | 182.2 -25% |
* ... menor é melhor
| MSI GF75 Thin 10SCXR i5-10300H, GeForce GTX 1650 Mobile, 51 Wh | Acer Aspire Nitro 5 AN517-51-7887 i7-9750H, GeForce GTX 1660 Ti Mobile, 57 Wh | MSI GF75 Thin 9SC i7-9750H, GeForce GTX 1650 Mobile, 51 Wh | MSI GP75 Leopard 9SD i7-9750H, GeForce GTX 1660 Ti Mobile, 51 Wh | Asus ROG Strix G GL731GU-RB74 i7-9750H, GeForce GTX 1660 Ti Mobile, 66 Wh | Lenovo Ideapad L340-17IRH 81LL001YGE i5-9300H, GeForce GTX 1650 Mobile, 45 Wh | |
|---|---|---|---|---|---|---|
| Duração da bateria | 54% | 0% | -38% | 20% | 32% | |
| Reader / Idle (h) | 7.7 | 13.4 74% | 4.8 -38% | 8.6 12% | ||
| WiFi v1.3 (h) | 4.7 | 6.2 32% | 4.7 0% | 3.2 -32% | 4.9 4% | 6.2 32% |
| Load (h) | 1.1 | 1.7 55% | 0.6 -45% | 1.6 45% |
Pro
Contra
A melhor parte do 2020 MSI GF75 10SCXR é que o modelo 2019 agora é mais barato. O Core i5-9300H do ano passado está logo atrás do Core i5-10300H, a ponto de que qualquer benefício de desempenho deste último é imperceptível nos jogos. Essa é uma ótima notícia se você estiver atualizando de um portátil para jogos muito mais antigo, porque isso significa que você pode economizar dinheiro comprando um portátil Core i5 de 9a geração em vez de um portátil de 10a geração sem sacrificar o desempenho.
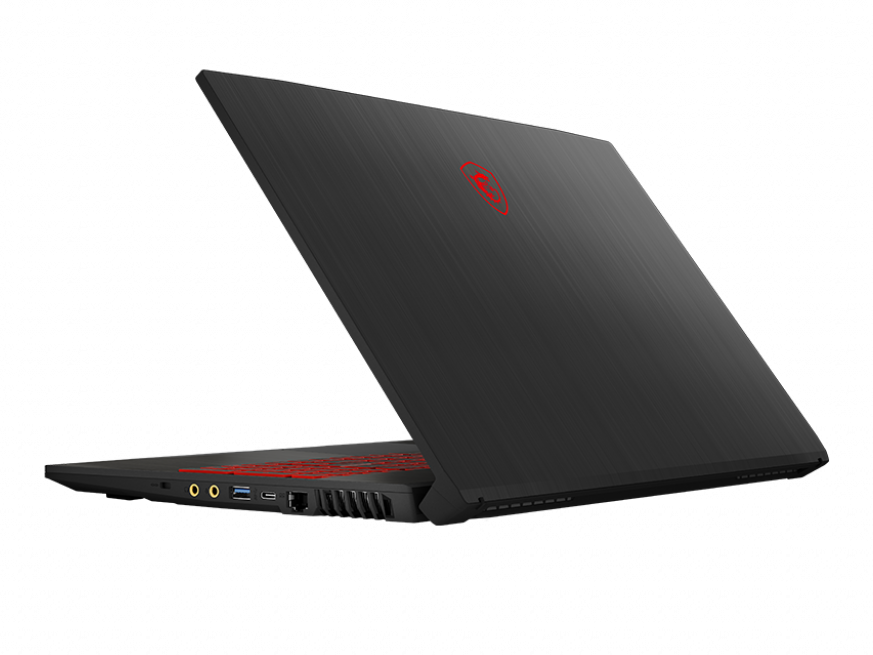
Quanto ao portátil em si, seus melhores atributos são o baixo peso, tamanho pequeno e ventiladores relativamente silenciosos ao jogar para um formato de 17,3 polegadas. Pode não ser tão fino quanto o GS75, mas é difícil argumentar contra o baixo preço e a rápida taxa de atualização de 120 Hz. Recomendamos que você opte por 16 GB de RAM em vez de apenas 8 GB no modelo 2019 e verifique novamente com o atendimento ao cliente se são possíveis atualizações simples de RAM e HDD, pois você precisará quebrar um adesivo de garantia para fazê-lo depois. Tenha um mouse pronto também para evitar o clickpad esponjoso.
Uma pequena atualização de desempenho para o modelo do ano passado. Seria melhor investir em um portátil para jogos Core i5 da 9ª geração, em vez deste portátil da 10ª geração, para obter um retorno maior.
MSI GF75 Thin 10SCXR
- 04/24/2020 v7 (old)
Allen Ngo
Price comparison
