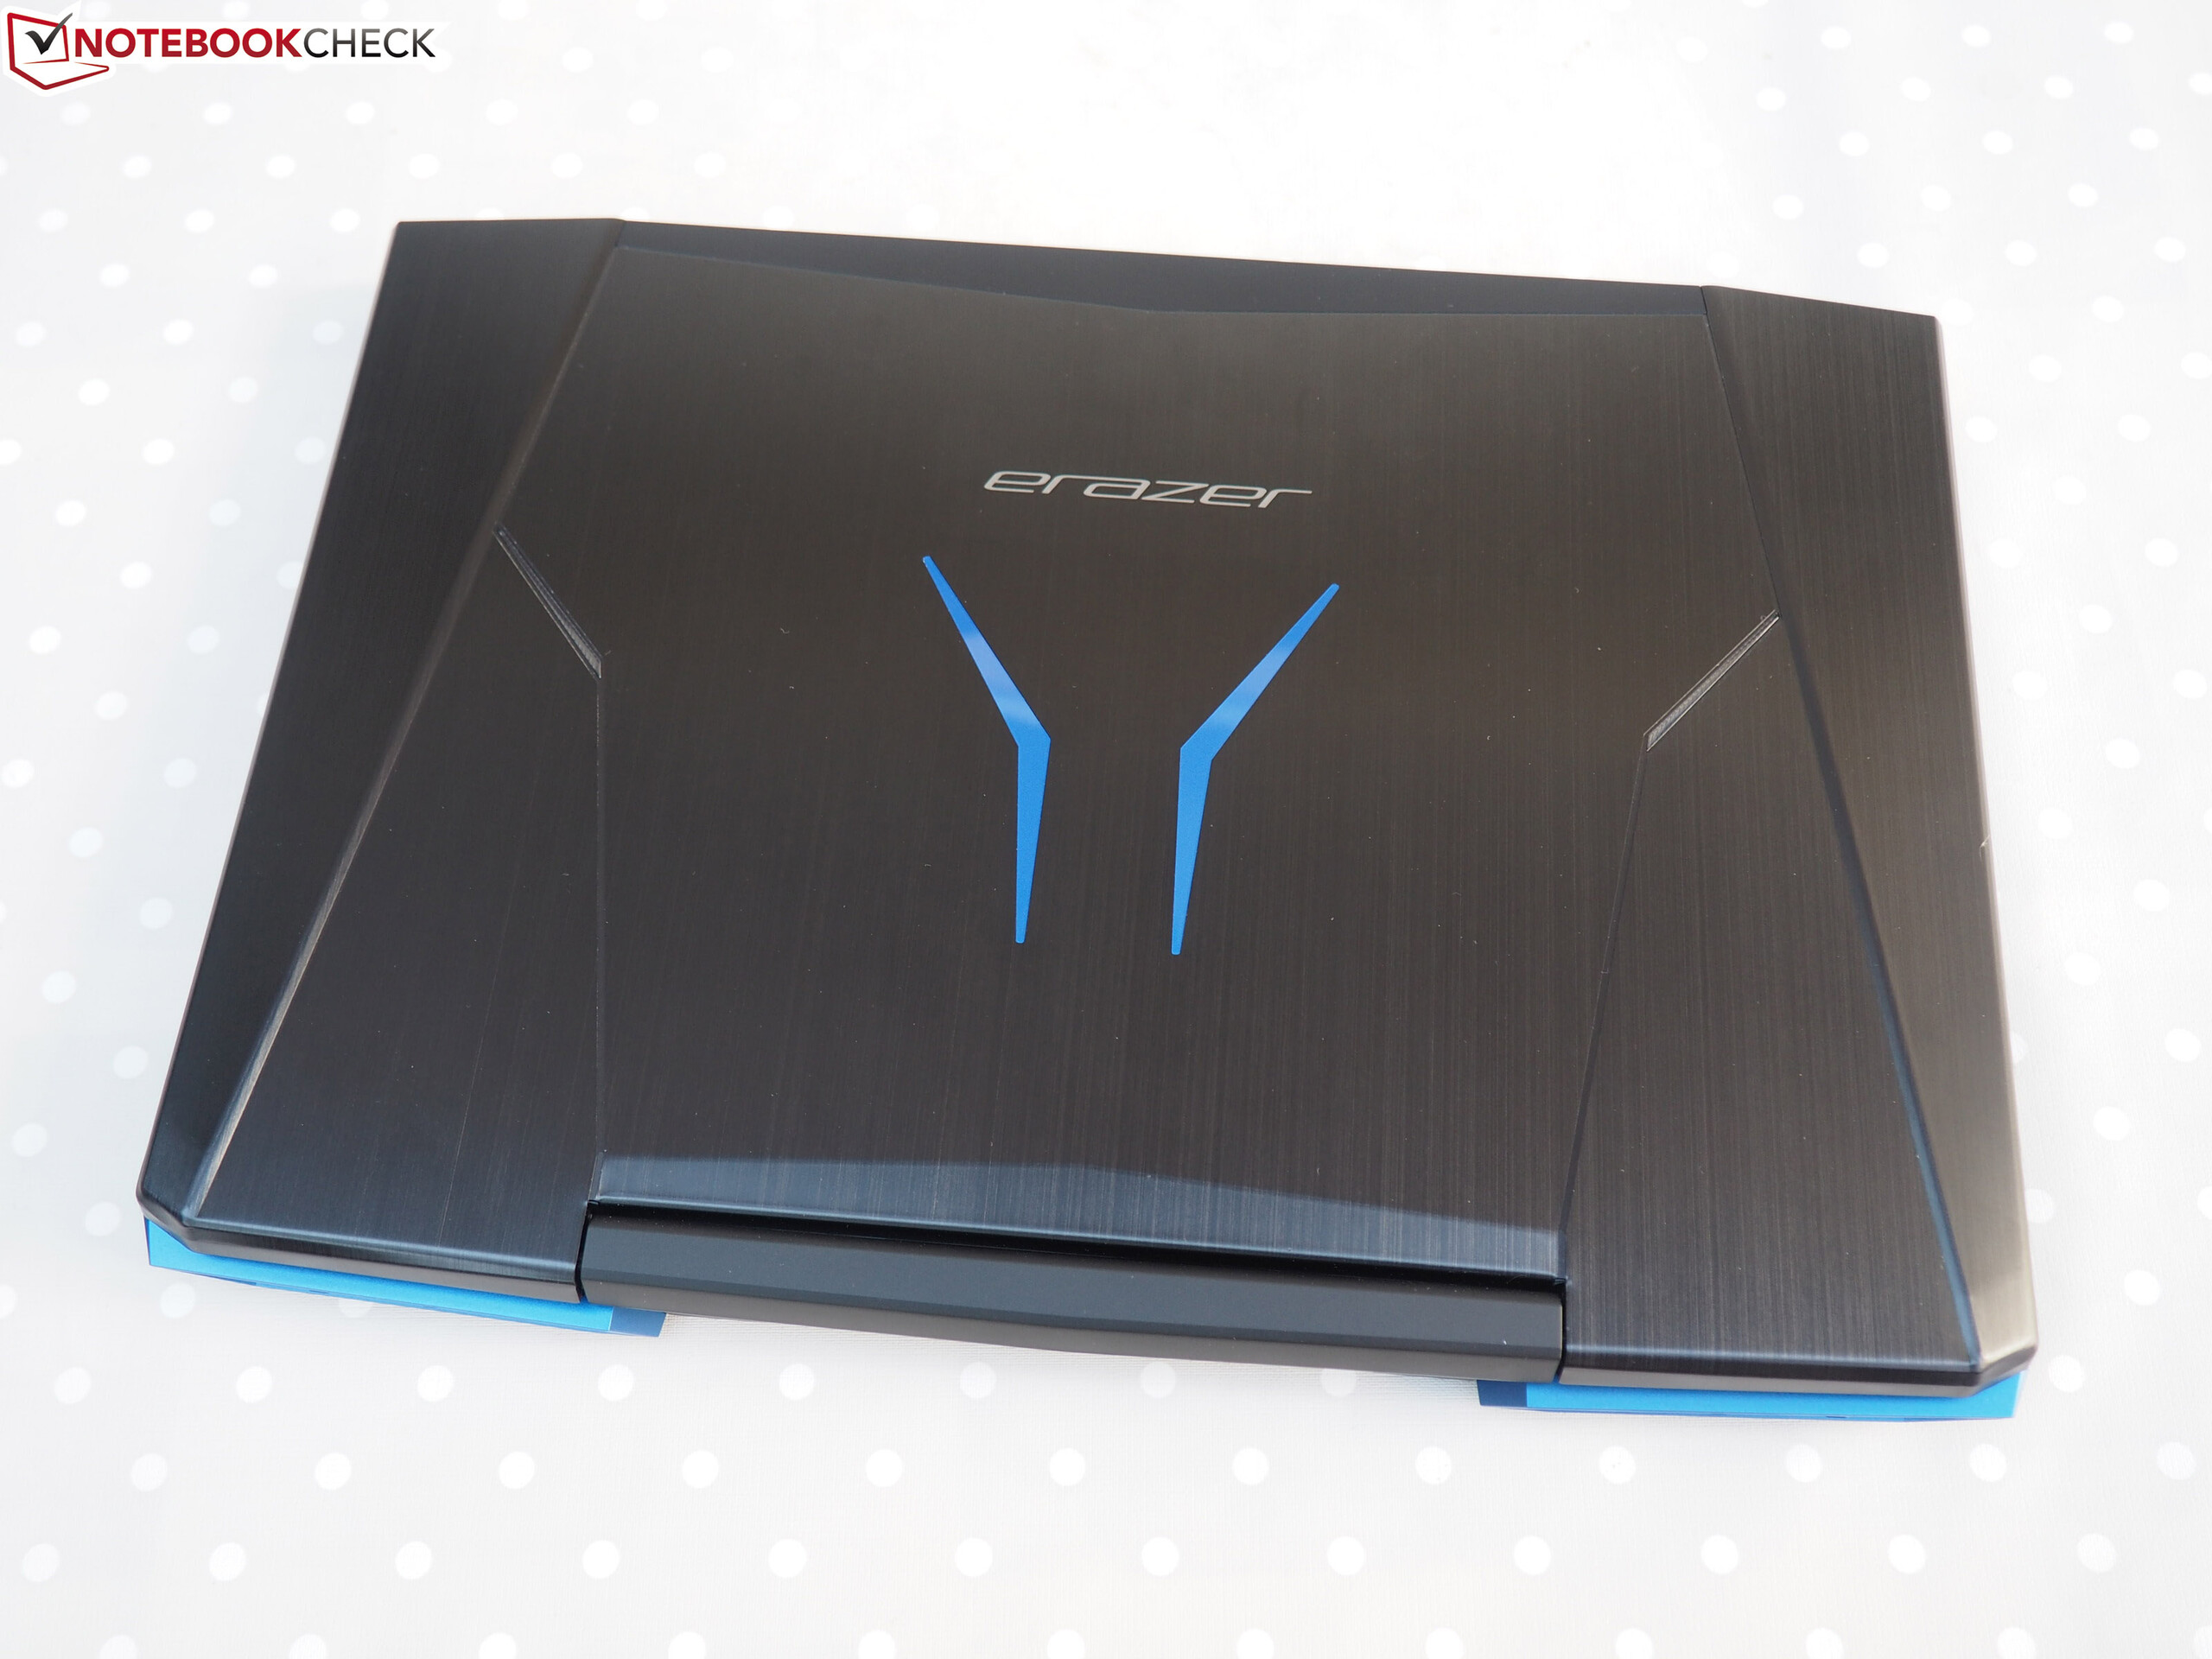
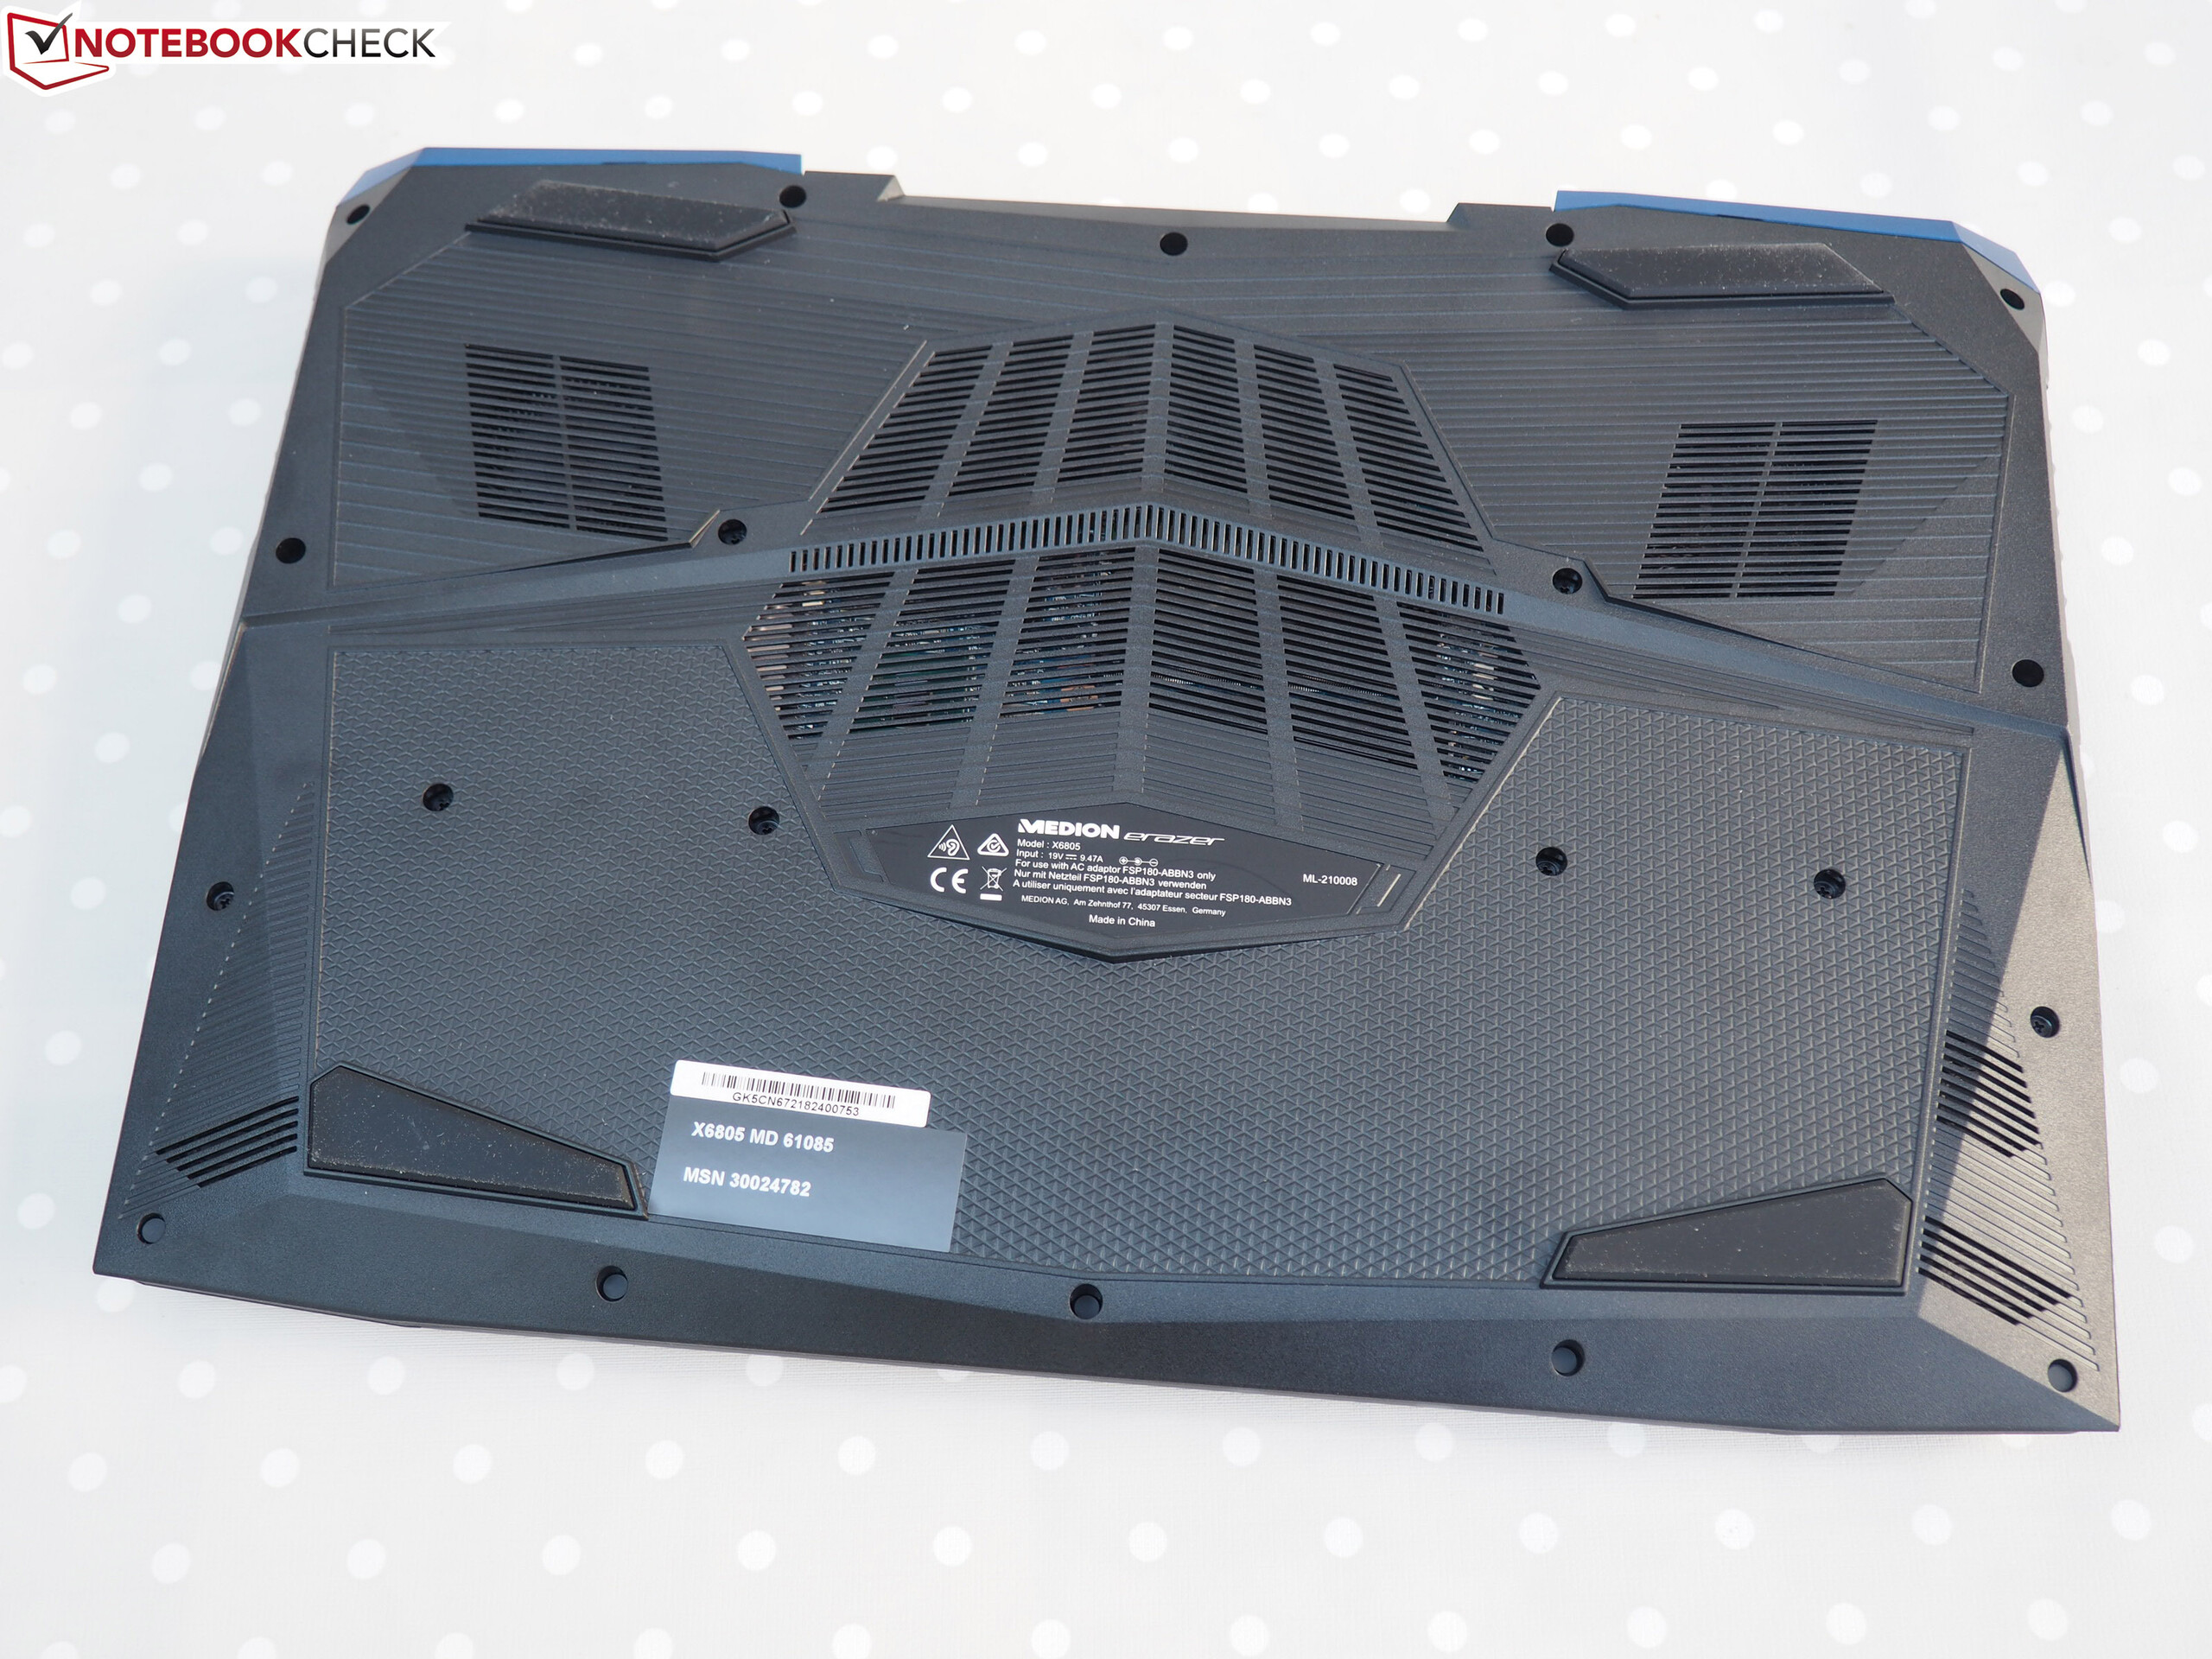
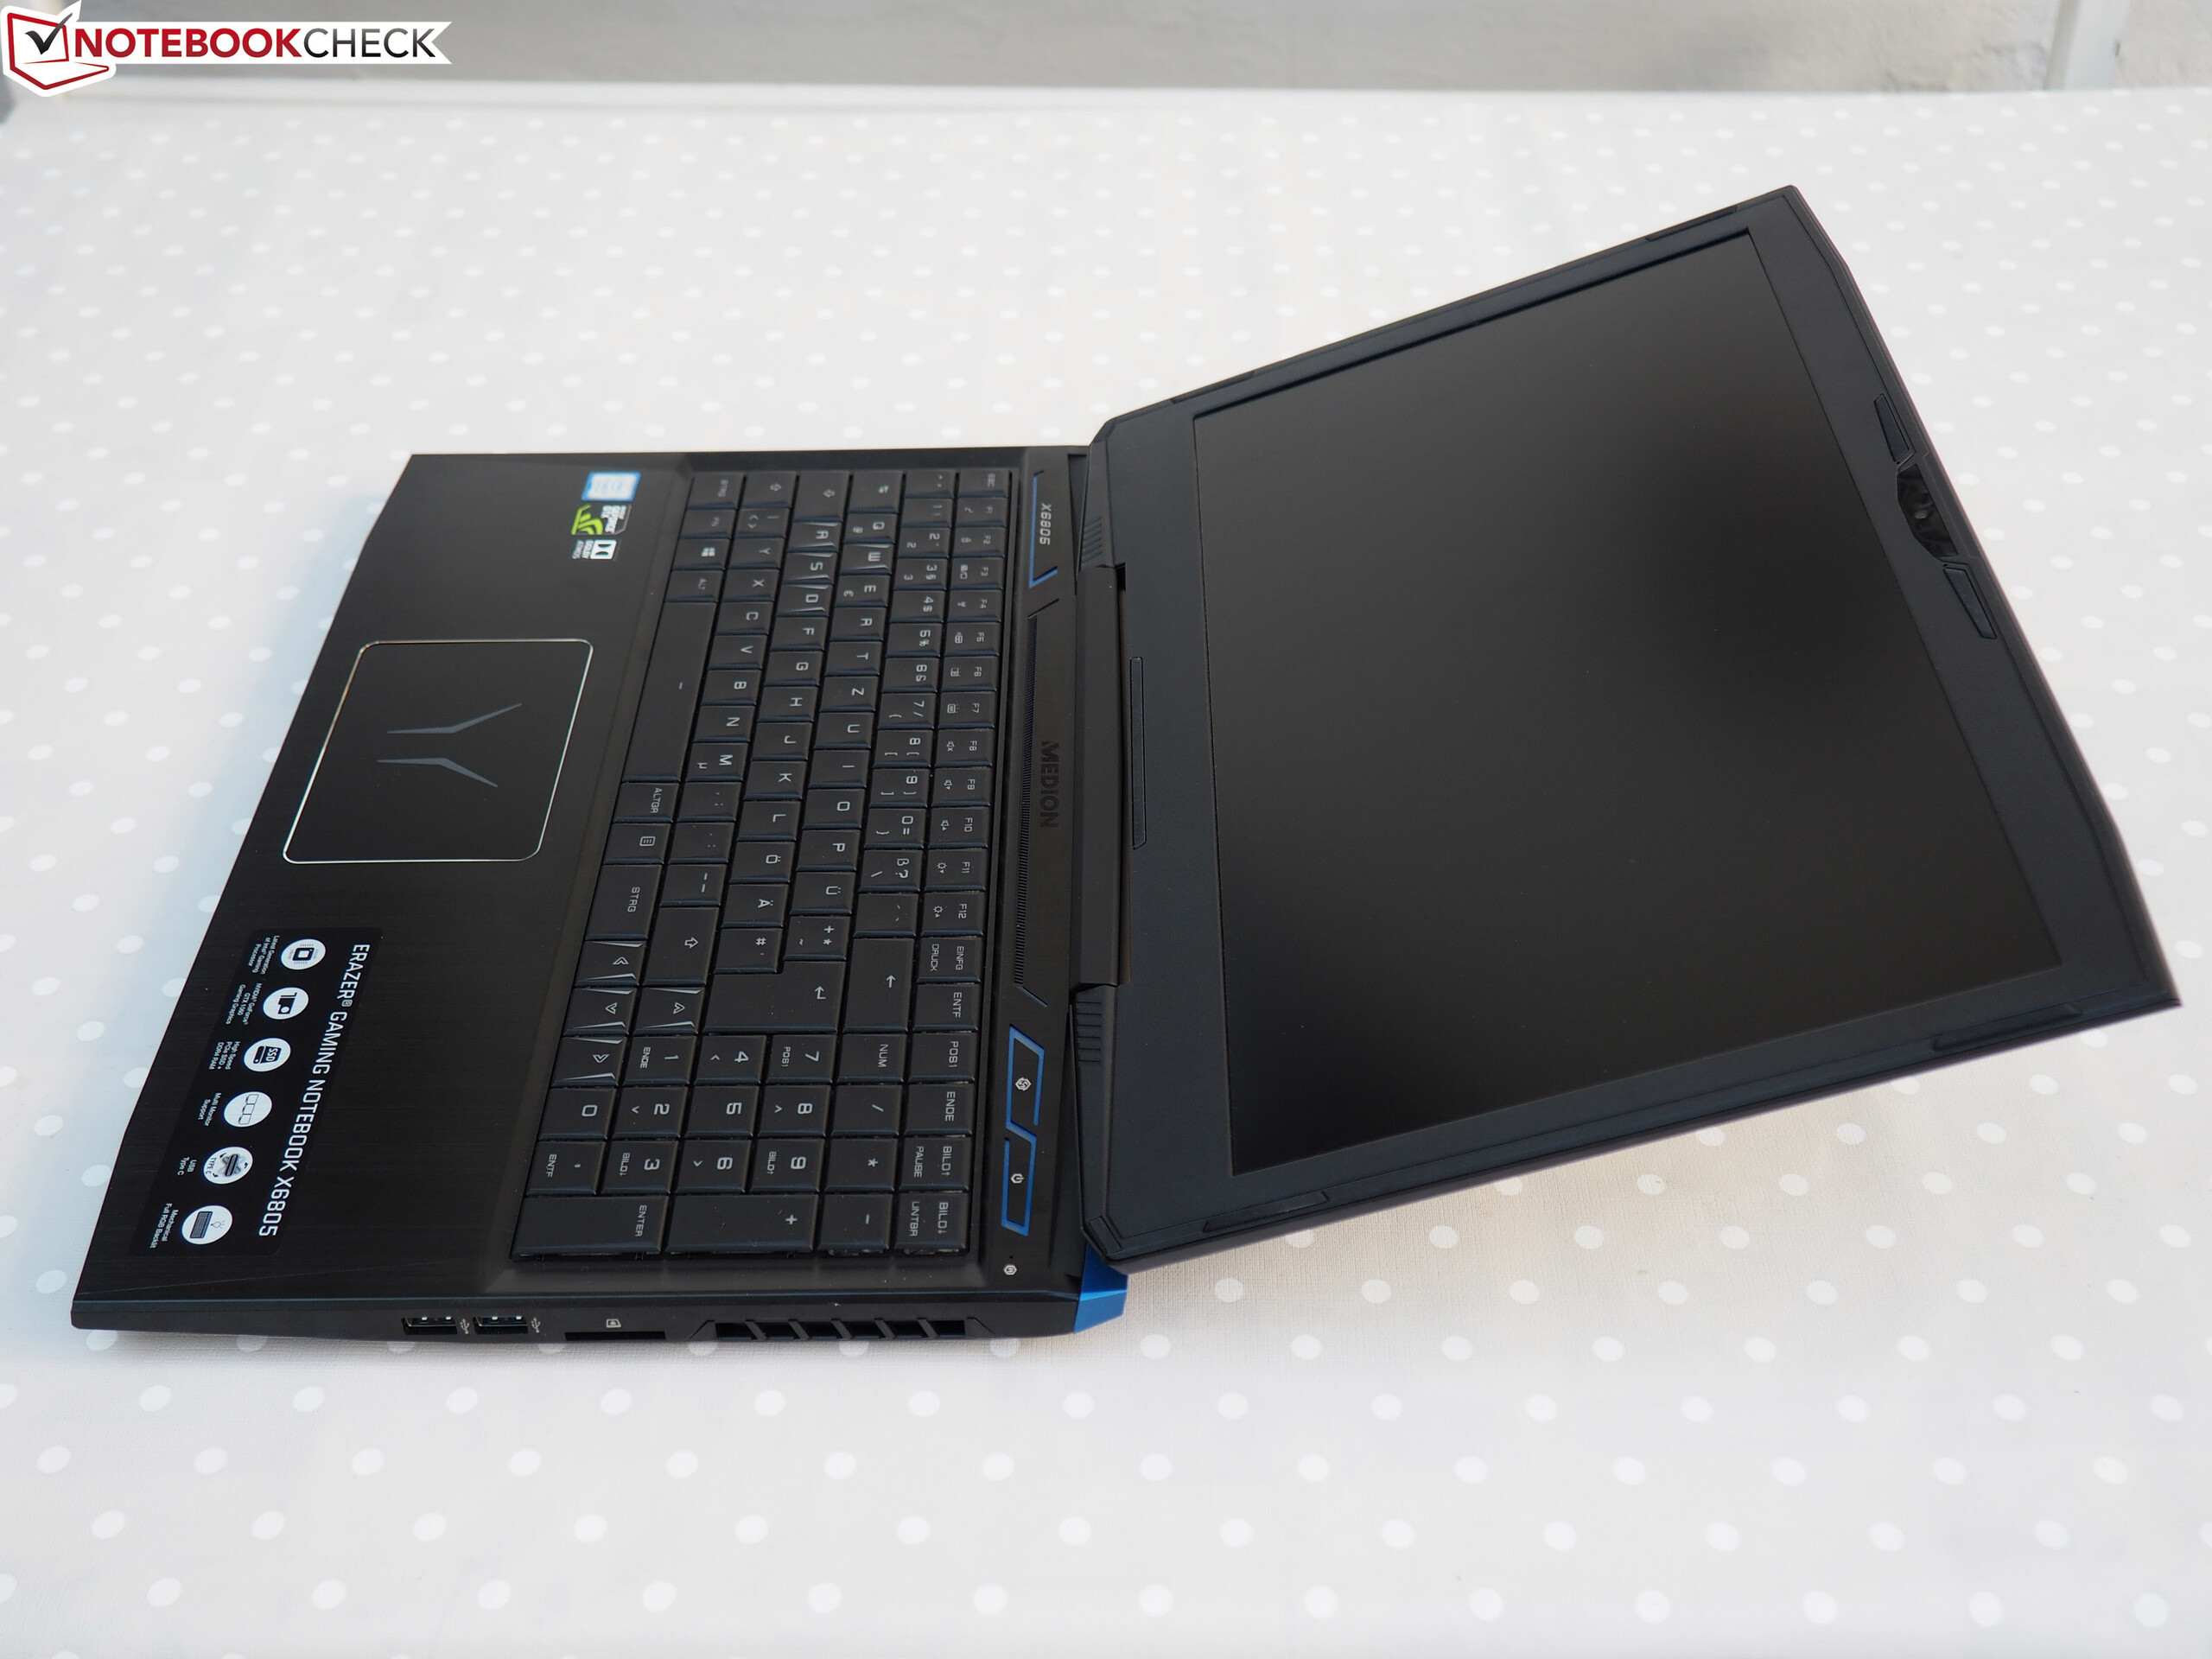
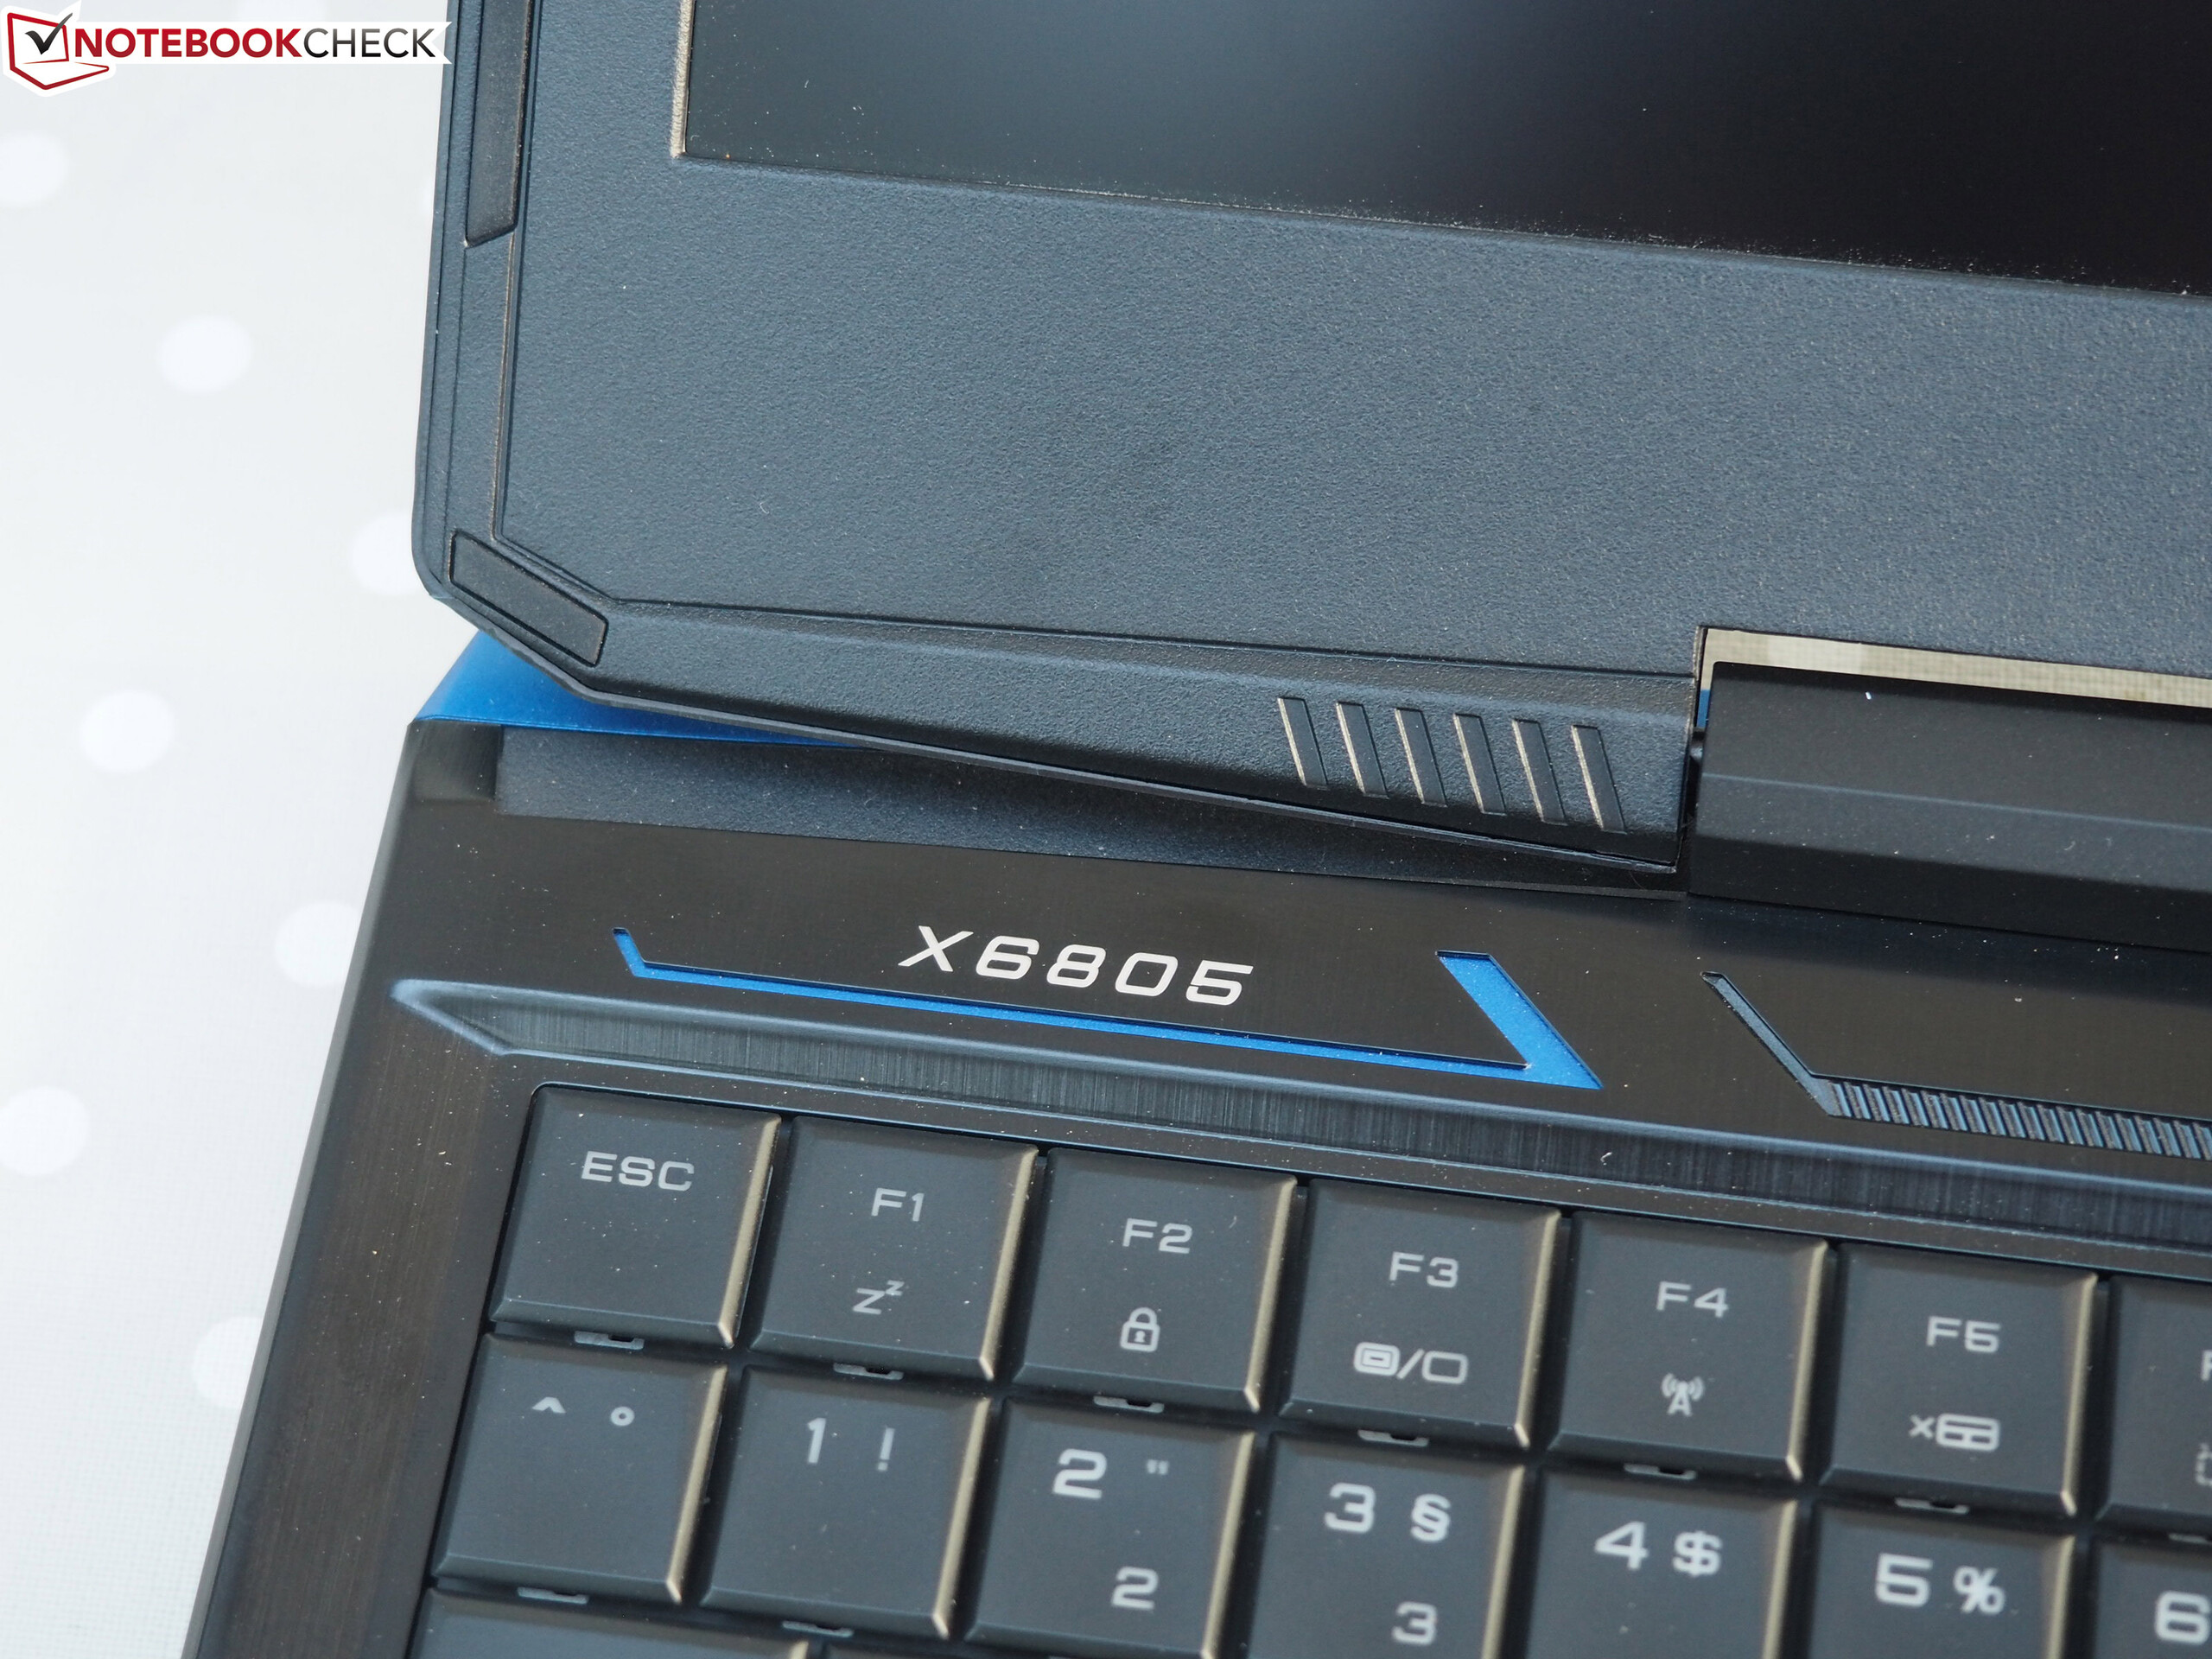
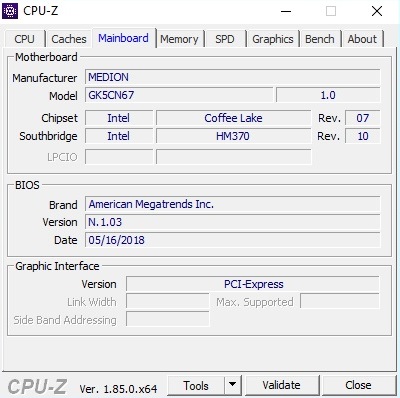
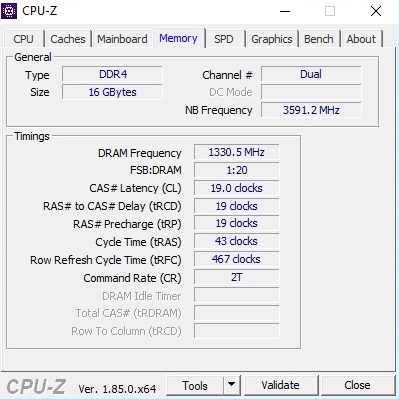
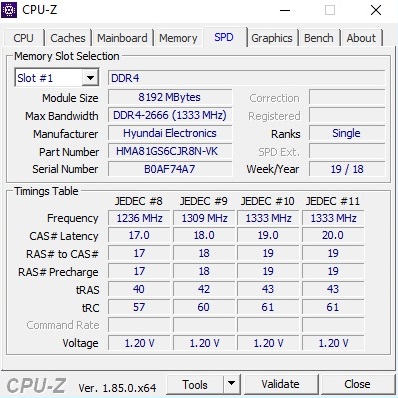
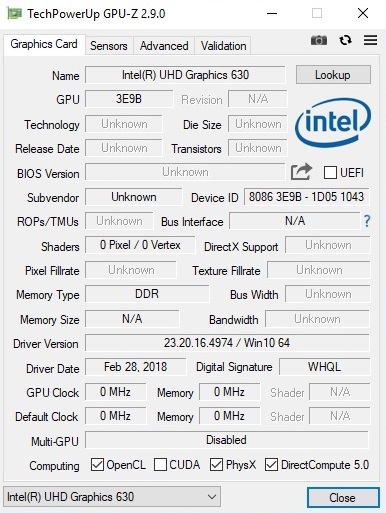
Breve Análise do Portátil Medion Erazer X6805 (Core i7-8750H, GTX 1060, FHD)
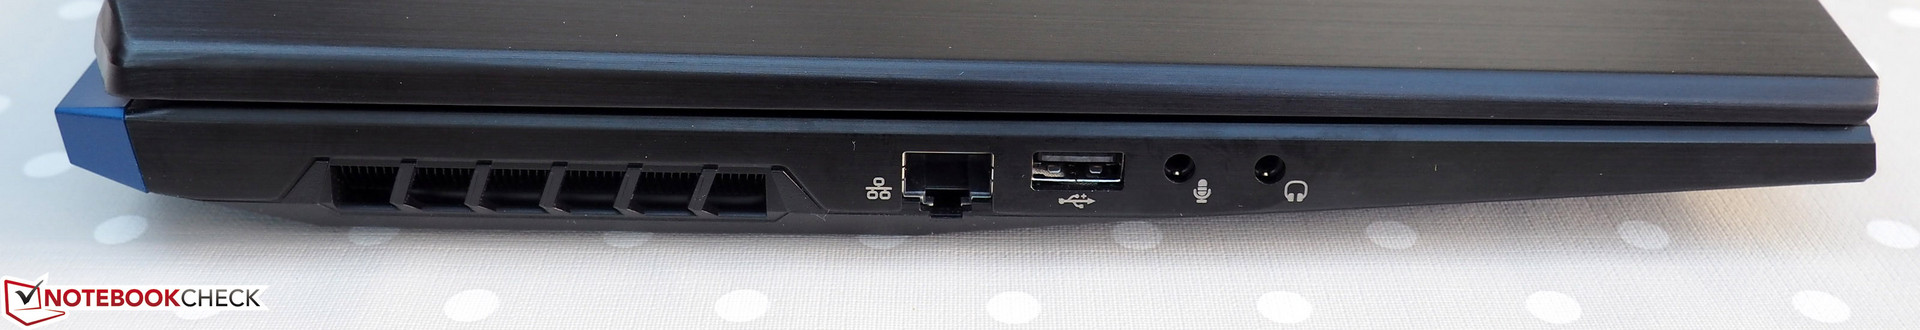
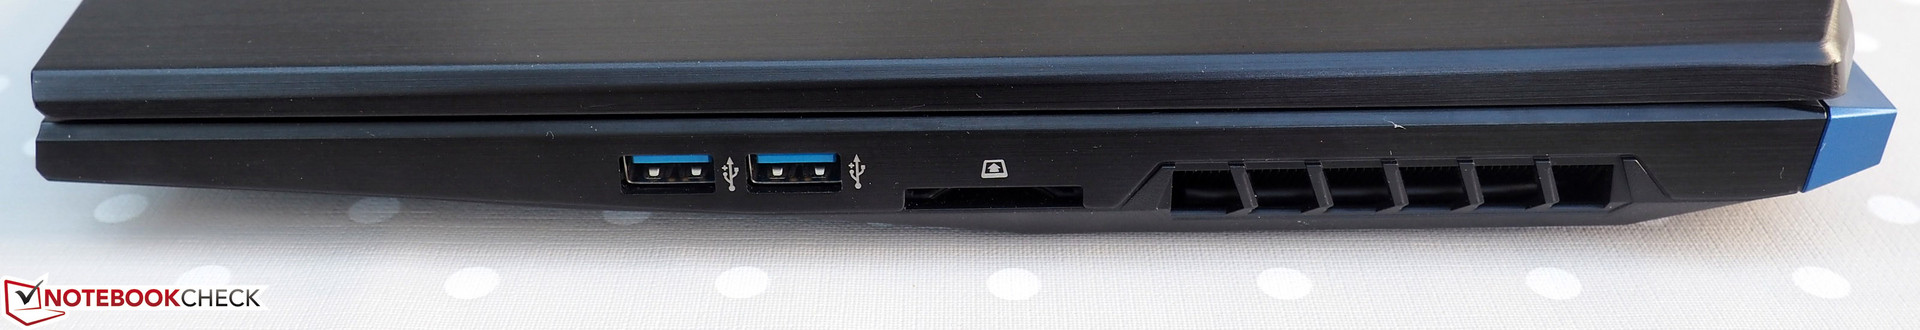
| SD Card Reader | |
| average JPG Copy Test (av. of 3 runs) | |
| Média da turma Gaming (20.9 - 210, n=55, últimos 2 anos) | |
| Acer Nitro 5 AN515-52-74DR (Toshiba Exceria Pro SDXC 64 GB UHS-II) | |
| HP Omen 15-dc0001ng (Toshiba Exceria Pro SDXC 64 GB UHS-II) | |
| Xiaomi Mi Gaming Laptop 7300HQ 1060 (Toshiba Exceria Pro SDXC 64 GB UHS-II) | |
| Dell G7 15-7588 (Toshiba Exceria Pro SDXC 64 GB UHS-II) | |
| Medion Erazer X6805-MD61085 (Toshiba Exceria Pro SDXC 64 GB UHS-II) | |
| maximum AS SSD Seq Read Test (1GB) | |
| Média da turma Gaming (25.5 - 261, n=52, últimos 2 anos) | |
| HP Omen 15-dc0001ng (Toshiba Exceria Pro SDXC 64 GB UHS-II) | |
| Acer Nitro 5 AN515-52-74DR (Toshiba Exceria Pro SDXC 64 GB UHS-II) | |
| Dell G7 15-7588 (Toshiba Exceria Pro SDXC 64 GB UHS-II) | |
| Medion Erazer X6805-MD61085 (Toshiba Exceria Pro SDXC 64 GB UHS-II) | |
| Xiaomi Mi Gaming Laptop 7300HQ 1060 (Toshiba Exceria Pro SDXC 64 GB UHS-II) | |
| |||||||||||||||||||||||||
iluminação: 86 %
iluminação com acumulador: 270 cd/m²
Contraste: 844:1 (Preto: 0.32 cd/m²)
ΔE ColorChecker Calman: 5.1 | ∀{0.5-29.43 Ø4.71}
calibrated: 3.25
ΔE Greyscale Calman: 4.16 | ∀{0.09-98 Ø4.96}
82% sRGB (Argyll 1.6.3 3D)
54% AdobeRGB 1998 (Argyll 1.6.3 3D)
60.3% AdobeRGB 1998 (Argyll 3D)
82.4% sRGB (Argyll 3D)
63.8% Display P3 (Argyll 3D)
Gamma: 2.53
CCT: 6860 K
| Medion Erazer X6805-MD61085 LG Philips LP156WF6 (LGD046F), IPS, 1920x1080 | Xiaomi Mi Gaming Laptop 7300HQ 1060 BOEhydis NV156FHM-N61 (BOE0747), IPS, 1920x1080 | Dell G7 15-7588 LG Philips LGD053F, IPS, 1920x1080 | Acer Nitro 5 AN515-52-74DR LG Philips LP156WF6-SPK6 (LGD0590), IPS, 1920x1080 | HP Omen 15-dc0001ng BOE07A1, IPS, 1920x1080 | Lenovo Legion Y530-15ICH B156HAN02.1, IPS, 1920x1080 | |
|---|---|---|---|---|---|---|
| Display | 5% | -36% | -33% | -33% | -35% | |
| Display P3 Coverage (%) | 63.8 | 66.6 4% | 37.82 -41% | 39.59 -38% | 39.64 -38% | 38.31 -40% |
| sRGB Coverage (%) | 82.4 | 87.3 6% | 56.2 -32% | 59.5 -28% | 59 -28% | 57.3 -30% |
| AdobeRGB 1998 Coverage (%) | 60.3 | 63.8 6% | 39.2 -35% | 40.92 -32% | 40.95 -32% | 39.58 -34% |
| Response Times | -41% | 4% | 13% | -17% | -13% | |
| Response Time Grey 50% / Grey 80% * (ms) | 38.4 ? | 53.2 ? -39% | 38.8 ? -1% | 38 ? 1% | 47.2 ? -23% | 43.6 ? -14% |
| Response Time Black / White * (ms) | 29.2 ? | 41.6 ? -42% | 26.8 ? 8% | 22 ? 25% | 32.4 ? -11% | 32.4 ? -11% |
| PWM Frequency (Hz) | 20490 ? | 21550 ? | 200 ? | |||
| Screen | 12% | -41% | 4% | -1% | -19% | |
| Brightness middle (cd/m²) | 270 | 283 5% | 250.9 -7% | 252 -7% | 275 2% | 282.8 5% |
| Brightness (cd/m²) | 269 | 269 0% | 246 -9% | 237 -12% | 254 -6% | 264 -2% |
| Brightness Distribution (%) | 86 | 87 1% | 89 3% | 86 0% | 90 5% | 88 2% |
| Black Level * (cd/m²) | 0.32 | 0.23 28% | 0.34 -6% | 0.21 34% | 0.27 16% | 0.42 -31% |
| Contrast (:1) | 844 | 1230 46% | 738 -13% | 1200 42% | 1019 21% | 673 -20% |
| Colorchecker dE 2000 * | 5.1 | 4.68 8% | 7.34 -44% | 4.42 13% | 4.62 9% | 4.93 3% |
| Colorchecker dE 2000 max. * | 9.25 | 8 14% | 28.66 -210% | 7.21 22% | 8.05 13% | 17.65 -91% |
| Colorchecker dE 2000 calibrated * | 3.25 | 2.5 23% | 4.42 -36% | 3.08 5% | 3.59 -10% | 4.07 -25% |
| Greyscale dE 2000 * | 4.16 | 4.32 -4% | 6.8 -63% | 3.74 10% | 4.31 -4% | 3.8 9% |
| Gamma | 2.53 87% | 2.36 93% | 2.164 102% | 2.34 94% | 2.49 88% | 2.449 90% |
| CCT | 6860 95% | 7612 85% | 6780 96% | 7291 89% | 7000 93% | 6112 106% |
| Color Space (Percent of AdobeRGB 1998) (%) | 54 | 57 6% | 36 -33% | 38 -30% | 38 -30% | 36 -33% |
| Color Space (Percent of sRGB) (%) | 82 | 87 6% | 56 -32% | 59 -28% | 59 -28% | 57 -30% |
| Média Total (Programa/Configurações) | -8% /
4% | -24% /
-34% | -5% /
-1% | -17% /
-9% | -22% /
-21% |
* ... menor é melhor
Exibir tempos de resposta
| ↔ Tempo de resposta preto para branco | ||
|---|---|---|
| 29.2 ms ... ascensão ↗ e queda ↘ combinadas | ↗ 16.8 ms ascensão | 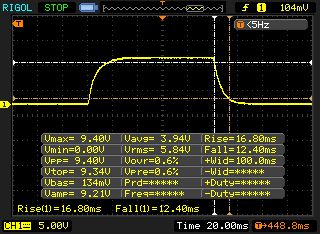 |
| ↘ 12.4 ms queda | ||
| A tela mostra taxas de resposta relativamente lentas em nossos testes e pode ser muito lenta para os jogadores. Em comparação, todos os dispositivos testados variam de 0.1 (mínimo) a 240 (máximo) ms. » 78 % de todos os dispositivos são melhores. Isso significa que o tempo de resposta medido é pior que a média de todos os dispositivos testados (19.8 ms). | ||
| ↔ Tempo de resposta 50% cinza a 80% cinza | ||
| 38.4 ms ... ascensão ↗ e queda ↘ combinadas | ↗ 18.8 ms ascensão | 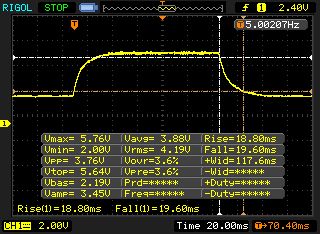 |
| ↘ 19.6 ms queda | ||
| A tela mostra taxas de resposta lentas em nossos testes e será insatisfatória para os jogadores. Em comparação, todos os dispositivos testados variam de 0.165 (mínimo) a 636 (máximo) ms. » 58 % de todos os dispositivos são melhores. Isso significa que o tempo de resposta medido é pior que a média de todos os dispositivos testados (30.9 ms). | ||
Cintilação da tela / PWM (modulação por largura de pulso)
| Tela tremeluzindo/PWM detectado | 20490 Hz | ≤ 99 % configuração de brilho | 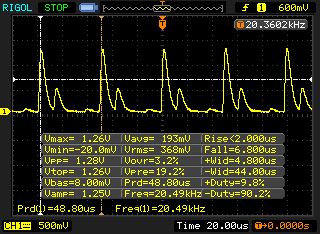 |
A luz de fundo da tela pisca em 20490 Hz (pior caso, por exemplo, utilizando PWM) Cintilação detectada em uma configuração de brilho de 99 % e abaixo. Não deve haver cintilação ou PWM acima desta configuração de brilho. A frequência de 20490 Hz é bastante alta, então a maioria dos usuários sensíveis ao PWM não deve notar nenhuma oscilação. [pwm_comparison] Em comparação: 52 % de todos os dispositivos testados não usam PWM para escurecer a tela. Se PWM foi detectado, uma média de 7748 (mínimo: 5 - máximo: 343500) Hz foi medida. | |||
| PCMark 8 Home Score Accelerated v2 | 4404 pontos | |
| PCMark 8 Work Score Accelerated v2 | 5379 pontos | |
| PCMark 10 Score | 5234 pontos | |
Ajuda | ||
| Medion Erazer X6805-MD61085 Samsung PM961 MZVLW256HEHP | Xiaomi Mi Gaming Laptop 7300HQ 1060 Samsung PM871b MZNLN128HAHQ | Dell G7 15-7588 SK hynix SC311 SATA | Acer Nitro 5 AN515-52-74DR Intel SSD 600p SSDPEKKW512G7 | HP Omen 15-dc0001ng Toshiba KBG30ZMV128G | Lenovo Legion Y530-15ICH Toshiba KBG30ZMT128G | |
|---|---|---|---|---|---|---|
| AS SSD | -51% | -69% | -32% | -56% | -60% | |
| Seq Read (MB/s) | 1653 | 502 -70% | 506 -69% | 1321 -20% | 1238 -25% | 1231 -26% |
| Seq Write (MB/s) | 1262 | 450.1 -64% | 220.3 -83% | 554 -56% | 123.5 -90% | 131.6 -90% |
| 4K Read (MB/s) | 44.29 | 38.11 -14% | 23.66 -47% | 32.38 -27% | 31.48 -29% | 38.71 -13% |
| 4K Write (MB/s) | 100.9 | 104.1 3% | 59.8 -41% | 94.5 -6% | 79.3 -21% | 35.74 -65% |
| Score Read (Points) | 1565 | 343 -78% | 233 -85% | 670 -57% | 343 -78% | 497 -68% |
| Score Write (Points) | 762 | 302 -60% | 181 -76% | 661 -13% | 195 -74% | 128 -83% |
| Score Total (Points) | 3113 | 834 -73% | 528 -83% | 1643 -47% | 670 -78% | 838 -73% |

| 3DMark 11 Performance | 13648 pontos | |
| 3DMark Cloud Gate Standard Score | 33333 pontos | |
| 3DMark Fire Strike Score | 10351 pontos | |
Ajuda | ||
| The Witcher 3 | |
| 1920x1080 Ultra Graphics & Postprocessing (HBAO+) | |
| Média da turma Gaming (104.7 - 240, n=7, últimos 2 anos) | |
| Xiaomi Mi Gaming Laptop 7300HQ 1060 | |
| Medion Erazer X6805-MD61085 | |
| Lenovo Legion Y530-15ICH | |
| Dell G7 15-7588 | |
| Acer Nitro 5 AN515-52-74DR | |
| HP Omen 15-dc0001ng | |
| 1920x1080 High Graphics & Postprocessing (Nvidia HairWorks Off) | |
| Média da turma Gaming (341 - 404, n=2, últimos 2 anos) | |
| Xiaomi Mi Gaming Laptop 7300HQ 1060 | |
| Medion Erazer X6805-MD61085 | |
| Dell G7 15-7588 | |
| Acer Nitro 5 AN515-52-74DR | |
| HP Omen 15-dc0001ng | |
| baixo | média | alto | ultra | |
|---|---|---|---|---|
| The Witcher 3 (2015) | 72.1 | 39.5 | ||
| Destiny 2 (2017) | 93.8 | 81.3 | ||
| Wolfenstein II: The New Colossus (2017) | 85.2 | 78.7 | ||
| Call of Duty WWII (2017) | 94.5 | 68.2 | ||
| The Crew 2 (2018) | 60 | 59.9 | ||
| Monster Hunter World (2018) | 56.5 | 44.9 | ||
| F1 2018 (2018) | 97 | 60 | ||
| Shadow of the Tomb Raider (2018) | 56 | 49 |
Barulho
| Ocioso |
| 29 / 32 / 35 dB |
| HDD |
| 32 dB |
| Carga |
| 45 / 56 dB |
 | ||
30 dB silencioso 40 dB(A) audível 50 dB(A) ruidosamente alto |
||
min: | ||
| Medion Erazer X6805-MD61085 GeForce GTX 1060 Mobile, i7-8750H | Xiaomi Mi Gaming Laptop 7300HQ 1060 GeForce GTX 1060 Mobile, i5-7300HQ | Dell G7 15-7588 GeForce GTX 1060 Max-Q, i7-8750H | Acer Nitro 5 AN515-52-74DR GeForce GTX 1050 Ti Mobile, i7-8750H | HP Omen 15-dc0001ng GeForce GTX 1050 Ti Mobile, i5-8300H | Lenovo Legion Y530-15ICH GeForce GTX 1050 Ti Mobile, i5-8300H | Média da turma Gaming | |
|---|---|---|---|---|---|---|---|
| Noise | -3% | 6% | 3% | -1% | 12% | 10% | |
| desligado / ambiente * (dB) | 29 | 30 -3% | 28.1 3% | 30 -3% | 29 -0% | 28 3% | 24.1 ? 17% |
| Idle Minimum * (dB) | 29 | 30 -3% | 29 -0% | 30 -3% | 29 -0% | 28 3% | 26 ? 10% |
| Idle Average * (dB) | 32 | 34 -6% | 29 9% | 32 -0% | 33 -3% | 28 12% | 27.5 ? 14% |
| Idle Maximum * (dB) | 35 | 38 -9% | 29.2 17% | 33 6% | 41 -17% | 28.5 19% | 30.1 ? 14% |
| Load Average * (dB) | 45 | 44 2% | 40.6 10% | 42 7% | 44 2% | 34.9 22% | 43.8 ? 3% |
| Witcher 3 ultra * (dB) | 47 | 50 -6% | 49.8 -6% | 46 2% | 47 -0% | 40 15% | |
| Load Maximum * (dB) | 56 | 55 2% | 49.8 11% | 49 12% | 49 12% | 49.6 11% | 54.3 ? 3% |
* ... menor é melhor
(±) A temperatura máxima no lado superior é 43 °C / 109 F, em comparação com a média de 40.4 °C / 105 F , variando de 21.2 a 68.8 °C para a classe Gaming.
(-) A parte inferior aquece até um máximo de 55 °C / 131 F, em comparação com a média de 43.2 °C / 110 F
(+) Em uso inativo, a temperatura média para o lado superior é 26 °C / 79 F, em comparação com a média do dispositivo de 33.9 °C / ### class_avg_f### F.
(±) Jogando The Witcher 3, a temperatura média para o lado superior é 37.1 °C / 99 F, em comparação com a média do dispositivo de 33.9 °C / ## #class_avg_f### F.
(+) Os apoios para as mãos e o touchpad estão atingindo a temperatura máxima da pele (32 °C / 89.6 F) e, portanto, não estão quentes.
(-) A temperatura média da área do apoio para as mãos de dispositivos semelhantes foi 28.8 °C / 83.8 F (-3.2 °C / -5.8 F).
| Medion Erazer X6805-MD61085 GeForce GTX 1060 Mobile, i7-8750H | Xiaomi Mi Gaming Laptop 7300HQ 1060 GeForce GTX 1060 Mobile, i5-7300HQ | Dell G7 15-7588 GeForce GTX 1060 Max-Q, i7-8750H | Acer Nitro 5 AN515-52-74DR GeForce GTX 1050 Ti Mobile, i7-8750H | HP Omen 15-dc0001ng GeForce GTX 1050 Ti Mobile, i5-8300H | Lenovo Legion Y530-15ICH GeForce GTX 1050 Ti Mobile, i5-8300H | Média da turma Gaming | |
|---|---|---|---|---|---|---|---|
| Heat | -6% | 5% | -14% | -17% | -10% | -5% | |
| Maximum Upper Side * (°C) | 43 | 46 -7% | 48.6 -13% | 52 -21% | 51 -19% | 42.8 -0% | 45.2 ? -5% |
| Maximum Bottom * (°C) | 55 | 52 5% | 51.4 7% | 55 -0% | 58 -5% | 52 5% | 48.2 ? 12% |
| Idle Upper Side * (°C) | 28 | 32 -14% | 24 14% | 36 -29% | 35 -25% | 32 -14% | 31 ? -11% |
| Idle Bottom * (°C) | 30 | 32 -7% | 26.8 11% | 32 -7% | 35 -17% | 39.4 -31% | 34.2 ? -14% |
* ... menor é melhor
Medion Erazer X6805-MD61085 análise de áudio
(+) | os alto-falantes podem tocar relativamente alto (###valor### dB)
Graves 100 - 315Hz
(±) | graves reduzidos - em média 11.2% menor que a mediana
(±) | a linearidade dos graves é média (9.6% delta para a frequência anterior)
Médios 400 - 2.000 Hz
(+) | médios equilibrados - apenas 4.9% longe da mediana
(±) | a linearidade dos médios é média (8.2% delta para frequência anterior)
Altos 2 - 16 kHz
(+) | agudos equilibrados - apenas 2.9% longe da mediana
(±) | a linearidade dos máximos é média (7.8% delta para frequência anterior)
Geral 100 - 16.000 Hz
(+) | o som geral é linear (13.5% diferença em relação à mediana)
Comparado com a mesma classe
» 20% de todos os dispositivos testados nesta classe foram melhores, 7% semelhantes, 73% piores
» O melhor teve um delta de 6%, a média foi 18%, o pior foi 132%
Comparado com todos os dispositivos testados
» 14% de todos os dispositivos testados foram melhores, 4% semelhantes, 82% piores
» O melhor teve um delta de 4%, a média foi 23%, o pior foi 134%
Xiaomi Mi Gaming Laptop 7300HQ 1060 análise de áudio
(+) | os alto-falantes podem tocar relativamente alto (###valor### dB)
Graves 100 - 315Hz
(±) | graves reduzidos - em média 13.5% menor que a mediana
(±) | a linearidade dos graves é média (8.5% delta para a frequência anterior)
Médios 400 - 2.000 Hz
(+) | médios equilibrados - apenas 4.6% longe da mediana
(+) | médios são lineares (5% delta para frequência anterior)
Altos 2 - 16 kHz
(+) | agudos equilibrados - apenas 2.6% longe da mediana
(+) | os máximos são lineares (4.4% delta da frequência anterior)
Geral 100 - 16.000 Hz
(+) | o som geral é linear (13.2% diferença em relação à mediana)
Comparado com a mesma classe
» 19% de todos os dispositivos testados nesta classe foram melhores, 4% semelhantes, 77% piores
» O melhor teve um delta de 6%, a média foi 18%, o pior foi 132%
Comparado com todos os dispositivos testados
» 14% de todos os dispositivos testados foram melhores, 3% semelhantes, 84% piores
» O melhor teve um delta de 4%, a média foi 23%, o pior foi 134%
| desligado | |
| Ocioso | |
| Carga |
|
Key:
min: | |
| Medion Erazer X6805-MD61085 GeForce GTX 1060 Mobile, i7-8750H | Xiaomi Mi Gaming Laptop 7300HQ 1060 GeForce GTX 1060 Mobile, i5-7300HQ | Dell G7 15-7588 GeForce GTX 1060 Max-Q, i7-8750H | Acer Nitro 5 AN515-52-74DR GeForce GTX 1050 Ti Mobile, i7-8750H | HP Omen 15-dc0001ng GeForce GTX 1050 Ti Mobile, i5-8300H | Lenovo Legion Y530-15ICH GeForce GTX 1050 Ti Mobile, i5-8300H | Média da turma Gaming | |
|---|---|---|---|---|---|---|---|
| Power Consumption | 13% | 29% | 33% | 6% | 27% | -30% | |
| Idle Minimum * (Watt) | 10 | 10 -0% | 5.5 45% | 5 50% | 12 -20% | 4.5 55% | 13 ? -30% |
| Idle Average * (Watt) | 13 | 13 -0% | 7.6 42% | 7 46% | 14 -8% | 10 23% | 19 ? -46% |
| Idle Maximum * (Watt) | 21 | 19 10% | 9 57% | 11 48% | 18 14% | 13.8 34% | 24.5 ? -17% |
| Load Average * (Watt) | 101 | 68 33% | 94 7% | 91 10% | 92 9% | 92.5 8% | 111.1 ? -10% |
| Witcher 3 ultra * (Watt) | 126 | 110 13% | 116.3 8% | 97 23% | 100 21% | 108.1 14% | |
| Load Maximum * (Watt) | 176 | 136 23% | 154.4 12% | 137 22% | 142 19% | 123.2 30% | 260 ? -48% |
* ... menor é melhor
| Medion Erazer X6805-MD61085 GeForce GTX 1060 Mobile, i7-8750H, 46.7 Wh | Xiaomi Mi Gaming Laptop 7300HQ 1060 GeForce GTX 1060 Mobile, i5-7300HQ, 55 Wh | Dell G7 15-7588 GeForce GTX 1060 Max-Q, i7-8750H, 56 Wh | Acer Nitro 5 AN515-52-74DR GeForce GTX 1050 Ti Mobile, i7-8750H, 48 Wh | HP Omen 15-dc0001ng GeForce GTX 1050 Ti Mobile, i5-8300H, 70 Wh | Lenovo Legion Y530-15ICH GeForce GTX 1050 Ti Mobile, i5-8300H, 52.5 Wh | Média da turma Gaming | |
|---|---|---|---|---|---|---|---|
| Duração da bateria | -14% | 45% | 33% | 43% | -9% | 17% | |
| Reader / Idle (h) | 8.4 | 6.4 -24% | 10.9 30% | 12.5 49% | 10.4 24% | 8.27 ? -2% | |
| WiFi v1.3 (h) | 4.5 | 4.6 2% | 7.5 67% | 7 56% | 8.6 91% | 4.1 -9% | 7.11 ? 58% |
| Load (h) | 1.6 | 1.3 -19% | 2.2 38% | 1.5 -6% | 1.8 13% | 1.502 ? -6% | |
| H.264 (h) | 4.4 | 7.1 | 8.4 | 8.32 ? |
Pro
Contra
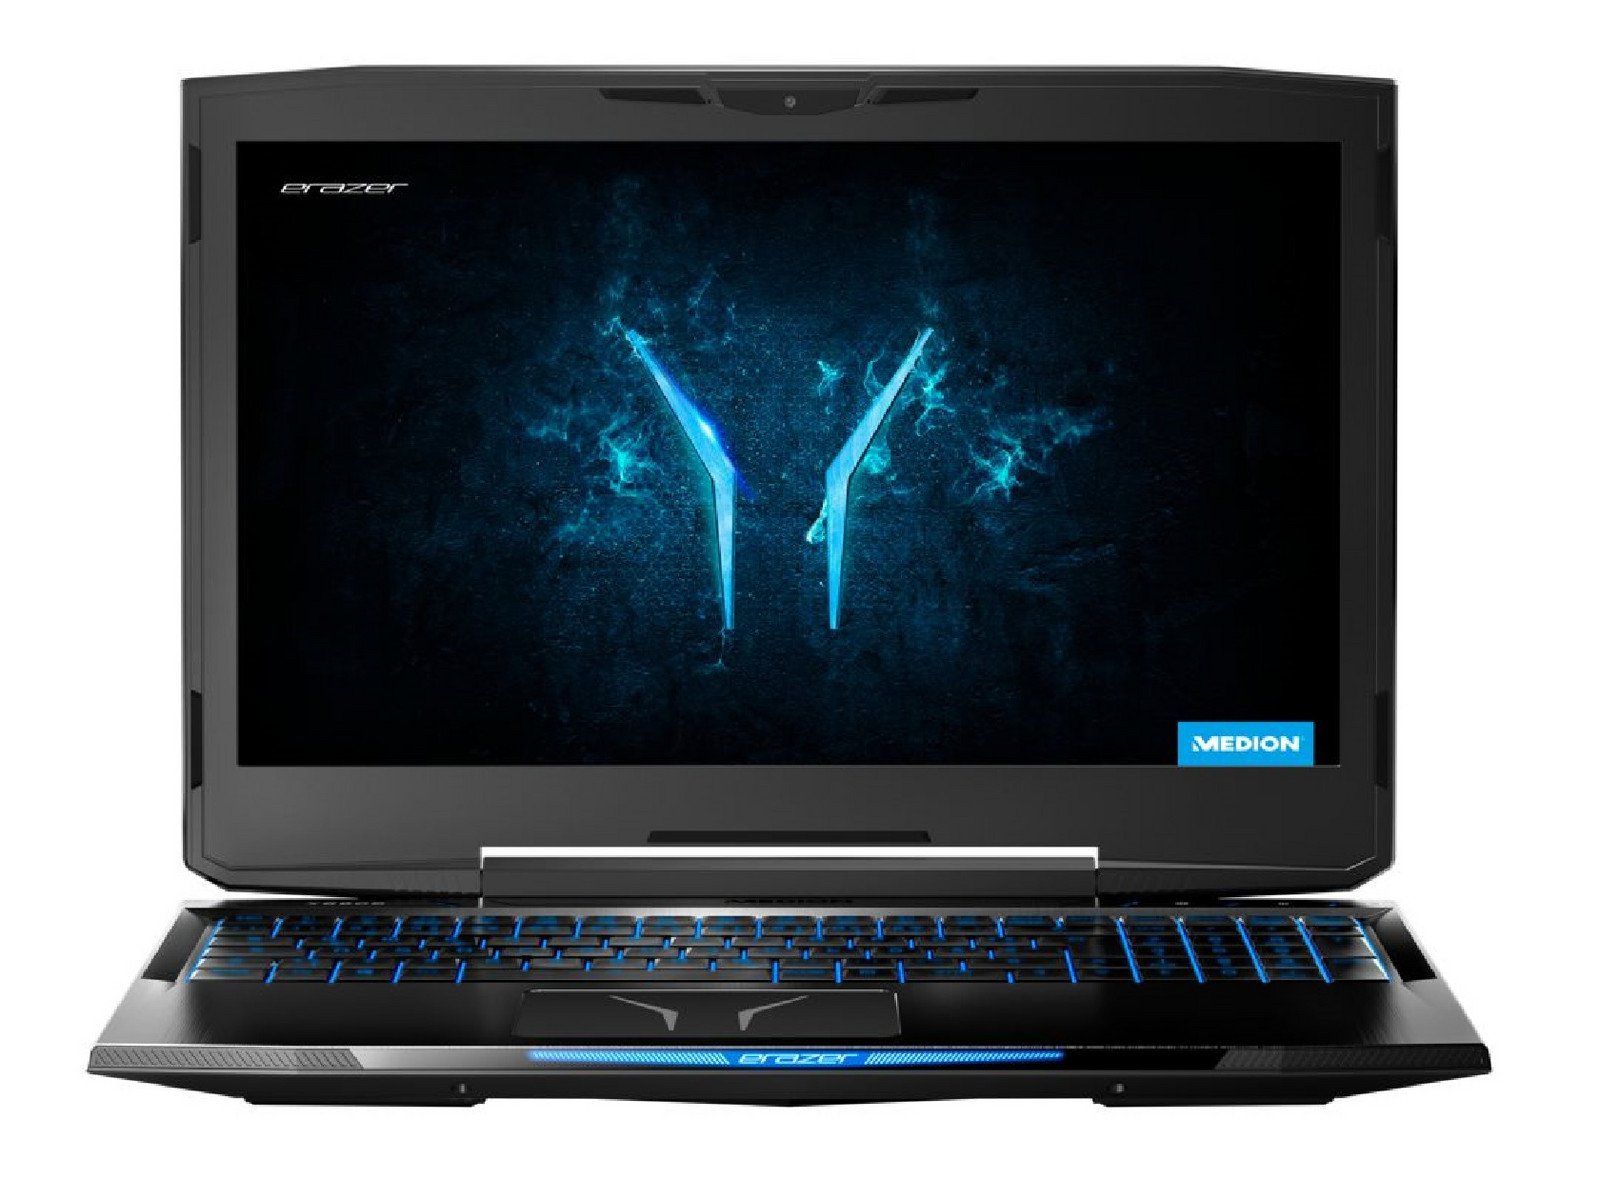
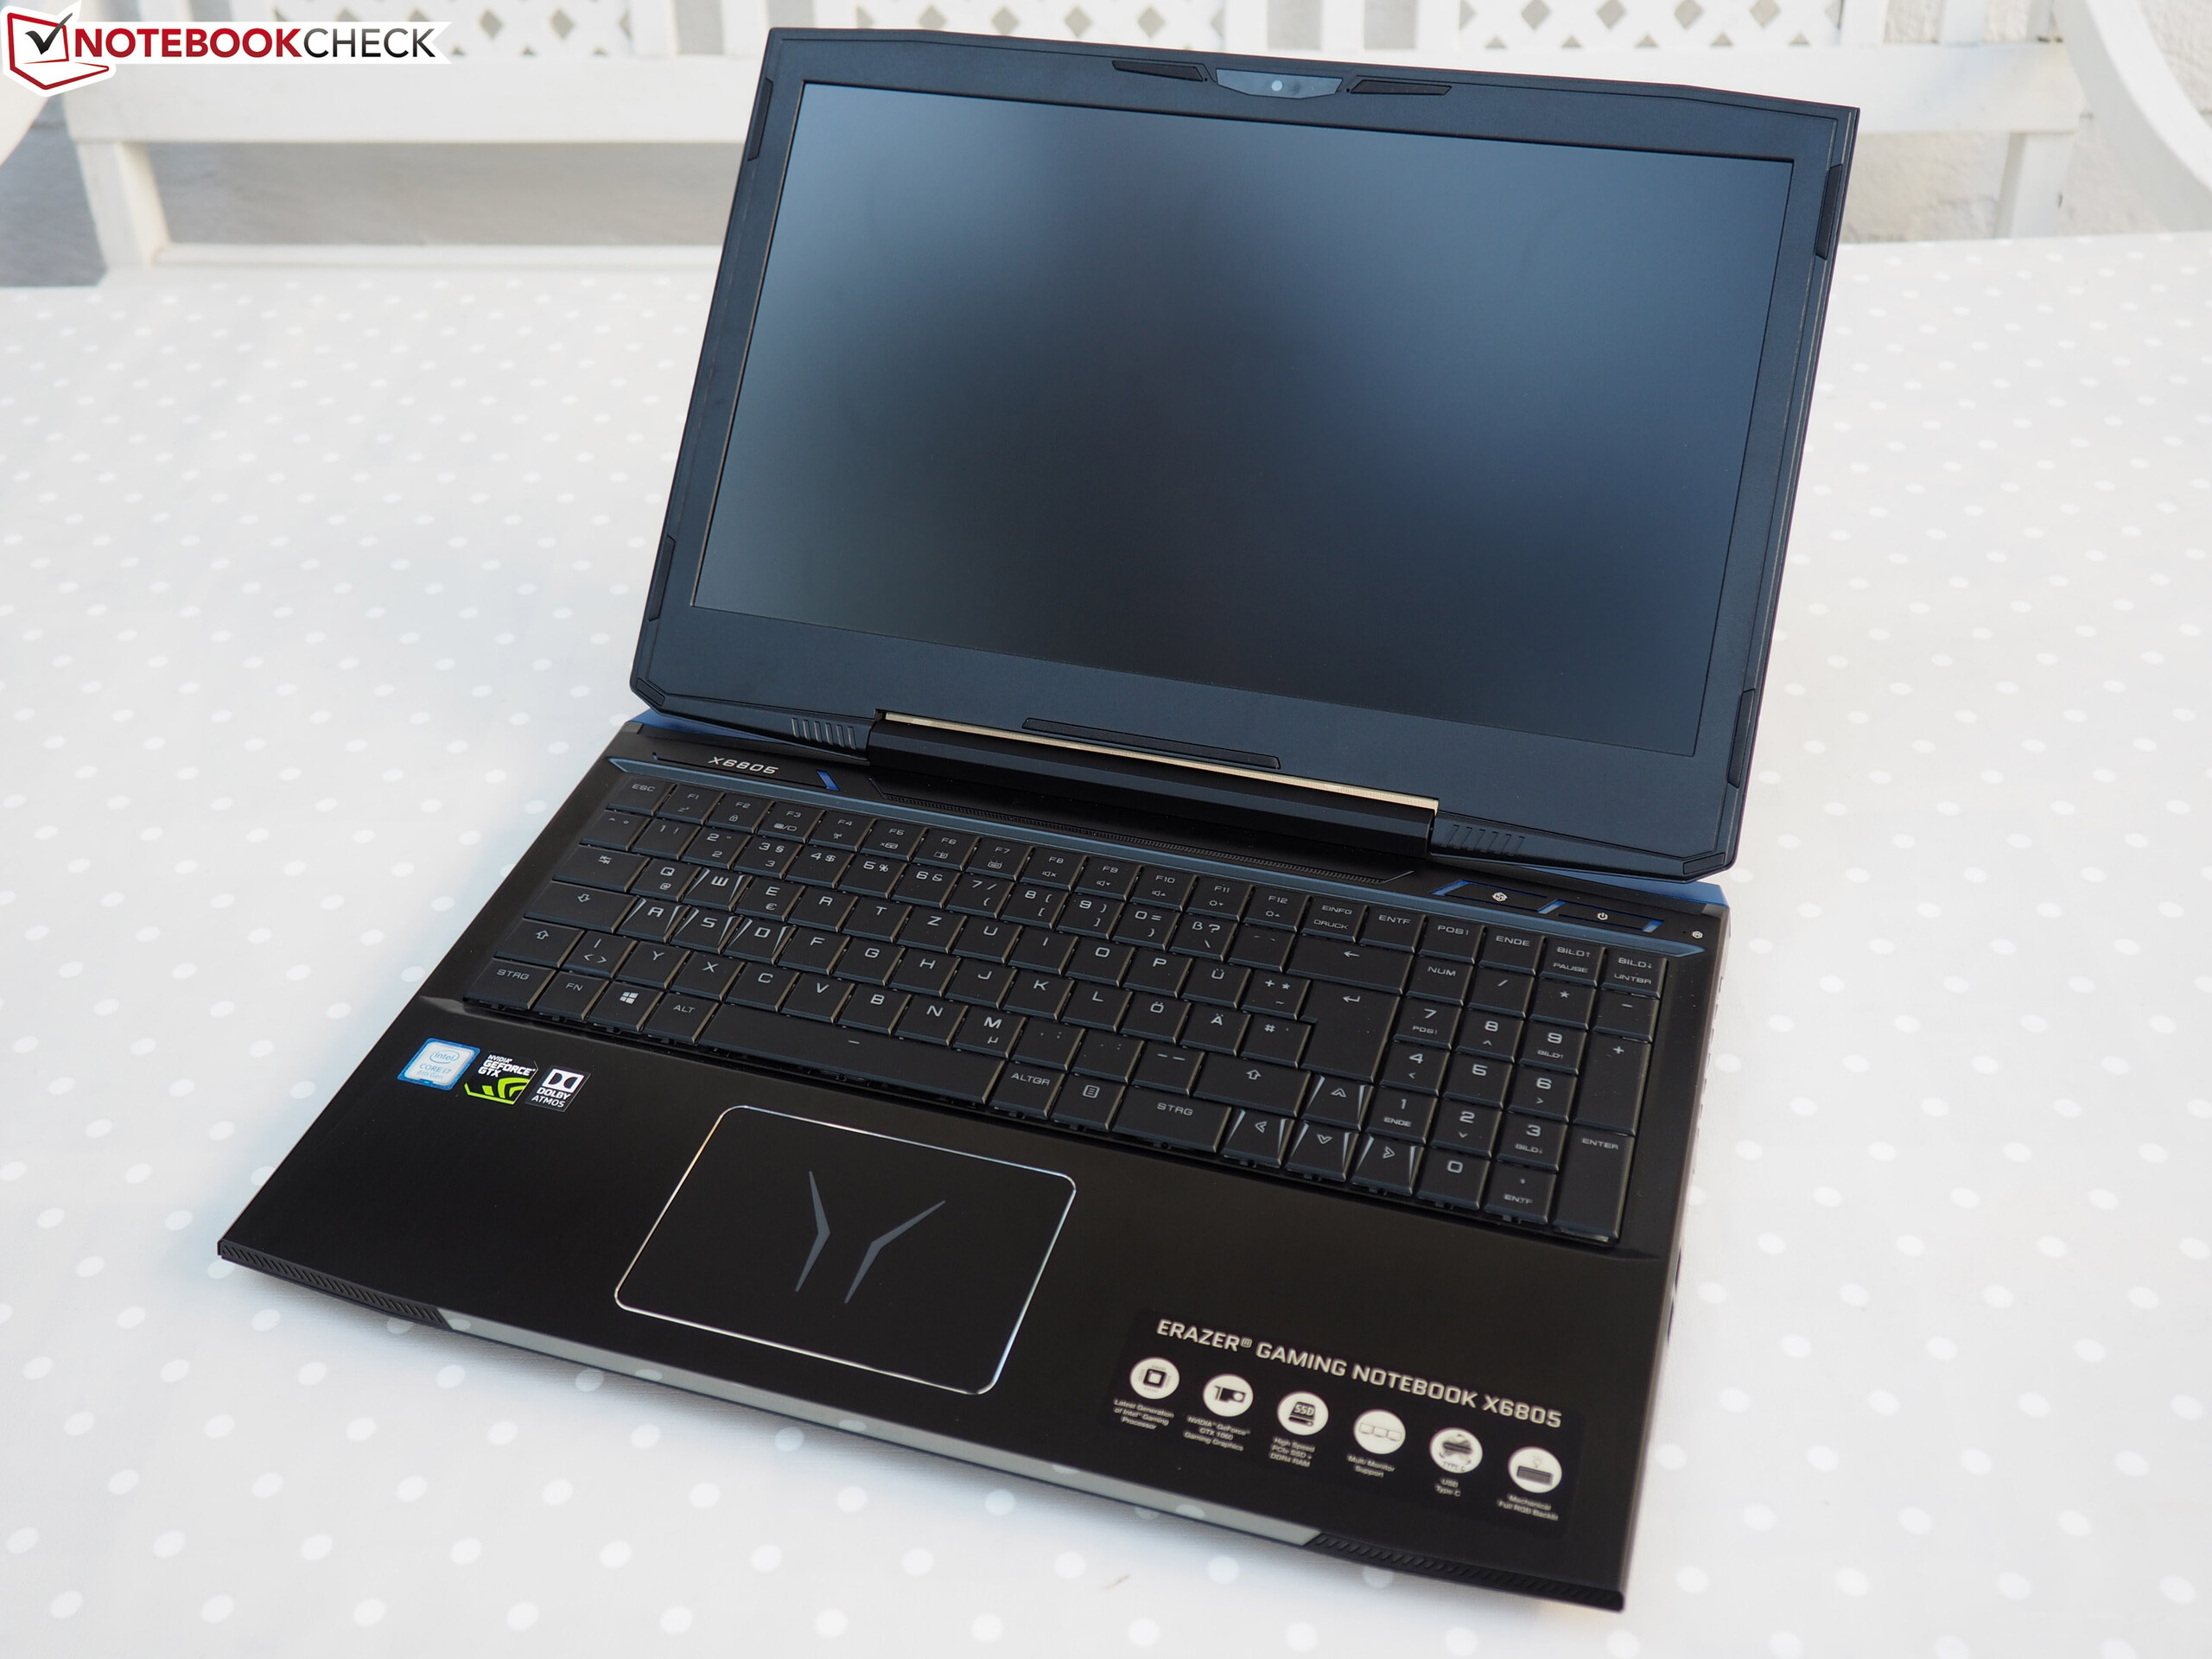
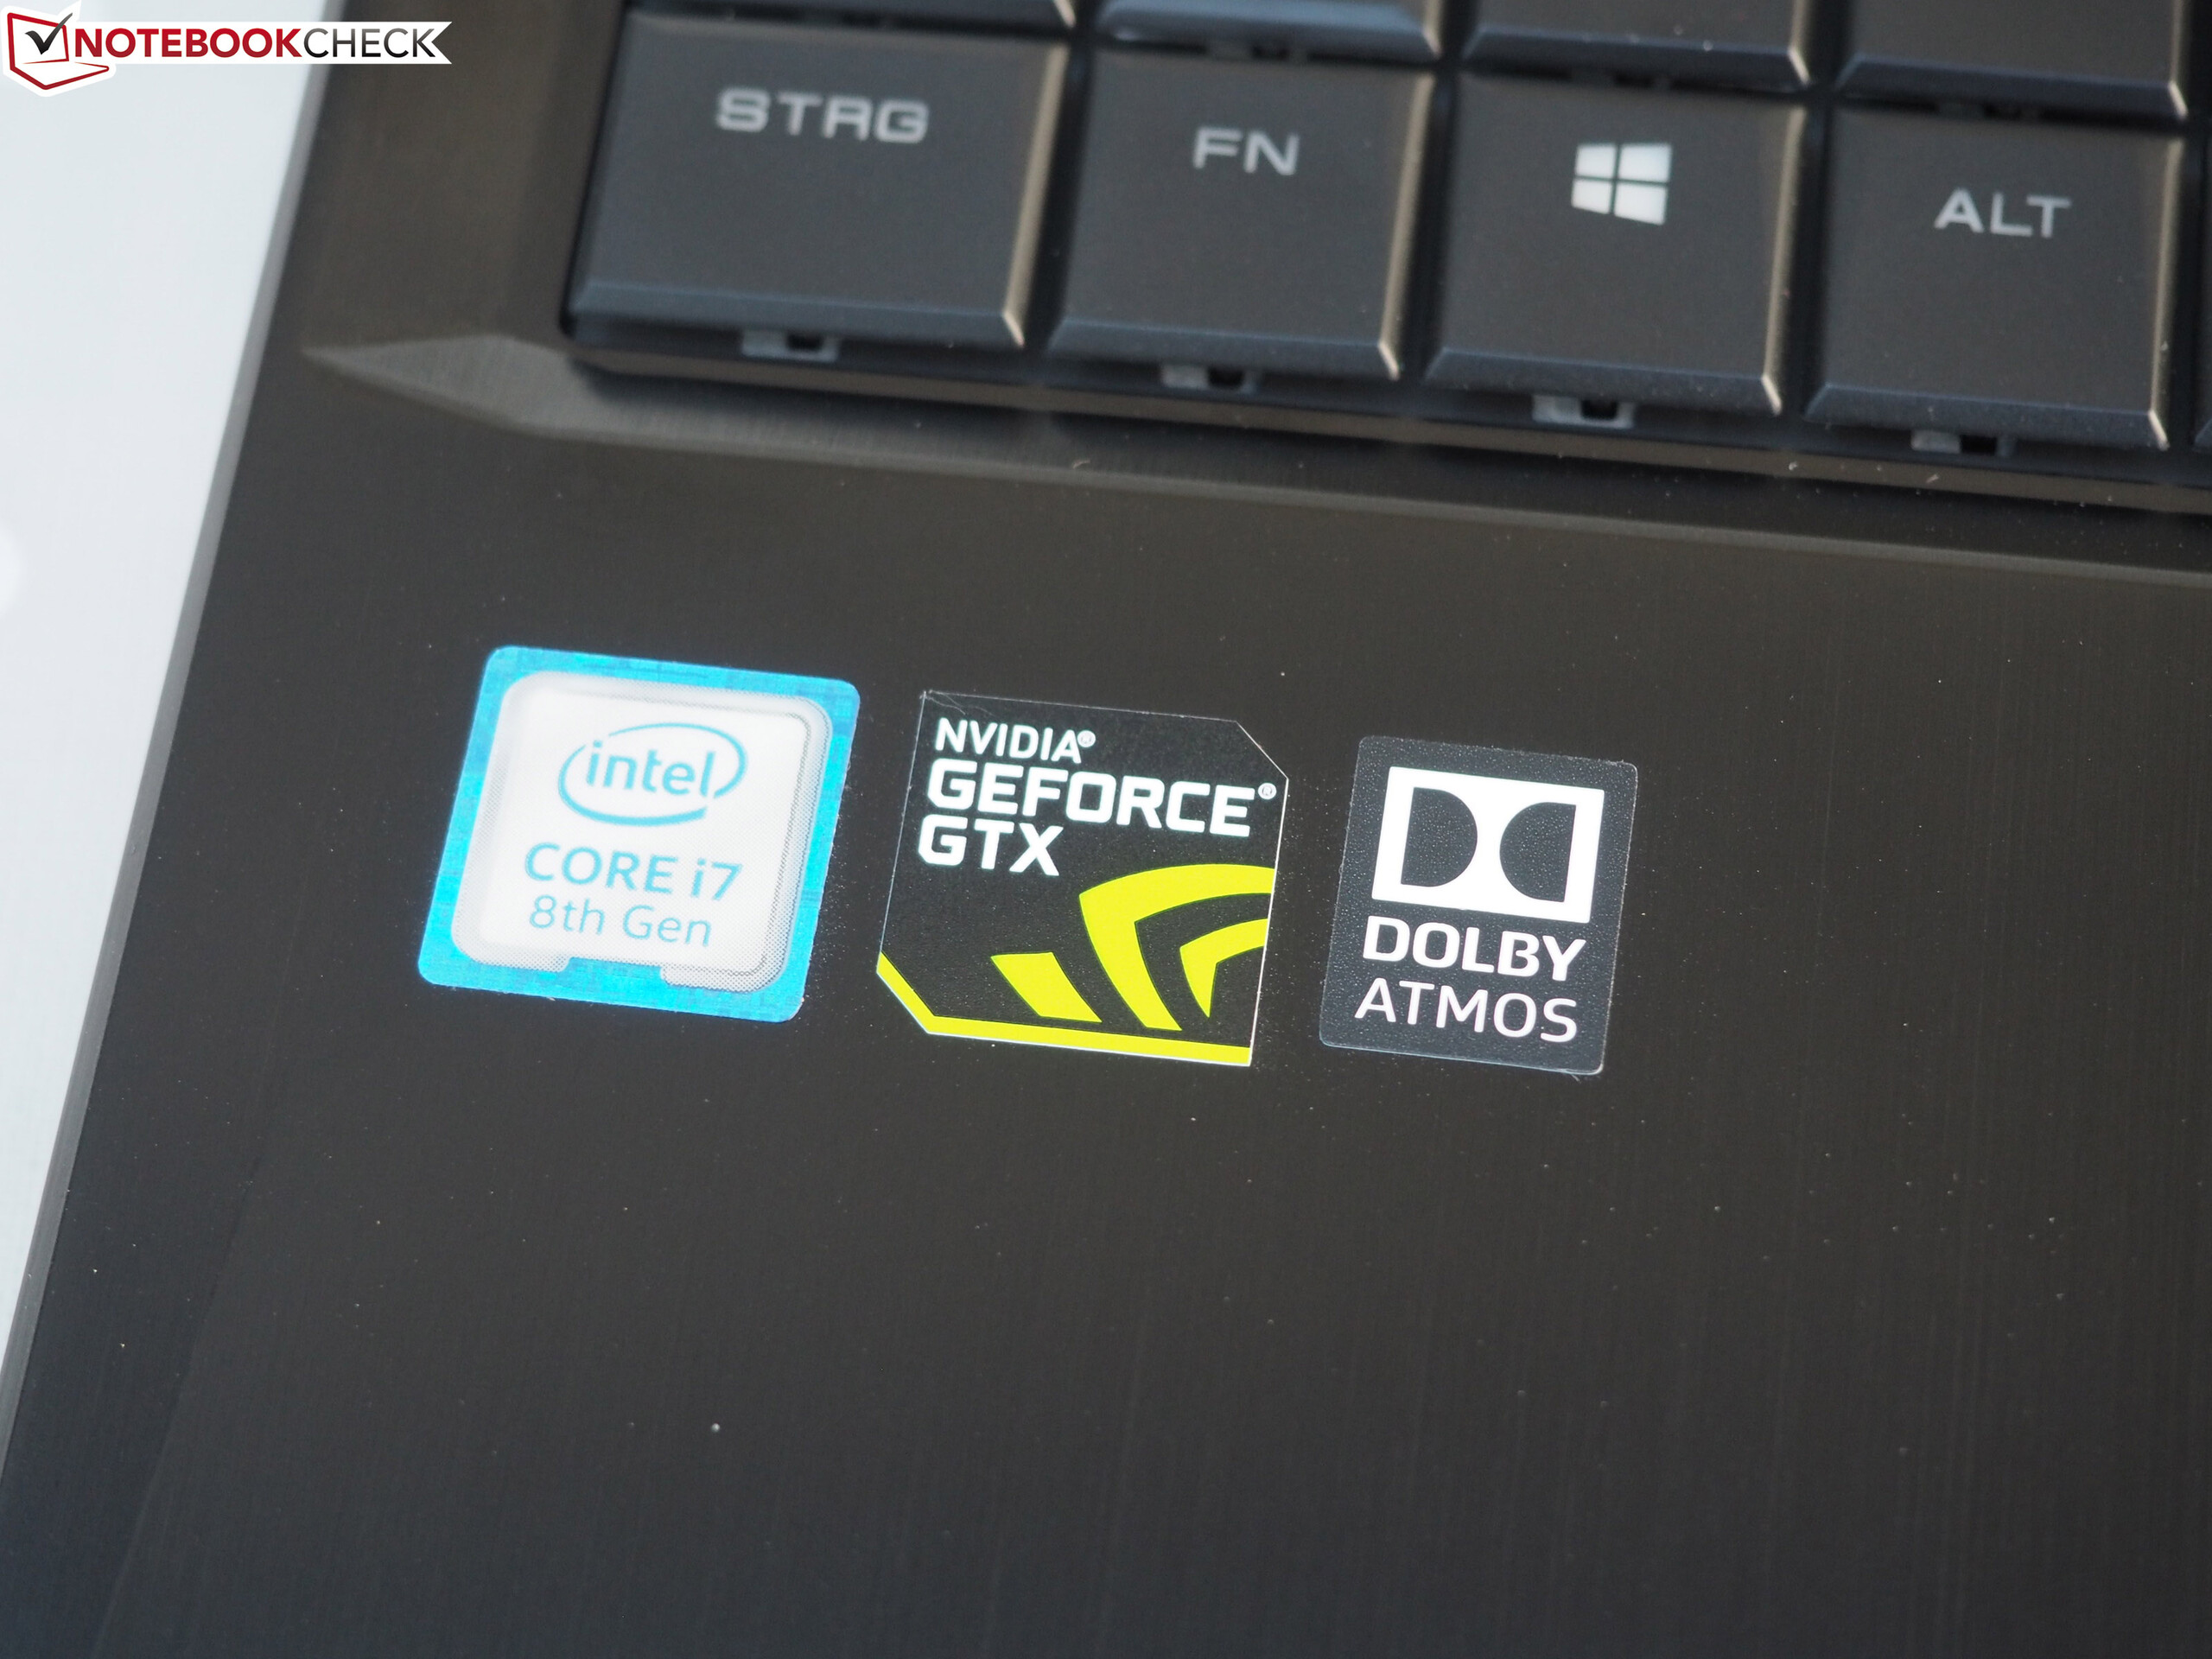
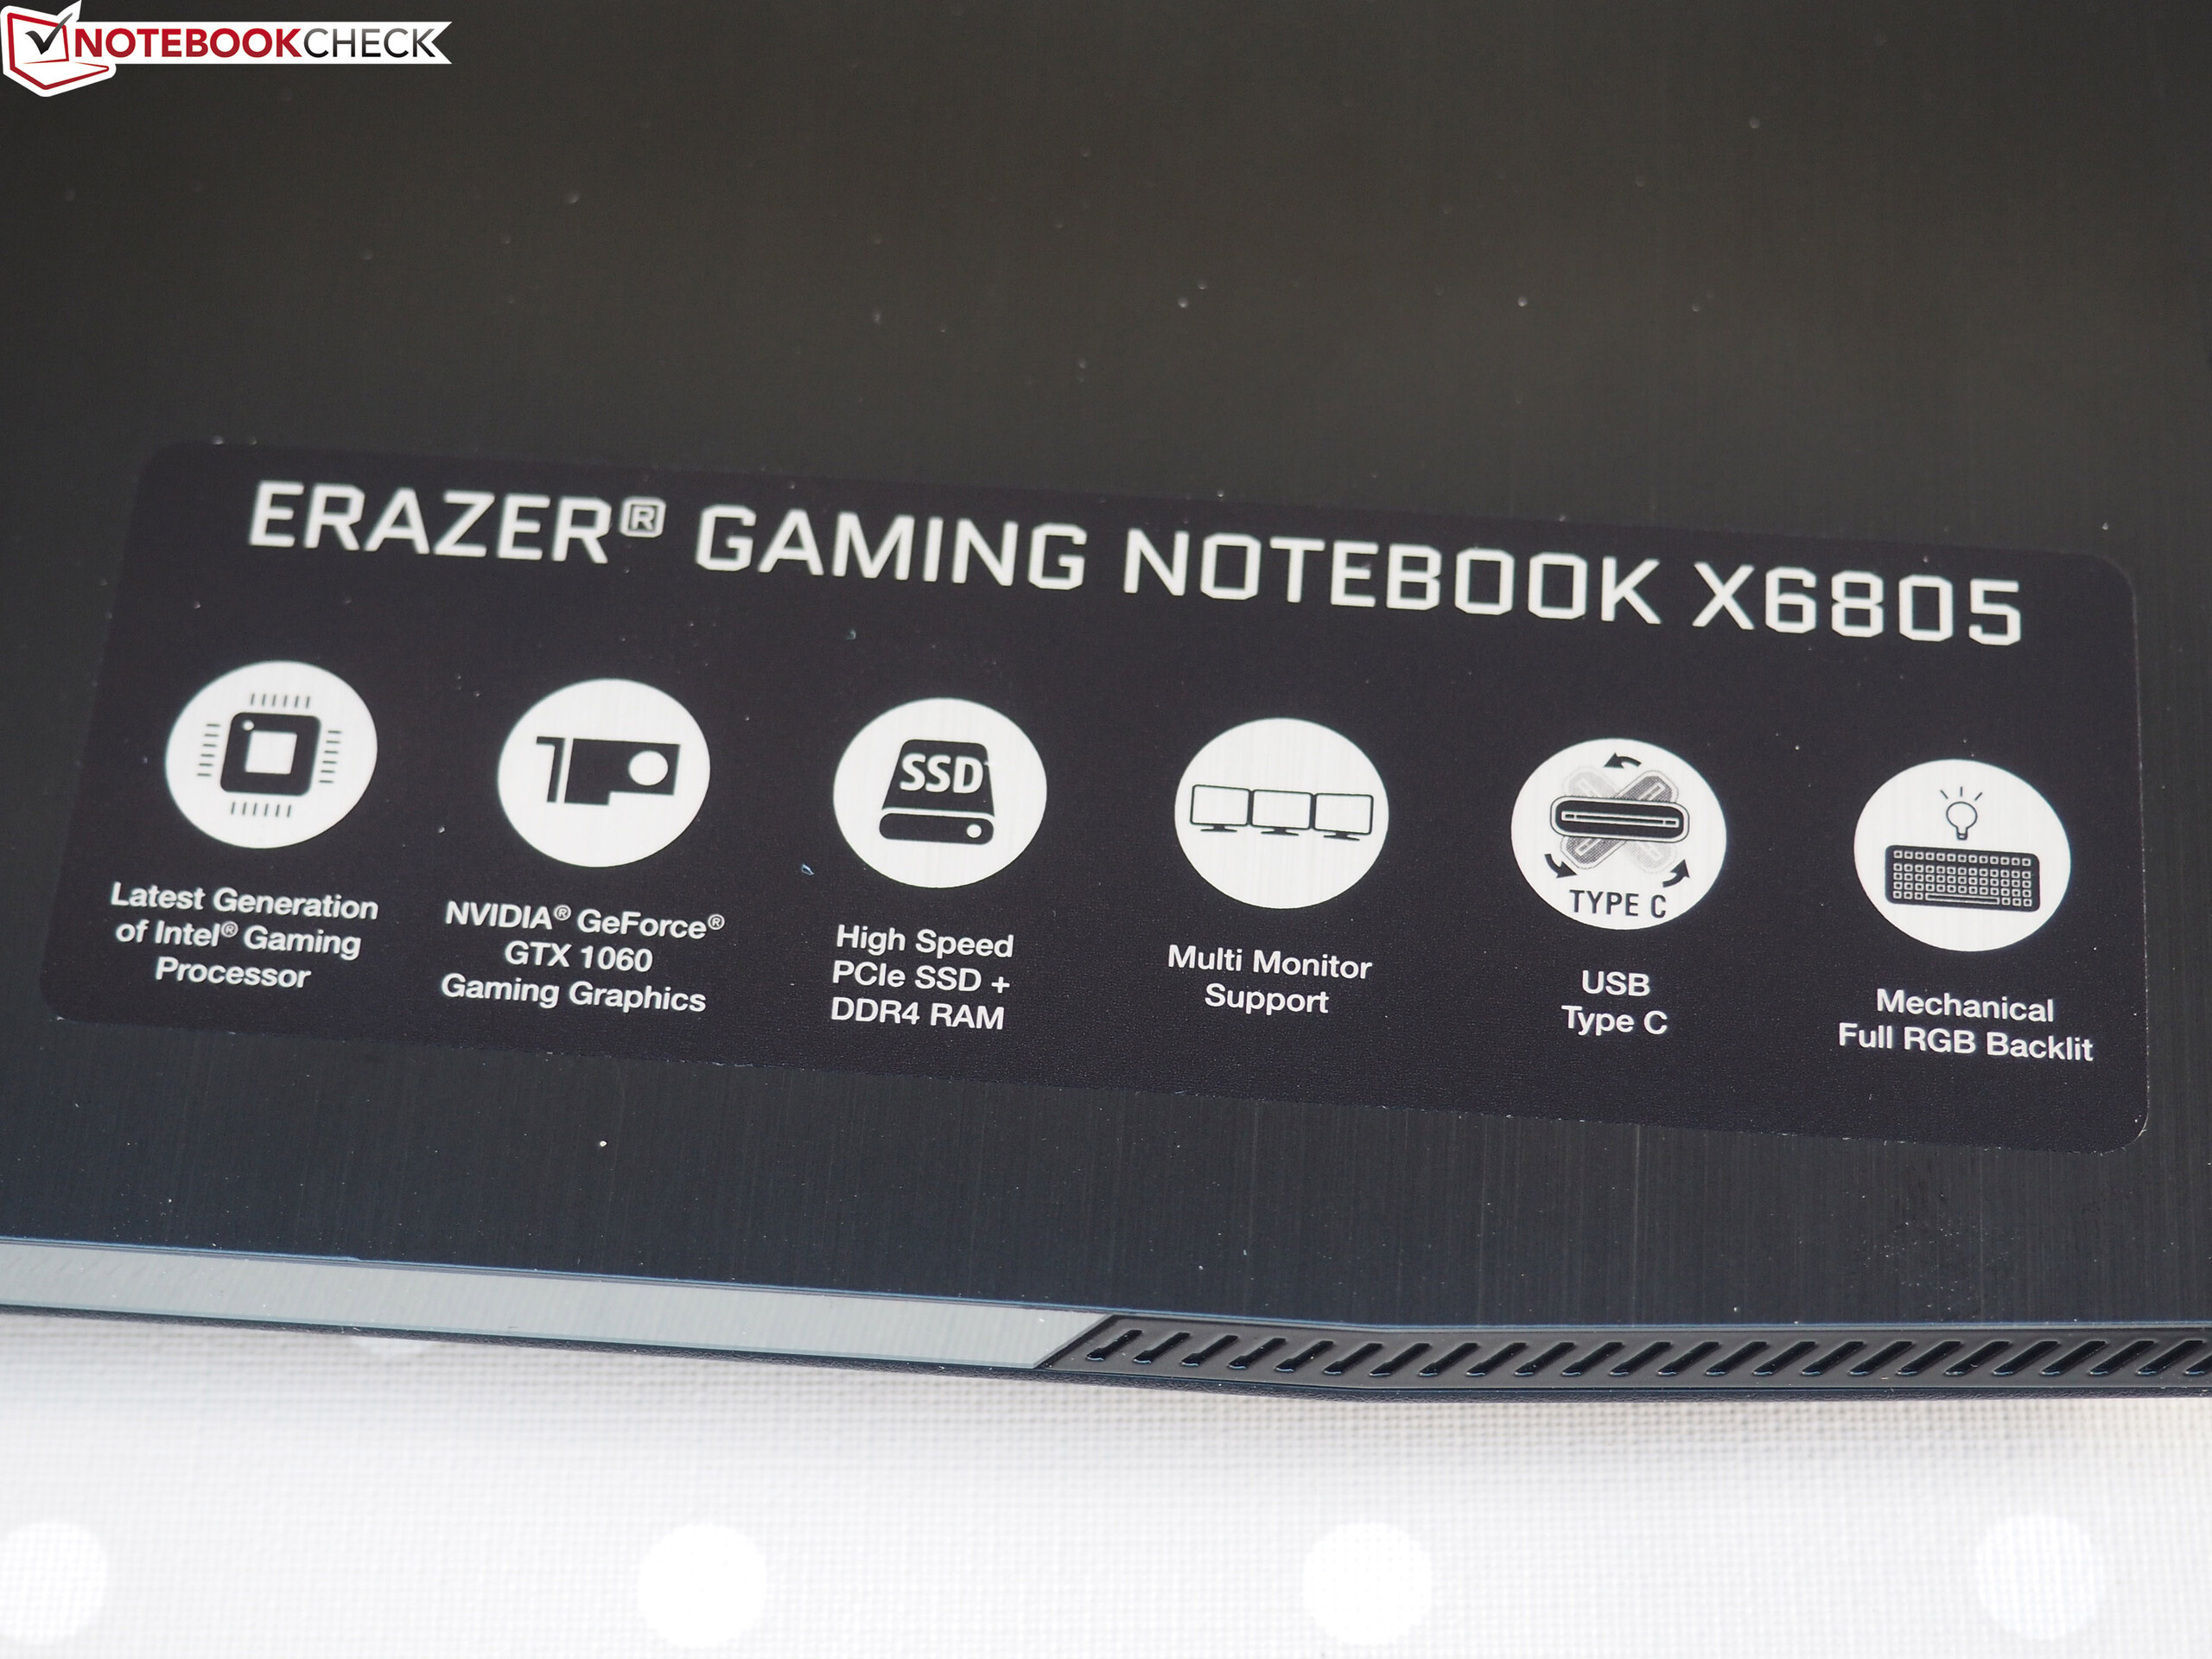
O Medion Erazer X6805 é um excelente valor pelo dinheiro. A maioria dos portáteis de jogos econômicos é equipado com uma CPU Core i5-8300H, uma GeForce GTX 1050 Ti, 8 GB de RAM e um SSD de 128 GB. A Medion deu um passo para frente e armou seu X6805 com uma CPU Core i7-8750H, uma GPU GeForce GTX 1060, 16 GB de RAM e um SSD PCIe de 256 GB.
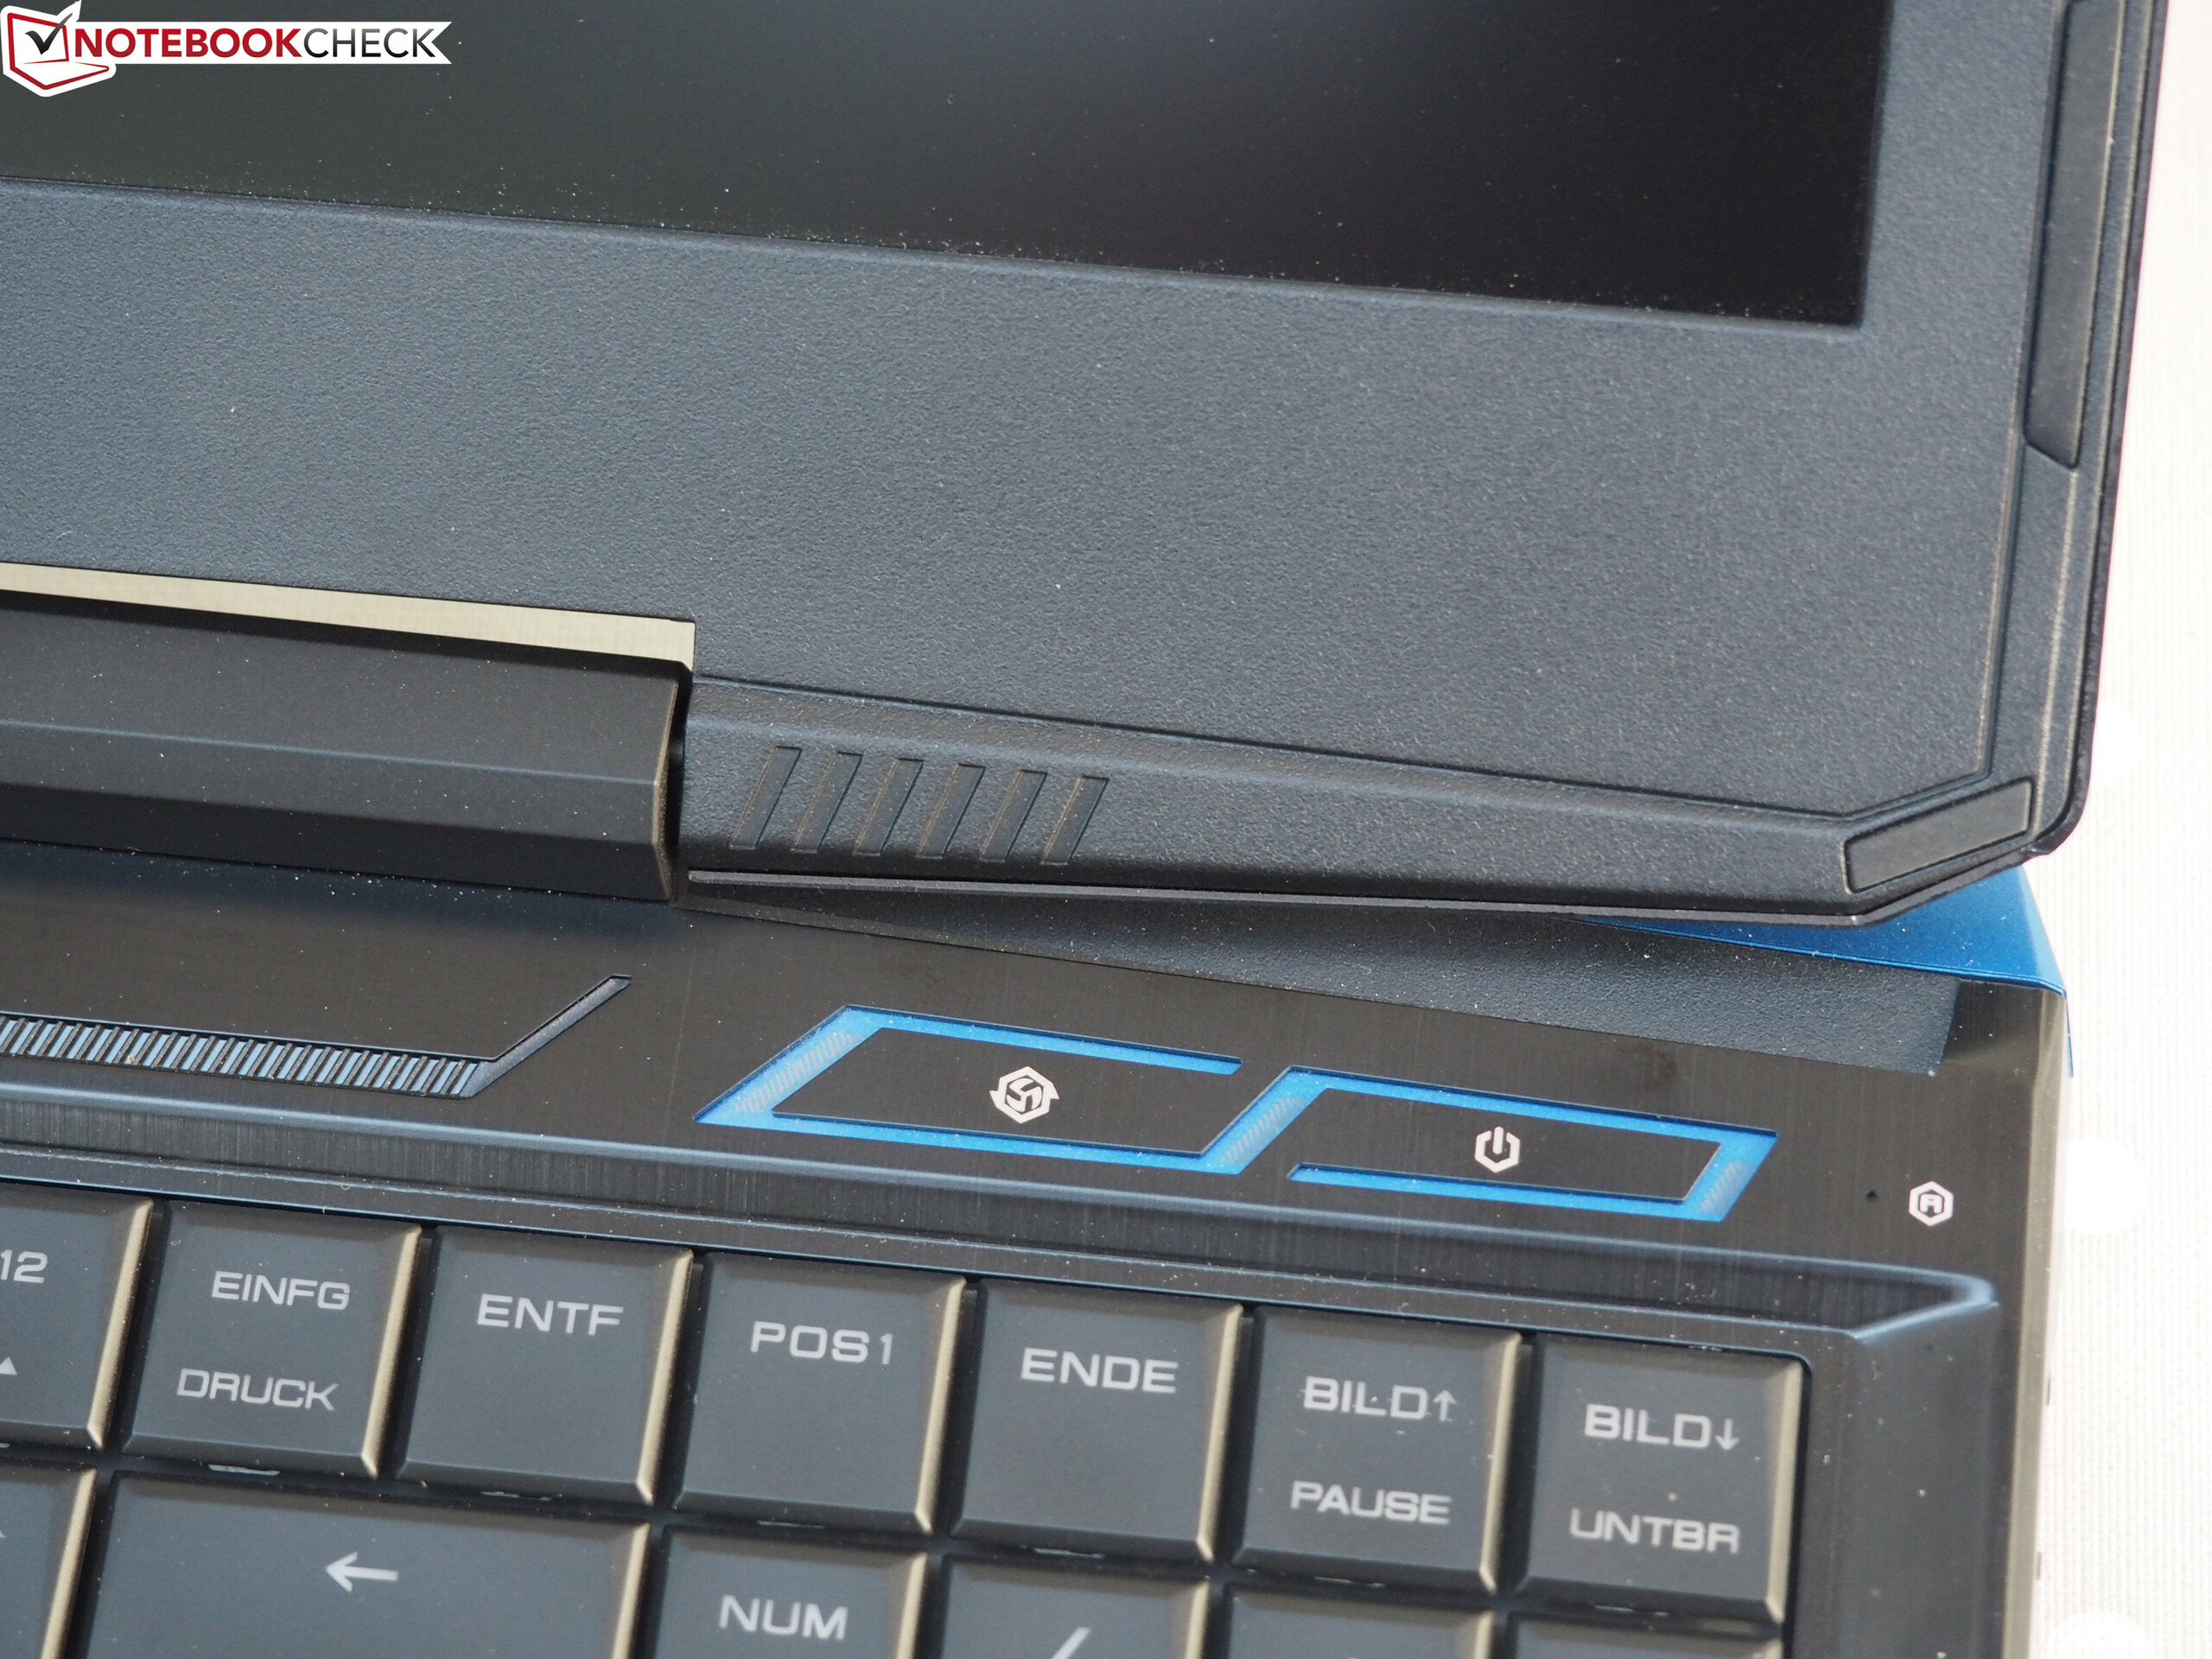
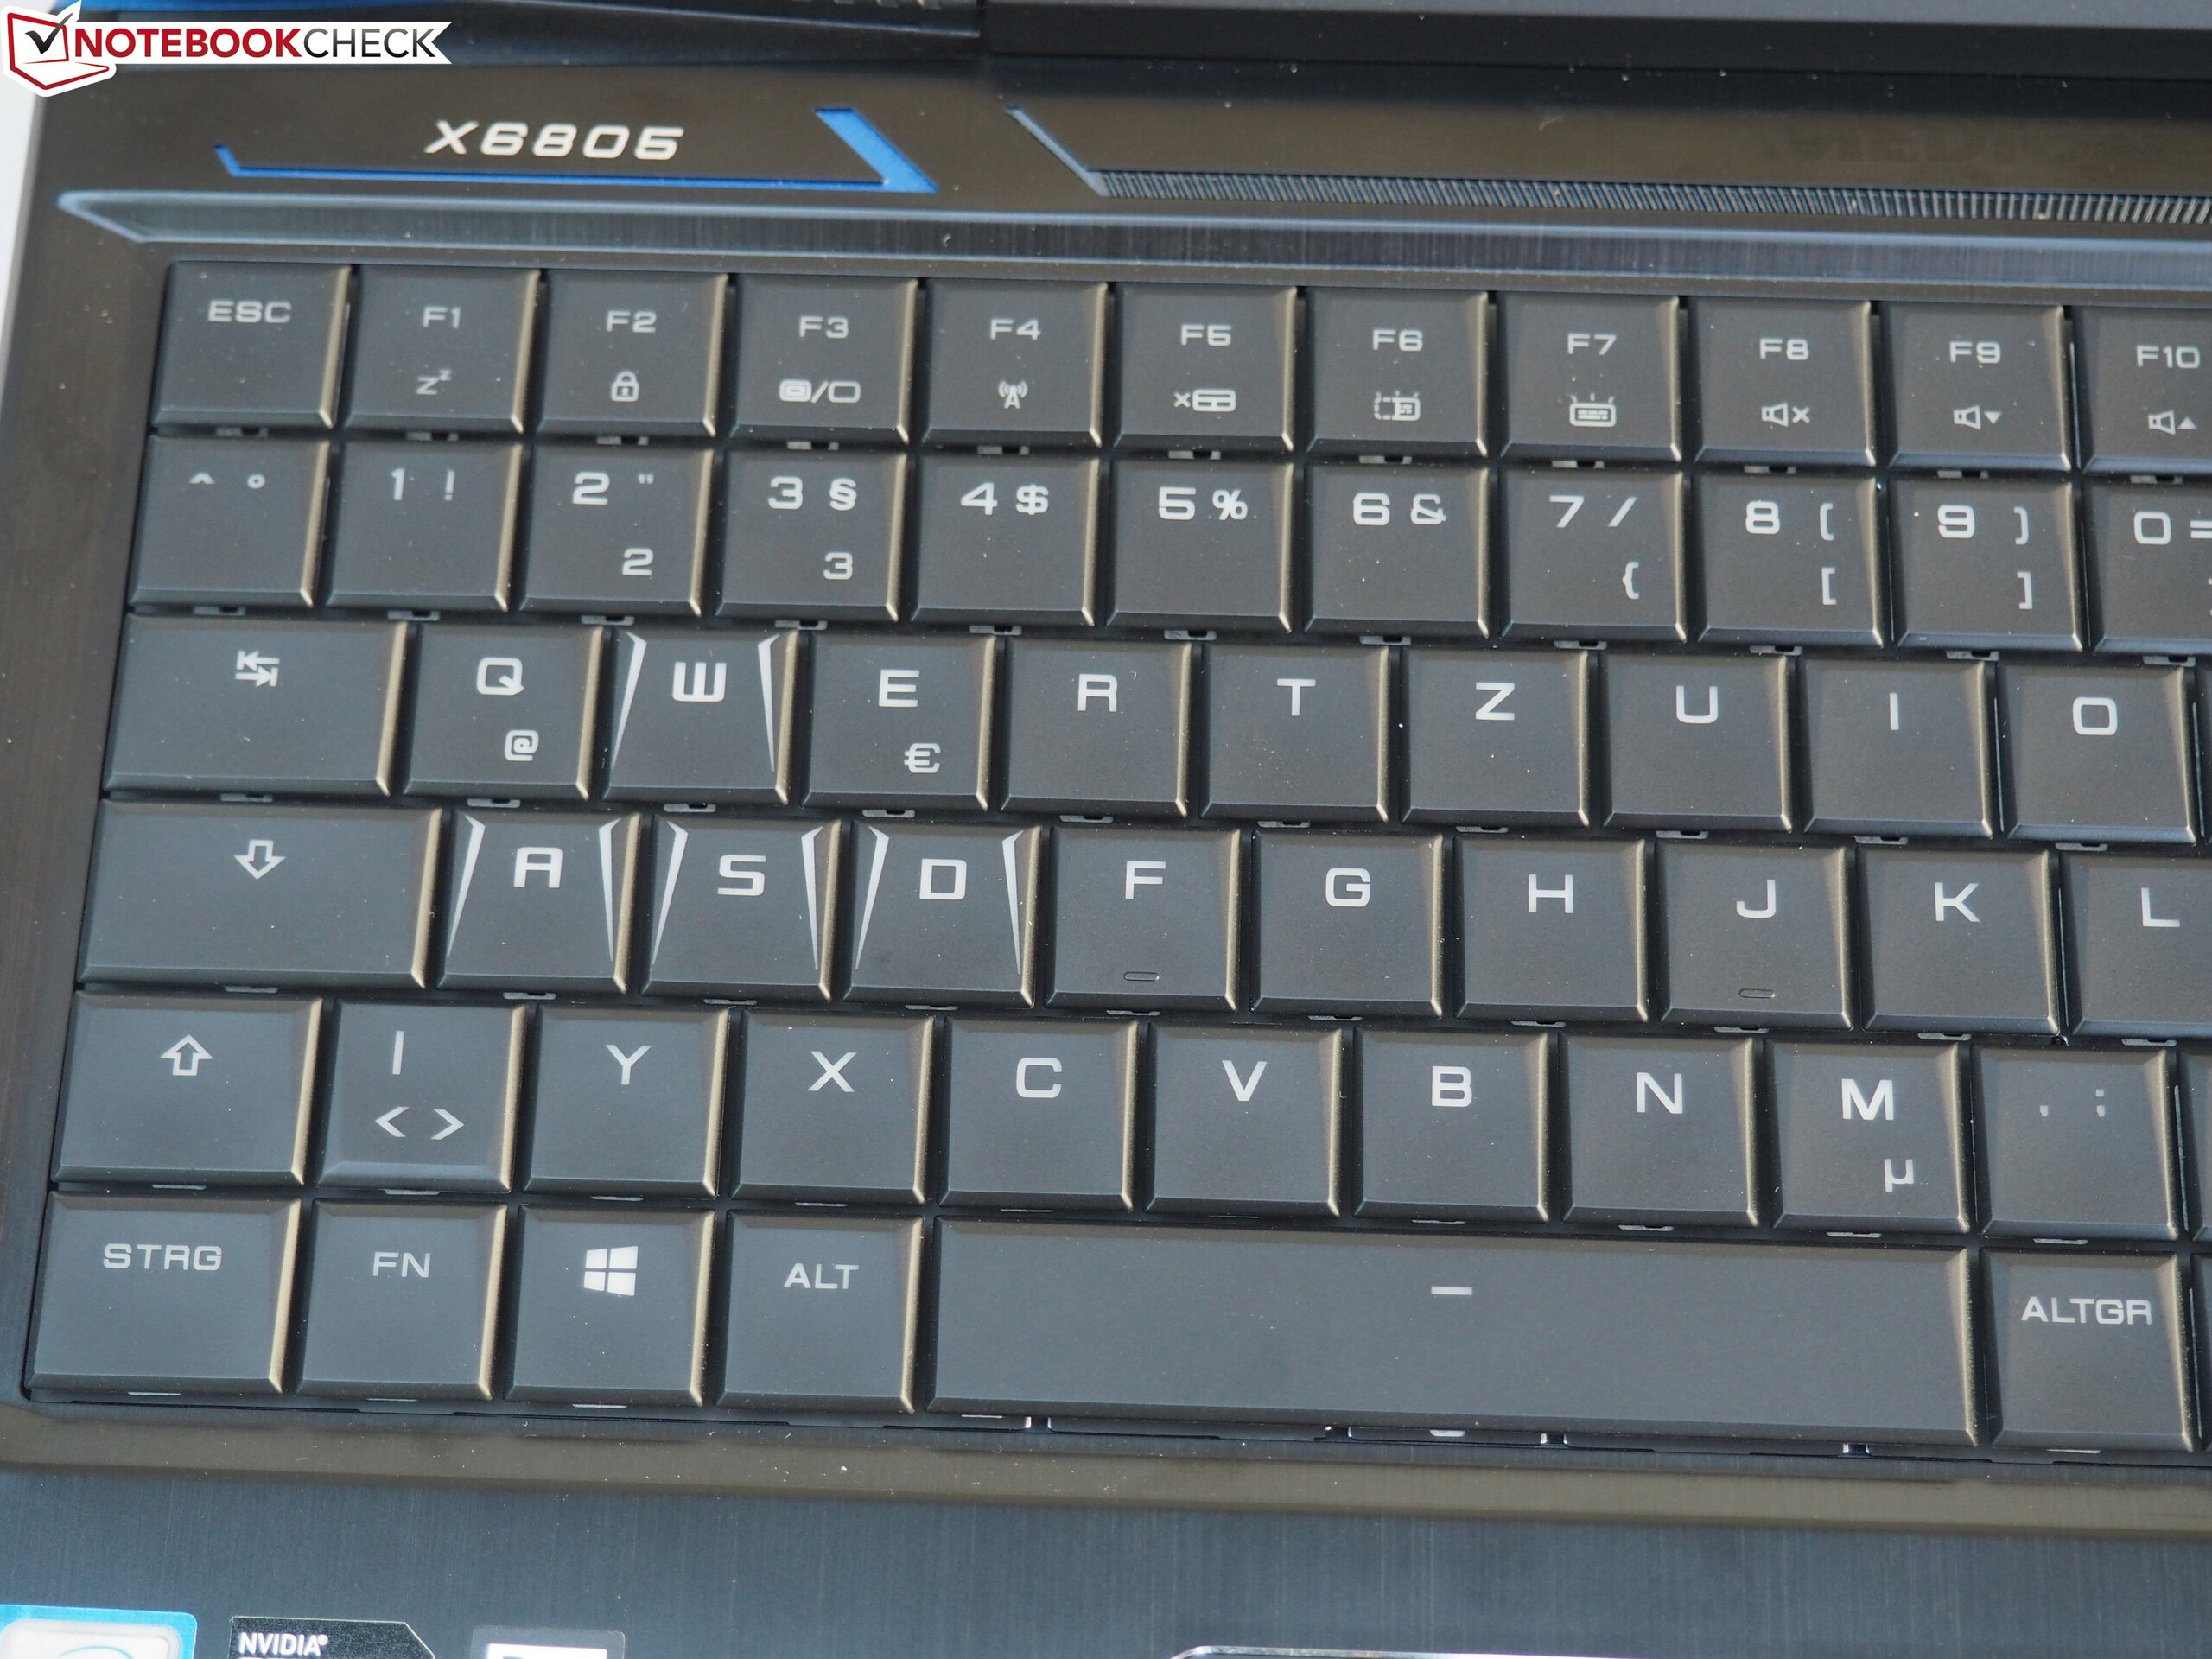
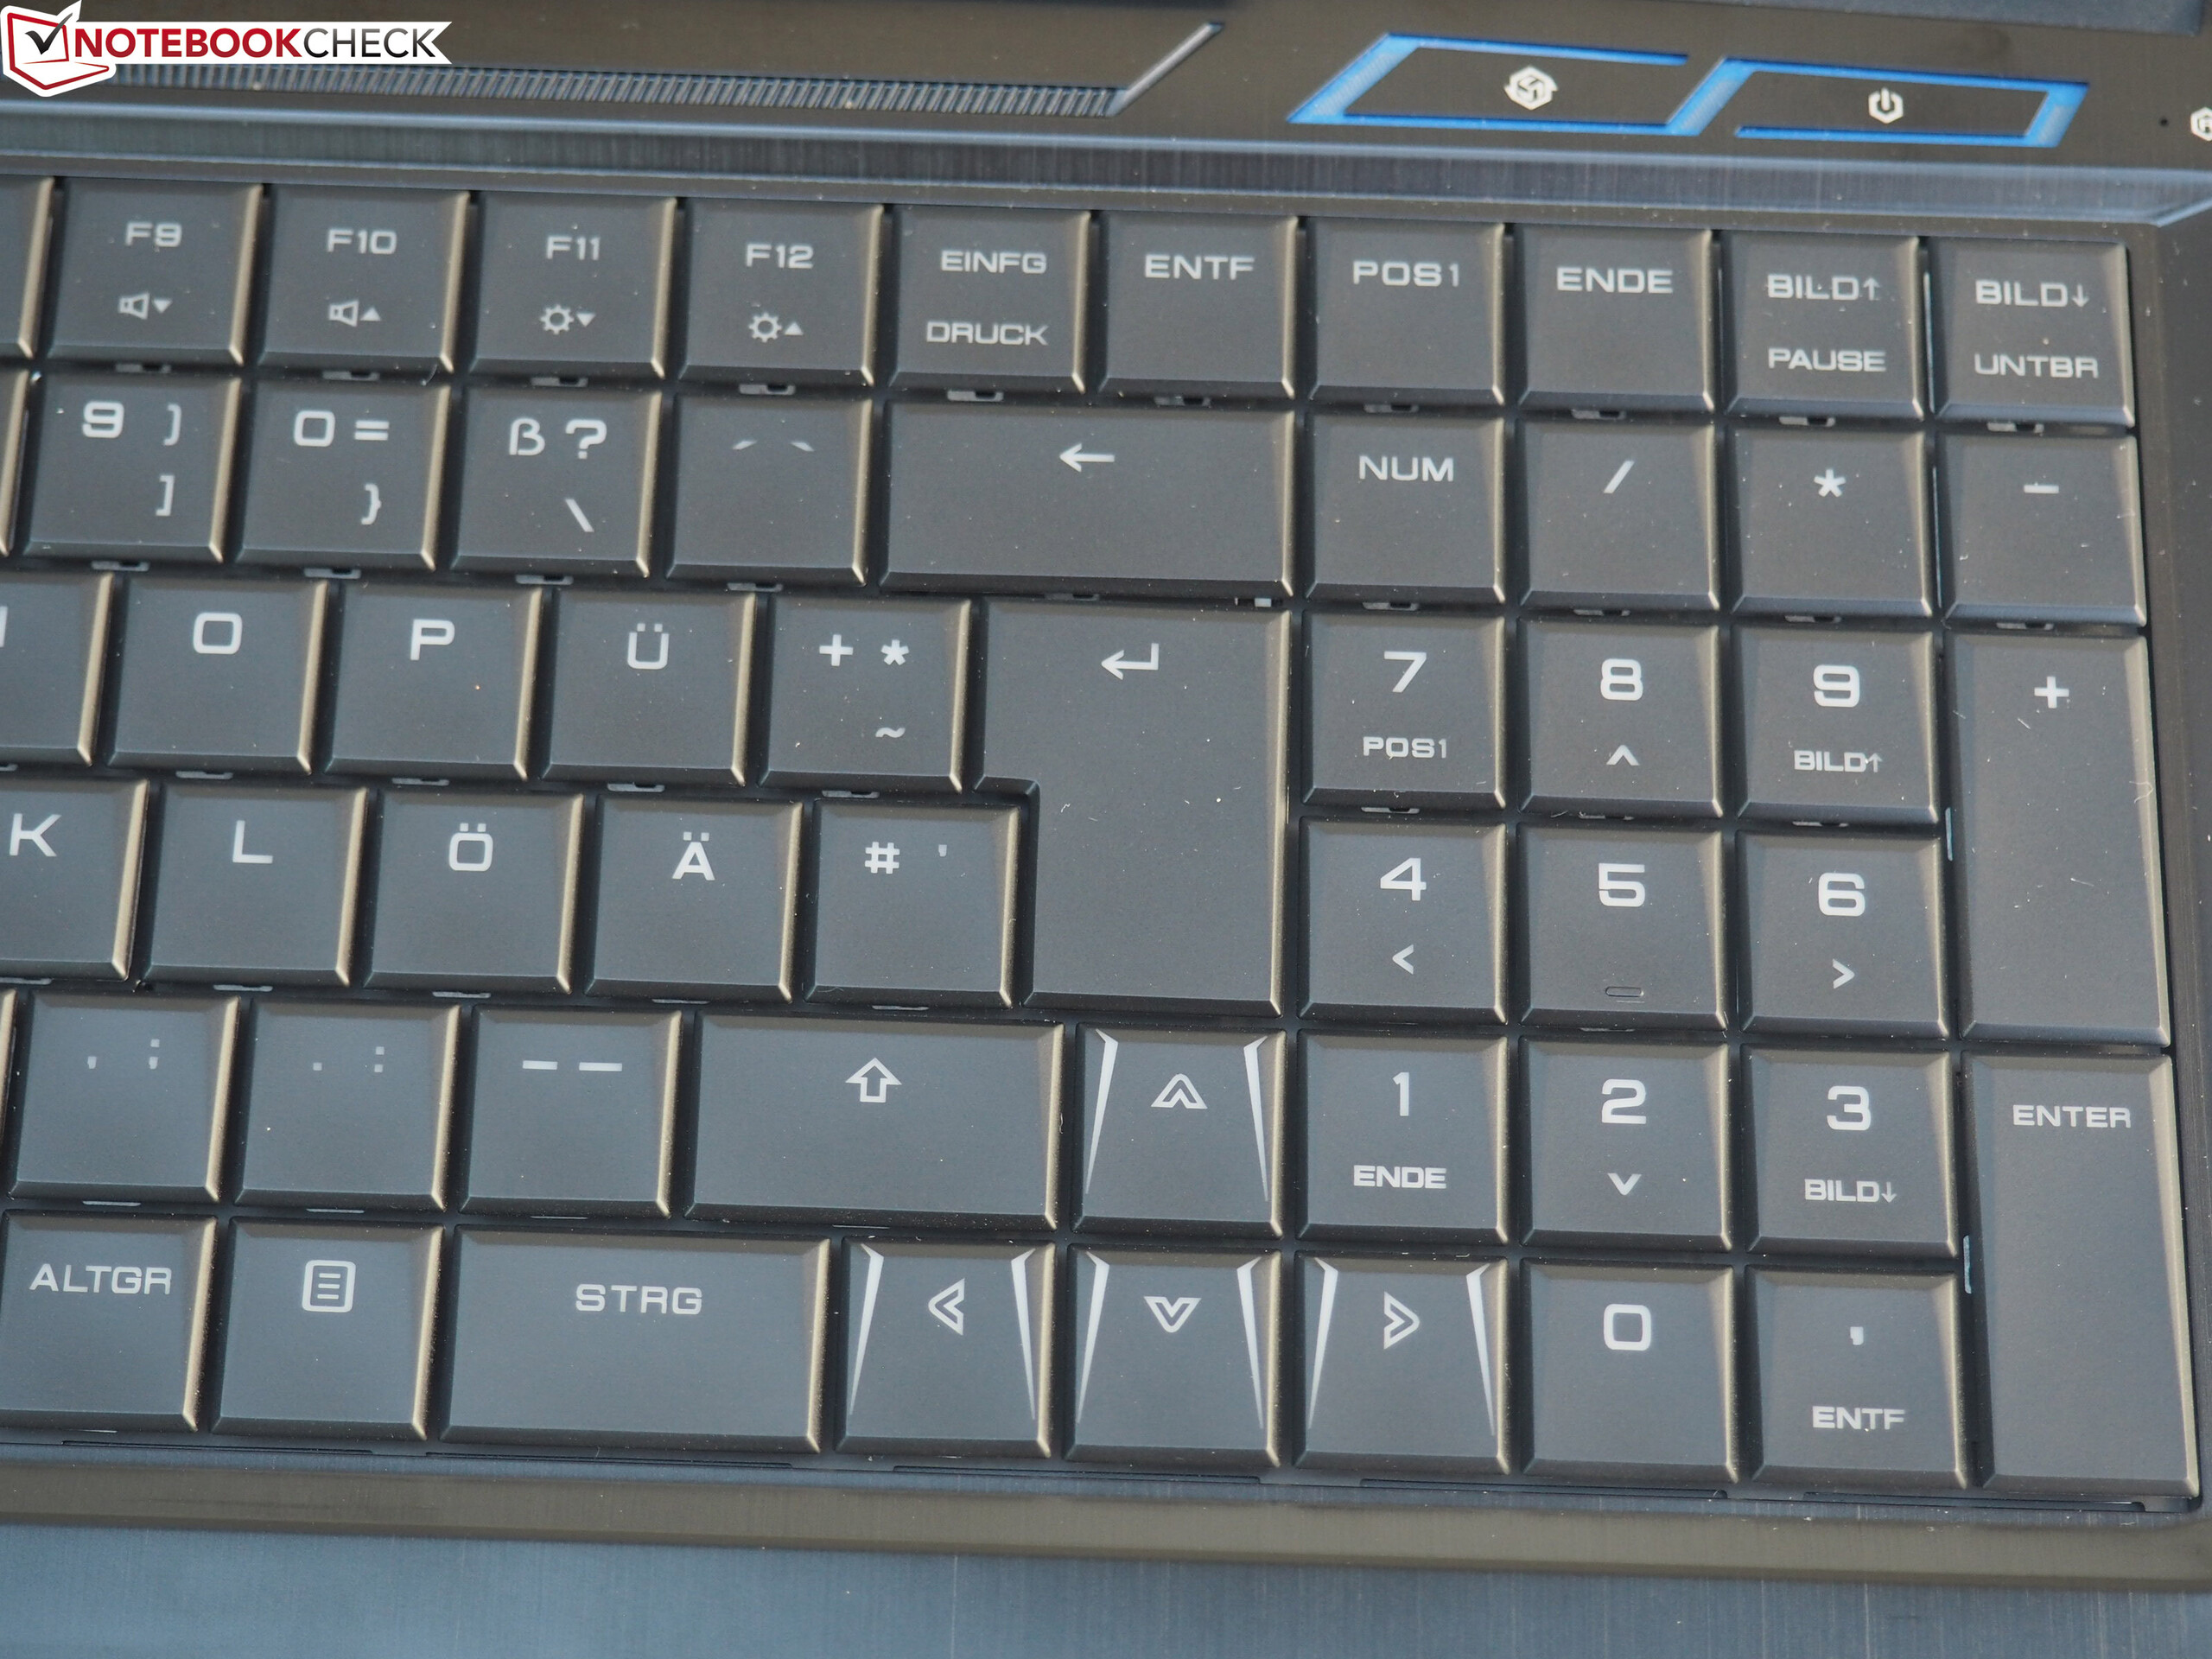
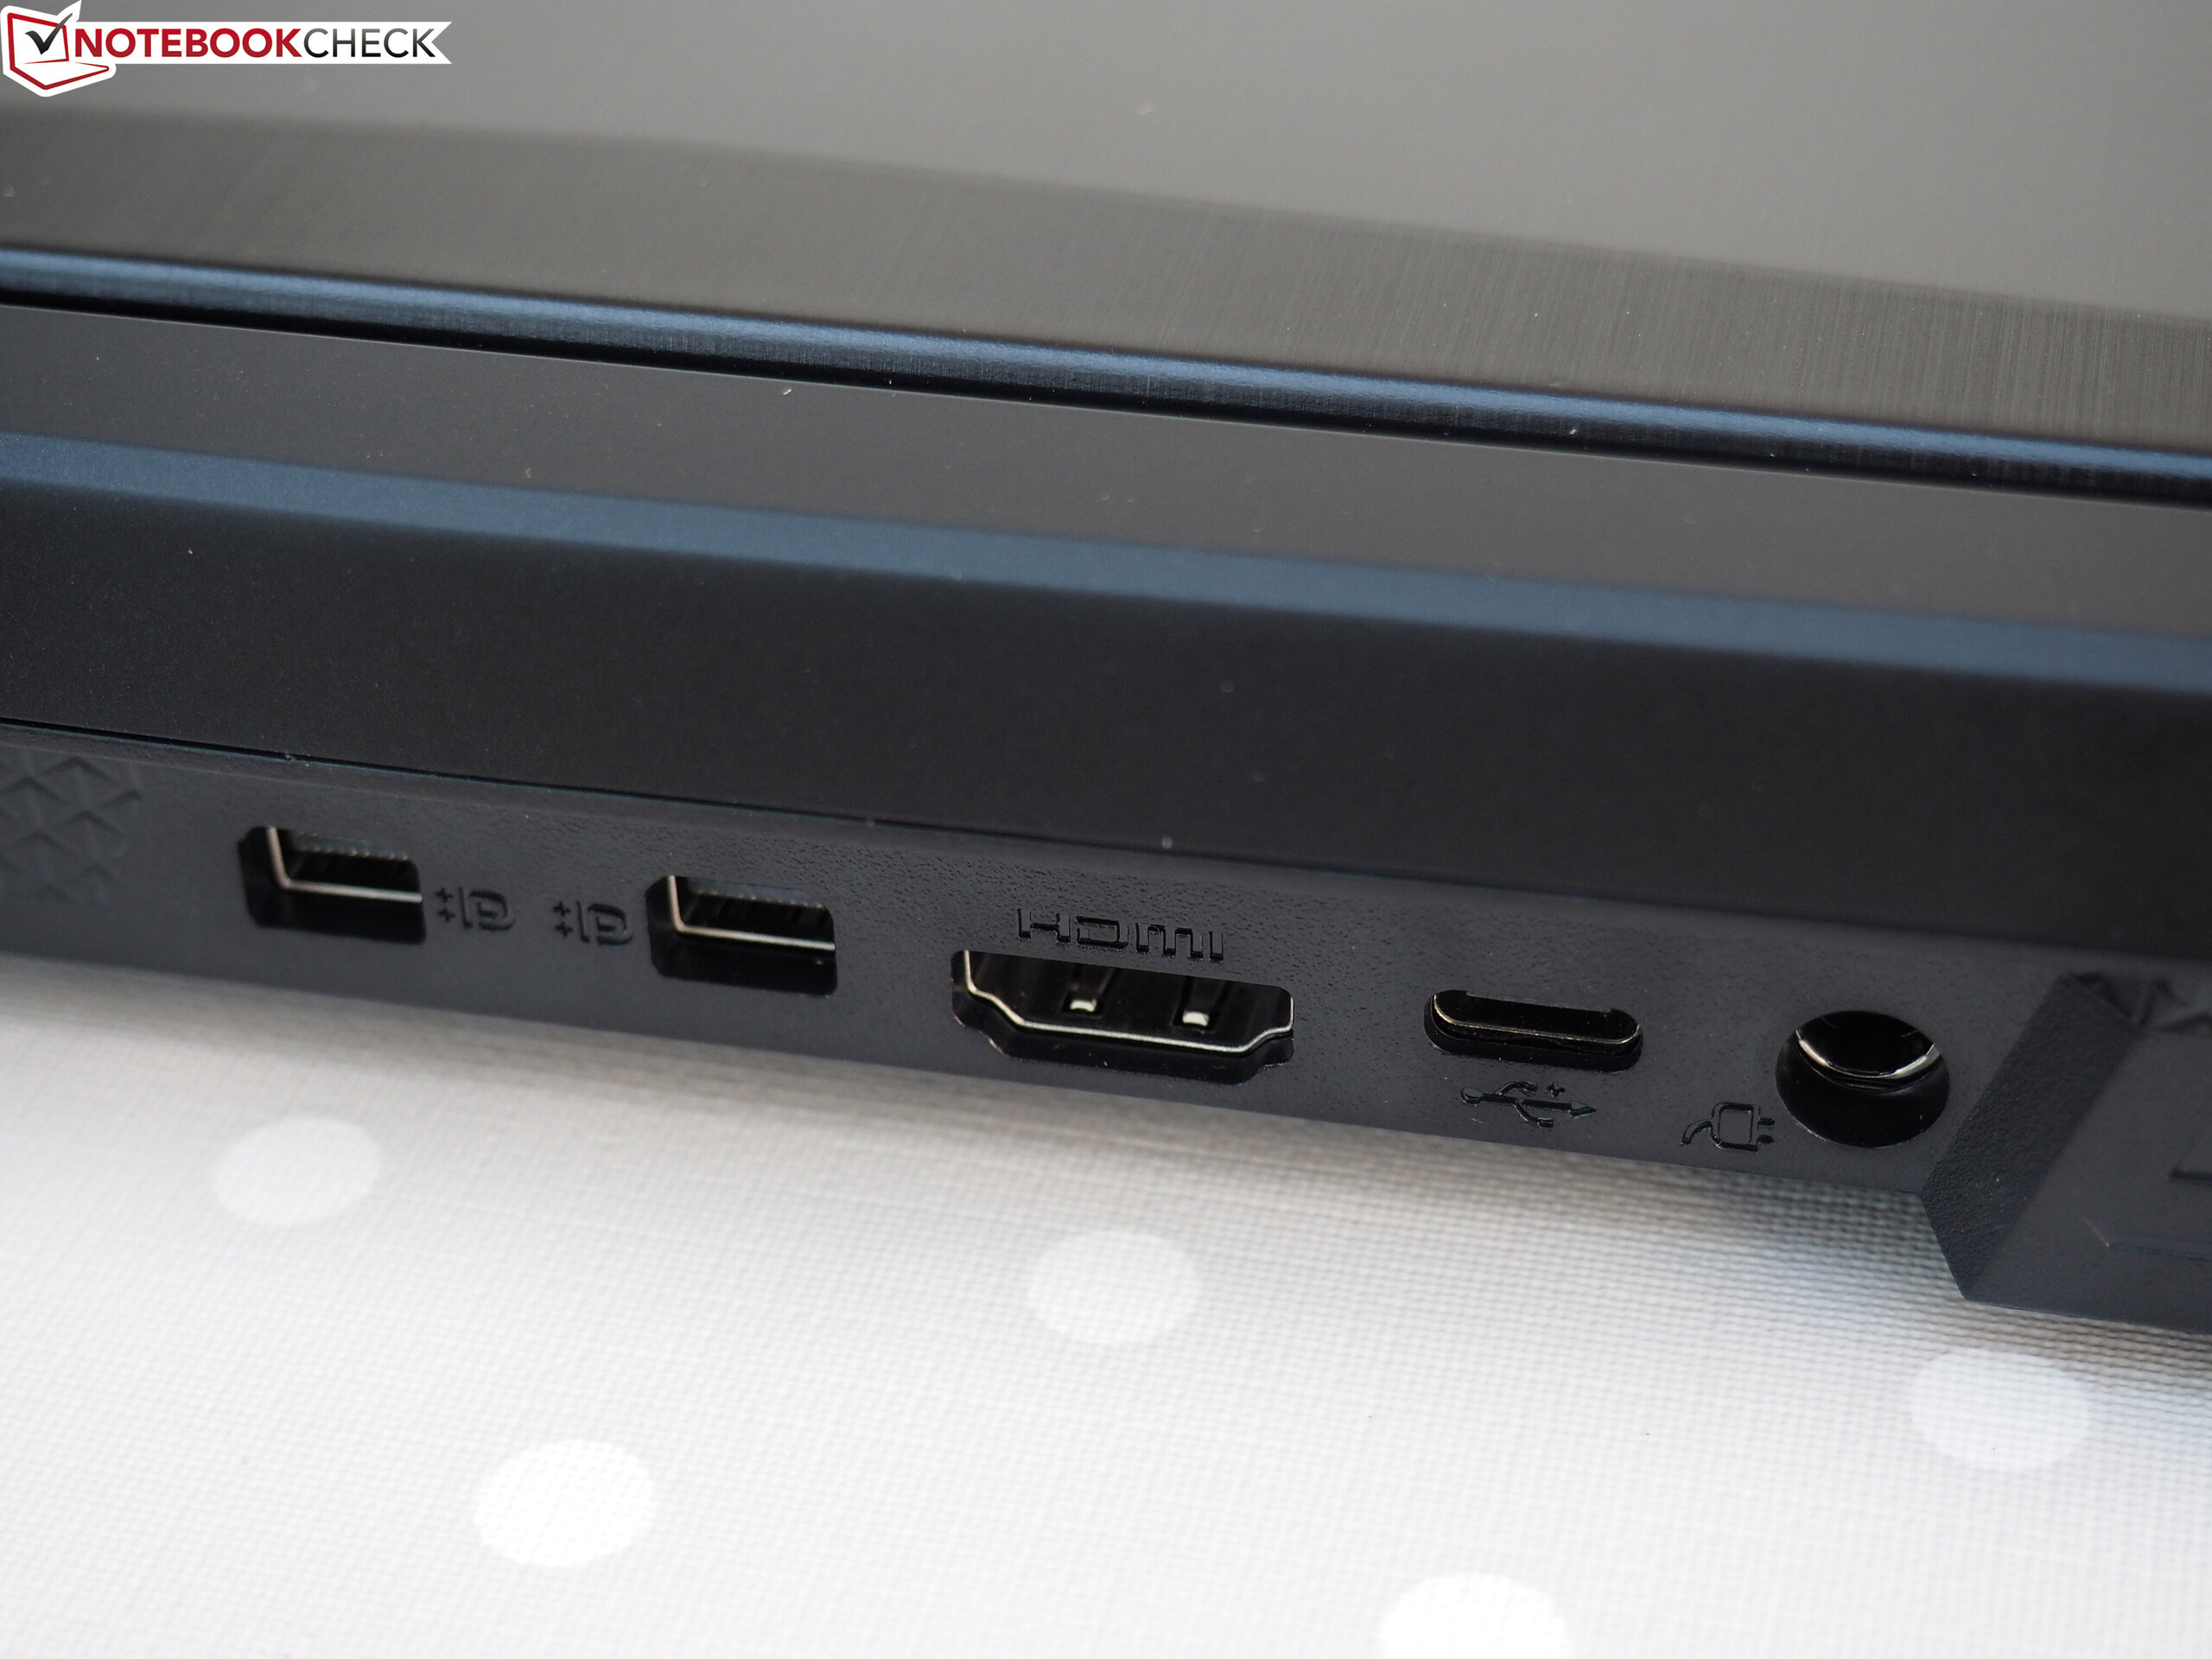
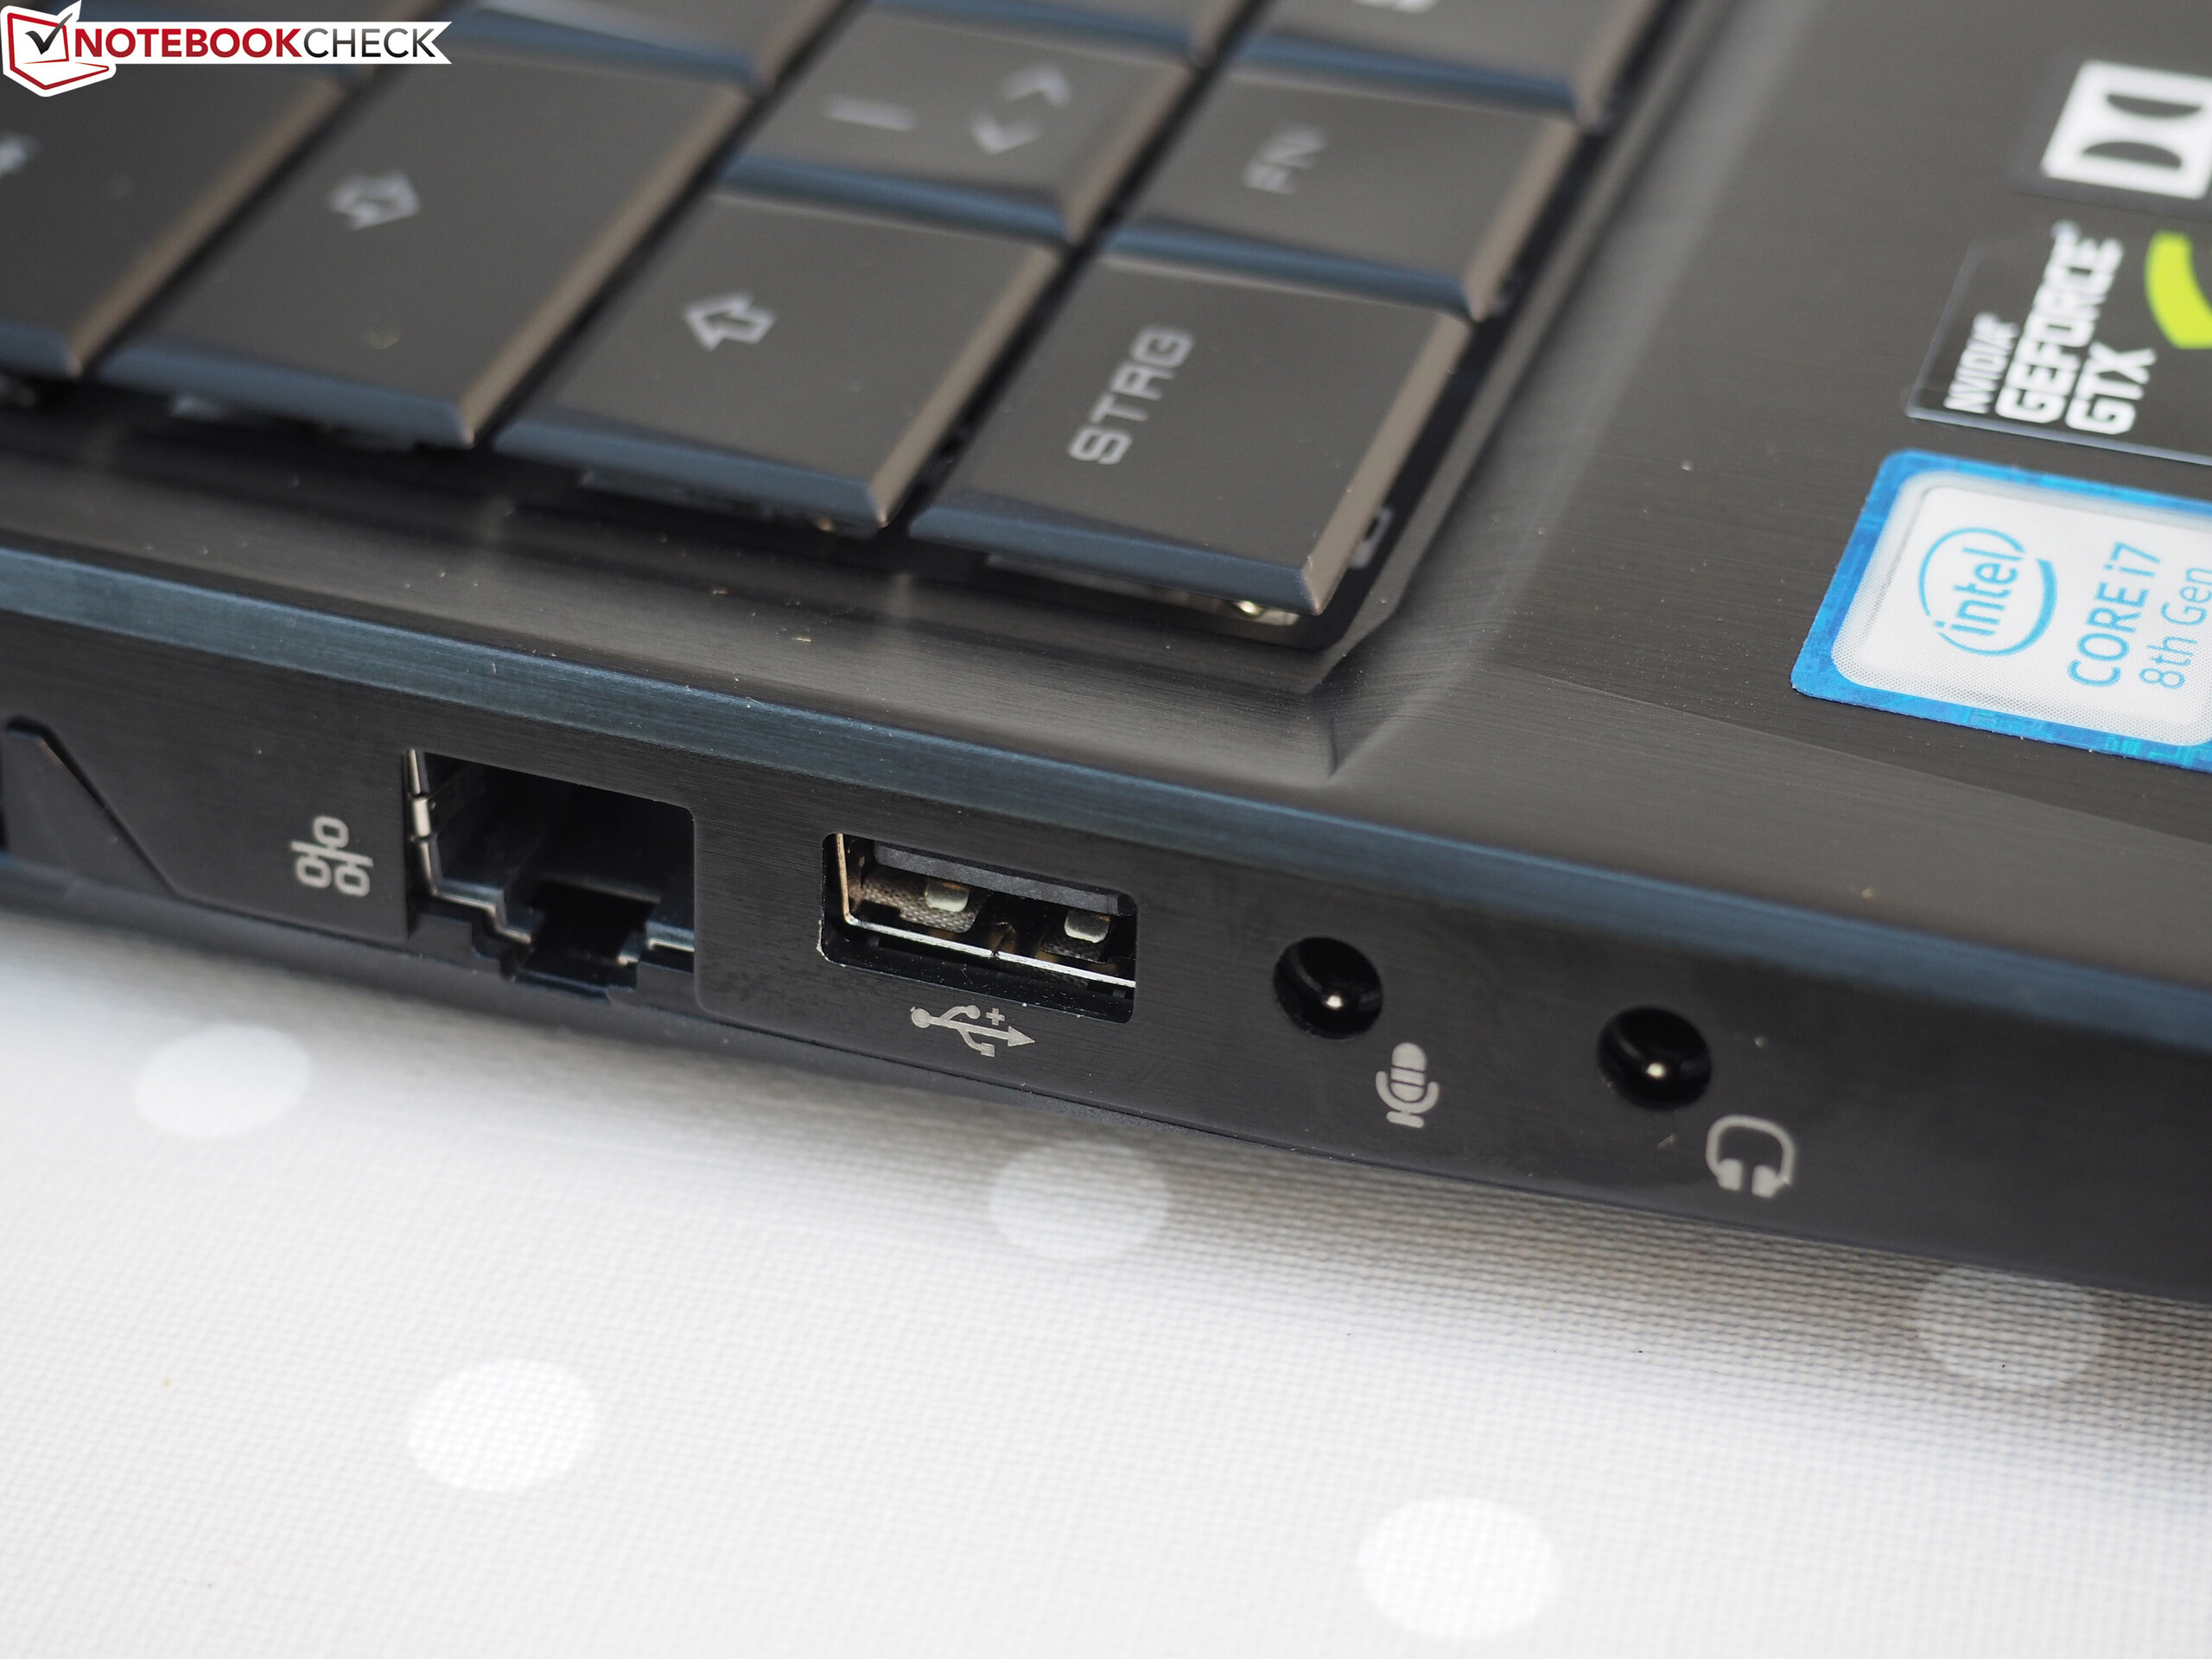
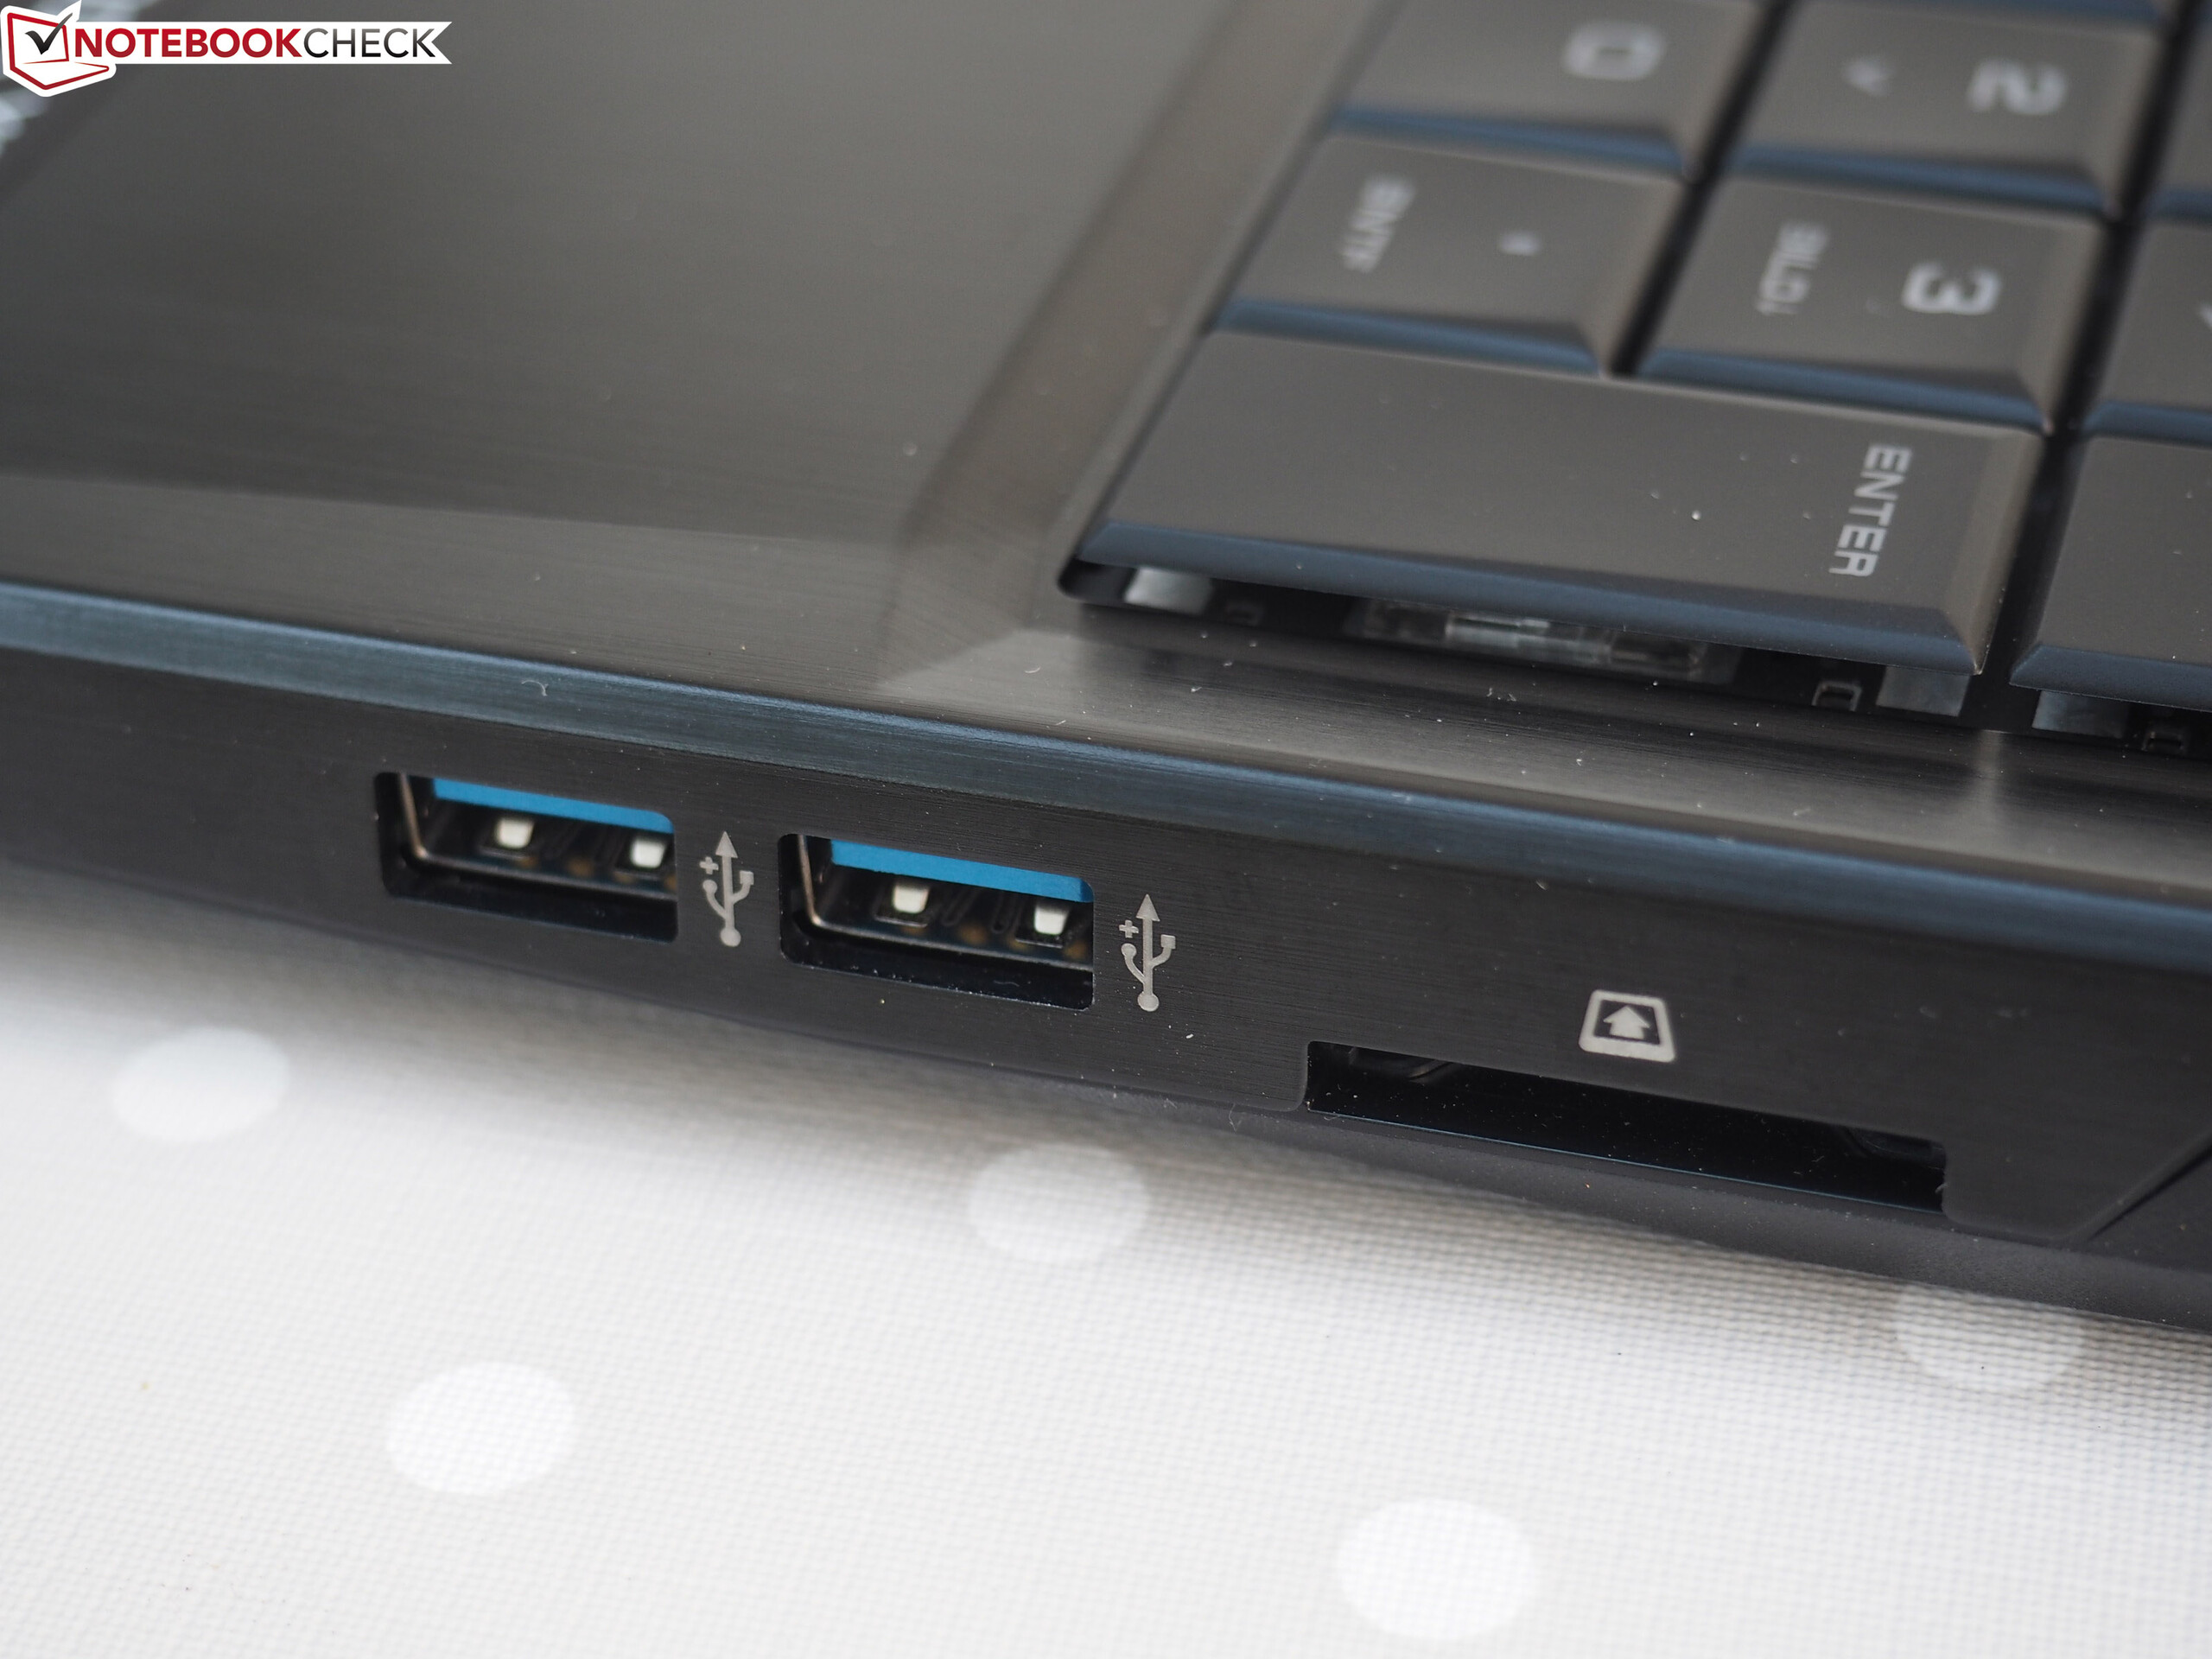
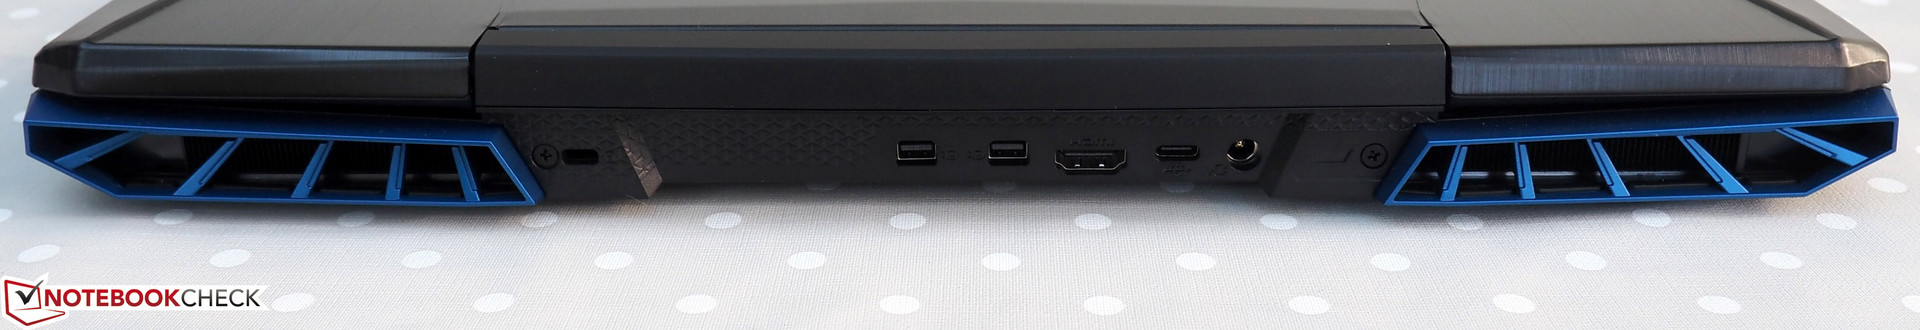
A inclusão de um teclado mecânico é um movimento incomum, mas inteligente, para um dispositivo desse preço. Além disso, a iluminação RGB e a carcaça robusta devem atrair os jogadores. Os alto-falantes e a seleção de portas também são decentes, embora tenhamos gostado de ver o Thunderbolt 3 ou pelo menos uma porta USB 3.1 Gen2.
O Medion Erazer X6805 é um poderoso e bem projetado portátil de jogos de orçamento que não é obstaculizado por suas deficiências.
A Medion também poderia ter equipado o X6805 com um leitor de cartões SD mais rápido e ajustou a curva padrão do ventilador. Além disso, o dispositivo teria se beneficiado de uma opção para uma bateria maior em vez do HD. Independentemente disso, recomendamos muito o Medion Erazer X6805, pois é um dos melhores portáteis de jogos de orçamento no momento.
Medion Erazer X6805-MD61085
- 09/28/2018 v6 (old)
Florian Glaser
Price comparison