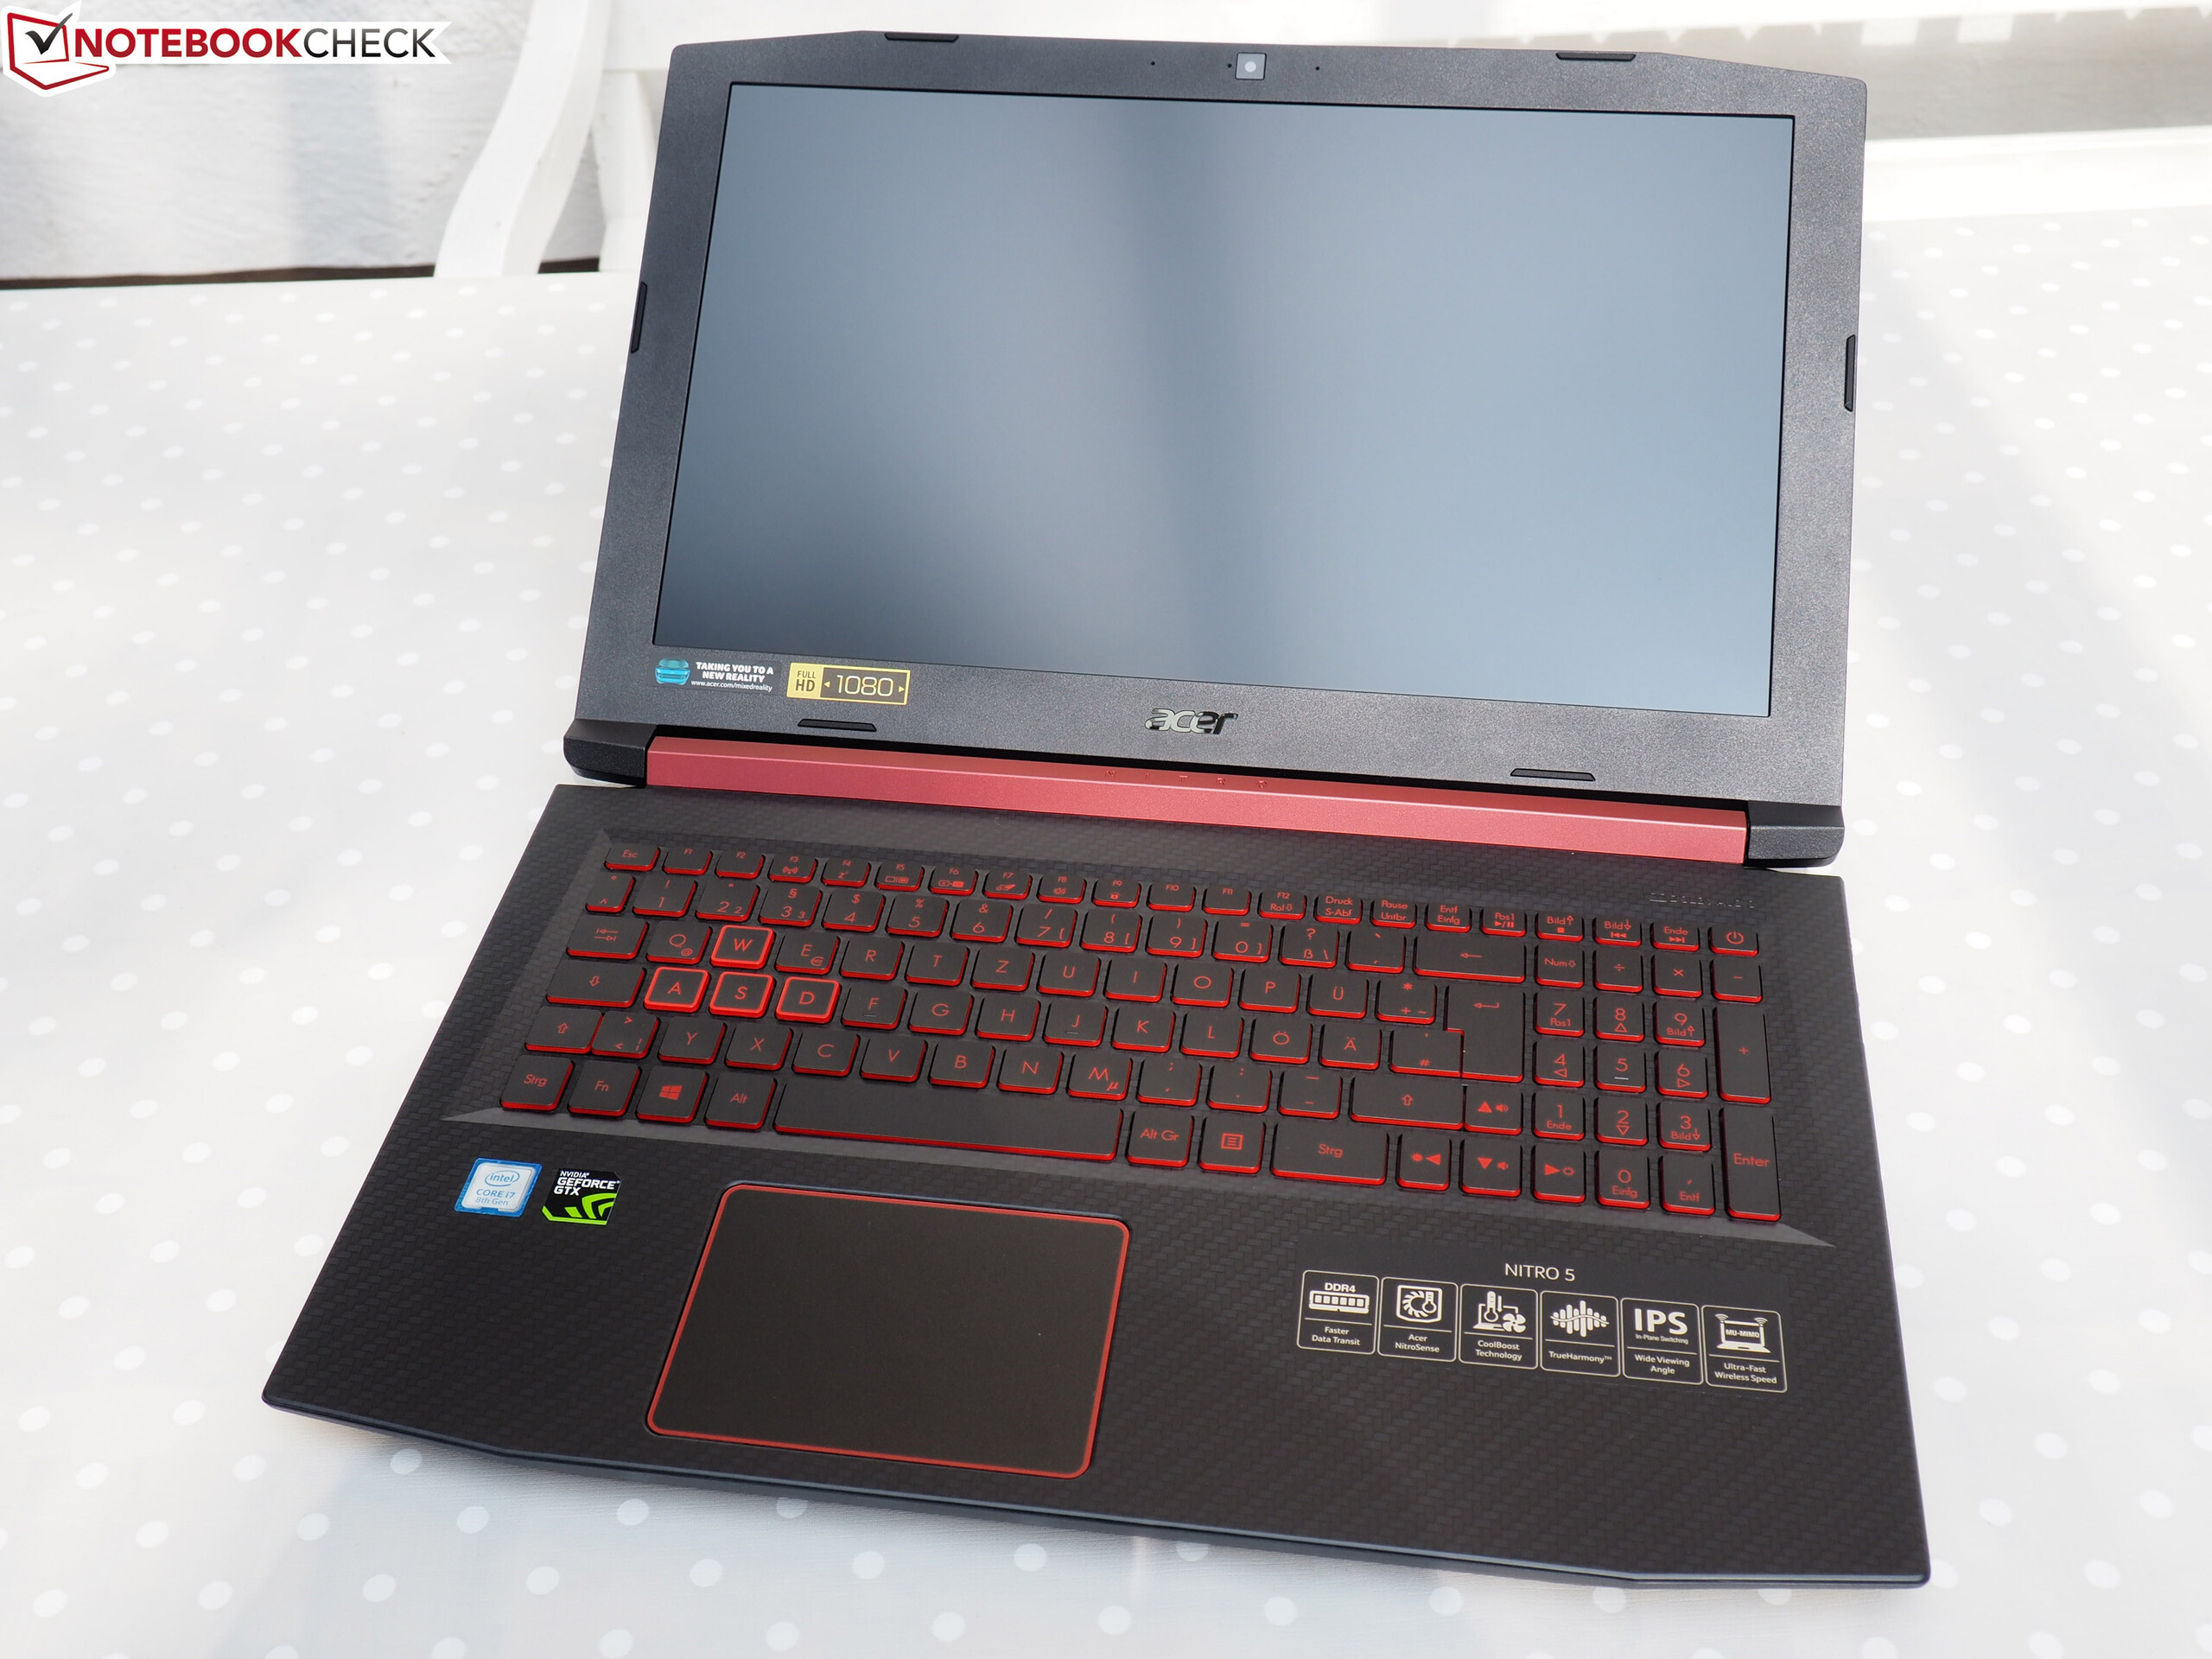
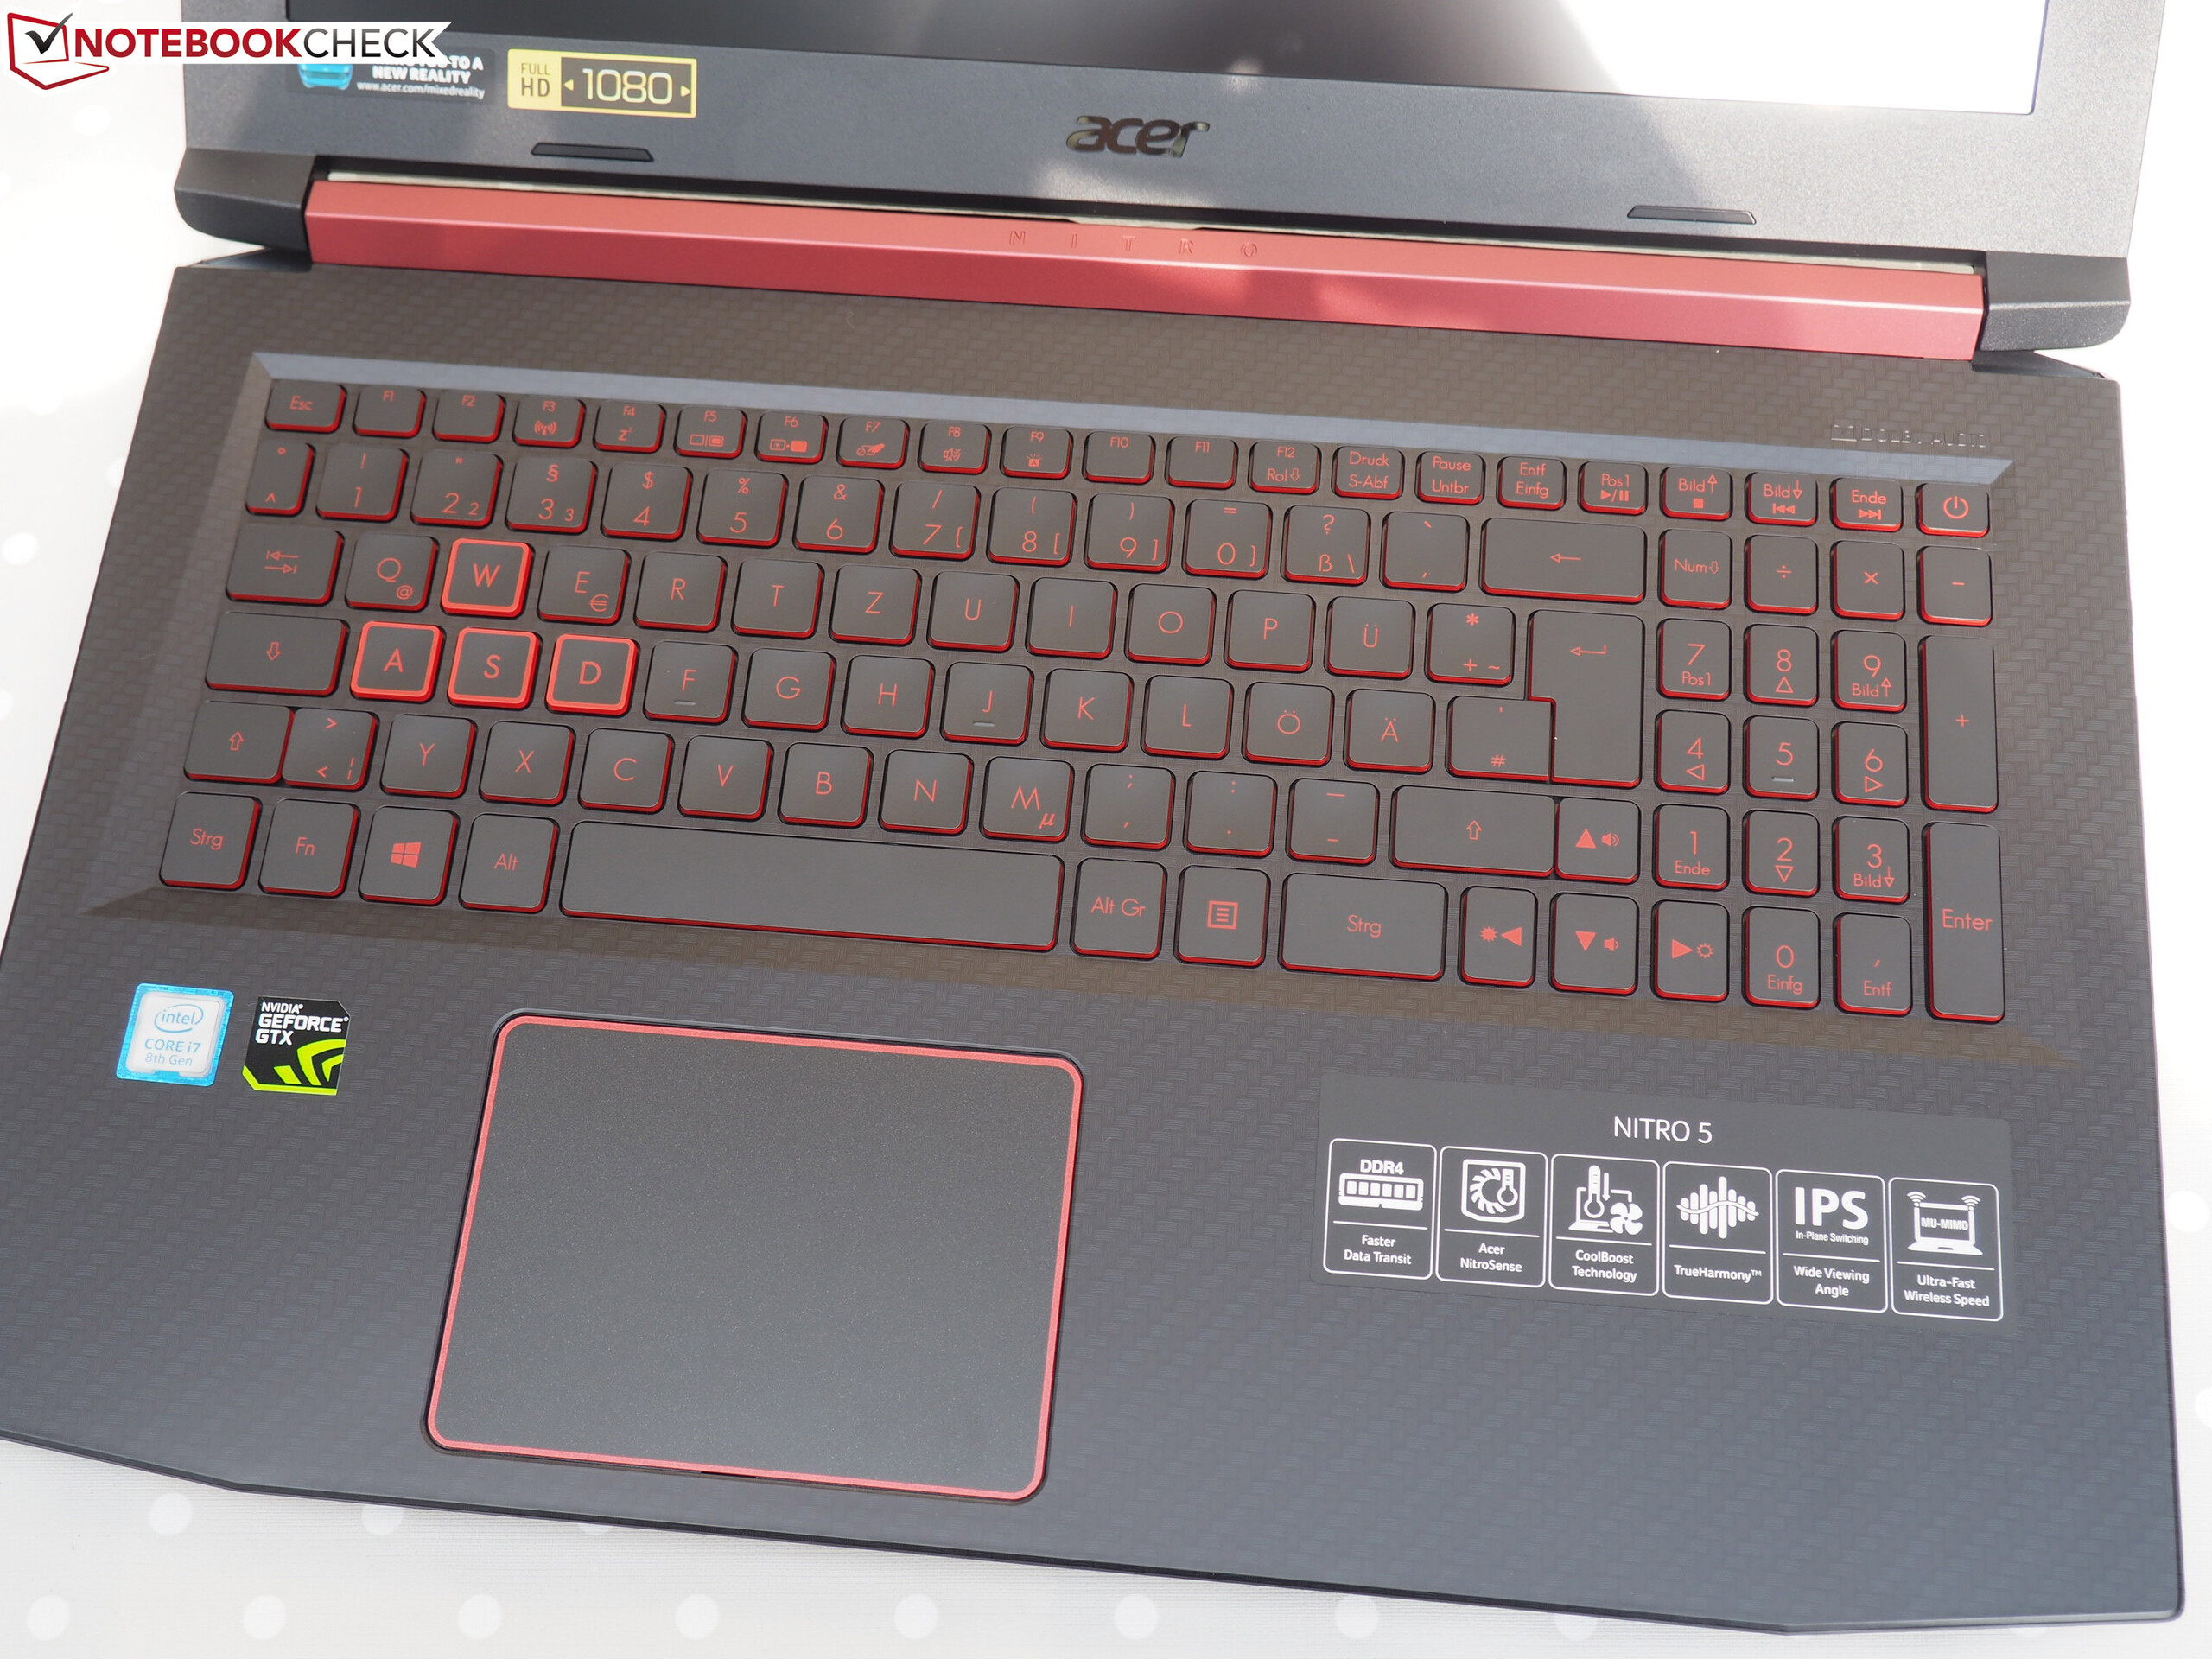
Breve Análise do Portátil Acer Nitro 5 (i7-8750H, GTX 1050 Ti, FHD)
| SD Card Reader | |
| average JPG Copy Test (av. of 3 runs) | |
| Média da turma Gaming (20.9 - 210, n=55, últimos 2 anos) | |
| Acer Nitro 5 AN515-52-74DR (Toshiba Exceria Pro SDXC 64 GB UHS-II) | |
| HP Omen 15-dc0001ng (Toshiba Exceria Pro SDXC 64 GB UHS-II) | |
| Acer Nitro 5 Spin NP515-51-86CX (Toshiba Exceria Pro SDXC 64 GB UHS-II) | |
| Dell G5 15 5587 (Toshiba Exceria Pro SDXC 64 GB UHS-II) | |
| maximum AS SSD Seq Read Test (1GB) | |
| Média da turma Gaming (25.5 - 261, n=52, últimos 2 anos) | |
| HP Omen 15-dc0001ng (Toshiba Exceria Pro SDXC 64 GB UHS-II) | |
| Acer Nitro 5 AN515-52-74DR (Toshiba Exceria Pro SDXC 64 GB UHS-II) | |
| Dell G5 15 5587 (Toshiba Exceria Pro SDXC 64 GB UHS-II) | |
| Acer Nitro 5 Spin NP515-51-86CX (Toshiba Exceria Pro SDXC 64 GB UHS-II) | |
| |||||||||||||||||||||||||
iluminação: 86 %
iluminação com acumulador: 252 cd/m²
Contraste: 1200:1 (Preto: 0.21 cd/m²)
ΔE ColorChecker Calman: 4.42 | ∀{0.5-29.43 Ø4.71}
calibrated: 3.08
ΔE Greyscale Calman: 3.74 | ∀{0.09-98 Ø4.96}
59% sRGB (Argyll 1.6.3 3D)
38% AdobeRGB 1998 (Argyll 1.6.3 3D)
40.92% AdobeRGB 1998 (Argyll 3D)
59.5% sRGB (Argyll 3D)
39.59% Display P3 (Argyll 3D)
Gamma: 2.34
CCT: 7291 K
| Acer Nitro 5 AN515-52-74DR LG Philips LP156WF6-SPK6 (LGD0590), IPS, 1920x1080 | Acer Nitro 5 Spin NP515-51-86CX Chi Mei CMN15D7, IPS, 1920x1080 | HP Omen 15-dc0001ng BOE07A1, IPS, 1920x1080 | Lenovo Legion Y530-15ICH B156HAN02.1, IPS, 1920x1080 | Dell G5 15 5587 LGD053F, 156WF6, IPS, 1920x1080 | |
|---|---|---|---|---|---|
| Display | 61% | -0% | -3% | -4% | |
| Display P3 Coverage (%) | 39.59 | 64.9 64% | 39.64 0% | 38.31 -3% | 38.13 -4% |
| sRGB Coverage (%) | 59.5 | 92.6 56% | 59 -1% | 57.3 -4% | 56.8 -5% |
| AdobeRGB 1998 Coverage (%) | 40.92 | 66.3 62% | 40.95 0% | 39.58 -3% | 39.47 -4% |
| Response Times | -7% | -36% | -31% | 2% | |
| Response Time Grey 50% / Grey 80% * (ms) | 38 ? | 36 ? 5% | 47.2 ? -24% | 43.6 ? -15% | 33 ? 13% |
| Response Time Black / White * (ms) | 22 ? | 26 ? -18% | 32.4 ? -47% | 32.4 ? -47% | 24 ? -9% |
| PWM Frequency (Hz) | 200 ? | ||||
| Screen | -4% | -7% | -29% | -31% | |
| Brightness middle (cd/m²) | 252 | 345 37% | 275 9% | 282.8 12% | 229 -9% |
| Brightness (cd/m²) | 237 | 332 40% | 254 7% | 264 11% | 224 -5% |
| Brightness Distribution (%) | 86 | 92 7% | 90 5% | 88 2% | 87 1% |
| Black Level * (cd/m²) | 0.21 | 0.28 -33% | 0.27 -29% | 0.42 -100% | 0.28 -33% |
| Contrast (:1) | 1200 | 1232 3% | 1019 -15% | 673 -44% | 818 -32% |
| Colorchecker dE 2000 * | 4.42 | 5.85 -32% | 4.62 -5% | 4.93 -12% | 6.1 -38% |
| Colorchecker dE 2000 max. * | 7.21 | 11.87 -65% | 8.05 -12% | 17.65 -145% | 12.2 -69% |
| Colorchecker dE 2000 calibrated * | 3.08 | 3.59 -17% | 4.07 -32% | 6.12 -99% | |
| Greyscale dE 2000 * | 3.74 | 8.11 -117% | 4.31 -15% | 3.8 -2% | 5.68 -52% |
| Gamma | 2.34 94% | 2.48 89% | 2.49 88% | 2.449 90% | 2.4 92% |
| CCT | 7291 89% | 6741 96% | 7000 93% | 6112 106% | 6989 93% |
| Color Space (Percent of AdobeRGB 1998) (%) | 38 | 60 58% | 38 0% | 36 -5% | 36 -5% |
| Color Space (Percent of sRGB) (%) | 59 | 93 58% | 59 0% | 57 -3% | 57 -3% |
| Média Total (Programa/Configurações) | 17% /
8% | -14% /
-9% | -21% /
-24% | -11% /
-22% |
* ... menor é melhor
Exibir tempos de resposta
| ↔ Tempo de resposta preto para branco | ||
|---|---|---|
| 22 ms ... ascensão ↗ e queda ↘ combinadas | ↗ 12 ms ascensão | 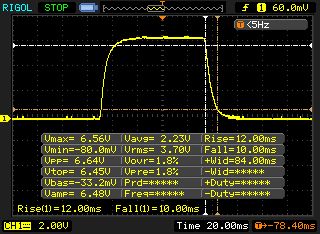 |
| ↘ 10 ms queda | ||
| A tela mostra boas taxas de resposta em nossos testes, mas pode ser muito lenta para jogadores competitivos. Em comparação, todos os dispositivos testados variam de 0.1 (mínimo) a 240 (máximo) ms. » 49 % de todos os dispositivos são melhores. Isso significa que o tempo de resposta medido é pior que a média de todos os dispositivos testados (19.8 ms). | ||
| ↔ Tempo de resposta 50% cinza a 80% cinza | ||
| 38 ms ... ascensão ↗ e queda ↘ combinadas | ↗ 19.2 ms ascensão |  |
| ↘ 18.8 ms queda | ||
| A tela mostra taxas de resposta lentas em nossos testes e será insatisfatória para os jogadores. Em comparação, todos os dispositivos testados variam de 0.165 (mínimo) a 636 (máximo) ms. » 55 % de todos os dispositivos são melhores. Isso significa que o tempo de resposta medido é pior que a média de todos os dispositivos testados (30.9 ms). | ||
Cintilação da tela / PWM (modulação por largura de pulso)
| Tela tremeluzindo / PWM não detectado | 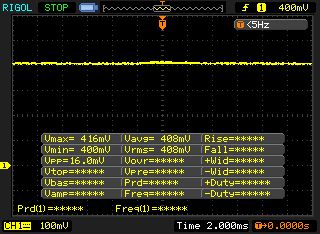 | ||
[pwm_comparison] Em comparação: 52 % de todos os dispositivos testados não usam PWM para escurecer a tela. Se PWM foi detectado, uma média de 7748 (mínimo: 5 - máximo: 343500) Hz foi medida. | |||
| PCMark 10 - Score | |
| Média da turma Gaming (5828 - 12414, n=94, últimos 2 anos) | |
| Dell G5 15 5587 | |
| Acer Nitro 5 AN515-52-74DR | |
| Lenovo Legion Y530-15ICH | |
| HP Omen 15-dc0001ng | |
| Acer Nitro 5 Spin NP515-51-86CX | |
| PCMark 8 Home Score Accelerated v2 | 4371 pontos | |
| PCMark 8 Work Score Accelerated v2 | 5370 pontos | |
| PCMark 10 Score | 5001 pontos | |
Ajuda | ||
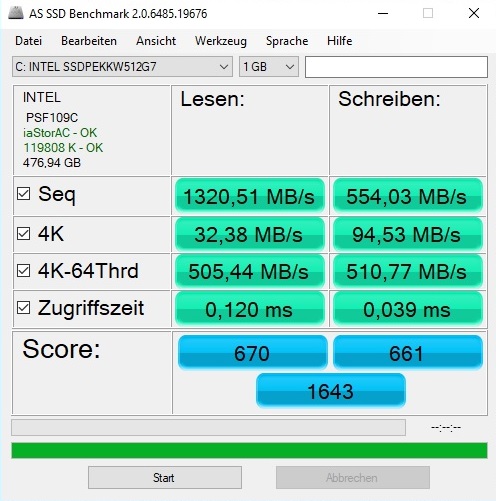
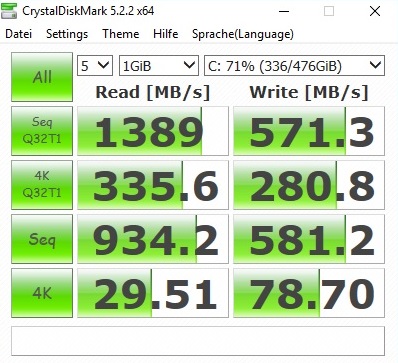
| Acer Nitro 5 AN515-52-74DR Intel SSD 600p SSDPEKKW512G7 | Acer Nitro 5 Spin NP515-51-86CX Micron 1100 MTFDDAV256TBN | HP Omen 15-dc0001ng Toshiba KBG30ZMV128G | Lenovo Legion Y530-15ICH Toshiba KBG30ZMT128G | Dell G5 15 5587 SK hynix SC311 M.2 | |
|---|---|---|---|---|---|
| AS SSD | -41% | -40% | -40% | -54% | |
| Seq Read (MB/s) | 1321 | 490.1 -63% | 1238 -6% | 1231 -7% | 511 -61% |
| Seq Write (MB/s) | 554 | 335.2 -39% | 123.5 -78% | 131.6 -76% | 243.7 -56% |
| 4K Read (MB/s) | 32.38 | 25.86 -20% | 31.48 -3% | 38.71 20% | 24.44 -25% |
| 4K Write (MB/s) | 94.5 | 78.1 -17% | 79.3 -16% | 35.74 -62% | 62.2 -34% |
| Score Read (Points) | 670 | 309 -54% | 343 -49% | 497 -26% | 240 -64% |
| Score Write (Points) | 661 | 367 -44% | 195 -70% | 128 -81% | 199 -70% |
| Score Total (Points) | 1643 | 835 -49% | 670 -59% | 838 -49% | 557 -66% |

| 3DMark - 1920x1080 Fire Strike Graphics | |
| Média da turma Gaming (12242 - 62849, n=116, últimos 2 anos) | |
| Dell G5 15 5587 | |
| Lenovo Legion Y530-15ICH | |
| Acer Nitro 5 AN515-52-74DR | |
| HP Omen 15-dc0001ng | |
| Acer Nitro 5 Spin NP515-51-86CX | |
| 3DMark 11 Performance | 9468 pontos | |
| 3DMark Ice Storm Standard Score | 98693 pontos | |
| 3DMark Cloud Gate Standard Score | 27750 pontos | |
| 3DMark Fire Strike Score | 6890 pontos | |
Ajuda | ||
| The Witcher 3 | |
| 1920x1080 Ultra Graphics & Postprocessing (HBAO+) | |
| Média da turma Gaming (104.7 - 240, n=7, últimos 2 anos) | |
| Dell G5 15 5587 | |
| Acer Nitro 5 AN515-52-74DR | |
| HP Omen 15-dc0001ng | |
| 1920x1080 High Graphics & Postprocessing (Nvidia HairWorks Off) | |
| Média da turma Gaming (341 - 404, n=2, últimos 2 anos) | |
| Dell G5 15 5587 | |
| Acer Nitro 5 AN515-52-74DR | |
| HP Omen 15-dc0001ng | |
| baixo | média | alto | ultra | |
|---|---|---|---|---|
| The Witcher 3 (2015) | 46.4 | 26 | ||
| Rainbow Six Siege (2015) | 99.2 | 82.2 | ||
| Destiny 2 (2017) | 65.1 | 54.7 | ||
| Fortnite (2018) | 75.8 | 52.9 | ||
| Final Fantasy XV Benchmark (2018) | 40.1 | 25.6 | ||
| Kingdom Come: Deliverance (2018) | 39.4 | 29.7 | ||
| Far Cry 5 (2018) | 45 | 42 | ||
| The Crew 2 (2018) | 53.4 | 48.9 |
Barulho
| Ocioso |
| 30 / 32 / 33 dB |
| Carga |
| 42 / 49 dB |
 | ||
30 dB silencioso 40 dB(A) audível 50 dB(A) ruidosamente alto |
||
min: | ||
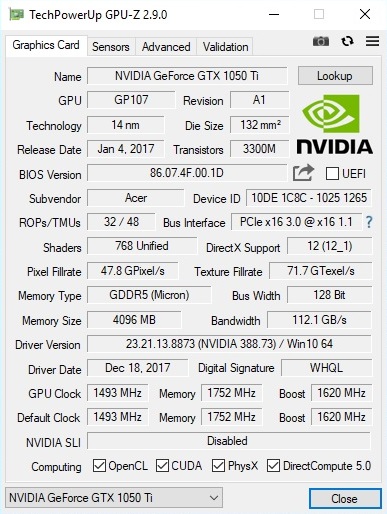
| Acer Nitro 5 AN515-52-74DR GeForce GTX 1050 Ti Mobile, i7-8750H | Acer Nitro 5 Spin NP515-51-86CX GeForce GTX 1050 Mobile, i5-8550U | HP Omen 15-dc0001ng GeForce GTX 1050 Ti Mobile, i5-8300H | Lenovo Legion Y530-15ICH GeForce GTX 1050 Ti Mobile, i5-8300H | Dell G5 15 5587 GeForce GTX 1060 Max-Q, i5-8300H | Média da turma Gaming | |
|---|---|---|---|---|---|---|
| Noise | 2% | -4% | 10% | 4% | 7% | |
| desligado / ambiente * (dB) | 30 | 30.4 -1% | 29 3% | 28 7% | 30.3 -1% | 24.1 ? 20% |
| Idle Minimum * (dB) | 30 | 30.9 -3% | 29 3% | 28 7% | 31.1 -4% | 26 ? 13% |
| Idle Average * (dB) | 32 | 30.9 3% | 33 -3% | 28 12% | 31.1 3% | 27.5 ? 14% |
| Idle Maximum * (dB) | 33 | 30.9 6% | 41 -24% | 28.5 14% | 34.2 -4% | 30.1 ? 9% |
| Load Average * (dB) | 42 | 42.6 -1% | 44 -5% | 34.9 17% | 34.9 17% | 43.8 ? -4% |
| Witcher 3 ultra * (dB) | 46 | 47 -2% | 40 13% | 42.7 7% | ||
| Load Maximum * (dB) | 49 | 45 8% | 49 -0% | 49.6 -1% | 44 10% | 54.3 ? -11% |
* ... menor é melhor
(-) A temperatura máxima no lado superior é 52 °C / 126 F, em comparação com a média de 40.4 °C / 105 F , variando de 21.2 a 68.8 °C para a classe Gaming.
(-) A parte inferior aquece até um máximo de 55 °C / 131 F, em comparação com a média de 43.2 °C / 110 F
(+) Em uso inativo, a temperatura média para o lado superior é 31.4 °C / 89 F, em comparação com a média do dispositivo de 33.9 °C / ### class_avg_f### F.
(-) Jogando The Witcher 3, a temperatura média para o lado superior é 42.1 °C / 108 F, em comparação com a média do dispositivo de 33.9 °C / ## #class_avg_f### F.
(±) Os apoios para as mãos e o touchpad podem ficar muito quentes ao toque, com um máximo de 37 °C / 98.6 F.
(-) A temperatura média da área do apoio para as mãos de dispositivos semelhantes foi 28.8 °C / 83.8 F (-8.2 °C / -14.8 F).
| Acer Nitro 5 AN515-52-74DR GeForce GTX 1050 Ti Mobile, i7-8750H | Acer Nitro 5 Spin NP515-51-86CX GeForce GTX 1050 Mobile, i5-8550U | HP Omen 15-dc0001ng GeForce GTX 1050 Ti Mobile, i5-8300H | Lenovo Legion Y530-15ICH GeForce GTX 1050 Ti Mobile, i5-8300H | Dell G5 15 5587 GeForce GTX 1060 Max-Q, i5-8300H | Média da turma Gaming | |
|---|---|---|---|---|---|---|
| Heat | 17% | -2% | 3% | 8% | 8% | |
| Maximum Upper Side * (°C) | 52 | 46 12% | 51 2% | 42.8 18% | 50.2 3% | 45.2 ? 13% |
| Maximum Bottom * (°C) | 55 | 47 15% | 58 -5% | 52 5% | 57 -4% | 48.2 ? 12% |
| Idle Upper Side * (°C) | 36 | 29.6 18% | 35 3% | 32 11% | 28.6 21% | 31 ? 14% |
| Idle Bottom * (°C) | 32 | 24.6 23% | 35 -9% | 39.4 -23% | 28.9 10% | 34.2 ? -7% |
* ... menor é melhor
Acer Nitro 5 AN515-52-74DR análise de áudio
(±) | o volume do alto-falante é médio, mas bom (###valor### dB)
Graves 100 - 315Hz
(±) | graves reduzidos - em média 12.6% menor que a mediana
(±) | a linearidade dos graves é média (13.5% delta para a frequência anterior)
Médios 400 - 2.000 Hz
(+) | médios equilibrados - apenas 4.5% longe da mediana
(+) | médios são lineares (4.4% delta para frequência anterior)
Altos 2 - 16 kHz
(+) | agudos equilibrados - apenas 3% longe da mediana
(±) | a linearidade dos máximos é média (8.9% delta para frequência anterior)
Geral 100 - 16.000 Hz
(±) | a linearidade do som geral é média (16.1% diferença em relação à mediana)
Comparado com a mesma classe
» 39% de todos os dispositivos testados nesta classe foram melhores, 7% semelhantes, 54% piores
» O melhor teve um delta de 6%, a média foi 18%, o pior foi 132%
Comparado com todos os dispositivos testados
» 26% de todos os dispositivos testados foram melhores, 5% semelhantes, 69% piores
» O melhor teve um delta de 4%, a média foi 23%, o pior foi 134%
Acer Nitro 5 Spin NP515-51-86CX análise de áudio
(±) | o volume do alto-falante é médio, mas bom (###valor### dB)
Graves 100 - 315Hz
(-) | quase nenhum baixo - em média 20.8% menor que a mediana
(-) | graves não são lineares (16.9% delta para frequência anterior)
Médios 400 - 2.000 Hz
(+) | médios equilibrados - apenas 3.5% longe da mediana
(±) | a linearidade dos médios é média (8.8% delta para frequência anterior)
Altos 2 - 16 kHz
(+) | agudos equilibrados - apenas 4.4% longe da mediana
(+) | os máximos são lineares (6.2% delta da frequência anterior)
Geral 100 - 16.000 Hz
(±) | a linearidade do som geral é média (18.9% diferença em relação à mediana)
Comparado com a mesma classe
» 59% de todos os dispositivos testados nesta classe foram melhores, 7% semelhantes, 33% piores
» O melhor teve um delta de 5%, a média foi 17%, o pior foi 45%
Comparado com todos os dispositivos testados
» 44% de todos os dispositivos testados foram melhores, 8% semelhantes, 48% piores
» O melhor teve um delta de 4%, a média foi 23%, o pior foi 134%
| desligado | |
| Ocioso | |
| Carga |
|
Key:
min: | |
| Acer Nitro 5 AN515-52-74DR GeForce GTX 1050 Ti Mobile, i7-8750H | Acer Nitro 5 Spin NP515-51-86CX GeForce GTX 1050 Mobile, i5-8550U | HP Omen 15-dc0001ng GeForce GTX 1050 Ti Mobile, i5-8300H | Lenovo Legion Y530-15ICH GeForce GTX 1050 Ti Mobile, i5-8300H | Dell G5 15 5587 GeForce GTX 1060 Max-Q, i5-8300H | Média da turma Gaming | |
|---|---|---|---|---|---|---|
| Power Consumption | 19% | -52% | -10% | -3% | -113% | |
| Idle Minimum * (Watt) | 5 | 4.1 18% | 12 -140% | 4.5 10% | 4.9 2% | 13 ? -160% |
| Idle Average * (Watt) | 7 | 7.4 -6% | 14 -100% | 10 -43% | 8.5 -21% | 19 ? -171% |
| Idle Maximum * (Watt) | 11 | 8.6 22% | 18 -64% | 13.8 -25% | 9.1 17% | 24.5 ? -123% |
| Load Average * (Watt) | 91 | 66 27% | 92 -1% | 92.5 -2% | 90.7 -0% | 111.1 ? -22% |
| Witcher 3 ultra * (Watt) | 97 | 100 -3% | 108.1 -11% | 110 -13% | ||
| Load Maximum * (Watt) | 137 | 87 36% | 142 -4% | 123.2 10% | 144 -5% | 260 ? -90% |
* ... menor é melhor
| Acer Nitro 5 AN515-52-74DR GeForce GTX 1050 Ti Mobile, i7-8750H, 48 Wh | Acer Nitro 5 Spin NP515-51-86CX GeForce GTX 1050 Mobile, i5-8550U, 48 Wh | HP Omen 15-dc0001ng GeForce GTX 1050 Ti Mobile, i5-8300H, 70 Wh | Lenovo Legion Y530-15ICH GeForce GTX 1050 Ti Mobile, i5-8300H, 52.5 Wh | Dell G5 15 5587 GeForce GTX 1060 Max-Q, i5-8300H, 56 Wh | Média da turma Gaming | |
|---|---|---|---|---|---|---|
| Duração da bateria | 2% | 11% | -41% | 3% | -4% | |
| Reader / Idle (h) | 12.5 | 12.5 0% | 10.4 -17% | 11.8 -6% | 8.27 ? -34% | |
| H.264 (h) | 7.1 | 6.2 -13% | 8.4 18% | 5.4 -24% | 8.32 ? 17% | |
| WiFi v1.3 (h) | 7 | 6.6 -6% | 8.6 23% | 4.1 -41% | 6.5 -7% | 7.11 ? 2% |
| Load (h) | 1.5 | 1.9 27% | 1.8 20% | 2.2 47% | 1.502 ? 0% |
Pro
Contra
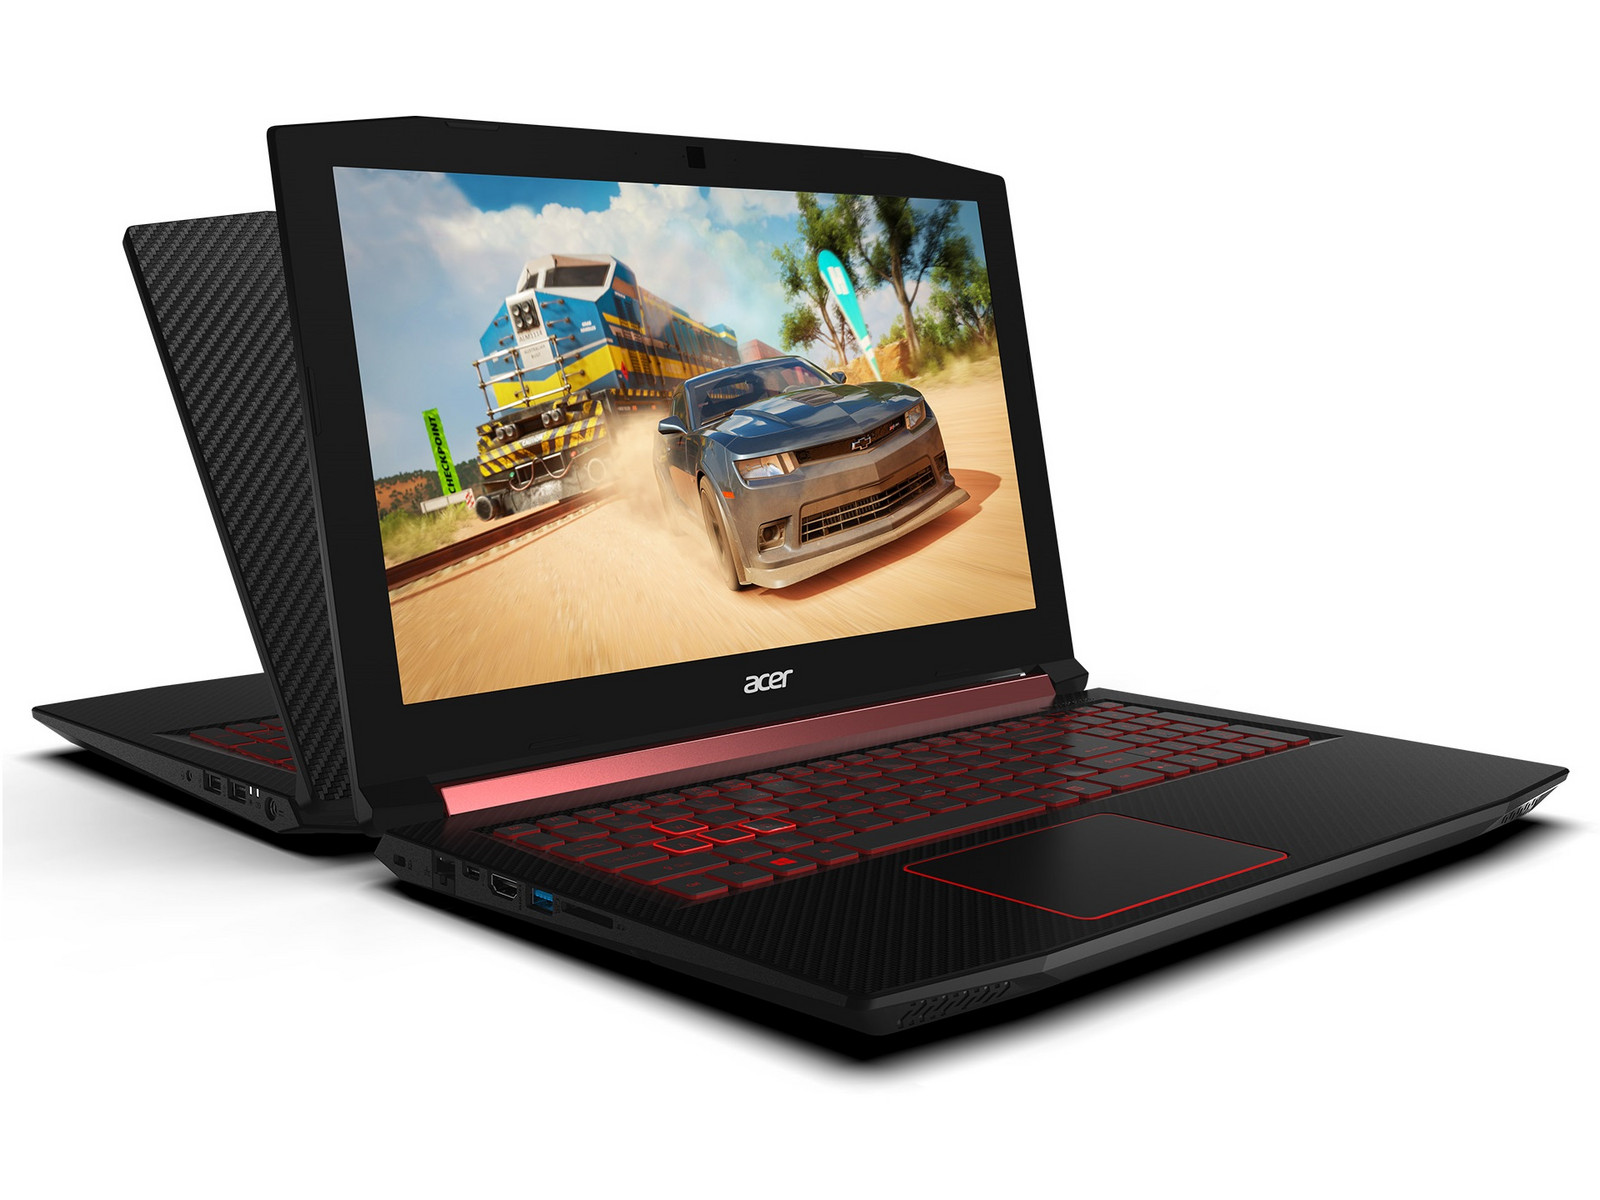
O Acer Nitro 5 é um dos melhores portáteis para jogos econômicos atualmente disponíveis no mercado, apesar de apresentar algumas falhas menores. A Acer oferece um dispositivo com preços atrativos, o que é bem sucedido em quase todos os aspectos - se conseguir viver com a pobre gama de cores da tela Full HD.
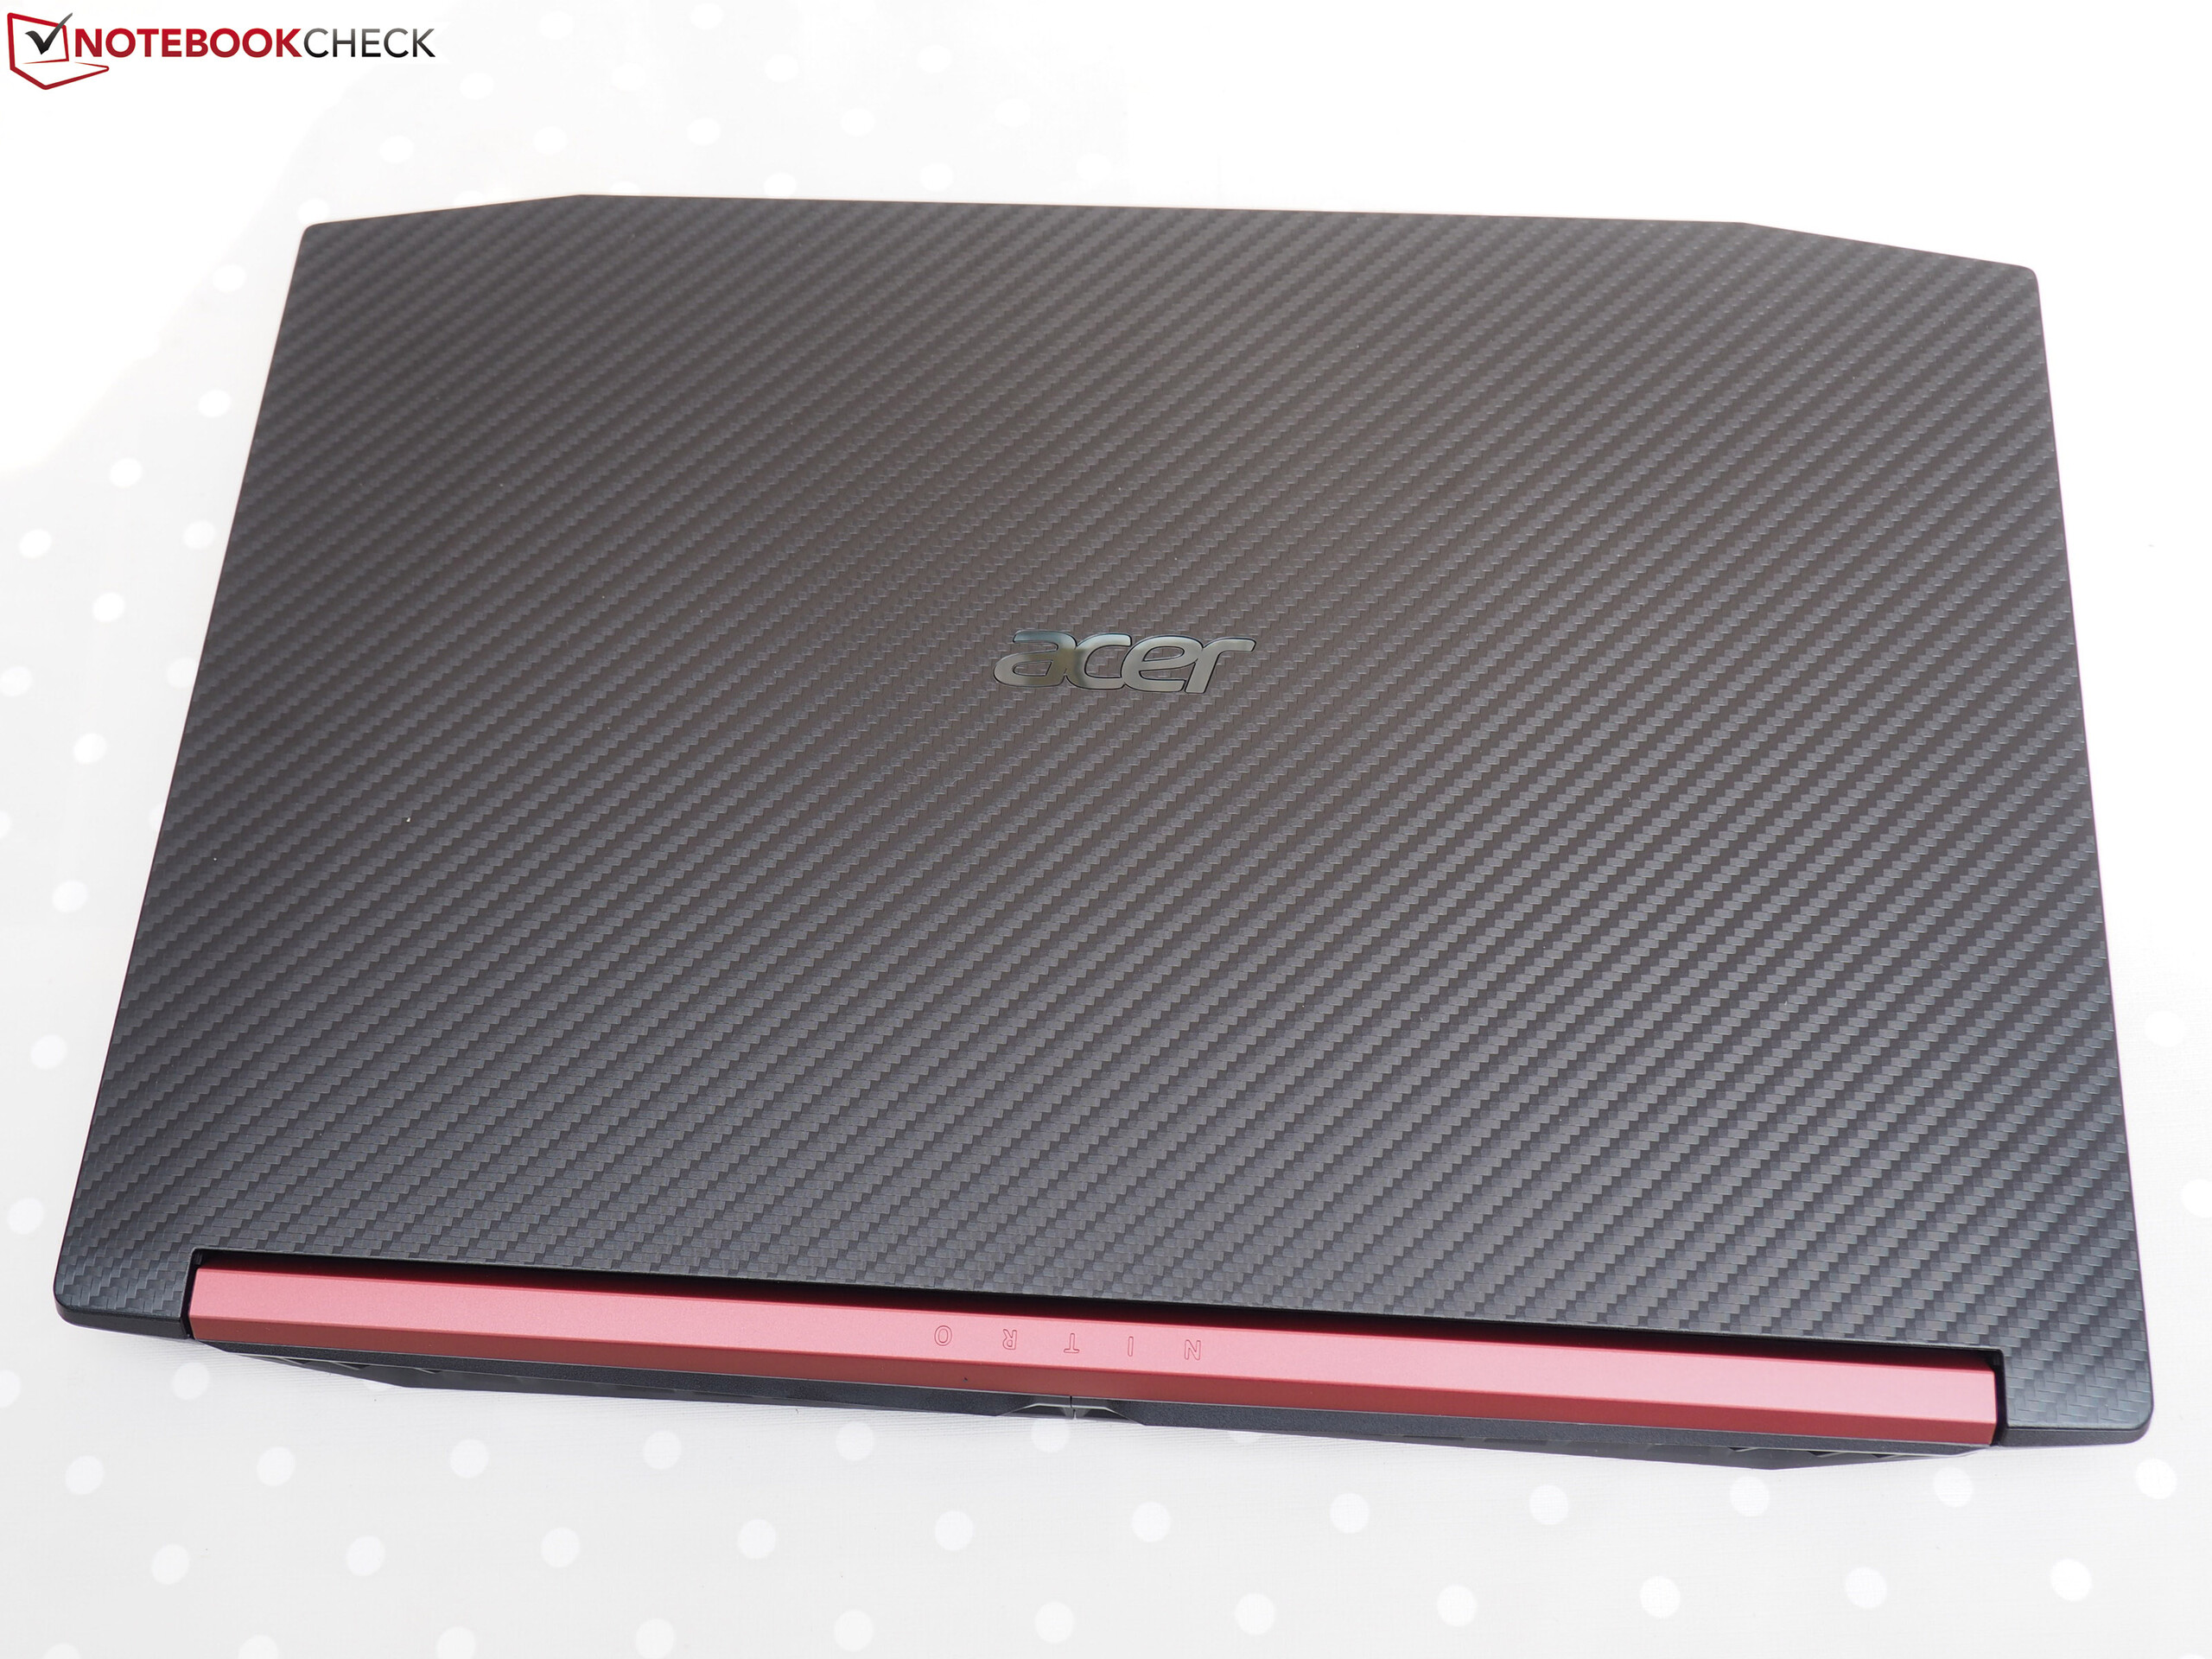
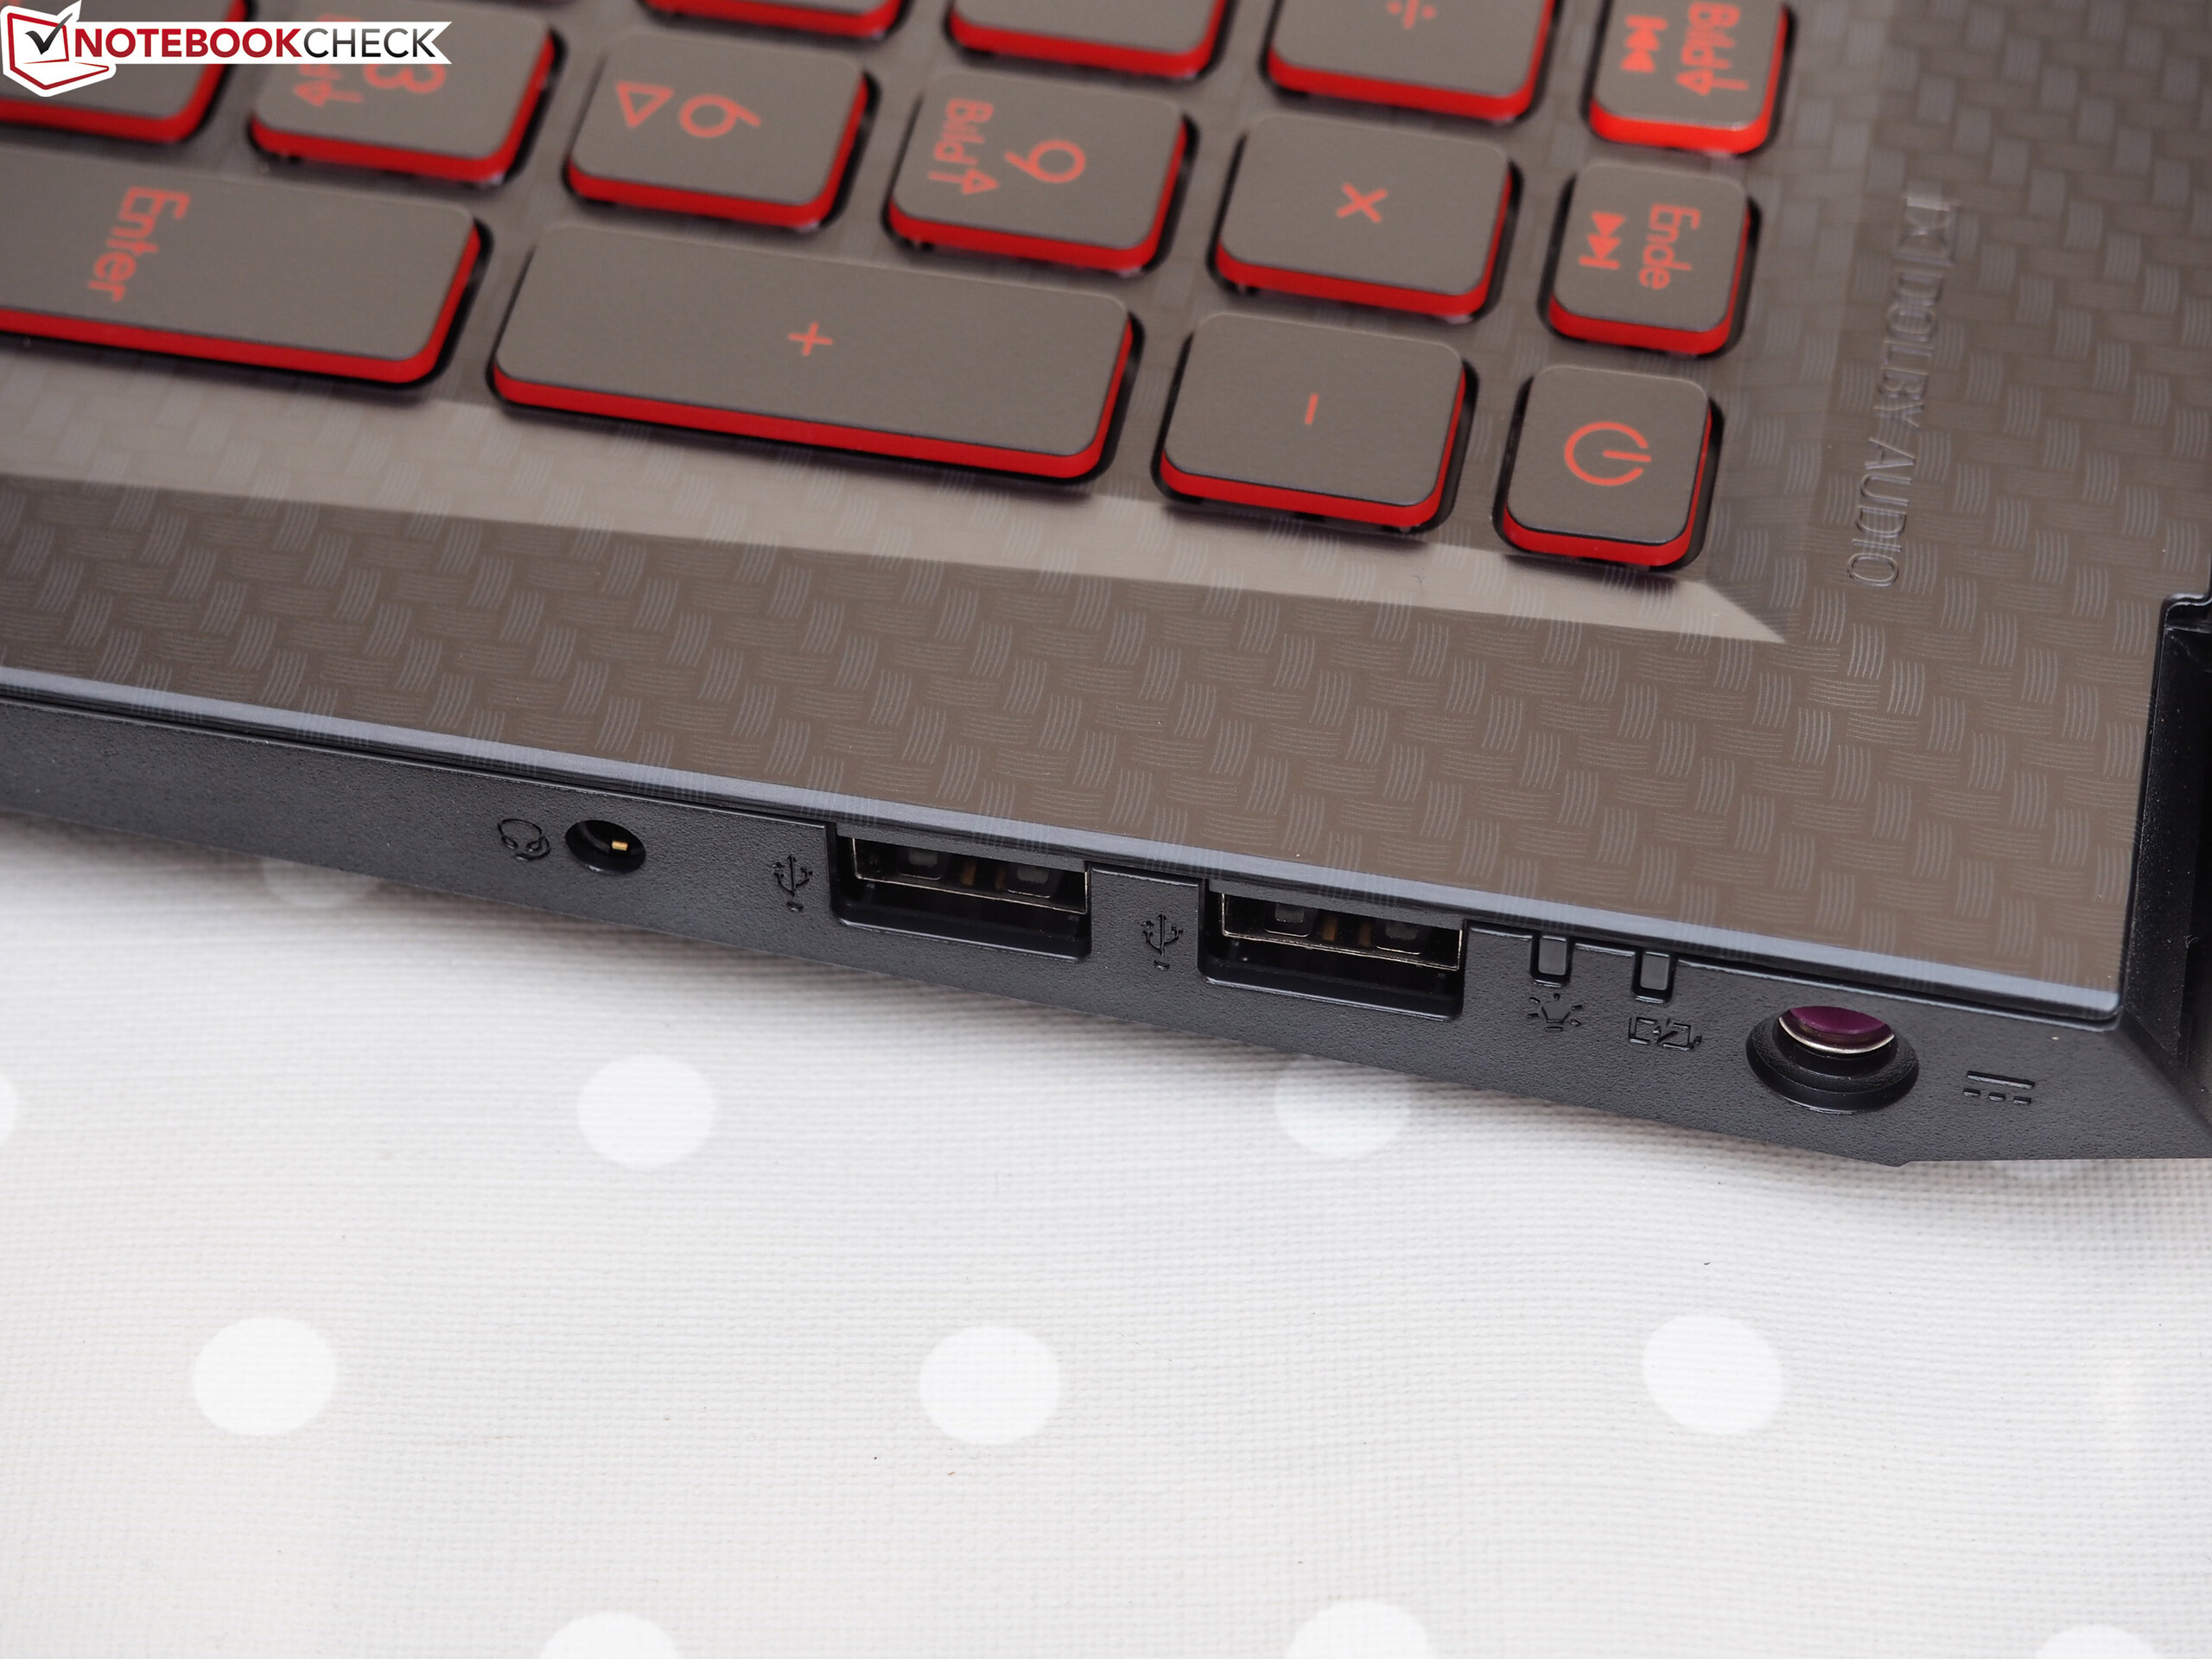
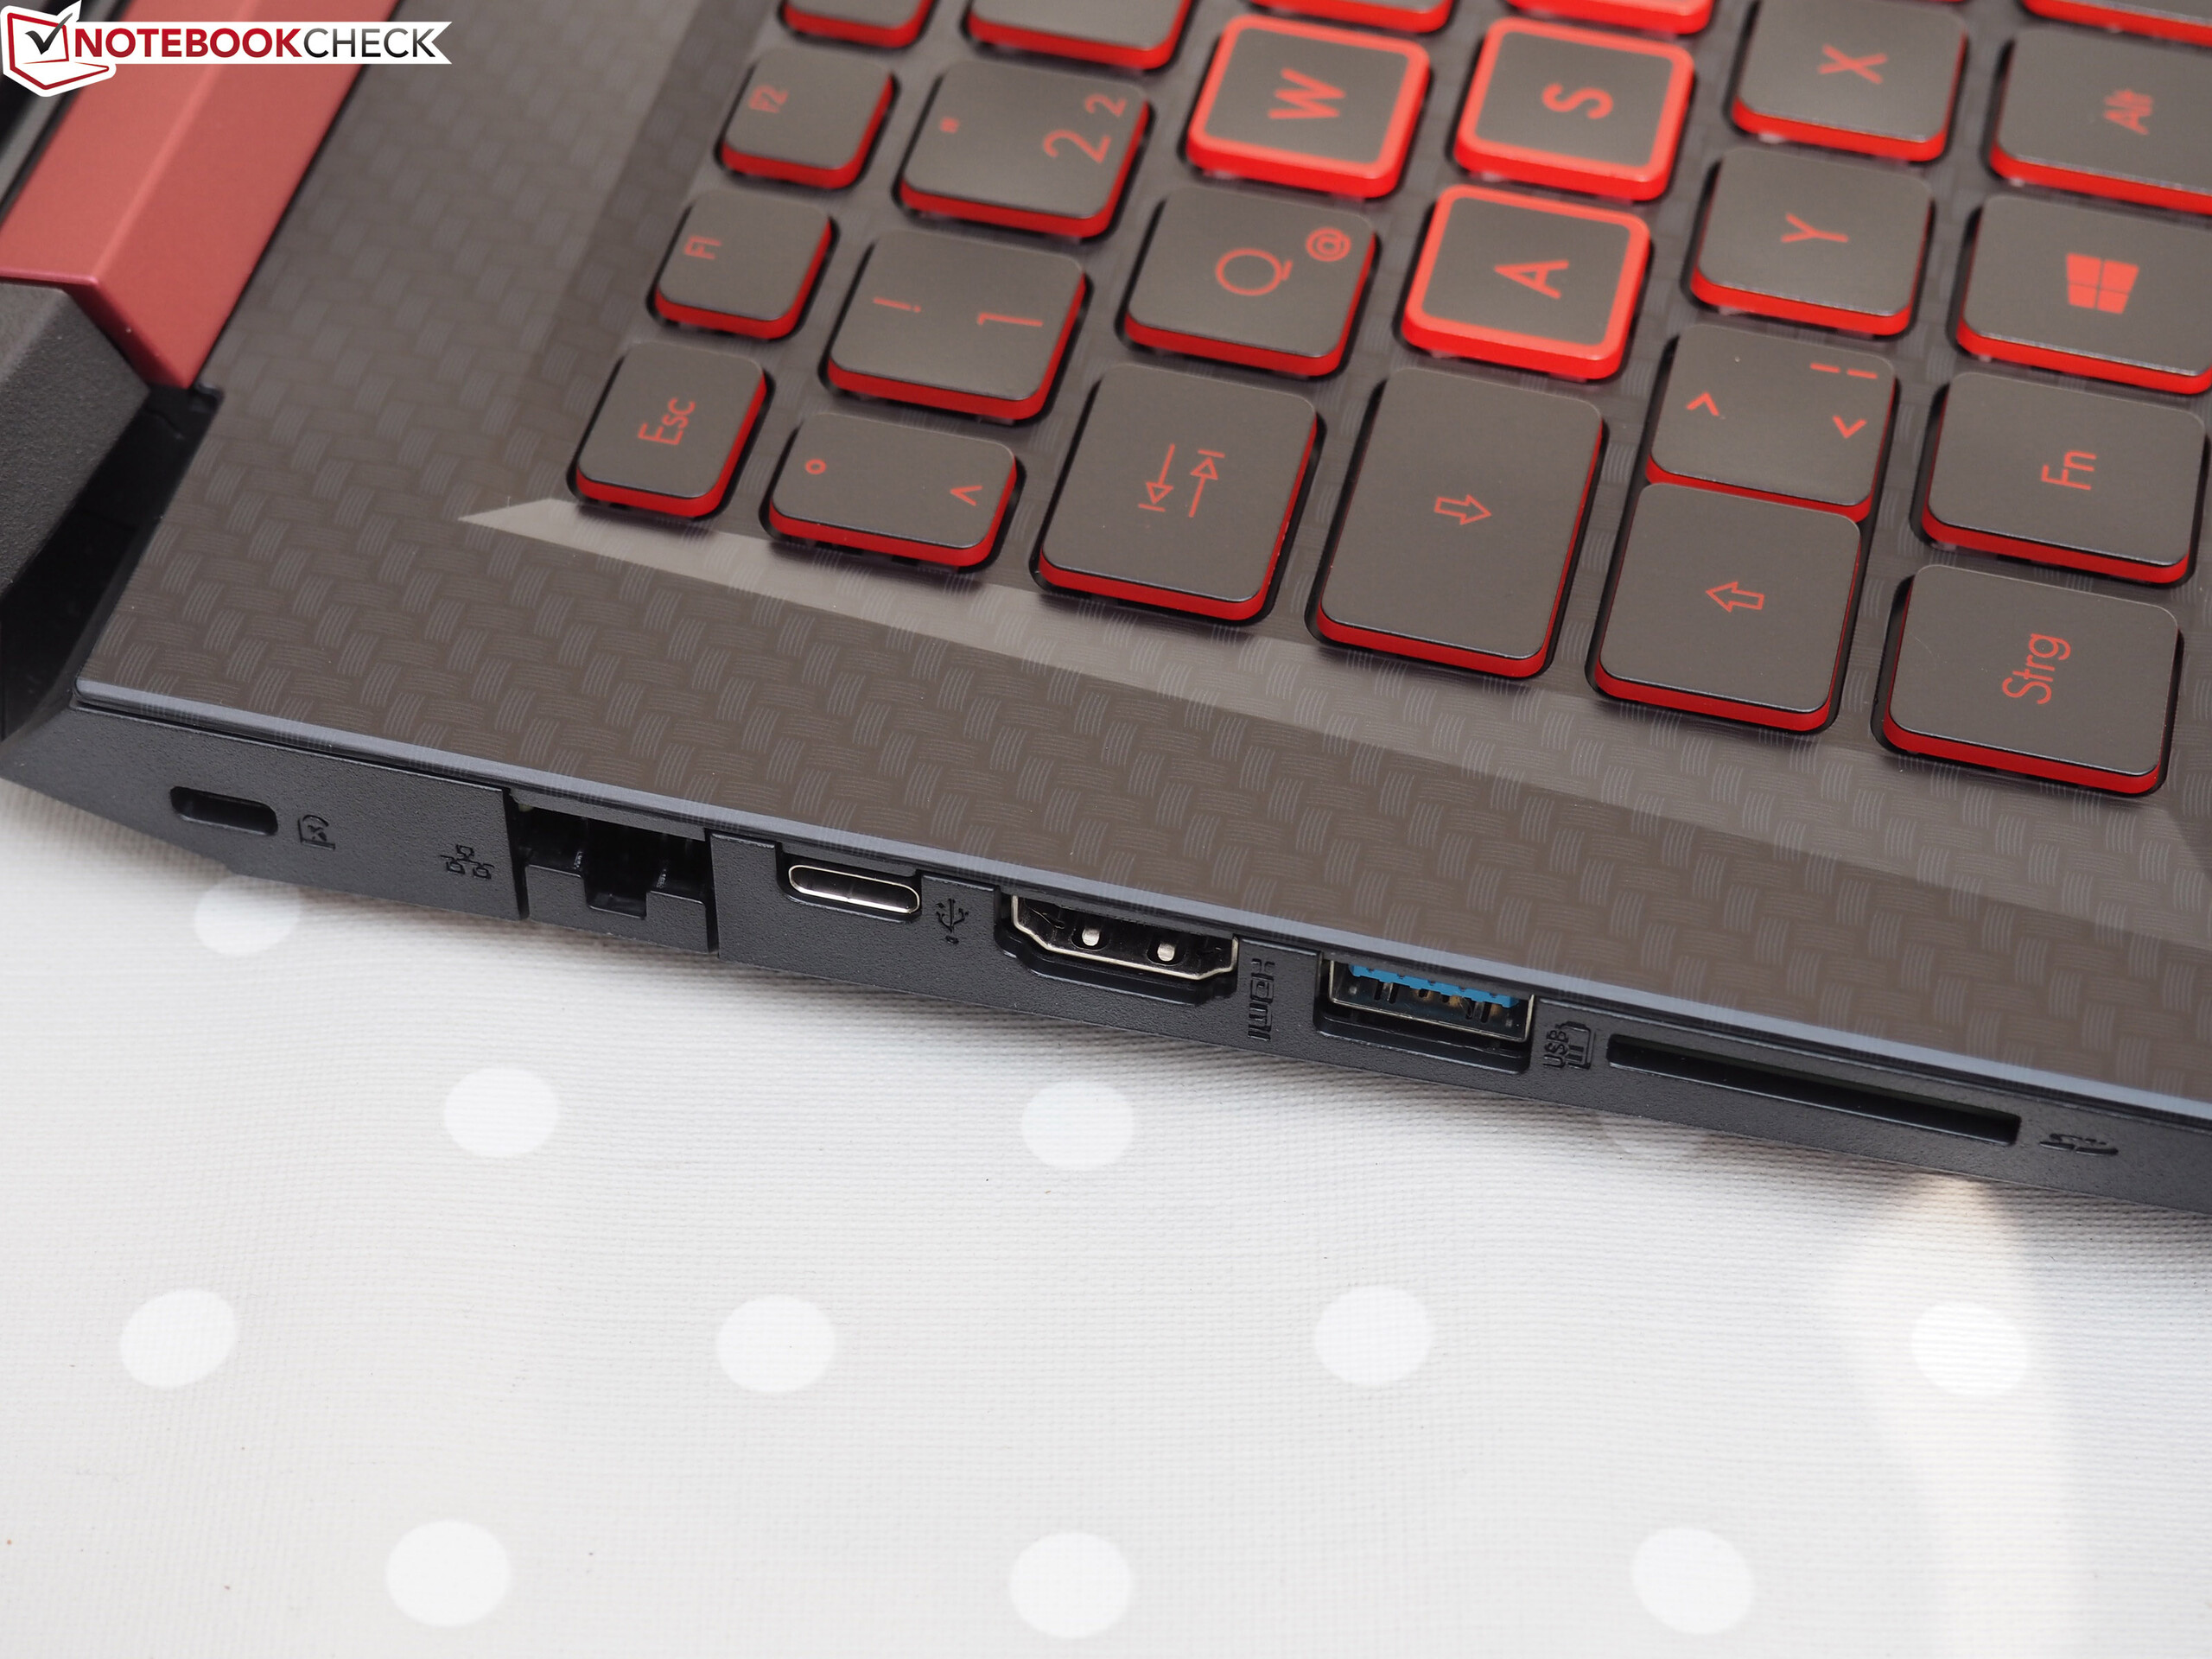
A carcaça de plástico, os dispositivos de entrada e a conectividade fraca (sem Thunderbolt 3, sem USB 3.1 Gen2, sem DisplayPort) não são bons, mas é difícil encontrar alternativas melhores nessa faixa de preço. No geral, o Nitro 5 está no mesmo nível do HP Omen 15, o Lenovo Legion Y530, e o Dell G5 15, que também estão com preços abaixo dos 1.500 Euros (~$1.760).
O maior destaque do Acer Nitro 5 é a excelente duração da bateria de 12,5 horas no máximo.
O Nitro 5 oferece uma boa relação preço-desempenho para gamers casuais.
Acer Nitro 5 AN515-52-74DR
- 08/08/2018 v6 (old)
Florian Glaser
Price comparison