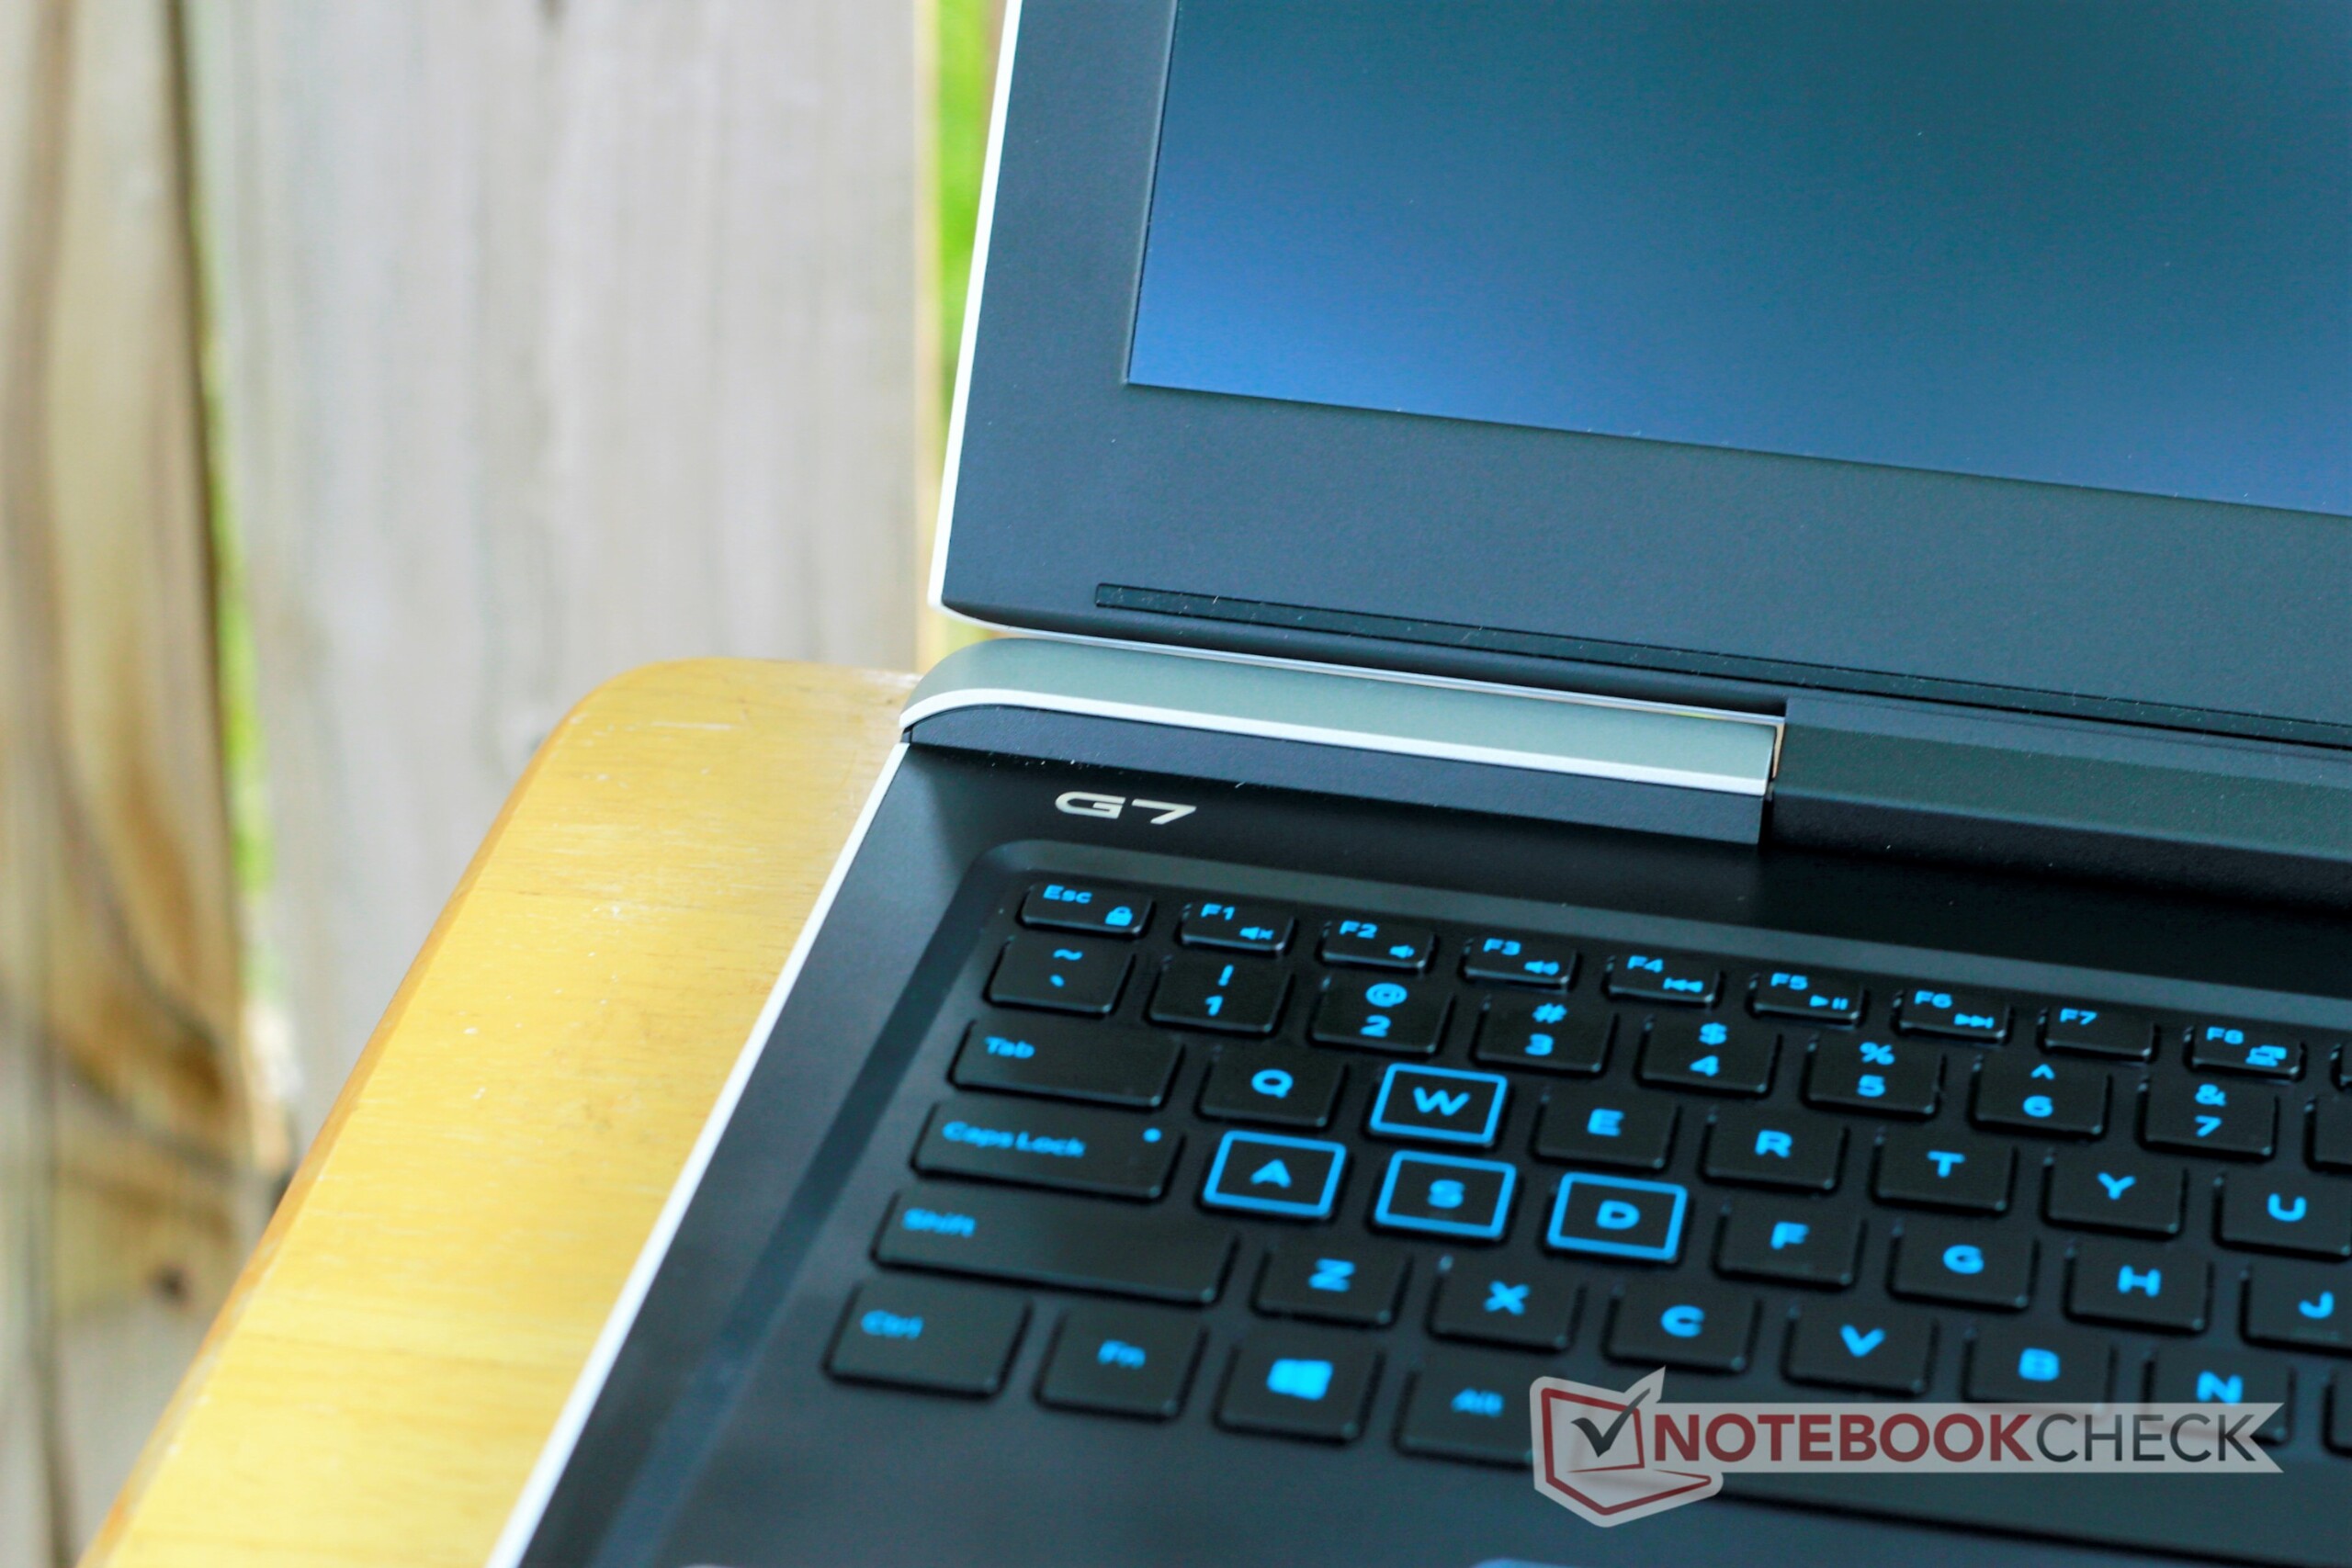
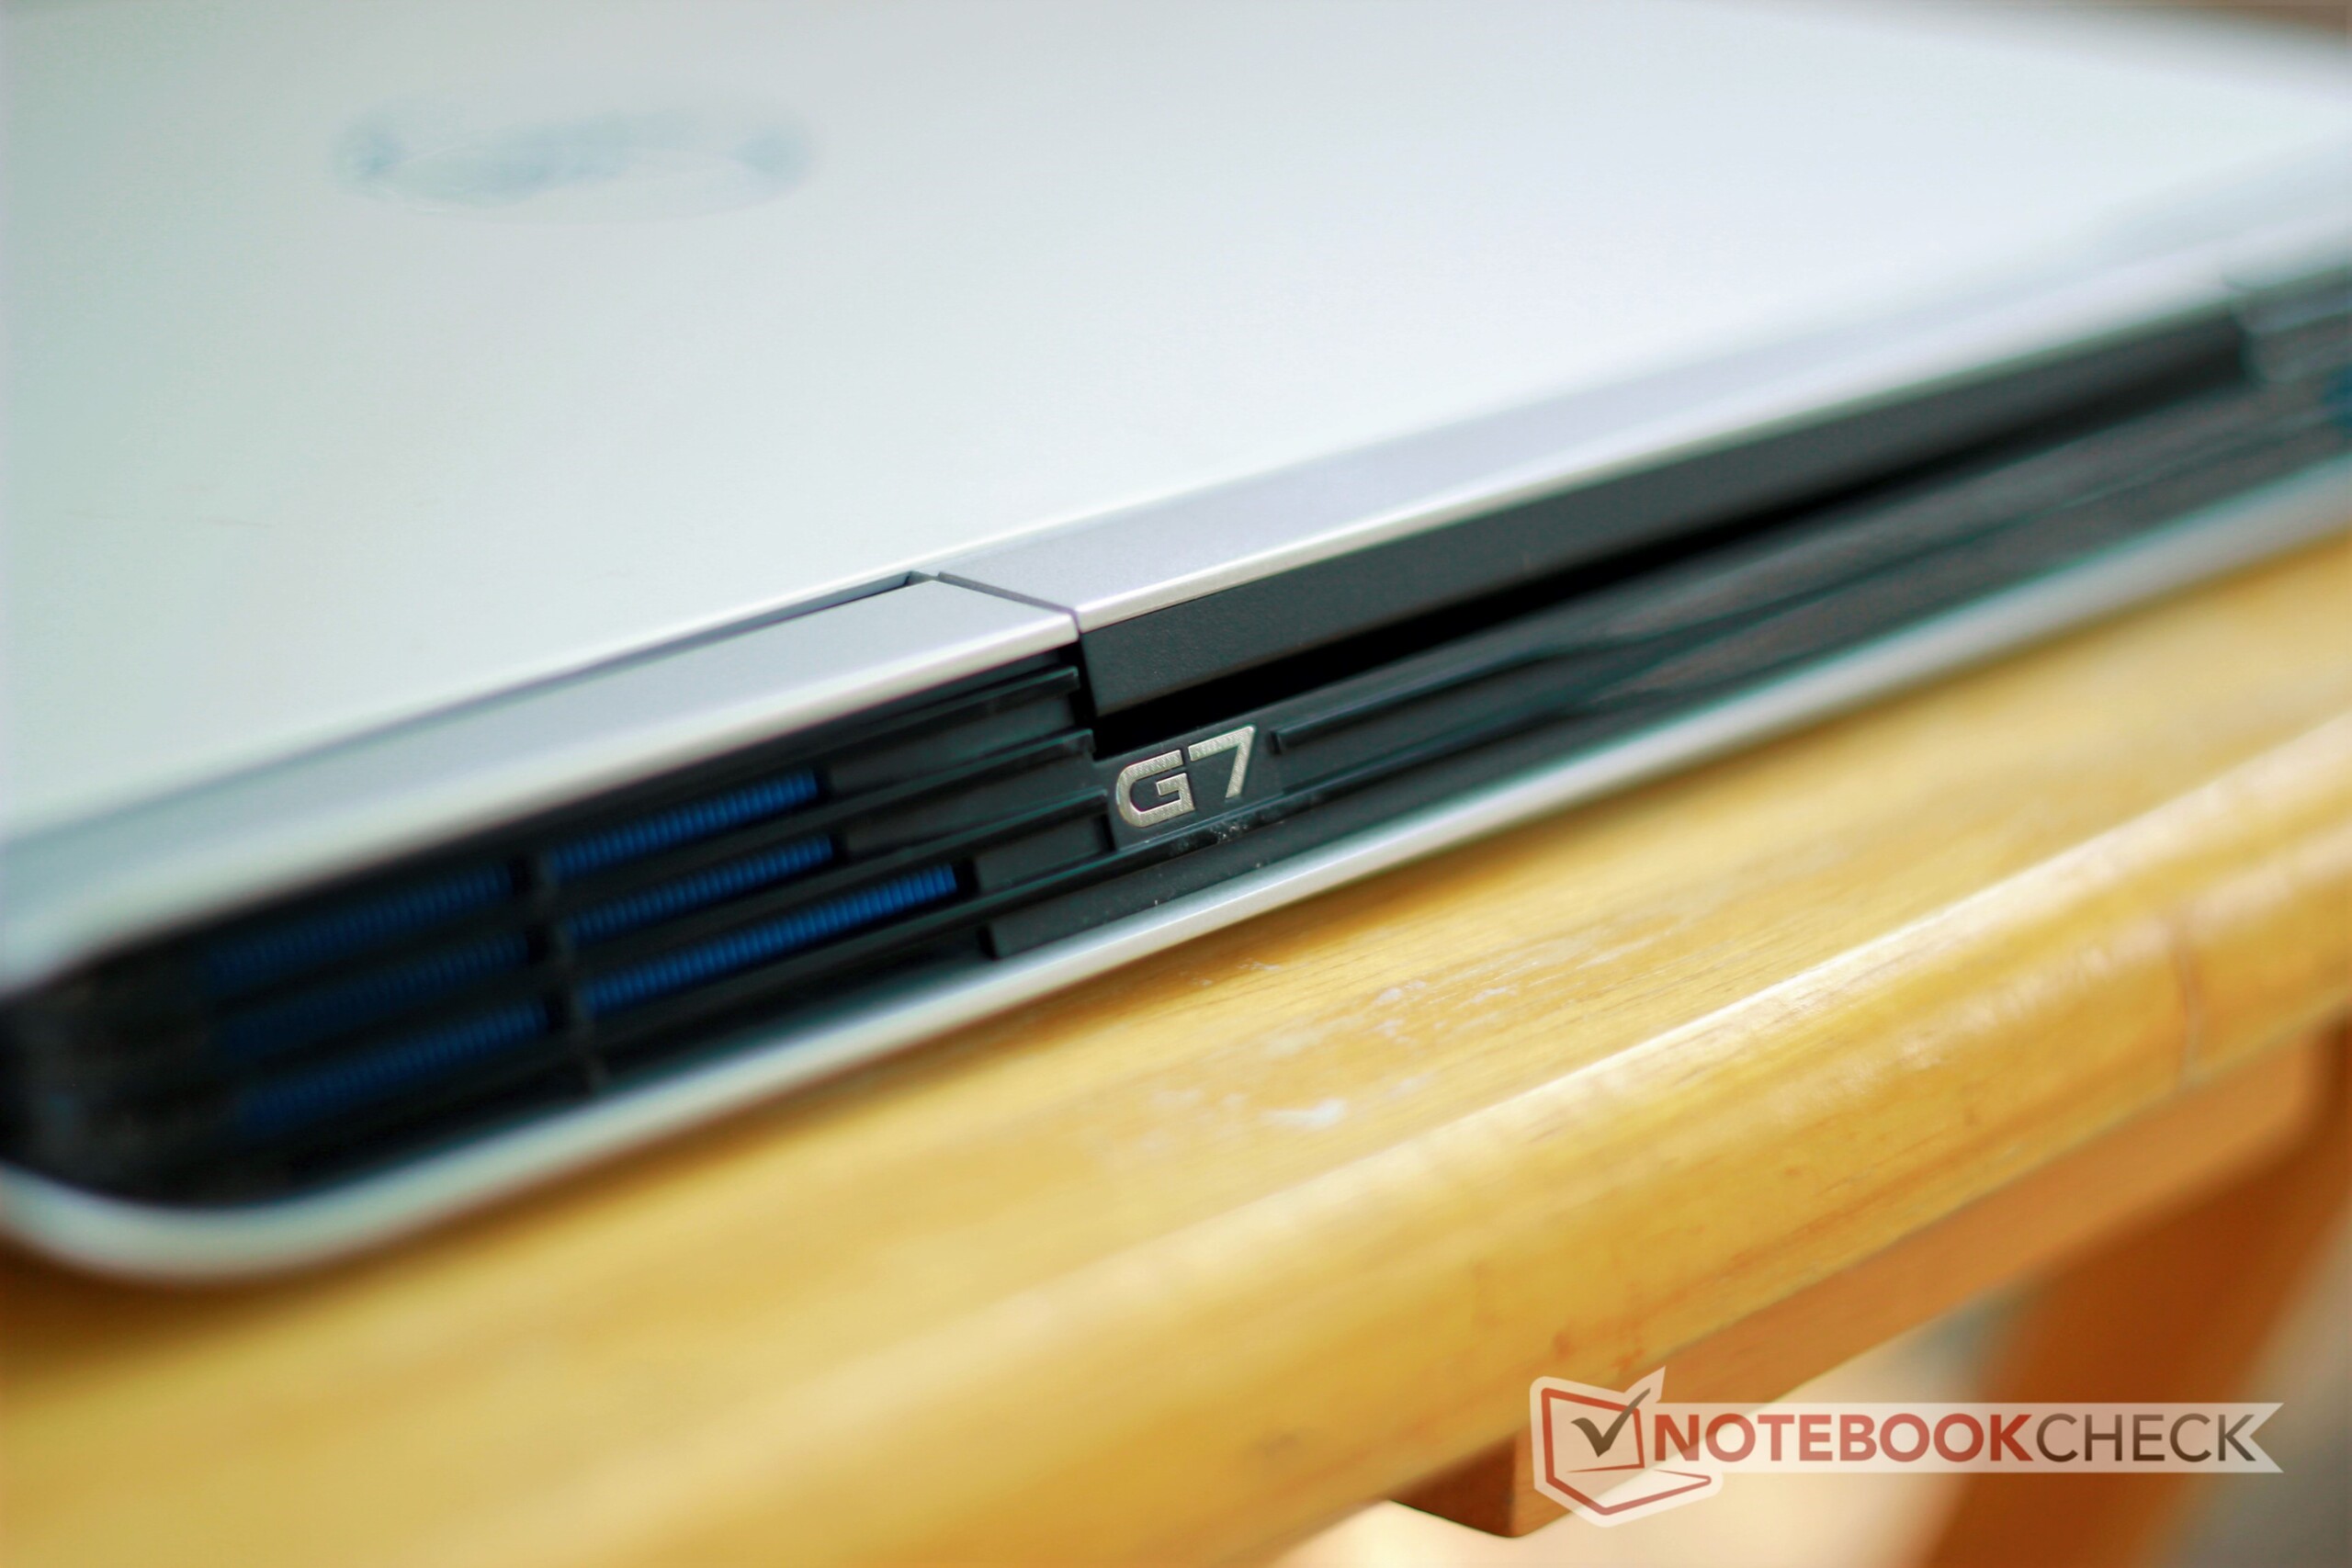
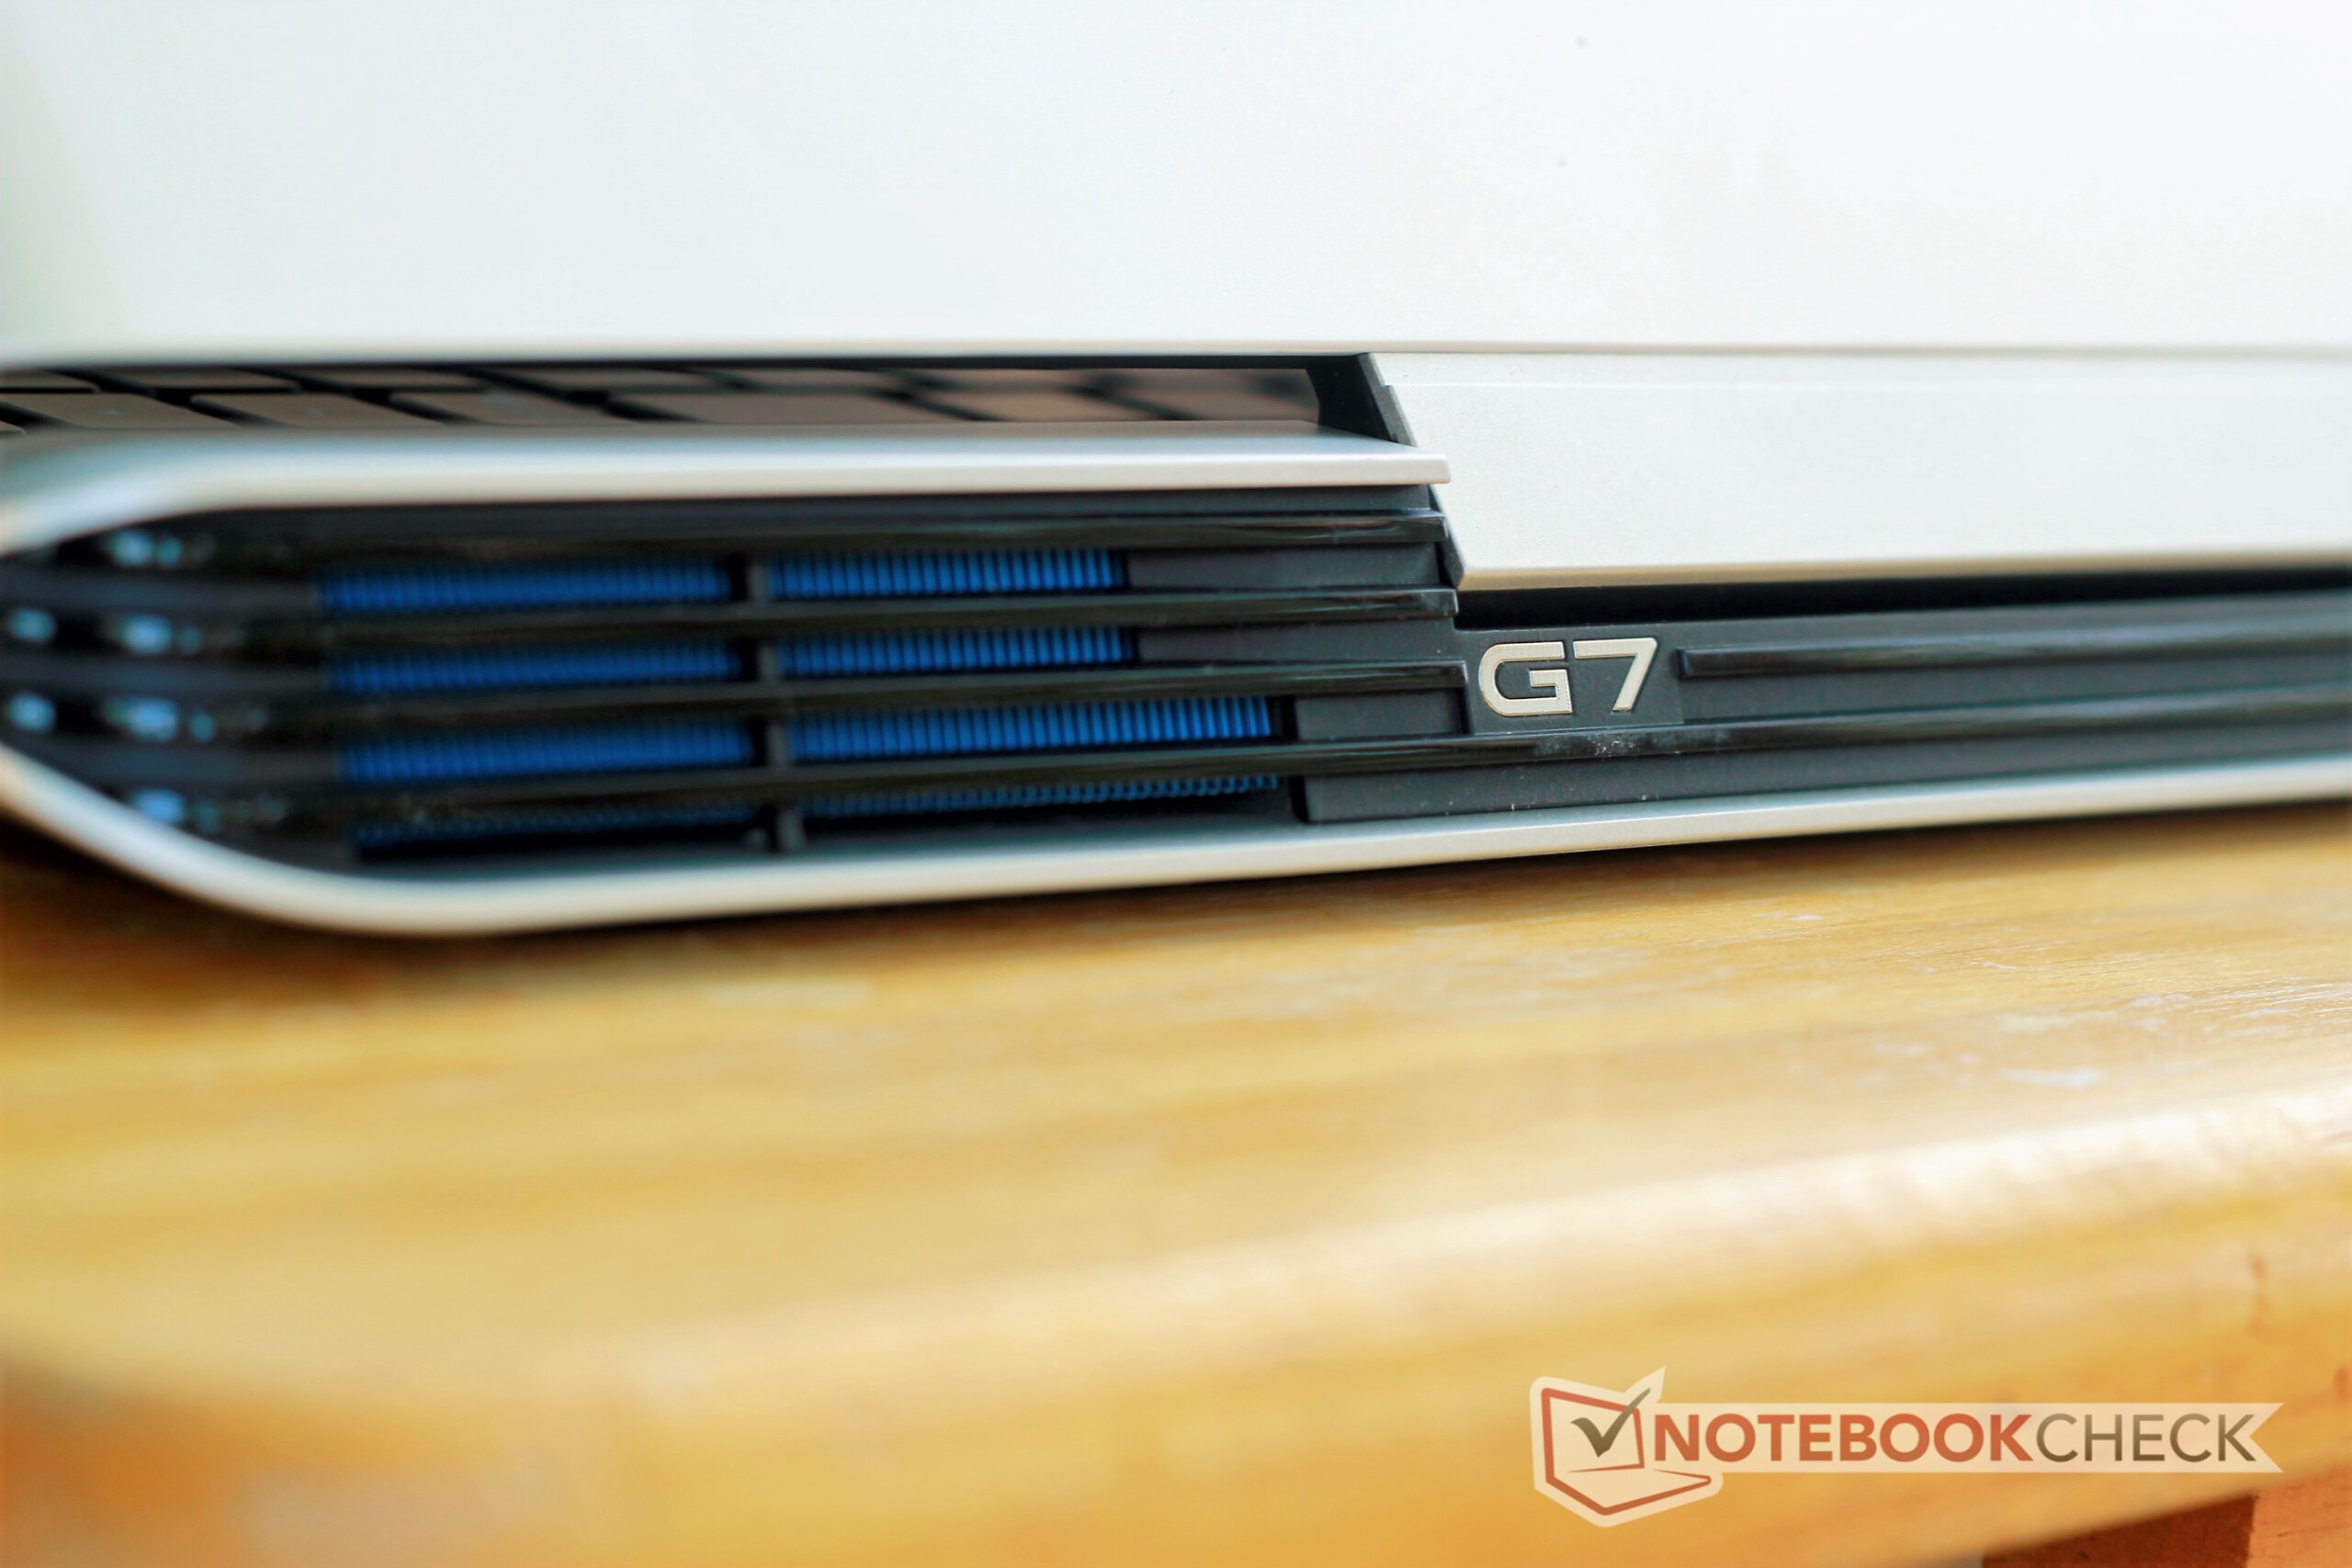
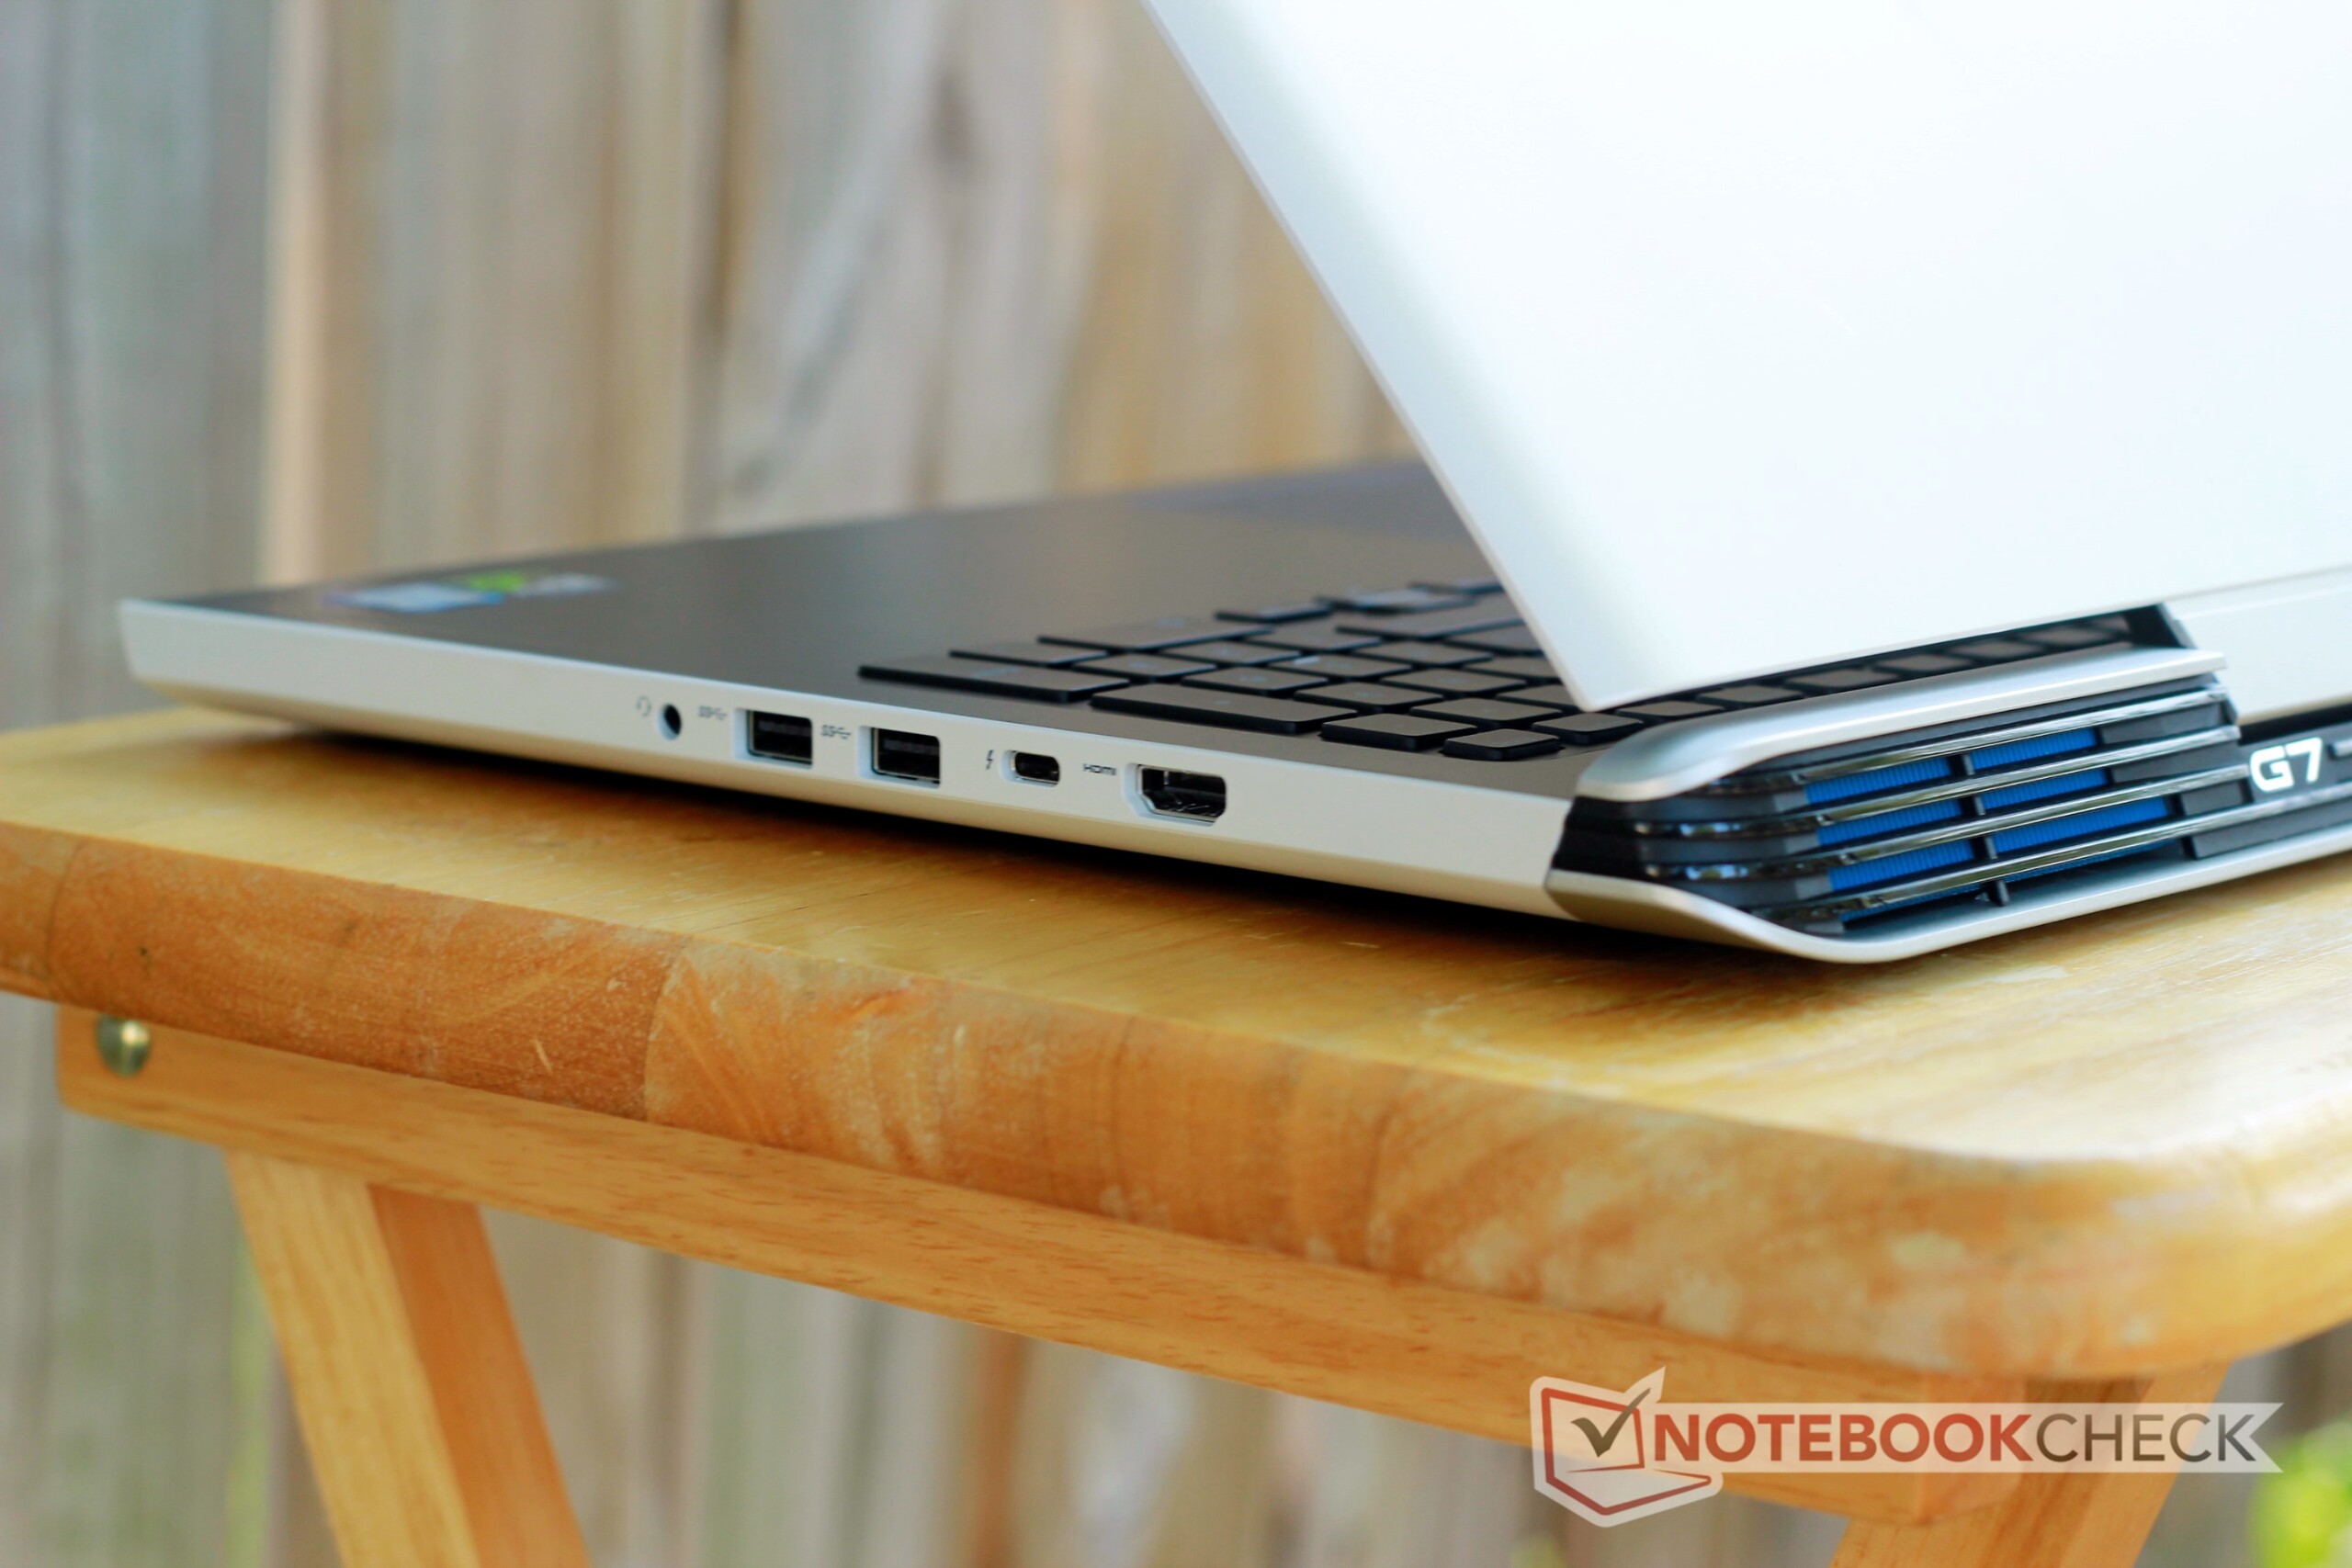
Breve Análise do Portátil Dell G7 15 (i7-8750H, GTX 1060 Max-Q)
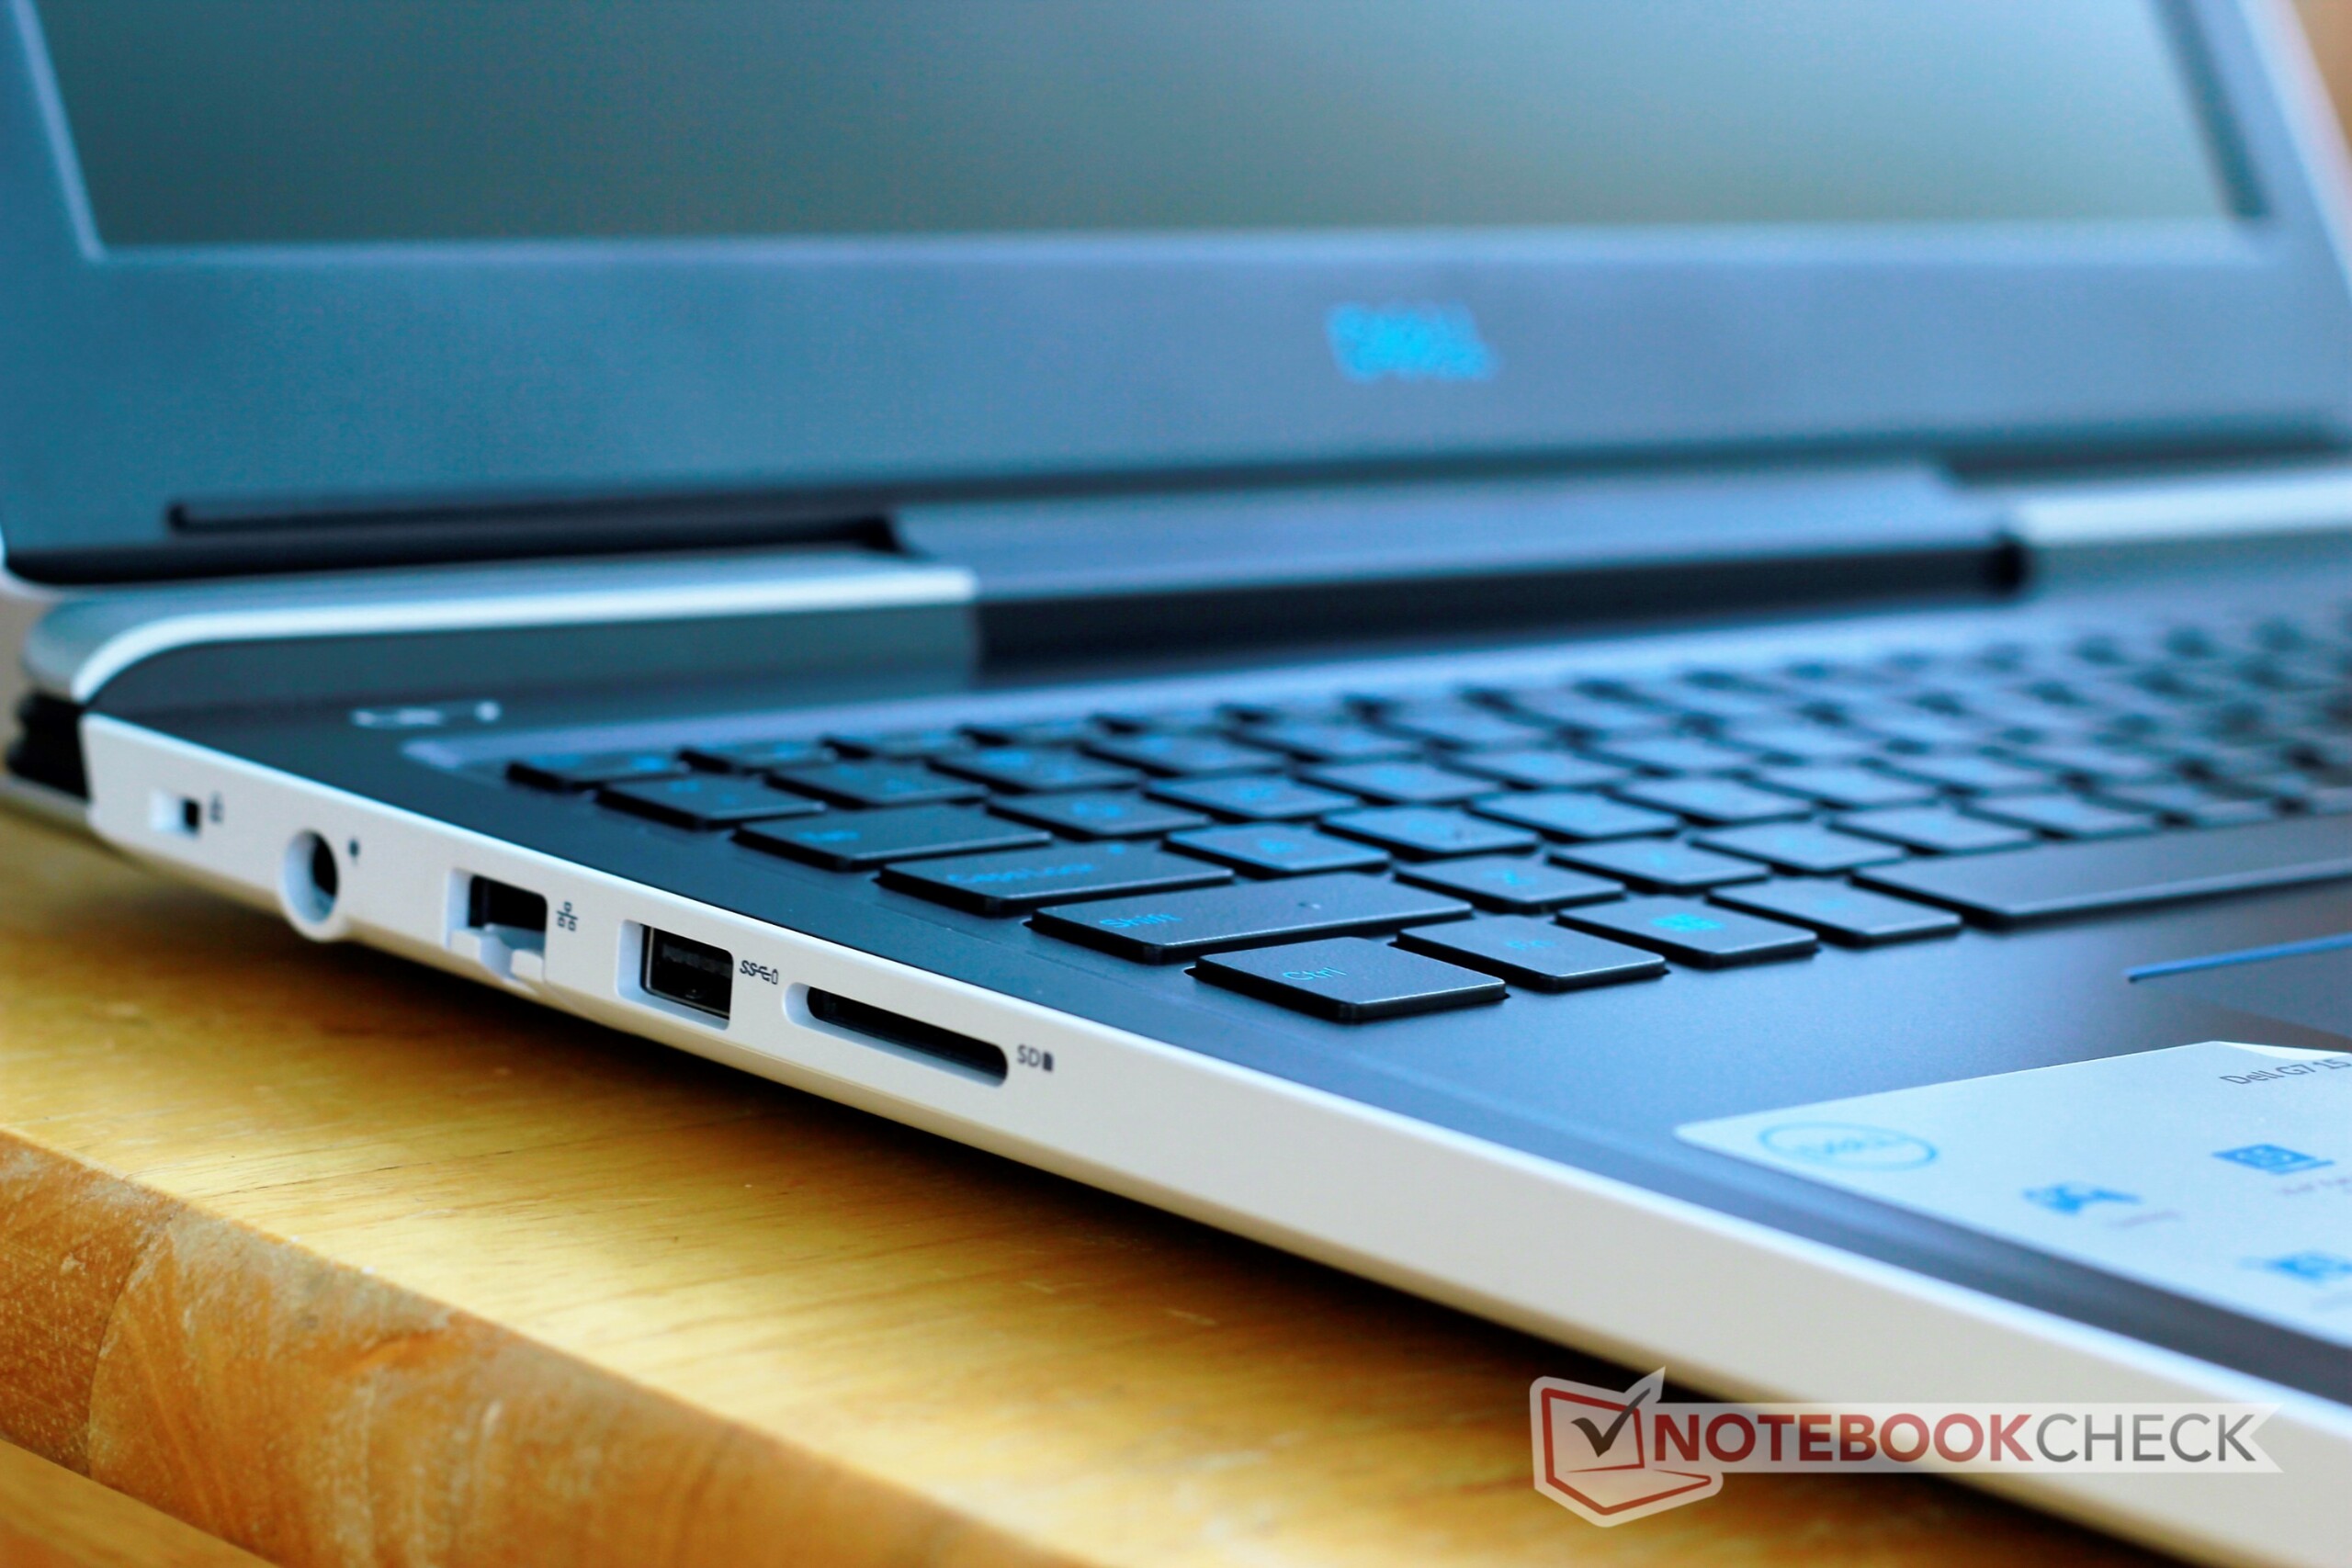

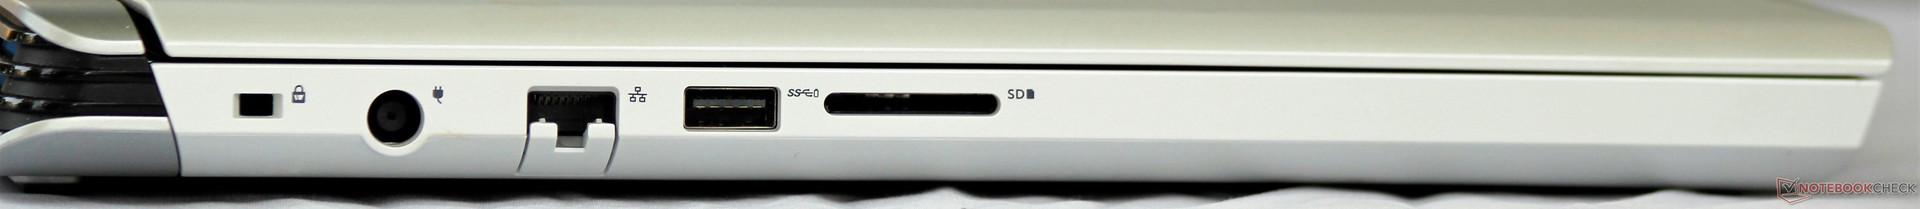
| SD Card Reader | |
| average JPG Copy Test (av. of 3 runs) | |
| Média da turma Gaming (20.9 - 210, n=54, últimos 2 anos) | |
| Asus FX503VM-EH73 (Toshiba Exceria Pro SDXC 64 GB UHS-II) | |
| Acer Predator Helios 300 PH317-52-51M6 (Toshiba Exceria Pro SDXC 64 GB UHS-II) | |
| HP Omen 15t-ce000 (Toshiba Exceria Pro SDXC 64 GB UHS-II) | |
| Dell Inspiron 15 7000 7577 (Toshiba Exceria Pro SDXC 64 GB UHS-II) | |
| Dell G7 15-7588 (Toshiba Exceria Pro SDXC 64 GB UHS-II) | |
| maximum AS SSD Seq Read Test (1GB) | |
| Média da turma Gaming (25.5 - 261, n=51, últimos 2 anos) | |
| HP Omen 15t-ce000 (Toshiba Exceria Pro SDXC 64 GB UHS-II) | |
| Asus FX503VM-EH73 (Toshiba Exceria Pro SDXC 64 GB UHS-II) | |
| Acer Predator Helios 300 PH317-52-51M6 (Toshiba Exceria Pro SDXC 64 GB UHS-II) | |
| Dell G7 15-7588 (Toshiba Exceria Pro SDXC 64 GB UHS-II) | |
| Dell Inspiron 15 7000 7577 (Toshiba Exceria Pro SDXC 64 GB UHS-II) | |
| |||||||||||||||||||||||||
iluminação: 89 %
iluminação com acumulador: 250.9 cd/m²
Contraste: 738:1 (Preto: 0.34 cd/m²)
ΔE ColorChecker Calman: 7.34 | ∀{0.5-29.43 Ø4.72}
calibrated: 4.42
ΔE Greyscale Calman: 6.8 | ∀{0.09-98 Ø4.97}
56% sRGB (Argyll 1.6.3 3D)
36% AdobeRGB 1998 (Argyll 1.6.3 3D)
39.2% AdobeRGB 1998 (Argyll 3D)
56.2% sRGB (Argyll 3D)
37.82% Display P3 (Argyll 3D)
Gamma: 2.164
CCT: 6780 K
| Dell G7 15-7588 LG Philips LGD053F, IPS, 15.6", 1920x1080 | Dell Inspiron 15 7000 7577 ID: LG Philips LGD053F, Name: 156WF6, Dell P/N: 4XK13, IPS, 15.6", 1920x1080 | Acer Predator Helios 300 PH317-52-51M6 LG Philips LP173WF4-SPF5 (LGD056D), IPS, 17.3", 1920x1080 | Asus FX503VM-EH73 AU Optronics B156HAN06.1, IPS, 15.6", 1920x1080 | HP Omen 15t-ce000 AU Optronics AUO23EB, IPS, 15.6", 3840x2160 | Lenovo Legion Y530-15ICH B156HAN02.1, IPS, 15.6", 1920x1080 | |
|---|---|---|---|---|---|---|
| Display | -2% | 64% | -1% | 70% | 1% | |
| Display P3 Coverage (%) | 37.82 | 37.07 -2% | 67.1 77% | 37.48 -1% | 66.1 75% | 38.31 1% |
| sRGB Coverage (%) | 56.2 | 55.6 -1% | 86.1 53% | 56.3 0% | 91.8 63% | 57.3 2% |
| AdobeRGB 1998 Coverage (%) | 39.2 | 38.32 -2% | 63 61% | 38.72 -1% | 66.9 71% | 39.58 1% |
| Response Times | 3% | 13% | -7% | 5% | -17% | |
| Response Time Grey 50% / Grey 80% * (ms) | 38.8 ? | 35.6 ? 8% | 36 ? 7% | 36.8 ? 5% | 37.6 ? 3% | 43.6 ? -12% |
| Response Time Black / White * (ms) | 26.8 ? | 27.6 ? -3% | 22 ? 18% | 31.6 ? -18% | 24.8 ? 7% | 32.4 ? -21% |
| PWM Frequency (Hz) | 122000 ? | |||||
| Screen | 12% | 31% | 14% | 38% | 10% | |
| Brightness middle (cd/m²) | 250.9 | 235.4 -6% | 365 45% | 235.9 -6% | 358.5 43% | 282.8 13% |
| Brightness (cd/m²) | 246 | 223 -9% | 341 39% | 235 -4% | 350 42% | 264 7% |
| Brightness Distribution (%) | 89 | 91 2% | 89 0% | 91 2% | 95 7% | 88 -1% |
| Black Level * (cd/m²) | 0.34 | 0.28 18% | 0.32 6% | 0.27 21% | 0.39 -15% | 0.42 -24% |
| Contrast (:1) | 738 | 841 14% | 1141 55% | 874 18% | 919 25% | 673 -9% |
| Colorchecker dE 2000 * | 7.34 | 5.6 24% | 6.51 11% | 4.81 34% | 4.6 37% | 4.93 33% |
| Colorchecker dE 2000 max. * | 28.66 | 20.3 29% | 12.32 57% | 21.55 25% | 8.5 70% | 17.65 38% |
| Colorchecker dE 2000 calibrated * | 4.42 | 2.9 34% | 4.07 8% | |||
| Greyscale dE 2000 * | 6.8 | 3.6 47% | 7.65 -13% | 3.1 54% | 5.2 24% | 3.8 44% |
| Gamma | 2.164 102% | 2.23 99% | 2.64 83% | 2.31 95% | 2.28 96% | 2.449 90% |
| CCT | 6780 96% | 7214 90% | 8066 81% | 6984 93% | 6410 101% | 6112 106% |
| Color Space (Percent of AdobeRGB 1998) (%) | 36 | 35.2 -2% | 56 56% | 36 0% | 66.9 86% | 36 0% |
| Color Space (Percent of sRGB) (%) | 56 | 55.4 -1% | 86 54% | 56 0% | 91.8 64% | 57 2% |
| Média Total (Programa/Configurações) | 4% /
8% | 36% /
35% | 2% /
9% | 38% /
40% | -2% /
5% |
* ... menor é melhor
Exibir tempos de resposta
| ↔ Tempo de resposta preto para branco | ||
|---|---|---|
| 26.8 ms ... ascensão ↗ e queda ↘ combinadas | ↗ 14.4 ms ascensão | 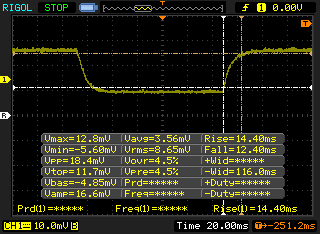 |
| ↘ 12.4 ms queda | ||
| A tela mostra taxas de resposta relativamente lentas em nossos testes e pode ser muito lenta para os jogadores. Em comparação, todos os dispositivos testados variam de 0.1 (mínimo) a 240 (máximo) ms. » 67 % de todos os dispositivos são melhores. Isso significa que o tempo de resposta medido é pior que a média de todos os dispositivos testados (19.8 ms). | ||
| ↔ Tempo de resposta 50% cinza a 80% cinza | ||
| 38.8 ms ... ascensão ↗ e queda ↘ combinadas | ↗ 16 ms ascensão | 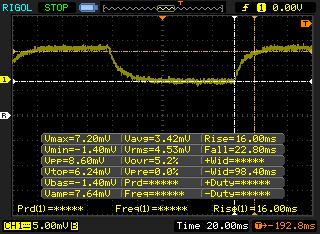 |
| ↘ 22.8 ms queda | ||
| A tela mostra taxas de resposta lentas em nossos testes e será insatisfatória para os jogadores. Em comparação, todos os dispositivos testados variam de 0.165 (mínimo) a 636 (máximo) ms. » 58 % de todos os dispositivos são melhores. Isso significa que o tempo de resposta medido é pior que a média de todos os dispositivos testados (31 ms). | ||
Cintilação da tela / PWM (modulação por largura de pulso)
| Tela tremeluzindo / PWM não detectado |  | ||
[pwm_comparison] Em comparação: 52 % de todos os dispositivos testados não usam PWM para escurecer a tela. Se PWM foi detectado, uma média de 7772 (mínimo: 5 - máximo: 343500) Hz foi medida. | |||

| wPrime 2.10 - 1024m | |
| Asus ROG Strix GL702ZC-GC204T | |
| Dell Inspiron 15 7000 7577 | |
| Acer Nitro 5 (AMD Ryzen & Polaris) | |
| Asus FX503VM-EH73 | |
| Média Intel Core i7-8750H (125.5 - 180.5, n=6) | |
| Dell G7 15-7588 | |
| Média da turma Gaming (33 - 210, n=5, últimos 2 anos) | |
* ... menor é melhor
| PCMark 8 Home Score Accelerated v2 | 3968 pontos | |
| PCMark 8 Work Score Accelerated v2 | 5410 pontos | |
| PCMark 10 Score | 5285 pontos | |
Ajuda | ||
| Dell G7 15-7588 SK hynix SC311 SATA | Dell Inspiron 15 7000 7577 Samsung PM961 MZVLW256HEHP | Acer Predator Helios 300 PH317-52-51M6 Hynix HFS128G39TND | Asus FX503VM-EH73 SanDisk SD8SN8U128G1002 | HP Omen 15t-ce000 Samsung PM961 NVMe MZVLW128HEGR | Lenovo Legion Y530-15ICH Toshiba KBG30ZMT128G | |
|---|---|---|---|---|---|---|
| AS SSD | 227% | -3% | 19% | 146% | -23% | |
| Copy Game MB/s (MB/s) | 223.2 | 382.5 71% | 736 230% | |||
| Copy Program MB/s (MB/s) | 126.9 | 274.8 117% | 195.4 54% | |||
| Copy ISO MB/s (MB/s) | 460.8 | 814 77% | 1087 136% | |||
| Score Total (Points) | 528 | 2405 355% | 811 54% | 798 51% | 1515 187% | 838 59% |
| Score Write (Points) | 181 | 594 228% | 196 8% | 178 -2% | 361 99% | 128 -29% |
| Score Read (Points) | 233 | 1241 433% | 414 78% | 411 76% | 789 239% | 497 113% |
| Access Time Write * (ms) | 0.068 | 0.037 46% | 0.259 -281% | 0.09 -32% | 0.034 50% | 0.287 -322% |
| Access Time Read * (ms) | 0.161 | 0.058 64% | 0.17 -6% | 0.071 56% | 0.626 -289% | |
| 4K-64 Write (MB/s) | 99.6 | 375.8 277% | 120.1 21% | 95.5 -4% | 175.9 77% | 78.9 -21% |
| 4K-64 Read (MB/s) | 158.8 | 929 485% | 336.6 112% | 343.4 116% | 568 258% | 335.3 111% |
| 4K Write (MB/s) | 59.8 | 100.2 68% | 62.7 5% | 46.48 -22% | 111.2 86% | 35.74 -40% |
| 4K Read (MB/s) | 23.66 | 46.95 98% | 26.5 12% | 20.44 -14% | 43.09 82% | 38.71 64% |
| Seq Write (MB/s) | 220.3 | 1181 436% | 128.2 -42% | 328.4 49% | 743 237% | 131.6 -40% |
| Seq Read (MB/s) | 506 | 2652 424% | 513 1% | 476.3 -6% | 1774 251% | 1231 143% |
* ... menor é melhor

| 3DMark 11 Performance | 13296 pontos | |
| 3DMark Cloud Gate Standard Score | 32658 pontos | |
| 3DMark Fire Strike Score | 9936 pontos | |
Ajuda | ||
| Rise of the Tomb Raider | |
| 1920x1080 Very High Preset AA:FX AF:16x (classificar por valor) | |
| Dell G7 15-7588 | |
| Asus FX503VM-EH73 | |
| Apple MacBook Pro 15 2018 (2.6 GHz, 560X) | |
| Acer Swift 3 SF315-41G-R6BR | |
| Dell G3 15 3579 | |
| Média NVIDIA GeForce GTX 1060 Max-Q (45.3 - 66.4, n=8) | |
| 1920x1080 High Preset AA:FX AF:4x (classificar por valor) | |
| Dell G7 15-7588 | |
| Apple MacBook Pro 15 2018 (2.6 GHz, 560X) | |
| Acer Swift 3 SF315-41G-R6BR | |
| Dell G3 15 3579 | |
| Média NVIDIA GeForce GTX 1060 Max-Q (63 - 73.3, n=7) | |
| 1366x768 Medium Preset AF:2x (classificar por valor) | |
| Dell G7 15-7588 | |
| Acer Swift 3 SF315-41G-R6BR | |
| Dell G3 15 3579 | |
| Média NVIDIA GeForce GTX 1060 Max-Q (111 - 133.3, n=6) | |
| 1024x768 Lowest Preset (classificar por valor) | |
| Dell G7 15-7588 | |
| Acer Swift 3 SF315-41G-R6BR | |
| Dell G3 15 3579 | |
| Média NVIDIA GeForce GTX 1060 Max-Q (148.1 - 203, n=5) | |
| baixo | média | alto | ultra | |
|---|---|---|---|---|
| The Witcher 3 (2015) | 189 | 125 | 62 | 37 |
| Rise of the Tomb Raider (2016) | 203 | 130 | 70 | 57 |
| Final Fantasy XV Benchmark (2018) | 109 | 59 | 43 | |
| Kingdom Come: Deliverance (2018) | 60 | 58 | 56 | 41 |
Barulho
| Ocioso |
| 29 / 29 / 29.2 dB |
| Carga |
| 40.6 / 49.8 dB |
 | ||
30 dB silencioso 40 dB(A) audível 50 dB(A) ruidosamente alto |
||
min: | ||
| Dell G7 15-7588 GeForce GTX 1060 Max-Q, i7-8750H, SK hynix SC311 SATA | Dell Inspiron 15 7000 7577 GeForce GTX 1060 Max-Q, i5-7300HQ, Samsung PM961 MZVLW256HEHP | Acer Predator Helios 300 PH317-52-51M6 GeForce GTX 1050 Ti Mobile, i5-8300H, Hynix HFS128G39TND | Asus FX503VM-EH73 GeForce GTX 1060 Mobile, i7-7700HQ, SanDisk SD8SN8U128G1002 | HP Omen 15t-ce000 GeForce GTX 1060 Max-Q, i7-7700HQ, Samsung PM961 NVMe MZVLW128HEGR | Lenovo Legion Y530-15ICH GeForce GTX 1050 Ti Mobile, i5-8300H, Toshiba KBG30ZMT128G | |
|---|---|---|---|---|---|---|
| Noise | 9% | -4% | -1% | 2% | 6% | |
| desligado / ambiente * (dB) | 28.1 | 28 -0% | 29 -3% | 27.8 1% | 28.2 -0% | 28 -0% |
| Idle Minimum * (dB) | 29 | 28 3% | 29 -0% | 29.6 -2% | 30.4 -5% | 28 3% |
| Idle Average * (dB) | 29 | 28 3% | 31 -7% | 29.6 -2% | 30.4 -5% | 28 3% |
| Idle Maximum * (dB) | 29.2 | 28 4% | 33 -13% | 29.6 -1% | 30.5 -4% | 28.5 2% |
| Load Average * (dB) | 40.6 | 30.3 25% | 45 -11% | 37.3 8% | 38.5 5% | 34.9 14% |
| Witcher 3 ultra * (dB) | 49.8 | 39.5 21% | 45 10% | 49.8 -0% | 37.6 24% | 40 20% |
| Load Maximum * (dB) | 49.8 | 46.5 7% | 51 -2% | 53.7 -8% | 49 2% | 49.6 -0% |
* ... menor é melhor
(-) A temperatura máxima no lado superior é 48.6 °C / 119 F, em comparação com a média de 40.4 °C / 105 F , variando de 21.2 a 68.8 °C para a classe Gaming.
(-) A parte inferior aquece até um máximo de 51.4 °C / 125 F, em comparação com a média de 43.2 °C / 110 F
(+) Em uso inativo, a temperatura média para o lado superior é 22.7 °C / 73 F, em comparação com a média do dispositivo de 33.9 °C / ### class_avg_f### F.
(+) Jogando The Witcher 3, a temperatura média para o lado superior é 30.7 °C / 87 F, em comparação com a média do dispositivo de 33.9 °C / ## #class_avg_f### F.
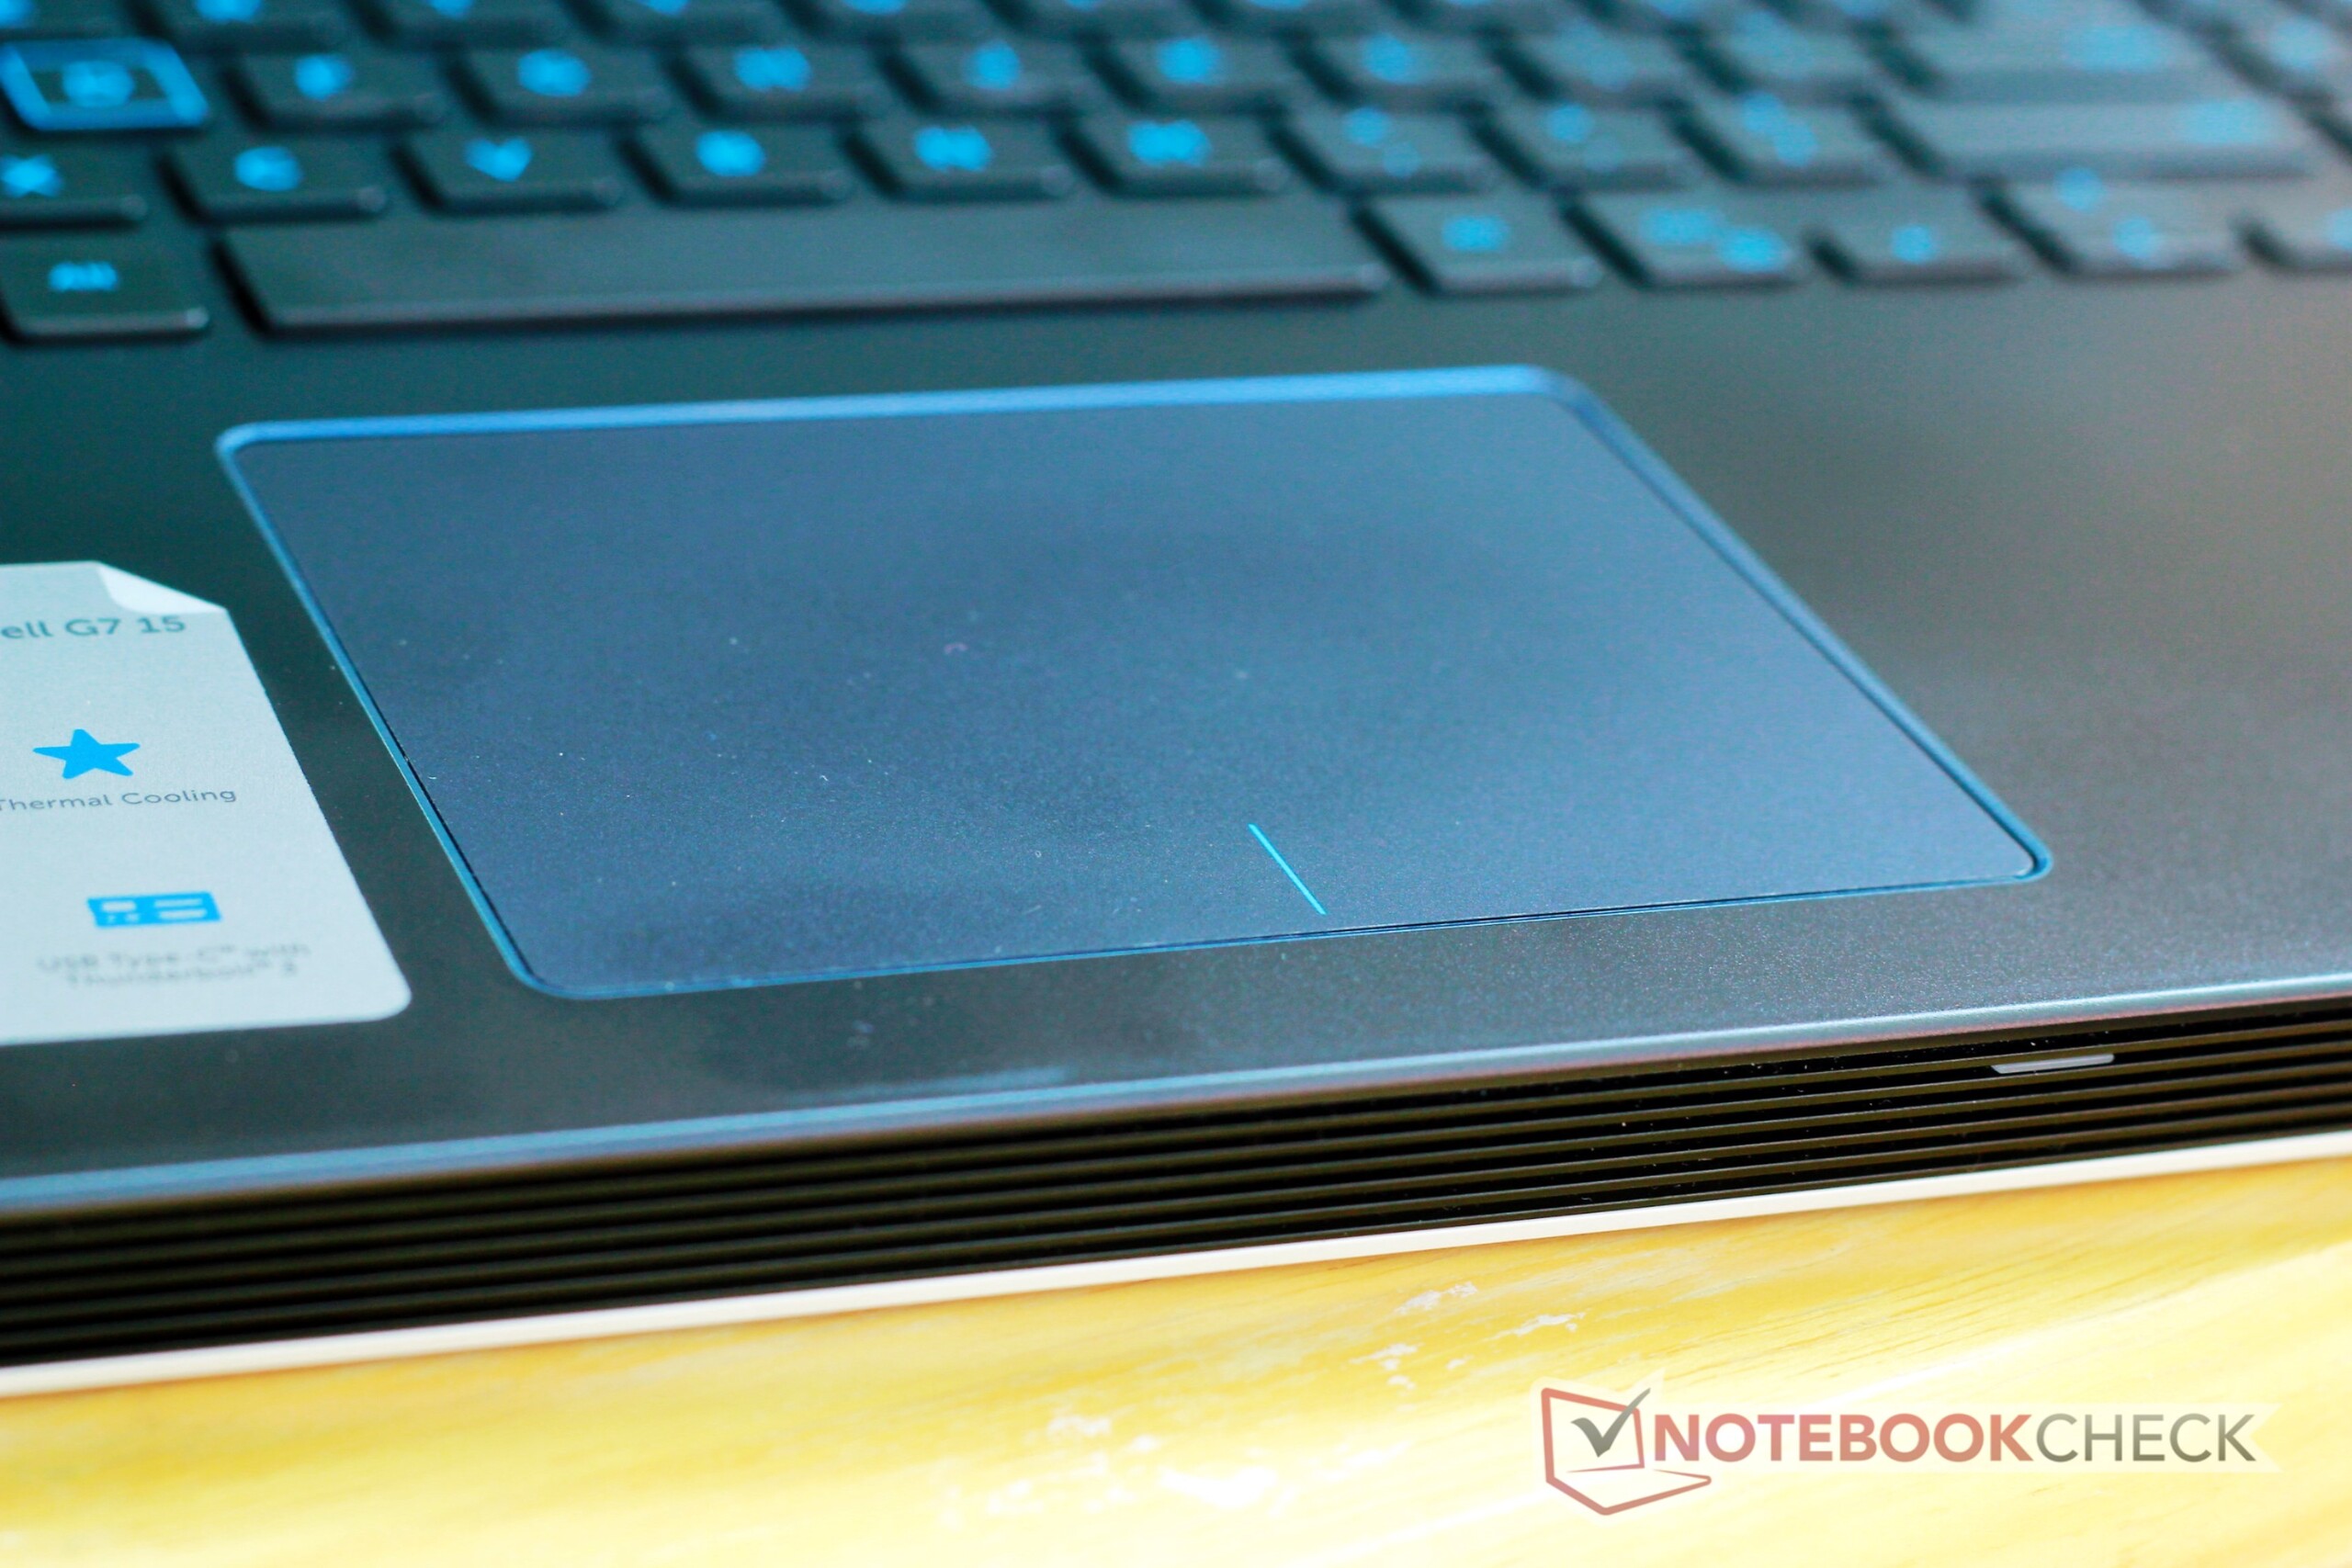
(+) Os apoios para as mãos e o touchpad são mais frios que a temperatura da pele, com um máximo de 29.4 °C / 84.9 F e, portanto, são frios ao toque.
(±) A temperatura média da área do apoio para as mãos de dispositivos semelhantes foi 28.8 °C / 83.8 F (-0.6 °C / -1.1 F).
Dell G7 15-7588 análise de áudio
(±) | o volume do alto-falante é médio, mas bom (###valor### dB)
Graves 100 - 315Hz
(-) | quase nenhum baixo - em média 16.7% menor que a mediana
(±) | a linearidade dos graves é média (11.8% delta para a frequência anterior)
Médios 400 - 2.000 Hz
(+) | médios equilibrados - apenas 4.6% longe da mediana
(±) | a linearidade dos médios é média (7.1% delta para frequência anterior)
Altos 2 - 16 kHz
(+) | agudos equilibrados - apenas 4.8% longe da mediana
(±) | a linearidade dos máximos é média (10.7% delta para frequência anterior)
Geral 100 - 16.000 Hz
(±) | a linearidade do som geral é média (21.1% diferença em relação à mediana)
Comparado com a mesma classe
» 76% de todos os dispositivos testados nesta classe foram melhores, 4% semelhantes, 20% piores
» O melhor teve um delta de 6%, a média foi 18%, o pior foi 132%
Comparado com todos os dispositivos testados
» 58% de todos os dispositivos testados foram melhores, 7% semelhantes, 35% piores
» O melhor teve um delta de 4%, a média foi 24%, o pior foi 134%
Lenovo Legion Y530-15ICH análise de áudio
(±) | o volume do alto-falante é médio, mas bom (###valor### dB)
Graves 100 - 315Hz
(±) | graves reduzidos - em média 14% menor que a mediana
(±) | a linearidade dos graves é média (14.1% delta para a frequência anterior)
Médios 400 - 2.000 Hz
(+) | médios equilibrados - apenas 1.5% longe da mediana
(+) | médios são lineares (6.7% delta para frequência anterior)
Altos 2 - 16 kHz
(+) | agudos equilibrados - apenas 4.8% longe da mediana
(±) | a linearidade dos máximos é média (10% delta para frequência anterior)
Geral 100 - 16.000 Hz
(±) | a linearidade do som geral é média (18.9% diferença em relação à mediana)
Comparado com a mesma classe
» 63% de todos os dispositivos testados nesta classe foram melhores, 8% semelhantes, 29% piores
» O melhor teve um delta de 6%, a média foi 18%, o pior foi 132%
Comparado com todos os dispositivos testados
» 44% de todos os dispositivos testados foram melhores, 8% semelhantes, 48% piores
» O melhor teve um delta de 4%, a média foi 24%, o pior foi 134%
| desligado | |
| Ocioso | |
| Carga |
|
Key:
min: | |
| Dell G7 15-7588 i7-8750H, GeForce GTX 1060 Max-Q, SK hynix SC311 SATA, IPS, 1920x1080, 15.6" | Schenker XMG Neo 15 i7-8750H, GeForce GTX 1060 Mobile, Samsung SSD 970 Pro 1TB, IPS, 1920x1080, 15.6" | Asus Strix GL703GM-DS74 i7-8750H, GeForce GTX 1060 Mobile, Samsung PM961 MZVLW256HEHP, TN LED, 1920x1080, 17.3" | Dell Inspiron 15 7000 7577 i5-7300HQ, GeForce GTX 1060 Max-Q, Samsung PM961 MZVLW256HEHP, IPS, 1920x1080, 15.6" | Acer Predator Helios 300 PH317-52-51M6 i5-8300H, GeForce GTX 1050 Ti Mobile, Hynix HFS128G39TND, IPS, 1920x1080, 17.3" | Asus FX503VM-EH73 i7-7700HQ, GeForce GTX 1060 Mobile, SanDisk SD8SN8U128G1002, IPS, 1920x1080, 15.6" | HP Omen 15t-ce000 i7-7700HQ, GeForce GTX 1060 Max-Q, Samsung PM961 NVMe MZVLW128HEGR, IPS, 3840x2160, 15.6" | Lenovo Legion Y530-15ICH i5-8300H, GeForce GTX 1050 Ti Mobile, Toshiba KBG30ZMT128G, IPS, 1920x1080, 15.6" | |
|---|---|---|---|---|---|---|---|---|
| Power Consumption | -45% | -127% | 10% | -8% | -47% | -80% | -6% | |
| Idle Minimum * (Watt) | 5.5 | 10 -82% | 18.88 -243% | 7.1 -29% | 6 -9% | 12.8 -133% | 15.4 -180% | 4.5 18% |
| Idle Average * (Watt) | 7.6 | 13 -71% | 24.36 -221% | 7.6 -0% | 9 -18% | 15.4 -103% | 22.4 -195% | 10 -32% |
| Idle Maximum * (Watt) | 9 | 18 -100% | 32.27 -259% | 8.6 4% | 13 -44% | 15.9 -77% | 22.4 -149% | 13.8 -53% |
| Load Average * (Watt) | 94 | 95 -1% | 107.74 -15% | 59.5 37% | 95 -1% | 78 17% | 78.1 17% | 92.5 2% |
| Witcher 3 ultra * (Watt) | 116.3 | 114 2% | 142 -22% | 89 23% | 102 12% | 107.3 8% | 97.5 16% | 108.1 7% |
| Load Maximum * (Watt) | 154.4 | 179 -16% | 160.28 -4% | 112.8 27% | 134 13% | 143.4 7% | 133.52 14% | 123.2 20% |
* ... menor é melhor
| Dell G7 15-7588 i7-8750H, GeForce GTX 1060 Max-Q, 56 Wh | Dell Inspiron 15 7000 7577 i5-7300HQ, GeForce GTX 1060 Max-Q, 56 Wh | Acer Predator Helios 300 PH317-52-51M6 i5-8300H, GeForce GTX 1050 Ti Mobile, 48 Wh | Asus FX503VM-EH73 i7-7700HQ, GeForce GTX 1060 Mobile, 64 Wh | HP Omen 15t-ce000 i7-7700HQ, GeForce GTX 1060 Max-Q, 70 Wh | Lenovo Legion Y530-15ICH i5-8300H, GeForce GTX 1050 Ti Mobile, 52.5 Wh | |
|---|---|---|---|---|---|---|
| Duração da bateria | -11% | -12% | -46% | -48% | -45% | |
| Reader / Idle (h) | 10.9 | 11 1% | 11.8 8% | 5.7 -48% | 5 -54% | |
| WiFi v1.3 (h) | 7.5 | 6.9 -8% | 5.9 -21% | 4.6 -39% | 3.5 -53% | 4.1 -45% |
| Load (h) | 2.2 | 1.6 -27% | 1.7 -23% | 1.1 -50% | 1.4 -36% |
Pro
Contra

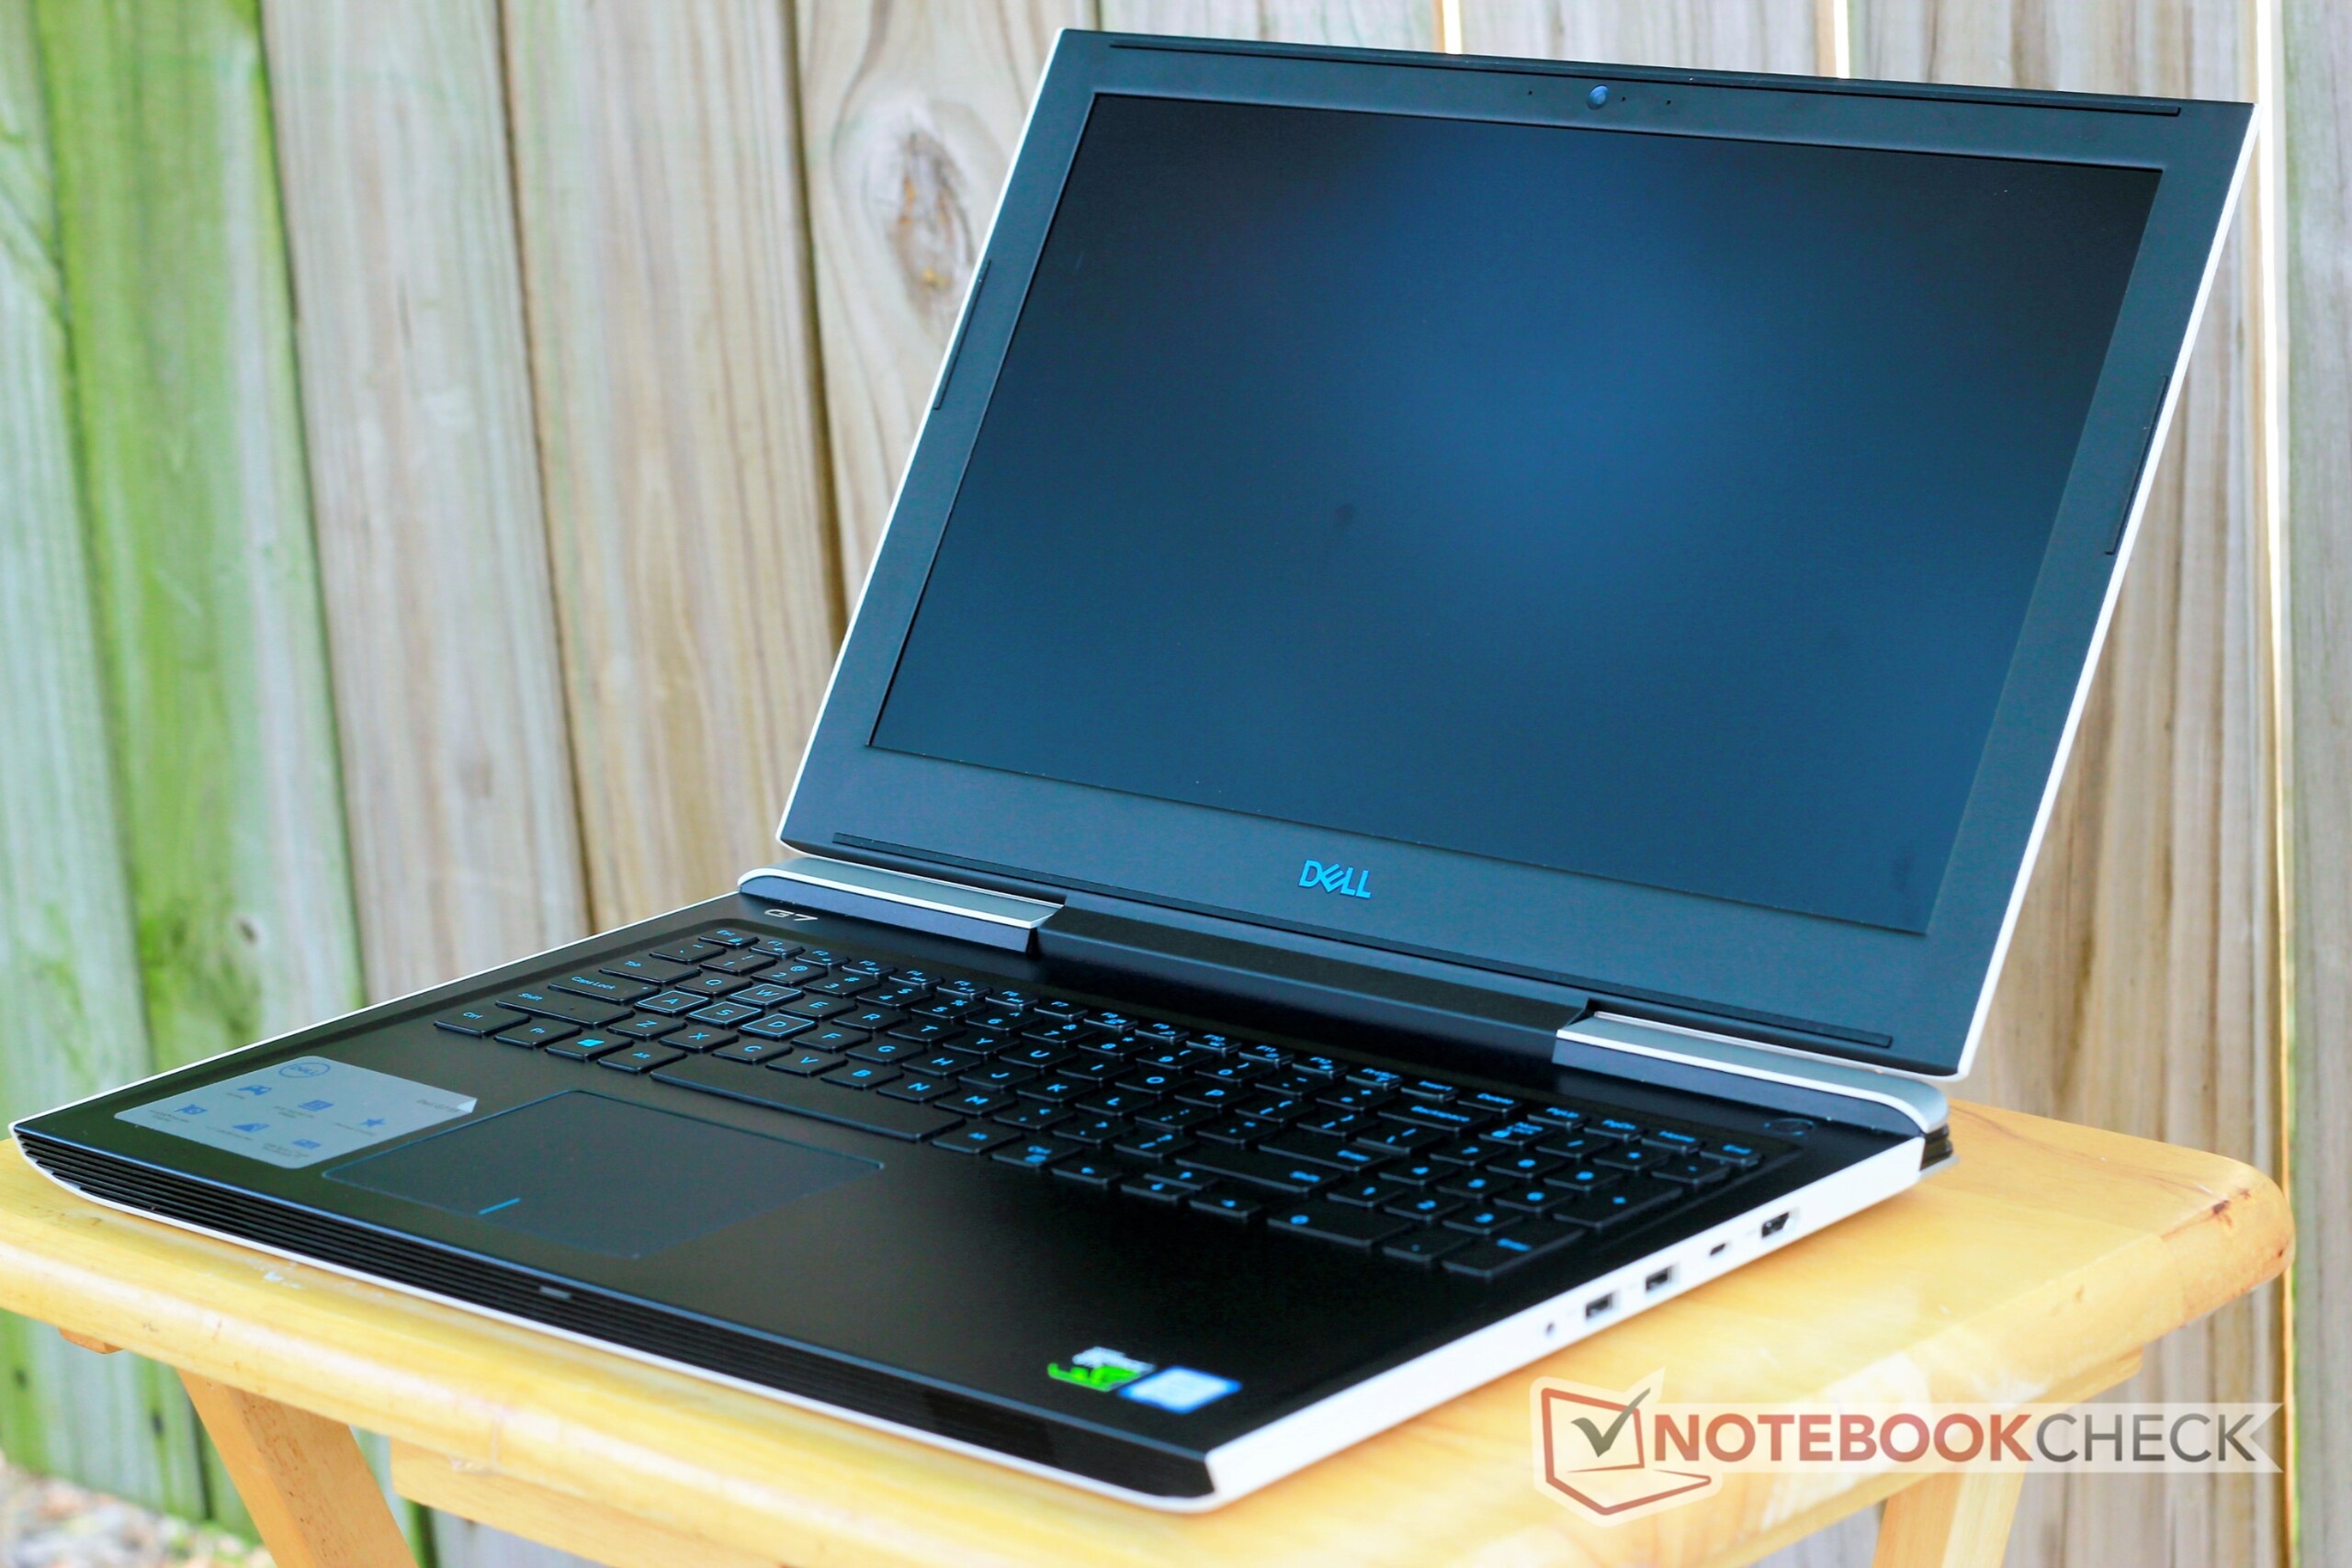
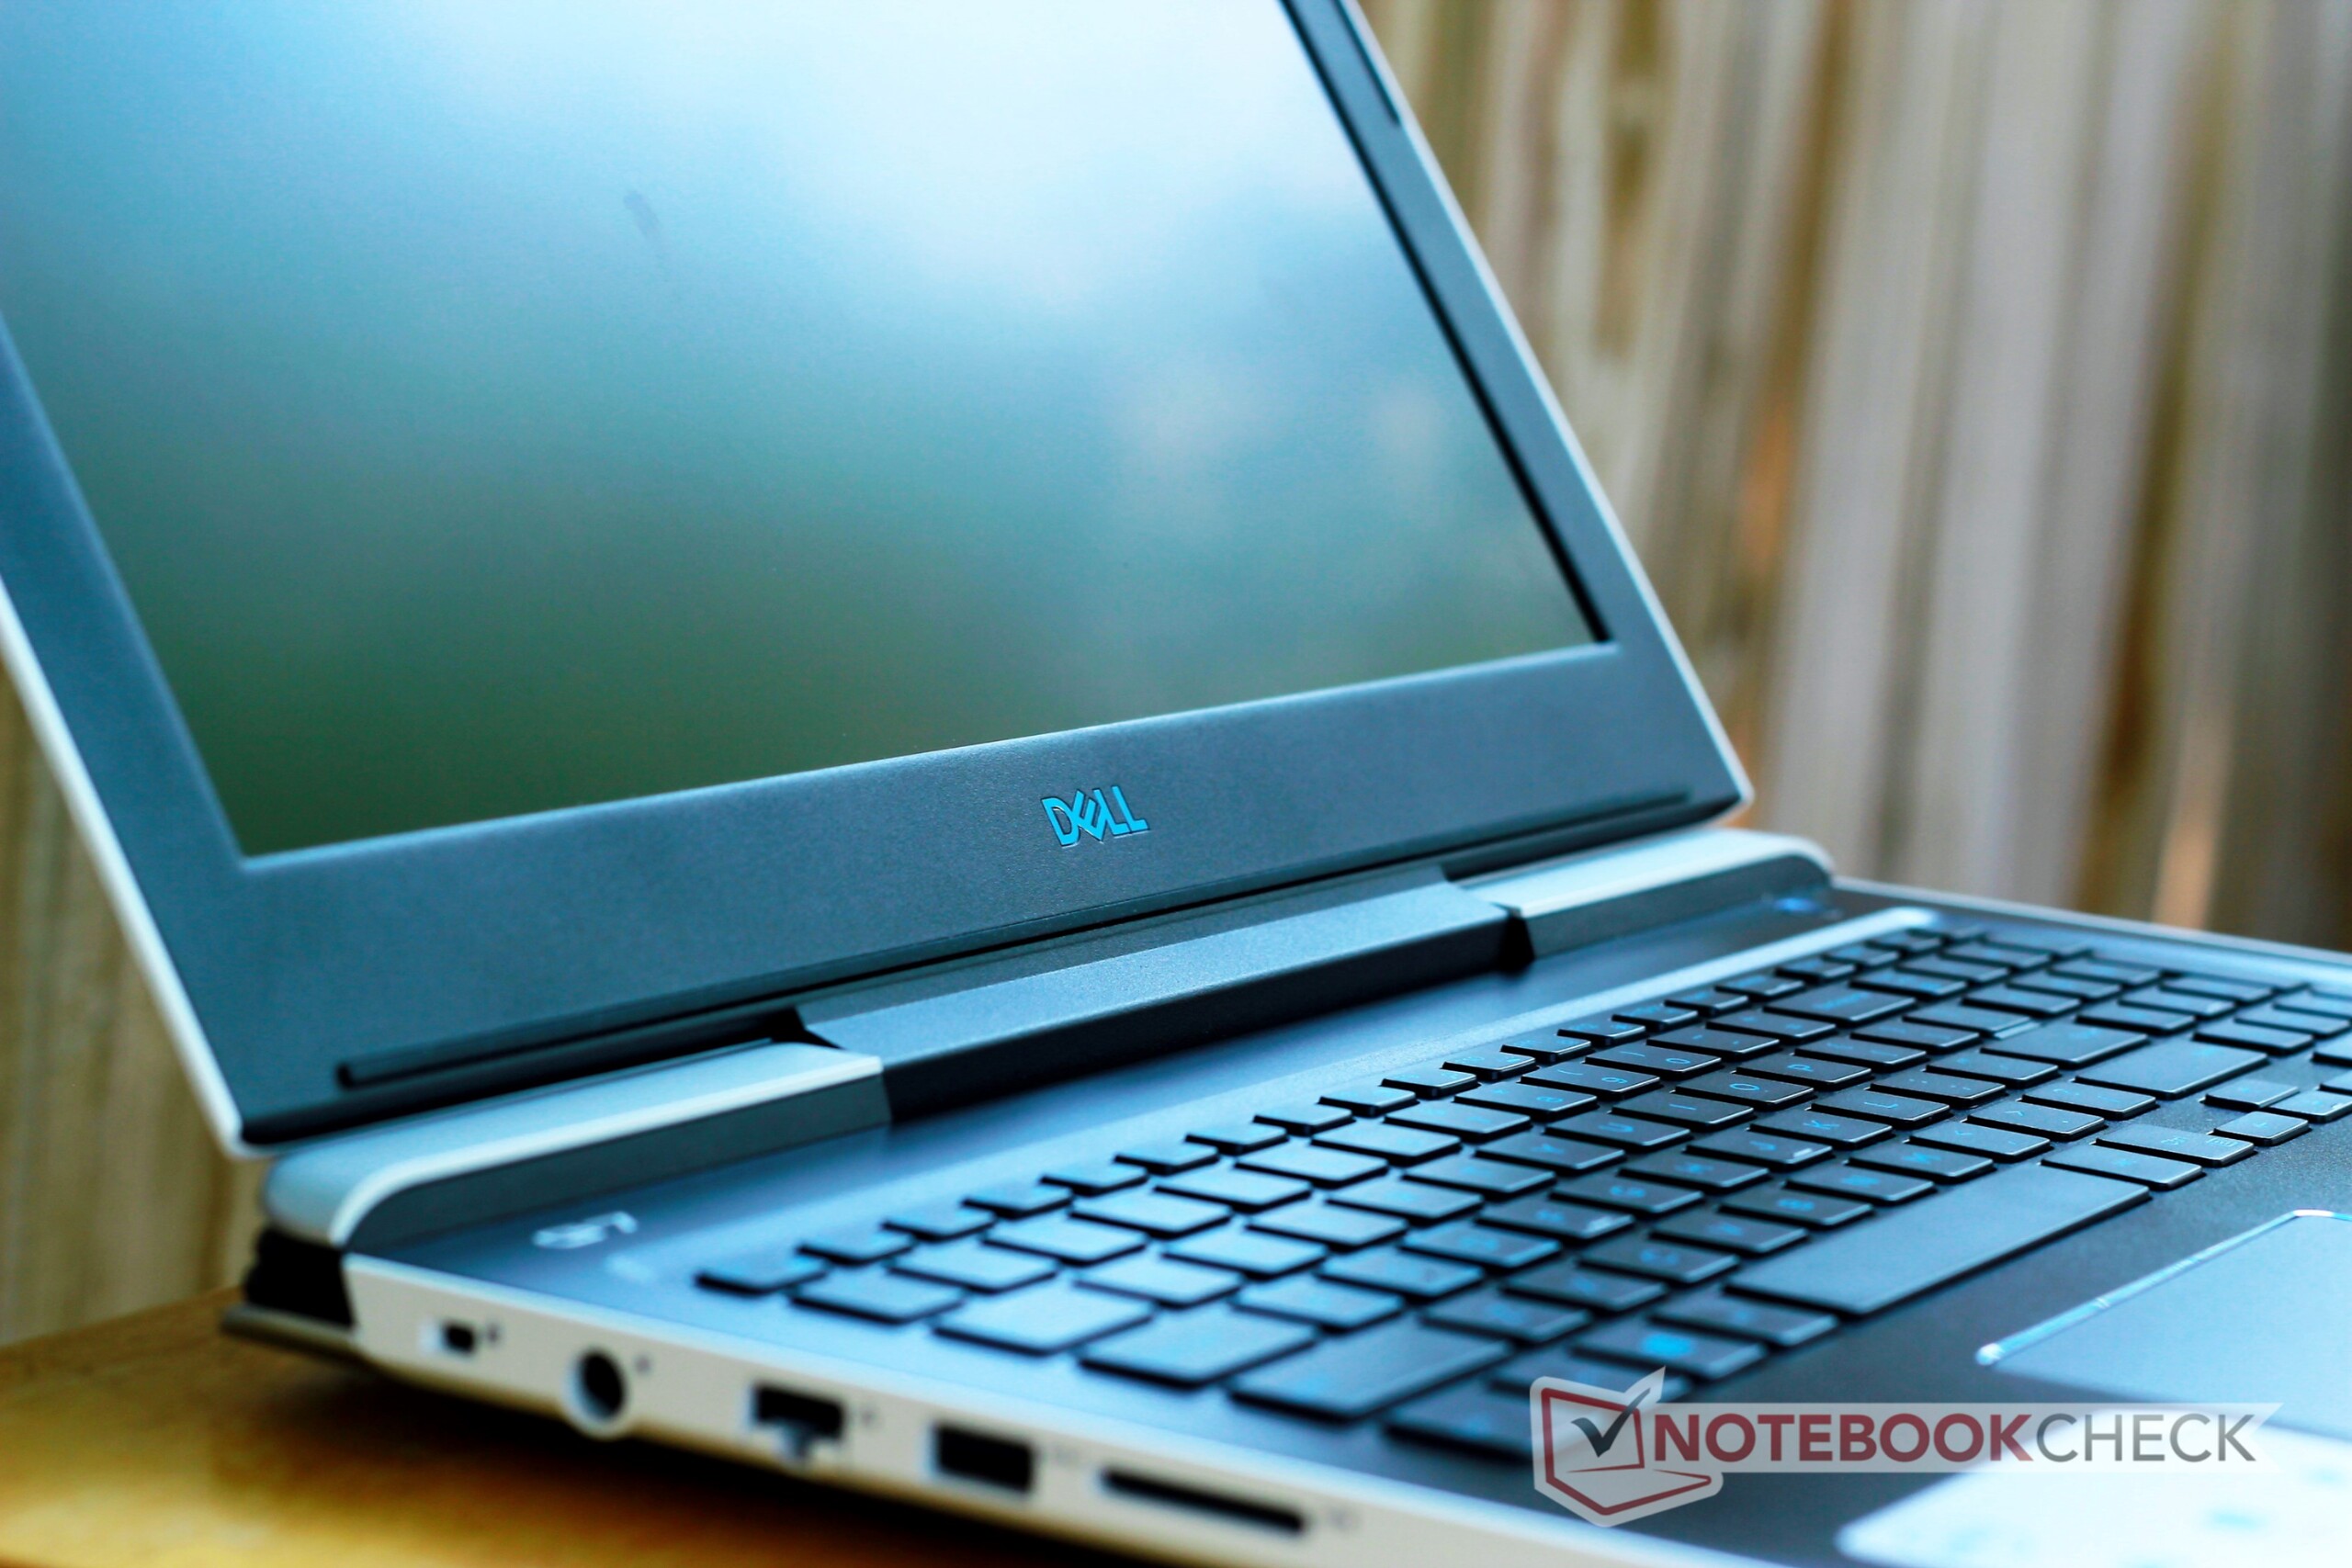
Dell teve uma grande vitória com o portátil de jogos Inspiron 15 7000 original há vários anos, e manteve os sucessos. O Inspiron 15 7000 7577 do ano passado foi uma opção de jogo popular para o orçamento, e o G7 deste ano melhor as coisas um pouquinho. Além do novo nome, a CPU atualizada oferece um aumento de 40% a 50% no desempenho, em tarefas pesadas, e o novo esquema de cores cria uma carcaça única e (subjetivamente) atraente.
Caso contrário, o G7 é simplesmente um Inspiron 15 7000 7577 com outro nome. Isso não é algo ruim, mas os consumidores que compraram o excelente 7577 do ano passado têm poucos motivos para atualizar. No entanto, outros que estão utilizando silicon mais antigo ou procurando por um novo portátil de jogos de nível básico devem levar o G7 ao topo de sua lista. Outros portáteis neste mercado vêm com preços ligeiramente mais baixos, mas fazem alguns sacrifícios pesados em termos de gerenciamento de calor, ruído do ventilador e qualidade de construção. O G7 oferece um ótimo acabamento superando sua faixa de preço e oferece desempenho estelar.
Tomando hardware poderoso, normalmente visto em dispositivos muito mais caros, e colocando em uma carcaça bonita e bem construída, o Dell G7 tem muita potência por dólar. Para os jogadores conscientes de preços, é difícil superar o Dell G7.
Dell G7 15-7588
- 07/31/2018 v6 (old)
Sam Medley
Price comparison
