Breve Análise do Portátil Samsung Notebook 9 NP900X3N (i5-7200U, FHD)

| SD Card Reader | |
| average JPG Copy Test (av. of 3 runs) | |
| Dell XPS 13 9360 FHD i5 | |
| Samsung Notebook 9 NP900X5N-X01US | |
| Samsung Notebook 9 NP900X3N-K01US | |
| maximum AS SSD Seq Read Test (1GB) | |
| Dell XPS 13 9360 FHD i5 | |
| Samsung Notebook 9 NP900X3N-K01US | |
| Samsung Notebook 9 NP900X5N-X01US | |
| Networking | |
| iperf3 transmit AX12 | |
| HP Spectre 13-v131ng | |
| Dell XPS 13 9360 FHD i5 | |
| Samsung Notebook 9 NP900X3N-K01US | |
| iperf3 receive AX12 | |
| Samsung Notebook 9 NP900X3N-K01US | |
| Dell XPS 13 9360 FHD i5 | |
| HP Spectre 13-v131ng | |
| |||||||||||||||||||||||||
iluminação: 90 %
iluminação com acumulador: 510.7 cd/m²
Contraste: 774:1 (Preto: 0.66 cd/m²)
ΔE ColorChecker Calman: 2.4 | ∀{0.5-29.43 Ø4.71}
ΔE Greyscale Calman: 2.4 | ∀{0.09-98 Ø4.96}
88.1% sRGB (Argyll 1.6.3 3D)
57% AdobeRGB 1998 (Argyll 1.6.3 3D)
64% AdobeRGB 1998 (Argyll 3D)
88.6% sRGB (Argyll 3D)
63.4% Display P3 (Argyll 3D)
Gamma: 2.23
CCT: 6747 K
| Samsung Notebook 9 NP900X3N-K01US ID: BOE06E1, Name: NV133FHB-N31, IPS, 13.3", 1920x1080 | HP Spectre 13-v131ng CMN1374, IPS UWVA, 13.3", 1920x1080 | Dell XPS 13 9360 FHD i5 Sharp SHP1449 LQ133M1, IPS, 13.3", 1920x1080 | Apple MacBook Pro 13 2017 APPA033, IPS, 13.3", 2560x1600 | Lenovo Yoga 910-13IKB-80VF004CGE AU Optronics AUO323D / B139HAN03.2, IPS, 13.9", 3840x2160 | |
|---|---|---|---|---|---|
| Display | 1% | -20% | 35% | -0% | |
| Display P3 Coverage (%) | 63.4 | 64.6 2% | 48.94 -23% | 99.2 56% | 62.2 -2% |
| sRGB Coverage (%) | 88.6 | 88.8 0% | 73.3 -17% | 99.9 13% | 90.1 2% |
| AdobeRGB 1998 Coverage (%) | 64 | 64.8 1% | 50.5 -21% | 87.1 36% | 63.5 -1% |
| Response Times | -4% | 12% | 6% | 9% | |
| Response Time Grey 50% / Grey 80% * (ms) | 41.6 ? | 46 ? -11% | 32.8 ? 21% | 42.8 ? -3% | 46 ? -11% |
| Response Time Black / White * (ms) | 34 ? | 33 ? 3% | 33.2 ? 2% | 28.8 ? 15% | 24 ? 29% |
| PWM Frequency (Hz) | 210.1 ? | ||||
| Screen | -26% | -30% | 29% | -49% | |
| Brightness middle (cd/m²) | 510.7 | 404 -21% | 351.2 -31% | 588 15% | 348 -32% |
| Brightness (cd/m²) | 481 | 382 -21% | 325 -32% | 561 17% | 310 -36% |
| Brightness Distribution (%) | 90 | 91 1% | 89 -1% | 92 2% | 80 -11% |
| Black Level * (cd/m²) | 0.66 | 0.35 47% | 0.195 70% | 0.45 32% | 0.25 62% |
| Contrast (:1) | 774 | 1154 49% | 1801 133% | 1307 69% | 1392 80% |
| Colorchecker dE 2000 * | 2.4 | 5.37 -124% | 7.4 -208% | 1.7 29% | 7.86 -228% |
| Colorchecker dE 2000 max. * | 7.3 | 9.46 -30% | 9.08 -24% | 3.5 52% | 13.43 -84% |
| Greyscale dE 2000 * | 2.4 | 6.44 -168% | 6.71 -180% | 1.9 21% | 8.25 -244% |
| Gamma | 2.23 99% | 2.52 87% | 2.74 80% | 2.33 94% | 2.05 107% |
| CCT | 6747 96% | 6738 96% | 7222 90% | 6738 96% | 6834 95% |
| Color Space (Percent of AdobeRGB 1998) (%) | 57 | 58 2% | 50.48 -11% | 77.92 37% | 58 2% |
| Color Space (Percent of sRGB) (%) | 88.1 | 89 1% | 73.31 -17% | 99.94 13% | 90 2% |
| Média Total (Programa/Configurações) | -10% /
-18% | -13% /
-23% | 23% /
27% | -13% /
-31% |
* ... menor é melhor
Exibir tempos de resposta
| ↔ Tempo de resposta preto para branco | ||
|---|---|---|
| 34 ms ... ascensão ↗ e queda ↘ combinadas | ↗ 20 ms ascensão | 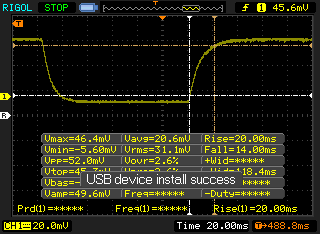 |
| ↘ 14 ms queda | ||
| A tela mostra taxas de resposta lentas em nossos testes e será insatisfatória para os jogadores. Em comparação, todos os dispositivos testados variam de 0.1 (mínimo) a 240 (máximo) ms. » 91 % de todos os dispositivos são melhores. Isso significa que o tempo de resposta medido é pior que a média de todos os dispositivos testados (19.8 ms). | ||
| ↔ Tempo de resposta 50% cinza a 80% cinza | ||
| 41.6 ms ... ascensão ↗ e queda ↘ combinadas | ↗ 22.8 ms ascensão | 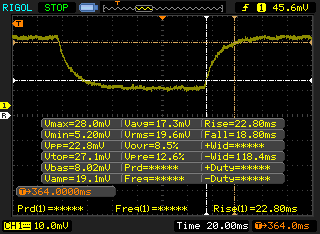 |
| ↘ 18.8 ms queda | ||
| A tela mostra taxas de resposta lentas em nossos testes e será insatisfatória para os jogadores. Em comparação, todos os dispositivos testados variam de 0.165 (mínimo) a 636 (máximo) ms. » 67 % de todos os dispositivos são melhores. Isso significa que o tempo de resposta medido é pior que a média de todos os dispositivos testados (31 ms). | ||
Cintilação da tela / PWM (modulação por largura de pulso)
| Tela tremeluzindo/PWM detectado | 210.1 Hz | ≤ 99 % configuração de brilho | 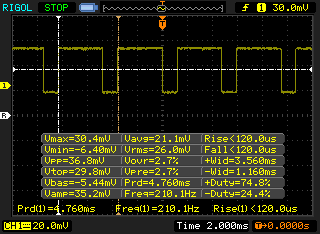 |
A luz de fundo da tela pisca em 210.1 Hz (pior caso, por exemplo, utilizando PWM) Cintilação detectada em uma configuração de brilho de 99 % e abaixo. Não deve haver cintilação ou PWM acima desta configuração de brilho. A frequência de 210.1 Hz é relativamente baixa, portanto, usuários sensíveis provavelmente notarão cintilação e sentirão fadiga ocular na configuração de brilho indicada e abaixo. [pwm_comparison] Em comparação: 52 % de todos os dispositivos testados não usam PWM para escurecer a tela. Se PWM foi detectado, uma média de 7754 (mínimo: 5 - máximo: 343500) Hz foi medida. | |||
| wPrime 2.10 - 1024m | |
| Toshiba Tecra A50-C1510W10 | |
| Apple MacBook Pro 13 2017 Touchbar i5 | |
| Samsung Notebook 9 NP900X3N-K01US | |
| HP Envy 13-ad065nr | |
| Samsung Notebook 9 NP900X5N-X01US | |
* ... menor é melhor
| PCMark 8 | |
| Home Score Accelerated v2 | |
| Samsung Notebook 9 NP900X5N-X01US | |
| HP Spectre 13-v131ng | |
| Samsung Notebook 9 NP900X3N-K01US | |
| Dell XPS 13 9360 FHD i5 | |
| Work Score Accelerated v2 | |
| HP Spectre 13-v131ng | |
| Samsung Notebook 9 NP900X5N-X01US | |
| Samsung Notebook 9 NP900X3N-K01US | |
| Dell XPS 13 9360 FHD i5 | |
| Creative Score Accelerated v2 | |
| Samsung Notebook 9 NP900X5N-X01US | |
| HP Spectre 13-v131ng | |
| Samsung Notebook 9 NP900X3N-K01US | |
| Dell XPS 13 9360 FHD i5 | |
| PCMark 8 Home Score Accelerated v2 | 3728 pontos | |
| PCMark 8 Creative Score Accelerated v2 | 4577 pontos | |
| PCMark 8 Work Score Accelerated v2 | 4786 pontos | |
| PCMark 10 Score | 3449 pontos | |
Ajuda | ||
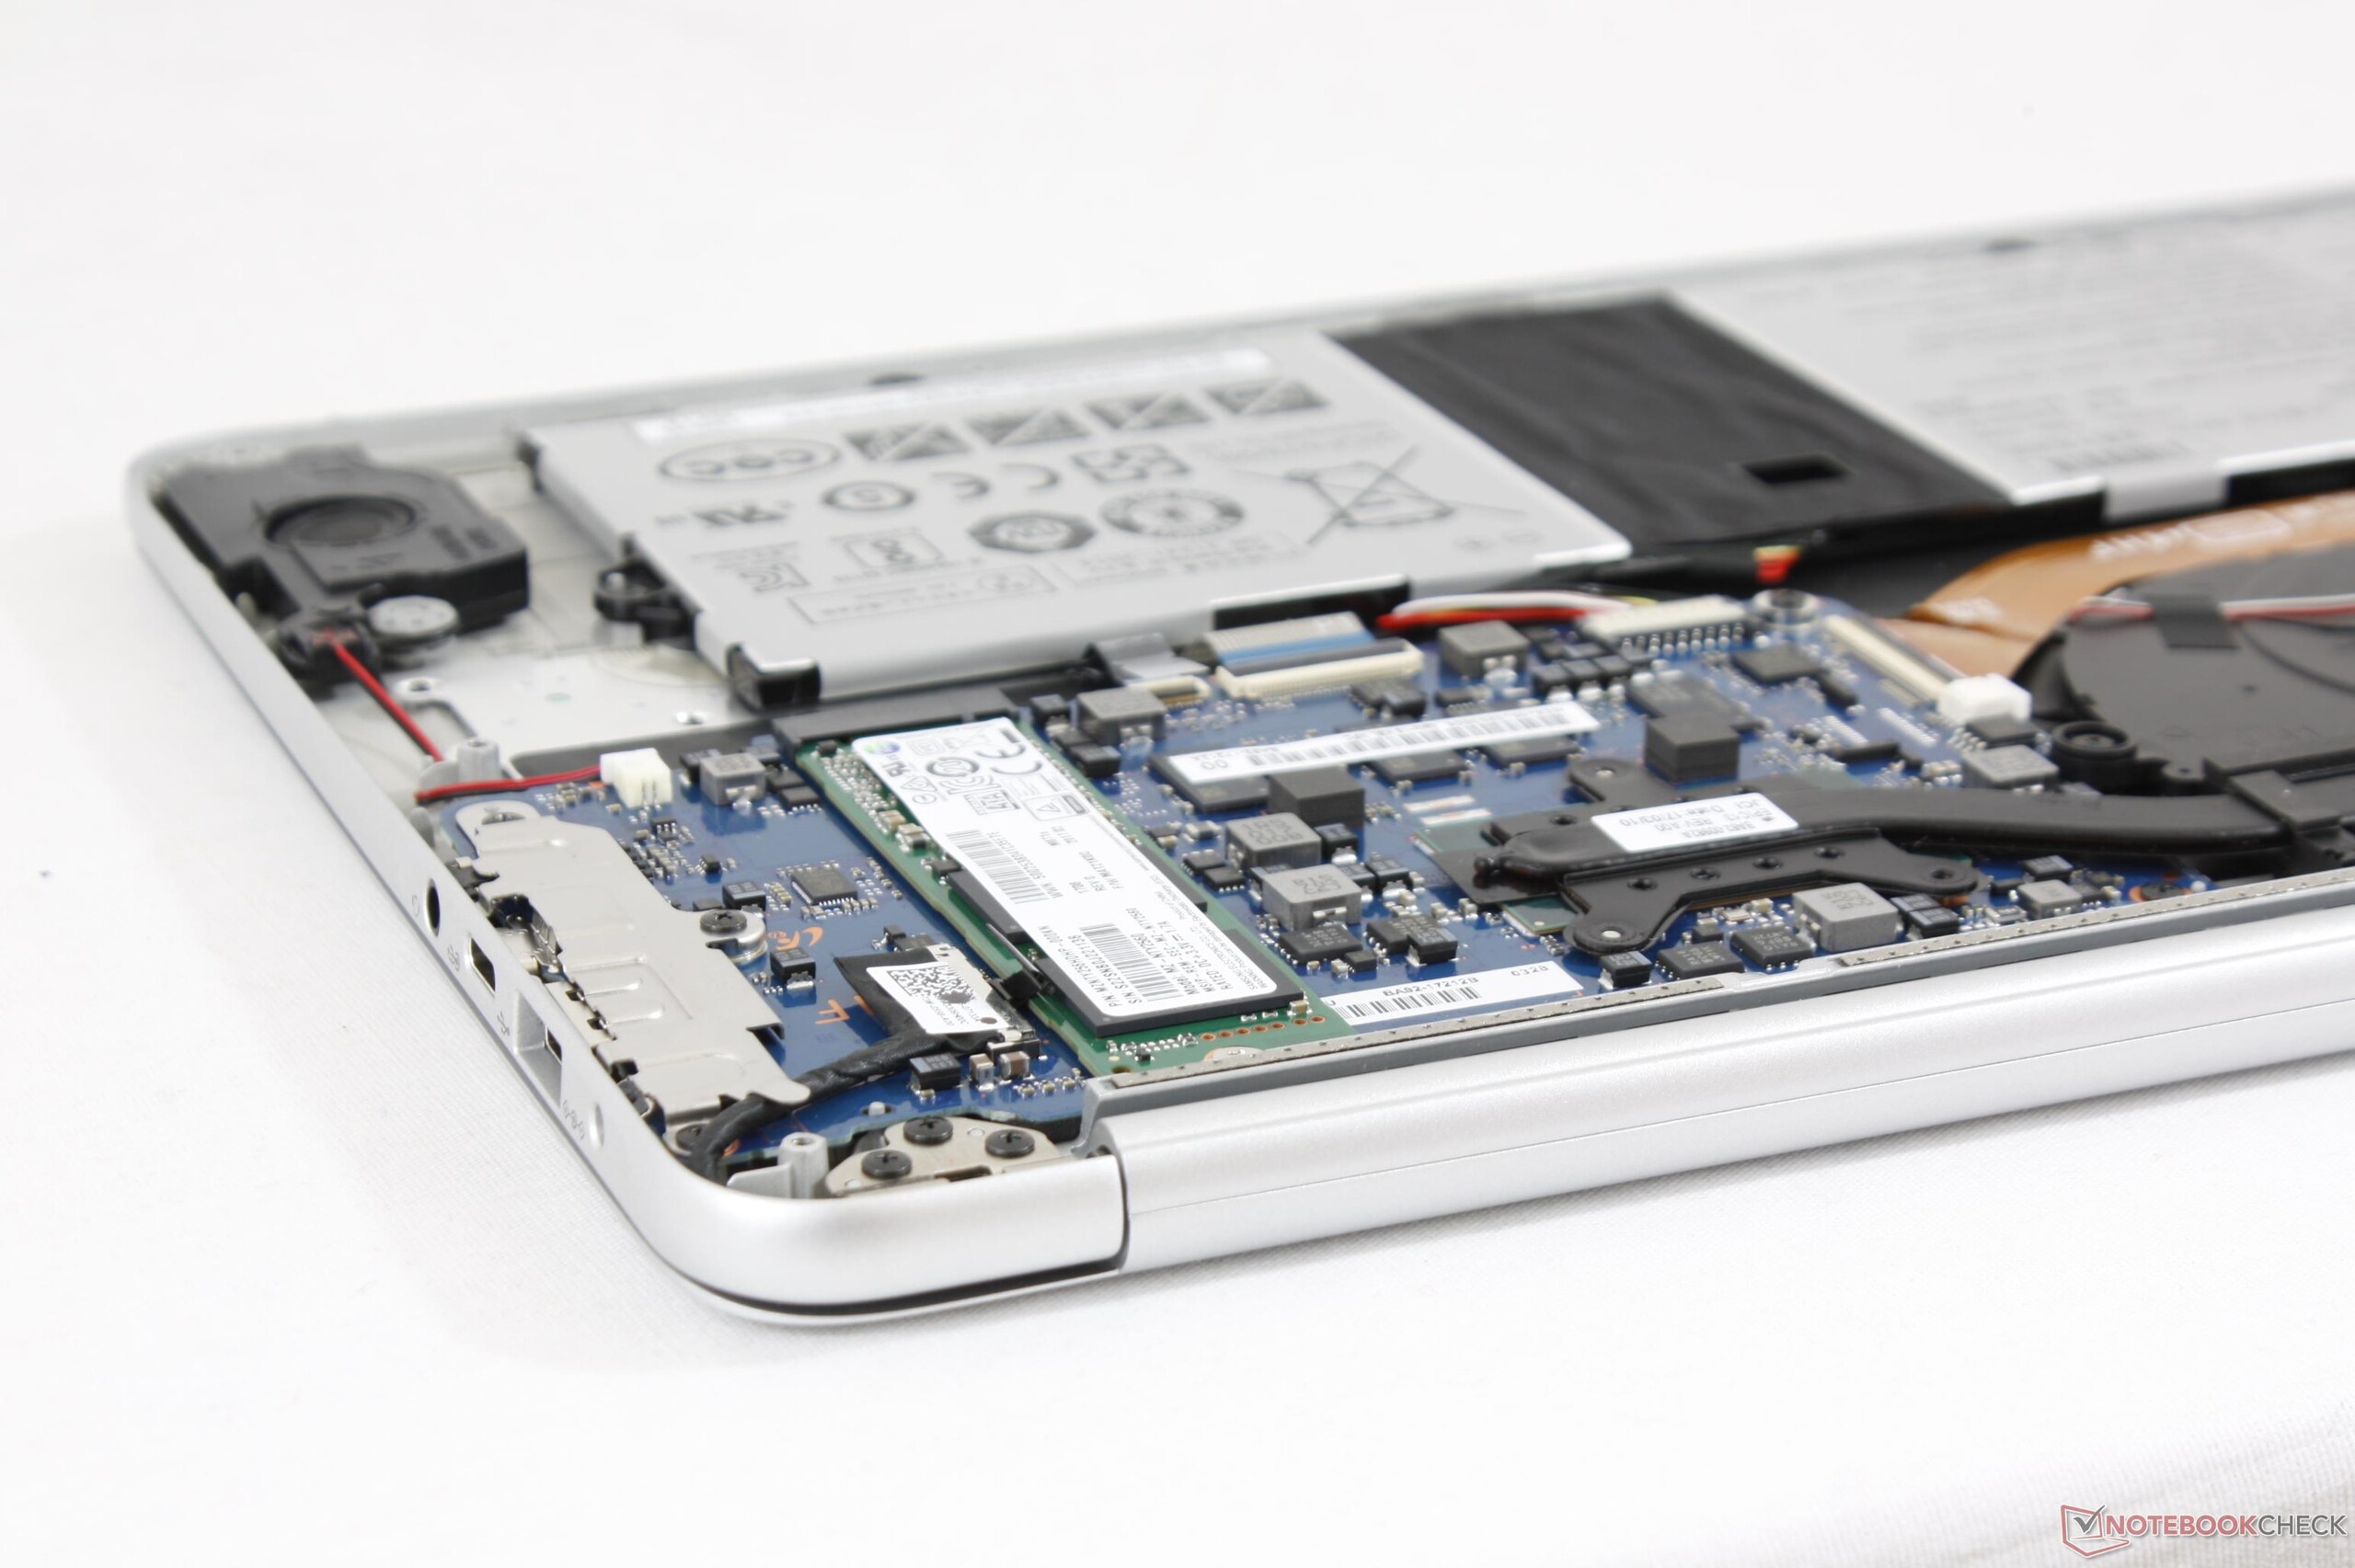
| Samsung Notebook 9 NP900X3N-K01US Samsung CM871a MZNTY256HDHP | HP Spectre 13-v131ng Samsung PM961 NVMe MZVLW512HMJP | Dell XPS 13 9360 FHD i5 Toshiba NVMe THNSN5256GPUK | Lenovo Yoga 910-13IKB-80VF004CGE Samsung PM951 NVMe MZVLV512 | Asus Zenbook 3 UX390UA-GS041T SK Hynix Canvas SC300 512GB M.2 (HFS512G39MND) | |
|---|---|---|---|---|---|
| AS SSD | 155% | 33% | 71% | -12% | |
| Copy Game MB/s (MB/s) | 186.8 | 397.9 113% | 390 109% | 189.4 1% | |
| Copy Program MB/s (MB/s) | 213 | 426 100% | 188 -12% | 204.3 -4% | |
| Copy ISO MB/s (MB/s) | 335.9 | 720 114% | 283.3 -16% | 293.5 -13% | |
| Score Total (Points) | 1057 | 3617 242% | 1607 52% | 1865 76% | 1056 0% |
| Score Write (Points) | 350 | 1115 219% | 327 -7% | 611 75% | 374 7% |
| Score Read (Points) | 463 | 1654 257% | 870 88% | 850 84% | 448 -3% |
| Access Time Write * (ms) | 0.053 | 0.026 51% | 0.035 34% | 0.028 47% | 0.11 -108% |
| Access Time Read * (ms) | 0.066 | 0.042 36% | 0.055 17% | 0.034 48% | 0.076 -15% |
| 4K-64 Write (MB/s) | 223.8 | 862 285% | 197.7 -12% | 422.2 89% | 271.4 21% |
| 4K-64 Read (MB/s) | 379.4 | 1465 286% | 723 91% | 671 77% | 370.3 -2% |
| 4K Write (MB/s) | 79.2 | 134.4 70% | 92 16% | 132.9 68% | 56.8 -28% |
| 4K Read (MB/s) | 31.24 | 56.4 81% | 29.52 -6% | 39.92 28% | 25.89 -17% |
| Seq Write (MB/s) | 466 | 1190 155% | 372.8 -20% | 560 20% | 463.4 -1% |
| Seq Read (MB/s) | 520 | 1325 155% | 1179 127% | 1389 167% | 514 -1% |
* ... menor é melhor

| 3DMark 11 Performance | 1695 pontos | |
| 3DMark Ice Storm Standard Score | 64405 pontos | |
| 3DMark Cloud Gate Standard Score | 6418 pontos | |
| 3DMark Fire Strike Score | 892 pontos | |
| 3DMark Fire Strike Extreme Score | 411 pontos | |
Ajuda | ||
| baixo | média | alto | ultra | |
|---|---|---|---|---|
| BioShock Infinite (2013) | 42.6 | 26 | 24.7 | 7.6 |
| Rise of the Tomb Raider (2016) | 20 |
Barulho
| Ocioso |
| 28.4 / 28.4 / 28.4 dB |
| Carga |
| 33.2 / 35.2 dB |
 | ||
30 dB silencioso 40 dB(A) audível 50 dB(A) ruidosamente alto |
||
min: | ||
| Samsung Notebook 9 NP900X3N-K01US HD Graphics 620, i5-7200U, Samsung CM871a MZNTY256HDHP | HP Spectre 13-v131ng HD Graphics 620, i7-7500U, Samsung PM961 NVMe MZVLW512HMJP | Dell XPS 13 9360 FHD i5 HD Graphics 620, i5-7200U, Toshiba NVMe THNSN5256GPUK | Lenovo Yoga 910-13IKB-80VF004CGE HD Graphics 620, i7-7500U, Samsung PM951 NVMe MZVLV512 | Apple MacBook Pro 13 2017 Iris Plus Graphics 640, i5-7360U, Apple SSD AP0128 | Asus Zenbook 3 UX390UA-GS041T HD Graphics 620, i5-7200U, SK Hynix Canvas SC300 512GB M.2 (HFS512G39MND) | |
|---|---|---|---|---|---|---|
| Noise | -10% | 1% | -11% | -6% | -10% | |
| desligado / ambiente * (dB) | 28.4 | 30.4 -7% | 31.7 -12% | 30.2 -6% | 30.7 -8% | |
| Idle Minimum * (dB) | 28.4 | 30.4 -7% | 28.9 -2% | 31.7 -12% | 30.2 -6% | 30.7 -8% |
| Idle Average * (dB) | 28.4 | 30.4 -7% | 28.9 -2% | 31.7 -12% | 30.2 -6% | 30.7 -8% |
| Idle Maximum * (dB) | 28.4 | 30.4 -7% | 28.9 -2% | 31.7 -12% | 30.2 -6% | 30.9 -9% |
| Load Average * (dB) | 33.2 | 40 -20% | 30.9 7% | 38.4 -16% | 32.9 1% | 38.7 -17% |
| Load Maximum * (dB) | 35.2 | 40 -14% | 33.5 5% | 34.7 1% | 39.3 -12% | 38.9 -11% |
* ... menor é melhor
(+) A temperatura máxima no lado superior é 39.8 °C / 104 F, em comparação com a média de 35.9 °C / 97 F , variando de 21.4 a 59 °C para a classe Subnotebook.
(+) A parte inferior aquece até um máximo de 38.8 °C / 102 F, em comparação com a média de 39.2 °C / 103 F
(+) Em uso inativo, a temperatura média para o lado superior é 24.2 °C / 76 F, em comparação com a média do dispositivo de 30.8 °C / ### class_avg_f### F.
(+) Os apoios para as mãos e o touchpad são mais frios que a temperatura da pele, com um máximo de 25.2 °C / 77.4 F e, portanto, são frios ao toque.
(+) A temperatura média da área do apoio para as mãos de dispositivos semelhantes foi 28.2 °C / 82.8 F (+3 °C / 5.4 F).
Samsung Notebook 9 NP900X3N-K01US análise de áudio
(-) | alto-falantes não muito altos (###valor### dB)
Graves 100 - 315Hz
(-) | quase nenhum baixo - em média 19.4% menor que a mediana
(±) | a linearidade dos graves é média (12.6% delta para a frequência anterior)
Médios 400 - 2.000 Hz
(+) | médios equilibrados - apenas 3.5% longe da mediana
(±) | a linearidade dos médios é média (11.7% delta para frequência anterior)
Altos 2 - 16 kHz
(+) | agudos equilibrados - apenas 2.7% longe da mediana
(±) | a linearidade dos máximos é média (9% delta para frequência anterior)
Geral 100 - 16.000 Hz
(±) | a linearidade do som geral é média (27.4% diferença em relação à mediana)
Comparado com a mesma classe
» 89% de todos os dispositivos testados nesta classe foram melhores, 3% semelhantes, 8% piores
» O melhor teve um delta de 5%, a média foi 18%, o pior foi 53%
Comparado com todos os dispositivos testados
» 83% de todos os dispositivos testados foram melhores, 4% semelhantes, 13% piores
» O melhor teve um delta de 4%, a média foi 23%, o pior foi 134%
Apple MacBook 12 (Early 2016) 1.1 GHz análise de áudio
(+) | os alto-falantes podem tocar relativamente alto (###valor### dB)
Graves 100 - 315Hz
(±) | graves reduzidos - em média 11.3% menor que a mediana
(±) | a linearidade dos graves é média (14.2% delta para a frequência anterior)
Médios 400 - 2.000 Hz
(+) | médios equilibrados - apenas 2.4% longe da mediana
(+) | médios são lineares (5.5% delta para frequência anterior)
Altos 2 - 16 kHz
(+) | agudos equilibrados - apenas 2% longe da mediana
(+) | os máximos são lineares (4.5% delta da frequência anterior)
Geral 100 - 16.000 Hz
(+) | o som geral é linear (10.2% diferença em relação à mediana)
Comparado com a mesma classe
» 7% de todos os dispositivos testados nesta classe foram melhores, 2% semelhantes, 90% piores
» O melhor teve um delta de 5%, a média foi 18%, o pior foi 53%
Comparado com todos os dispositivos testados
» 5% de todos os dispositivos testados foram melhores, 1% semelhantes, 94% piores
» O melhor teve um delta de 4%, a média foi 23%, o pior foi 134%
| desligado | |
| Ocioso | |
| Carga |
|
Key:
min: | |
| Samsung Notebook 9 NP900X3N-K01US i5-7200U, HD Graphics 620, Samsung CM871a MZNTY256HDHP, IPS, 1920x1080, 13.3" | HP Spectre 13-v131ng i7-7500U, HD Graphics 620, Samsung PM961 NVMe MZVLW512HMJP, IPS UWVA, 1920x1080, 13.3" | Dell XPS 13 9360 FHD i5 i5-7200U, HD Graphics 620, Toshiba NVMe THNSN5256GPUK, IPS, 1920x1080, 13.3" | Lenovo Yoga 910-13IKB-80VF004CGE i7-7500U, HD Graphics 620, Samsung PM951 NVMe MZVLV512, IPS, 3840x2160, 13.9" | Apple MacBook Pro 13 2017 i5-7360U, Iris Plus Graphics 640, Apple SSD AP0128, IPS, 2560x1600, 13.3" | Asus Zenbook 3 UX390UA-GS041T i5-7200U, HD Graphics 620, SK Hynix Canvas SC300 512GB M.2 (HFS512G39MND), IPS, 1920x1080, 12.5" | |
|---|---|---|---|---|---|---|
| Power Consumption | 16% | 34% | 16% | 7% | 23% | |
| Idle Minimum * (Watt) | 3.8 | 3.6 5% | 4.1 -8% | 4.3 -13% | 3.7 3% | 3.3 13% |
| Idle Average * (Watt) | 11 | 6.4 42% | 4.2 62% | 6.3 43% | 5.2 53% | 6.2 44% |
| Idle Maximum * (Watt) | 11.3 | 9.2 19% | 5.1 55% | 9 20% | 7.6 33% | 10.4 8% |
| Load Average * (Watt) | 35.6 | 34 4% | 22.1 38% | 32.7 8% | 41.6 -17% | 28 21% |
| Load Maximum * (Watt) | 37.2 | 34.4 8% | 29.4 21% | 28.8 23% | 50.5 -36% | 25.7 31% |
* ... menor é melhor
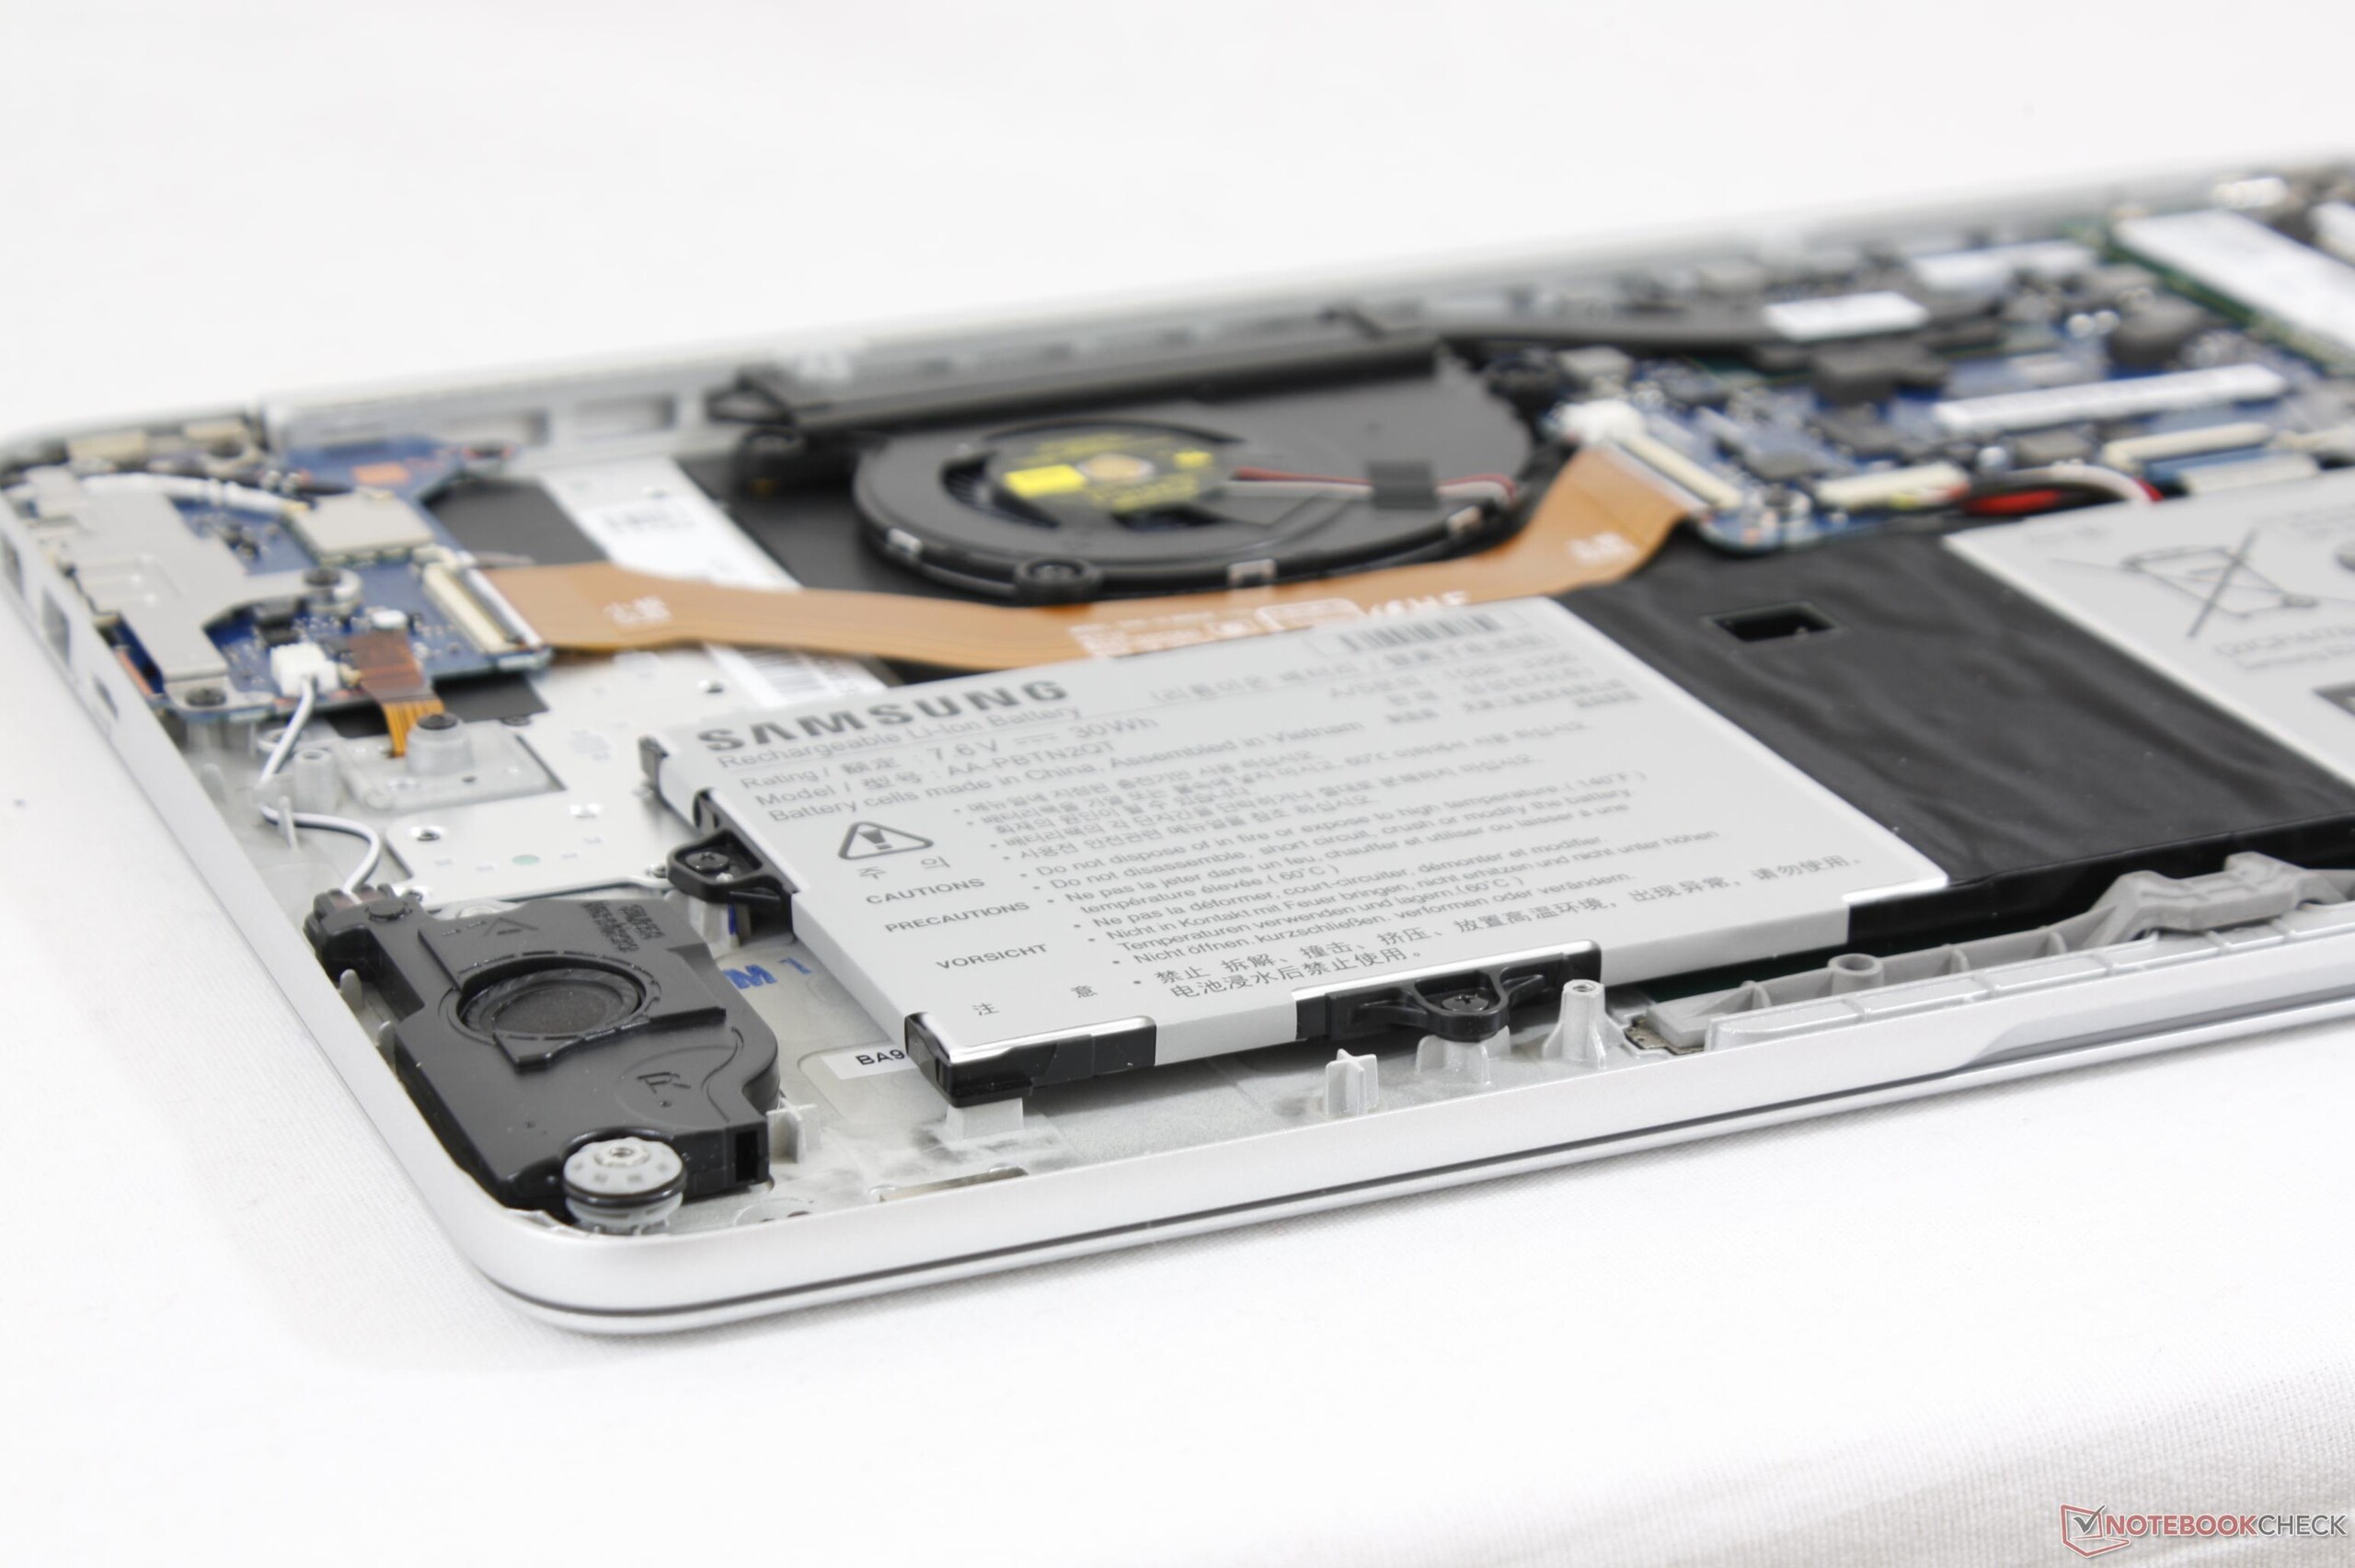
| Samsung Notebook 9 NP900X3N-K01US i5-7200U, HD Graphics 620, 30 Wh | HP Spectre 13-v131ng i7-7500U, HD Graphics 620, 38 Wh | Dell XPS 13 9360 FHD i5 i5-7200U, HD Graphics 620, 60 Wh | Lenovo Yoga 910-13IKB-80VF004CGE i7-7500U, HD Graphics 620, 78 Wh | Apple MacBook Pro 13 2017 i5-7360U, Iris Plus Graphics 640, 54.5 Wh | Asus Zenbook 3 UX390UA-GS041T i5-7200U, HD Graphics 620, 40 Wh | |
|---|---|---|---|---|---|---|
| Duração da bateria | 24% | 129% | 124% | 87% | 47% | |
| Reader / Idle (h) | 11.6 | 12 3% | 21.6 86% | 17.8 53% | 14.1 22% | |
| WiFi v1.3 (h) | 4.7 | 6.6 40% | 11.3 140% | 10.7 128% | 11.4 143% | 6.6 40% |
| Load (h) | 1 | 1.3 30% | 2.6 160% | 2.9 190% | 1.3 30% | 1.8 80% |
Pro
Contra
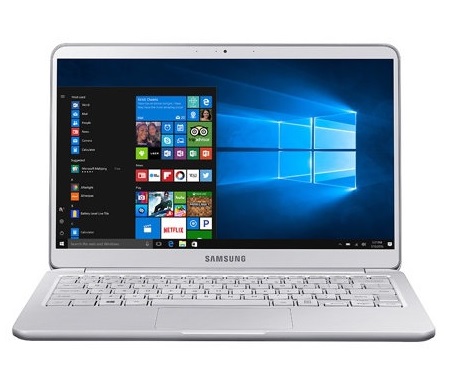
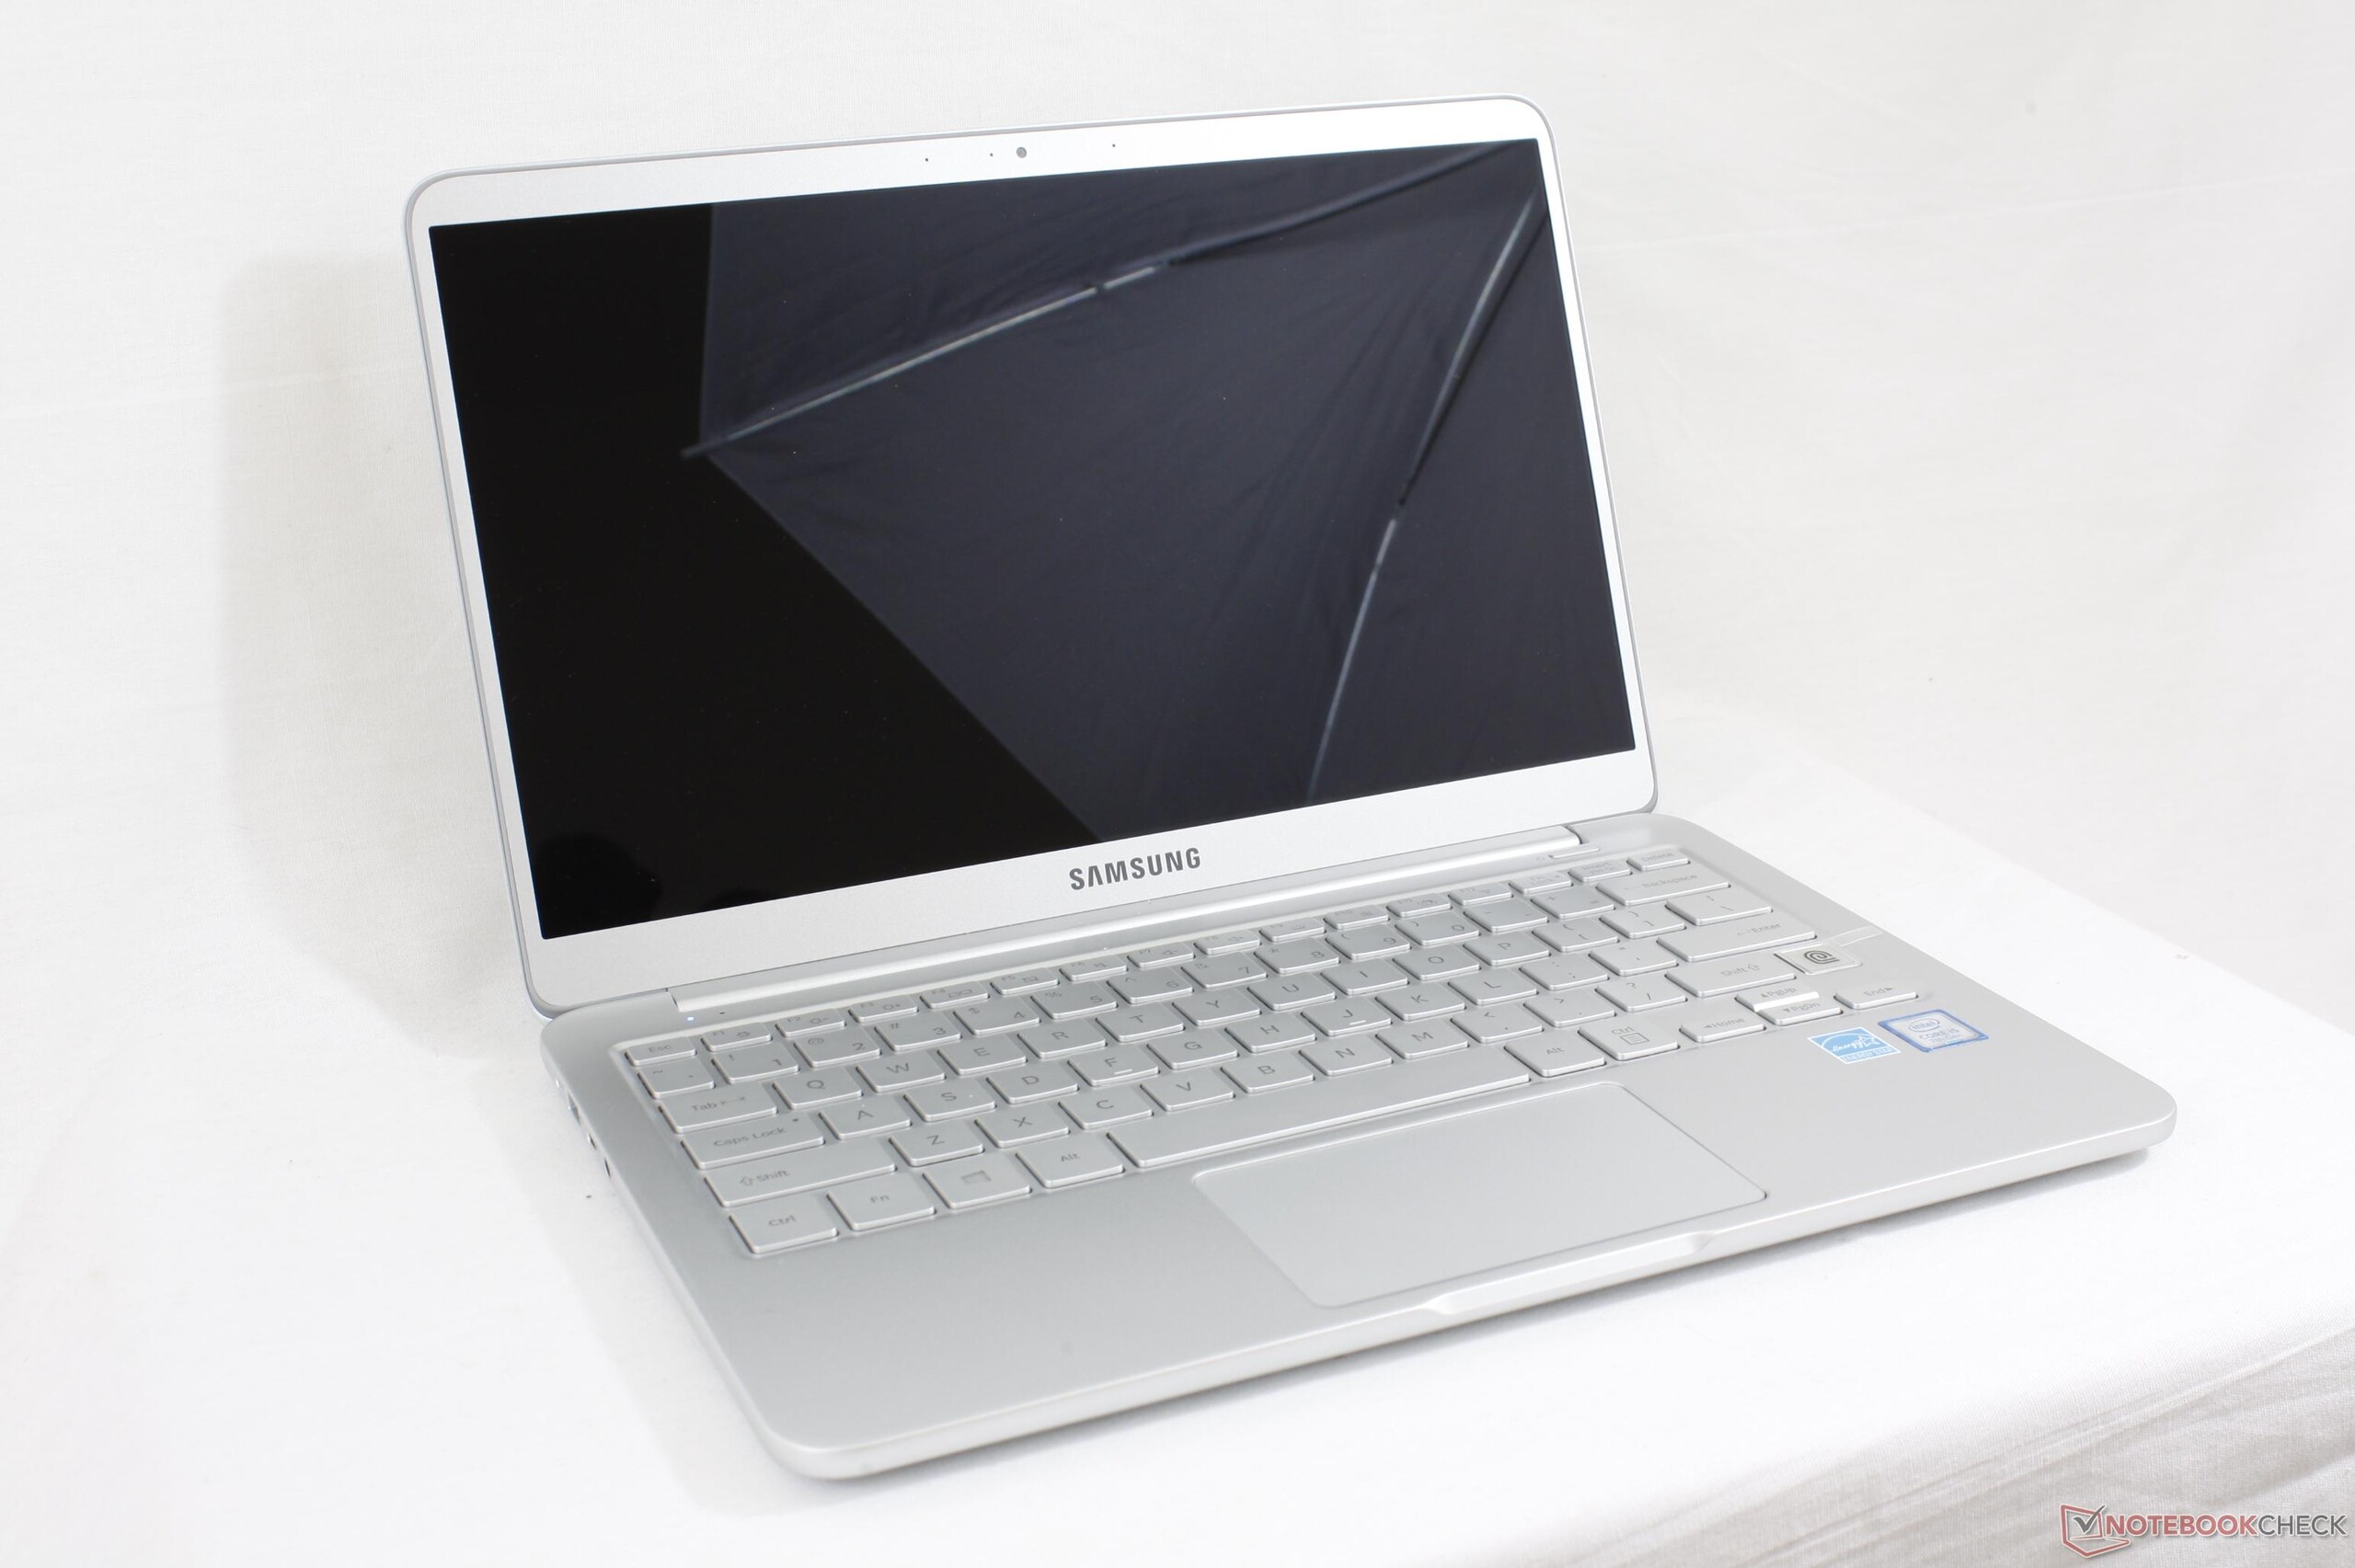
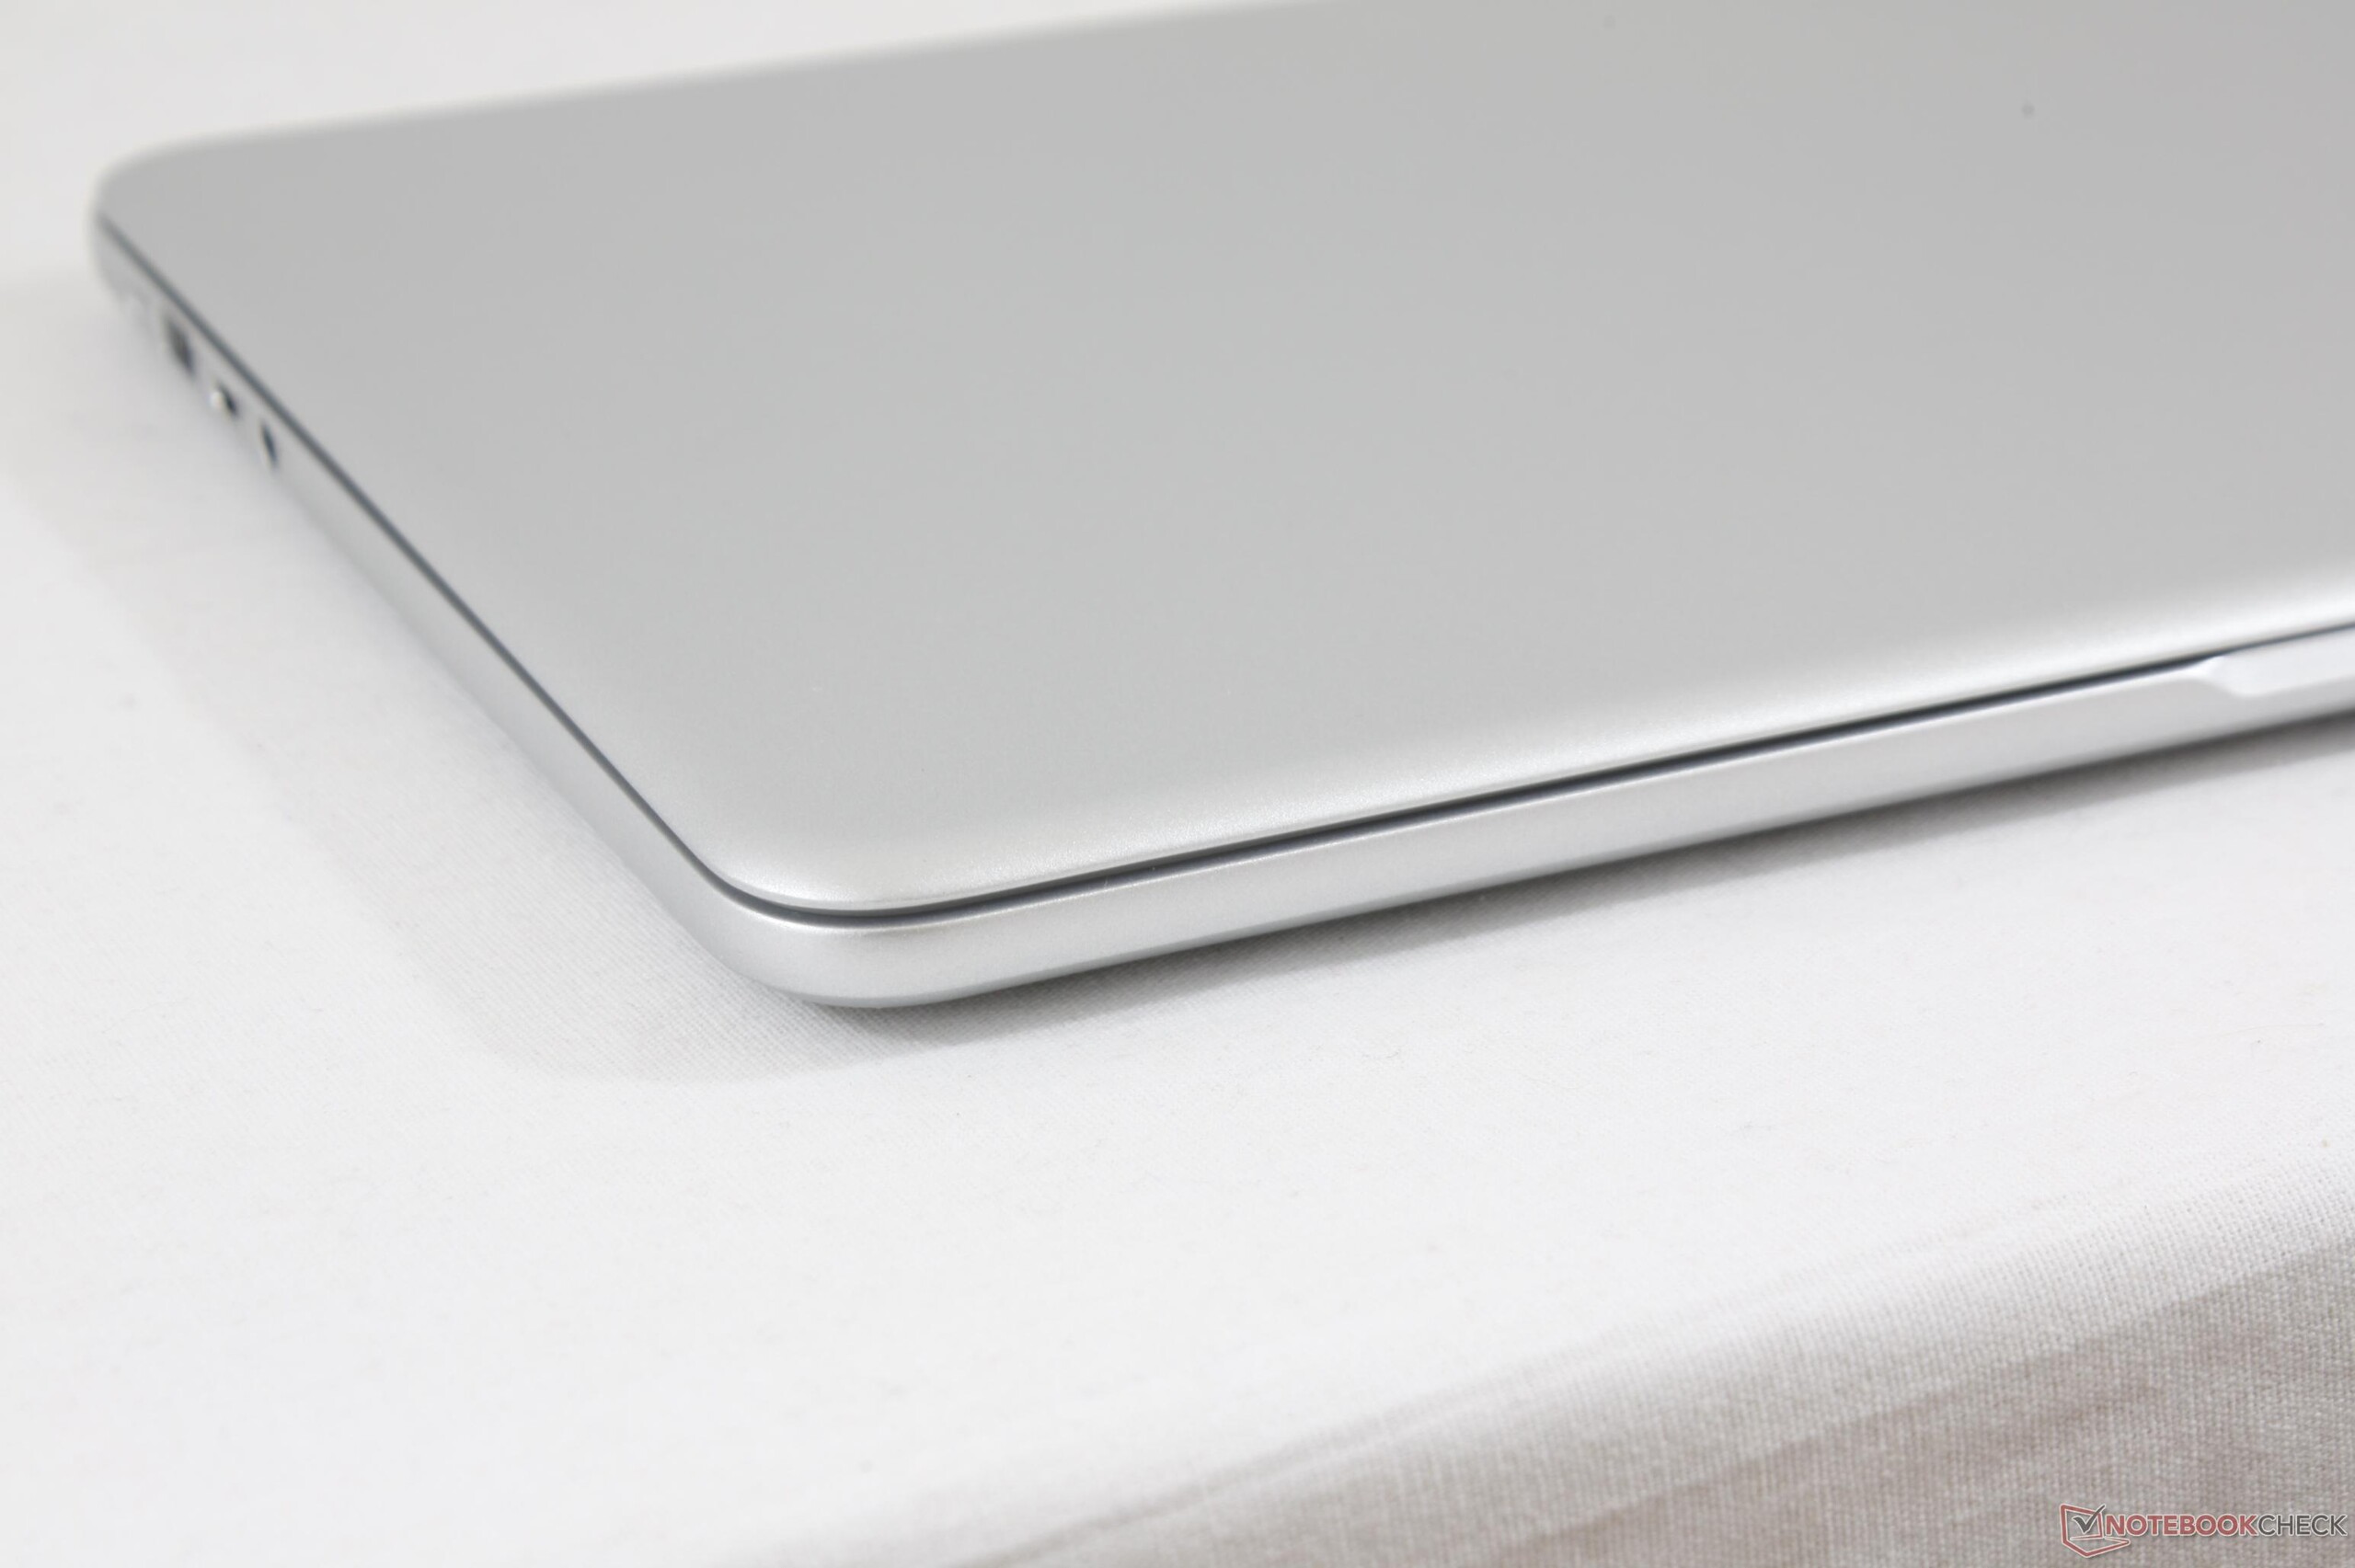
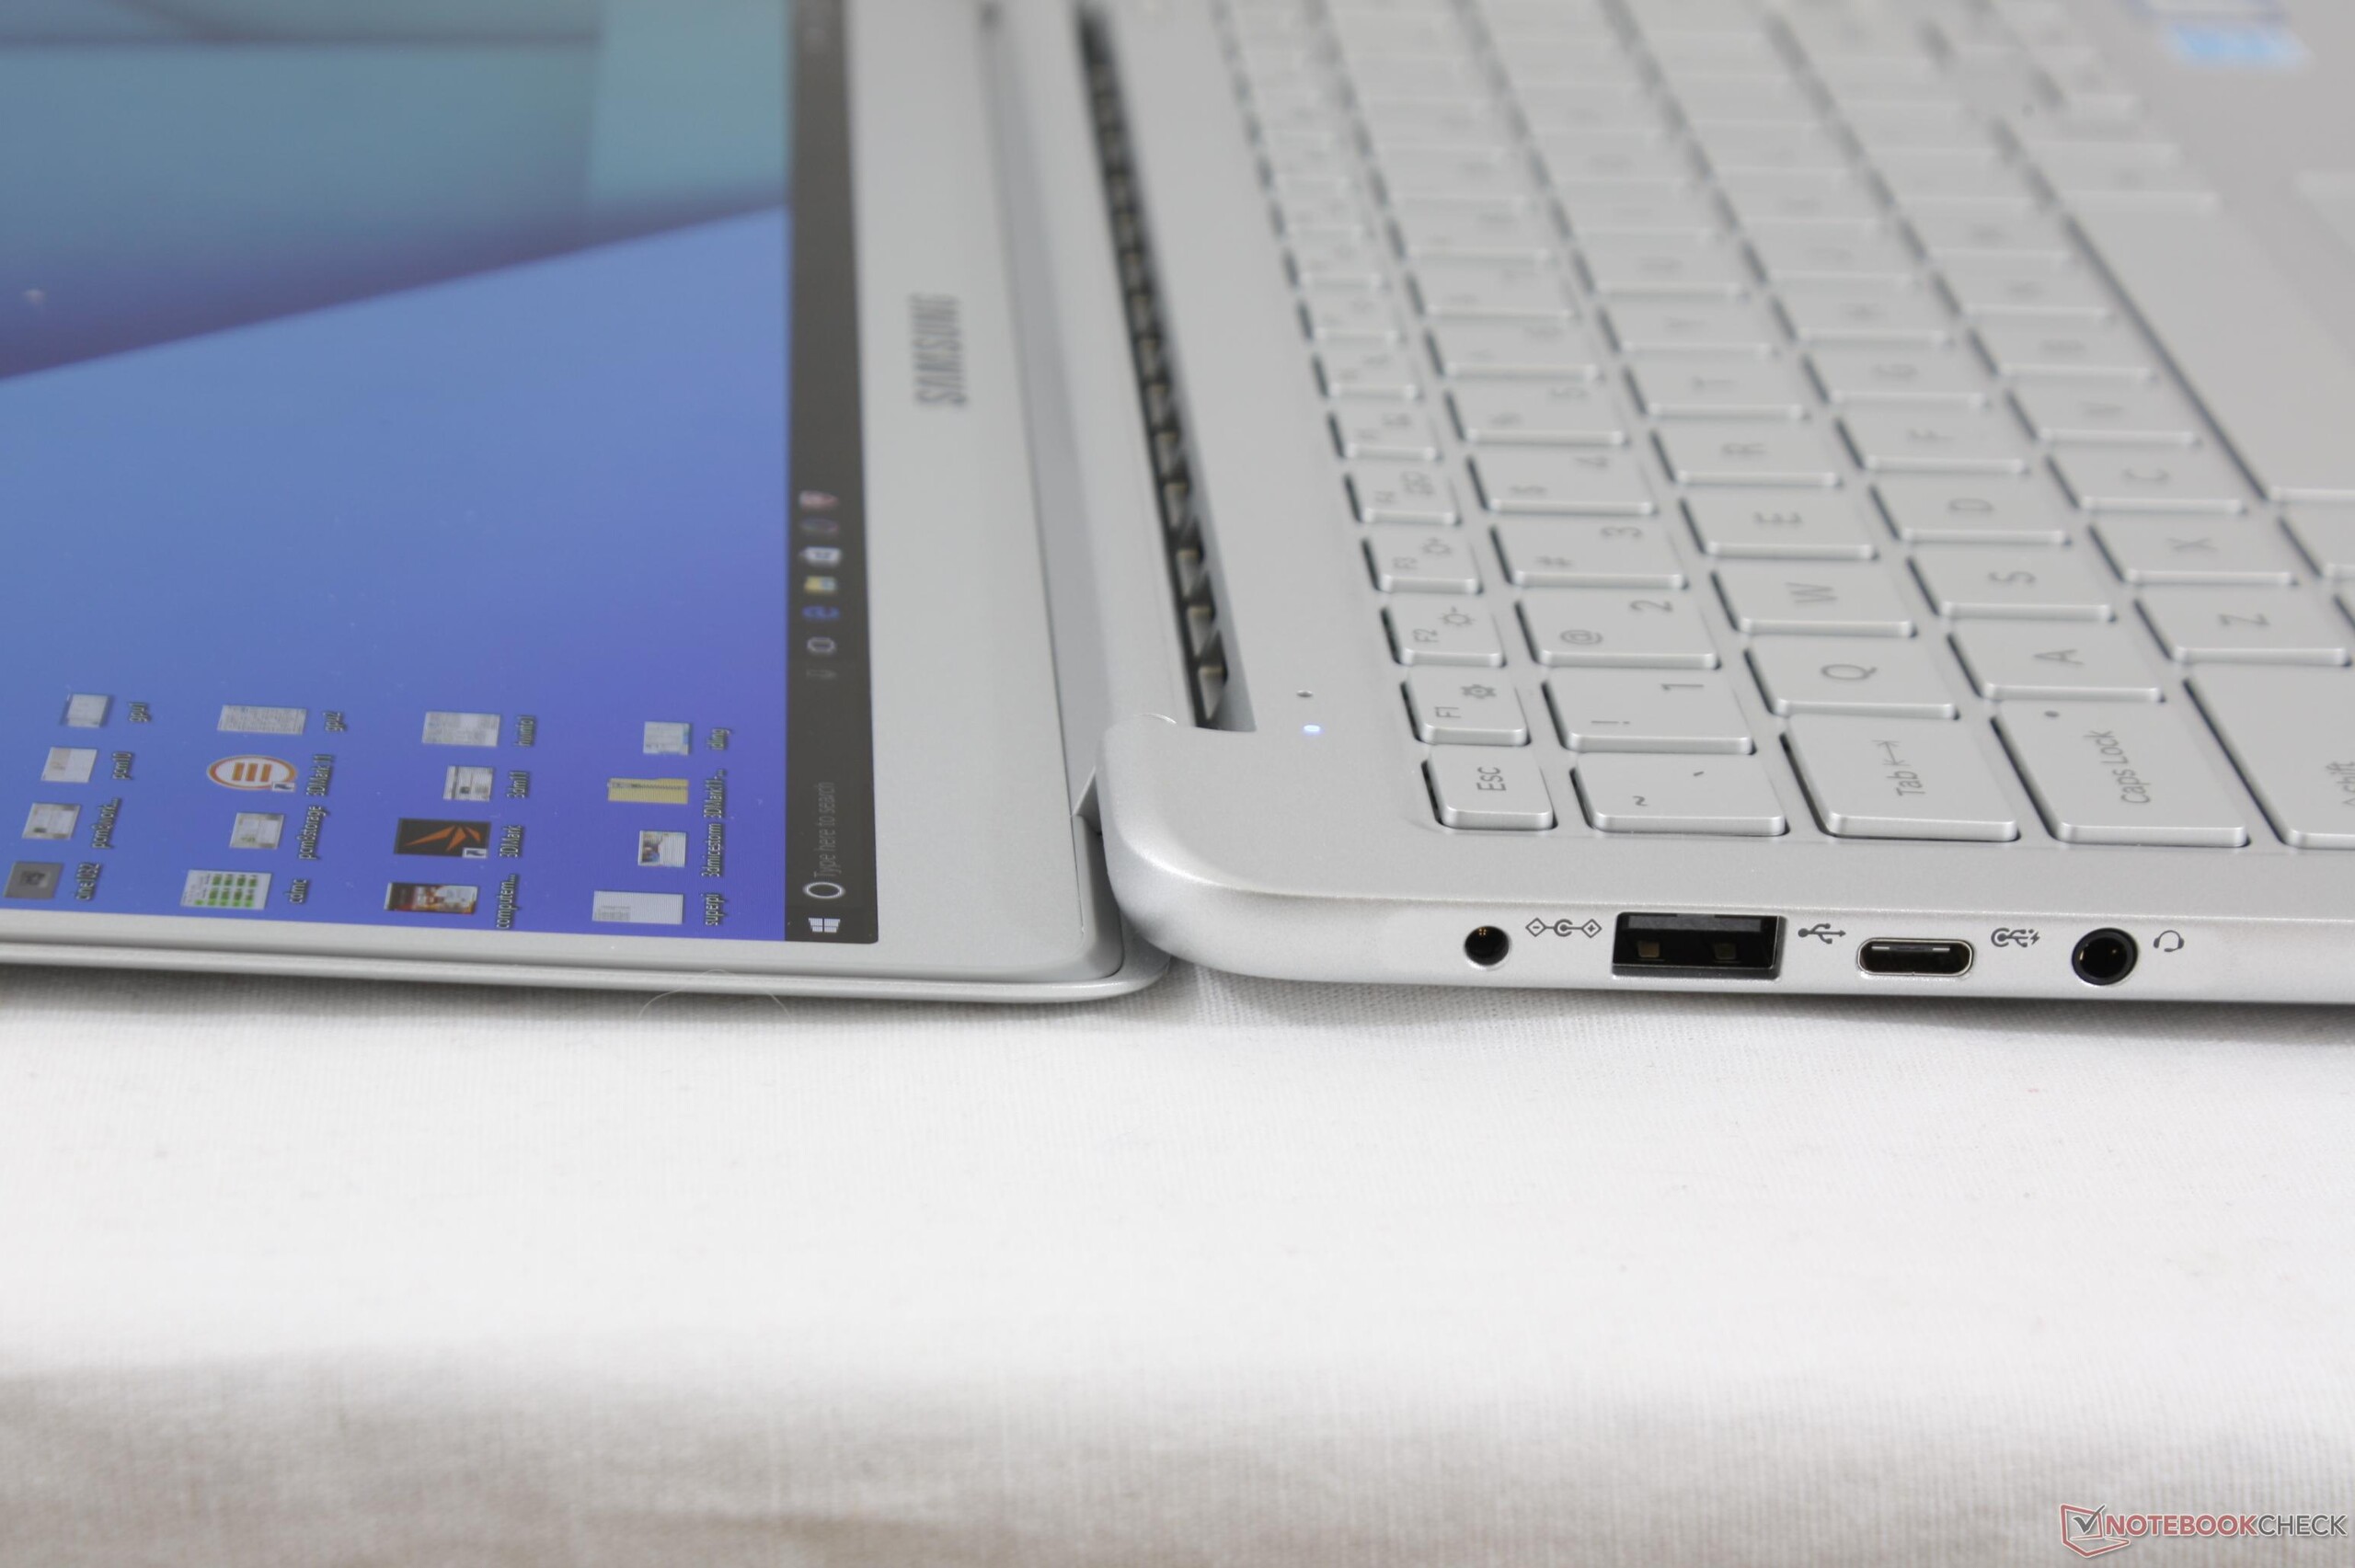
O Notebook 9 de 13 polegadas foi criado com um objetivo em mente - Ser o Ultrabook mais leve e mais brilhante em sua classe de tamanho. A Samsung o eliminou do parque, pois o NP900X3N não é apenas um pouco mais leve e brilhante do que o melhor, mas é significativamente assim. Combine isso com a ventoinha silenciosa, portas USB de tamanho normal e teclado respeitável e este é facilmente o melhor Ultrabook de 13 polegadas para viagens e uso em exteriores.
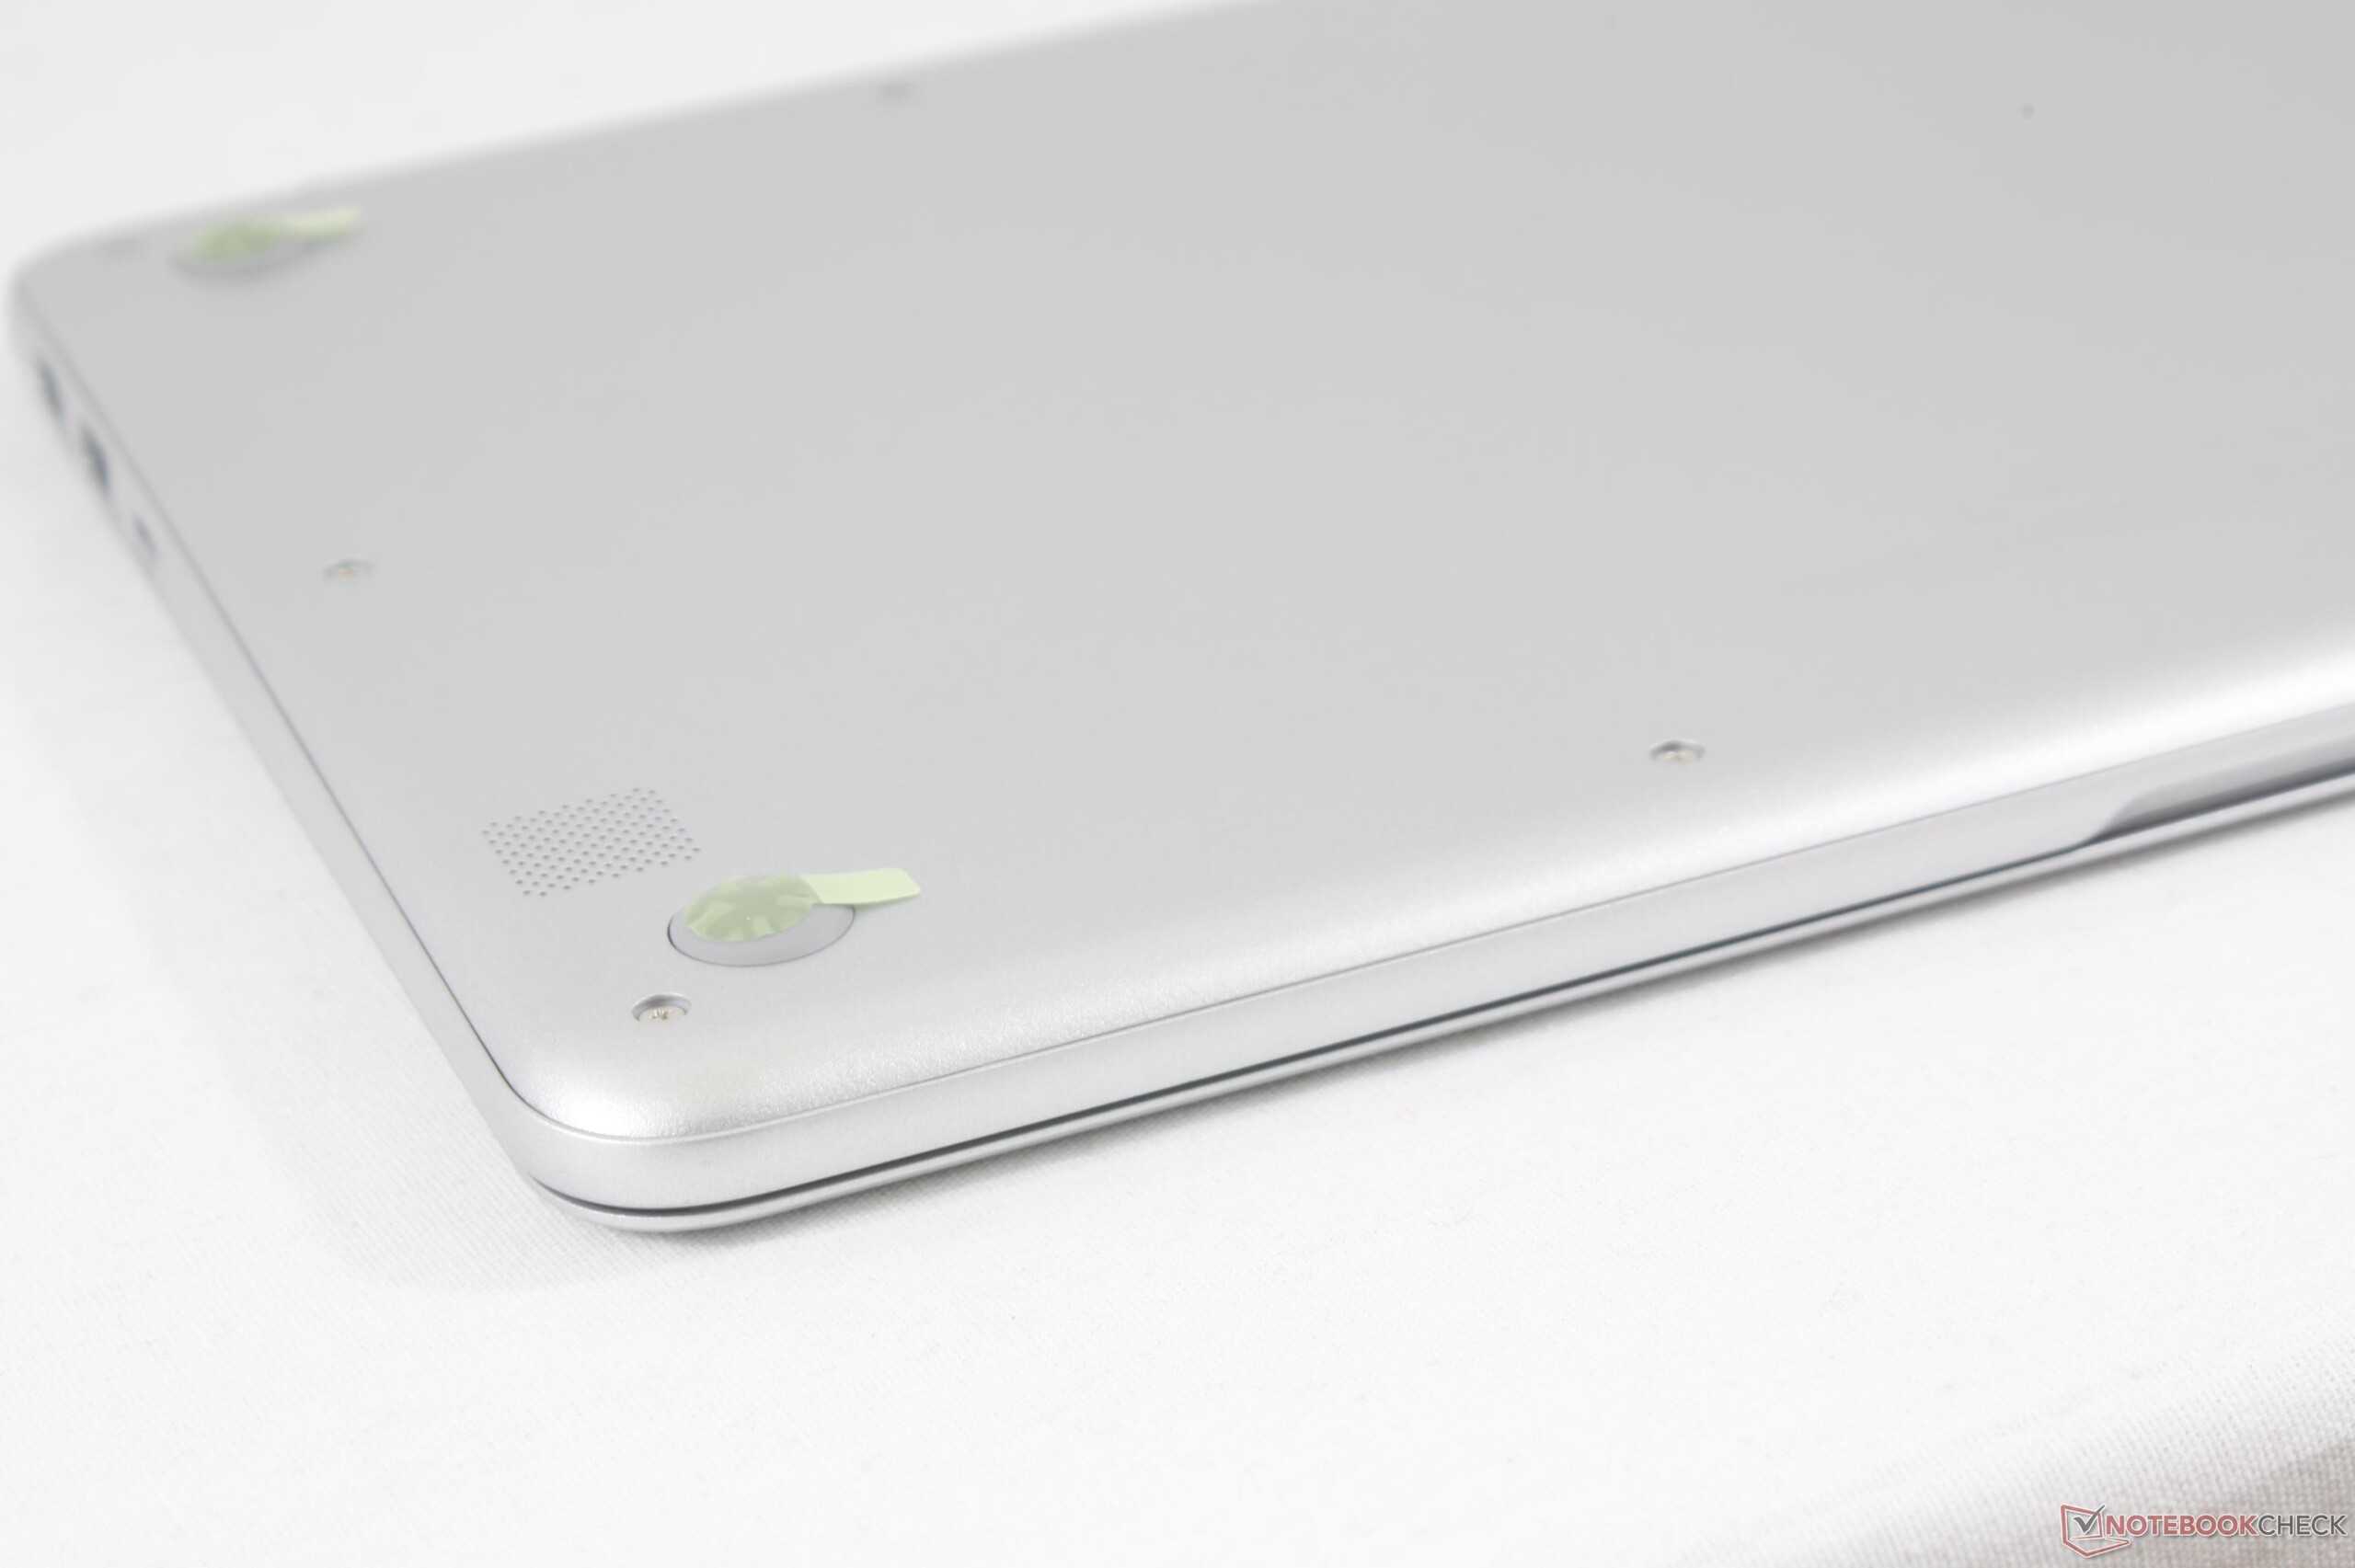
A abordagem feroz da Samsung para criar o mais leve Ultrabook disponível levou a alguns sacrifícios ao longo do caminho. Para manter o peso o mais baixo possível, o sistema não possui opções de tela táctil e Gorilla Glass, e sua solução de resfriamento e capacidade da bateria são bastante pequenas. Esta última revelação em particular resultou em uma duração da bateria abaixo da média para um portátil que de outra forma é excelente para uso em exteriores. A rigidez do chassi, embora não seja ruim, não está exatamente no mesmo nível do XPS 13 ou do MacBook Pro 13.
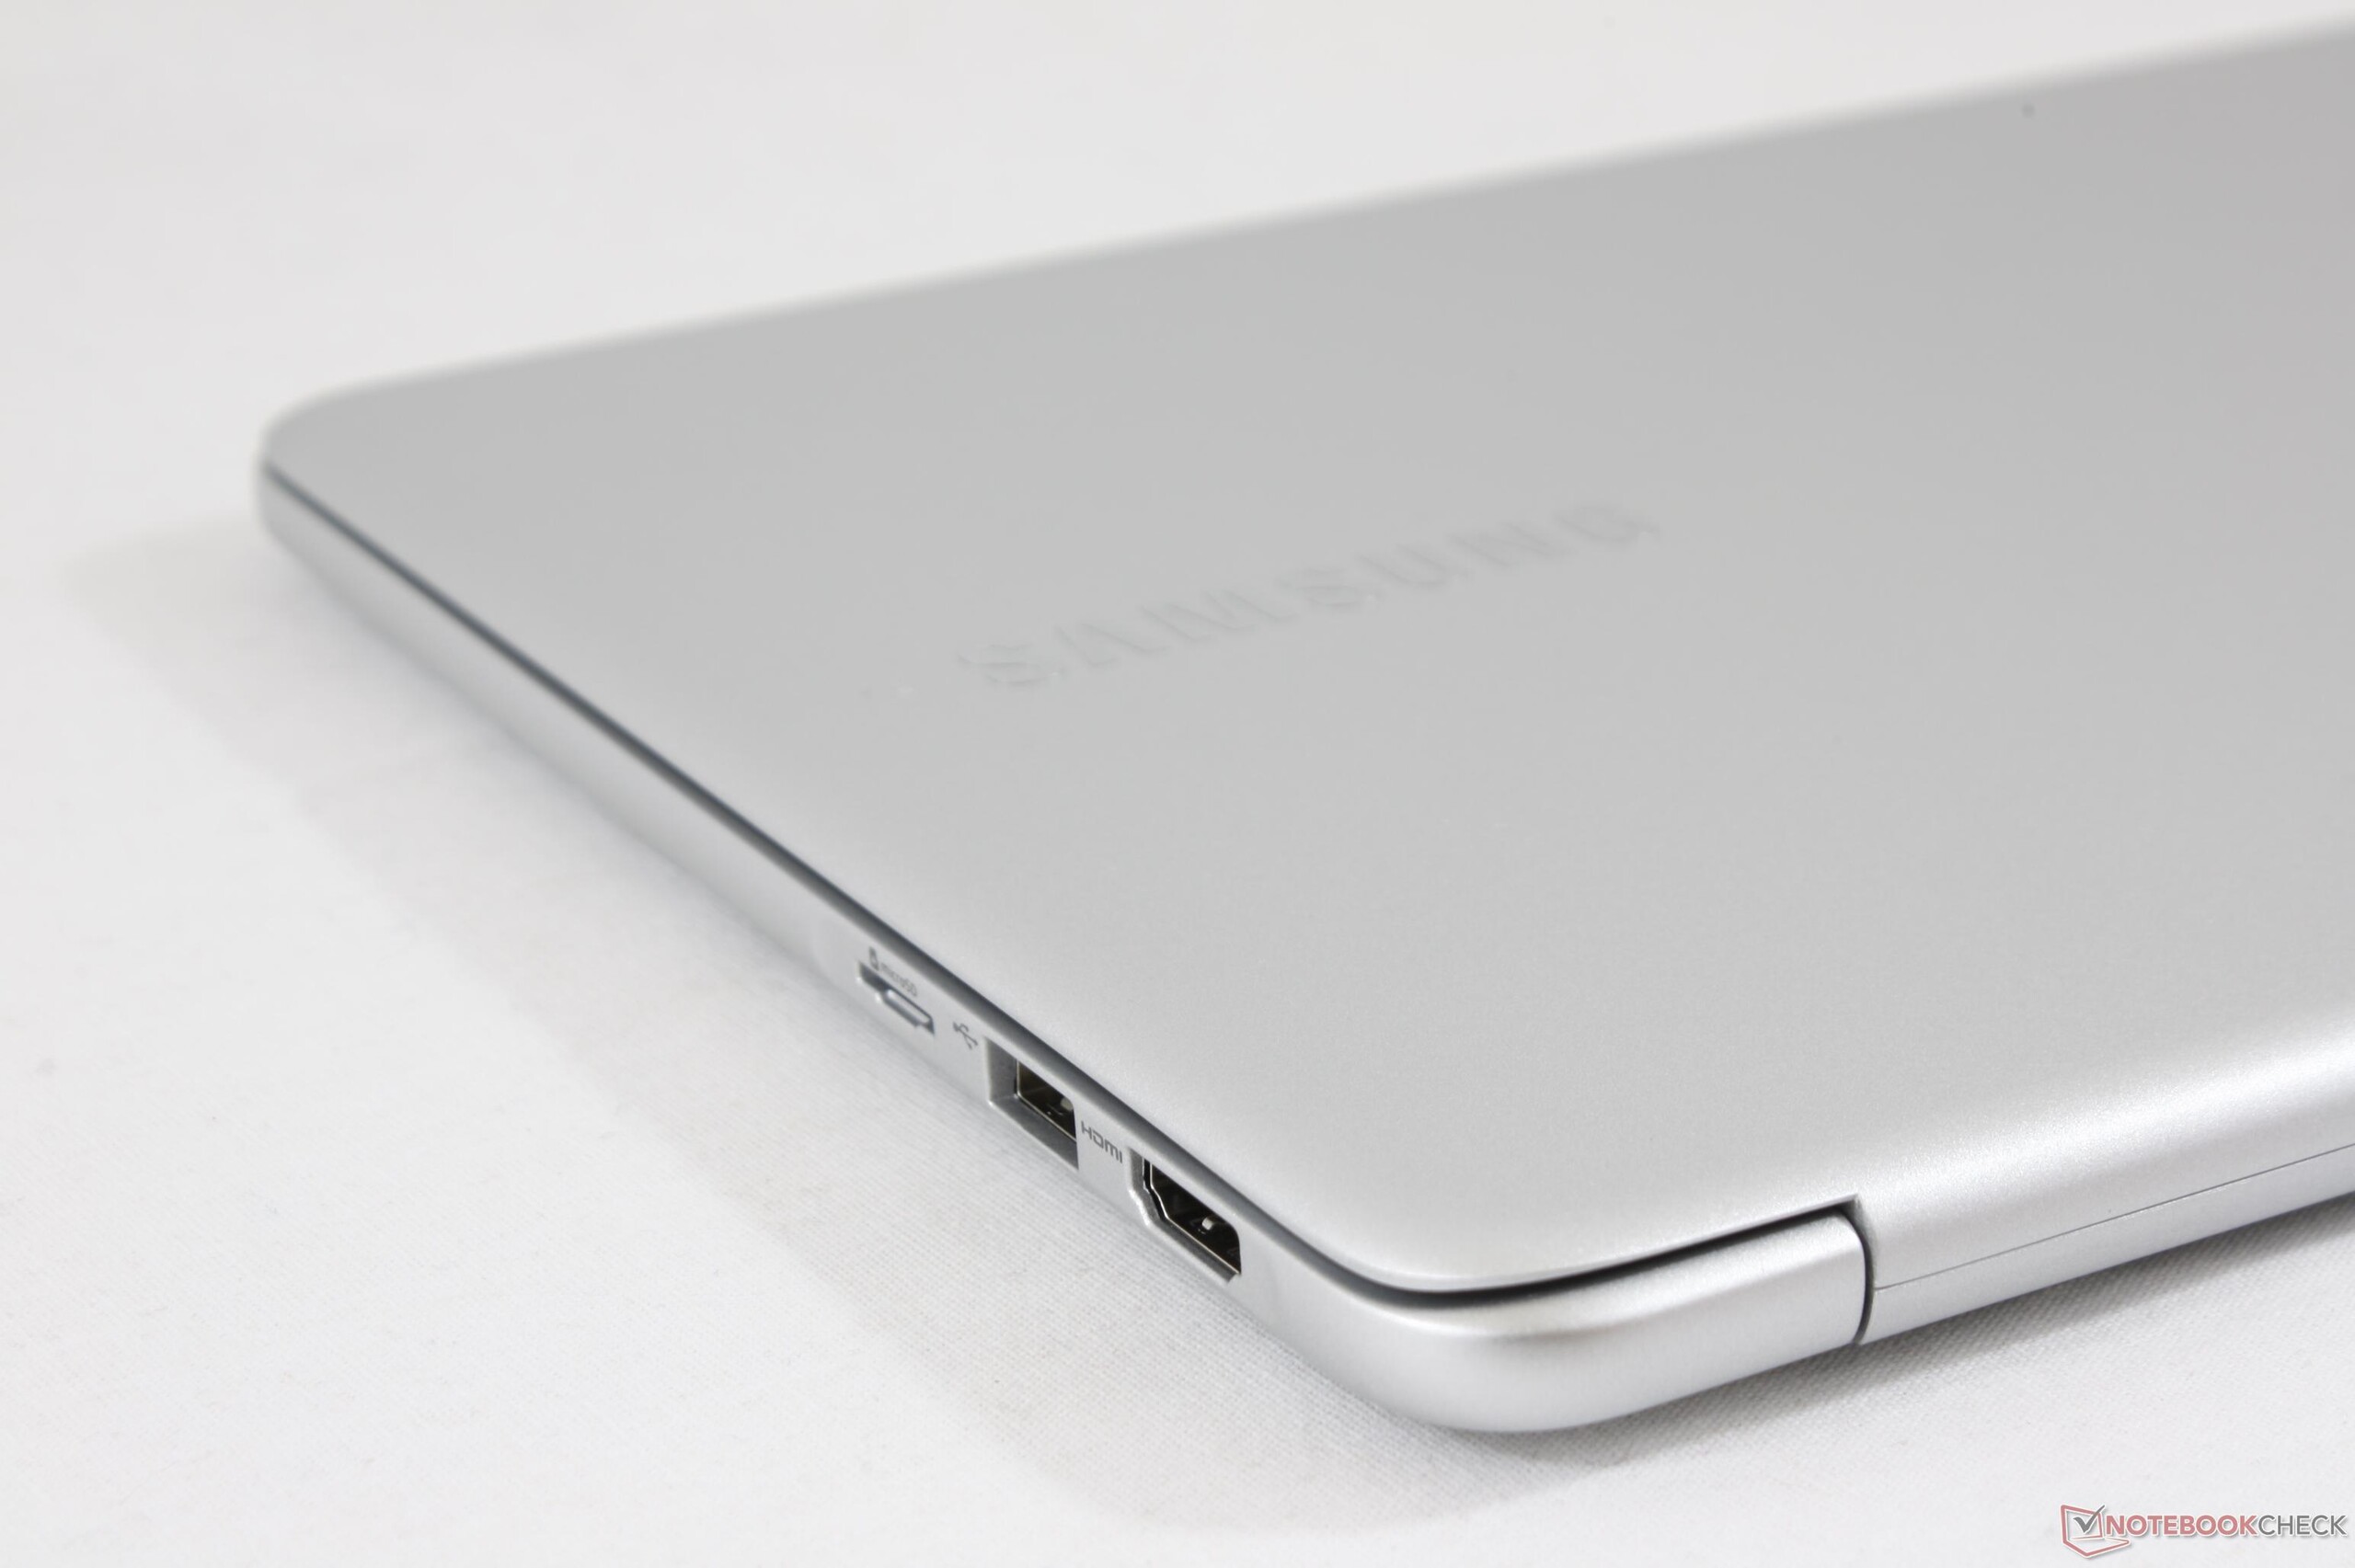
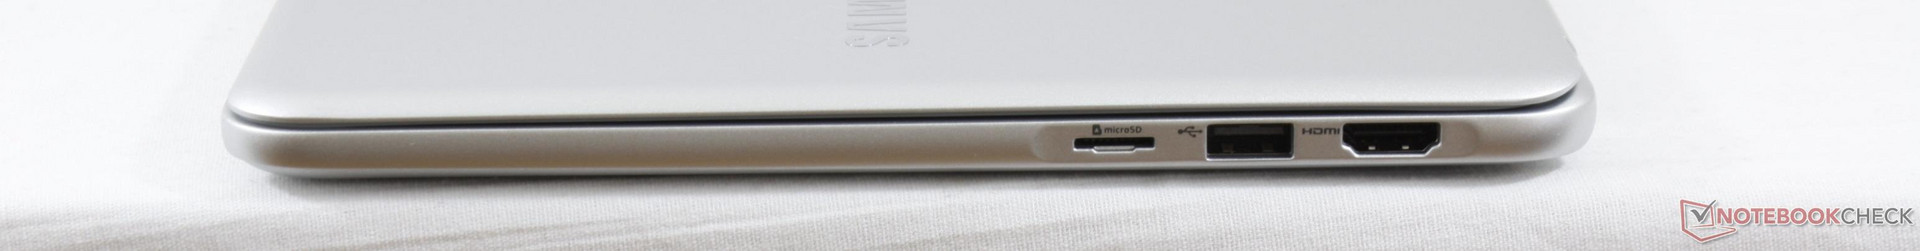
Esperamos que futuras revisões adicionem Thunderbolt 3, compatibilidade com SIM e uma opção de painel mate para tornar o Notebook 9 um companheiro de viagem ainda melhor. Até então, aqueles que querem algo mais leve e brilhante do que um XPS 13 sem sacrificar as portas USB ou HDMI de tamanho normal, como no Zenbook 3, Matebook X, Yoga 910 ou Specter 13, não ficará desapontado com a Samsung.
A tela extra brilhante e o superleve fazem deste portátil de 13 polegadas uma compra muito atraente para qualquer usuário que está constantemente em movimento. Se a duração da bateria durante todo o dia e as capacidades de ancoragem do Thunderbolt 3 forem mais importantes, no entanto, há muitas opções melhores.
Samsung Notebook 9 NP900X3N-K01US
- 08/29/2017 v6 (old)
Allen Ngo
Price comparison
