Breve Análise do Portátil Samsung Notebook 9 NP900X5N (7500U, FHD, GeForce 940MX)
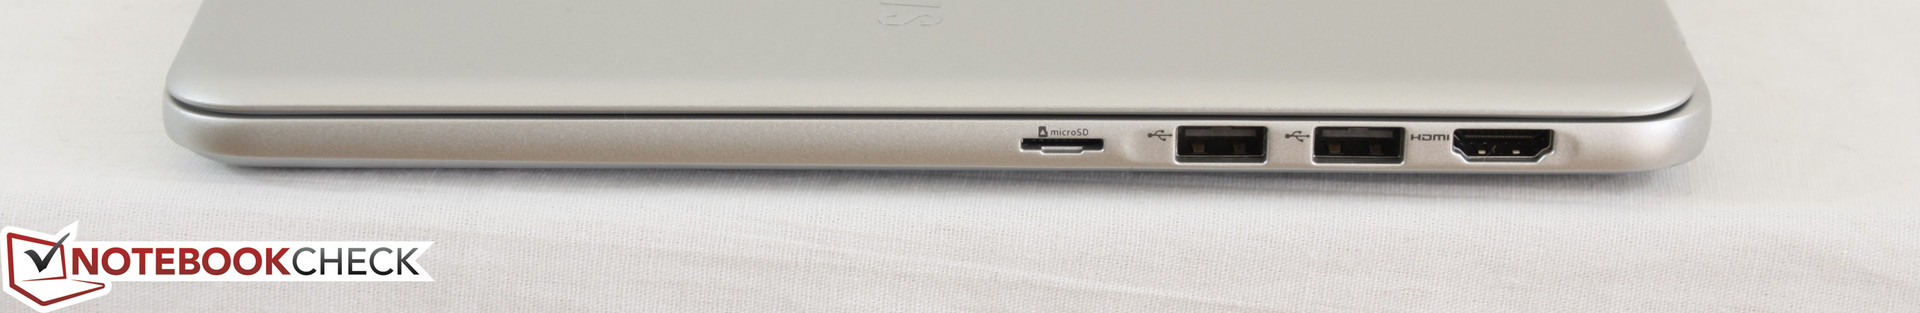
| SD Card Reader | |
| average JPG Copy Test (av. of 3 runs) | |
| Dell XPS 15 9560 (i7-7700HQ, UHD) | |
| Samsung Notebook 9 NP900X5N-X01US | |
| Dell Latitude 12 5285 2-in-1 | |
| maximum AS SSD Seq Read Test (1GB) | |
| Dell XPS 15 9560 (i7-7700HQ, UHD) | |
| Dell Latitude 12 5285 2-in-1 | |
| Samsung Notebook 9 NP900X5N-X01US | |
| Networking | |
| iperf3 transmit AX12 | |
| Dell XPS 15 9560 (i7-7700HQ, UHD) | |
| Samsung Notebook 9 NP900X5N-X01US | |
| Dell XPS 13 9365-4537 2-in-1 | |
| iperf3 receive AX12 | |
| Samsung Notebook 9 NP900X5N-X01US | |
| Dell XPS 15 9560 (i7-7700HQ, UHD) | |
| Dell XPS 13 9365-4537 2-in-1 | |
| |||||||||||||||||||||||||
iluminação: 88 %
iluminação com acumulador: 565.6 cd/m²
Contraste: 1154:1 (Preto: 0.49 cd/m²)
ΔE ColorChecker Calman: 2 | ∀{0.5-29.43 Ø4.71}
ΔE Greyscale Calman: 2.5 | ∀{0.09-98 Ø4.96}
97.5% sRGB (Argyll 1.6.3 3D)
61.2% AdobeRGB 1998 (Argyll 1.6.3 3D)
67.2% AdobeRGB 1998 (Argyll 3D)
97.7% sRGB (Argyll 3D)
65.2% Display P3 (Argyll 3D)
Gamma: 2.21
CCT: 6896 K
| Samsung Notebook 9 NP900X5N-X01US ID: BOE06E8, Name: BOE HF NV150FHB-N31, IPS, 15", 1920x1080 | Dell XPS 15 2017 9560 (7300HQ, Full-HD) Sharp SHP1453 LQ156M1, LED IGZO IPS InfinityEdge, 15.6", 1920x1080 | Apple MacBook Pro 15 2016 (2.9 GHz, 460) Apple APPA030, IPS, 15.4", 2880x1800 | HP Spectre x360 15-bl002xx UHD UWVA eDP BrightView WLED-backlit , IPS, 15.6", 3840x2160 | Lenovo ThinkPad T570-20HAS01E00 BOE NV156QUM-N44, IPS, 15.6", 3840x2160 | |
|---|---|---|---|---|---|
| Display | 4% | 28% | -3% | -0% | |
| Display P3 Coverage (%) | 65.2 | 68.9 6% | 99 52% | 67.9 4% | 70 7% |
| sRGB Coverage (%) | 97.7 | 98.9 1% | 100 2% | 88.2 -10% | 91.1 -7% |
| AdobeRGB 1998 Coverage (%) | 67.2 | 70.9 6% | 87.3 30% | 64.4 -4% | 66.7 -1% |
| Response Times | -47% | -43% | -14% | 26% | |
| Response Time Grey 50% / Grey 80% * (ms) | 40.8 ? | 54 ? -32% | 46 ? -13% | 44 ? -8% | 41.6 ? -2% |
| Response Time Black / White * (ms) | 32.4 ? | 52.4 ? -62% | 56 ? -73% | 38.8 ? -20% | 15.2 ? 53% |
| PWM Frequency (Hz) | 208.3 ? | 119000 ? | 1000 ? | 926 ? | |
| Screen | -42% | -3% | -9% | -35% | |
| Brightness middle (cd/m²) | 565.6 | 400 -29% | 420 -26% | 351.5 -38% | 339 -40% |
| Brightness (cd/m²) | 524 | 392 -25% | 401 -23% | 336 -36% | 314 -40% |
| Brightness Distribution (%) | 88 | 89 1% | 90 2% | 83 -6% | 89 1% |
| Black Level * (cd/m²) | 0.49 | 0.26 47% | 0.3 39% | 0.24 51% | 0.36 27% |
| Contrast (:1) | 1154 | 1538 33% | 1400 21% | 1465 27% | 942 -18% |
| Colorchecker dE 2000 * | 2 | 4.9 -145% | 3.33 -67% | 3.3 -65% | 4.2 -110% |
| Colorchecker dE 2000 max. * | 5 | 11 -120% | 5.11 -2% | 7.3 -46% | 7.8 -56% |
| Greyscale dE 2000 * | 2.5 | 7.2 -188% | 2.73 -9% | 1.9 24% | 5.1 -104% |
| Gamma | 2.21 100% | 2.11 104% | 2.48 89% | 2.09 105% | 2.16 102% |
| CCT | 6896 94% | 6911 94% | 6457 101% | 6784 96% | 6569 99% |
| Color Space (Percent of AdobeRGB 1998) (%) | 61.2 | 64.2 5% | 78.09 28% | 64.4 5% | 59.4 -3% |
| Color Space (Percent of sRGB) (%) | 97.5 | 98.9 1% | 99.97 3% | 88.2 -10% | 91 -7% |
| Média Total (Programa/Configurações) | -28% /
-33% | -6% /
-2% | -9% /
-9% | -3% /
-20% |
* ... menor é melhor
Exibir tempos de resposta
| ↔ Tempo de resposta preto para branco | ||
|---|---|---|
| 32.4 ms ... ascensão ↗ e queda ↘ combinadas | ↗ 17.6 ms ascensão | 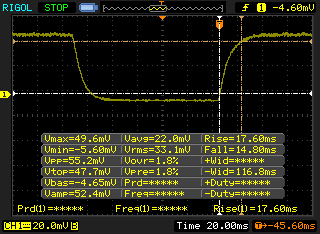 |
| ↘ 14.8 ms queda | ||
| A tela mostra taxas de resposta lentas em nossos testes e será insatisfatória para os jogadores. Em comparação, todos os dispositivos testados variam de 0.1 (mínimo) a 240 (máximo) ms. » 88 % de todos os dispositivos são melhores. Isso significa que o tempo de resposta medido é pior que a média de todos os dispositivos testados (19.8 ms). | ||
| ↔ Tempo de resposta 50% cinza a 80% cinza | ||
| 40.8 ms ... ascensão ↗ e queda ↘ combinadas | ↗ 20.4 ms ascensão | 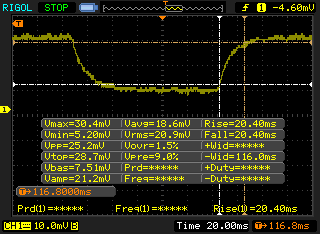 |
| ↘ 20.4 ms queda | ||
| A tela mostra taxas de resposta lentas em nossos testes e será insatisfatória para os jogadores. Em comparação, todos os dispositivos testados variam de 0.165 (mínimo) a 636 (máximo) ms. » 64 % de todos os dispositivos são melhores. Isso significa que o tempo de resposta medido é pior que a média de todos os dispositivos testados (31 ms). | ||
Cintilação da tela / PWM (modulação por largura de pulso)
| Tela tremeluzindo/PWM detectado | 208.3 Hz | ≤ 99 % configuração de brilho | 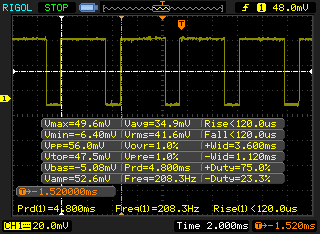 |
A luz de fundo da tela pisca em 208.3 Hz (pior caso, por exemplo, utilizando PWM) Cintilação detectada em uma configuração de brilho de 99 % e abaixo. Não deve haver cintilação ou PWM acima desta configuração de brilho. A frequência de 208.3 Hz é relativamente baixa, portanto, usuários sensíveis provavelmente notarão cintilação e sentirão fadiga ocular na configuração de brilho indicada e abaixo. [pwm_comparison] Em comparação: 52 % de todos os dispositivos testados não usam PWM para escurecer a tela. Se PWM foi detectado, uma média de 7754 (mínimo: 5 - máximo: 343500) Hz foi medida. | |||
| Cinebench R11.5 | |
| CPU Single 64Bit | |
| Lenovo ThinkPad 13-20J2S00G00 | |
| Samsung Notebook 9 NP900X5N-X01US | |
| Dell Latitude 5280 | |
| Lenovo U31-70 80M5003EGE | |
| Toshiba Portege Z30t-A-10X | |
| Acer TravelMate P449-M-7407 | |
| Lenovo Thinkpad 13-20J1001BUS | |
| CPU Multi 64Bit | |
| Lenovo ThinkPad 13-20J2S00G00 | |
| Samsung Notebook 9 NP900X5N-X01US | |
| Dell Latitude 5280 | |
| Acer TravelMate P449-M-7407 | |
| Lenovo U31-70 80M5003EGE | |
| Lenovo Thinkpad 13-20J1001BUS | |
| Toshiba Portege Z30t-A-10X | |
| Cinebench R10 | |
| Rendering Multiple CPUs 32Bit | |
| Apple MacBook Pro 15 2016 (2.7 GHz, 455) | |
| Samsung Notebook 9 NP900X5N-X01US | |
| Dell Latitude 5280 | |
| Lenovo ThinkPad 13-20J2S00G00 | |
| Lenovo U31-70 80M5003EGE | |
| Acer TravelMate P449-M-7407 | |
| Lenovo Thinkpad 13-20J1001BUS | |
| Toshiba Portege Z30t-A-10X | |
| Rendering Single 32Bit | |
| Samsung Notebook 9 NP900X5N-X01US | |
| Apple MacBook Pro 15 2016 (2.7 GHz, 455) | |
| Dell Latitude 5280 | |
| Lenovo ThinkPad 13-20J2S00G00 | |
| Acer TravelMate P449-M-7407 | |
| Lenovo U31-70 80M5003EGE | |
| Toshiba Portege Z30t-A-10X | |
| Lenovo Thinkpad 13-20J1001BUS | |
| wPrime 2.10 - 1024m | |
| Lenovo Thinkpad 13-20J1001BUS | |
| Acer TravelMate P449-M-7407 | |
| Dell Latitude 5280 | |
| Samsung Notebook 9 NP900X5N-X01US | |
| Apple MacBook Pro 15 2016 (2.7 GHz, 455) | |
* ... menor é melhor
| PCMark 8 | |
| Home Score Accelerated v2 | |
| Apple MacBook Pro 15 2016 (2.9 GHz, 460) | |
| Samsung Notebook 9 NP900X5N-X01US | |
| Dell XPS 15 9560 (i7-7700HQ, UHD) | |
| Work Score Accelerated v2 | |
| Samsung Notebook 9 NP900X5N-X01US | |
| Apple MacBook Pro 15 2016 (2.9 GHz, 460) | |
| Dell XPS 15 9560 (i7-7700HQ, UHD) | |
| Creative Score Accelerated v2 | |
| Dell XPS 15 9560 (i7-7700HQ, UHD) | |
| Apple MacBook Pro 15 2016 (2.9 GHz, 460) | |
| Samsung Notebook 9 NP900X5N-X01US | |
| PCMark 8 Home Score Accelerated v2 | 3852 pontos | |
| PCMark 8 Creative Score Accelerated v2 | 4769 pontos | |
| PCMark 8 Work Score Accelerated v2 | 4928 pontos | |
Ajuda | ||
| Samsung Notebook 9 NP900X5N-X01US Samsung PM961 MZVLW256HEHP | Dell XPS 15 9560 (i7-7700HQ, UHD) Lite-On CX2-8B512-Q11 | Apple MacBook Pro 15 2016 (2.9 GHz, 460) Apple SSD SM1024L | HP Spectre x360 15-bl002xx Toshiba XG4 NVMe (THNSN5512GPUK) | Lenovo ThinkPad T570-20HAS01E00 Samsung PM961 NVMe MZVLW512HMJP | |
|---|---|---|---|---|---|
| CrystalDiskMark 3.0 | 8% | -3% | -6% | 5% | |
| Read Seq (MB/s) | 1447 | 1684 16% | 1458 1% | 1266 -13% | 1210 -16% |
| Write Seq (MB/s) | 1281 | 1106 -14% | 1440 12% | 982 -23% | 1134 -11% |
| Read 512 (MB/s) | 651 | 977 50% | 914 40% | 834 28% | 789 21% |
| Write 512 (MB/s) | 765 | 1119 46% | 1058 38% | 714 -7% | 903 18% |
| Read 4k (MB/s) | 58.3 | 45.14 -23% | 9.786 -83% | 40.72 -30% | 58.4 0% |
| Write 4k (MB/s) | 131.9 | 134.1 2% | 10.9 -92% | 139.4 6% | 144.1 9% |
| Read 4k QD32 (MB/s) | 545 | 509 -7% | 679 25% | 527 -3% | 559 3% |
| Write 4k QD32 (MB/s) | 419.3 | 398.1 -5% | 562 34% | 395.2 -6% | 474.4 13% |

| 3DMark 11 | |
| 1280x720 Performance GPU | |
| Intel Skull Canyon NUC6i7KYK | |
| Apple MacBook Pro 13 2016 (2.9 GHz) | |
| Asus AsusPro P4540UQ-FY0056R | |
| HP Spectre x360 15-bl002xx | |
| Samsung Notebook 9 NP900X5N-X01US | |
| HP 15-ba077ng | |
| Dell Latitude 5280 | |
| Apple MacBook 12 (Early 2016) 1.2 GHz | |
| Toshiba Satellite Pro R50-C-16V | |
| 1280x720 Performance Combined | |
| Intel Skull Canyon NUC6i7KYK | |
| HP Spectre x360 15-bl002xx | |
| Apple MacBook Pro 13 2016 (2.9 GHz) | |
| Asus AsusPro P4540UQ-FY0056R | |
| Samsung Notebook 9 NP900X5N-X01US | |
| HP 15-ba077ng | |
| Apple MacBook 12 (Early 2016) 1.2 GHz | |
| Dell Latitude 5280 | |
| Toshiba Satellite Pro R50-C-16V | |
| 3DMark | |
| 1280x720 Cloud Gate Standard Graphics | |
| Intel Skull Canyon NUC6i7KYK | |
| Apple MacBook Pro 13 2016 (2.9 GHz) | |
| HP Spectre x360 15-bl002xx | |
| Asus AsusPro P4540UQ-FY0056R | |
| Samsung Notebook 9 NP900X5N-X01US | |
| HP 15-ba077ng | |
| Apple MacBook 12 (Early 2016) 1.2 GHz | |
| Dell Latitude 5280 | |
| 1920x1080 Fire Strike Graphics | |
| HP Spectre x360 15-bl002xx | |
| Asus AsusPro P4540UQ-FY0056R | |
| Intel Skull Canyon NUC6i7KYK | |
| Apple MacBook Pro 13 2016 (2.9 GHz) | |
| Samsung Notebook 9 NP900X5N-X01US | |
| HP 15-ba077ng | |
| Apple MacBook 12 (Early 2016) 1.2 GHz | |
| Dell Latitude 5280 | |
| 1920x1080 Ice Storm Extreme Graphics | |
| Intel Skull Canyon NUC6i7KYK | |
| Samsung Notebook 9 NP900X5N-X01US | |
| HP 15-ba077ng | |
| Dell Latitude 5280 | |
| HP Spectre x360 15-bl002xx | |
| 3DMark 11 Performance | 2372 pontos | |
| 3DMark Ice Storm Standard Score | 49982 pontos | |
| 3DMark Cloud Gate Standard Score | 6800 pontos | |
| 3DMark Fire Strike Score | 1408 pontos | |
| 3DMark Fire Strike Extreme Score | 722 pontos | |
Ajuda | ||
| BioShock Infinite - 1366x768 High Preset | |
| Lenovo ThinkPad T570-20HAS01E00 | |
| Intel Skull Canyon NUC6i7KYK | |
| Apple MacBook Pro 13 2016 (2.9 GHz) | |
| Samsung Notebook 9 NP900X5N-X01US | |
| Dell Latitude 5280 | |
| Toshiba Satellite Pro R50-C-16V | |
| baixo | média | alto | ultra | |
|---|---|---|---|---|
| BioShock Infinite (2013) | 89.8 | 48.7 | 39.3 | 13.5 |
| The Witcher 3 (2015) | 31 | |||
| Dota 2 Reborn (2015) | 95 | 64 | 24 | |
| Rise of the Tomb Raider (2016) | 37.4 | 20.5 | 10.9 | |
| Overwatch (2016) | 65.2 | 44.8 |
Barulho
| Ocioso |
| 28.3 / 28.3 / 28.3 dB |
| Carga |
| 38.3 / 38.3 dB |
 | ||
30 dB silencioso 40 dB(A) audível 50 dB(A) ruidosamente alto |
||
min: | ||
| Samsung Notebook 9 NP900X5N-X01US GeForce 940MX, i7-7500U, Samsung PM961 MZVLW256HEHP | Dell XPS 15 9560 (i7-7700HQ, UHD) GeForce GTX 1050 Mobile, i7-7700HQ, Lite-On CX2-8B512-Q11 | Apple MacBook Pro 15 2016 (2.9 GHz, 460) Radeon Pro 460, 6920HQ, Apple SSD SM1024L | HP Spectre x360 15-bl002xx GeForce 940MX, i7-7500U, Toshiba XG4 NVMe (THNSN5512GPUK) | Lenovo ThinkPad T570-20HAS01E00 GeForce 940MX, i7-7500U, Samsung PM961 NVMe MZVLW512HMJP | |
|---|---|---|---|---|---|
| Noise | -11% | -6% | -9% | -4% | |
| desligado / ambiente * (dB) | 28.3 | 28.4 -0% | 29 -2% | 28.5 -1% | 29.3 -4% |
| Idle Minimum * (dB) | 28.3 | 29 -2% | 30.3 -7% | 28.5 -1% | 29.3 -4% |
| Idle Average * (dB) | 28.3 | 29 -2% | 30.3 -7% | 28.5 -1% | 29.3 -4% |
| Idle Maximum * (dB) | 28.3 | 32.2 -14% | 30.3 -7% | 36.3 -28% | 31.1 -10% |
| Load Average * (dB) | 38.3 | 47.1 -23% | 35.1 8% | 42.7 -11% | 35.2 8% |
| Load Maximum * (dB) | 38.3 | 47.1 -23% | 46 -20% | 42.7 -11% | 41.3 -8% |
| Witcher 3 ultra * (dB) | 52 |
* ... menor é melhor
(±) A temperatura máxima no lado superior é 40.4 °C / 105 F, em comparação com a média de 36.8 °C / 98 F , variando de 21 a 71 °C para a classe Multimedia.
(±) A parte inferior aquece até um máximo de 42.4 °C / 108 F, em comparação com a média de 39.1 °C / 102 F
(+) Em uso inativo, a temperatura média para o lado superior é 22 °C / 72 F, em comparação com a média do dispositivo de 31.3 °C / ### class_avg_f### F.
(+) Os apoios para as mãos e o touchpad são mais frios que a temperatura da pele, com um máximo de 31.6 °C / 88.9 F e, portanto, são frios ao toque.
(-) A temperatura média da área do apoio para as mãos de dispositivos semelhantes foi 28.7 °C / 83.7 F (-2.9 °C / -5.2 F).
Samsung Notebook 9 NP900X5N-X01US análise de áudio
(-) | alto-falantes não muito altos (###valor### dB)
Graves 100 - 315Hz
(-) | quase nenhum baixo - em média 16% menor que a mediana
(±) | a linearidade dos graves é média (13.2% delta para a frequência anterior)
Médios 400 - 2.000 Hz
(+) | médios equilibrados - apenas 3.8% longe da mediana
(+) | médios são lineares (6.8% delta para frequência anterior)
Altos 2 - 16 kHz
(+) | agudos equilibrados - apenas 4.4% longe da mediana
(±) | a linearidade dos máximos é média (13.7% delta para frequência anterior)
Geral 100 - 16.000 Hz
(±) | a linearidade do som geral é média (29.8% diferença em relação à mediana)
Comparado com a mesma classe
» 95% de todos os dispositivos testados nesta classe foram melhores, 2% semelhantes, 3% piores
» O melhor teve um delta de 5%, a média foi 17%, o pior foi 45%
Comparado com todos os dispositivos testados
» 88% de todos os dispositivos testados foram melhores, 3% semelhantes, 9% piores
» O melhor teve um delta de 4%, a média foi 23%, o pior foi 134%
Apple MacBook 12 (Early 2016) 1.1 GHz análise de áudio
(+) | os alto-falantes podem tocar relativamente alto (###valor### dB)
Graves 100 - 315Hz
(±) | graves reduzidos - em média 11.3% menor que a mediana
(±) | a linearidade dos graves é média (14.2% delta para a frequência anterior)
Médios 400 - 2.000 Hz
(+) | médios equilibrados - apenas 2.4% longe da mediana
(+) | médios são lineares (5.5% delta para frequência anterior)
Altos 2 - 16 kHz
(+) | agudos equilibrados - apenas 2% longe da mediana
(+) | os máximos são lineares (4.5% delta da frequência anterior)
Geral 100 - 16.000 Hz
(+) | o som geral é linear (10.2% diferença em relação à mediana)
Comparado com a mesma classe
» 7% de todos os dispositivos testados nesta classe foram melhores, 2% semelhantes, 90% piores
» O melhor teve um delta de 5%, a média foi 18%, o pior foi 53%
Comparado com todos os dispositivos testados
» 5% de todos os dispositivos testados foram melhores, 1% semelhantes, 94% piores
» O melhor teve um delta de 4%, a média foi 23%, o pior foi 134%
| desligado | |
| Ocioso | |
| Carga |
|
Key:
min: | |
| Samsung Notebook 9 NP900X5N-X01US i7-7500U, GeForce 940MX, Samsung PM961 MZVLW256HEHP, IPS, 1920x1080, 15" | Dell XPS 15 9560 (i7-7700HQ, UHD) i7-7700HQ, GeForce GTX 1050 Mobile, Lite-On CX2-8B512-Q11, IGZO IPS, 3840x2160, 15.6" | Apple MacBook Pro 15 2016 (2.9 GHz, 460) 6920HQ, Radeon Pro 460, Apple SSD SM1024L, IPS, 2880x1800, 15.4" | HP Spectre x360 15-bl002xx i7-7500U, GeForce 940MX, Toshiba XG4 NVMe (THNSN5512GPUK), IPS, 3840x2160, 15.6" | Asus VivoBook S15 S510UA i5-7200U, HD Graphics 620, Toshiba HG6 THNSNJ128G8NY, IPS, 1920x1080, 15.6" | |
|---|---|---|---|---|---|
| Power Consumption | -91% | -12% | -18% | 28% | |
| Idle Minimum * (Watt) | 5 | 11.9 -138% | 3 40% | 8.14 -63% | 4.6 8% |
| Idle Average * (Watt) | 11.6 | 17.1 -47% | 9.9 15% | 10.91 6% | 7.6 34% |
| Idle Maximum * (Watt) | 12.2 | 17.3 -42% | 12.5 -2% | 12.26 -0% | 7.7 37% |
| Load Average * (Watt) | 47.8 | 94.7 -98% | 70.6 -48% | 45.67 4% | 35.1 27% |
| Witcher 3 ultra * (Watt) | 51.9 | 104.8 -102% | |||
| Load Maximum * (Watt) | 55.7 | 122 -119% | 90.8 -63% | 74.94 -35% | 36.2 35% |
* ... menor é melhor
| Samsung Notebook 9 NP900X5N-X01US i7-7500U, GeForce 940MX, 66 Wh | Dell XPS 15 9560 (i7-7700HQ, UHD) i7-7700HQ, GeForce GTX 1050 Mobile, 97 Wh | Apple MacBook Pro 15 2016 (2.9 GHz, 460) 6920HQ, Radeon Pro 460, 76 Wh | HP Spectre x360 15-bl002xx i7-7500U, GeForce 940MX, 79.2 Wh | Asus VivoBook S15 S510UA i5-7200U, HD Graphics 620, 42 Wh | Apple MacBook 13" T7200, Graphics Media Accelerator (GMA) 950, Wh | |
|---|---|---|---|---|---|---|
| Duração da bateria | -30% | -26% | -9% | -52% | -36% | |
| Reader / Idle (h) | 27.4 | 13.9 -49% | 14.4 -47% | 10.2 -63% | 6.5 -76% | |
| WiFi v1.3 (h) | 10.1 | 7.2 -29% | 10.3 2% | 8.9 -12% | 4.3 -57% | |
| Load (h) | 1.9 | 1.7 -11% | 0.9 -53% | 2.5 32% | 1.2 -37% | 2 5% |
Pro
Contra
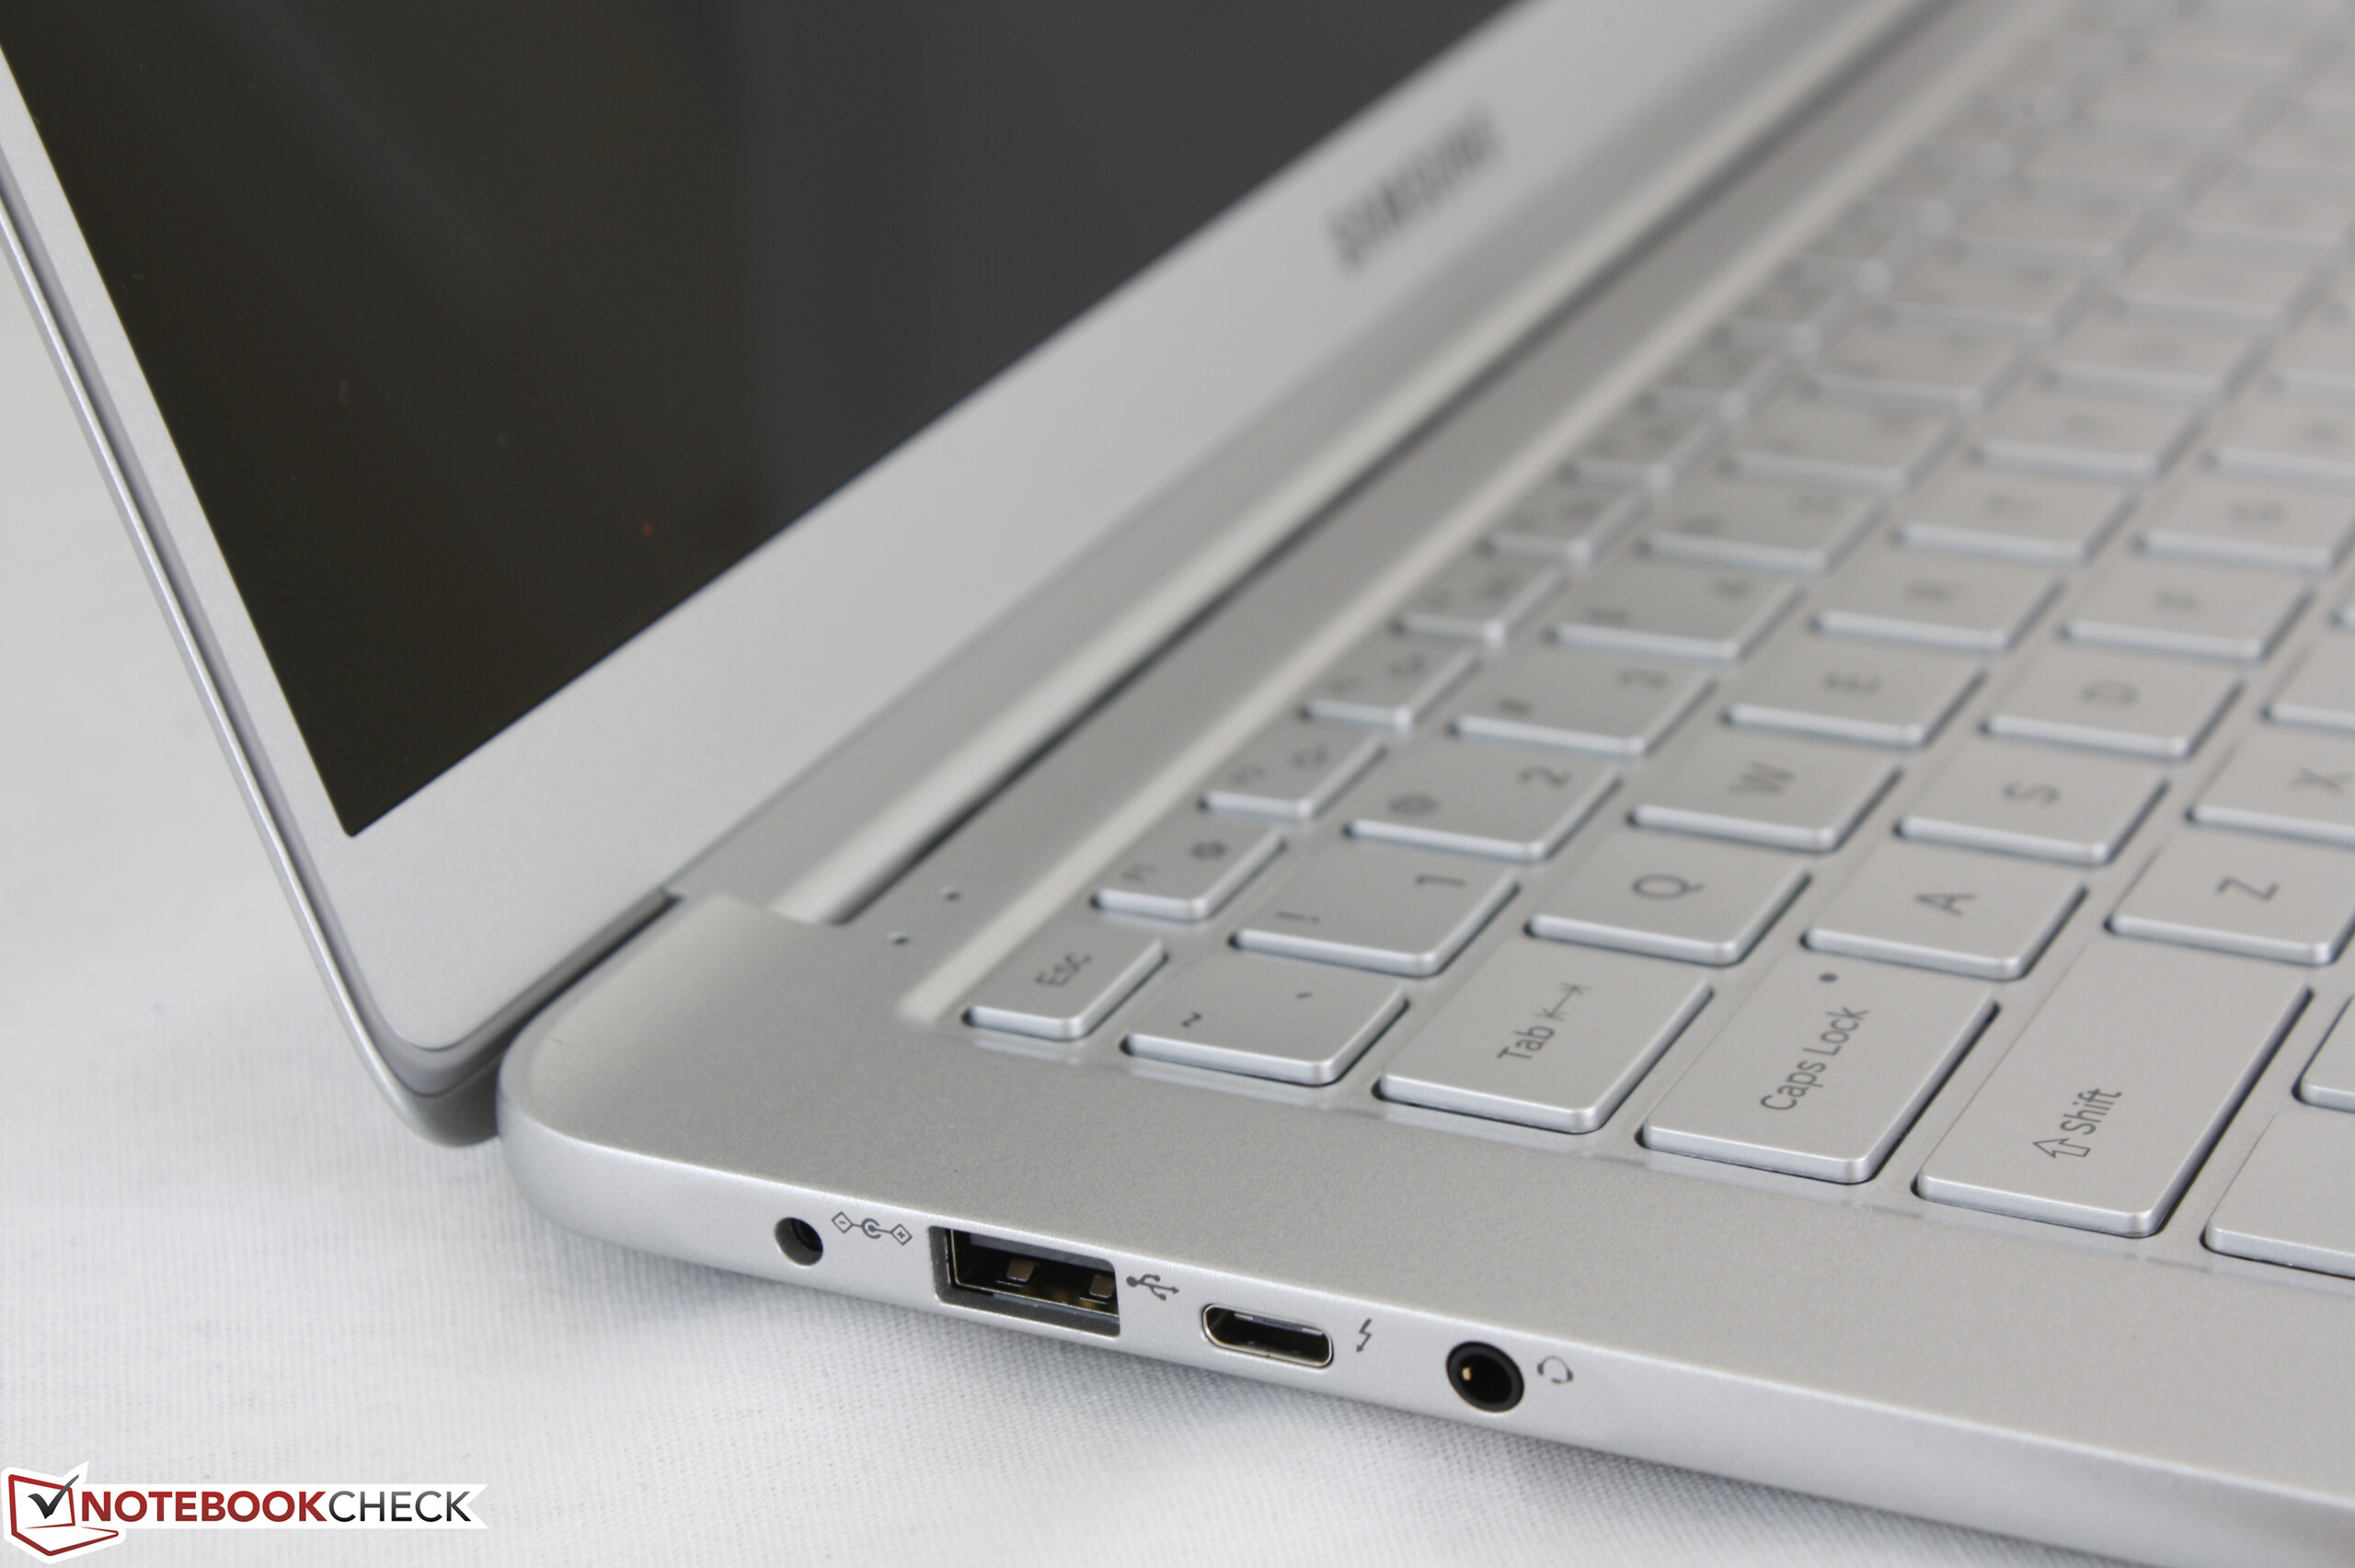
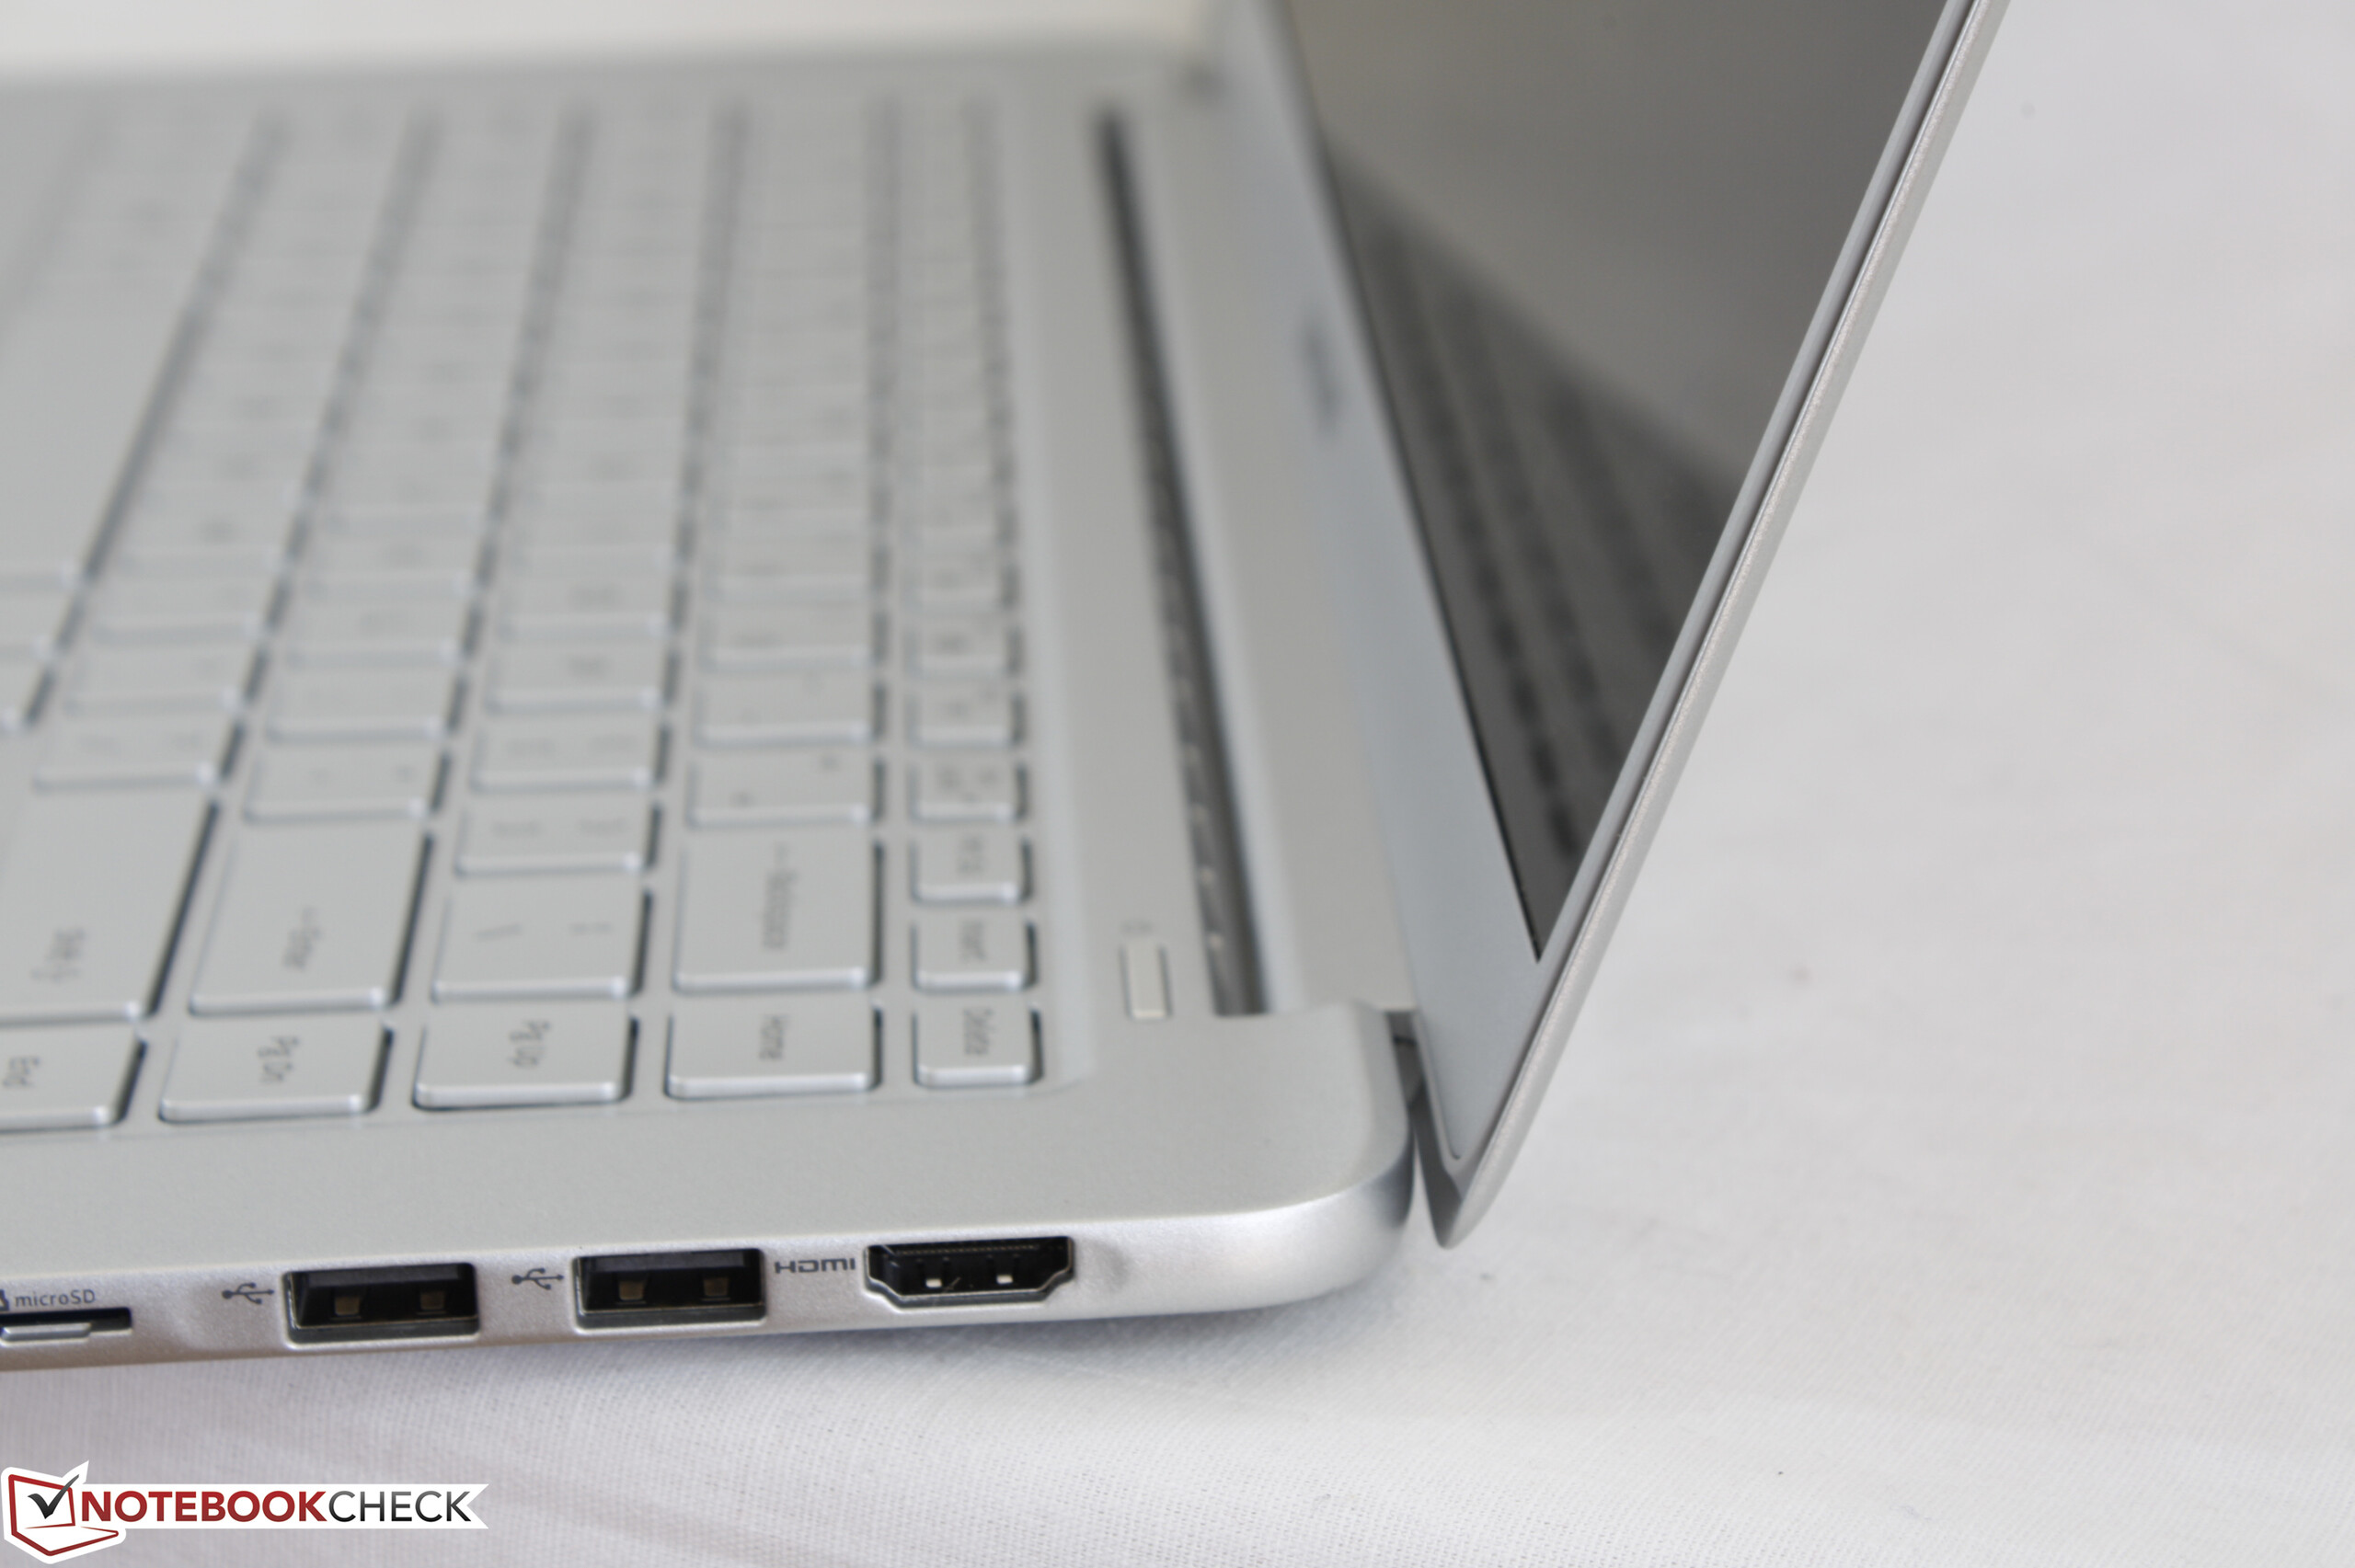
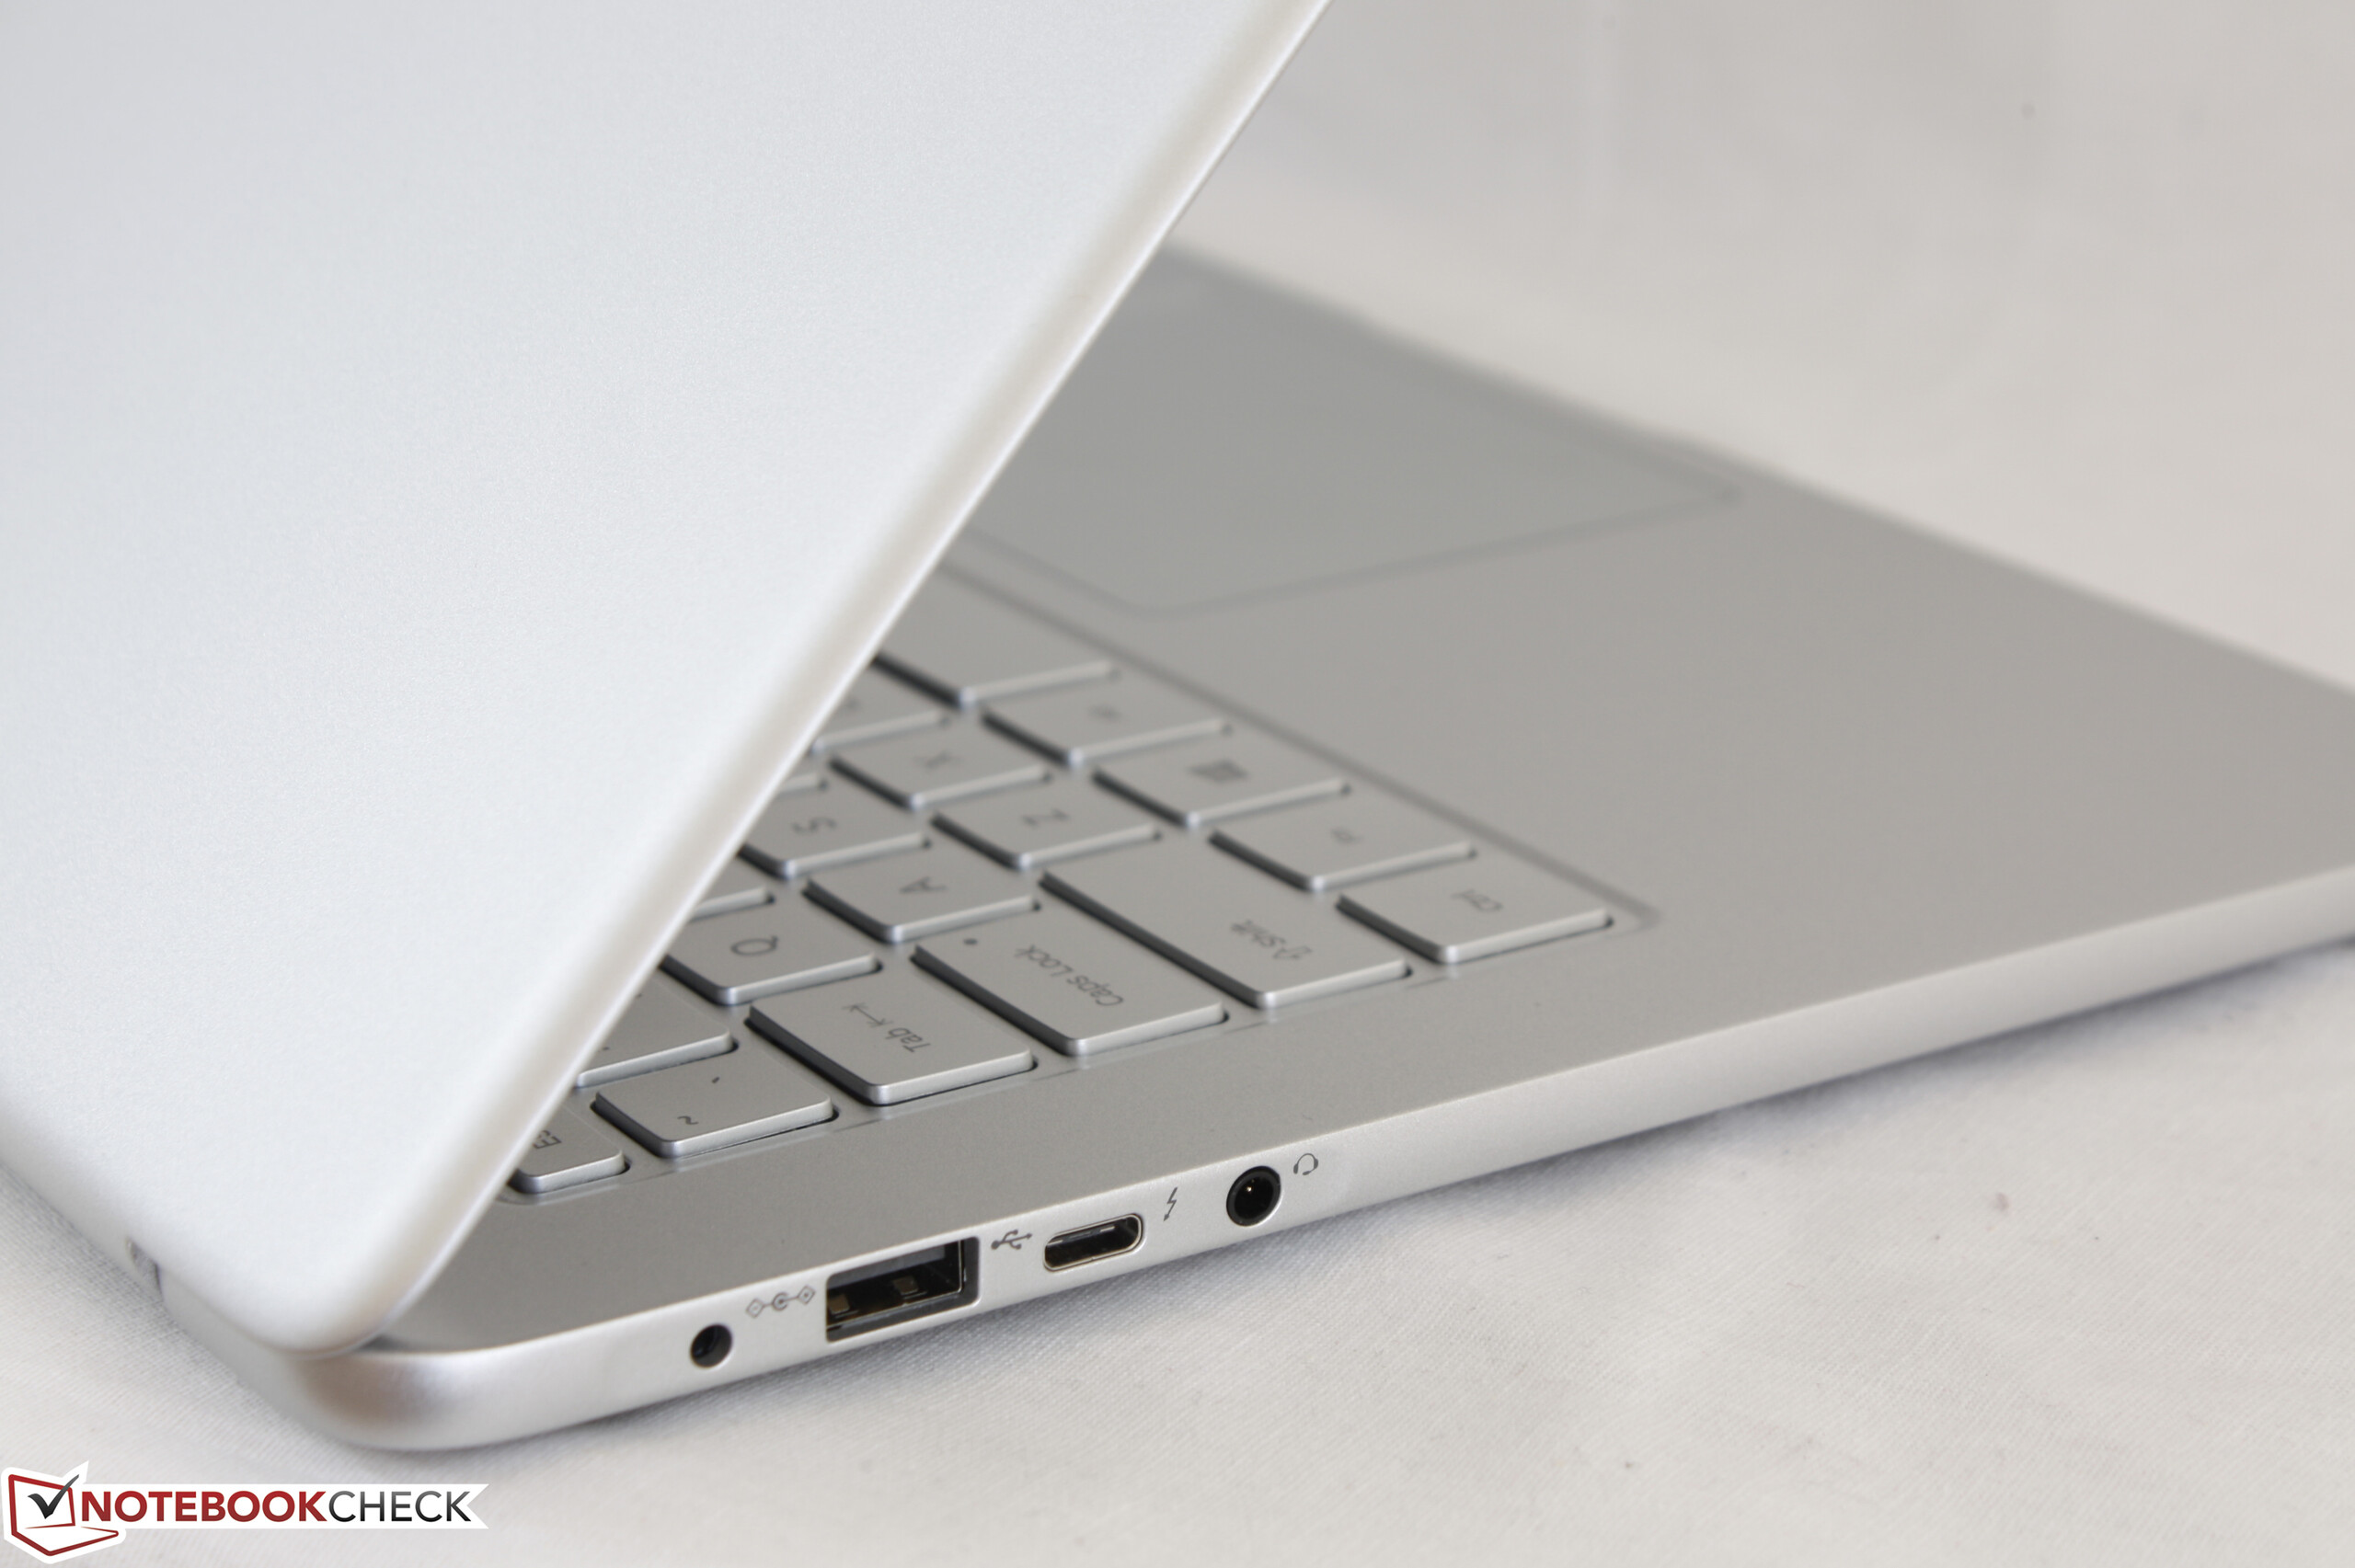
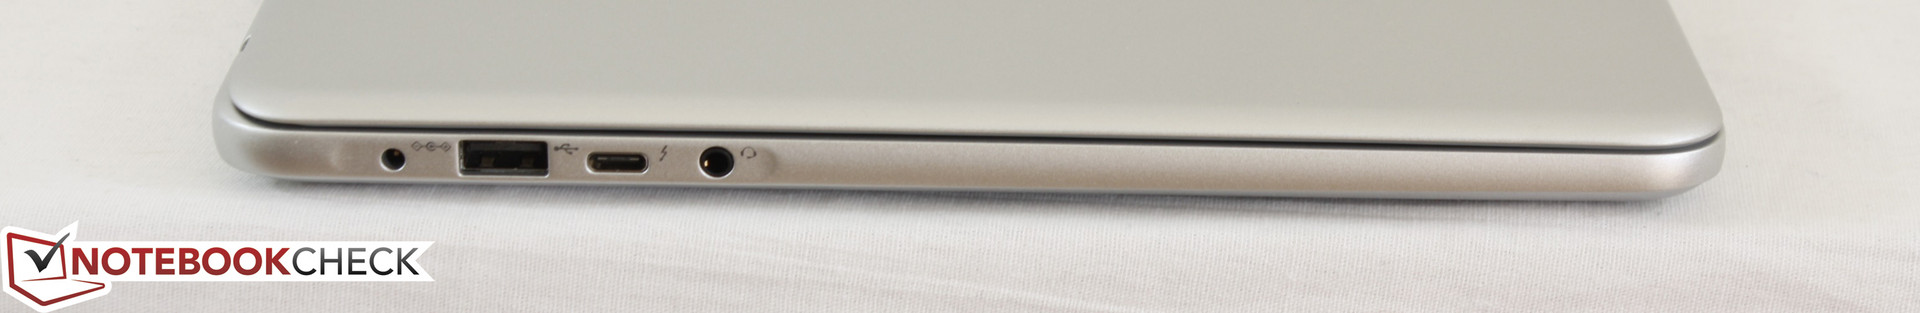
O Notebook 9 NP900X5N se destaca em muitas categorias, mas perde a marca em algumas áreas chave. Elogiamos o fabricante por oferecer uma tela tão brilhante de 1080p em um sistema extremamente leve e ainda ter opções de gráficos discretos disponíveis. Se o brilho, a portabilidade, a autonomia, a conectividade do Thunderbolt e os gráficos da GeForce forem prioritários, o Notebook 9 torna-se uma recomendação fácil, especialmente se os usuários encontrarem as telas tácteis, alternativas frívolas ou que as alternativas de 14 polegadas são muito pequenas para a produtividade.
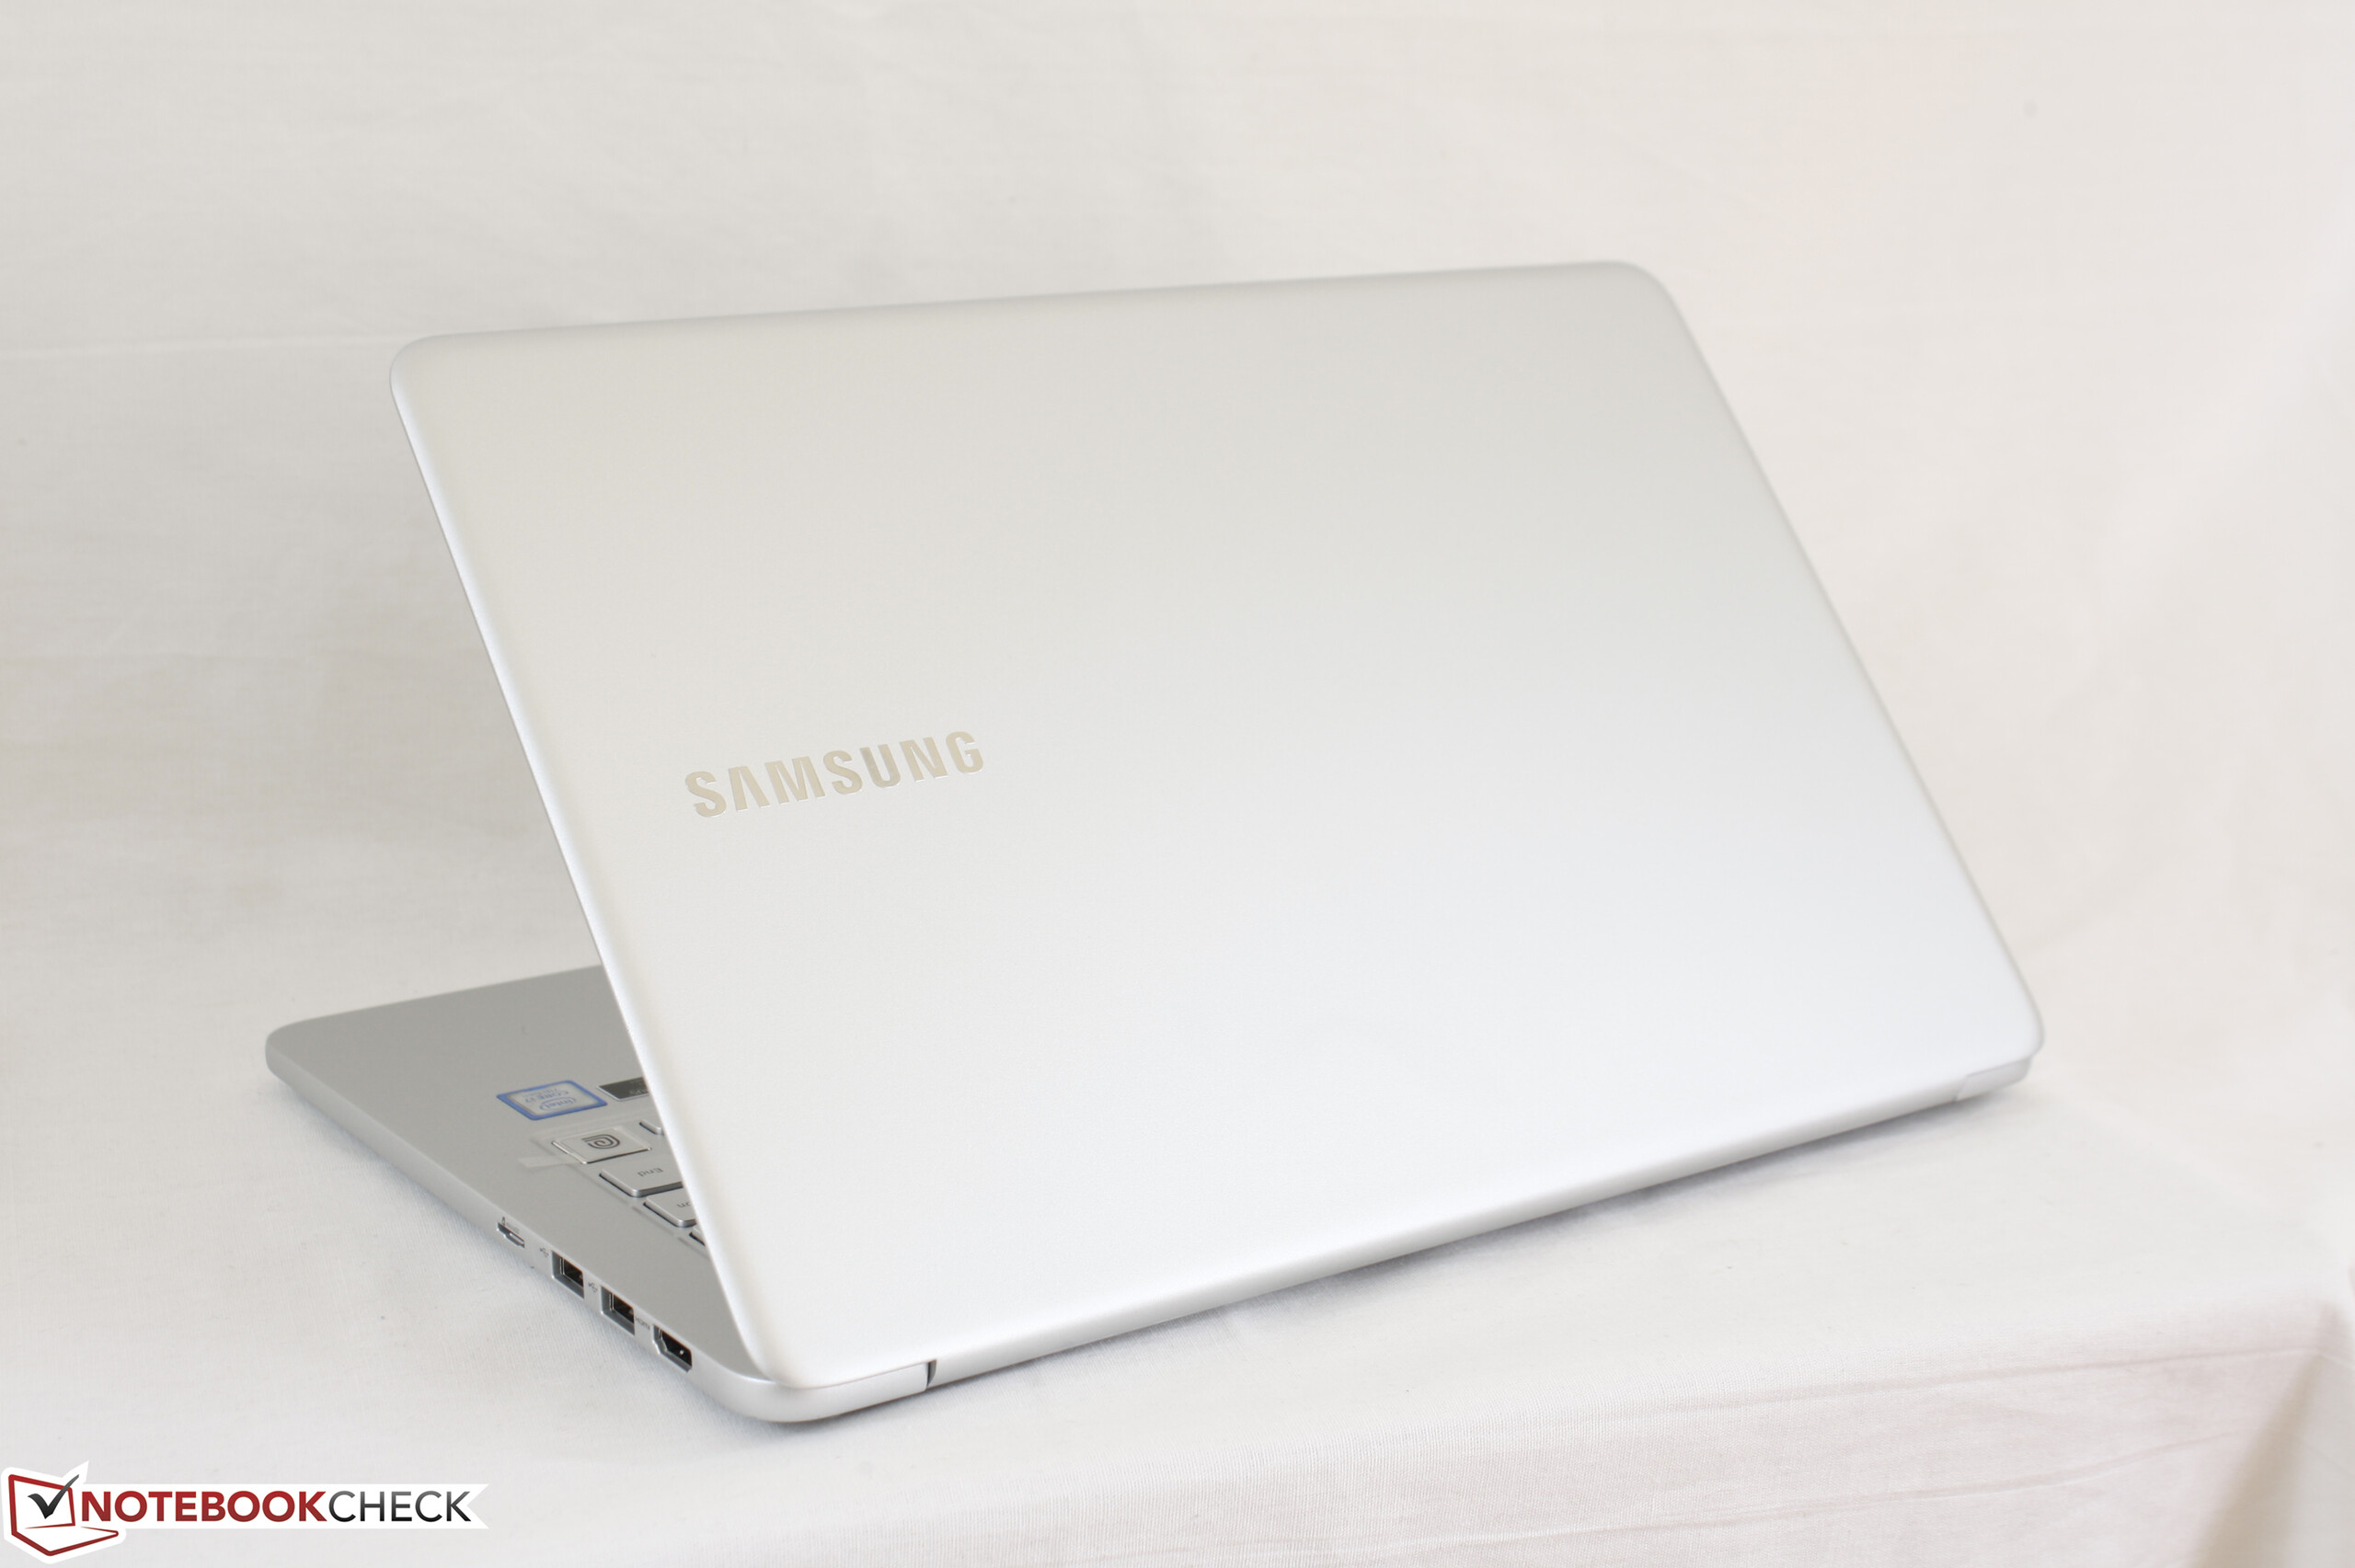
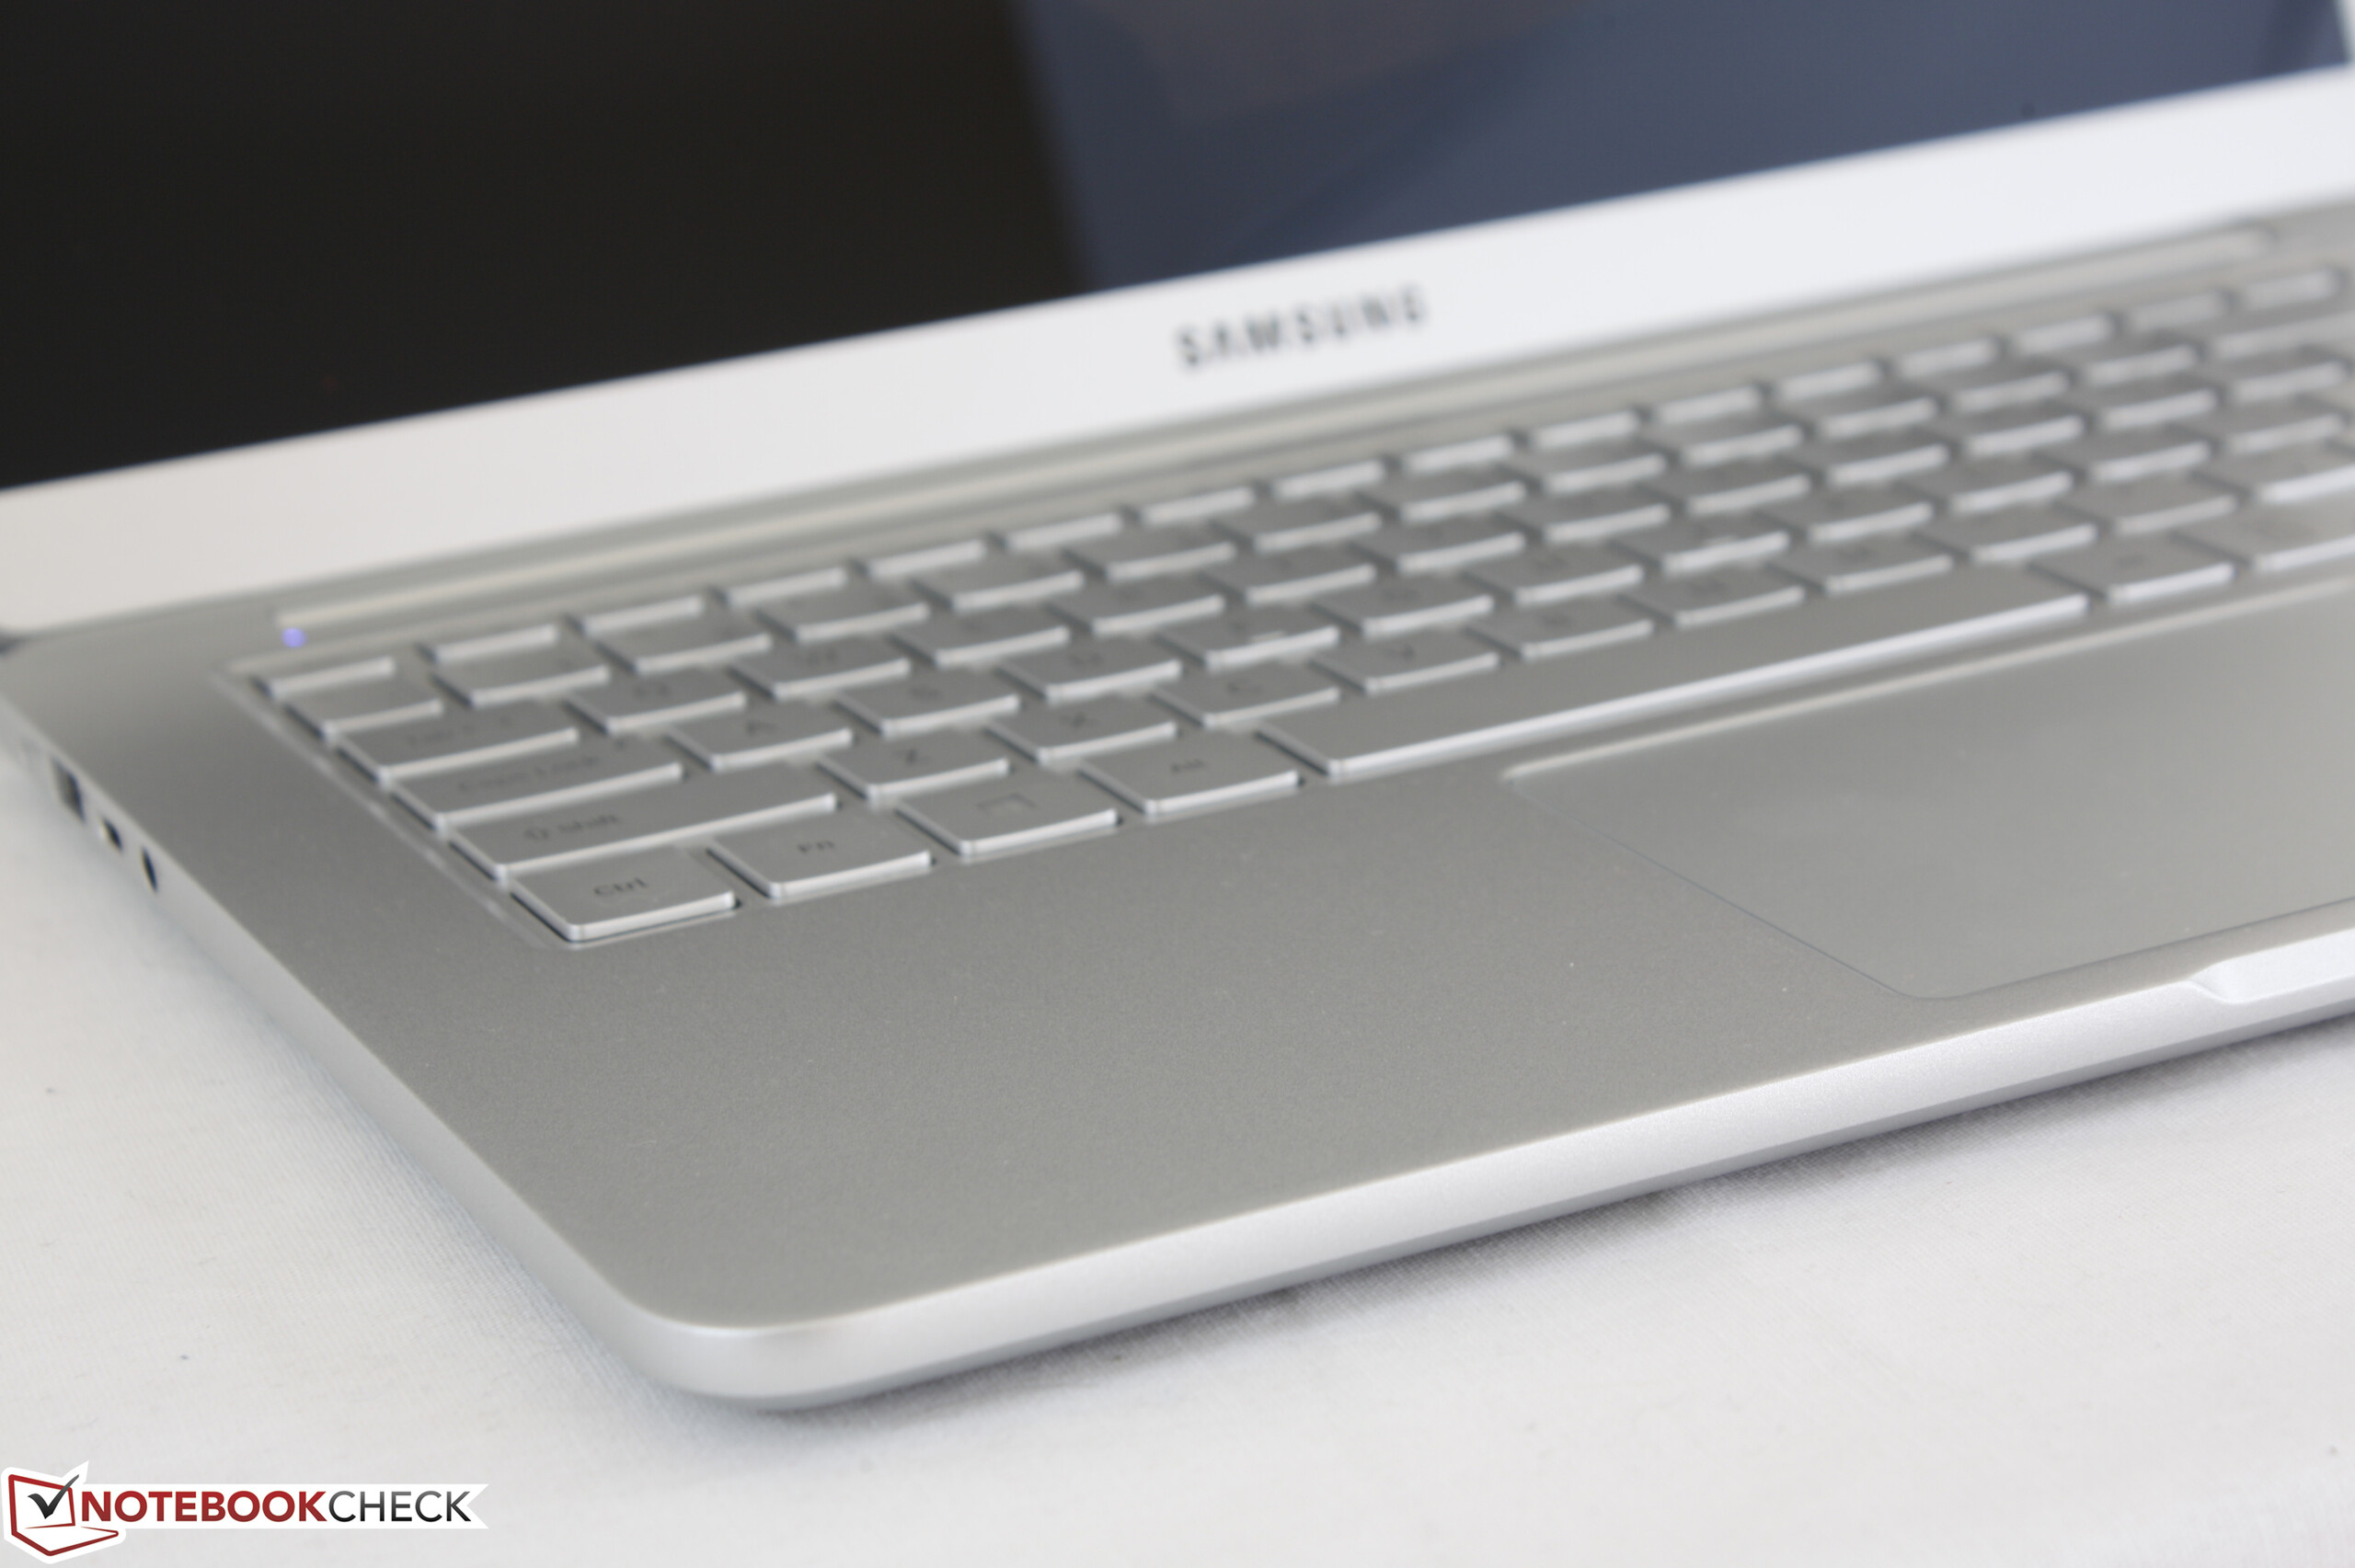
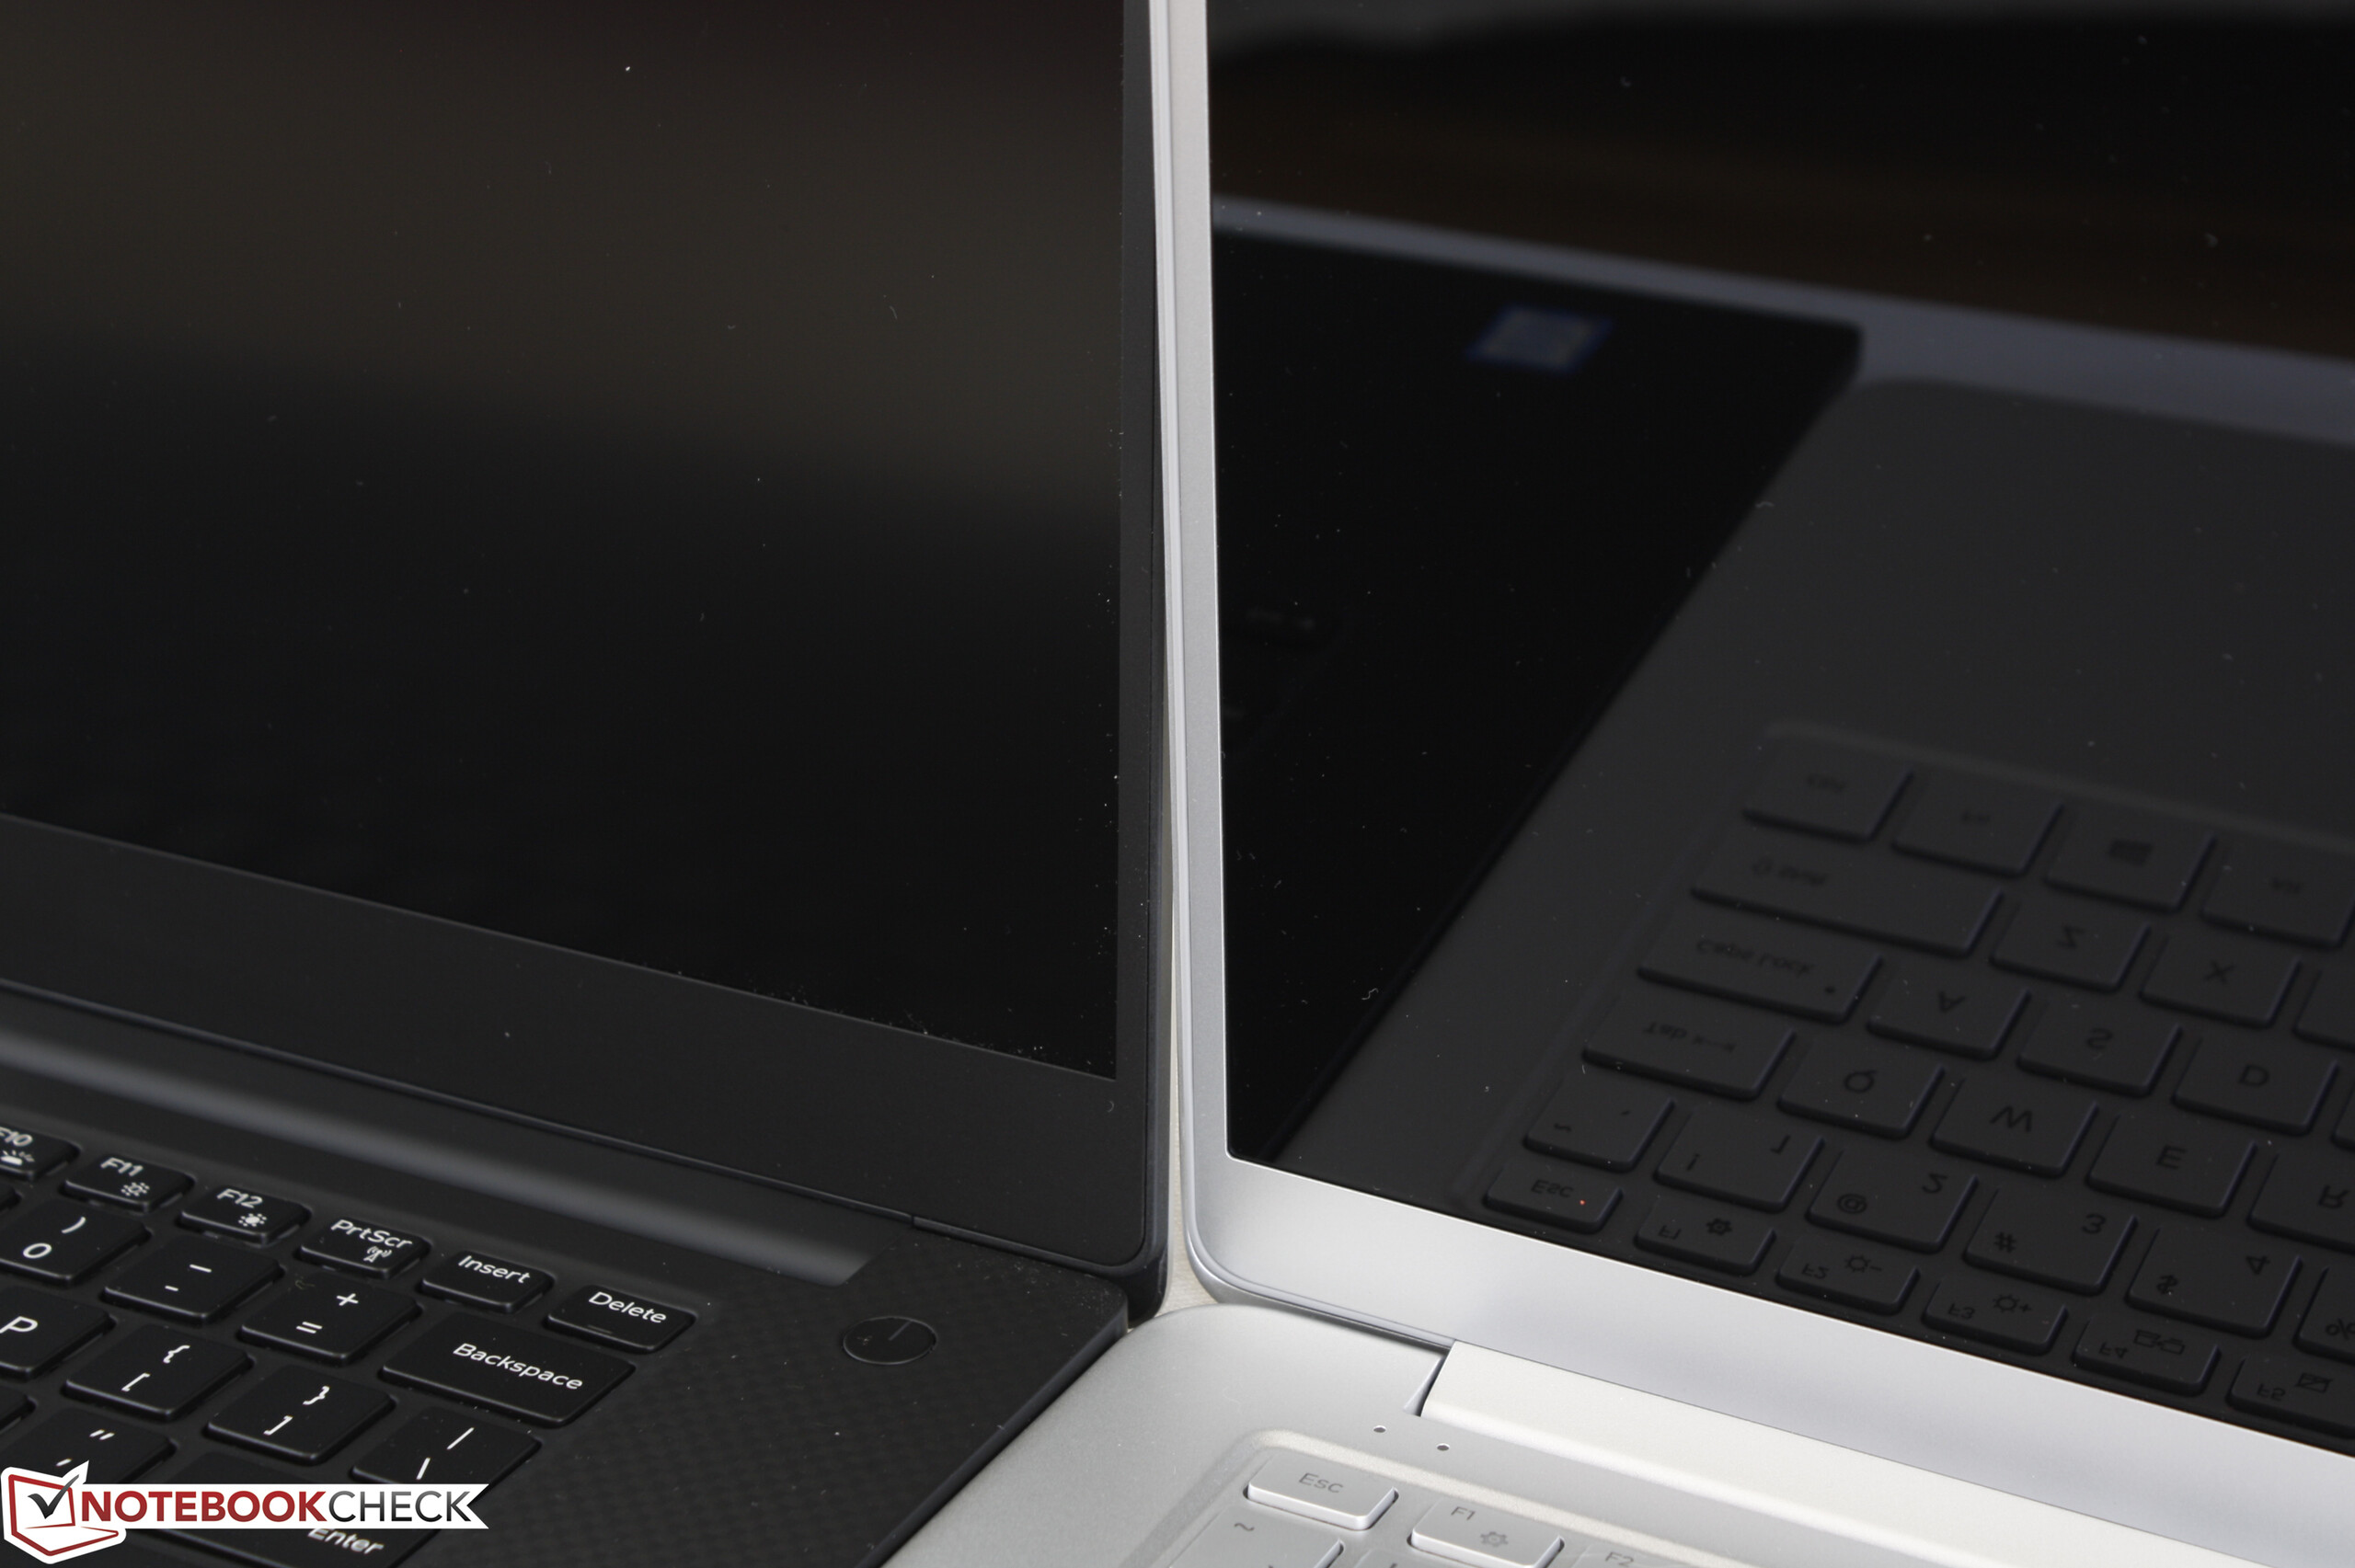
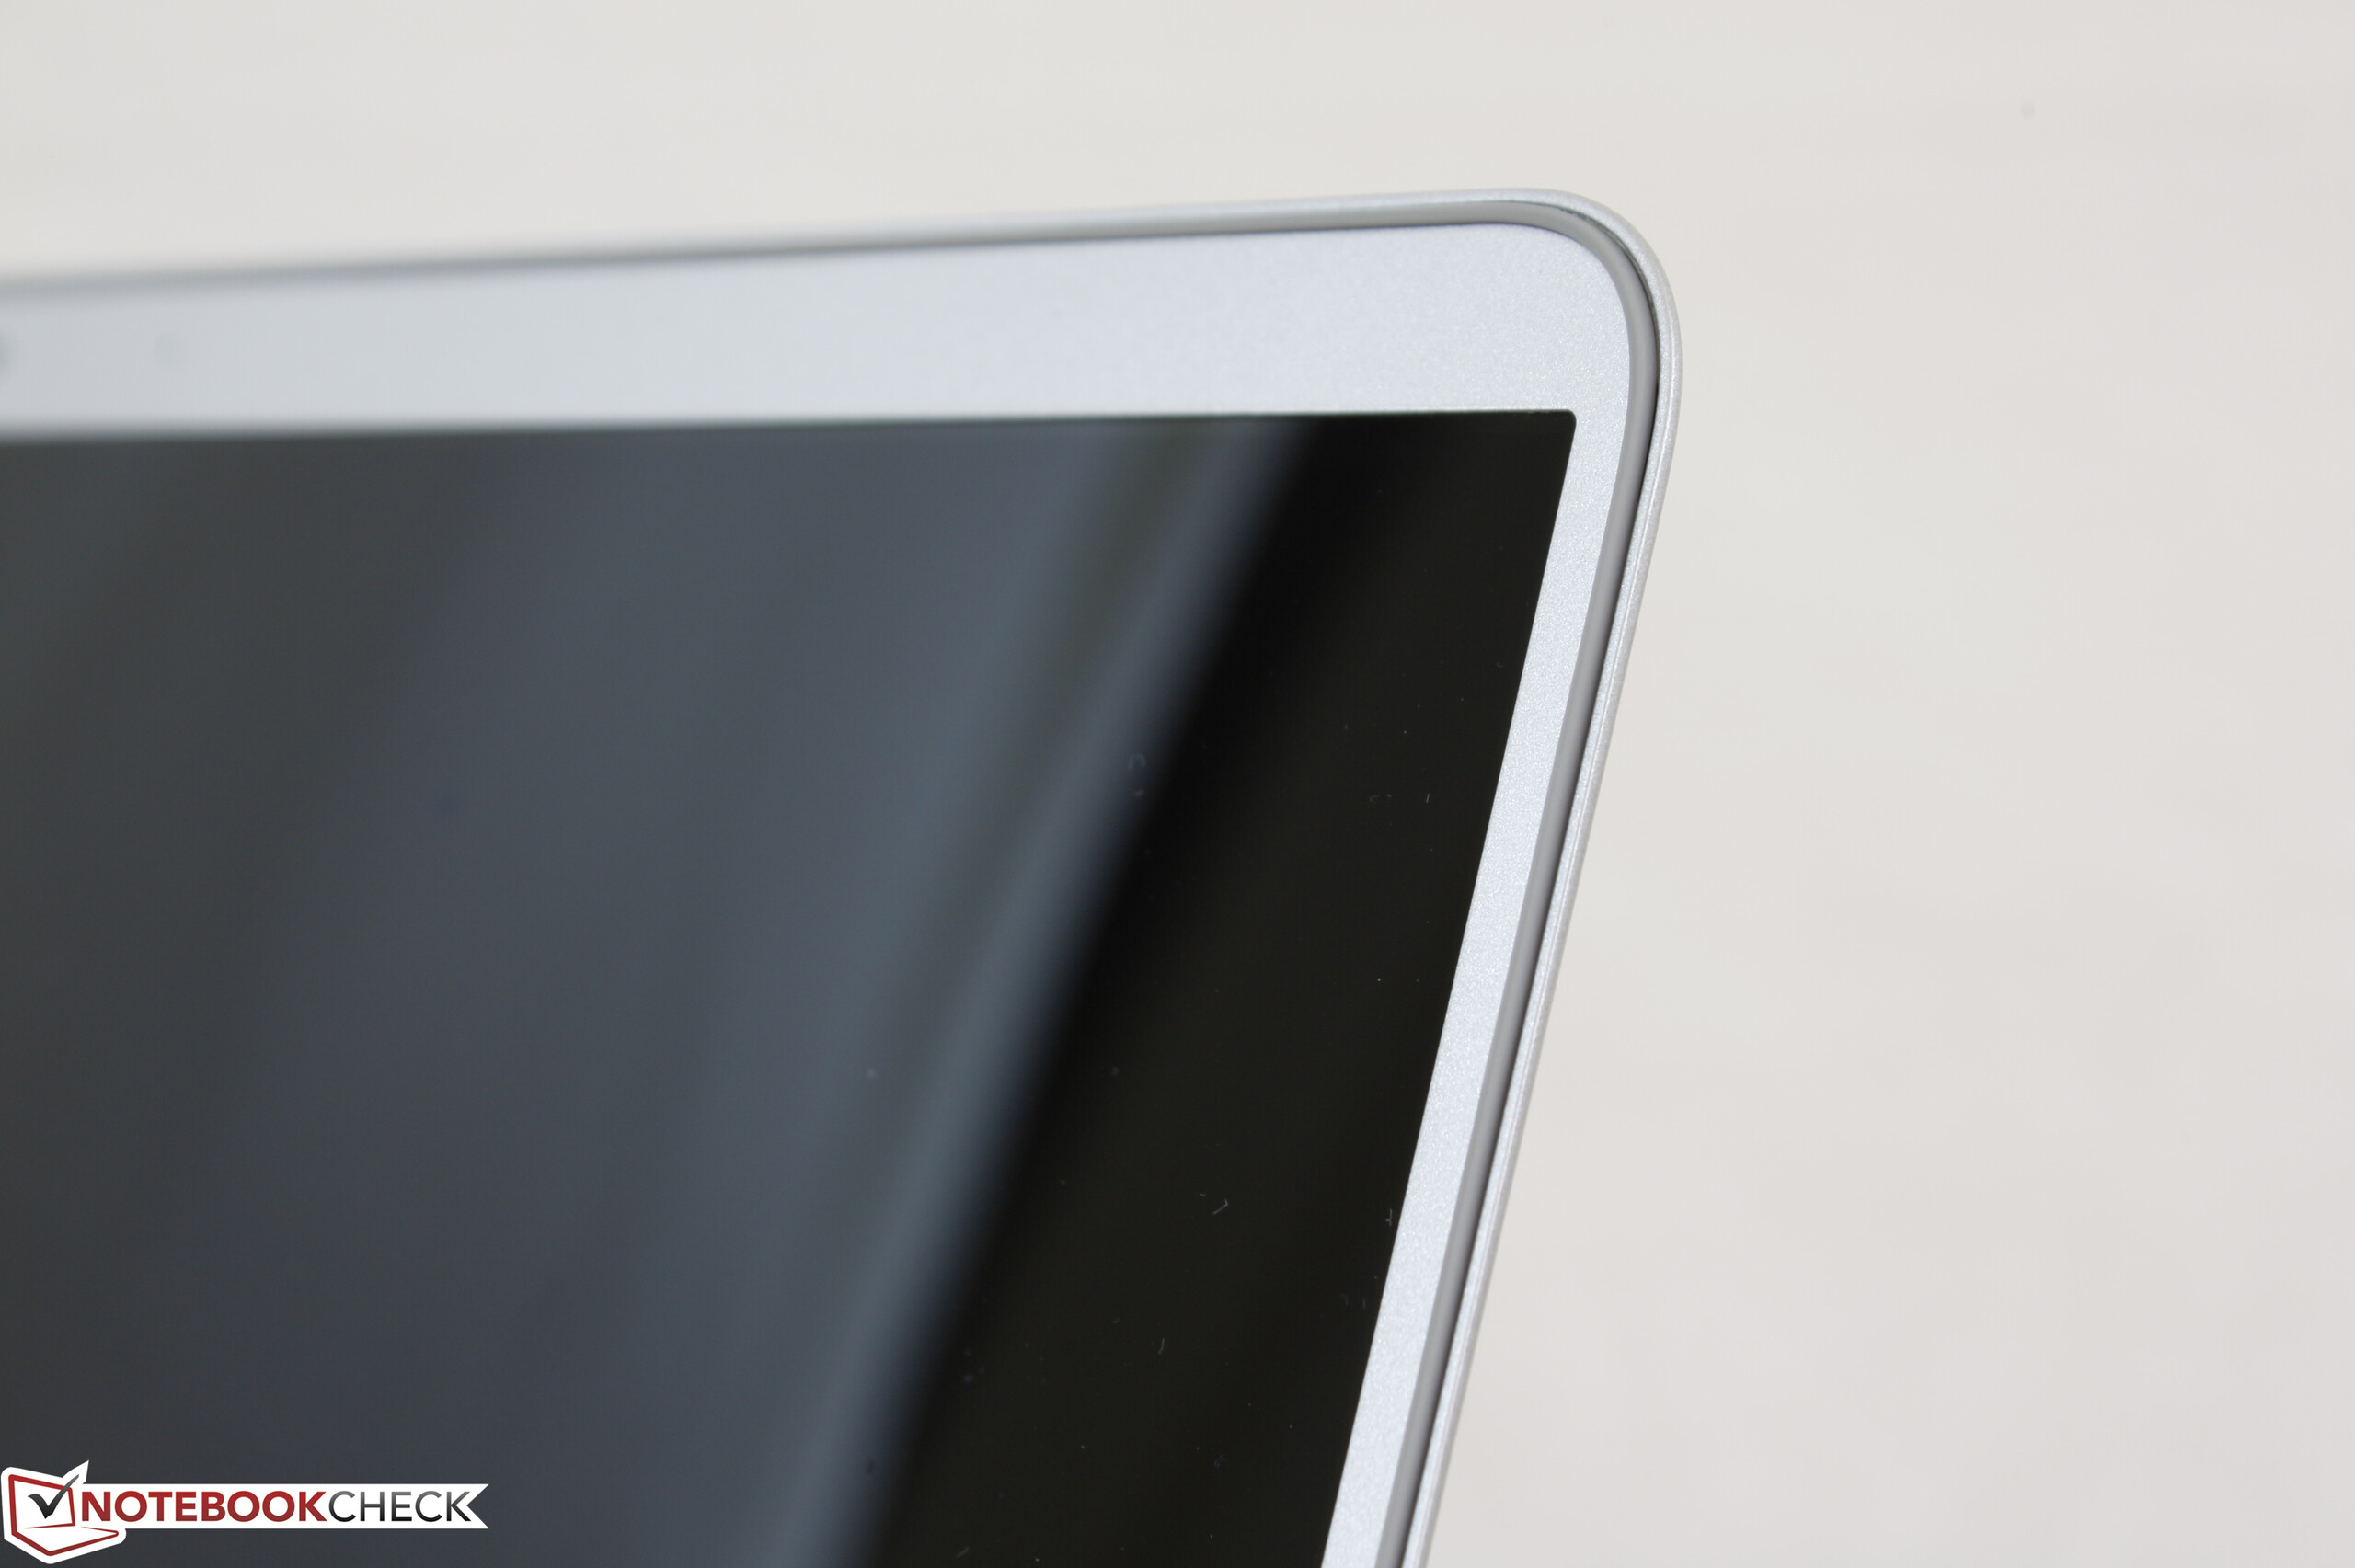
O aparelho da Samsung está longe de ser perfeito e é meramente médio na rigidez do chassi com algumas opções de configuração de tela estranhas. Por mais agradável que seja a tela com marcos finos, é muito mais flexível do que os concorrentes atualmente têm para oferecer. É estranho que tela refletiva seja obrigatória e ainda não possua proteção de Gorilla Glass ou opções de telas tácteis que normalmente o acompanham. A presença de PWM em quase todos os níveis de brilho é outro fator que alguns usuários podem querer considerar antes da compra.
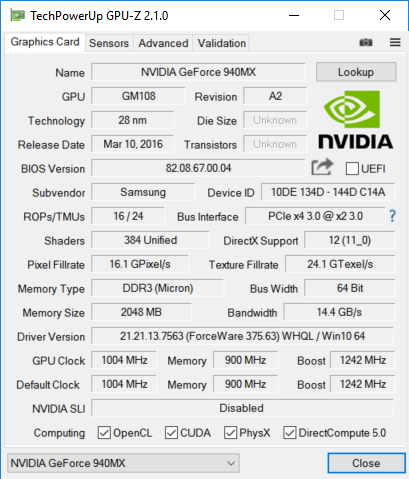
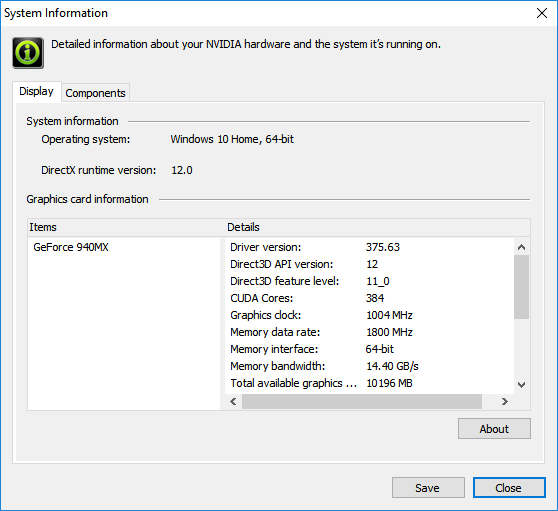
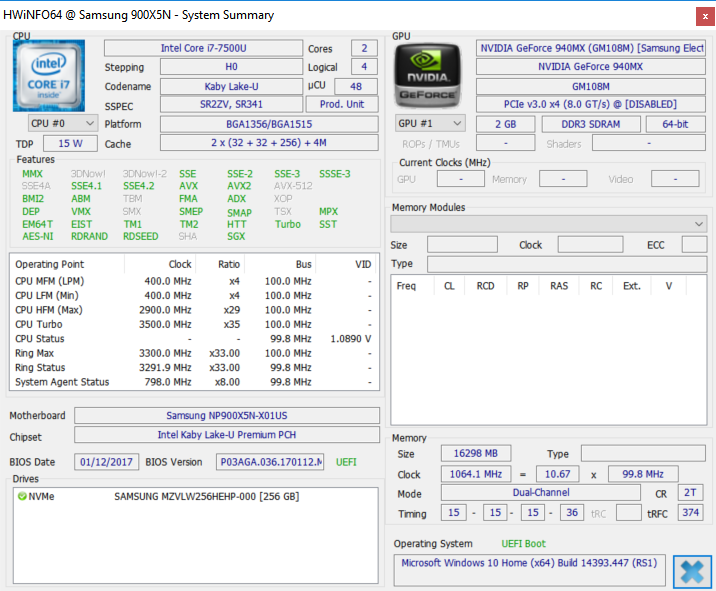
Além disso, ficamos decepcionados ao ver apenas a versão DDR3 da GeForce 940MX em vez da versão GDDR5 superior, especialmente porque esta GPU específica está envelhecendo muito rapidamente. A Nvidia em breve lançará a GeForce MX150 para portáteis finos e leves que, essencialmente, deixará a série 940MX obsoleta.
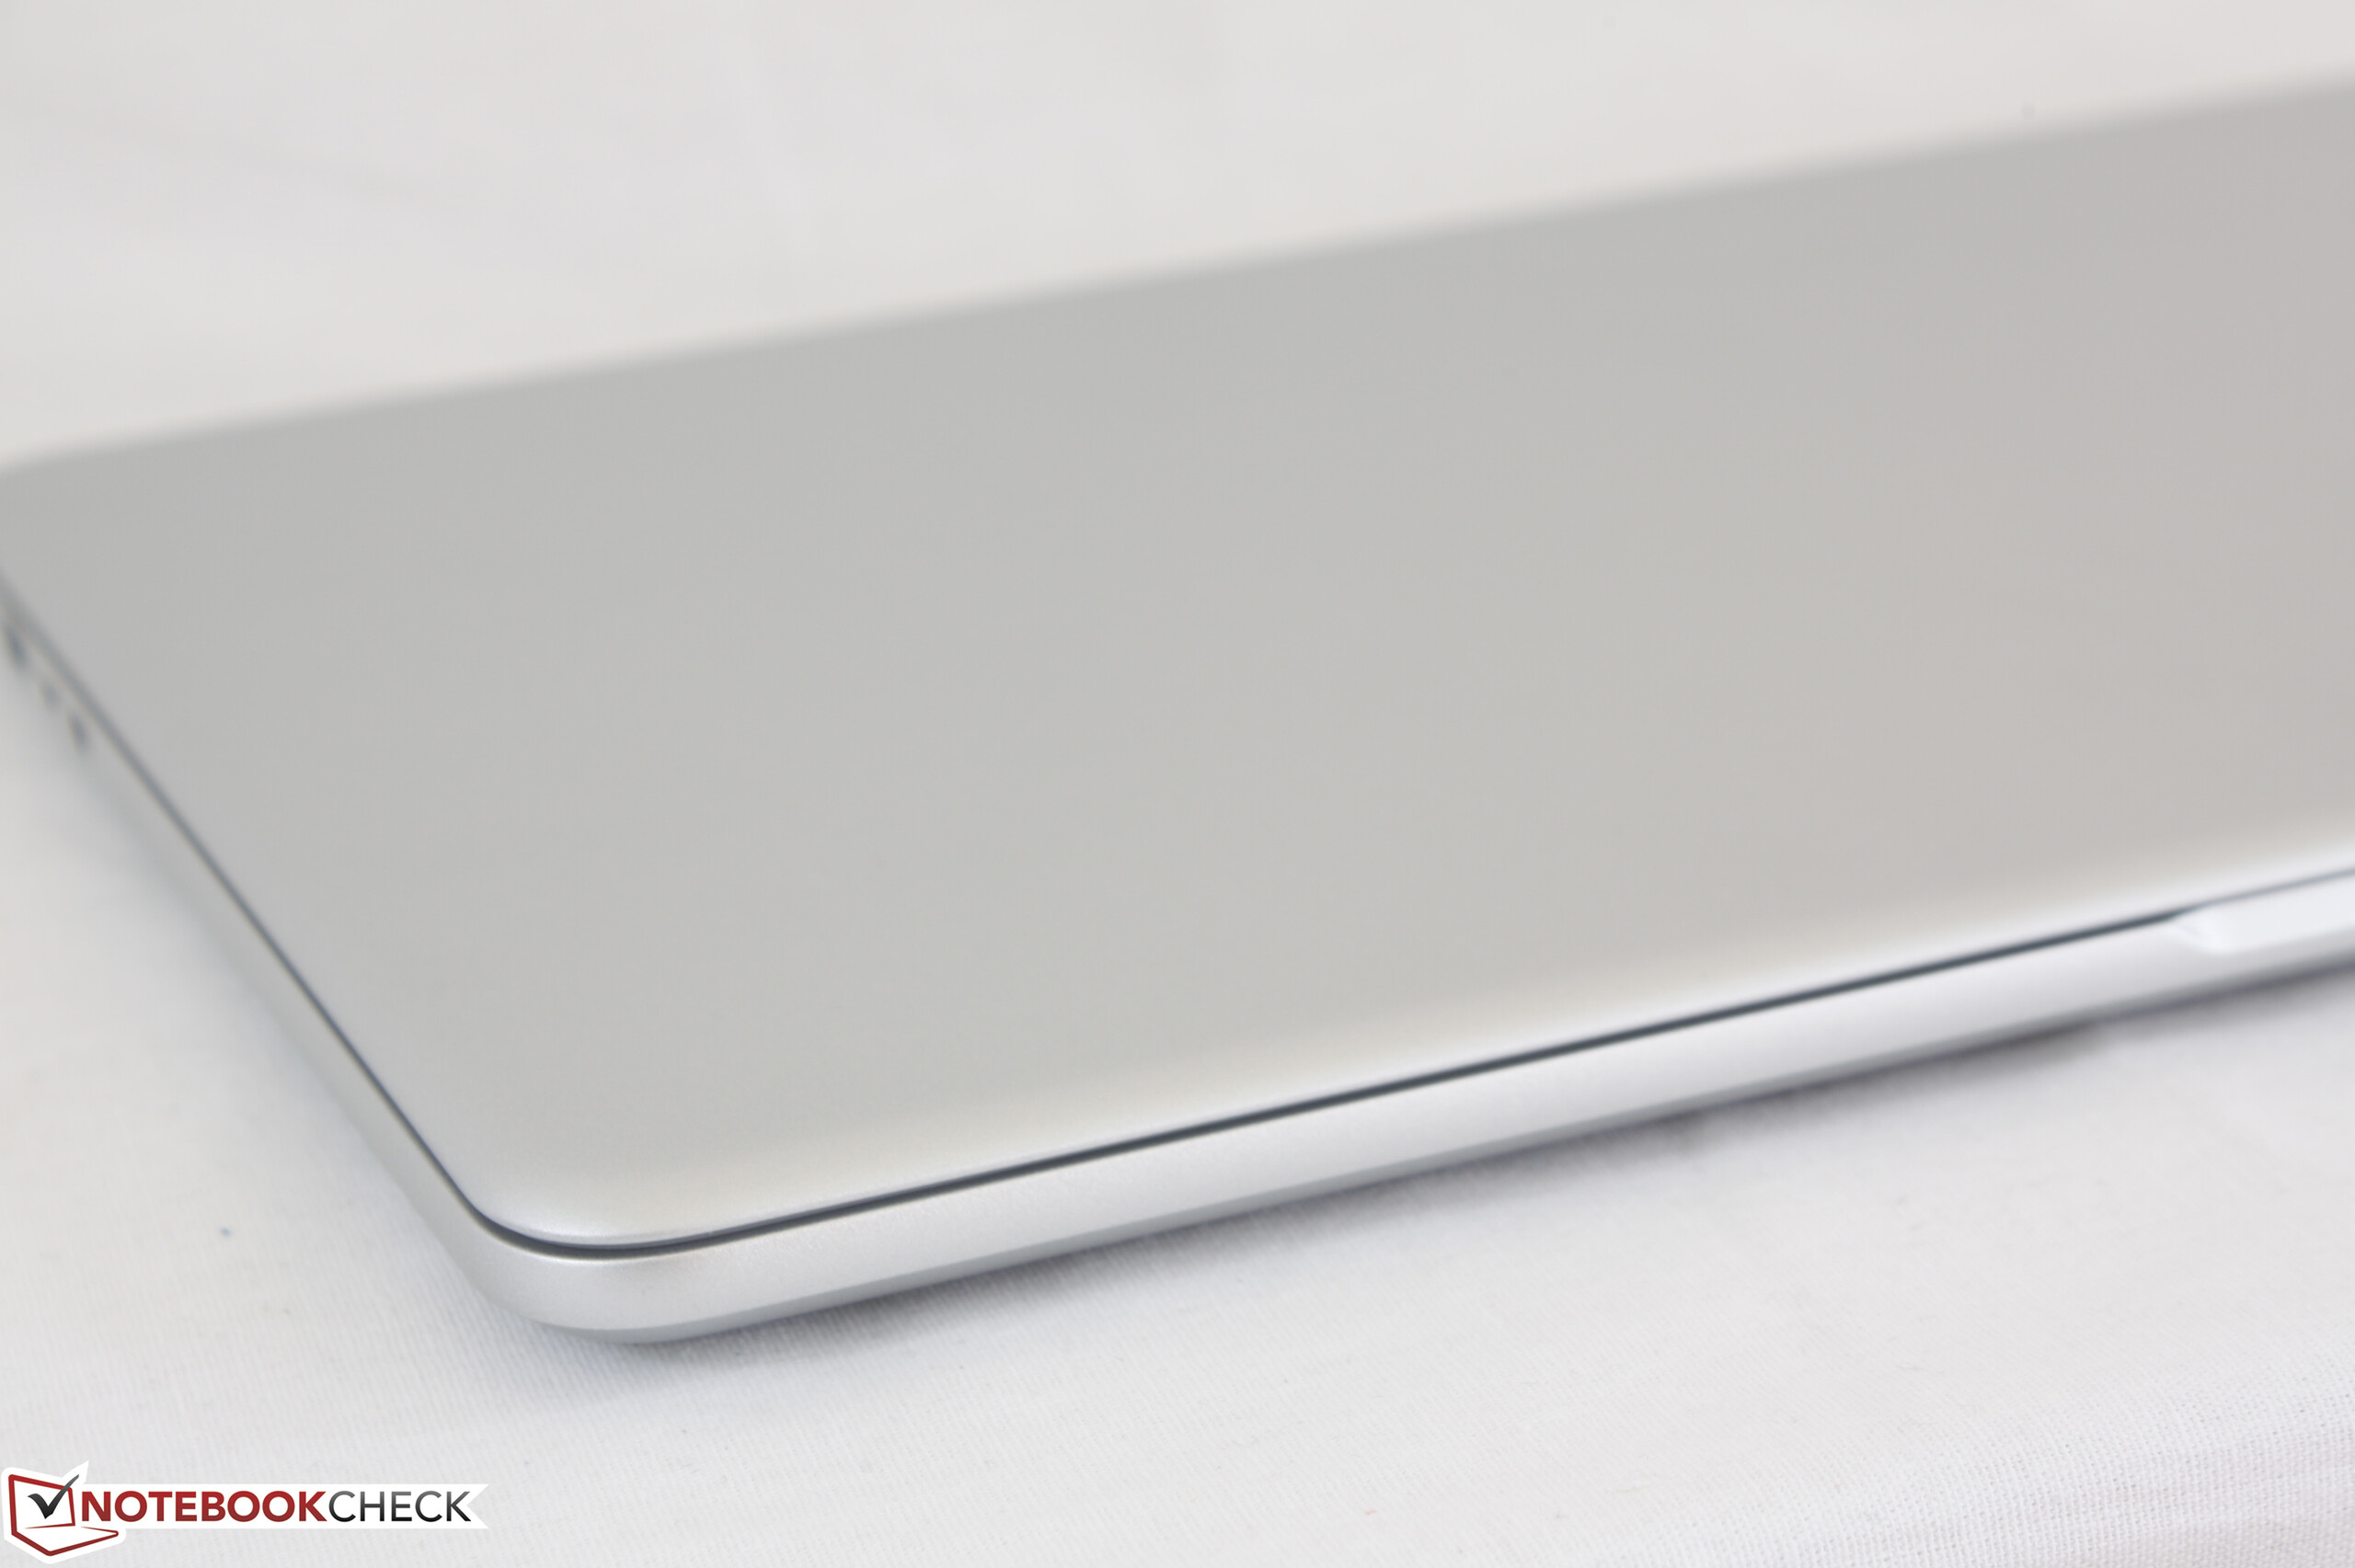
Finalmente, o sistema tem preços bastante elevados de $1400 por nossa configuração específica. Os pontos positivos ainda superam os negativos, desde que os proprietários possam evitar quaisquer colisões e contusões na frágil tampa.
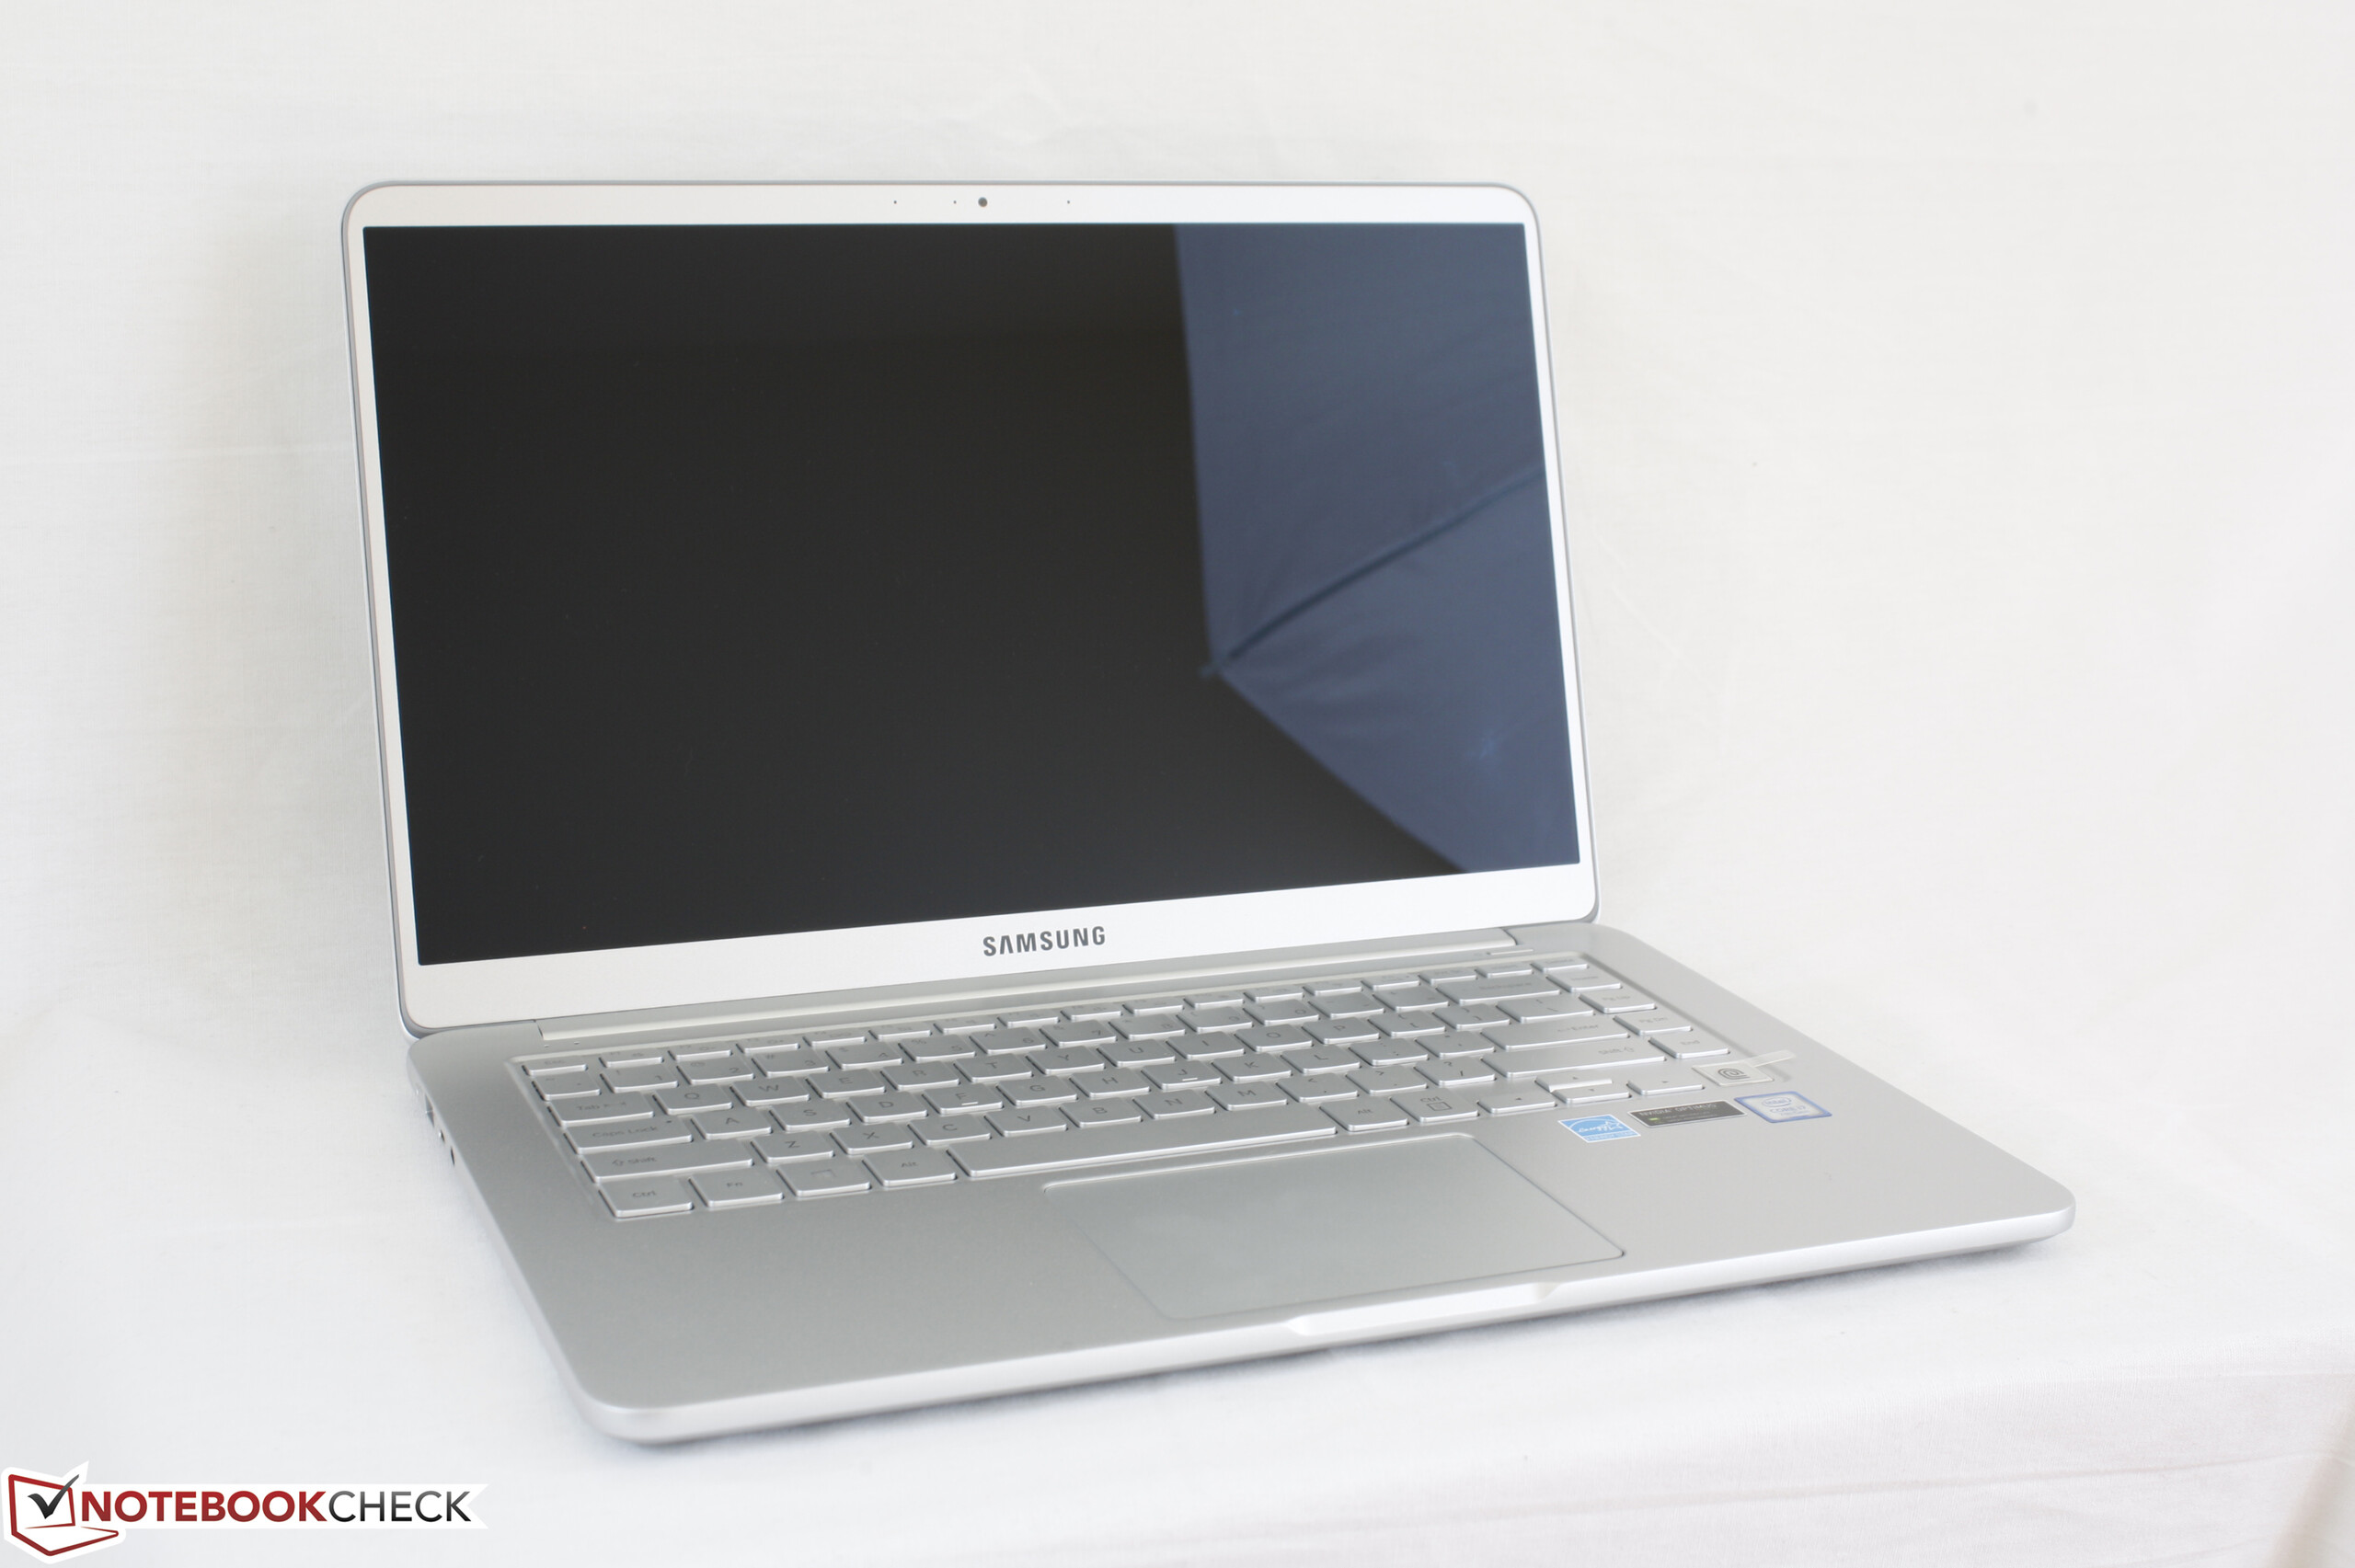
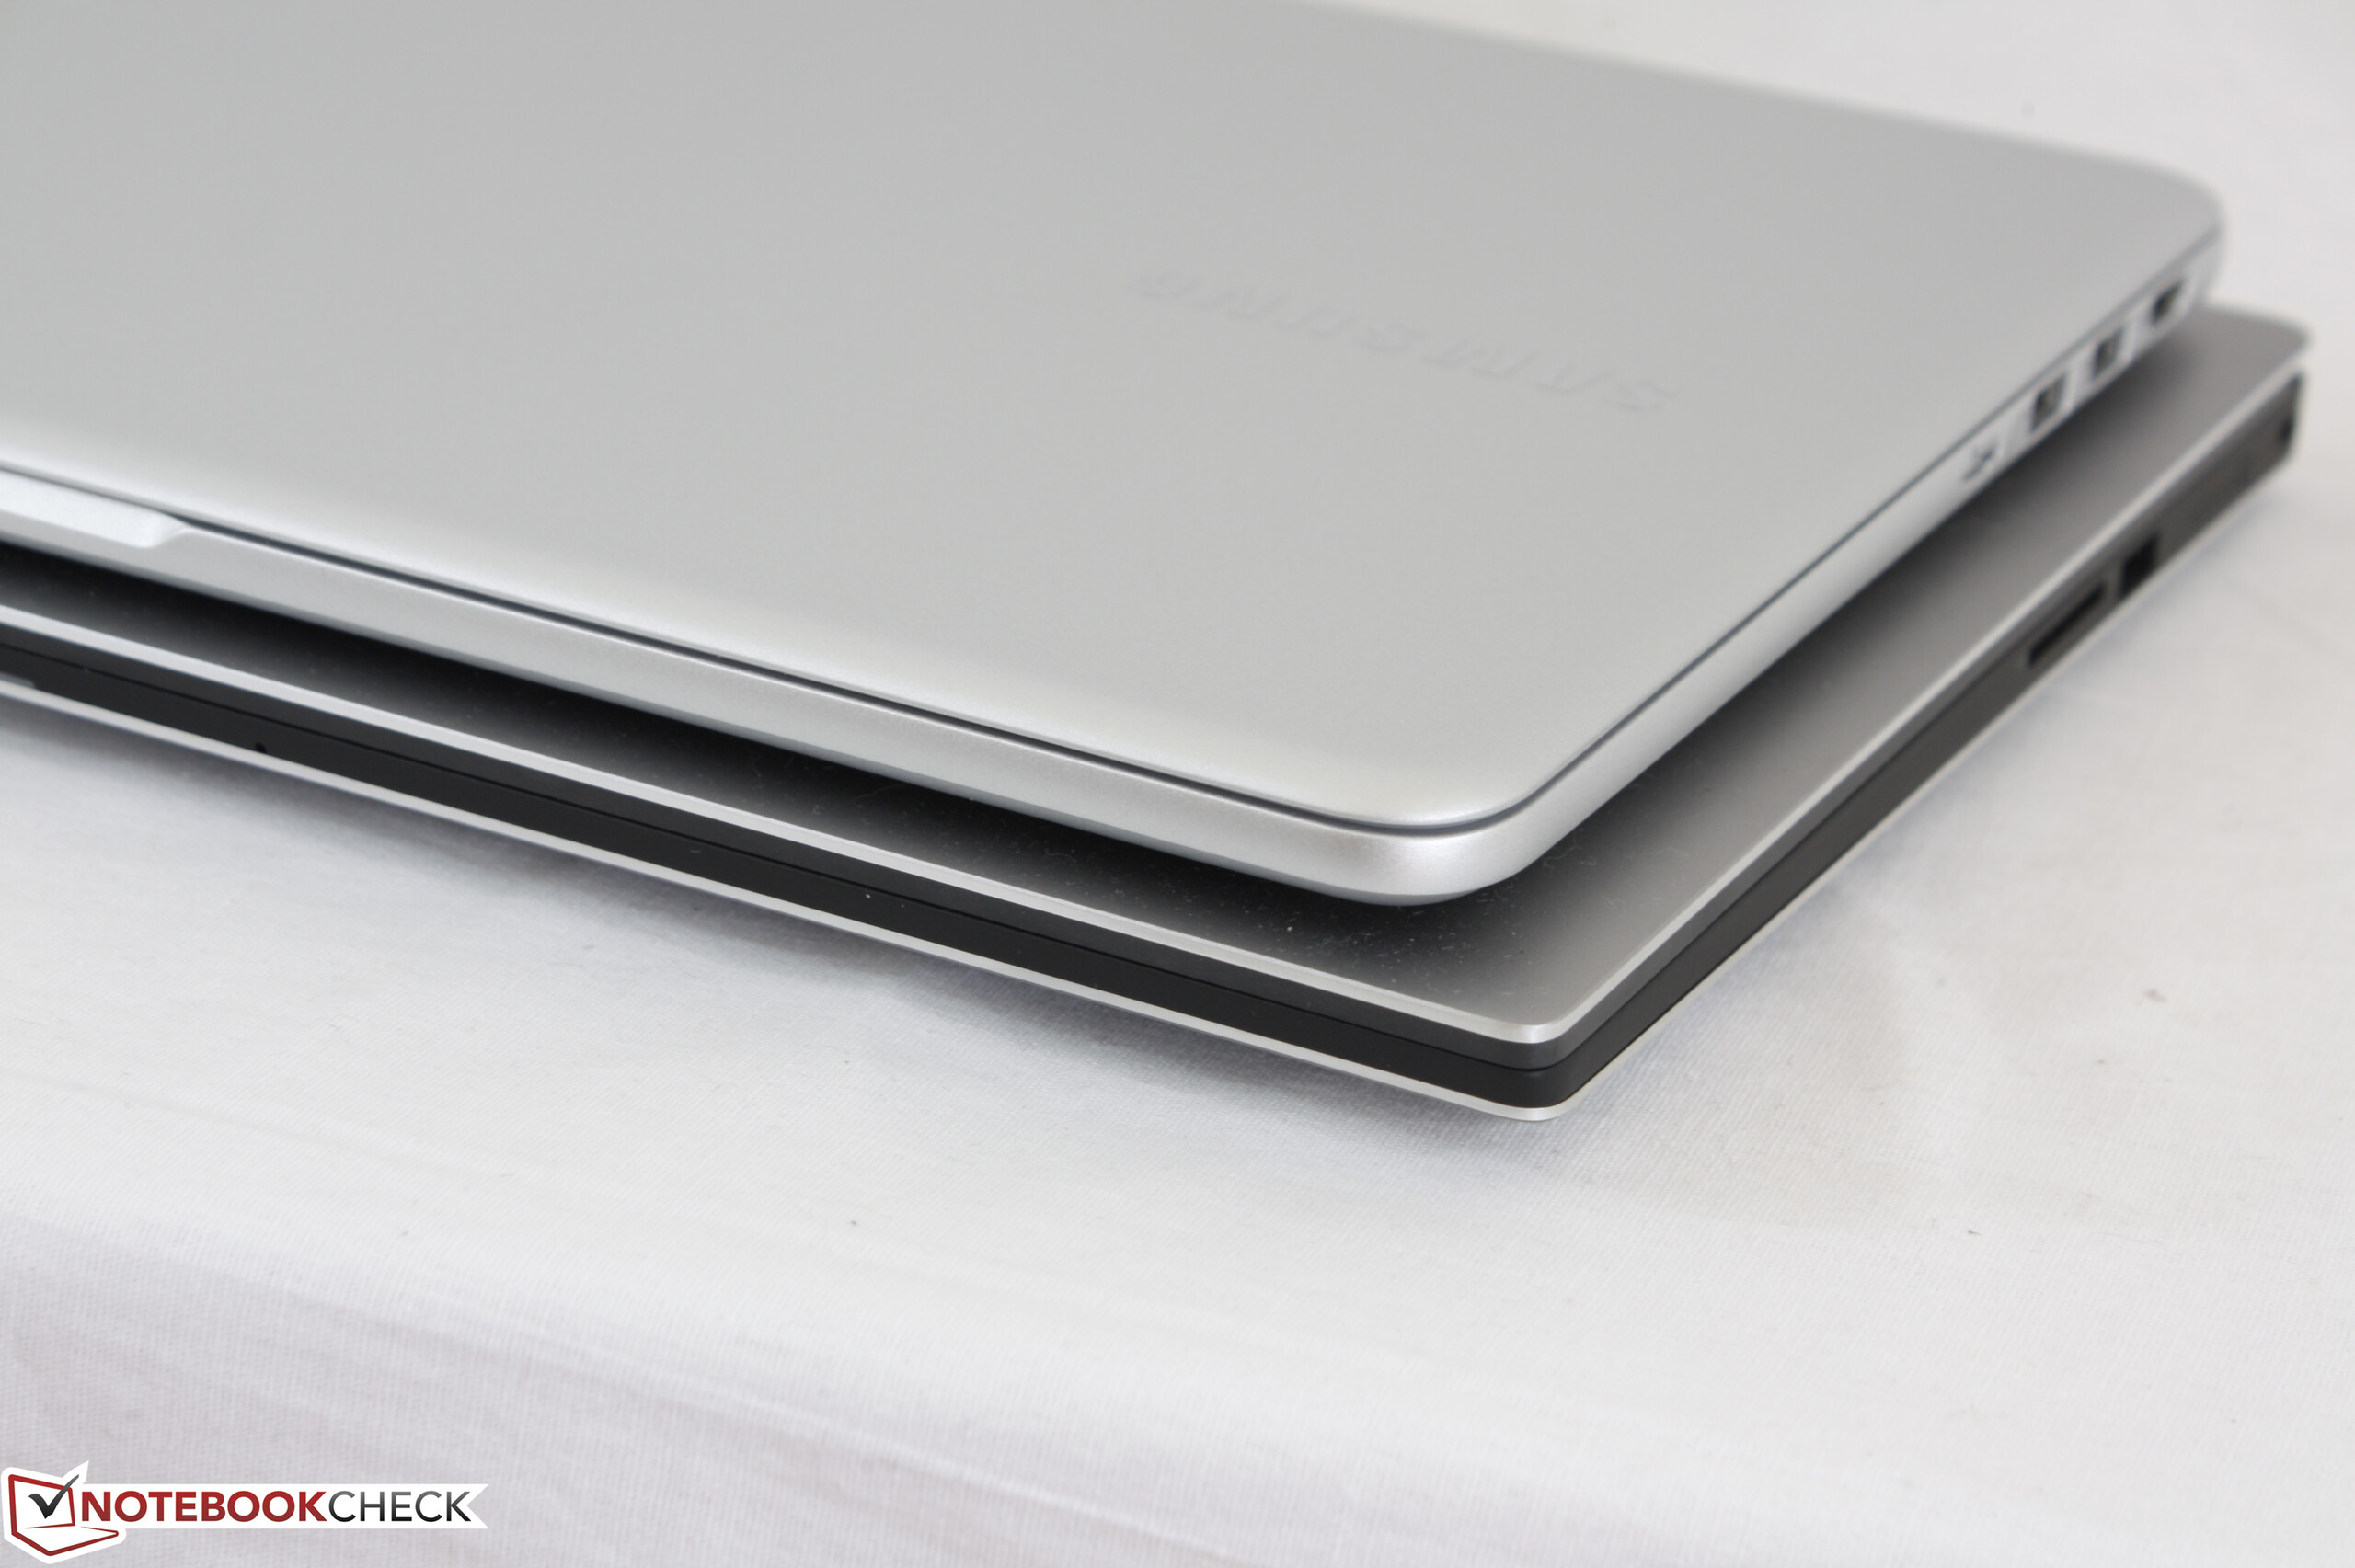
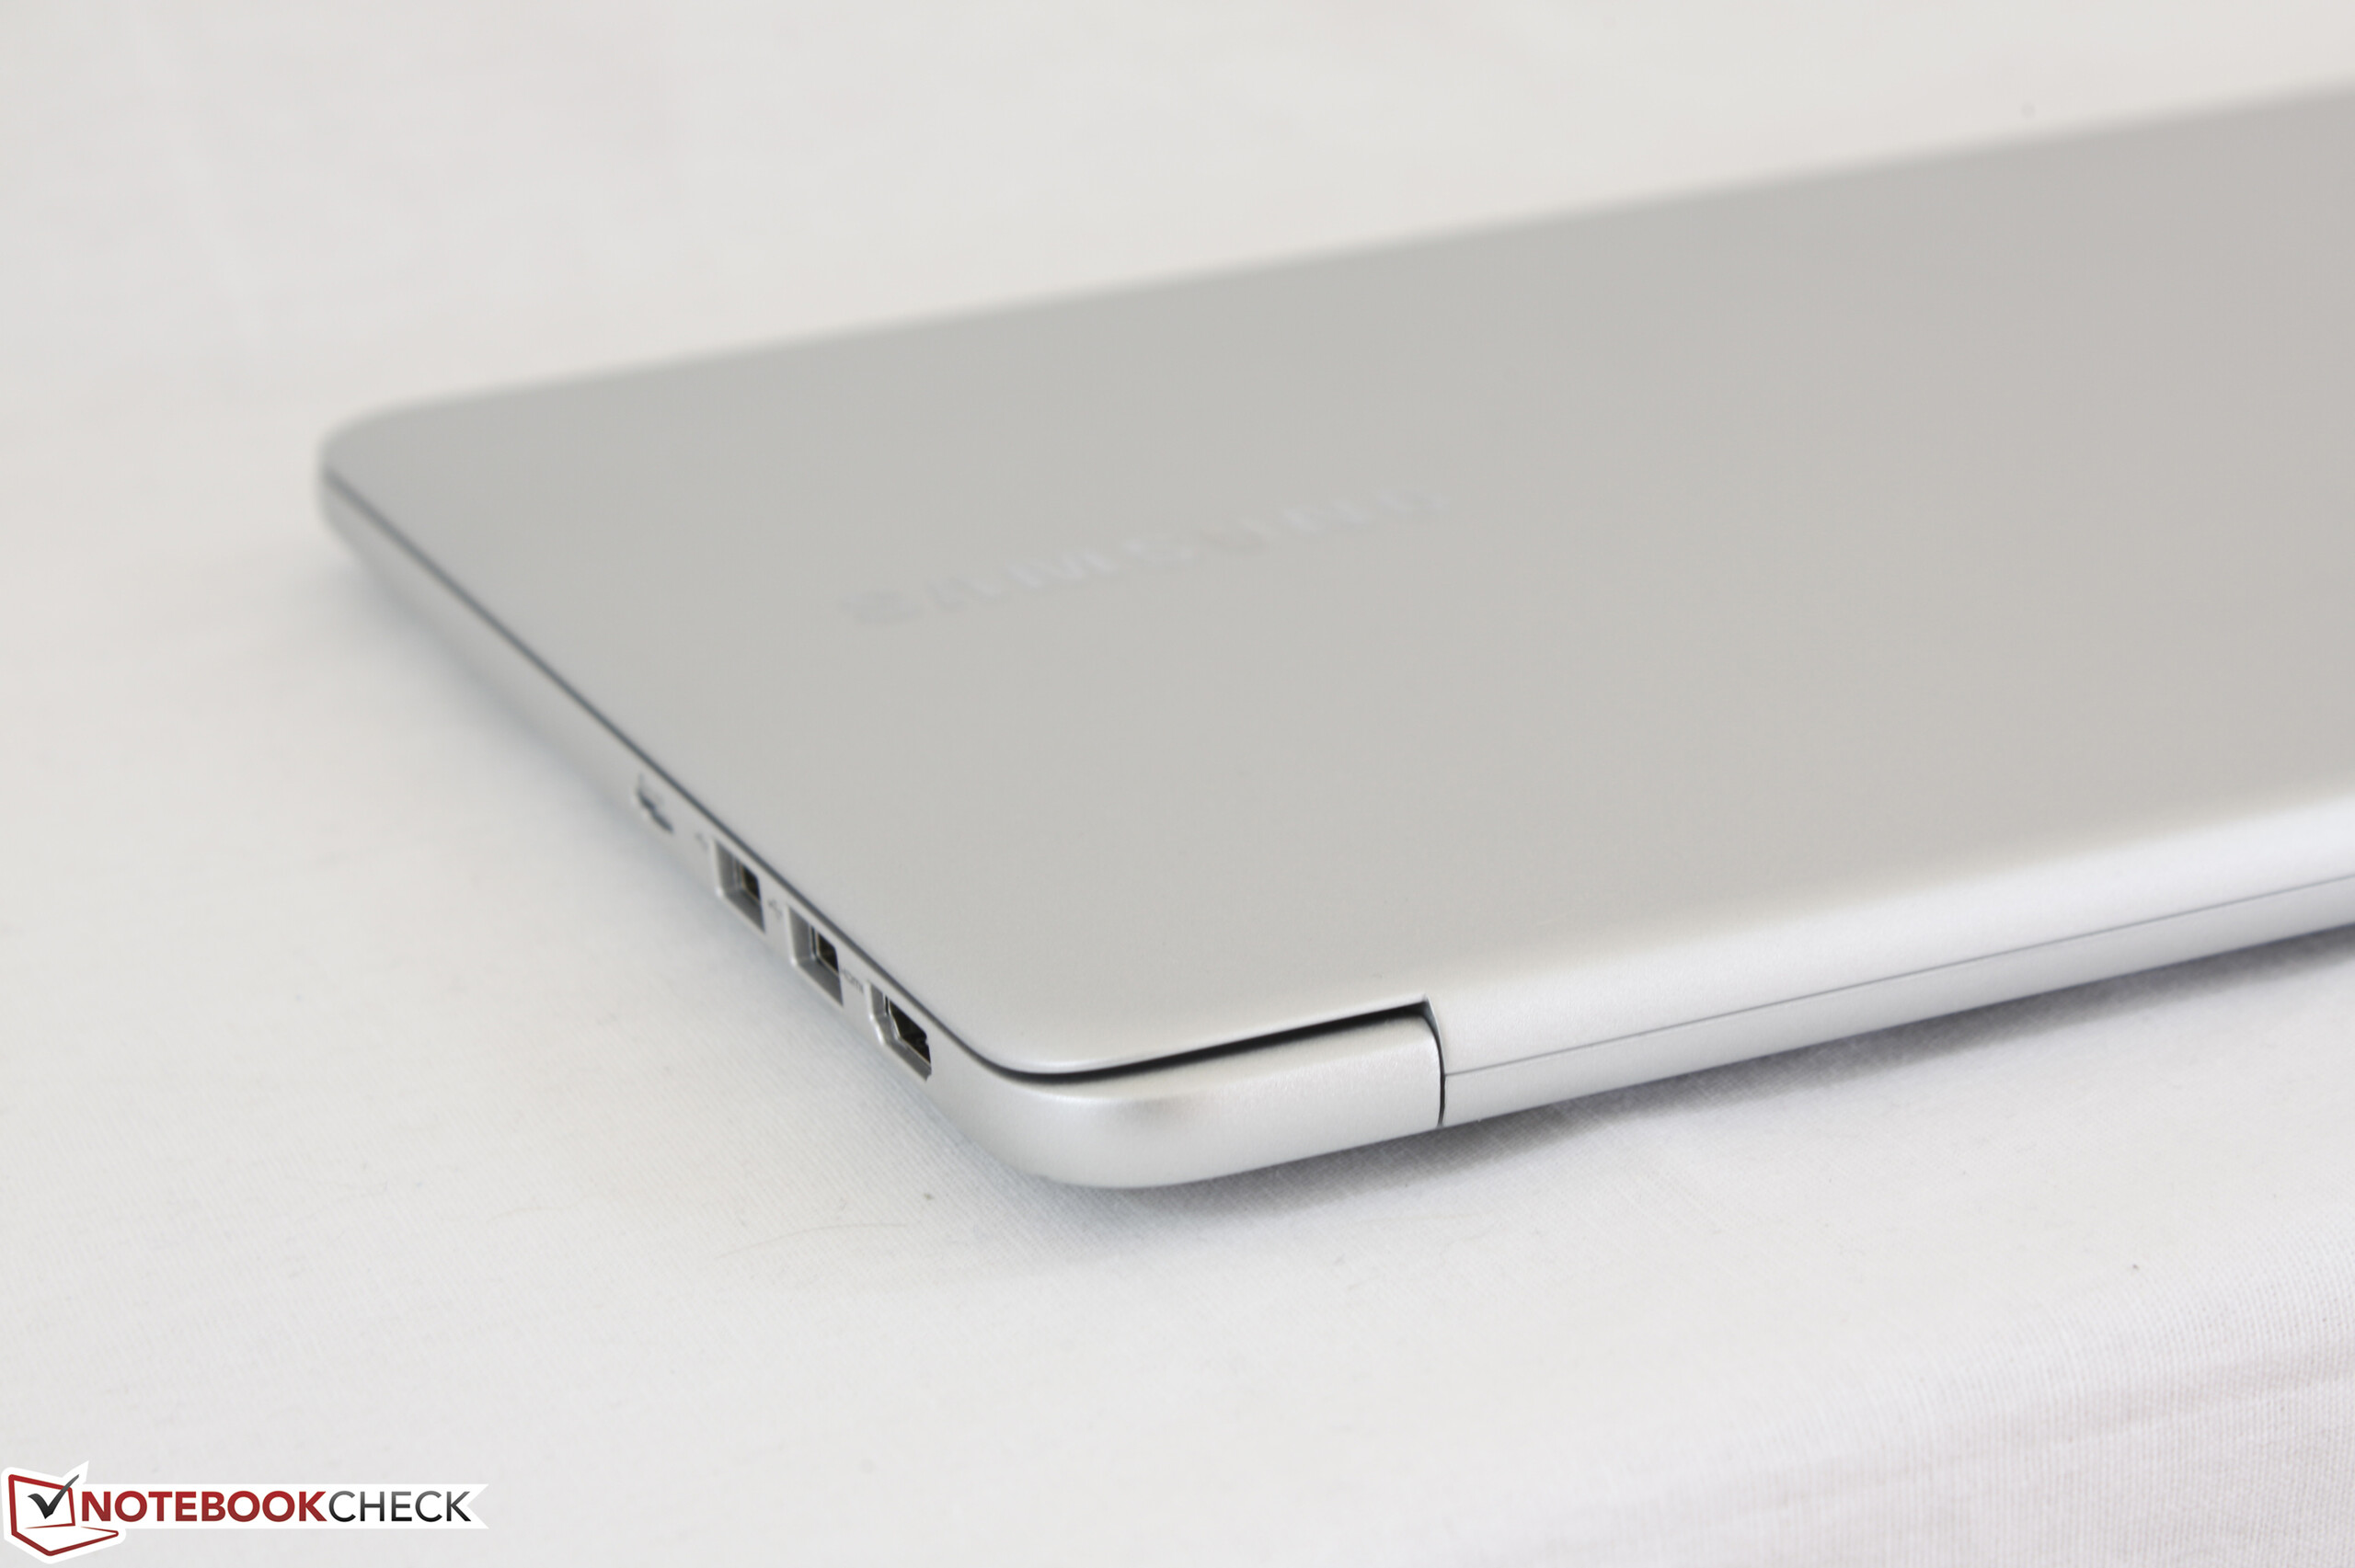
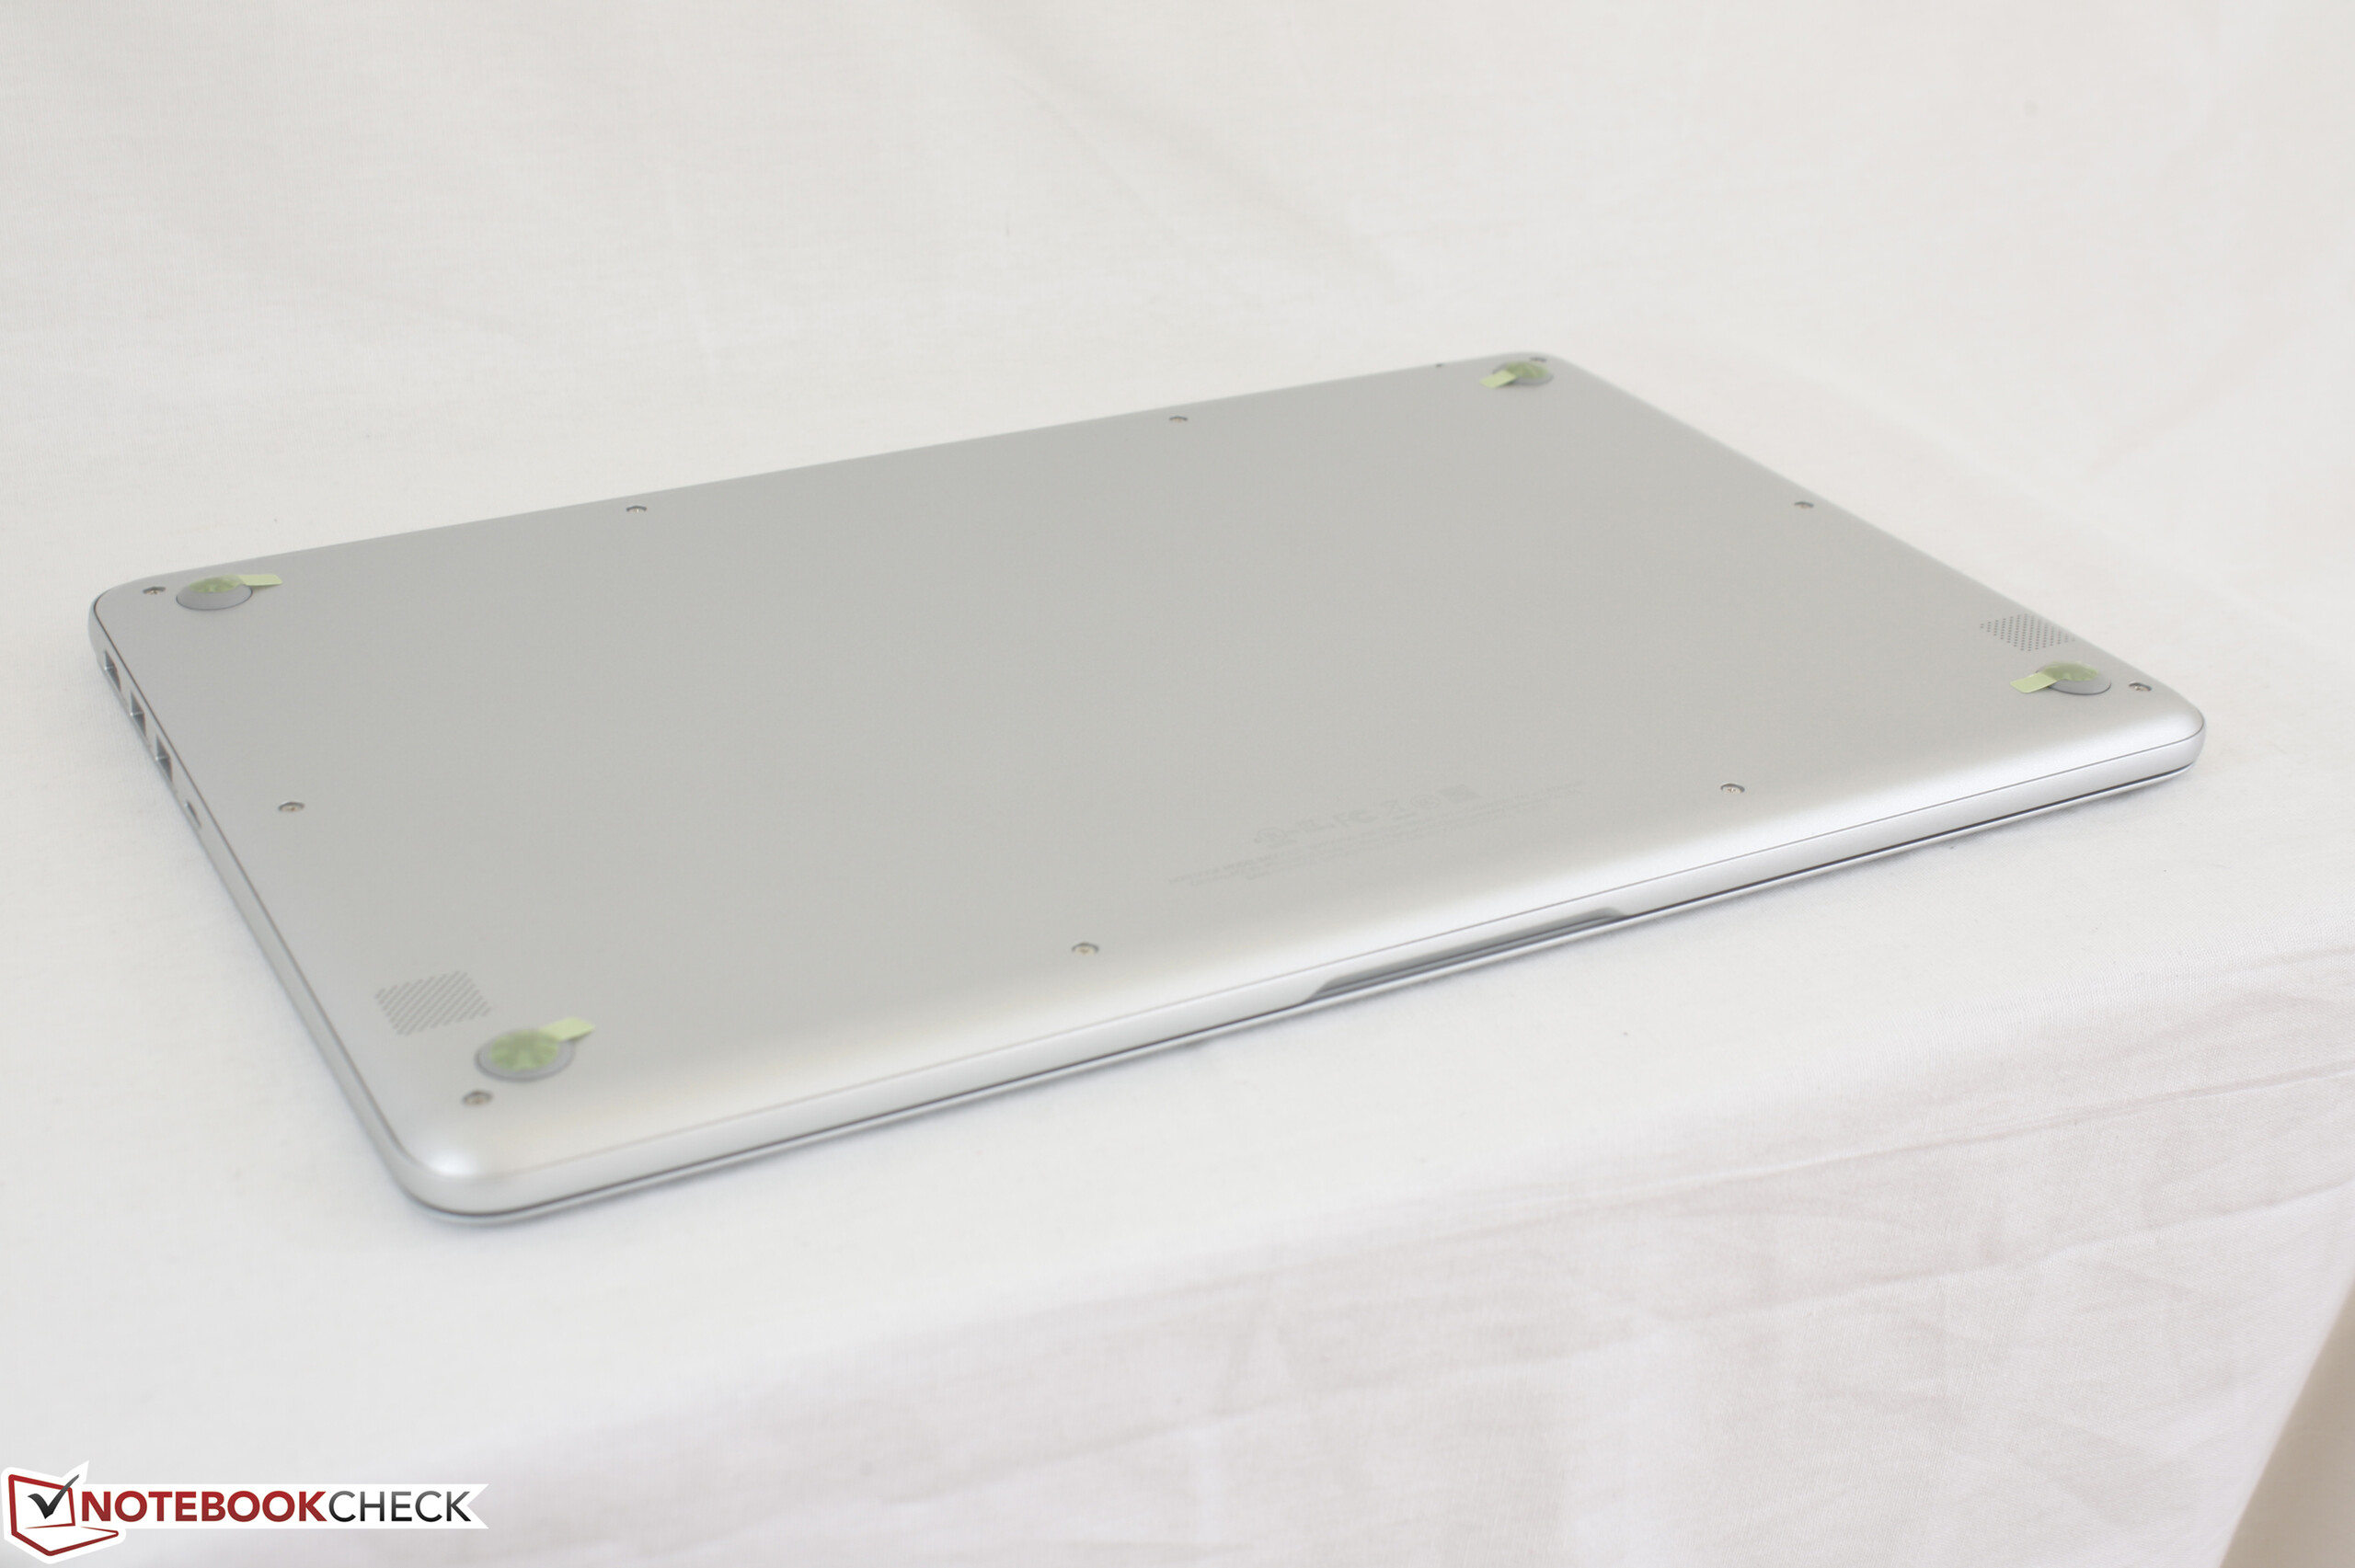
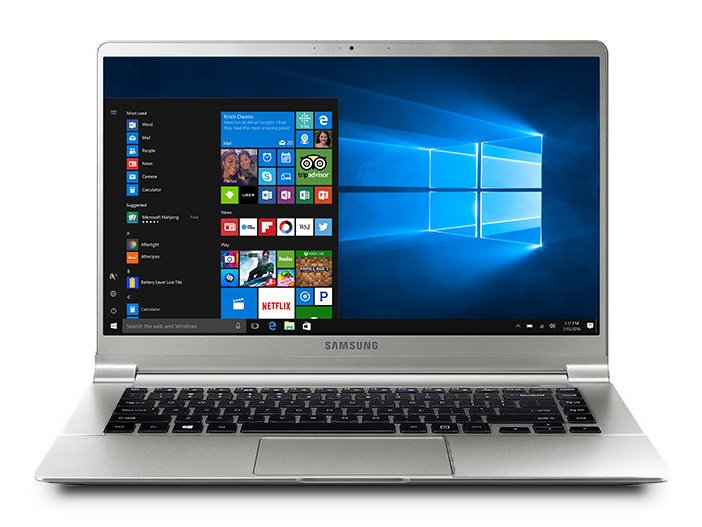
O novo Notebook 9 é exclusivo devido à sua tela de 15,0 polegadas que ocupa um vazio entre portáteis de 14 e 15,6 polegadas. É surpreendentemente portátil e confortável de usar, especialmente para viajantes constantes, mas o chassi poderia ter se beneficiado de mais reforço.
Samsung Notebook 9 NP900X5N-X01US
- 06/15/2017 v6 (old)
Allen Ngo
Price comparison
