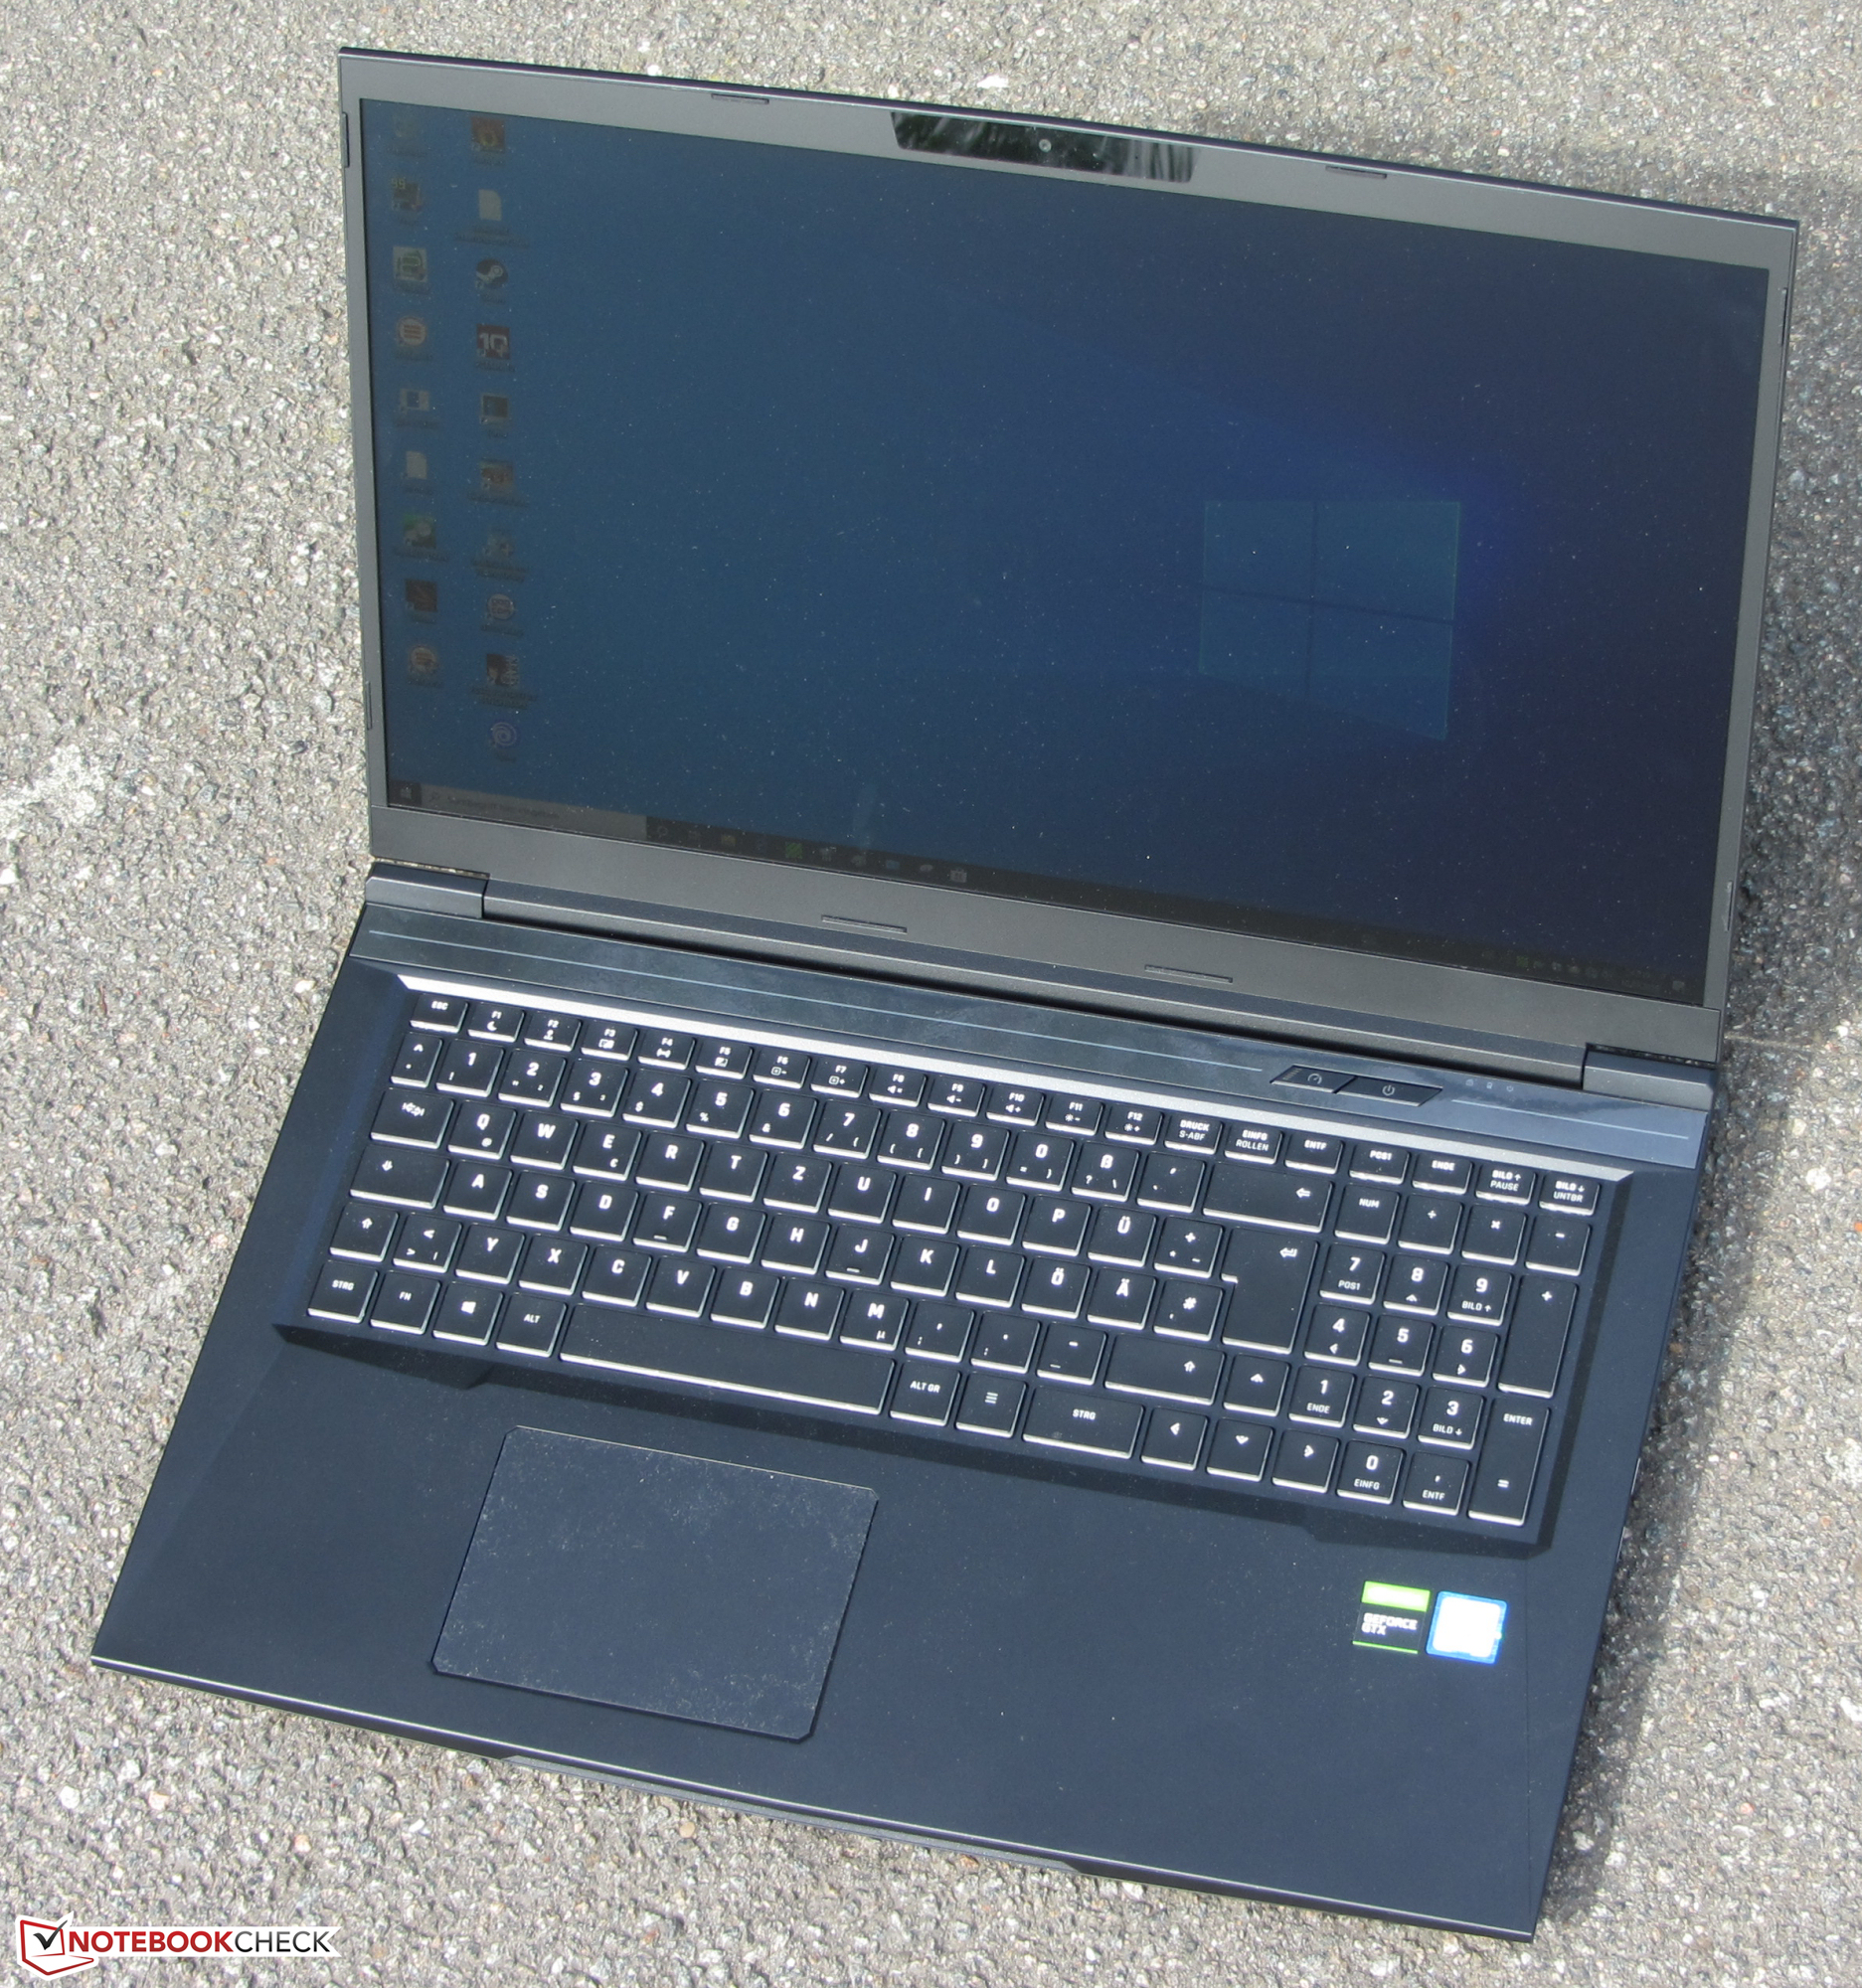
Schenker XMG Core 17 (Tongfang GK7MRFR) em revisão: Laptop para jogos de médio alcance sem afrontamentos

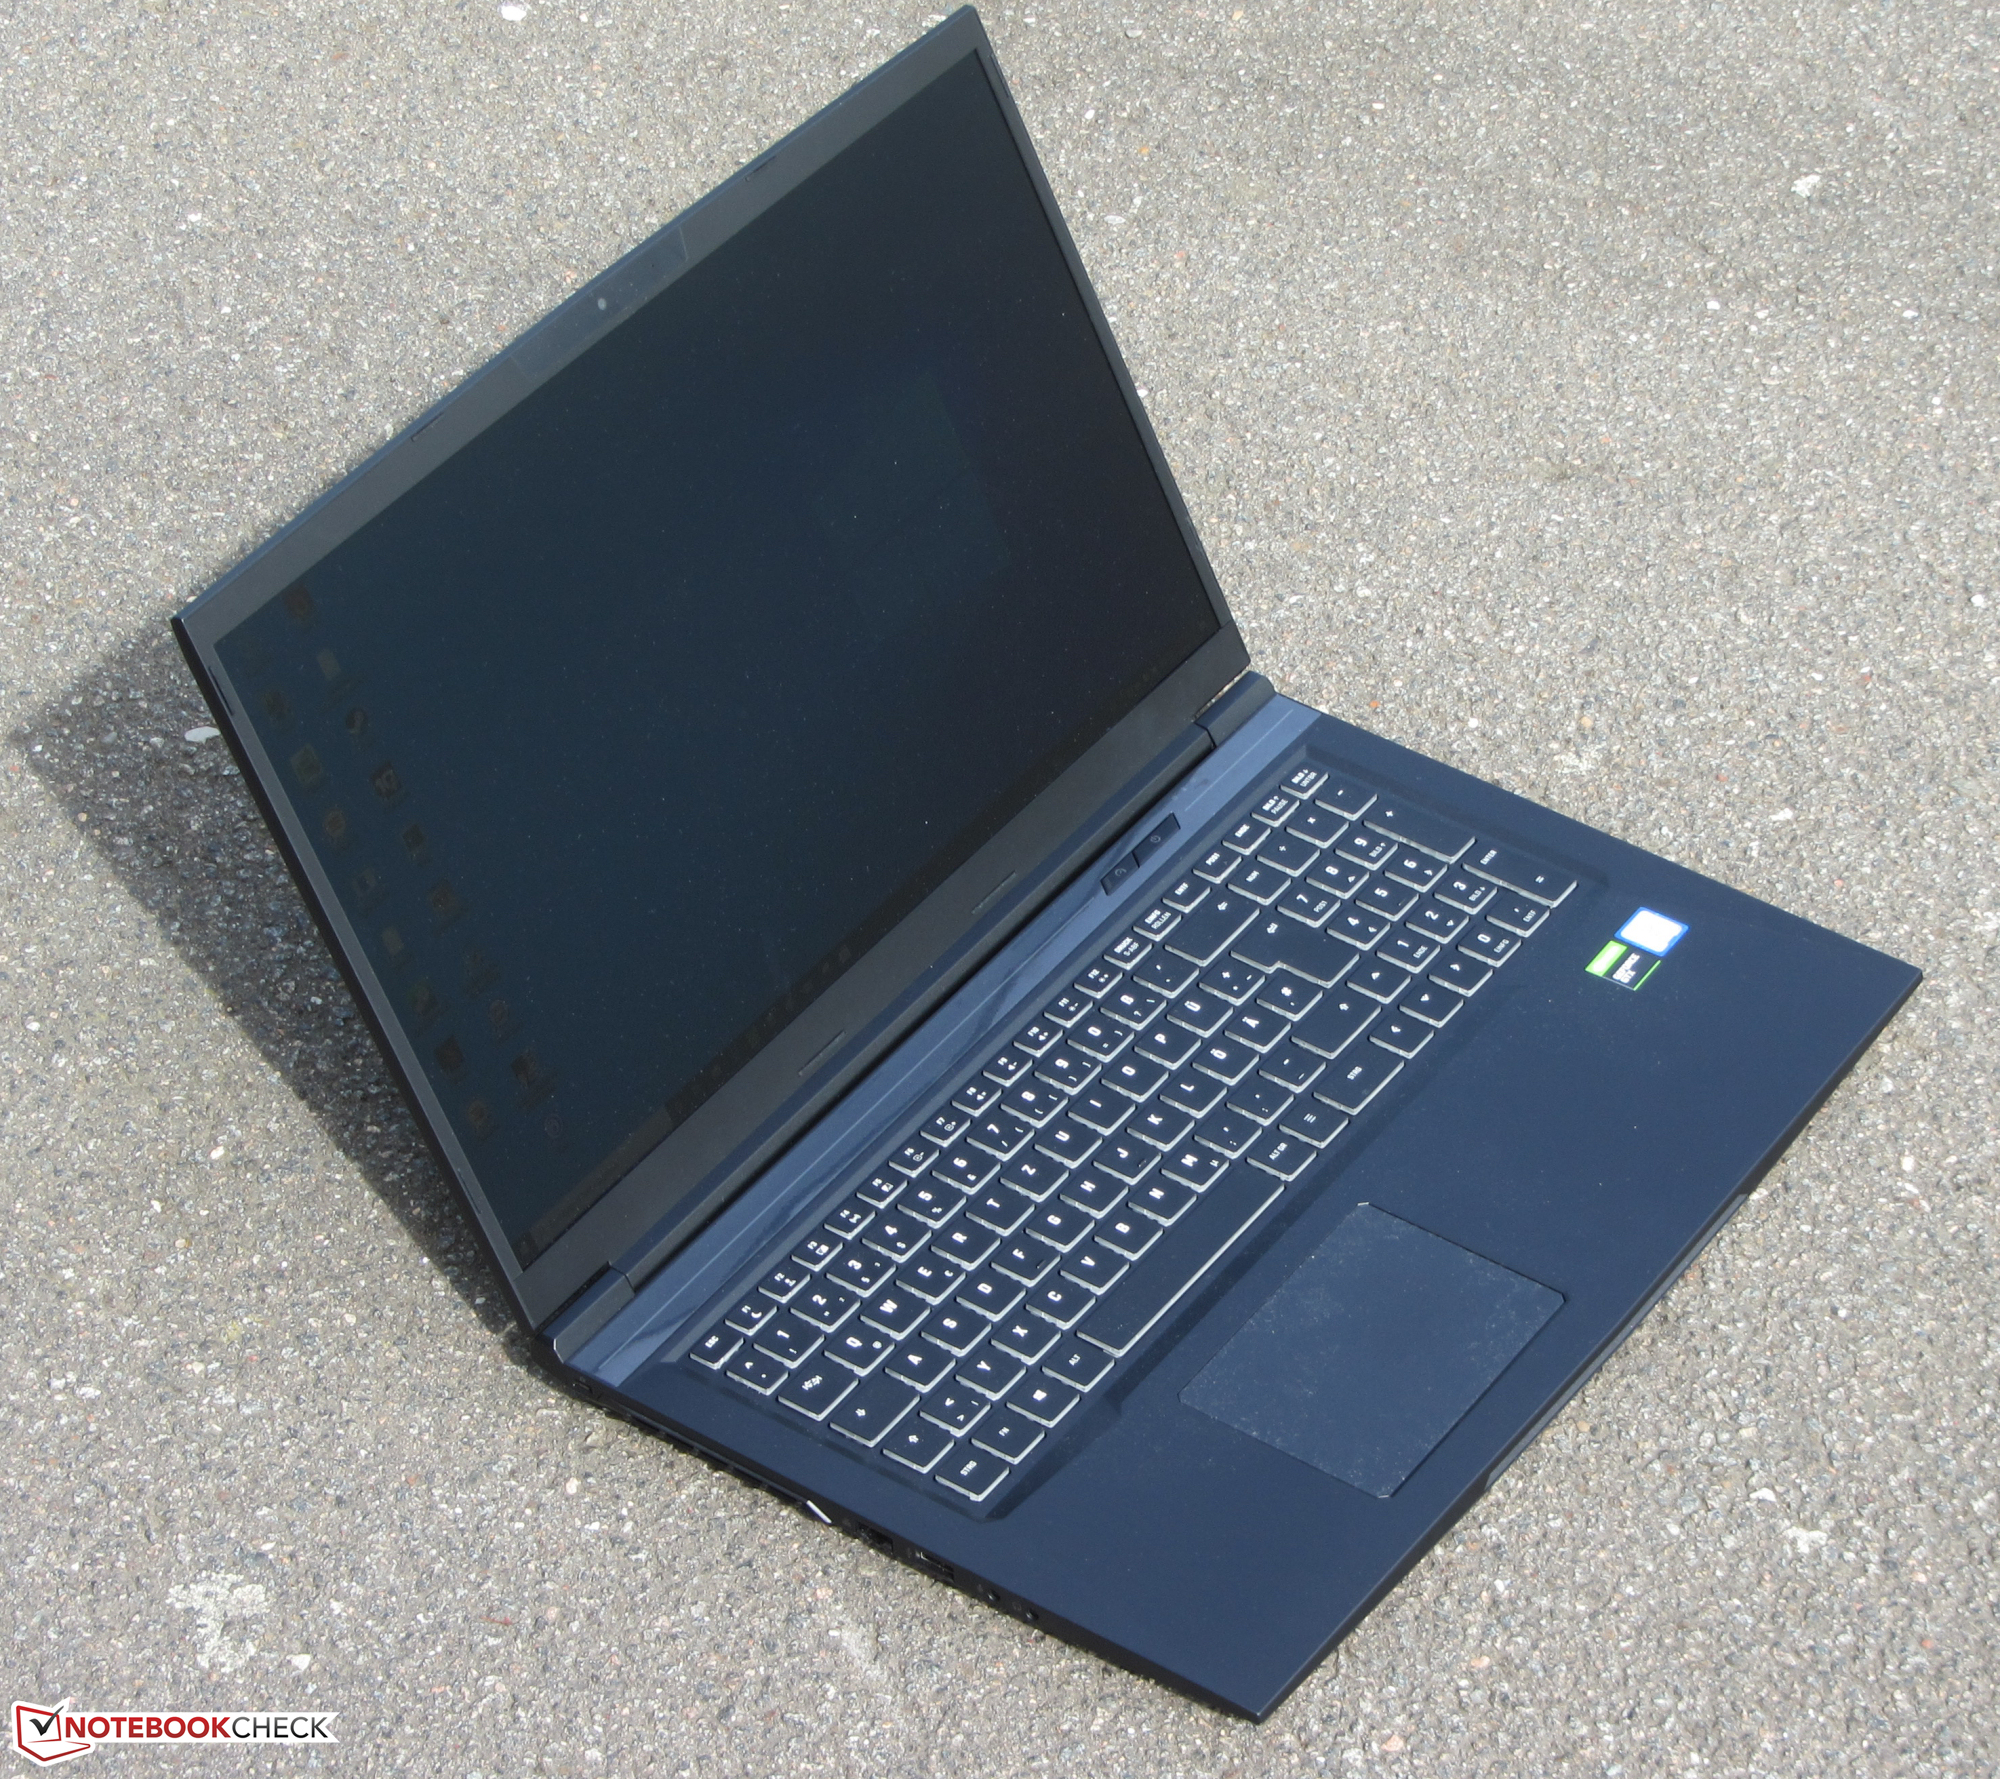
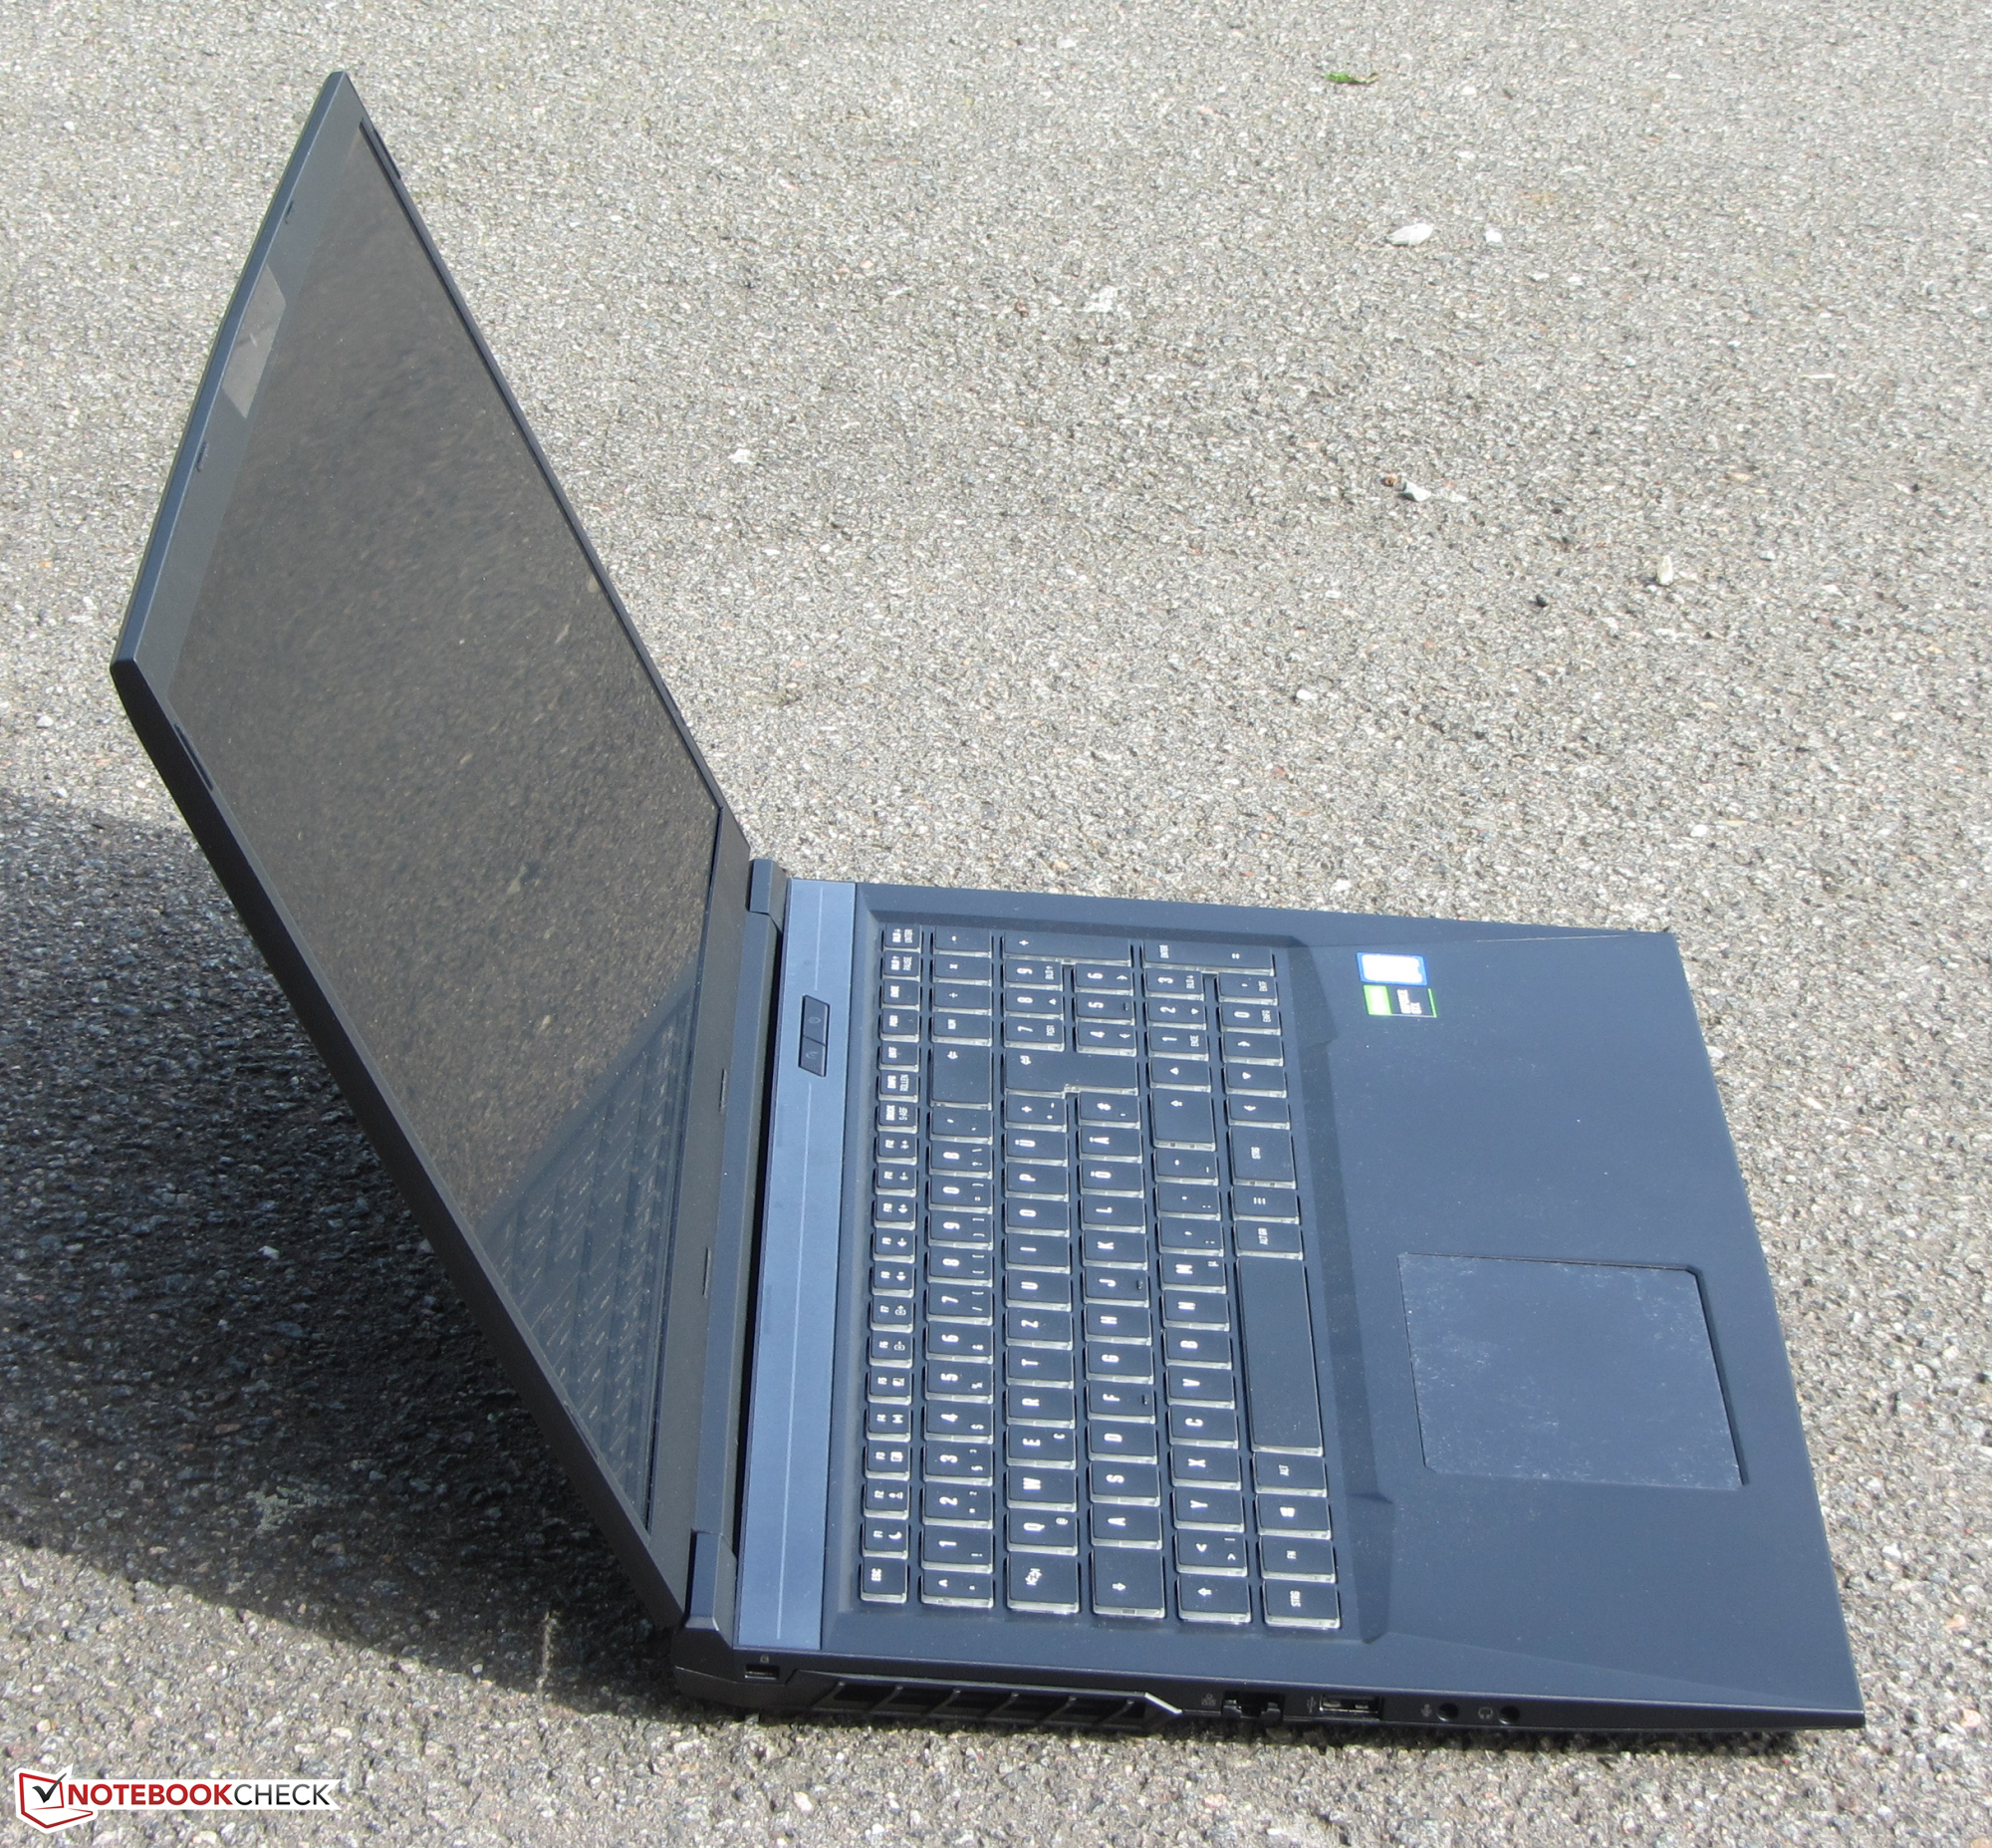
O Schenker XMG Core 17 é um laptop para jogos de médio alcance. A amostra de revisão que nos é fornecida é alimentada por umprocessador Corei7-10750H e umnúcleo gráficoGeForce GTX 1650 Ti. Alternativamente, o laptop está disponível com umGPU de atualizaçãoGeForce RTX 2060. Os concorrentes incluem dispositivos como a Lenovo Legion 5 17IMH05, o AcerPredator Helios 300 PH317-54, o MSI GF75Thin SDR, e o Nexoc GH7 716IG.
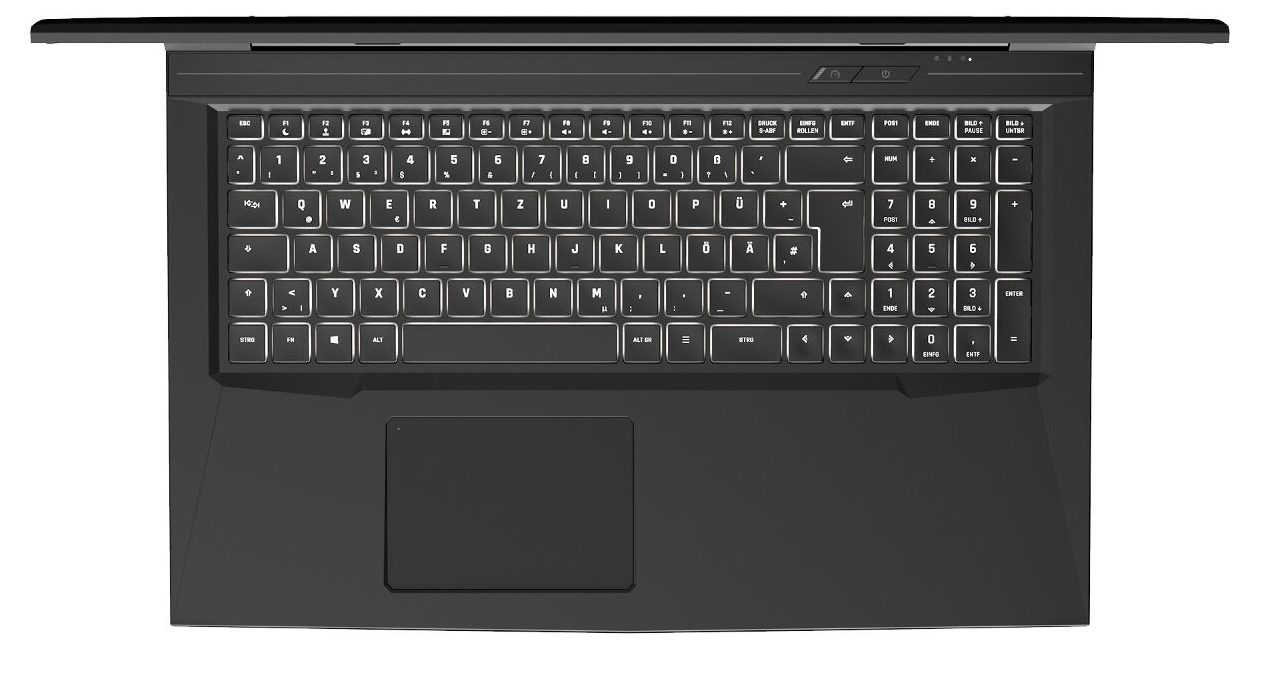
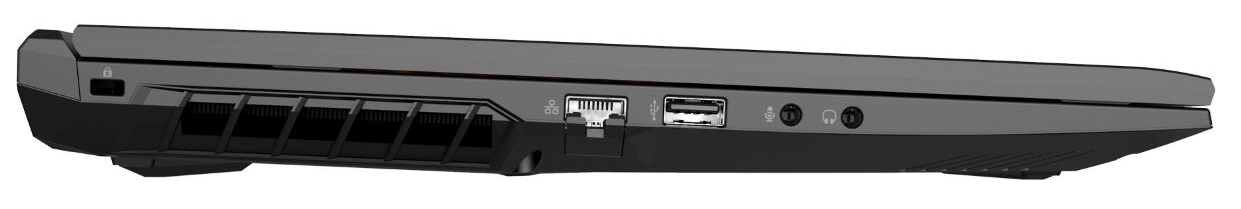
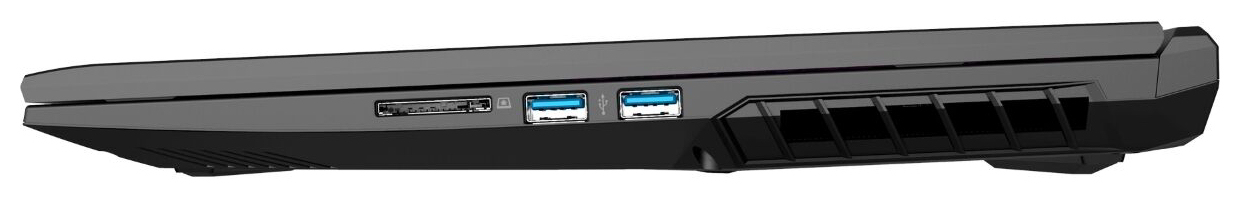
Desde 2020, o Core 17 é idêntico em construção aomodelo 2019não iremos mais longe no caso, a conectividade, os dispositivos de entrada e os alto-falantes. As informações correspondentes podem ser encontradas no revisão do Schenker XMG Core 17 (2019).
Avaliação | Data | Modelo | Peso | Altura | Size | Resolução | Preço |
|---|---|---|---|---|---|---|---|
| 81.4 % v7 (old) | 12/2020 | Schenker XMG Core 17 Comet Lake i7-10750H, GeForce GTX 1650 Ti Mobile | 2.5 kg | 30 mm | 17.30" | 1920x1080 | |
| 81.9 % v7 (old) | 10/2020 | Lenovo Legion 5 17IMH05 i5-10300H, GeForce GTX 1650 Mobile | 2.9 kg | 26.2 mm | 17.30" | 1920x1080 | |
| 83.6 % v7 (old) | 10/2020 | Acer Predator Helios 300 PH317-54-75G8 i7-10750H, GeForce RTX 2060 Mobile | 2.8 kg | 25 mm | 17.30" | 1920x1080 | |
| 79.8 % v7 (old) | 10/2020 | MSI GF75 Thin 10SDR i7-10750H, GeForce GTX 1660 Ti Mobile | 2.2 kg | 23 mm | 17.30" | 1920x1080 | |
| 81.5 % v7 (old) | Nexoc GH7 716IG i7-10750H, GeForce GTX 1660 Ti Mobile | 2.5 kg | 29.5 mm | 17.30" | 1920x1080 |

Conectividade

| SD Card Reader | |
| average JPG Copy Test (av. of 3 runs) | |
| Média da turma Gaming (20.9 - 210, n=54, últimos 2 anos) | |
| Nexoc GH7 716IG (Toshiba Exceria Pro SDXC 64 GB UHS-II) | |
| Lenovo Legion 5 17IMH05 (Toshiba Exceria Pro SDXC 64 GB UHS-II) | |
| Schenker XMG Core 17 (Toshiba Exceria Pro SDXC 64 GB UHS-II) | |
| Schenker XMG Core 17 Comet Lake (Toshiba Exceria Pro SDXC 64 GB UHS-II) | |
| maximum AS SSD Seq Read Test (1GB) | |
| Média da turma Gaming (25.5 - 261, n=51, últimos 2 anos) | |
| Lenovo Legion 5 17IMH05 (Toshiba Exceria Pro SDXC 64 GB UHS-II) | |
| Nexoc GH7 716IG (Toshiba Exceria Pro SDXC 64 GB UHS-II) | |
| Schenker XMG Core 17 (Toshiba Exceria Pro SDXC 64 GB UHS-II) | |
| Schenker XMG Core 17 Comet Lake (Toshiba Exceria Pro SDXC 64 GB UHS-II) | |
| Networking | |
| iperf3 transmit AX12 | |
| Acer Predator Helios 300 PH317-54-75G8 | |
| Nexoc GH7 716IG | |
| Schenker XMG Core 17 Comet Lake | |
| Média Intel Wi-Fi 6 AX201 (49.8 - 1775, n=324) | |
| Lenovo Legion 5 17IMH05 | |
| MSI GF75 Thin 10SDR | |
| Schenker XMG Core 17 | |
| iperf3 receive AX12 | |
| Nexoc GH7 716IG | |
| Schenker XMG Core 17 Comet Lake | |
| Acer Predator Helios 300 PH317-54-75G8 | |
| Lenovo Legion 5 17IMH05 | |
| Média Intel Wi-Fi 6 AX201 (136 - 1743, n=324) | |
| MSI GF75 Thin 10SDR | |
| Schenker XMG Core 17 | |


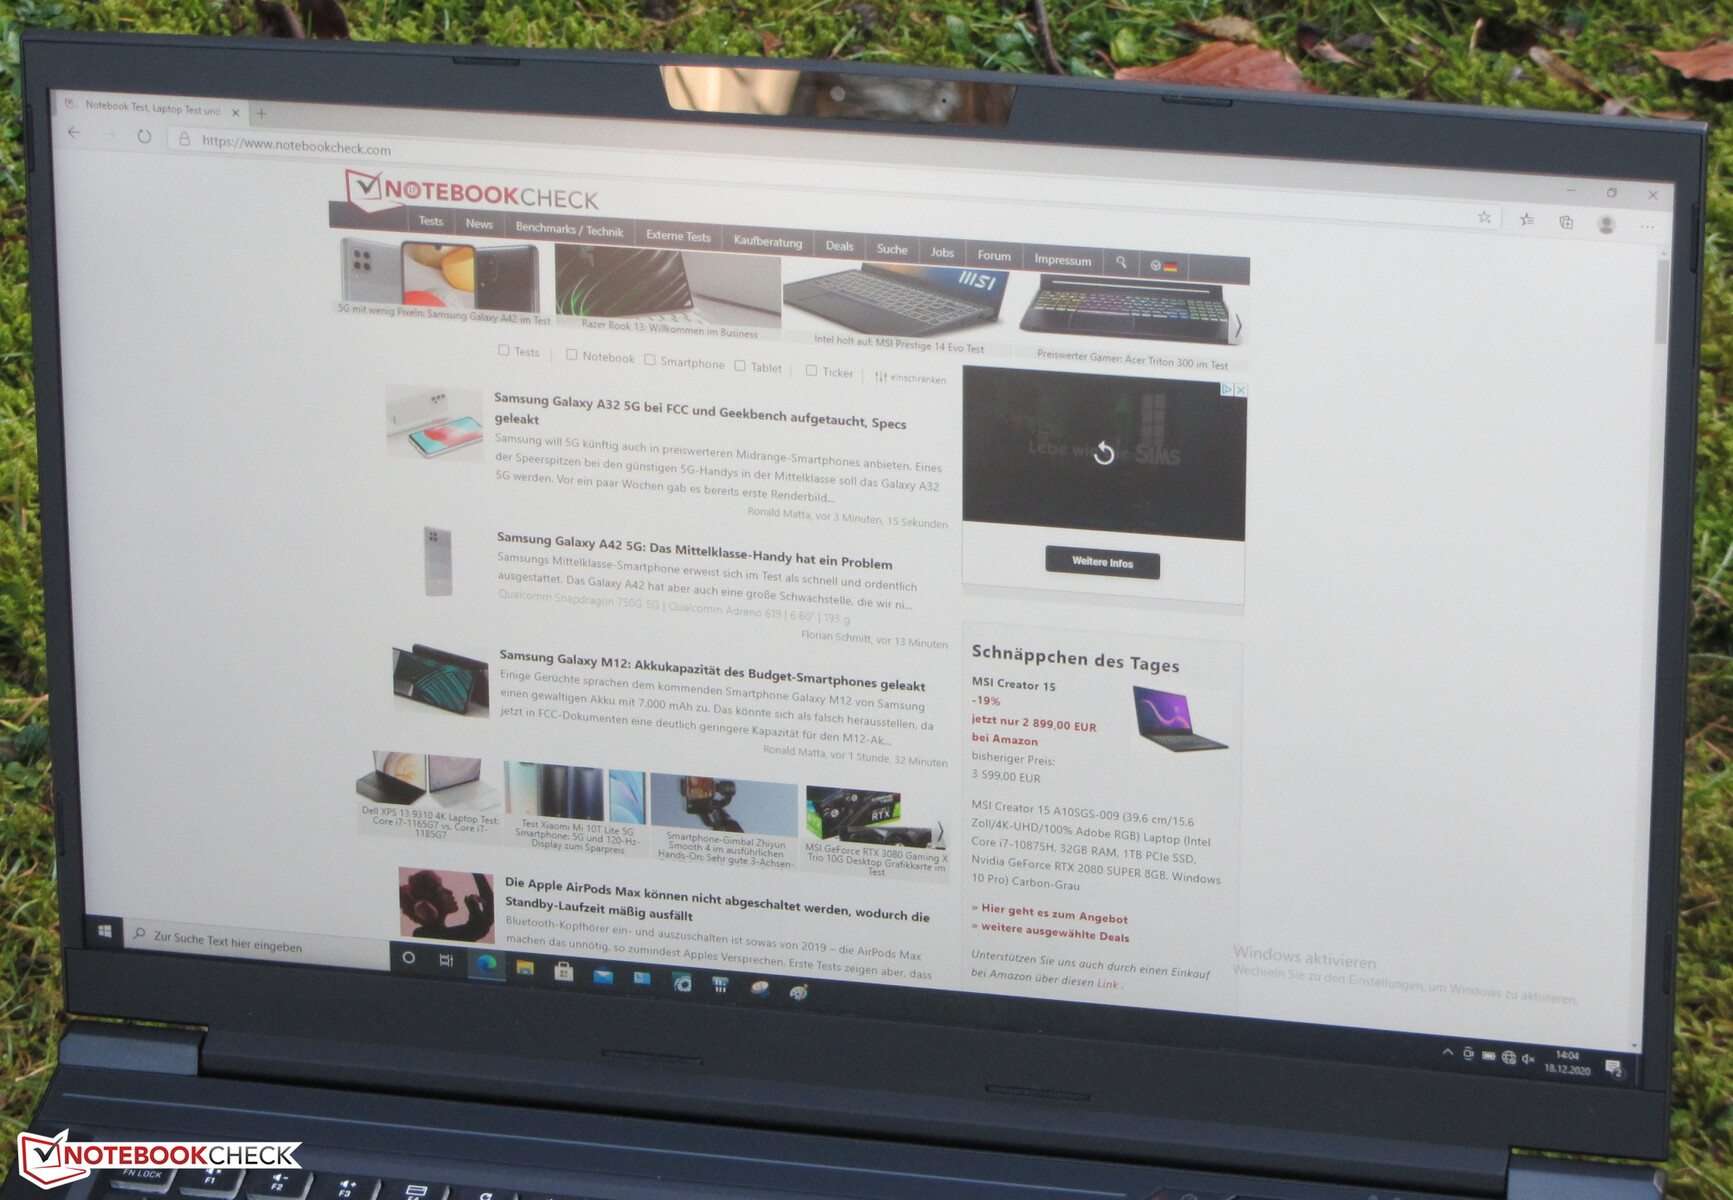
Visor - IPS 144 Hz
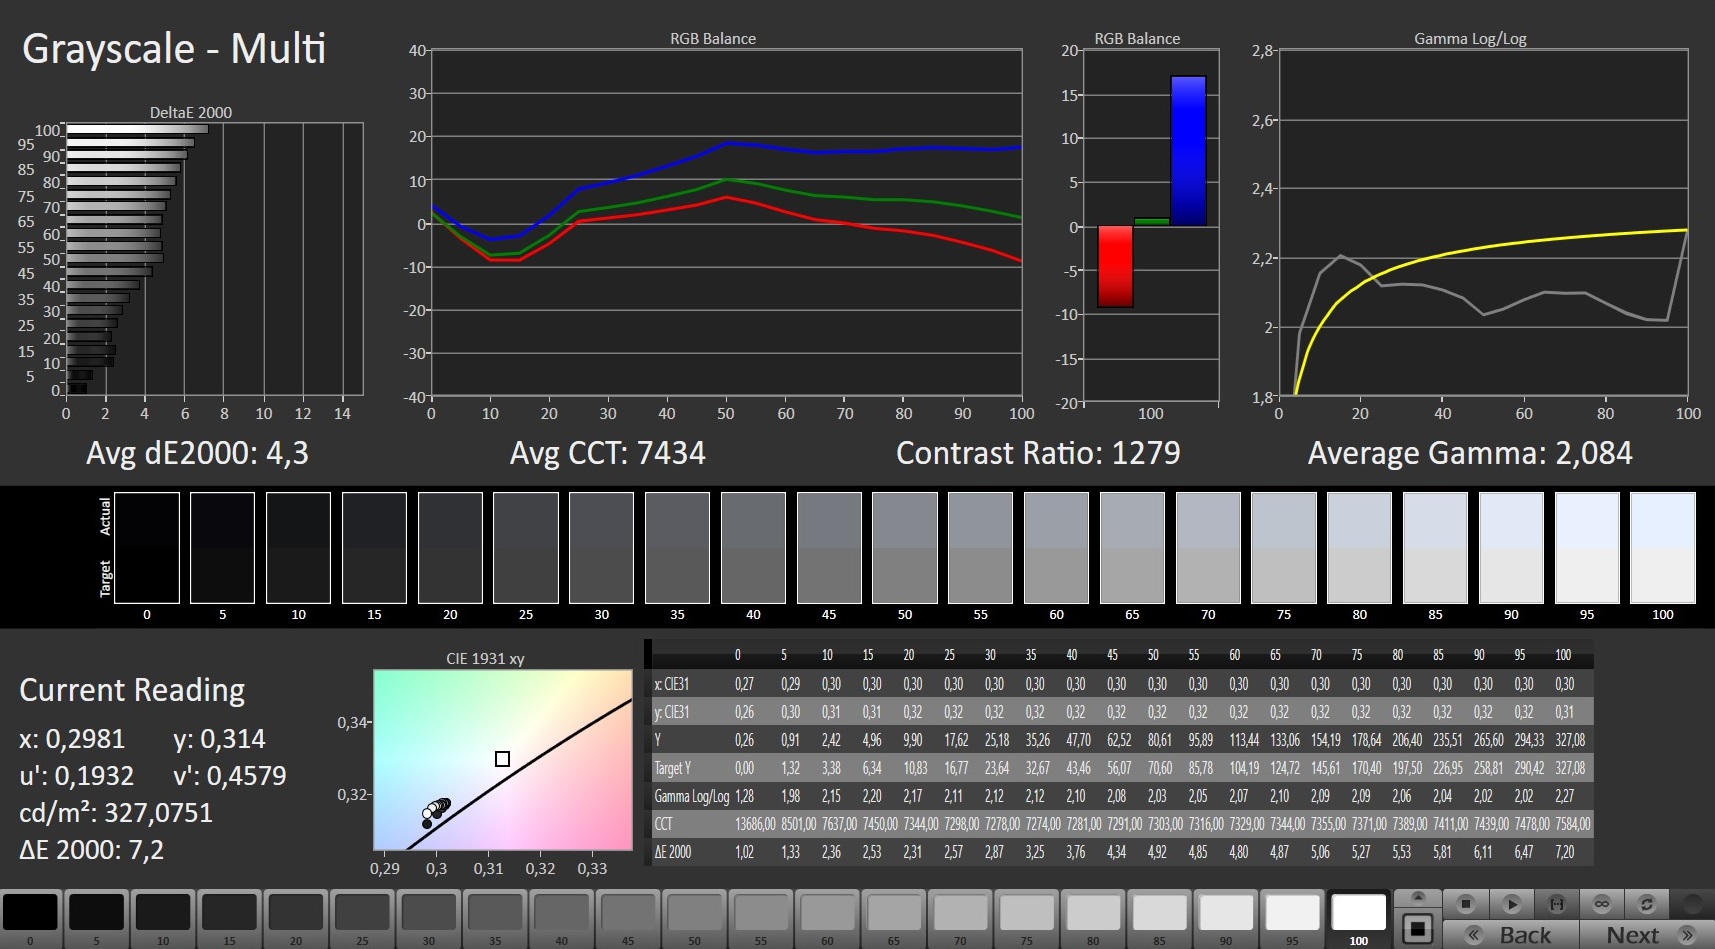
O brilho (297,8 cd/m²) e o contraste (1.086:1) da tela mate de 17,3 polegadas (1920x1080 pixels) são bons. Além disso, o painel de 144 Hz tem bons tempos de resposta em geral. A tela cintila a uma freqüência de 1.000 Hz com níveis de brilho de 99% e abaixo
| |||||||||||||||||||||||||
iluminação: 88 %
iluminação com acumulador: 315 cd/m²
Contraste: 1086:1 (Preto: 0.29 cd/m²)
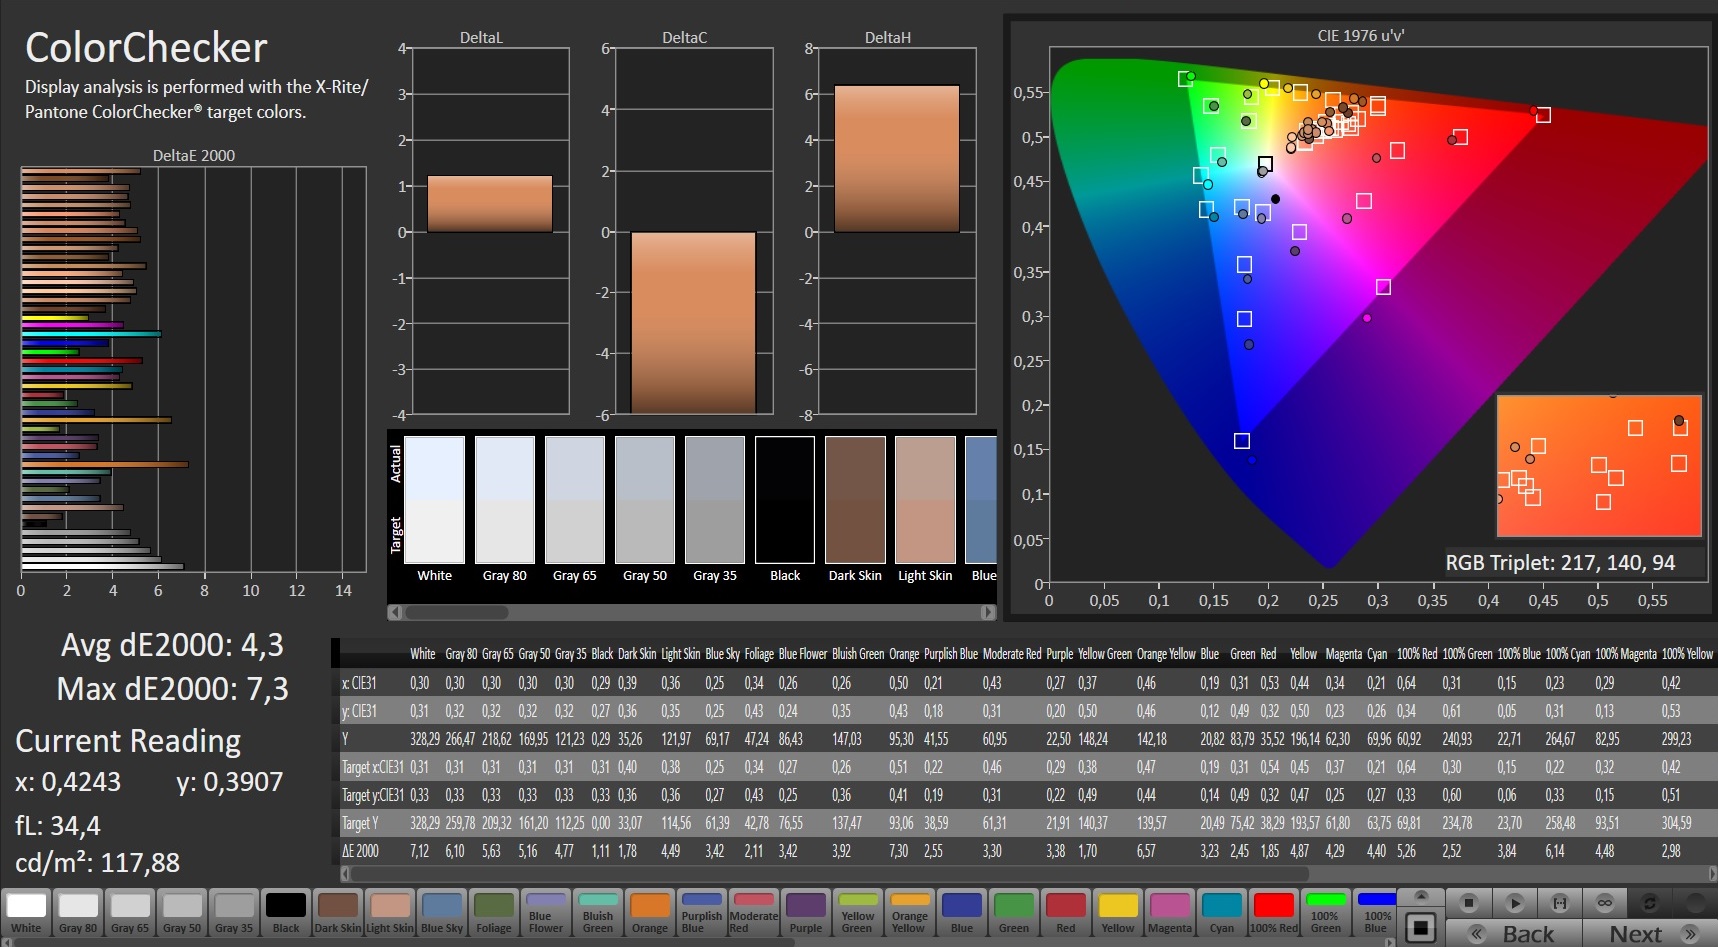
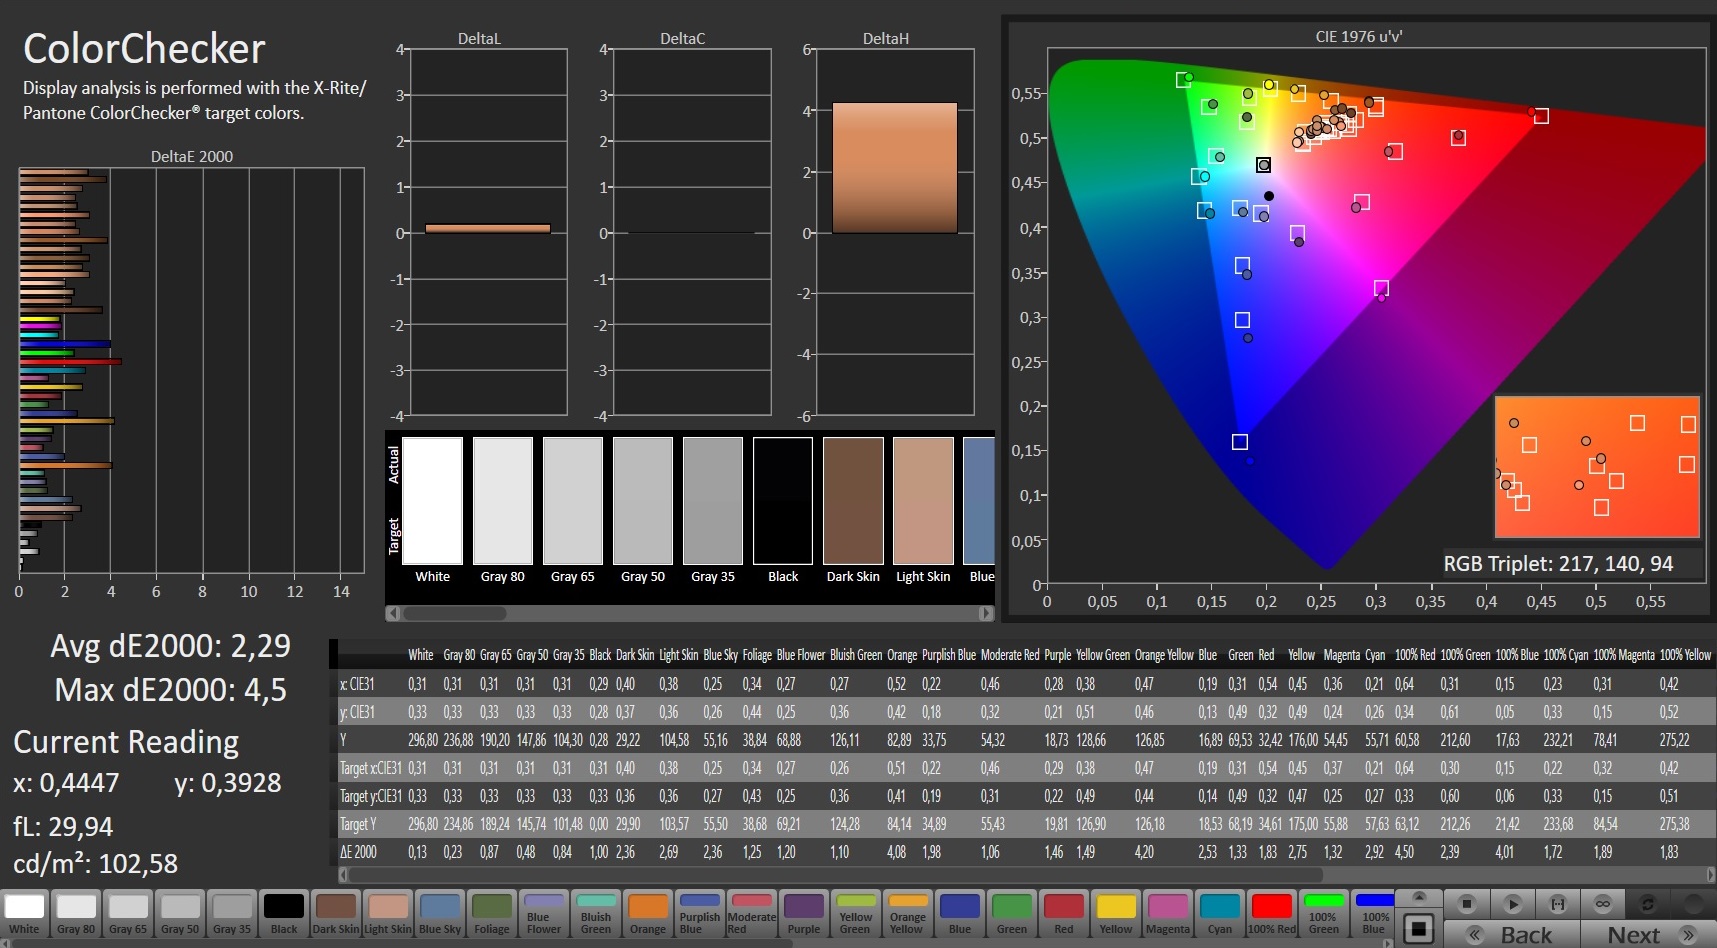
ΔE ColorChecker Calman: 4.3 | ∀{0.5-29.43 Ø4.71}
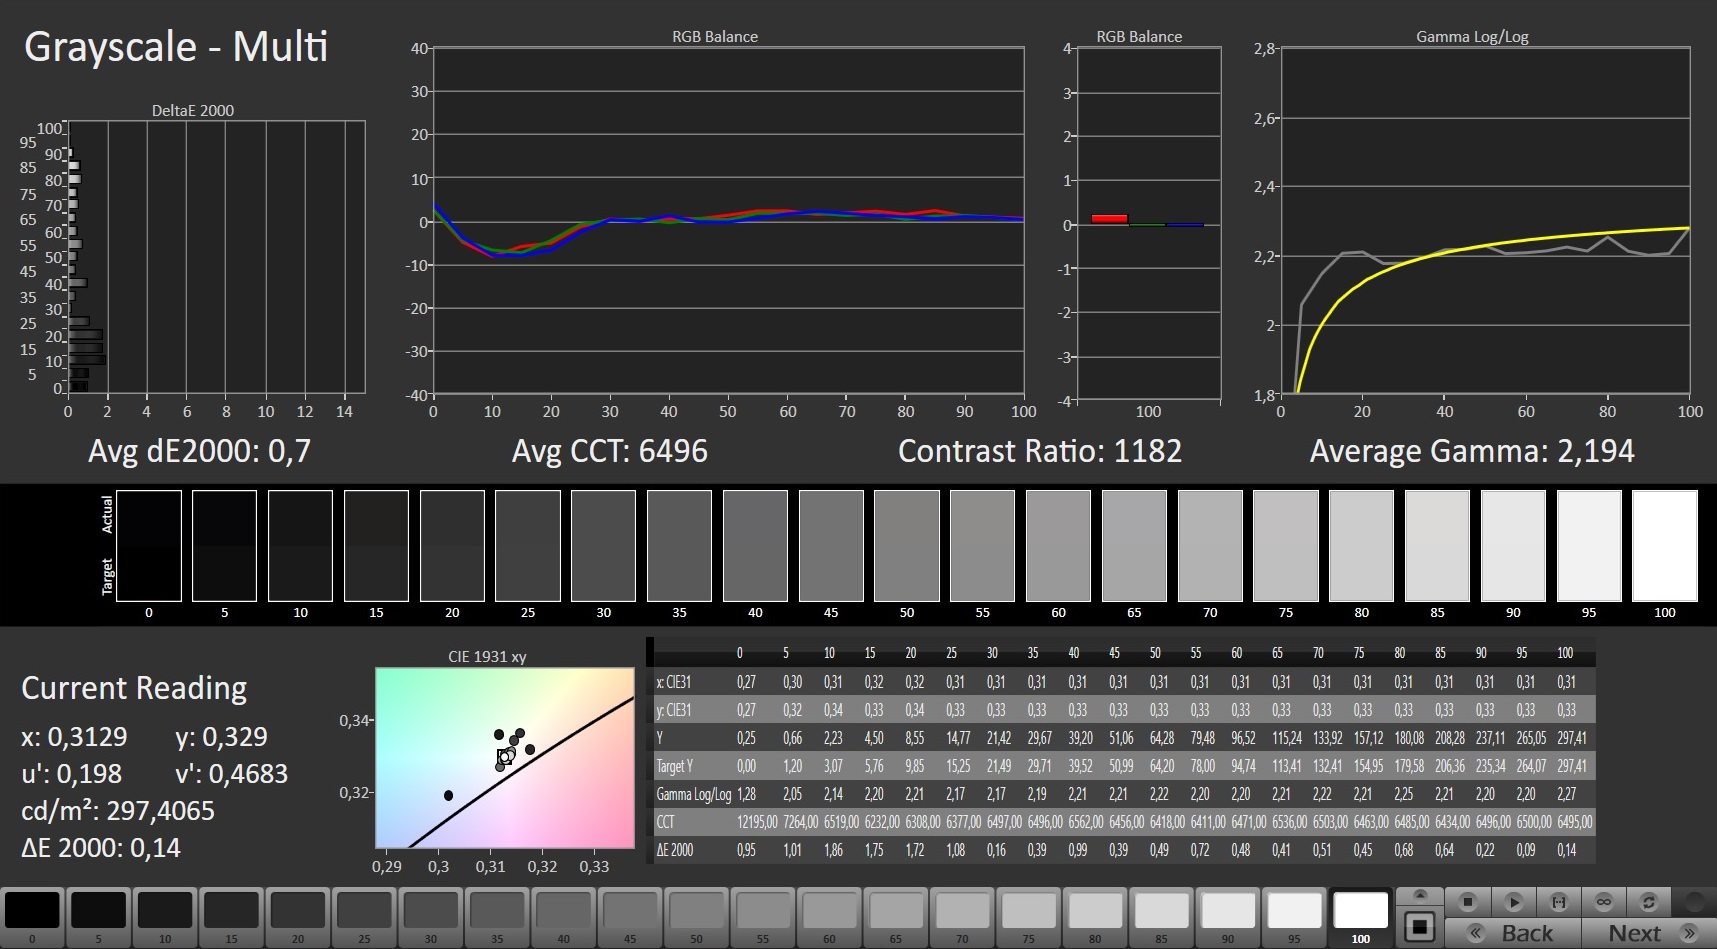
calibrated: 2.29
ΔE Greyscale Calman: 4.3 | ∀{0.09-98 Ø4.96}
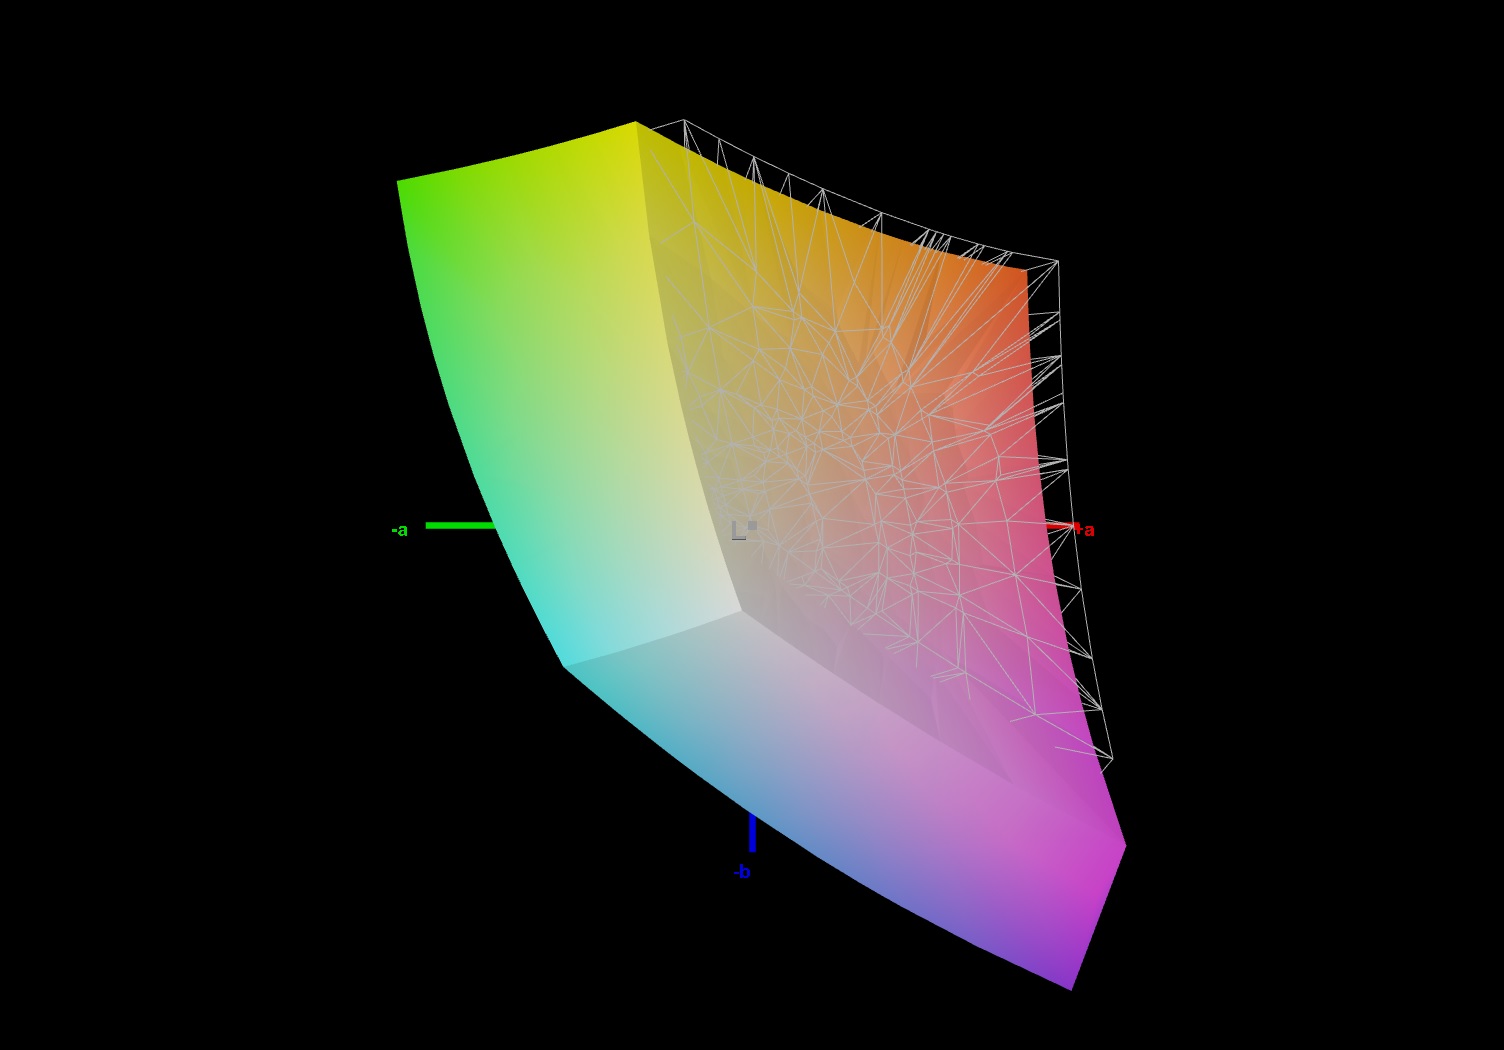
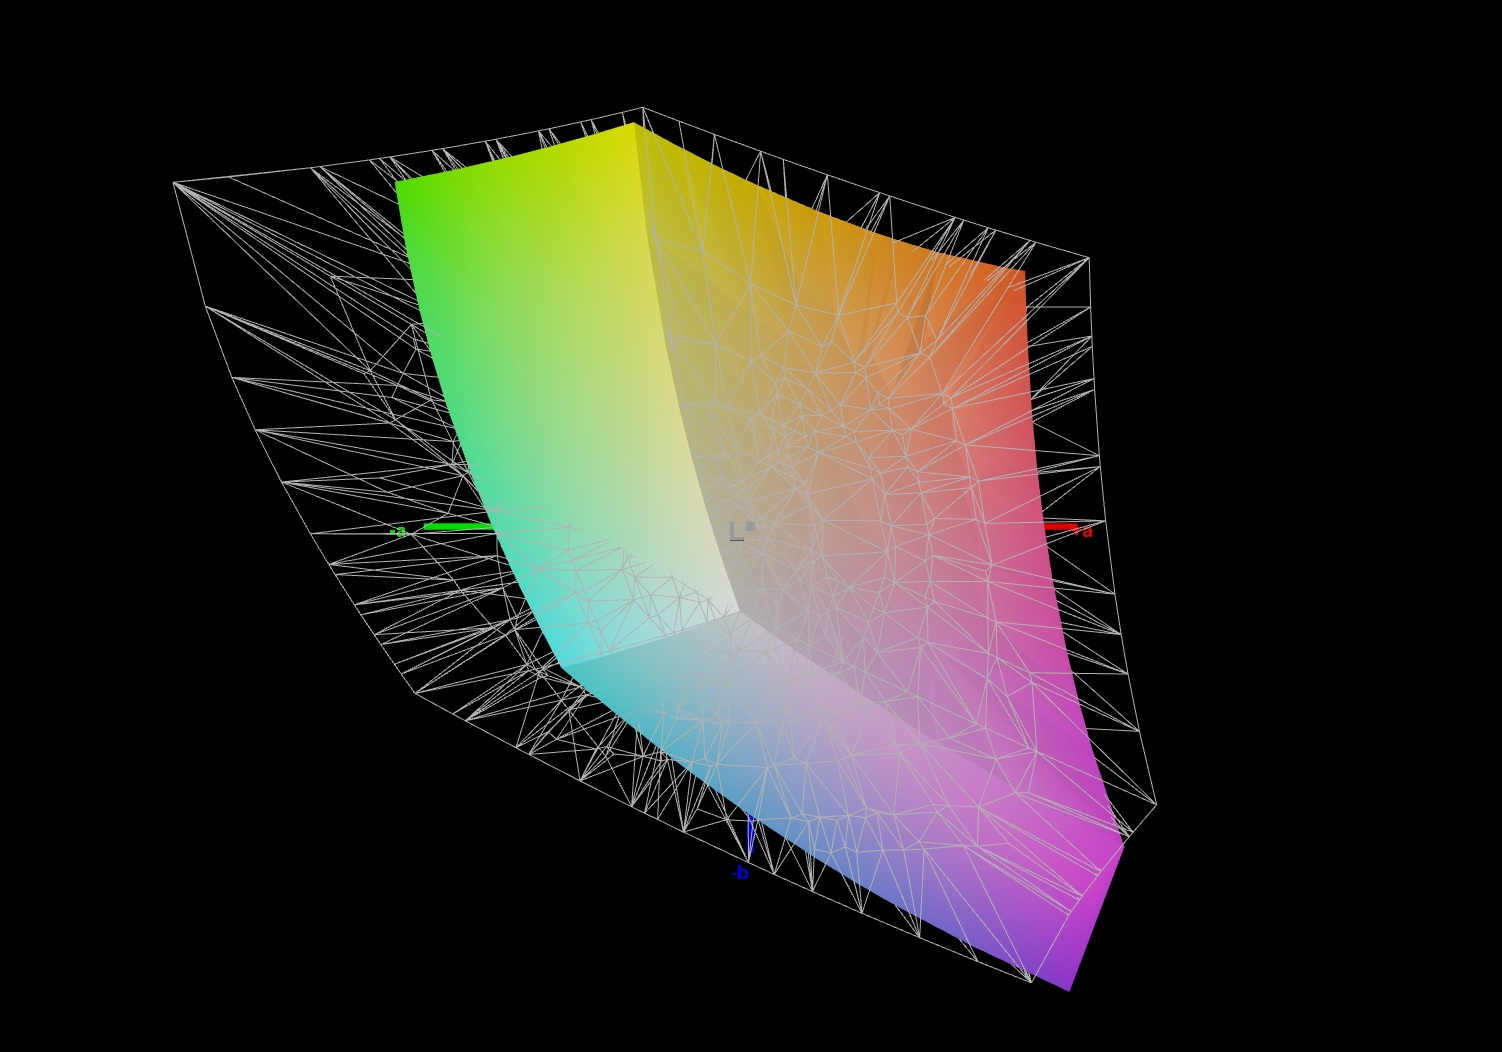
92% sRGB (Argyll 1.6.3 3D)
66% AdobeRGB 1998 (Argyll 1.6.3 3D)
66.5% AdobeRGB 1998 (Argyll 3D)
92.6% sRGB (Argyll 3D)
65.3% Display P3 (Argyll 3D)
Gamma: 2.084
CCT: 7434 K
| Schenker XMG Core 17 Comet Lake BOE HF NV173FHM-N44, IPS, 1920x1080, 17.3" | Schenker XMG Core 17 LG Philips LP173WFG-SPB1 (LGD0615), IPS, 1920x1080, 17.3" | Lenovo Legion 5 17IMH05 AU Optronics B173HAN04.3, IPS, 1920x1080, 17.3" | Acer Predator Helios 300 PH317-54-75G8 Chi Mei N173HCE-G33, IPS, 1920x1080, 17.3" | MSI GF75 Thin 10SDR B173HAN04.9 (AUO978F), IPS, 1920x1080, 17.3" | Nexoc GH7 716IG LG Philips LGD0615, IPS, 1920x1080, 17.3" | |
|---|---|---|---|---|---|---|
| Display | 0% | 6% | -2% | -37% | 0% | |
| Display P3 Coverage (%) | 65.3 | 64.4 -1% | 69.4 6% | 62.6 -4% | 39.98 -39% | 64.6 -1% |
| sRGB Coverage (%) | 92.6 | 95.6 3% | 97.1 5% | 94.3 2% | 59.9 -35% | 95.8 3% |
| AdobeRGB 1998 Coverage (%) | 66.5 | 65.6 -1% | 71.2 7% | 64.7 -3% | 41.31 -38% | 65.7 -1% |
| Response Times | 11% | -149% | -1% | -147% | 14% | |
| Response Time Grey 50% / Grey 80% * (ms) | 17.6 ? | 14.4 ? 18% | 38.4 ? -118% | 16.4 ? 7% | 38.4 ? -118% | 15.2 ? 14% |
| Response Time Black / White * (ms) | 10 ? | 9.6 ? 4% | 28 ? -180% | 10.8 ? -8% | 27.6 ? -176% | 8.6 ? 14% |
| PWM Frequency (Hz) | 1000 ? | 24510 ? | ||||
| Screen | 9% | 1% | 32% | -27% | 0% | |
| Brightness middle (cd/m²) | 315 | 329 4% | 326 3% | 322 2% | 252 -20% | 303 -4% |
| Brightness (cd/m²) | 298 | 286 -4% | 304 2% | 308 3% | 253 -15% | 277 -7% |
| Brightness Distribution (%) | 88 | 79 -10% | 89 1% | 92 5% | 92 5% | 86 -2% |
| Black Level * (cd/m²) | 0.29 | 0.3 -3% | 0.25 14% | 0.18 38% | 0.23 21% | 0.25 14% |
| Contrast (:1) | 1086 | 1097 1% | 1304 20% | 1789 65% | 1096 1% | 1212 12% |
| Colorchecker dE 2000 * | 4.3 | 2.52 41% | 4.42 -3% | 1.53 64% | 4.24 1% | 4.15 3% |
| Colorchecker dE 2000 max. * | 7.3 | 6.9 5% | 9.44 -29% | 3.14 57% | 21.4 -193% | 10.52 -44% |
| Colorchecker dE 2000 calibrated * | 2.29 | 1.31 43% | 1.53 33% | 0.74 68% | 3.64 -59% | 0.9 61% |
| Greyscale dE 2000 * | 4.3 | 2.98 31% | 5.8 -35% | 1.9 56% | 2.8 35% | 5.38 -25% |
| Gamma | 2.084 106% | 2.38 92% | 2.261 97% | 2.144 103% | 2.196 100% | 2.35 94% |
| CCT | 7434 87% | 6738 96% | 6822 95% | 6809 95% | 7027 93% | 7680 85% |
| Color Space (Percent of AdobeRGB 1998) (%) | 66 | 60 -9% | 71 8% | 65 -2% | 41 -38% | 61 -8% |
| Color Space (Percent of sRGB) (%) | 92 | 95 3% | 93 1% | 87 -5% | 59 -36% | 96 4% |
| Média Total (Programa/Configurações) | 7% /
8% | -47% /
-17% | 10% /
22% | -70% /
-44% | 5% /
2% |
* ... menor é melhor
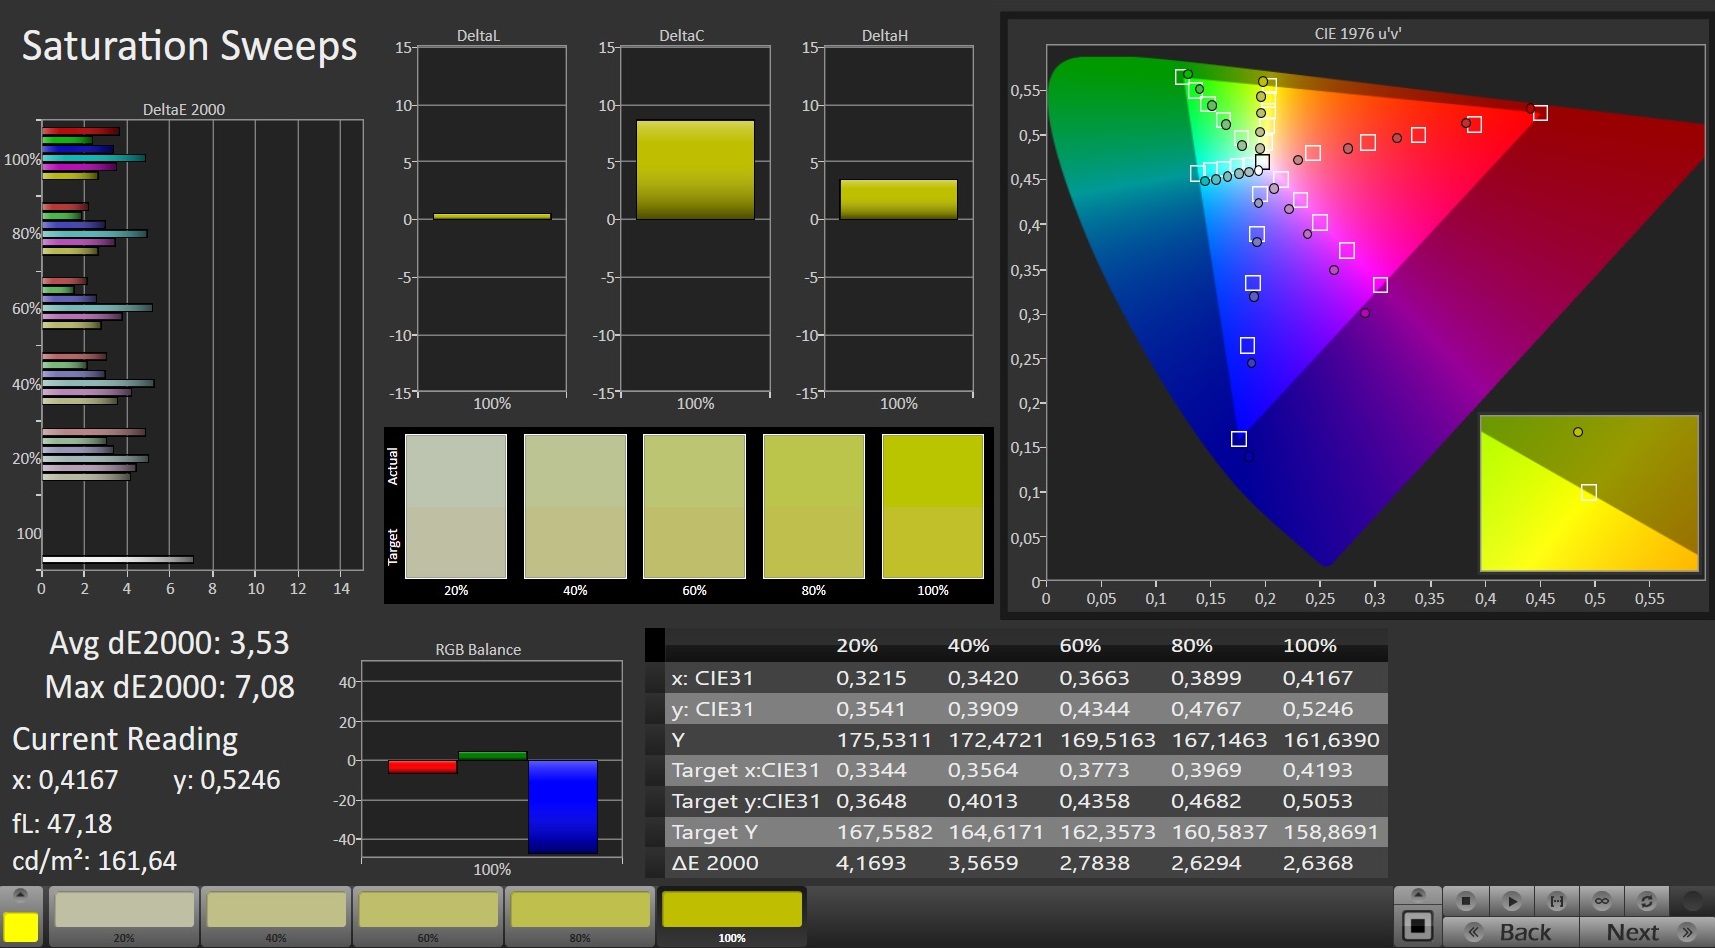
Fora da caixa, o display mostra uma reprodução de cores decente. Entretanto, com um desvio de cor de 4,3, o alvo (Delta E menor que 3) não é atingido. Além disso, o mostrador não sofre de uma coloração azul. A calibração reduz o desvio de cor para 2,29 e proporciona uma representação mais equilibrada das escalas de cinza. Os espaços de cor AdobeRGB (66%) e sRGB (92%) não são completamente reproduzidos

Exibir tempos de resposta
| ↔ Tempo de resposta preto para branco | ||
|---|---|---|
| 10 ms ... ascensão ↗ e queda ↘ combinadas | ↗ 5.2 ms ascensão | 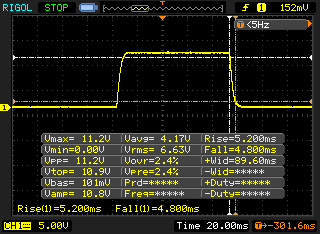 |
| ↘ 4.8 ms queda | ||
| A tela mostra boas taxas de resposta em nossos testes, mas pode ser muito lenta para jogadores competitivos. Em comparação, todos os dispositivos testados variam de 0.1 (mínimo) a 240 (máximo) ms. » 27 % de todos os dispositivos são melhores. Isso significa que o tempo de resposta medido é melhor que a média de todos os dispositivos testados (19.8 ms). | ||
| ↔ Tempo de resposta 50% cinza a 80% cinza | ||
| 17.6 ms ... ascensão ↗ e queda ↘ combinadas | ↗ 8.4 ms ascensão | 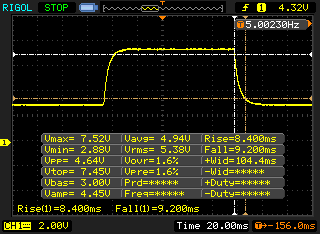 |
| ↘ 9.2 ms queda | ||
| A tela mostra boas taxas de resposta em nossos testes, mas pode ser muito lenta para jogadores competitivos. Em comparação, todos os dispositivos testados variam de 0.165 (mínimo) a 636 (máximo) ms. » 32 % de todos os dispositivos são melhores. Isso significa que o tempo de resposta medido é melhor que a média de todos os dispositivos testados (31 ms). | ||
Cintilação da tela / PWM (modulação por largura de pulso)
| Tela tremeluzindo/PWM detectado | 1000 Hz | ≤ 99 % configuração de brilho | 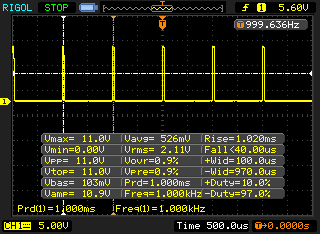 |
A luz de fundo da tela pisca em 1000 Hz (pior caso, por exemplo, utilizando PWM) Cintilação detectada em uma configuração de brilho de 99 % e abaixo. Não deve haver cintilação ou PWM acima desta configuração de brilho. A frequência de 1000 Hz é bastante alta, então a maioria dos usuários sensíveis ao PWM não deve notar nenhuma oscilação. [pwm_comparison] Em comparação: 52 % de todos os dispositivos testados não usam PWM para escurecer a tela. Se PWM foi detectado, uma média de 7757 (mínimo: 5 - máximo: 343500) Hz foi medida. | |||
O painel IPS estável em ângulo de visão pode ser lido a partir de qualquer posição. Ao ar livre, a leitura do visor é possível sob céu nublado ou na sombra
Desempenho - Suficiente para todas as áreas de aplicação
O laptop para jogos da Schenker de 17,3 polegadas traz cada jogo moderno suavemente para a tela e também corta uma bela figura em todas as outras áreas de aplicação. Nosso dispositivo de teste custa cerca de 1.500 Euros (~$1.828). O laptop pode ser personalizado na loja online da Schenker
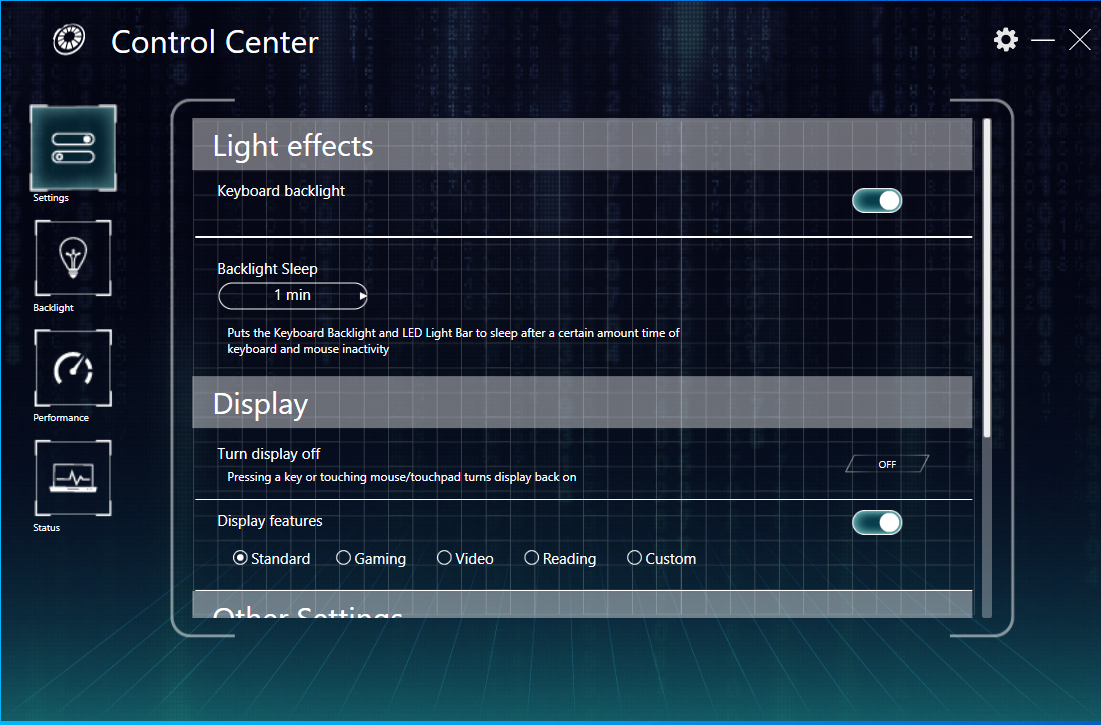
Condições de teste
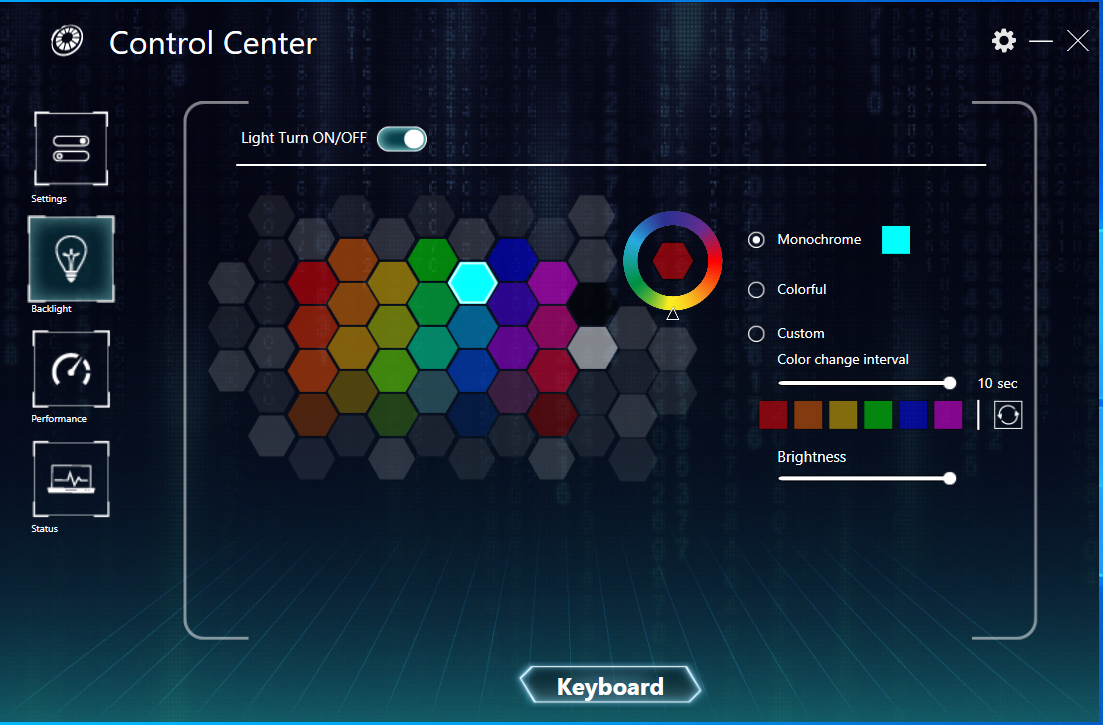
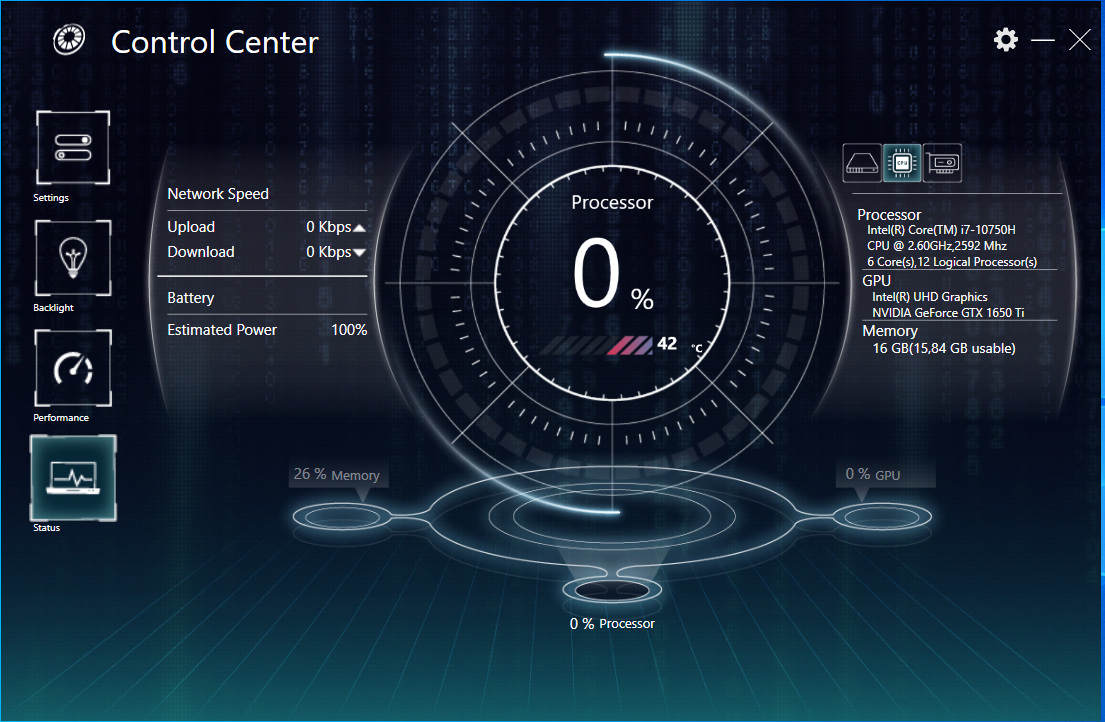
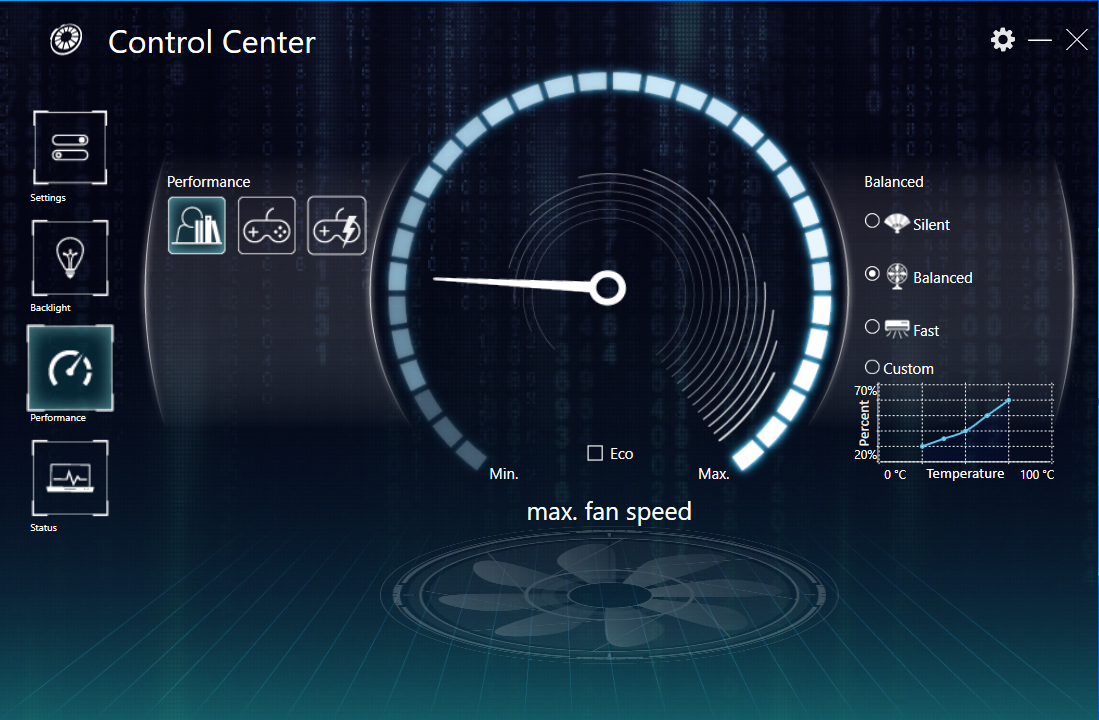
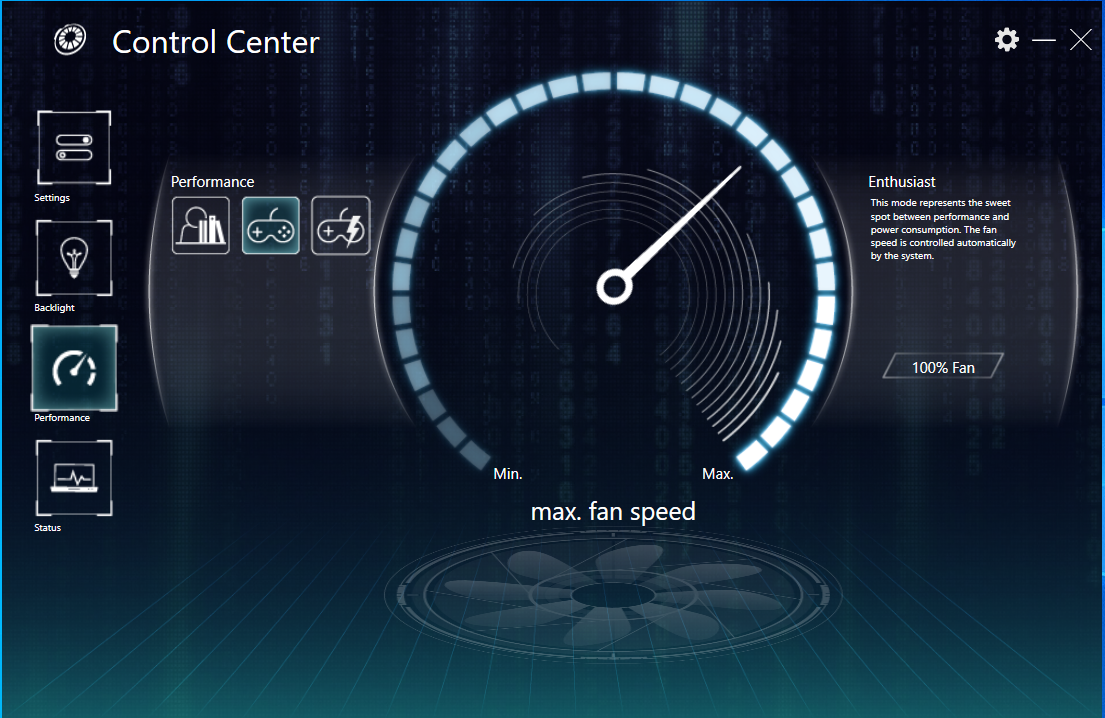
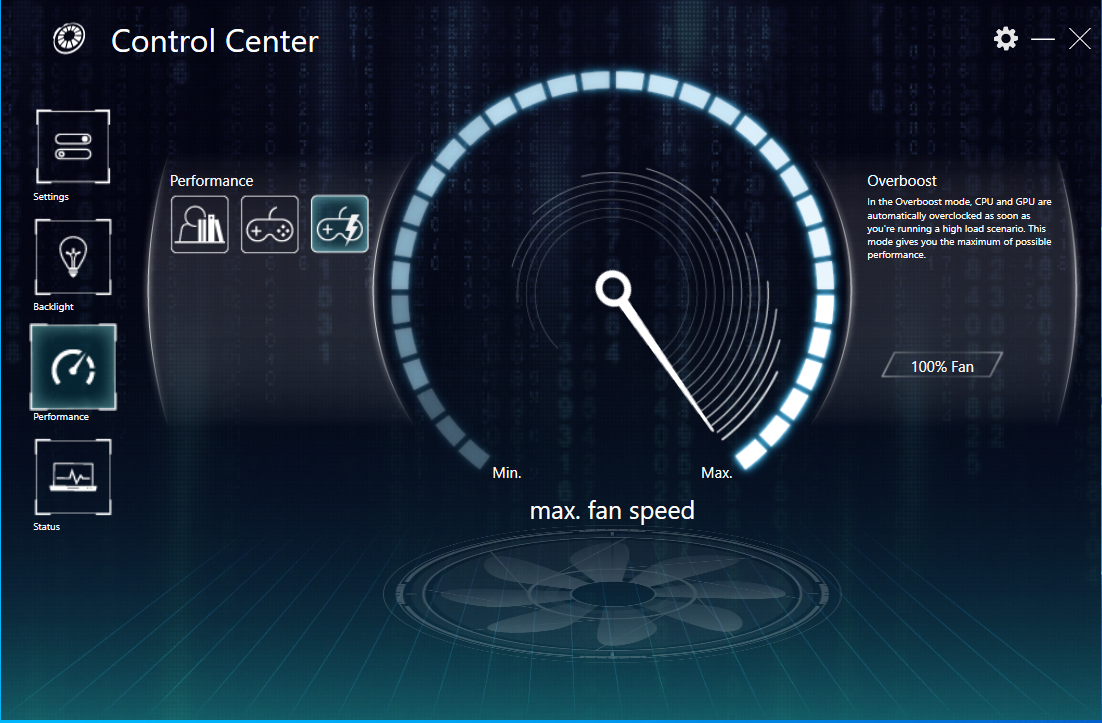
O Centro de Controle pré-instalado permite selecionar um perfil de desempenho ("Balanced", "Enthusiast", "Overboost"). Realizamos nosso teste sob o perfil "Enthusiast" e utilizando o controle automático do ventilador. Também executamos alguns benchmarks com os perfis "Overboost" e "Balanced" habilitados, respectivamente. Os resultados podem ser encontrados nos gráficos de comparação
Processador
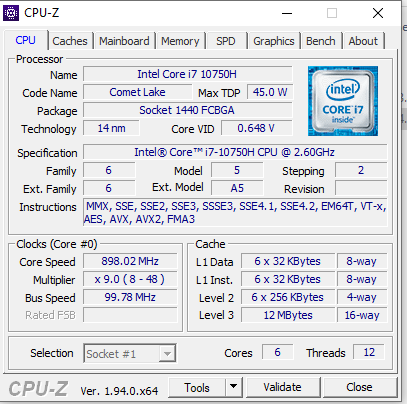
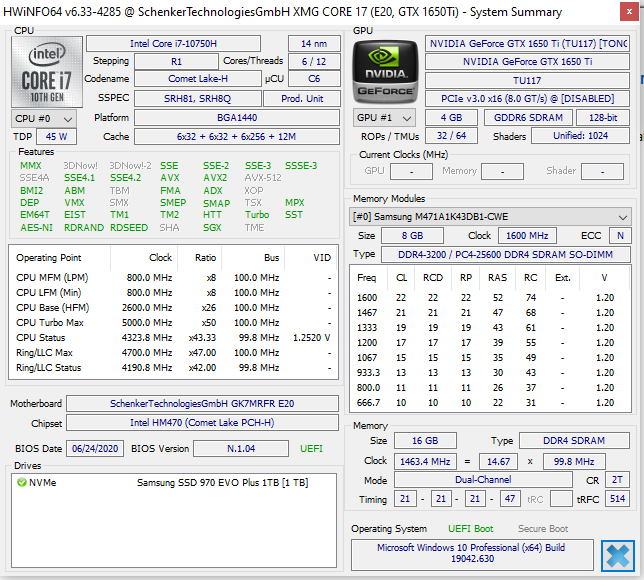
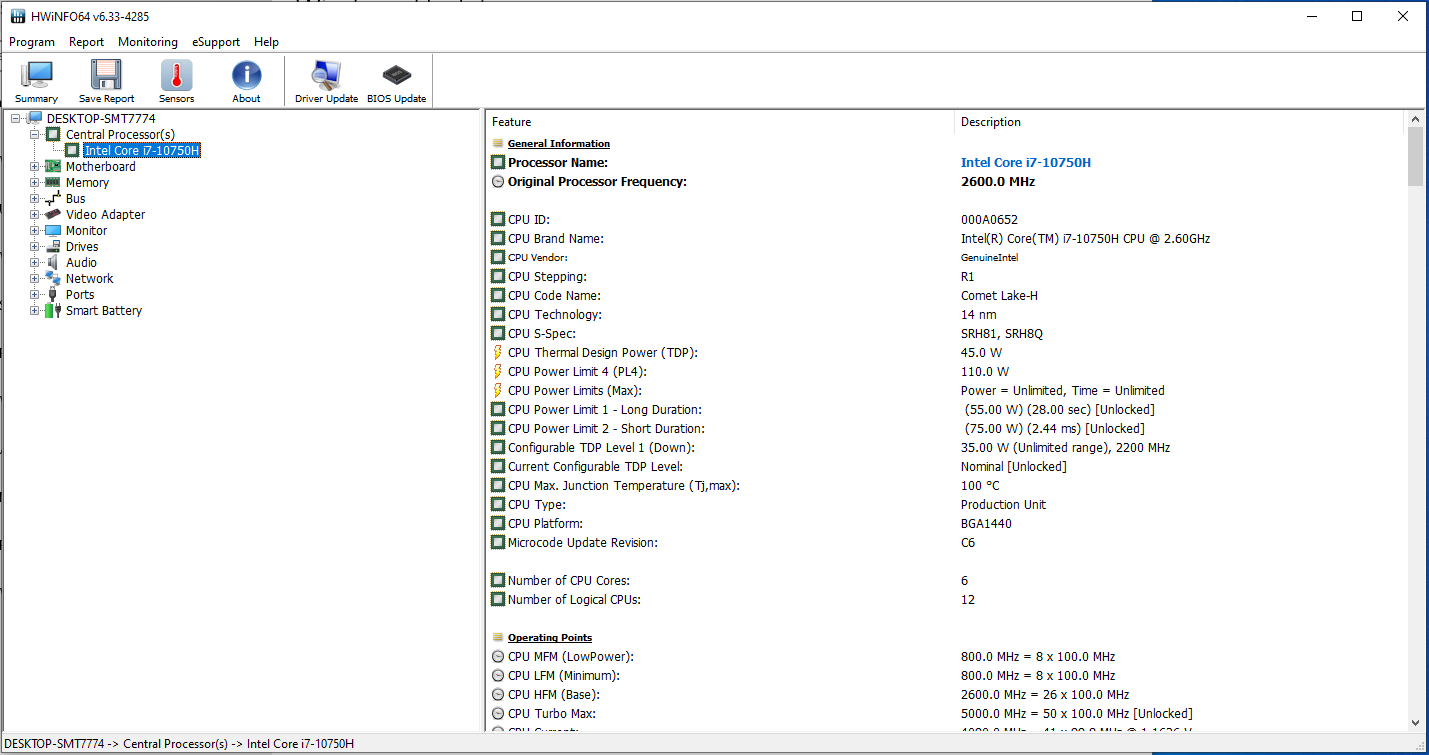
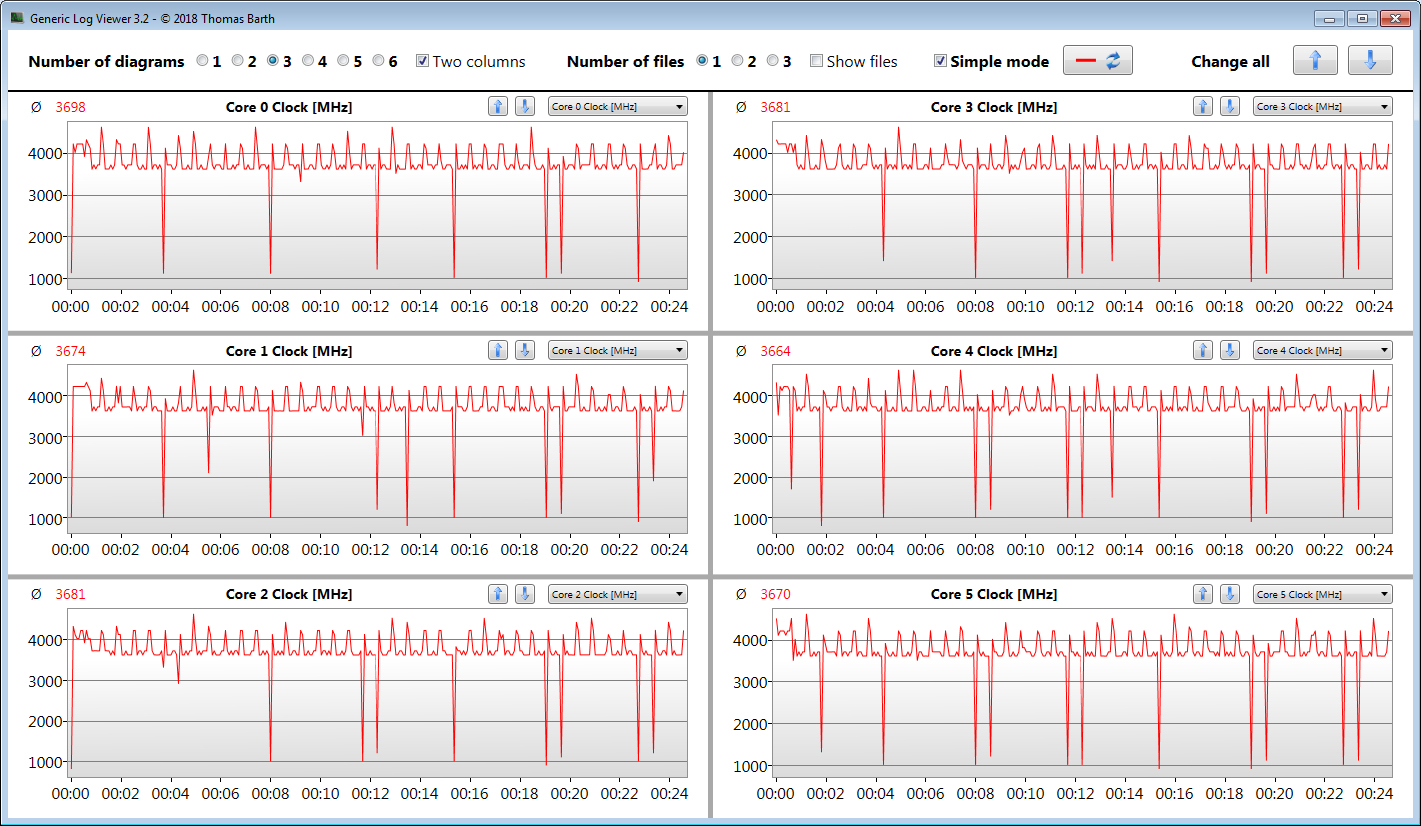
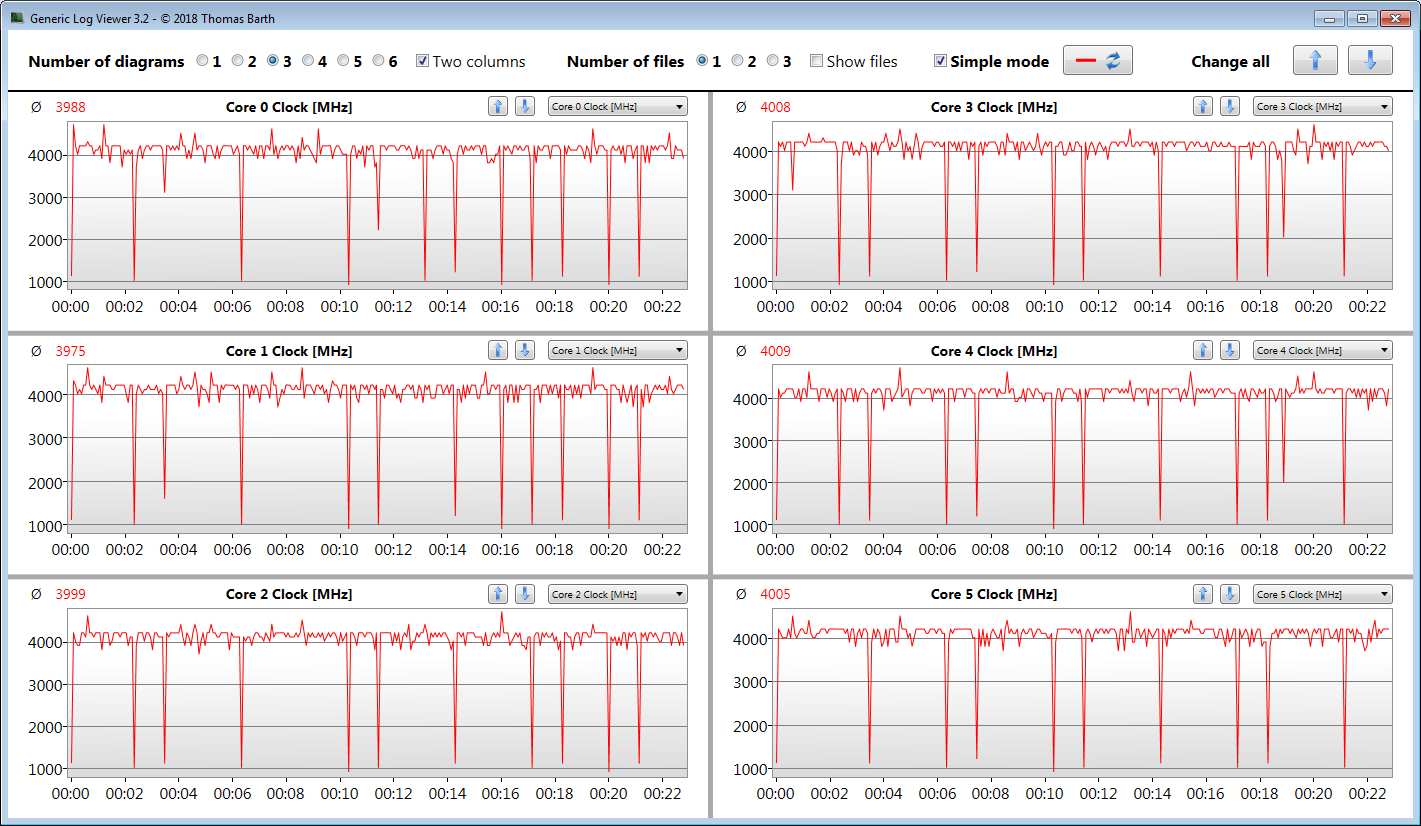
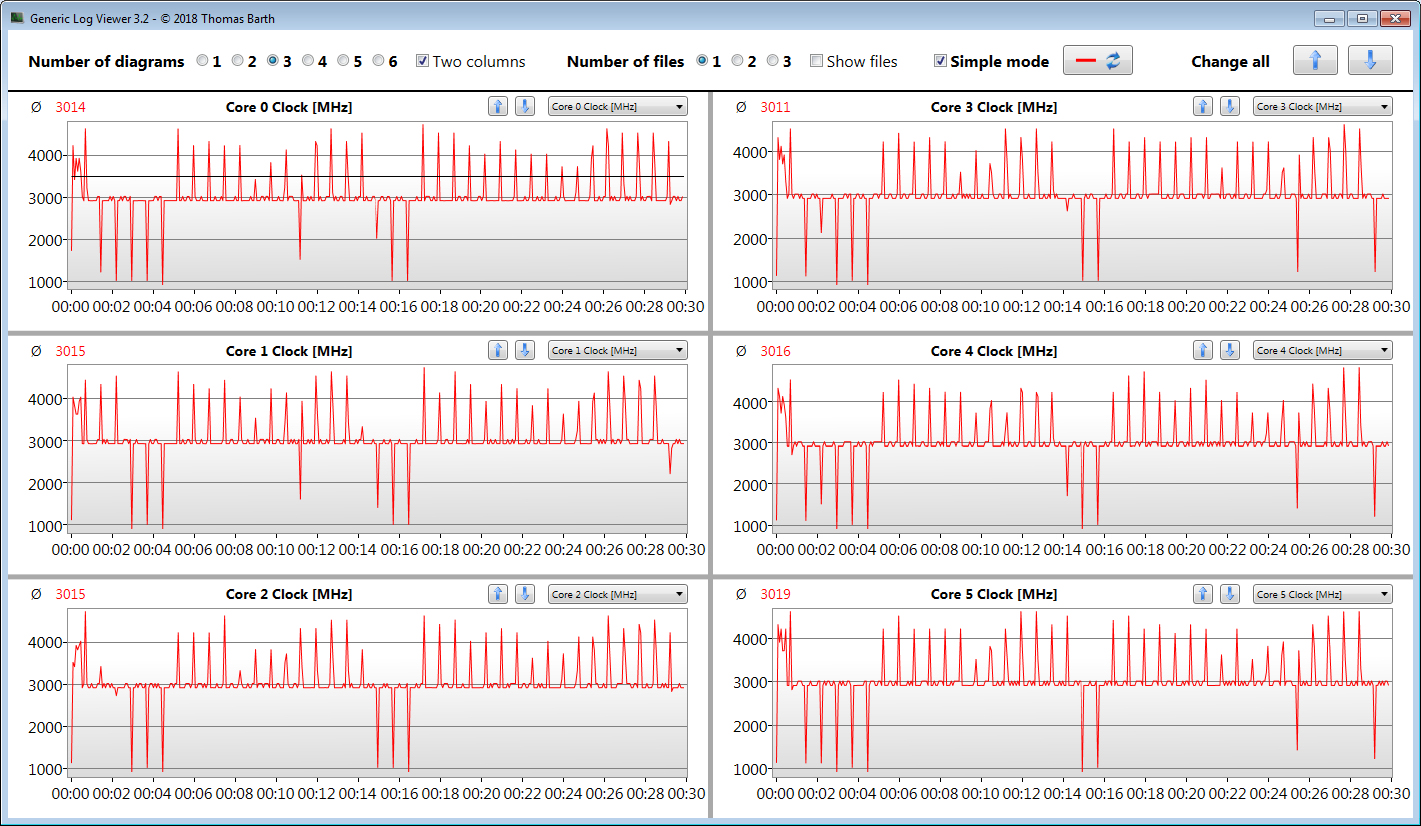
ONúcleo i7-10750H processador hexa-core (Comet Lake) opera a uma velocidade de base de 2,6 GHz. Através do Turbo, a velocidade do relógio pode ser aumentada para 4,3 GHz (seis núcleos) e até 5 GHz (um núcleo). O Hyper-Threading (dois fios por núcleo) é suportado.
O processador executa os testes de CPU do benchmark Cinebench R15 em 3,7 a 4,3 GHz (multithread) e 4,2 a 5 GHz (single-thread). Na potência da bateria, as taxas de relógio são de 3 a 3,3 GHz (multifios) e 2,5 a 3,9 GHz (mono-fios), respectivamente.
Verificamos se a CPU Turbo é utilizada de forma consistente quando conectada, executando o teste multithread do benchmark Cinebench R15 em um loop contínuo por pelo menos 30 minutos. O Turbo é usado. Além disso, a habilitação do perfil "Overboost" causa um aumento nas velocidades do Turbo.
| Cinebench R15 | |
| CPU Single 64Bit | |
| Média da turma Gaming (188.8 - 350, n=106, últimos 2 anos) | |
| Schenker XMG Core 17 Comet Lake | |
| Nexoc GH7 716IG | |
| MSI GF75 Thin 10SDR | |
| Média Intel Core i7-10750H (184 - 213, n=45) | |
| Acer Predator Helios 300 PH317-54-75G8 | |
| Schenker XMG Core 17 | |
| Lenovo Legion 5 17IMH05 | |
| CPU Multi 64Bit | |
| Média da turma Gaming (1578 - 6330, n=105, últimos 2 anos) | |
| Nexoc GH7 716IG | |
| Acer Predator Helios 300 PH317-54-75G8 | |
| Schenker XMG Core 17 Comet Lake (Overboost) | |
| Schenker XMG Core 17 Comet Lake | |
| Média Intel Core i7-10750H (804 - 1418, n=50) | |
| MSI GF75 Thin 10SDR | |
| Schenker XMG Core 17 Comet Lake (Balanced) | |
| Schenker XMG Core 17 | |
| Lenovo Legion 5 17IMH05 | |
| Blender - v2.79 BMW27 CPU | |
| Lenovo Legion 5 17IMH05 | |
| Schenker XMG Core 17 Comet Lake (Balanced) | |
| Média Intel Core i7-10750H (322 - 587, n=43) | |
| MSI GF75 Thin 10SDR | |
| Schenker XMG Core 17 Comet Lake | |
| Acer Predator Helios 300 PH317-54-75G8 | |
| Schenker XMG Core 17 Comet Lake (Overboost) | |
| Média da turma Gaming (79 - 330, n=104, últimos 2 anos) | |
| 7-Zip 18.03 | |
| 7z b 4 -mmt1 | |
| Média da turma Gaming (4199 - 7436, n=105, últimos 2 anos) | |
| Schenker XMG Core 17 Comet Lake (Overboost) | |
| Schenker XMG Core 17 Comet Lake | |
| Schenker XMG Core 17 Comet Lake (Balanced) | |
| Acer Predator Helios 300 PH317-54-75G8 | |
| Média Intel Core i7-10750H (4504 - 5470, n=43) | |
| MSI GF75 Thin 10SDR | |
| Lenovo Legion 5 17IMH05 | |
| 7z b 4 | |
| Média da turma Gaming (33491 - 148086, n=105, últimos 2 anos) | |
| Schenker XMG Core 17 Comet Lake (Overboost) | |
| Schenker XMG Core 17 Comet Lake | |
| Média Intel Core i7-10750H (26040 - 37345, n=43) | |
| MSI GF75 Thin 10SDR | |
| Acer Predator Helios 300 PH317-54-75G8 | |
| Schenker XMG Core 17 Comet Lake (Balanced) | |
| Lenovo Legion 5 17IMH05 | |
| Cinebench R20 | |
| CPU (Single Core) | |
| Média da turma Gaming (442 - 913, n=106, últimos 2 anos) | |
| Schenker XMG Core 17 Comet Lake (Overboost) | |
| Schenker XMG Core 17 Comet Lake | |
| Schenker XMG Core 17 Comet Lake (Balanced) | |
| Média Intel Core i7-10750H (431 - 504, n=43) | |
| MSI GF75 Thin 10SDR | |
| Acer Predator Helios 300 PH317-54-75G8 | |
| Schenker XMG Core 17 | |
| Lenovo Legion 5 17IMH05 | |
| CPU (Multi Core) | |
| Média da turma Gaming (4029 - 16433, n=106, últimos 2 anos) | |
| Schenker XMG Core 17 Comet Lake (Overboost) | |
| Acer Predator Helios 300 PH317-54-75G8 | |
| Schenker XMG Core 17 Comet Lake | |
| Média Intel Core i7-10750H (1749 - 3325, n=43) | |
| MSI GF75 Thin 10SDR | |
| Schenker XMG Core 17 | |
| Schenker XMG Core 17 Comet Lake (Balanced) | |
| Lenovo Legion 5 17IMH05 | |
| Geekbench 5.5 | |
| Single-Core | |
| Média da turma Gaming (986 - 2474, n=105, últimos 2 anos) | |
| Schenker XMG Core 17 Comet Lake | |
| Schenker XMG Core 17 Comet Lake (Overboost) | |
| Nexoc GH7 716IG | |
| MSI GF75 Thin 10SDR | |
| Schenker XMG Core 17 Comet Lake (Balanced) | |
| Média Intel Core i7-10750H (1114 - 1333, n=43) | |
| Acer Predator Helios 300 PH317-54-75G8 | |
| Lenovo Legion 5 17IMH05 | |
| Multi-Core | |
| Média da turma Gaming (6460 - 28263, n=105, últimos 2 anos) | |
| Schenker XMG Core 17 Comet Lake (Overboost) | |
| Nexoc GH7 716IG | |
| Schenker XMG Core 17 Comet Lake | |
| MSI GF75 Thin 10SDR | |
| Acer Predator Helios 300 PH317-54-75G8 | |
| Média Intel Core i7-10750H (4443 - 6674, n=43) | |
| Schenker XMG Core 17 Comet Lake (Balanced) | |
| Lenovo Legion 5 17IMH05 | |
| HWBOT x265 Benchmark v2.2 - 4k Preset | |
| Média da turma Gaming (11.5 - 44.4, n=105, últimos 2 anos) | |
| Schenker XMG Core 17 Comet Lake (Overboost) | |
| Acer Predator Helios 300 PH317-54-75G8 | |
| Schenker XMG Core 17 Comet Lake | |
| Média Intel Core i7-10750H (5.54 - 11.6, n=43) | |
| MSI GF75 Thin 10SDR | |
| Schenker XMG Core 17 Comet Lake (Balanced) | |
| Lenovo Legion 5 17IMH05 | |
| LibreOffice - 20 Documents To PDF | |
| Lenovo Legion 5 17IMH05 | |
| Acer Predator Helios 300 PH317-54-75G8 | |
| MSI GF75 Thin 10SDR | |
| Schenker XMG Core 17 Comet Lake | |
| Média Intel Core i7-10750H (43.1 - 99.2, n=43) | |
| Média da turma Gaming (33.2 - 88.8, n=105, últimos 2 anos) | |
| Nexoc GH7 716IG | |
| Schenker XMG Core 17 Comet Lake (Overboost) | |
| R Benchmark 2.5 - Overall mean | |
| Lenovo Legion 5 17IMH05 | |
| MSI GF75 Thin 10SDR | |
| Acer Predator Helios 300 PH317-54-75G8 | |
| Média Intel Core i7-10750H (0.578 - 0.708, n=42) | |
| Schenker XMG Core 17 Comet Lake (Balanced) | |
| Schenker XMG Core 17 Comet Lake (Overboost) | |
| Schenker XMG Core 17 Comet Lake | |
| Média da turma Gaming (0.3439 - 0.759, n=106, últimos 2 anos) | |
* ... menor é melhor
Desempenho do sistema
O sistema funciona bem e sem problemas. O laptop oferece poder de computação suficiente para todas as áreas de aplicação comuns - jogos, edição de vídeo, processamento de imagens, tarefas de escritório e uso da Internet não representam nenhum problema para o hardware. Isto é complementado por bons resultados nos benchmarks da PCMark
| PCMark 8 Home Score Accelerated v2 | 4136 pontos | |
| PCMark 8 Creative Score Accelerated v2 | 5002 pontos | |
| PCMark 8 Work Score Accelerated v2 | 5610 pontos | |
| PCMark 10 Score | 5185 pontos | |
Ajuda | ||
Latências DPC
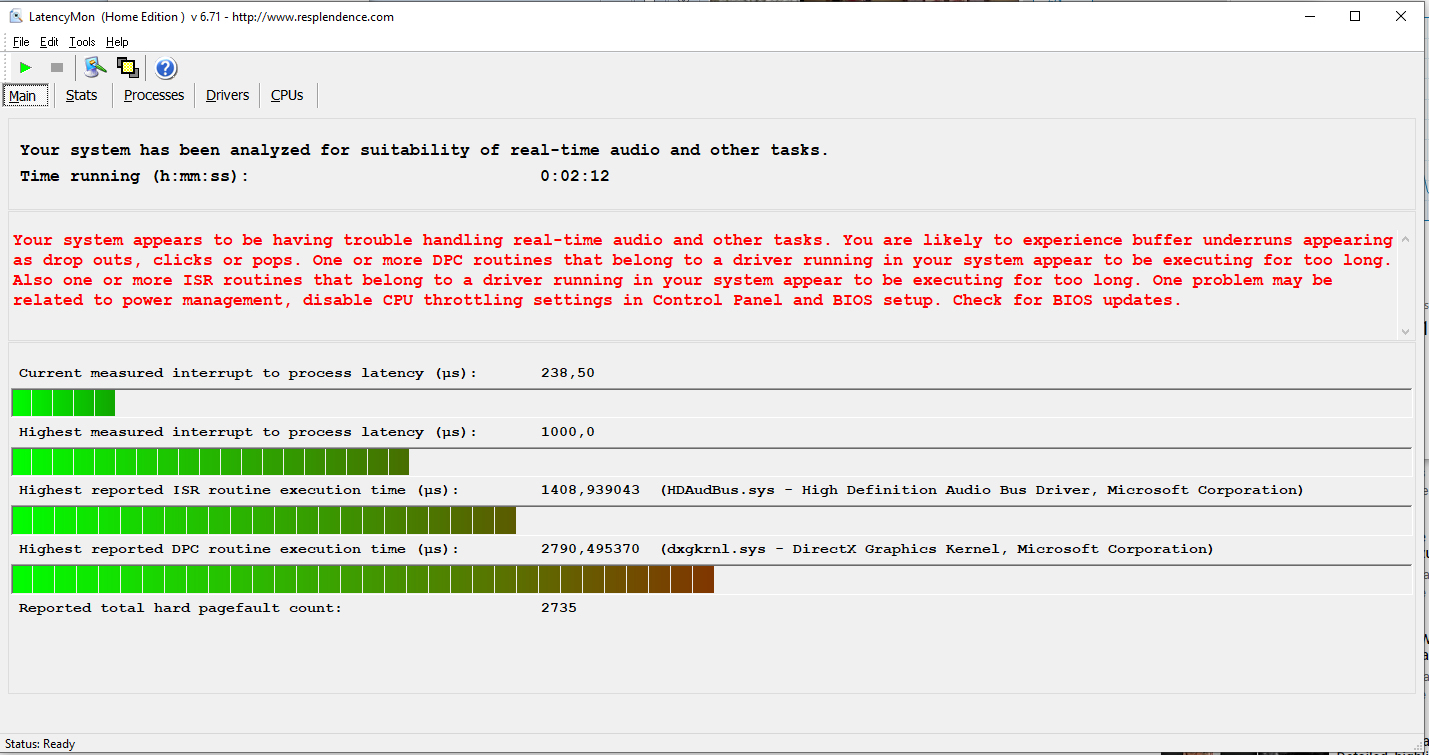
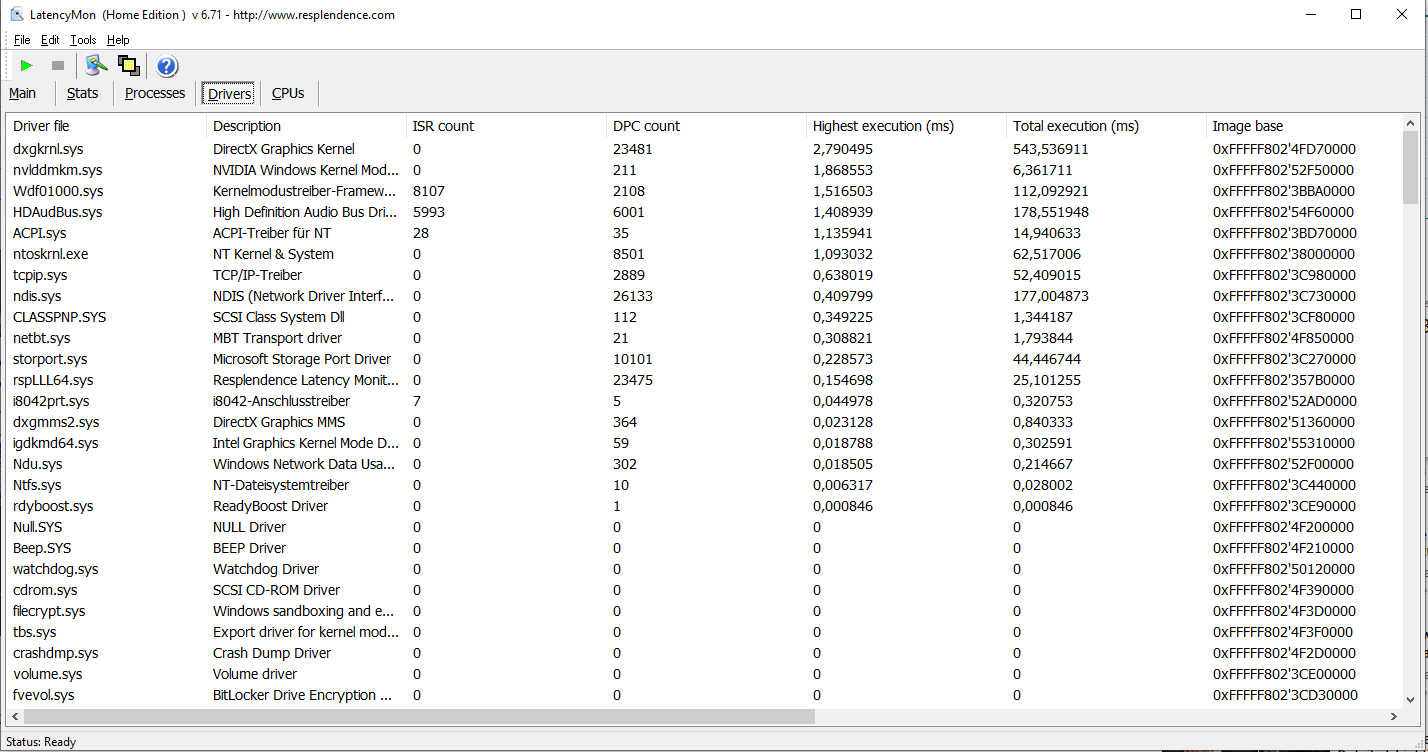
| DPC Latencies / LatencyMon - interrupt to process latency (max), Web, Youtube, Prime95 | |
| Lenovo Legion 5 17IMH05 | |
| MSI GF75 Thin 10SDR | |
| Schenker XMG Core 17 Comet Lake | |
| Nexoc GH7 716IG | |
| Acer Predator Helios 300 PH317-54-75G8 | |
* ... menor é melhor
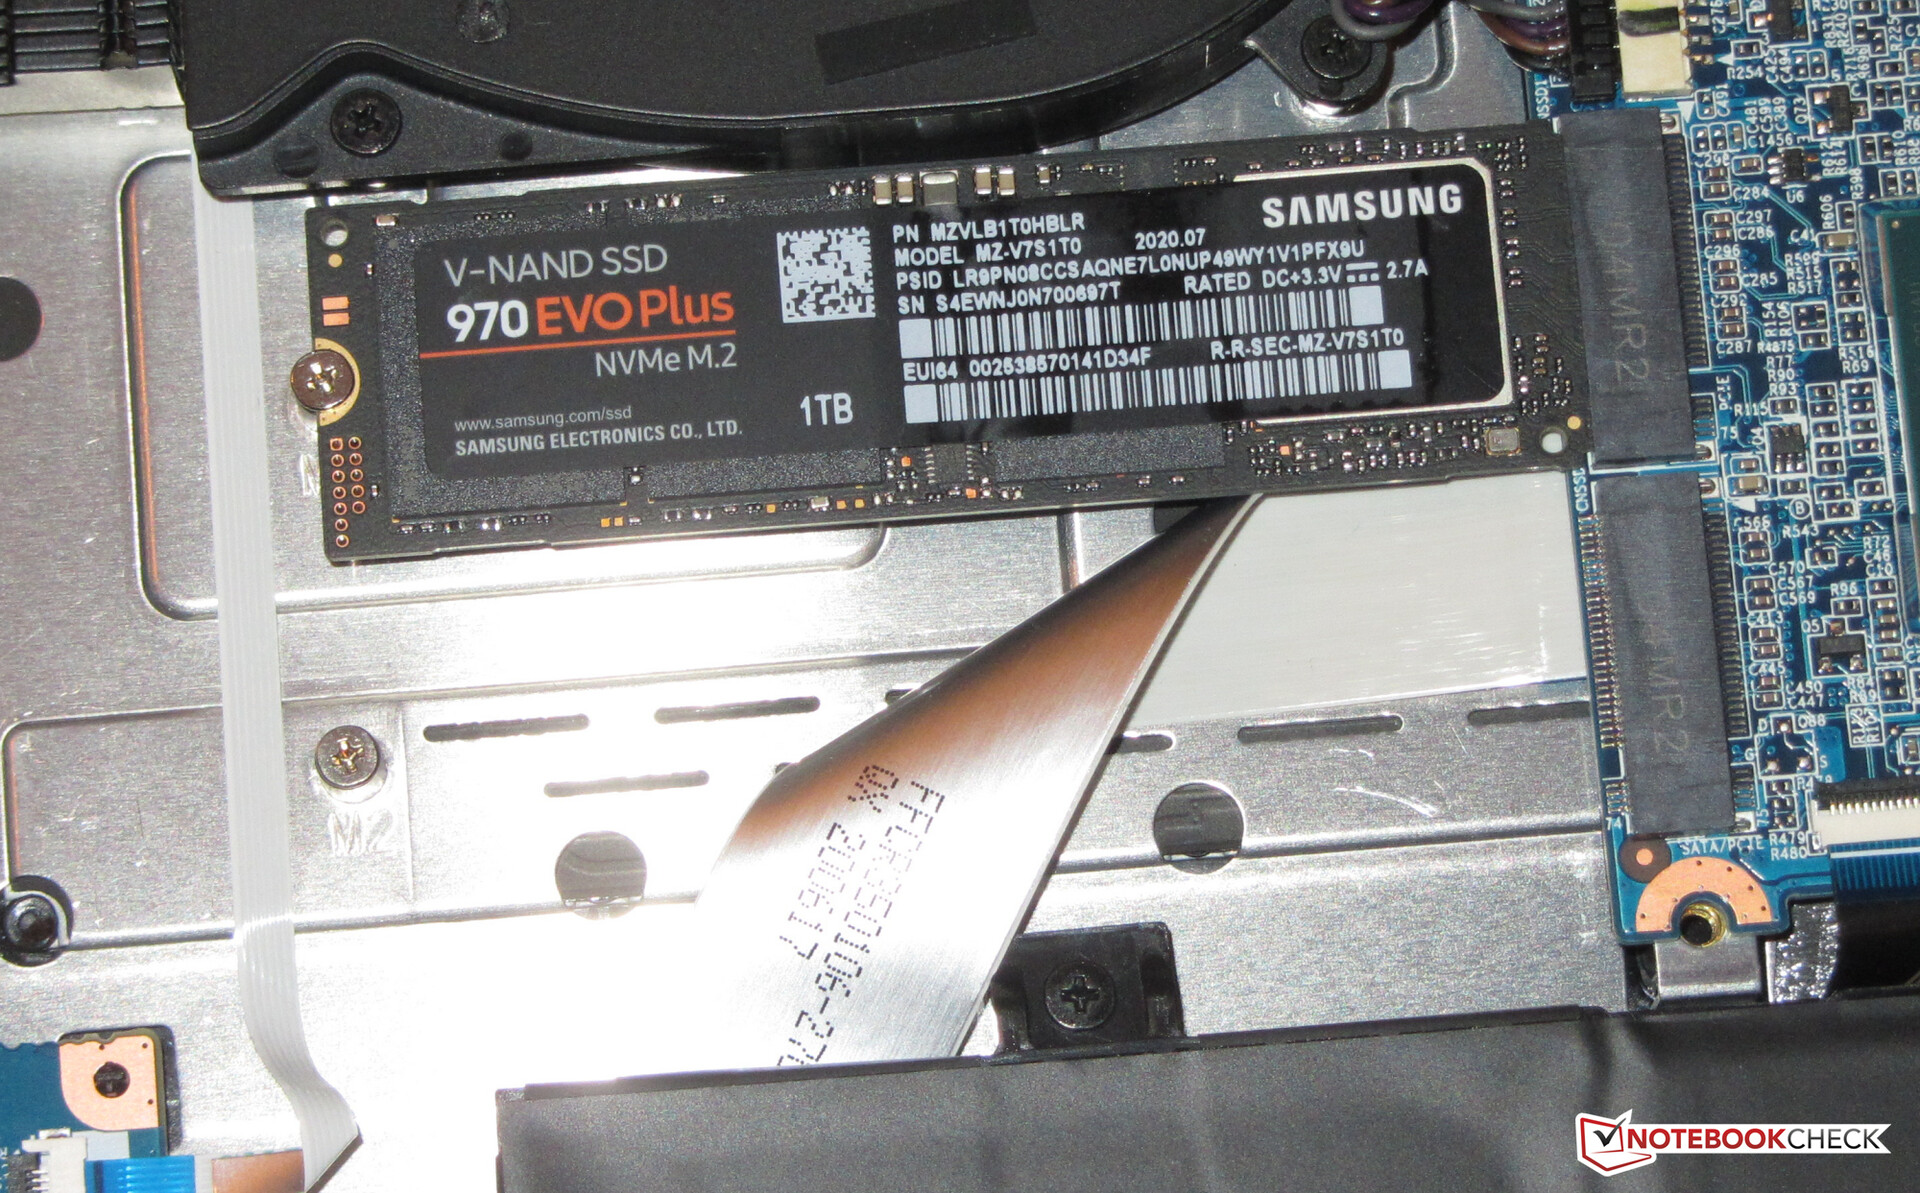
Armazenamento
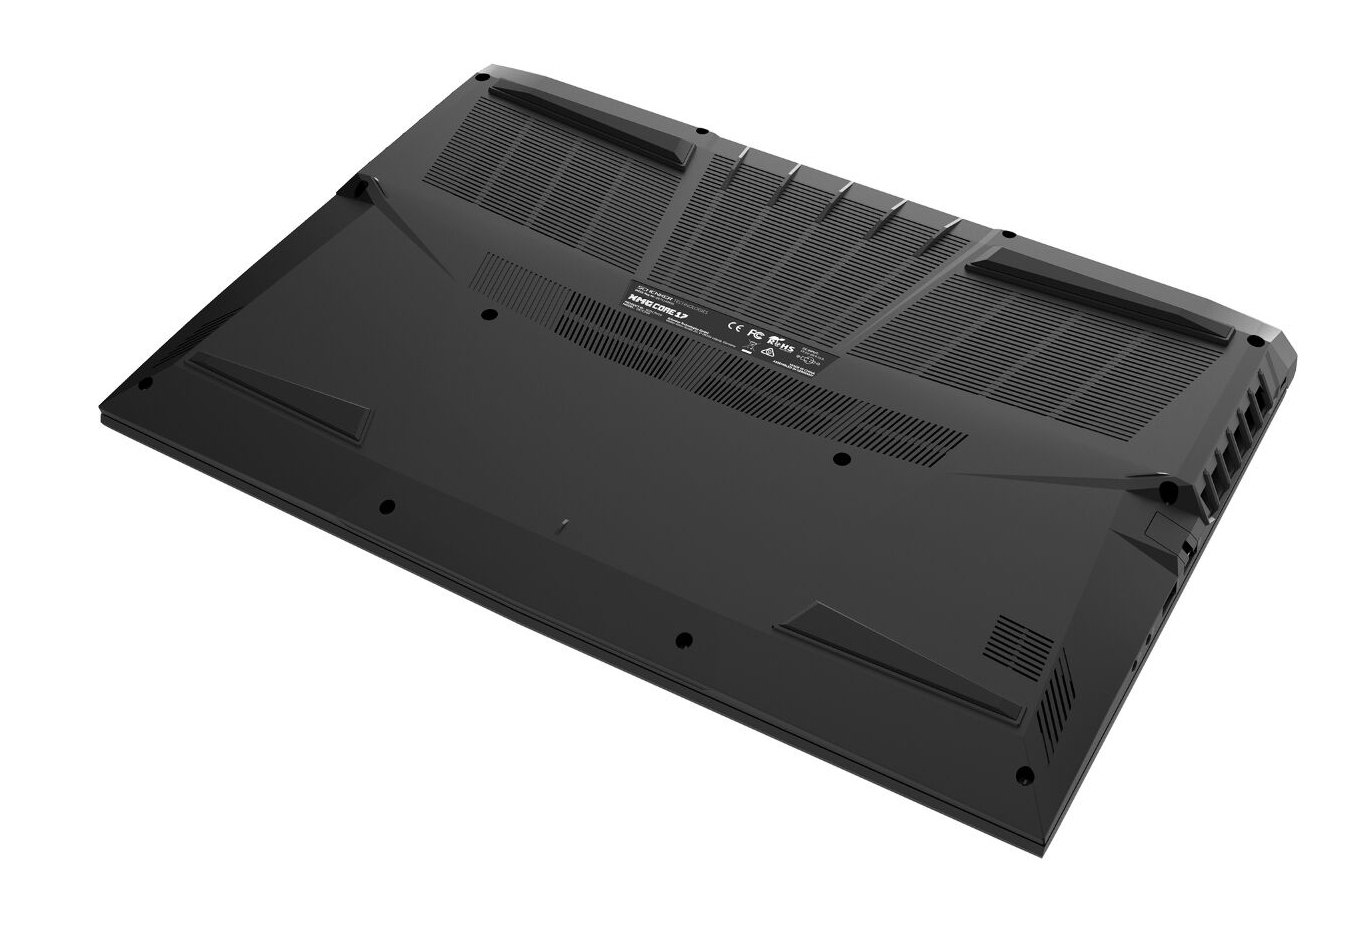
Um SSD NVMe (M.2 2280) da Samsung serve como acionamento do sistema. Ele fornece 1 TB de espaço de armazenamento e oferece taxas de transferência muito boas. No total, o laptop pode acomodar dois M.2 2280 SSDs (1x NVMe, 1x NVMe/SATA; RAID 0/1).
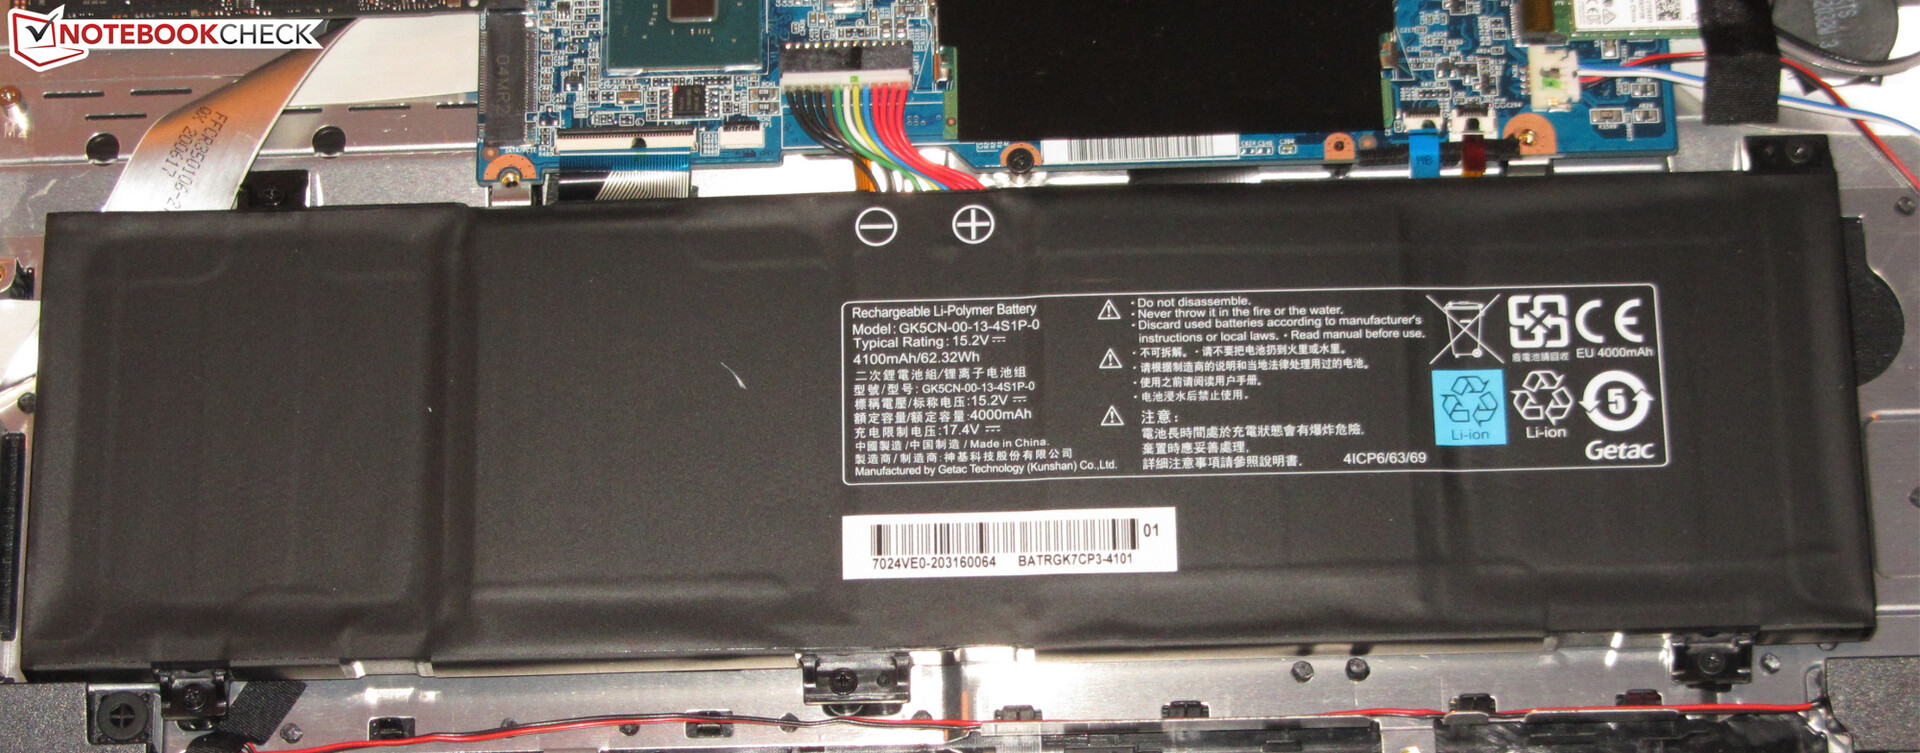
O laptop ainda teria espaço para um meio de armazenamento de 2,5 polegadas. Como nosso dispositivo de teste está equipado com a maior das duas baterias disponíveis (46 Wh, 62 Wh), a bateria ocupa o espaço designado para o dispositivo de armazenamento.

| Schenker XMG Core 17 Comet Lake Samsung SSD 970 EVO Plus 1TB | Lenovo Legion 5 17IMH05 SK hynix BC511 HFM512GDHTNI-87A0B | Acer Predator Helios 300 PH317-54-75G8 WDC PC SN730 SDBQNTY-1T00 | MSI GF75 Thin 10SDR Samsung PM991 MZVLQ512HALU | Nexoc GH7 716IG Samsung SSD 970 EVO Plus 500GB | Schenker XMG Core 17 Samsung SSD 970 EVO Plus 500GB | |
|---|---|---|---|---|---|---|
| CrystalDiskMark 5.2 / 6 | -36% | -15% | -34% | 4% | -31% | |
| Write 4K (MB/s) | 169.5 | 134.7 -21% | 141.9 -16% | 138.8 -18% | 201.6 19% | 99.3 -41% |
| Read 4K (MB/s) | 51.5 | 44.84 -13% | 48.75 -5% | 50.6 -2% | 54.8 6% | 38.47 -25% |
| Write Seq (MB/s) | 3009 | 1053 -65% | 2734 -9% | 1032 -66% | 2999 0% | 1449 -52% |
| Read Seq (MB/s) | 2959 | 1241 -58% | 1921 -35% | 1199 -59% | 3023 2% | 1237 -58% |
| Write 4K Q32T1 (MB/s) | 536 | 499.8 -7% | 422.6 -21% | 464.6 -13% | 545 2% | 364.4 -32% |
| Read 4K Q32T1 (MB/s) | 621 | 518 -17% | 509 -18% | 550 -11% | 636 2% | 421.9 -32% |
| Write Seq Q32T1 (MB/s) | 3339 | 1022 -69% | 3055 -9% | 1216 -64% | 3262 -2% | 3276 -2% |
| Read Seq Q32T1 (MB/s) | 3561 | 2263 -36% | 3257 -9% | 2275 -36% | 3550 0% | 3338 -6% |
| AS SSD | -50% | -18% | -69% | 1% | -34% | |
| Seq Read (MB/s) | 2937 | 1635 -44% | 2828 -4% | 1976 -33% | 3008 2% | 2283 -22% |
| Seq Write (MB/s) | 2858 | 913 -68% | 2677 -6% | 1057 -63% | 2521 -12% | 2779 -3% |
| 4K Read (MB/s) | 50.3 | 46.18 -8% | 39.94 -21% | 45.31 -10% | 64.3 28% | 29.99 -40% |
| 4K Write (MB/s) | 130.6 | 101.7 -22% | 100.9 -23% | 119.1 -9% | 142.5 9% | 99.1 -24% |
| 4K-64 Read (MB/s) | 1710 | 773 -55% | 1562 -9% | 817 -52% | 1664 -3% | 1156 -32% |
| 4K-64 Write (MB/s) | 2355 | 745 -68% | 1867 -21% | 672 -71% | 2447 4% | 2333 -1% |
| Access Time Read * (ms) | 0.037 | 0.05 -35% | 0.156 -322% | 0.047 -27% | 0.092 -149% | |
| Access Time Write * (ms) | 0.028 | 0.037 -32% | 0.037 -32% | 0.034 -21% | 0.026 7% | 0.037 -32% |
| Score Read (Points) | 2054 | 983 -52% | 1885 -8% | 1060 -48% | 2029 -1% | 1414 -31% |
| Score Write (Points) | 2771 | 938 -66% | 2236 -19% | 897 -68% | 2842 3% | 2710 -2% |
| Score Total (Points) | 5873 | 2399 -59% | 5076 -14% | 2464 -58% | 5893 0% | 4871 -17% |
| Copy ISO MB/s (MB/s) | 2225 | 573 -74% | 1870 -16% | 1394 -37% | ||
| Copy Program MB/s (MB/s) | 779 | 344.4 -56% | 545 -30% | 379.8 -51% | ||
| Copy Game MB/s (MB/s) | 1590 | 535 -66% | 1083 -32% | 976 -39% | ||
| Média Total (Programa/Configurações) | -43% /
-45% | -17% /
-17% | -52% /
-54% | 3% /
2% | -33% /
-33% |
* ... menor é melhor
Continuous load read: DiskSpd Read Loop, Queue Depth 8
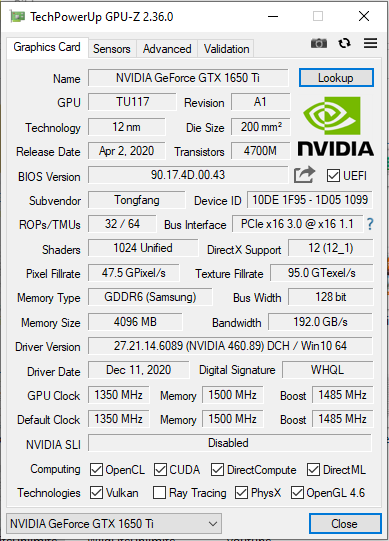
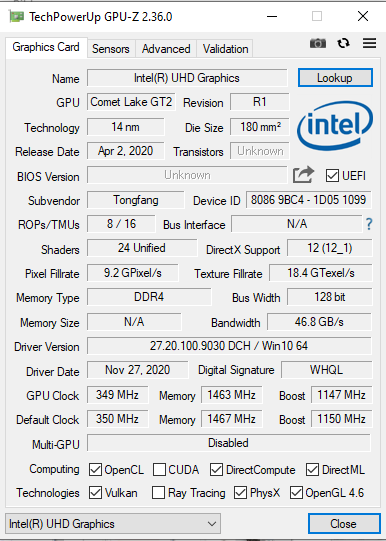
Placa gráfica
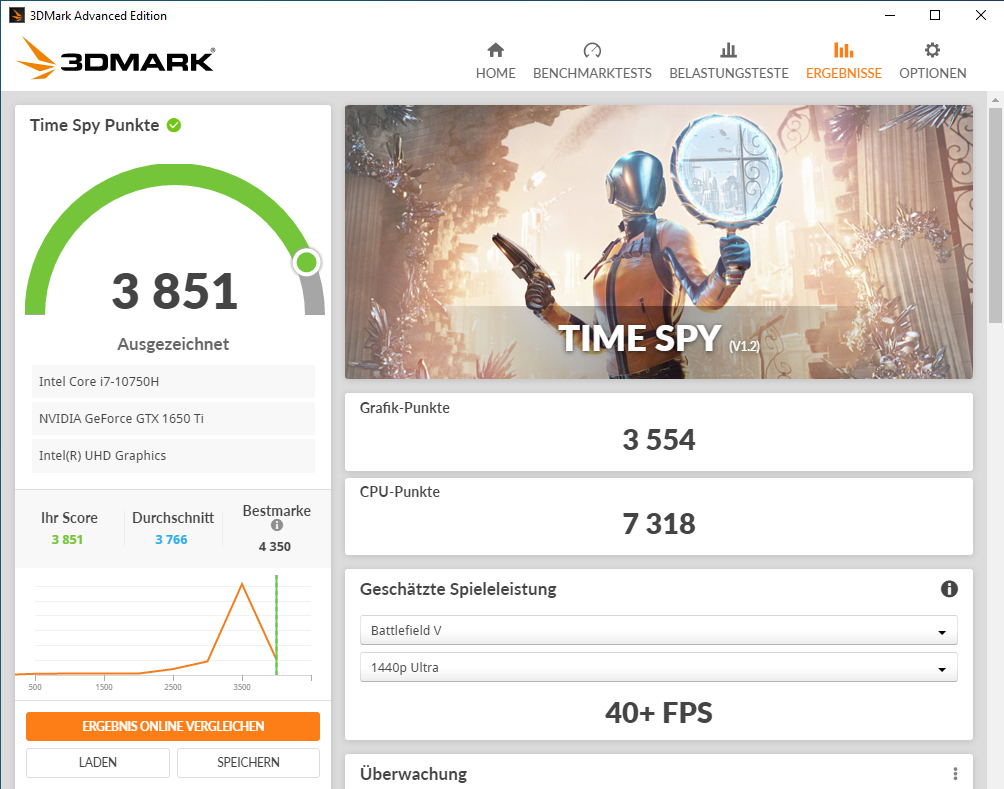
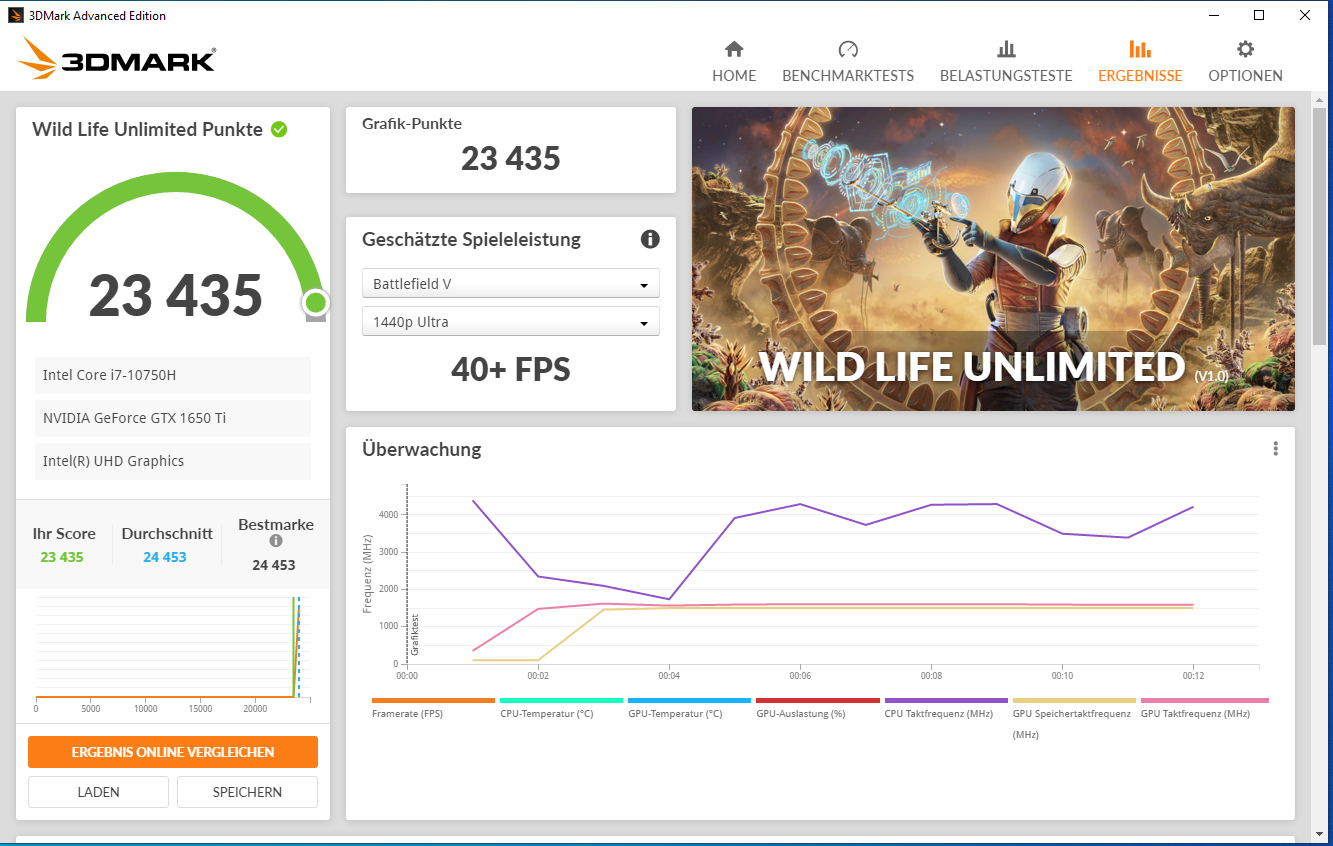
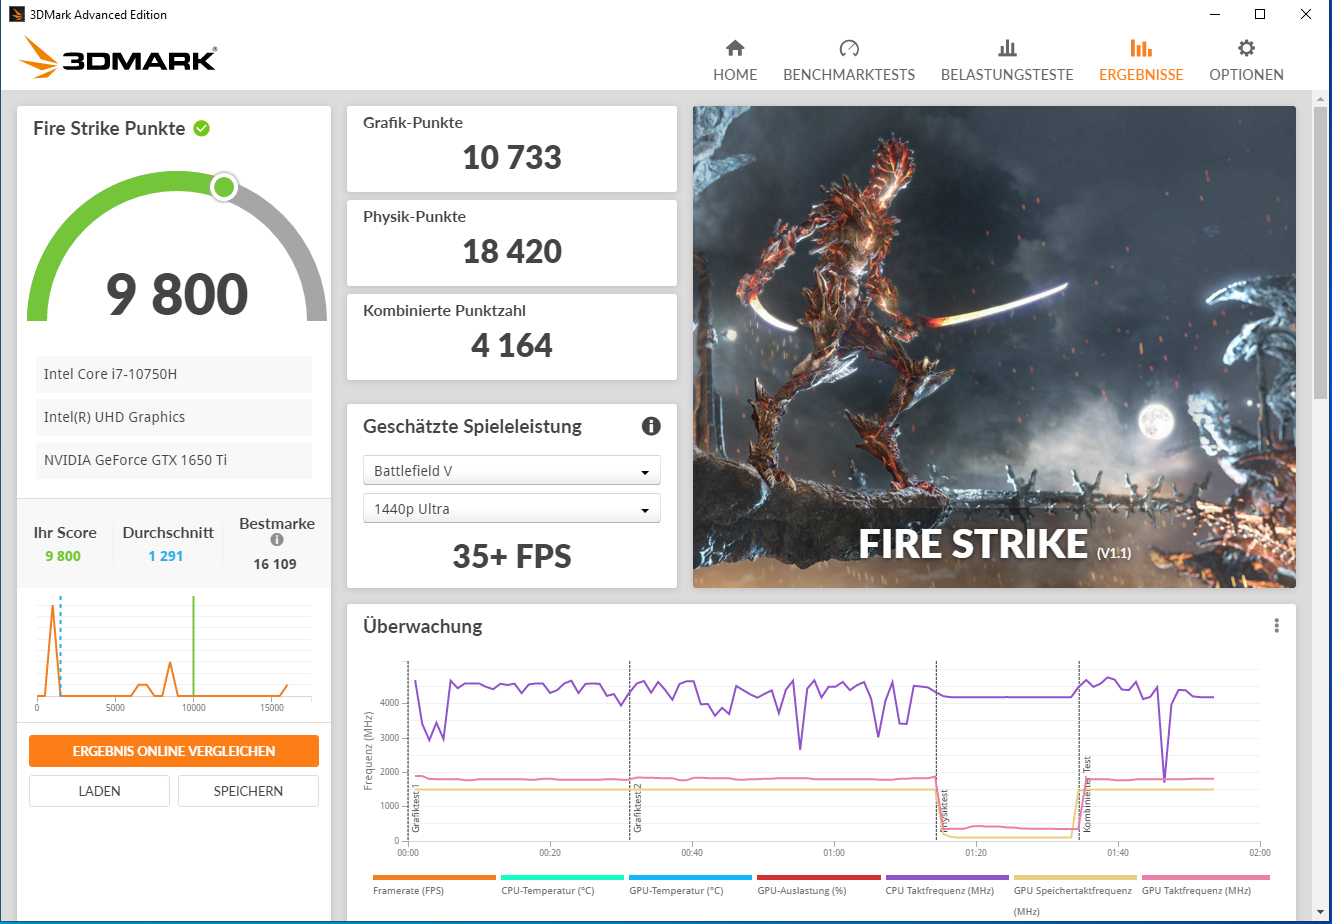
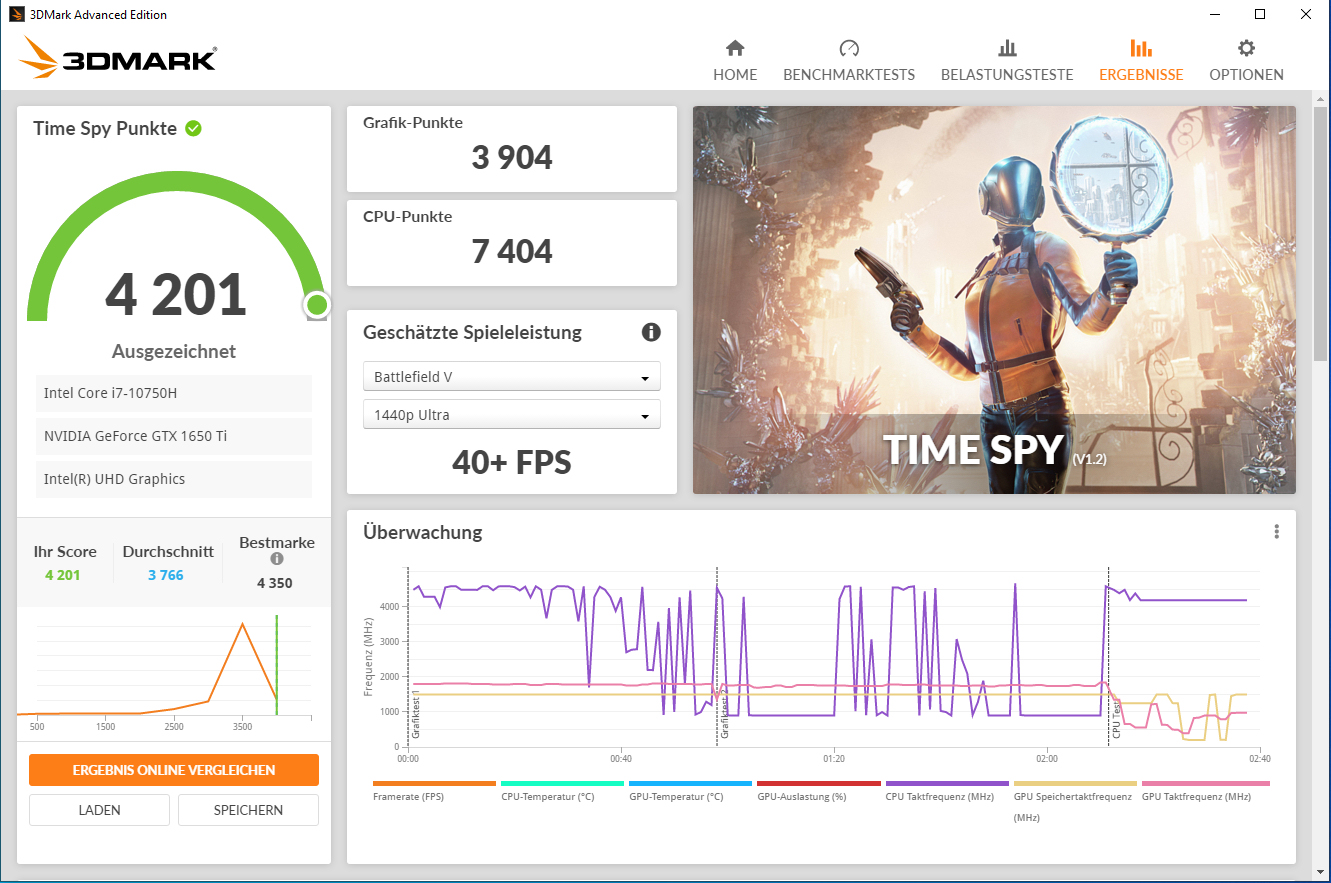
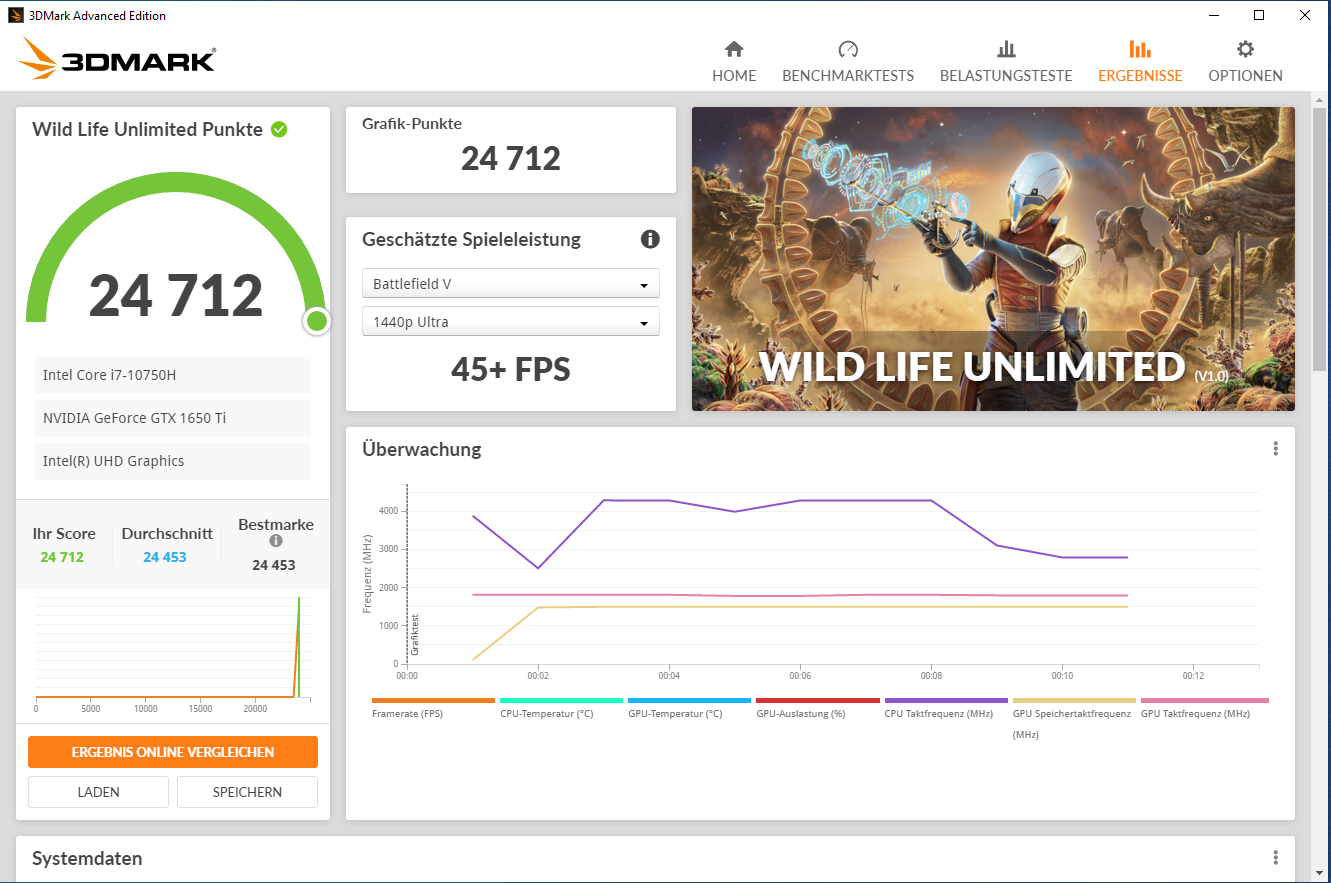
OGeForce GTX 1650 Ti núcleo gráfico (Turing) pertence à gama média superior da GPU. É suportado pela memória rápida GDDR6 (4.096 MB). Os resultados 3DMark estão em um nível normal para a GPU instalada aqui. O perfil "Overboost" causa um ligeiro aumento na performance gráfica. Além disso, oUHD Graphics 630 GPU integrada ao processador está ativa, e o laptop funciona com a solução de comutação gráfica Optimus da Nvidia
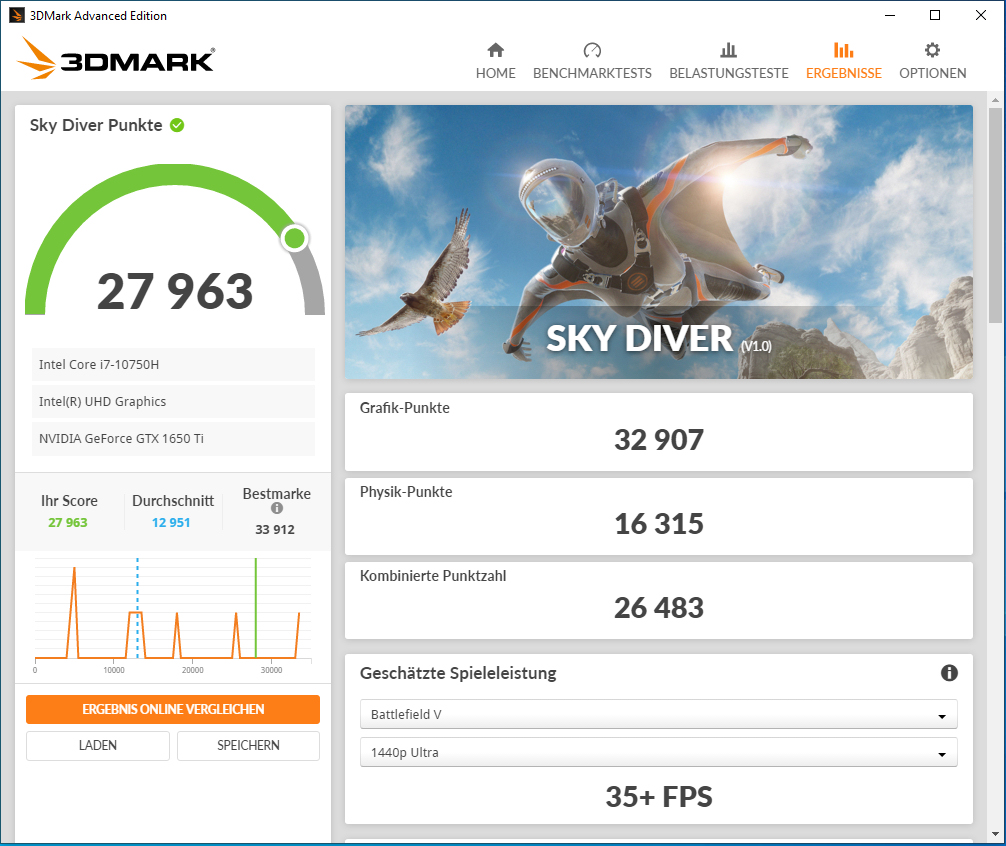

| 3DMark 11 Performance | 13280 pontos | |
| 3DMark Cloud Gate Standard Score | 33280 pontos | |
| 3DMark Fire Strike Score | 9057 pontos | |
| 3DMark Time Spy Score | 3851 pontos | |
Ajuda | ||
| 3DMark | |
| 1280x720 Cloud Gate Standard Graphics | |
| Média da turma Gaming (86886 - 223650, n=60, últimos 2 anos) | |
| Acer Predator Helios 300 PH317-54-75G8 | |
| Schenker XMG Core 17 | |
| Schenker XMG Core 17 Comet Lake | |
| Lenovo Legion 5 17IMH05 | |
| Média NVIDIA GeForce GTX 1650 Ti Mobile (34971 - 70377, n=7) | |
| 1920x1080 Fire Strike Graphics | |
| Média da turma Gaming (12242 - 62849, n=115, últimos 2 anos) | |
| Acer Predator Helios 300 PH317-54-75G8 | |
| MSI GF75 Thin 10SDR | |
| Schenker XMG Core 17 | |
| Schenker XMG Core 17 Comet Lake (Overboost) | |
| Média NVIDIA GeForce GTX 1650 Ti Mobile (9691 - 10733, n=9) | |
| Schenker XMG Core 17 Comet Lake | |
| Lenovo Legion 5 17IMH05 | |
| 2560x1440 Time Spy Graphics | |
| Média da turma Gaming (5012 - 26212, n=115, últimos 2 anos) | |
| Acer Predator Helios 300 PH317-54-75G8 | |
| MSI GF75 Thin 10SDR | |
| Schenker XMG Core 17 | |
| Schenker XMG Core 17 Comet Lake (Overboost) | |
| Média NVIDIA GeForce GTX 1650 Ti Mobile (3554 - 3904, n=9) | |
| Schenker XMG Core 17 Comet Lake | |
| Lenovo Legion 5 17IMH05 | |
Desempenho do jogo
O Core 17 traz todos os jogos em nosso banco de dados sem problemas para a tela. Resolução Full HD e configurações de média a alta qualidade geralmente podem ser selecionadas. Os títulos que têm apenas baixos requisitos de hardware permitem mais. Um sucesso atual como o Cyberpunk 2077 requer uma redução da resolução e/ou do nível de qualidade. O perfil "Overboost" não causa um aumento nas taxas de quadros
| The Witcher 3 - 1920x1080 Ultra Graphics & Postprocessing (HBAO+) | |
| Média da turma Gaming (104.7 - 240, n=7, últimos 2 anos) | |
| Acer Predator Helios 300 PH317-54-75G8 | |
| MSI GF75 Thin 10SDR | |
| Schenker XMG Core 17 | |
| Nexoc GH7 716IG | |
| Schenker XMG Core 17 Comet Lake | |
| Schenker XMG Core 17 Comet Lake (Overboost) | |
| Lenovo Legion 5 17IMH05 | |
| Média NVIDIA GeForce GTX 1650 Ti Mobile (34.7 - 42.3, n=8) | |
| Dota 2 Reborn - 1920x1080 ultra (3/3) best looking | |
| Média da turma Gaming (84.8 - 248, n=107, últimos 2 anos) | |
| Nexoc GH7 716IG | |
| MSI GF75 Thin 10SDR | |
| Schenker XMG Core 17 Comet Lake | |
| Schenker XMG Core 17 Comet Lake (Overboost) | |
| Média NVIDIA GeForce GTX 1650 Ti Mobile (87.1 - 120, n=8) | |
| Schenker XMG Core 17 Comet Lake (Balanced) | |
| X-Plane 11.11 - 1920x1080 high (fps_test=3) | |
| Média da turma Gaming (55.5 - 143.5, n=109, últimos 2 anos) | |
| Nexoc GH7 716IG | |
| MSI GF75 Thin 10SDR | |
| Schenker XMG Core 17 Comet Lake (Overboost) | |
| Schenker XMG Core 17 Comet Lake | |
| Schenker XMG Core 17 Comet Lake (Balanced) | |
| Média NVIDIA GeForce GTX 1650 Ti Mobile (59.1 - 75.9, n=8) | |
| Horizon Zero Dawn - 1920x1080 Ultimate Quality | |
| Acer Predator Helios 300 PH317-54-75G8 | |
| MSI GF75 Thin 10SDR | |
| Média NVIDIA GeForce GTX 1650 Ti Mobile (43 - 48, n=4) | |
| Schenker XMG Core 17 Comet Lake | |
| Schenker XMG Core 17 Comet Lake (Overboost) | |
| Watch Dogs Legion - 1920x1080 High Preset (DX12) | |
| Média NVIDIA GeForce GTX 1650 Ti Mobile (50 - 53.1, n=2) | |
| Schenker XMG Core 17 Comet Lake | |
| Immortals Fenyx Rising - 1920x1080 High Preset | |
| Média NVIDIA GeForce GTX 1650 Ti Mobile (38 - 46, n=2) | |
| Schenker XMG Core 17 Comet Lake | |
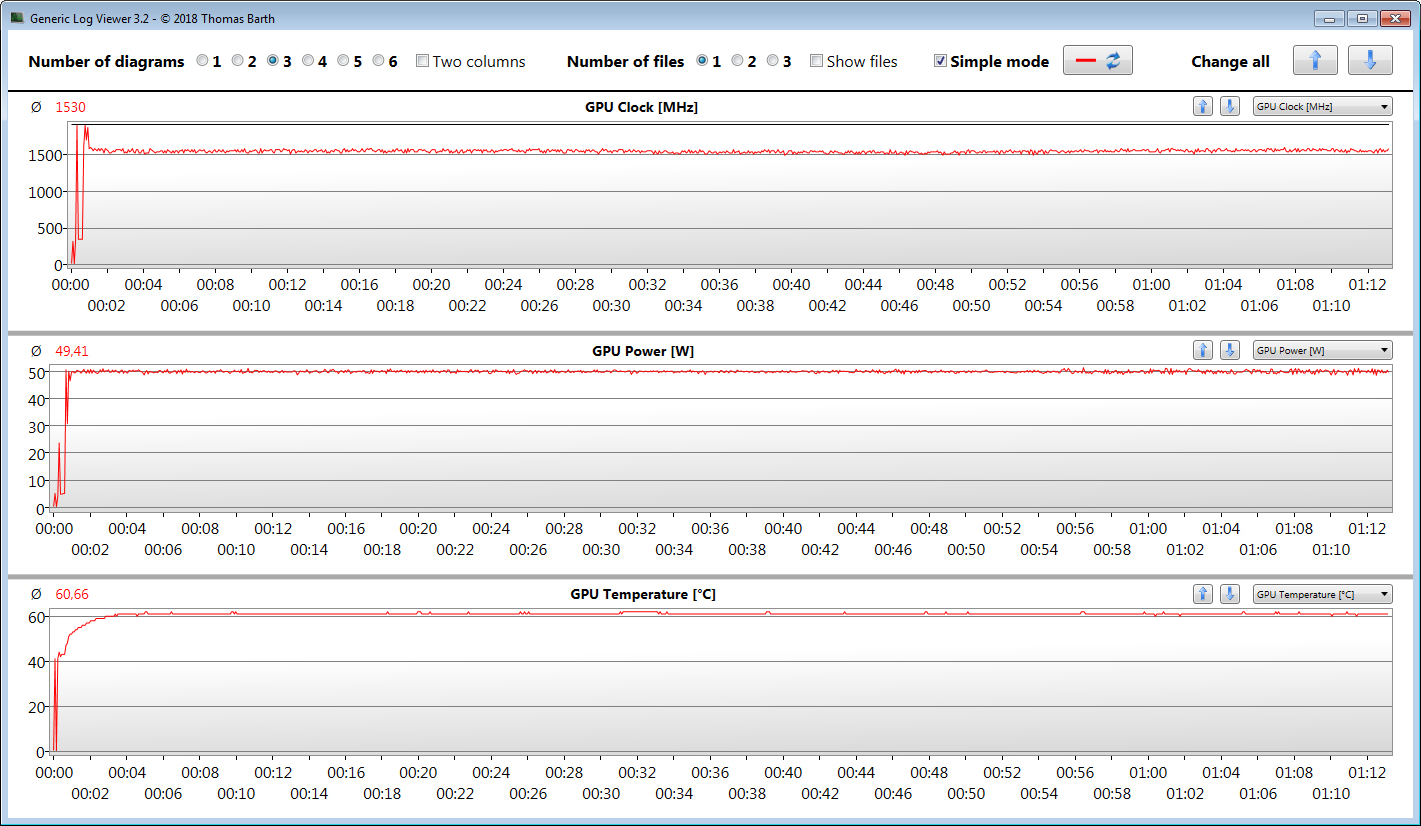
A fim de verificar se as taxas de quadros permanecem em grande parte constantes durante um longo período de tempo, deixamos o jogo O Witcher 3 funcionar por cerca de 60 minutos com resolução Full HD e ajustes de qualidade máxima. O personagem não é movido. Uma queda nas taxas de quadros não foi encontrada
| baixo | média | alto | ultra | |
|---|---|---|---|---|
| The Witcher 3 (2015) | 217 | 133.4 | 74.1 | 42.3 |
| Dota 2 Reborn (2015) | 148 | 129 | 120 | 112 |
| X-Plane 11.11 (2018) | 103 | 89.9 | 75.7 | |
| Doom Eternal (2020) | 188.3 | 97.9 | 82.3 | |
| F1 2020 (2020) | 206 | 110 | 87.9 | 61.4 |
| Horizon Zero Dawn (2020) | 110 | 62 | 50 | 43 |
| Serious Sam 4 (2020) | 119 | 55.8 | 43.4 | 32.9 |
| Watch Dogs Legion (2020) | 97 | 57 | 50 | 22 |
| Assassin´s Creed Valhalla (2020) | 85 | 49 | 35 | 15 |
| Yakuza Like a Dragon (2020) | 121.1 | 49.4 | 49 | 42.9 |
| Immortals Fenyx Rising (2020) | 92 | 54 | 38 | 33 |
| Cyberpunk 2077 1.0 (2020) | 69.5 | 34.2 | 27.9 | 23.2 |
Emissões e energia - O laptop Schenker não fica particularmente quente
Emissões sonoras
No uso inativo, o laptop produz pouco ou nenhum ruído. Os ventiladores trabalham em baixa velocidade ou ficam parados. Entretanto, eles aparecem sob carga. Desta forma, registramos um nível máximo de pressão sonora de 51 dB(A) durante o teste de estresse. A um nível de 44 dB(A), há menos ruído durante o nosso teste Witcher 3.
O desenvolvimento do ruído do laptop pode ser reduzido usando o perfil "Equilibrado" - às custas do desempenho.
Barulho
| Ocioso |
| 25 / 31 / 32 dB |
| Carga |
| 48 / 51 dB |
 | ||
30 dB silencioso 40 dB(A) audível 50 dB(A) ruidosamente alto |
||
min: | ||
Temperatura
Nosso teste de estresse (Prime95 e FurMark funcionam por pelo menos uma hora) é processado pela CPU e GPU em 3,1 a 3,2 GHz e 1.125 MHz, respectivamente. O teste de estresse representa um cenário extremo que não ocorre no uso diário. Realizamos este teste para verificar se o sistema permanece estável mesmo sob carga total
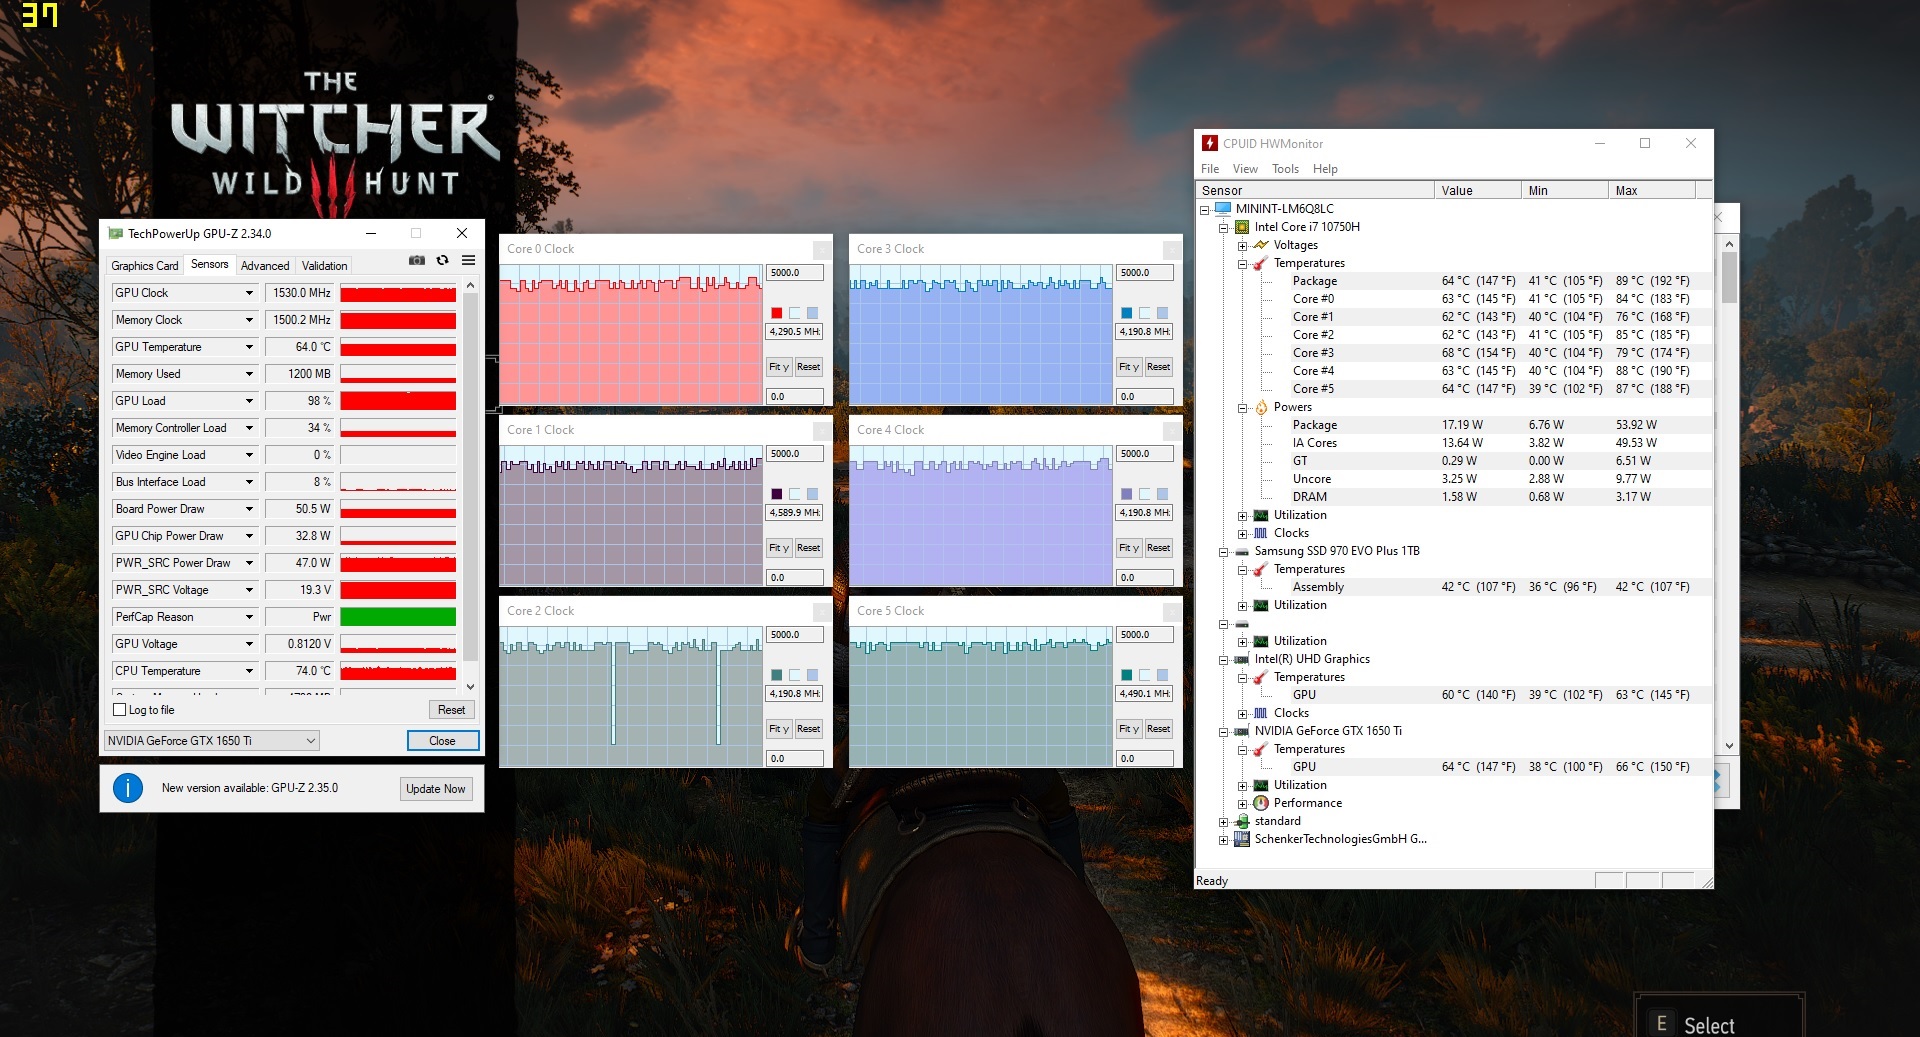
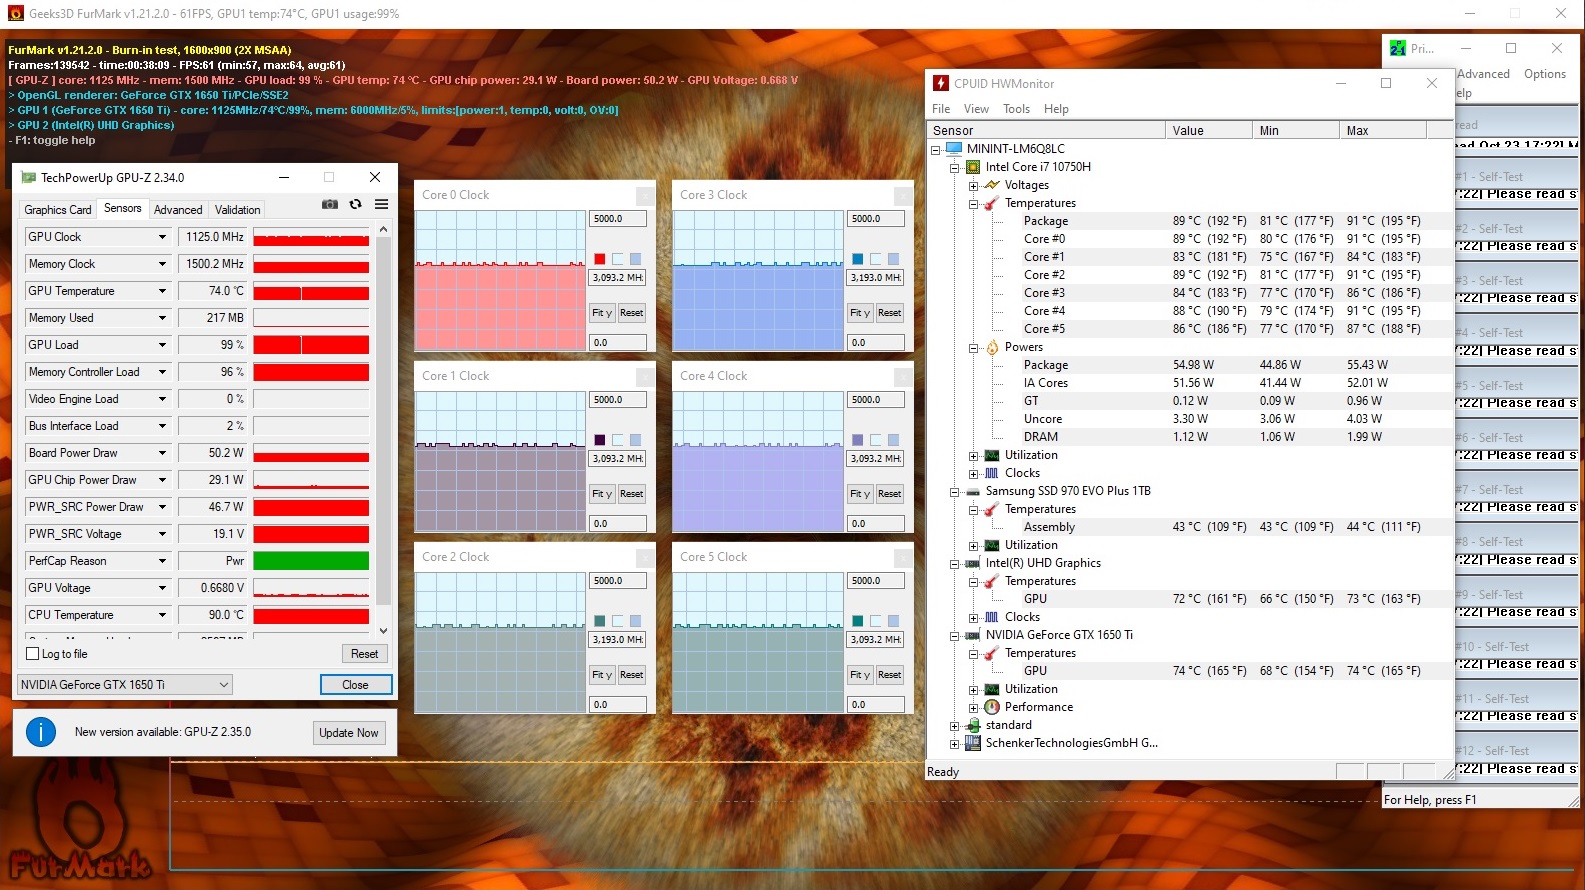
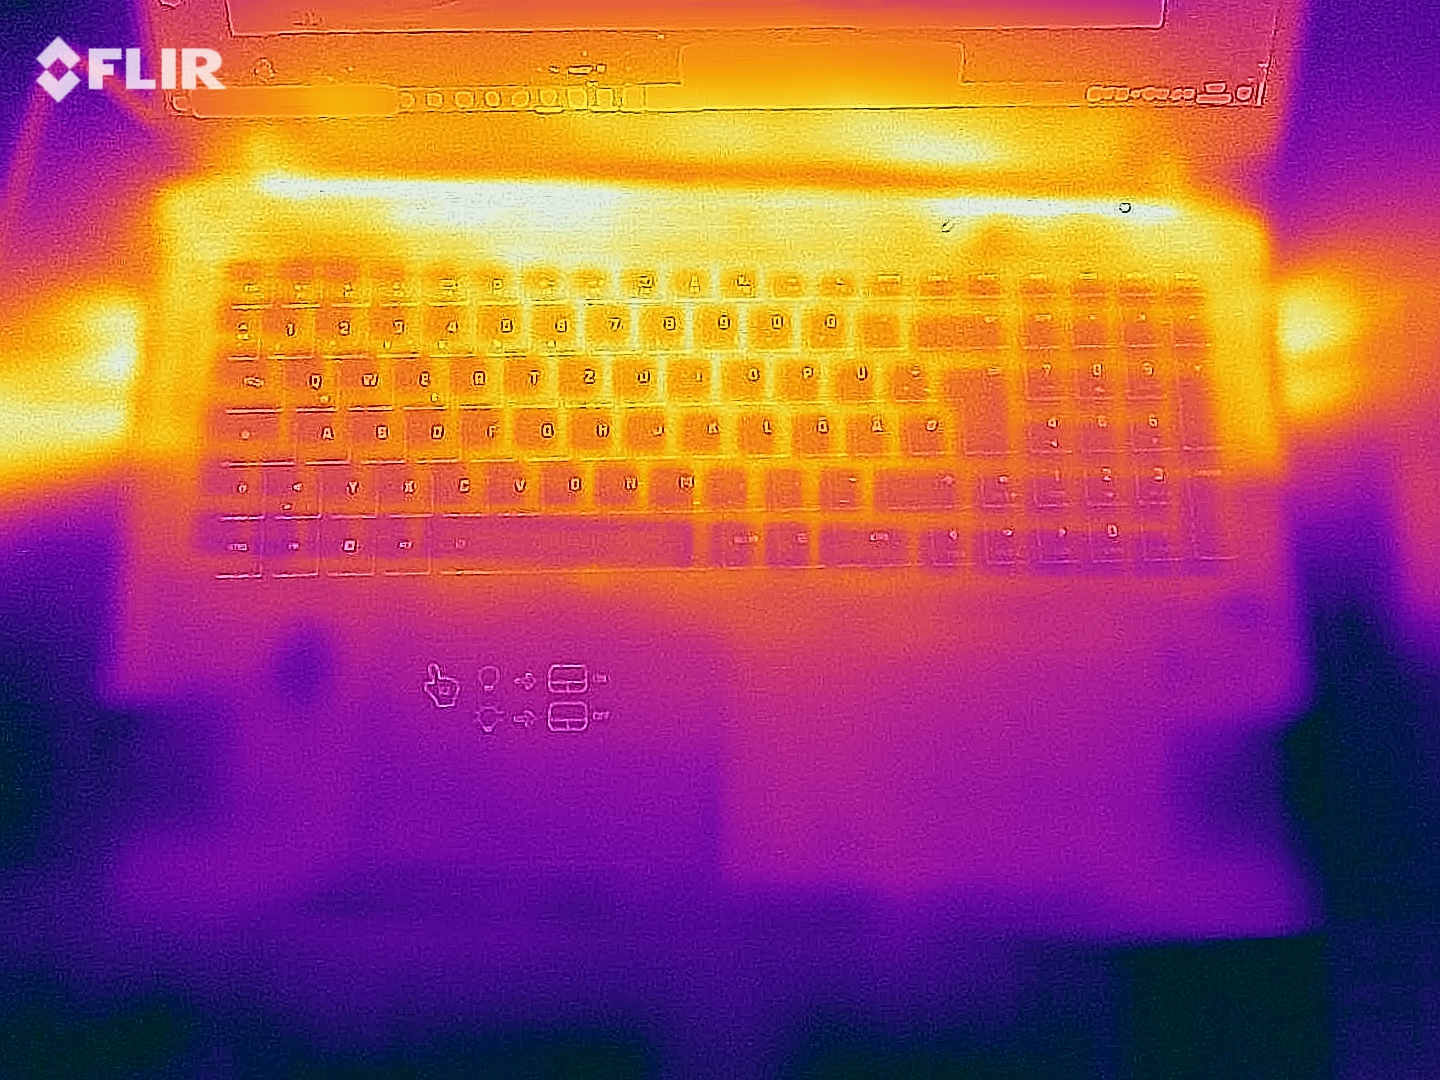
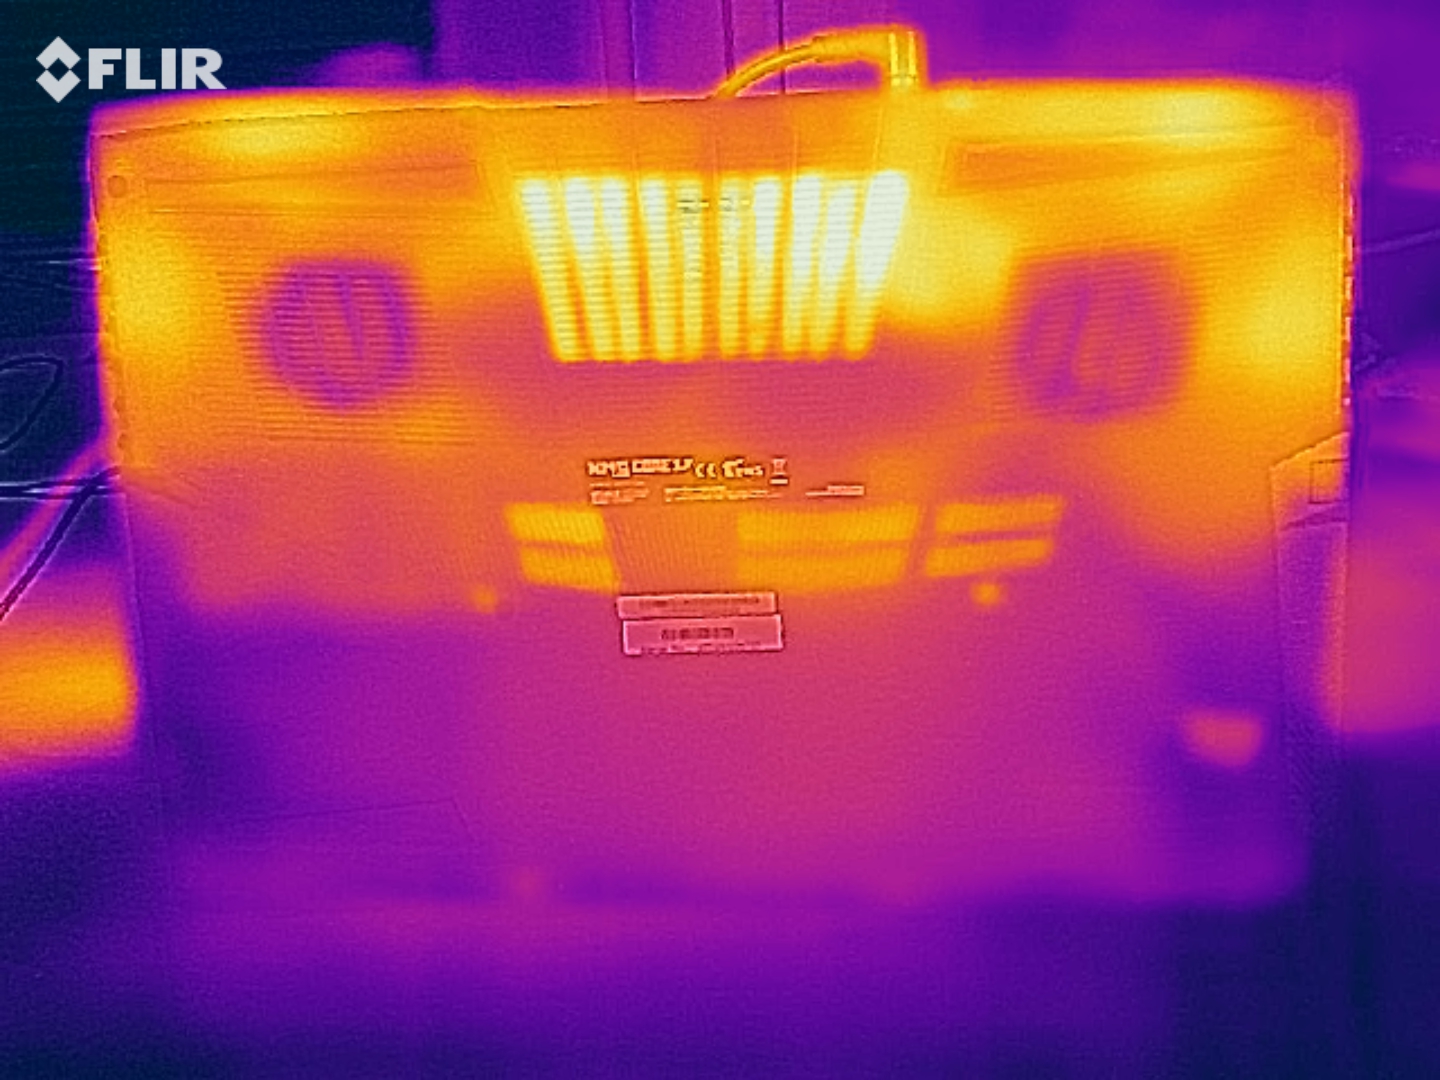
O laptop não esquenta excessivamente. Registramos temperaturas abaixo de 50 °C (~122 °F) em todos os pontos de medição durante o teste de estresse. O desenvolvimento de calor é menor quando realizamos nosso teste The Witcher 3. As temperaturas estão dentro da faixa verde no uso diário
(±) A temperatura máxima no lado superior é 45 °C / 113 F, em comparação com a média de 40.4 °C / 105 F , variando de 21.2 a 68.8 °C para a classe Gaming.
(-) A parte inferior aquece até um máximo de 48 °C / 118 F, em comparação com a média de 43.2 °C / 110 F
(+) Em uso inativo, a temperatura média para o lado superior é 26.3 °C / 79 F, em comparação com a média do dispositivo de 33.9 °C / ### class_avg_f### F.
(±) Jogando The Witcher 3, a temperatura média para o lado superior é 34.7 °C / 94 F, em comparação com a média do dispositivo de 33.9 °C / ## #class_avg_f### F.
(+) Os apoios para as mãos e o touchpad são mais frios que a temperatura da pele, com um máximo de 31 °C / 87.8 F e, portanto, são frios ao toque.
(-) A temperatura média da área do apoio para as mãos de dispositivos semelhantes foi 28.8 °C / 83.8 F (-2.2 °C / -4 F).
Oradores
Schenker XMG Core 17 Comet Lake análise de áudio
(-) | alto-falantes não muito altos (###valor### dB)
Graves 100 - 315Hz
(-) | quase nenhum baixo - em média 20.8% menor que a mediana
(±) | a linearidade dos graves é média (11.1% delta para a frequência anterior)
Médios 400 - 2.000 Hz
(+) | médios equilibrados - apenas 3.2% longe da mediana
(±) | a linearidade dos médios é média (8.5% delta para frequência anterior)
Altos 2 - 16 kHz
(+) | agudos equilibrados - apenas 3.9% longe da mediana
(±) | a linearidade dos máximos é média (7.1% delta para frequência anterior)
Geral 100 - 16.000 Hz
(±) | a linearidade do som geral é média (23.6% diferença em relação à mediana)
Comparado com a mesma classe
» 86% de todos os dispositivos testados nesta classe foram melhores, 4% semelhantes, 10% piores
» O melhor teve um delta de 6%, a média foi 18%, o pior foi 132%
Comparado com todos os dispositivos testados
» 71% de todos os dispositivos testados foram melhores, 6% semelhantes, 23% piores
» O melhor teve um delta de 4%, a média foi 23%, o pior foi 134%
Consumo de energia
Não há problemas em termos de consumo de energia. As taxas estão em um nível normal para o hardware instalado aqui em toda a faixa de carga. Além disso, a potência do adaptador de energia é de 150 watts
| desligado | |
| Ocioso | |
| Carga |
|
Key:
min: | |
Duração da bateria
Usando um script, nosso teste WLAN simula a carga causada pelo acesso a websites. Os recursos de economia de energia do laptop estão desativados e o brilho do visor está ajustado para cerca de 150 cd/m². O Core 17 atinge um tempo de execução de 5:06 horas
| Battery Runtime - WiFi Websurfing | |
| Lenovo Legion 5 17IMH05 | |
| Média da turma Gaming (1.967 - 14.6, n=100, últimos 2 anos) | |
| Acer Predator Helios 300 PH317-54-75G8 | |
| Schenker XMG Core 17 Comet Lake | |
| Schenker XMG Core 17 | |
| Nexoc GH7 716IG | |
| MSI GF75 Thin 10SDR | |
Pro
Contra
Veredicto
Graças aoNúcleo i7-10750H processador e aoGeForce GTX 1650 Ti GPU, o Schenker XMG Core 17 traz todos os jogos de computador modernos sem problemas para a tela. No entanto, a GPU não foi projetada para configurações de qualidade máxima.
Os potenciais compradores devem se perguntar se o modelo com o GeForce RTX 2060 A GPU pode ser uma escolha melhor antes de comprar o laptop. Esta GPU de classe mais alta está disponível por um preço de pouco menos de 150 Euros (~$183), e pode ser compensada a longo prazo.
A Schenker fornece um sólido laptop de 17,3 polegadas de médio alcance para jogos com o XMG Core 17.
Externamente, nada mudou em comparação com amodelo 2019mas o hardware foi atualizado por dentro. Além disso, as boas características domodelo 2019 foram herdadas: O laptop não aquece excessivamente sob carga e produz muito pouco ruído - pelo menos em uso ocioso e sob carga baixa.
O laptop oferece espaço para dois M.2 2280 SSDs (1x NVMe, 1x NVMe/SATA; RAID 0/1). Nosso dispositivo de teste é equipado com um SSD de 1 TB NVMe. A tela responsiva (Full HD, IPS, 144 Hz) pontua com uma superfície mate, reprodução de cores decente e cobertura de espaço de cores aceitável. Além disso, o brilho e o contraste também são aceitáveis.
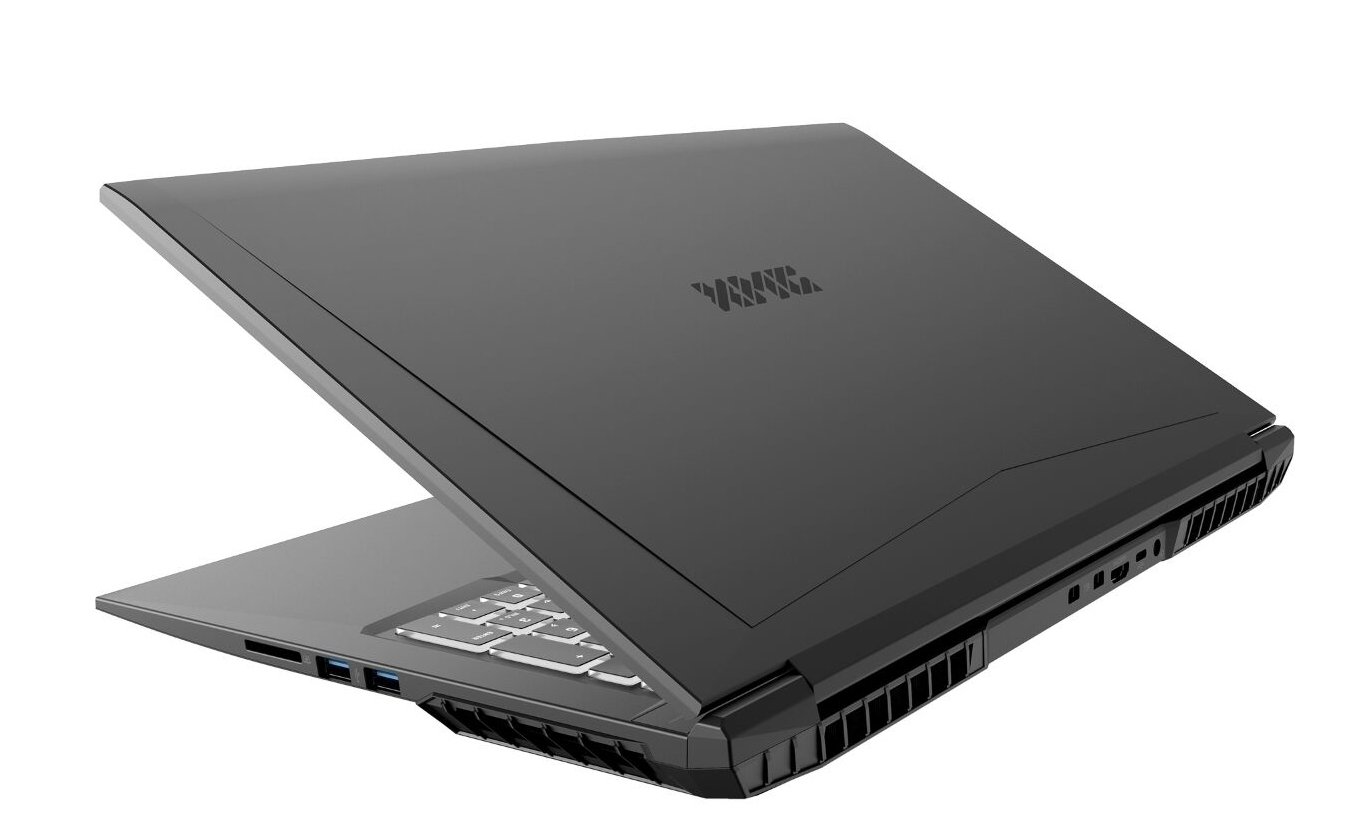
A vida útil da bateria está em um nível normal para um laptop para jogos. Além disso, a extensa gama de interfaces do laptop inclui, entre outras coisas, três saídas de vídeo - duas delas suportam G-Sync. Não há nenhuma porta Thunderbolt 3.
Nota: As pontuações das categorias individuais diferem em parte das do Core 17 de 2019, porque atualizamos o sistema de classificação. As pontuações de ambos os modelos do Core 17 não são comparáveis.
Schenker XMG Core 17 Comet Lake
- 12/21/2020 v7 (old)
Sascha Mölck
Price comparison

