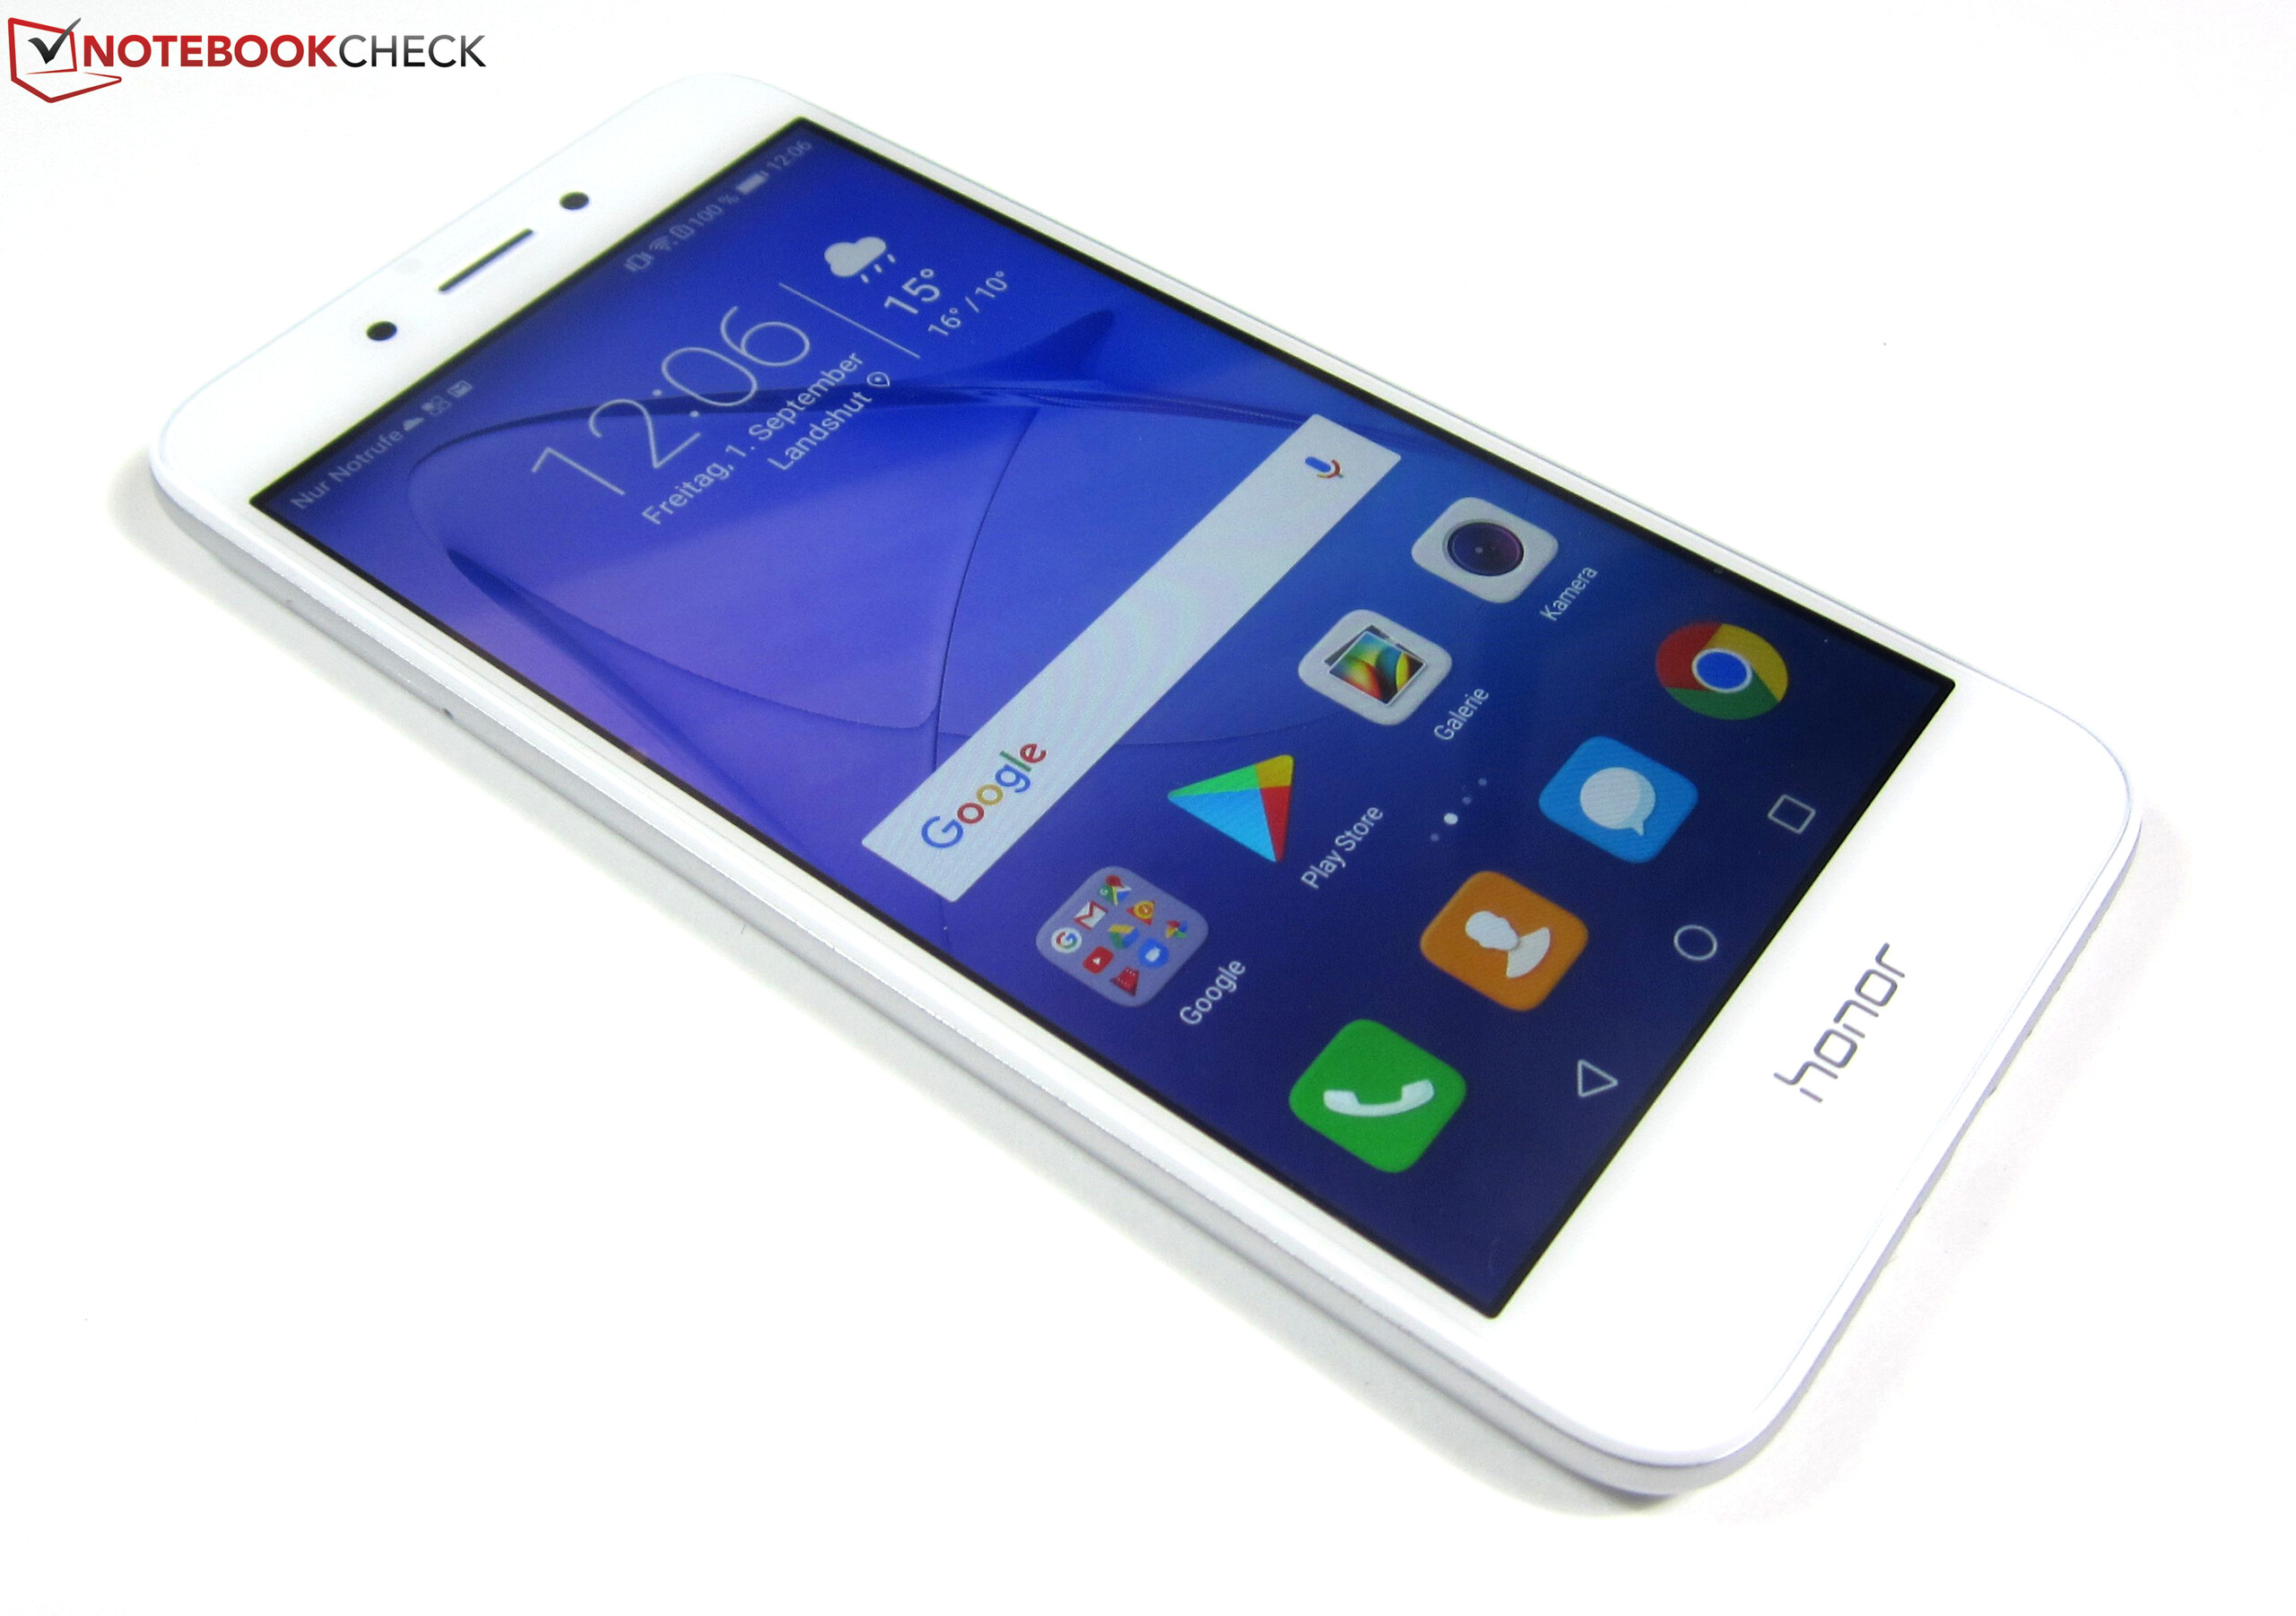
Breve Análise do Smartphone Honor 6A

| Networking | |
| iperf3 transmit AX12 | |
| Lenovo Moto G5 | |
| Nokia 3 | |
| Samsung Galaxy J3 2017 | |
| Honor 6A | |
| Huawei Y6 2017 | |
| iperf3 receive AX12 | |
| Lenovo Moto G5 | |
| Nokia 3 | |
| Honor 6A | |
| Samsung Galaxy J3 2017 | |
| Huawei Y6 2017 | |


| |||||||||||||||||||||||||
iluminação: 94 %
iluminação com acumulador: 480 cd/m²
Contraste: 1116:1 (Preto: 0.43 cd/m²)
ΔE ColorChecker Calman: 5.2 | ∀{0.5-29.43 Ø4.71}
ΔE Greyscale Calman: 3.1 | ∀{0.09-98 Ø4.96}
Gamma: 2.4
CCT: 6688 K
| Honor 6A IPS, 1280x720, 5" | Lenovo Moto G5 IPS, 1920x1080, 5" | Huawei Y6 2017 IPS, 1280x720, 5" | Nokia 3 IPS, 1280x720, 5" | Samsung Galaxy J3 2017 PLS, 1280x720, 5" | Sony Xperia XA IPS, 1280x720, 5" | |
|---|---|---|---|---|---|---|
| Screen | 21% | 27% | -23% | 11% | -34% | |
| Brightness middle (cd/m²) | 480 | 660 38% | 438 -9% | 481 0% | 502 5% | 518 8% |
| Brightness (cd/m²) | 462 | 625 35% | 432 -6% | 469 2% | 494 7% | 475 3% |
| Brightness Distribution (%) | 94 | 92 -2% | 90 -4% | 84 -11% | 89 -5% | 81 -14% |
| Black Level * (cd/m²) | 0.43 | 0.29 33% | 0.13 70% | 0.22 49% | 0.35 19% | 0.61 -42% |
| Contrast (:1) | 1116 | 2276 104% | 3369 202% | 2186 96% | 1434 28% | 849 -24% |
| Colorchecker dE 2000 * | 5.2 | 4.9 6% | 4.8 8% | 8.1 -56% | 4.6 12% | 6.8 -31% |
| Colorchecker dE 2000 max. * | 8 | 7.6 5% | 11.4 -43% | 15.4 -93% | 8 -0% | 11.4 -43% |
| Greyscale dE 2000 * | 3.1 | 4.8 -55% | 3.2 -3% | 8.5 -174% | 2.5 19% | 7 -126% |
| Gamma | 2.4 92% | 2.18 101% | 2.23 99% | 2.16 102% | 2.29 96% | 2.35 94% |
| CCT | 6688 97% | 7357 88% | 7090 92% | 9014 72% | 6351 102% | 8151 80% |
* ... menor é melhor
Cintilação da tela / PWM (modulação por largura de pulso)
| Tela tremeluzindo/PWM detectado | 2232 Hz | ≤ 20 % configuração de brilho | 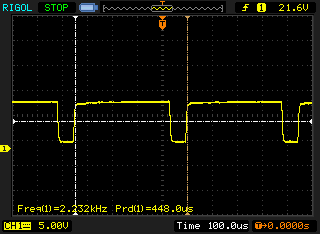 |
A luz de fundo da tela pisca em 2232 Hz (pior caso, por exemplo, utilizando PWM) Cintilação detectada em uma configuração de brilho de 20 % e abaixo. Não deve haver cintilação ou PWM acima desta configuração de brilho. A frequência de 2232 Hz é bastante alta, então a maioria dos usuários sensíveis ao PWM não deve notar nenhuma oscilação. [pwm_comparison] Em comparação: 52 % de todos os dispositivos testados não usam PWM para escurecer a tela. Se PWM foi detectado, uma média de 7754 (mínimo: 5 - máximo: 343500) Hz foi medida. | |||
Exibir tempos de resposta
| ↔ Tempo de resposta preto para branco | ||
|---|---|---|
| 21.2 ms ... ascensão ↗ e queda ↘ combinadas | ↗ 9.2 ms ascensão | 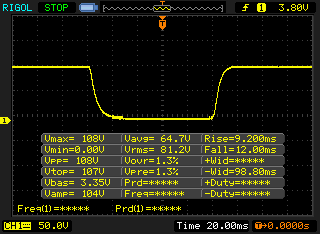 |
| ↘ 12 ms queda | ||
| A tela mostra boas taxas de resposta em nossos testes, mas pode ser muito lenta para jogadores competitivos. Em comparação, todos os dispositivos testados variam de 0.1 (mínimo) a 240 (máximo) ms. » 48 % de todos os dispositivos são melhores. Isso significa que o tempo de resposta medido é semelhante à média de todos os dispositivos testados (19.8 ms). | ||
| ↔ Tempo de resposta 50% cinza a 80% cinza | ||
| 36.8 ms ... ascensão ↗ e queda ↘ combinadas | ↗ 19.6 ms ascensão | 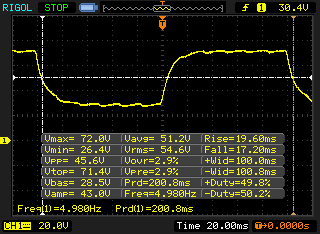 |
| ↘ 17.2 ms queda | ||
| A tela mostra taxas de resposta lentas em nossos testes e será insatisfatória para os jogadores. Em comparação, todos os dispositivos testados variam de 0.165 (mínimo) a 636 (máximo) ms. » 53 % de todos os dispositivos são melhores. Isso significa que o tempo de resposta medido é pior que a média de todos os dispositivos testados (31 ms). | ||
| AnTuTu v6 - Total Score (classificar por valor) | |
| Honor 6A | |
| Lenovo Moto G5 | |
| Huawei Y6 2017 | |
| Nokia 3 | |
| Samsung Galaxy J3 2017 | |
| Sony Xperia XA | |
| PCMark for Android | |
| Work performance score (classificar por valor) | |
| Honor 6A | |
| Lenovo Moto G5 | |
| Huawei Y6 2017 | |
| Nokia 3 | |
| Sony Xperia XA | |
| Work 2.0 performance score (classificar por valor) | |
| Honor 6A | |
| Lenovo Moto G5 | |
| Huawei Y6 2017 | |
| Nokia 3 | |
| Samsung Galaxy J3 2017 | |
| Geekbench 4.4 | |
| 64 Bit Single-Core Score (classificar por valor) | |
| Honor 6A | |
| Lenovo Moto G5 | |
| Huawei Y6 2017 | |
| Nokia 3 | |
| Samsung Galaxy J3 2017 | |
| 64 Bit Multi-Core Score (classificar por valor) | |
| Honor 6A | |
| Lenovo Moto G5 | |
| Huawei Y6 2017 | |
| Nokia 3 | |
| Samsung Galaxy J3 2017 | |
| Compute RenderScript Score (classificar por valor) | |
| Lenovo Moto G5 | |
| Huawei Y6 2017 | |
| Nokia 3 | |
| Samsung Galaxy J3 2017 | |
| GFXBench (DX / GLBenchmark) 2.7 | |
| T-Rex Onscreen (classificar por valor) | |
| Honor 6A | |
| Lenovo Moto G5 | |
| Huawei Y6 2017 | |
| Nokia 3 | |
| Samsung Galaxy J3 2017 | |
| Sony Xperia XA | |
| 1920x1080 T-Rex Offscreen (classificar por valor) | |
| Honor 6A | |
| Lenovo Moto G5 | |
| Huawei Y6 2017 | |
| Nokia 3 | |
| Samsung Galaxy J3 2017 | |
| Sony Xperia XA | |
| GFXBench 3.0 | |
| on screen Manhattan Onscreen OGL (classificar por valor) | |
| Honor 6A | |
| Lenovo Moto G5 | |
| Huawei Y6 2017 | |
| Nokia 3 | |
| Samsung Galaxy J3 2017 | |
| Sony Xperia XA | |
| 1920x1080 1080p Manhattan Offscreen (classificar por valor) | |
| Honor 6A | |
| Lenovo Moto G5 | |
| Huawei Y6 2017 | |
| Nokia 3 | |
| Samsung Galaxy J3 2017 | |
| Sony Xperia XA | |
| GFXBench 3.1 | |
| on screen Manhattan ES 3.1 Onscreen (classificar por valor) | |
| Honor 6A | |
| Lenovo Moto G5 | |
| Huawei Y6 2017 | |
| Nokia 3 | |
| Samsung Galaxy J3 2017 | |
| Sony Xperia XA | |
| 1920x1080 Manhattan ES 3.1 Offscreen (classificar por valor) | |
| Honor 6A | |
| Lenovo Moto G5 | |
| Huawei Y6 2017 | |
| Nokia 3 | |
| Samsung Galaxy J3 2017 | |
| Sony Xperia XA | |
| GFXBench | |
| on screen Car Chase Onscreen (classificar por valor) | |
| Honor 6A | |
| Lenovo Moto G5 | |
| Huawei Y6 2017 | |
| Sony Xperia XA | |
| 1920x1080 Car Chase Offscreen (classificar por valor) | |
| Honor 6A | |
| Lenovo Moto G5 | |
| Huawei Y6 2017 | |
| Sony Xperia XA | |
| JetStream 1.1 - 1.1 Total | |
| Sony Xperia XA (Chrome 51) | |
| Honor 6A (Chrome 55.0.2883.91) | |
| Lenovo Moto G5 (Chrome 57) | |
| Huawei Y6 2017 (Chrome 60) | |
| Samsung Galaxy J3 2017 (Chrome 59) | |
| Nokia 3 (Chrome 59) | |
| Octane V2 - Total Score | |
| Sony Xperia XA (Chrome 51) | |
| Honor 6A (Chrome 55.0.2883.91) | |
| Huawei Y6 2017 (Chrome 60) | |
| Samsung Galaxy J3 2017 (Chrome 59) | |
| Lenovo Moto G5 (Chrome 57) | |
| Nokia 3 (Chrome 59) | |
| Mozilla Kraken 1.1 - Total | |
| Nokia 3 (Chrome 59) | |
| Samsung Galaxy J3 2017 (Chrome 59) | |
| Huawei Y6 2017 (Chrome 60) | |
| Lenovo Moto G5 (Chrome 57) | |
| Honor 6A (Chrome 55.0.2883.91) | |
| Sony Xperia XA (Chrome 51) | |
| WebXPRT 2015 - Overall | |
| Sony Xperia XA (Chrome 51) | |
| Huawei Y6 2017 (Chrome 60) | |
| Samsung Galaxy J3 2017 (Chrome 59) | |
| Lenovo Moto G5 (Chrome 57) | |
| Nokia 3 (Chrome 59) | |
| Honor 6A (Chrome 55.0.2883.91) | |
* ... menor é melhor
| Honor 6A | Lenovo Moto G5 | Huawei Y6 2017 | Nokia 3 | Samsung Galaxy J3 2017 | Sony Xperia XA | |
|---|---|---|---|---|---|---|
| AndroBench 3-5 | 78% | 19% | -18% | -2% | 11% | |
| Sequential Read 256KB (MB/s) | 123.6 | 230.6 87% | 202.6 64% | 181 46% | 177.7 44% | 240.4 94% |
| Sequential Write 256KB (MB/s) | 64.1 | 45.6 -29% | 66.9 4% | 34 -47% | 51 -20% | 68.6 7% |
| Random Read 4KB (MB/s) | 50.2 | 37.6 -25% | 25.93 -48% | 17.7 -65% | 24 -52% | 22.05 -56% |
| Random Write 4KB (MB/s) | 6.94 | 37.9 446% | 20.54 196% | 5.5 -21% | 9.5 37% | 10.6 53% |
| Sequential Read 256KB SDCard (MB/s) | 83.9 ? | 78.5 ? -6% | 48.4 -42% | 64.3 -23% | 70.3 -16% | 72.9 ? -13% |
| Sequential Write 256KB SDCard (MB/s) | 63.1 ? | 58 ? -8% | 26.4 -58% | 62.9 0% | 59.6 -6% | 50.7 ? -20% |
| Dead Trigger 2 | |||
| Configurações | Valor | ||
| high | 52 fps | ||
| Asphalt 8: Airborne | |||
| Configurações | Valor | ||
| high | 30 fps | ||
| very low | 30 fps | ||
(±) A temperatura máxima no lado superior é 43.1 °C / 110 F, em comparação com a média de 35.3 °C / 96 F , variando de 21.9 a 247 °C para a classe Smartphone.
(+) A parte inferior aquece até um máximo de 38.6 °C / 101 F, em comparação com a média de 34 °C / 93 F
(±) Em uso inativo, a temperatura média para o lado superior é 34.5 °C / 94 F, em comparação com a média do dispositivo de 33 °C / ### class_avg_f### F.
Honor 6A análise de áudio
(+) | os alto-falantes podem tocar relativamente alto (###valor### dB)
Graves 100 - 315Hz
(-) | quase nenhum baixo - em média 35.3% menor que a mediana
(±) | a linearidade dos graves é média (7.4% delta para a frequência anterior)
Médios 400 - 2.000 Hz
(±) | médios reduzidos - em média 5.2% menor que a mediana
(±) | a linearidade dos médios é média (7.1% delta para frequência anterior)
Altos 2 - 16 kHz
(±) | máximos mais altos - em média 5.2% maior que a mediana
(+) | os máximos são lineares (3.9% delta da frequência anterior)
Geral 100 - 16.000 Hz
(±) | a linearidade do som geral é média (25.8% diferença em relação à mediana)
Comparado com a mesma classe
» 65% de todos os dispositivos testados nesta classe foram melhores, 6% semelhantes, 29% piores
» O melhor teve um delta de 11%, a média foi 34%, o pior foi 134%
Comparado com todos os dispositivos testados
» 79% de todos os dispositivos testados foram melhores, 4% semelhantes, 17% piores
» O melhor teve um delta de 4%, a média foi 23%, o pior foi 134%
Nokia 3 análise de áudio
(+) | os alto-falantes podem tocar relativamente alto (###valor### dB)
Graves 100 - 315Hz
(-) | quase nenhum baixo - em média 39.4% menor que a mediana
(±) | a linearidade dos graves é média (11.6% delta para a frequência anterior)
Médios 400 - 2.000 Hz
(+) | médios equilibrados - apenas 4.8% longe da mediana
(±) | a linearidade dos médios é média (8% delta para frequência anterior)
Altos 2 - 16 kHz
(±) | máximos mais altos - em média 5% maior que a mediana
(+) | os máximos são lineares (5.8% delta da frequência anterior)
Geral 100 - 16.000 Hz
(±) | a linearidade do som geral é média (29% diferença em relação à mediana)
Comparado com a mesma classe
» 76% de todos os dispositivos testados nesta classe foram melhores, 3% semelhantes, 20% piores
» O melhor teve um delta de 11%, a média foi 34%, o pior foi 134%
Comparado com todos os dispositivos testados
» 87% de todos os dispositivos testados foram melhores, 2% semelhantes, 11% piores
» O melhor teve um delta de 4%, a média foi 23%, o pior foi 134%
Samsung Galaxy J3 2017 análise de áudio
(±) | o volume do alto-falante é médio, mas bom (###valor### dB)
Graves 100 - 315Hz
(-) | quase nenhum baixo - em média 16.8% menor que a mediana
(±) | a linearidade dos graves é média (13.2% delta para a frequência anterior)
Médios 400 - 2.000 Hz
(±) | médios mais altos - em média 6% maior que a mediana
(+) | médios são lineares (4.2% delta para frequência anterior)
Altos 2 - 16 kHz
(±) | máximos mais altos - em média 6.4% maior que a mediana
(±) | a linearidade dos máximos é média (7.6% delta para frequência anterior)
Geral 100 - 16.000 Hz
(±) | a linearidade do som geral é média (23.6% diferença em relação à mediana)
Comparado com a mesma classe
» 54% de todos os dispositivos testados nesta classe foram melhores, 8% semelhantes, 38% piores
» O melhor teve um delta de 11%, a média foi 34%, o pior foi 134%
Comparado com todos os dispositivos testados
» 71% de todos os dispositivos testados foram melhores, 6% semelhantes, 23% piores
» O melhor teve um delta de 4%, a média foi 23%, o pior foi 134%
| desligado | |
| Ocioso | |
| Carga |
|
Key:
min: | |
| Honor 6A 3020 mAh | Lenovo Moto G5 2800 mAh | Nokia 3 2630 mAh | Samsung Galaxy J3 2017 2400 mAh | Sony Xperia XA 2300 mAh | |
|---|---|---|---|---|---|
| Power Consumption | 25% | 39% | 26% | 27% | |
| Idle Minimum * (Watt) | 1.33 | 0.73 45% | 0.67 50% | 0.82 38% | 0.72 46% |
| Idle Average * (Watt) | 2.53 | 1.64 35% | 1.35 47% | 1.94 23% | 1.5 41% |
| Idle Maximum * (Watt) | 2.54 | 1.68 34% | 1.39 45% | 2.06 19% | 1.57 38% |
| Load Average * (Watt) | 3.84 | 3.46 10% | 3.1 19% | 3.31 14% | 3.48 9% |
| Load Maximum * (Watt) | 6.12 | 6.13 -0% | 4.02 34% | 3.89 36% | 6.04 1% |
* ... menor é melhor
| Honor 6A 3020 mAh | Lenovo Moto G5 2800 mAh | Huawei Y6 2017 3000 mAh | Nokia 3 2630 mAh | Samsung Galaxy J3 2017 2400 mAh | Sony Xperia XA 2300 mAh | |
|---|---|---|---|---|---|---|
| Duração da bateria | -28% | -11% | -21% | -6% | -49% | |
| Reader / Idle (h) | 33.5 | 20.7 -38% | 25.4 -24% | 21 -37% | 23.8 -29% | 12.9 -61% |
| H.264 (h) | 12.2 | 10.3 -16% | 11.6 -5% | 10.5 -14% | 13.7 12% | 7.7 -37% |
| WiFi v1.3 (h) | 13.2 | 9.4 -29% | 10.9 -17% | 9.2 -30% | 12 -9% | 5.9 -55% |
| Load (h) | 4.9 | 3.5 -29% | 5 2% | 4.7 -4% | 5.1 4% | 2.8 -43% |
Pro
Contra

Com o 6A, a linha Honor conseguiu manter o seu ideal de produzir smartphones que são de bom valor pelo seu dinheiro. O Android de 5 polegadas, disponível por $200 e menos, tem muito a oferecer: uma carcaça bem construída, feita de plástico e metal, uma tela HD brilhante e bem ajustada, longos tempos de duração da bateria e desempenho rápido do sistema.
Embora o Honor 6A seja "apenas" um aparelho acessível de nível de entrada, oferece um desempenho comparativamente alto e muitos recursos.
O Honor, no entanto, economizou no armazenamento disponível, e apenas a metade dos 16 GB originais de armazenamento está efetivamente disponível para o usuário. A câmera de 13 MP também não é particularmente excitante e você tem que aceitar uma qualidade de imagem medíocre. O Honor também poderia trabalhar em suas correções de segurança do Android, já que tinham mais de 3 meses no momento do teste.
Honor 6A
- 09/11/2017 v6 (old)
Manuel Masiero