Breve Análise do Smartphone Huawei P10 Plus

| Networking | |
| iperf3 transmit AX12 | |
| Samsung Galaxy S8 Plus | |
| Huawei P10 | |
| OnePlus 3T | |
| LG G6 | |
| Huawei P10 Plus | |
| iperf3 receive AX12 | |
| Samsung Galaxy S8 Plus | |
| LG G6 | |
| Huawei P10 | |
| OnePlus 3T | |
| Huawei P10 Plus | |


| |||||||||||||||||||||||||
iluminação: 92 %
iluminação com acumulador: 568 cd/m²
Contraste: 1321:1 (Preto: 0.43 cd/m²)
ΔE ColorChecker Calman: 2.4 | ∀{0.5-29.43 Ø4.71}
ΔE Greyscale Calman: 2.5 | ∀{0.09-98 Ø4.96}
Gamma: 2.37
CCT: 6779 K
| Huawei P10 Plus LTPS, 2560x1440, 5.5" | Apple iPhone 7 Plus IPS, 1920x1080, 5.5" | Huawei P10 LTPS, 1920x1080, 5.1" | OnePlus 3T Optic-AMOLED, 1920x1080, 5.5" | Samsung Galaxy S8 Plus Super AMOLED, 2960x1440, 6.2" | LG G6 IPS LCD, 2880x1440, 5.7" | Lenovo Moto Z AMOLED, 2560x1440, 5.5" | |
|---|---|---|---|---|---|---|---|
| Screen | 19% | -41% | -122% | 13% | -21% | -11% | |
| Brightness middle (cd/m²) | 568 | 557 -2% | 547 -4% | 421 -26% | 560 -1% | 646 14% | 485 -15% |
| Brightness (cd/m²) | 562 | 553 -2% | 556 -1% | 430 -23% | 562 0% | 611 9% | 490 -13% |
| Brightness Distribution (%) | 92 | 97 5% | 86 -7% | 84 -9% | 93 1% | 89 -3% | 92 0% |
| Black Level * (cd/m²) | 0.43 | 0.35 19% | 0.43 -0% | 0.23 47% | |||
| Contrast (:1) | 1321 | 1591 20% | 1272 -4% | 2809 113% | |||
| Colorchecker dE 2000 * | 2.4 | 1.4 42% | 4.8 -100% | 7.1 -196% | 1.7 29% | 4.5 -88% | 2.1 12% |
| Colorchecker dE 2000 max. * | 3.8 | 3.1 18% | 8.8 -132% | 15.3 -303% | 3.4 11% | 8.3 -118% | 5.5 -45% |
| Greyscale dE 2000 * | 2.5 | 1.3 48% | 4.5 -80% | 6.8 -172% | 1.6 36% | 6 -140% | 2.6 -4% |
| Gamma | 2.37 93% | 2.21 100% | 2.39 92% | 2.23 99% | 2.13 103% | 2.27 97% | 2.23 99% |
| CCT | 6779 96% | 6667 97% | 7194 90% | 7866 83% | 6435 101% | 7996 81% | 6843 95% |
| Color Space (Percent of AdobeRGB 1998) (%) | 63.1 | 81.57 | 67.74 | 88.14 | |||
| Color Space (Percent of sRGB) (%) | 99.83 | 99.87 | 99.05 | 100 |
* ... menor é melhor
Cintilação da tela / PWM (modulação por largura de pulso)
| Tela tremeluzindo / PWM não detectado | 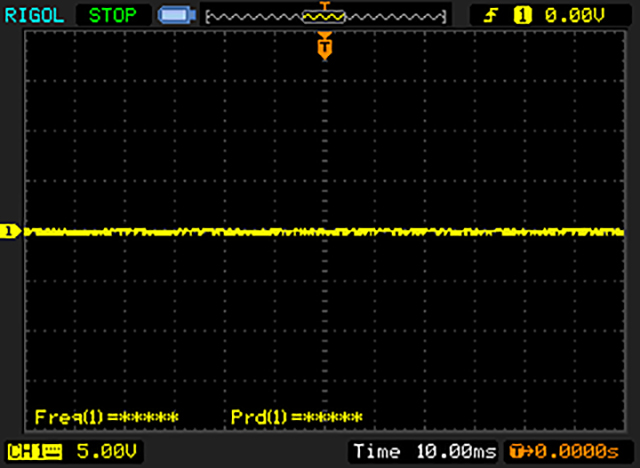 | ||
[pwm_comparison] Em comparação: 52 % de todos os dispositivos testados não usam PWM para escurecer a tela. Se PWM foi detectado, uma média de 7741 (mínimo: 5 - máximo: 343500) Hz foi medida. | |||
Exibir tempos de resposta
| ↔ Tempo de resposta preto para branco | ||
|---|---|---|
| 17.6 ms ... ascensão ↗ e queda ↘ combinadas | ↗ 5.2 ms ascensão | 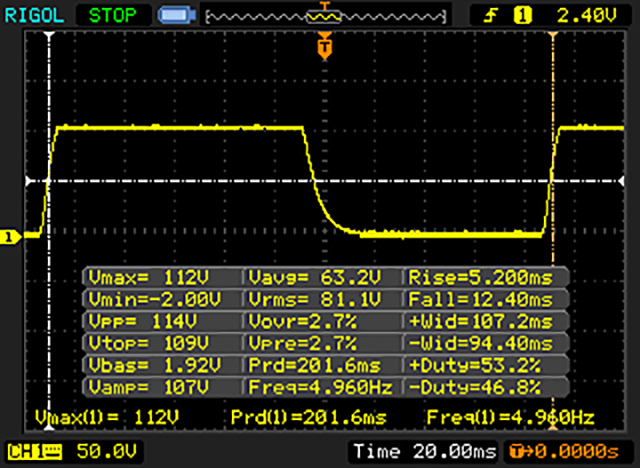 |
| ↘ 12.4 ms queda | ||
| A tela mostra boas taxas de resposta em nossos testes, mas pode ser muito lenta para jogadores competitivos. Em comparação, todos os dispositivos testados variam de 0.1 (mínimo) a 240 (máximo) ms. » 40 % de todos os dispositivos são melhores. Isso significa que o tempo de resposta medido é melhor que a média de todos os dispositivos testados (19.8 ms). | ||
| ↔ Tempo de resposta 50% cinza a 80% cinza | ||
| 38 ms ... ascensão ↗ e queda ↘ combinadas | ↗ 17.6 ms ascensão | 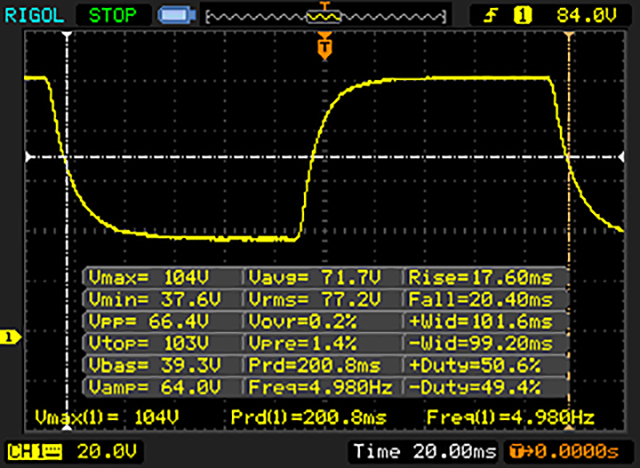 |
| ↘ 20.4 ms queda | ||
| A tela mostra taxas de resposta lentas em nossos testes e será insatisfatória para os jogadores. Em comparação, todos os dispositivos testados variam de 0.165 (mínimo) a 636 (máximo) ms. » 55 % de todos os dispositivos são melhores. Isso significa que o tempo de resposta medido é pior que a média de todos os dispositivos testados (30.9 ms). | ||
| AnTuTu v6 - Total Score (classificar por valor) | |
| Huawei P10 Plus | |
| Apple iPhone 7 Plus | |
| Huawei P10 | |
| OnePlus 3T | |
| Samsung Galaxy S8 Plus | |
| LG G6 | |
| Lenovo Moto Z | |
| Geekbench 4.4 | |
| 64 Bit Single-Core Score (classificar por valor) | |
| Huawei P10 Plus | |
| Huawei P10 | |
| Samsung Galaxy S8 Plus | |
| LG G6 | |
| 64 Bit Multi-Core Score (classificar por valor) | |
| Huawei P10 Plus | |
| Huawei P10 | |
| Samsung Galaxy S8 Plus | |
| LG G6 | |
| GFXBench (DX / GLBenchmark) 2.7 | |
| T-Rex Onscreen (classificar por valor) | |
| Huawei P10 Plus | |
| Apple iPhone 7 Plus | |
| Huawei P10 | |
| OnePlus 3T | |
| Samsung Galaxy S8 Plus | |
| LG G6 | |
| Lenovo Moto Z | |
| 1920x1080 T-Rex Offscreen (classificar por valor) | |
| Huawei P10 Plus | |
| Apple iPhone 7 Plus | |
| Huawei P10 | |
| OnePlus 3T | |
| Samsung Galaxy S8 Plus | |
| LG G6 | |
| Lenovo Moto Z | |
| GFXBench 3.0 | |
| on screen Manhattan Onscreen OGL (classificar por valor) | |
| Huawei P10 Plus | |
| Apple iPhone 7 Plus | |
| Huawei P10 | |
| OnePlus 3T | |
| Samsung Galaxy S8 Plus | |
| LG G6 | |
| Lenovo Moto Z | |
| 1920x1080 1080p Manhattan Offscreen (classificar por valor) | |
| Huawei P10 Plus | |
| Apple iPhone 7 Plus | |
| Huawei P10 | |
| OnePlus 3T | |
| Samsung Galaxy S8 Plus | |
| LG G6 | |
| Lenovo Moto Z | |
| GFXBench 3.1 | |
| on screen Manhattan ES 3.1 Onscreen (classificar por valor) | |
| Huawei P10 Plus | |
| Apple iPhone 7 Plus | |
| Huawei P10 | |
| OnePlus 3T | |
| Samsung Galaxy S8 Plus | |
| LG G6 | |
| Lenovo Moto Z | |
| 1920x1080 Manhattan ES 3.1 Offscreen (classificar por valor) | |
| Huawei P10 Plus | |
| Apple iPhone 7 Plus | |
| Huawei P10 | |
| OnePlus 3T | |
| Samsung Galaxy S8 Plus | |
| LG G6 | |
| Lenovo Moto Z | |
| PCMark for Android - Work performance score (classificar por valor) | |
| Huawei P10 Plus | |
| Huawei P10 | |
| OnePlus 3T | |
| Samsung Galaxy S8 Plus | |
| LG G6 | |
| Lenovo Moto Z | |
| Octane V2 - Total Score (classificar por valor) | |
| Huawei P10 Plus | |
| Apple iPhone 7 Plus | |
| Huawei P10 | |
| OnePlus 3T | |
| Samsung Galaxy S8 Plus | |
| LG G6 | |
| Lenovo Moto Z | |
| Mozilla Kraken 1.1 - Total (classificar por valor) | |
| Huawei P10 Plus | |
| Apple iPhone 7 Plus | |
| Huawei P10 | |
| OnePlus 3T | |
| Samsung Galaxy S8 Plus | |
| LG G6 | |
| Lenovo Moto Z | |
| WebXPRT 2015 - Overall (classificar por valor) | |
| Huawei P10 Plus | |
| Apple iPhone 7 Plus | |
| Huawei P10 | |
| OnePlus 3T | |
| Samsung Galaxy S8 Plus | |
| LG G6 | |
| Lenovo Moto Z | |
| JetStream 1.1 - 1.1 Total (classificar por valor) | |
| Huawei P10 Plus | |
| Apple iPhone 7 Plus | |
| Huawei P10 | |
| OnePlus 3T | |
| Samsung Galaxy S8 Plus | |
| LG G6 | |
| Lenovo Moto Z | |
* ... menor é melhor
| Huawei P10 Plus | Huawei P10 | OnePlus 3T | Samsung Galaxy S8 Plus | LG G6 | Lenovo Moto Z | |
|---|---|---|---|---|---|---|
| AndroBench 3-5 | 0% | -32% | -0% | -18% | -8% | |
| Sequential Read 256KB (MB/s) | 733 | 738 1% | 436.4 -40% | 788 8% | 428.7 -42% | 439.7 -40% |
| Sequential Write 256KB (MB/s) | 182.6 | 189.8 4% | 165.3 -9% | 194.2 6% | 122.8 -33% | 168.3 -8% |
| Random Read 4KB (MB/s) | 173.1 | 168.4 -3% | 123.6 -29% | 127.2 -27% | 95.2 -45% | 117.2 -32% |
| Random Write 4KB (MB/s) | 149.8 | 152.3 2% | 74.4 -50% | 15.27 -90% | 16.58 -89% | 74.9 -50% |
| Sequential Read 256KB SDCard (MB/s) | 54 | 54.2 0% | 71.1 32% | 77.6 44% | 78.5 45% | |
| Sequential Write 256KB SDCard (MB/s) | 33.61 | 32.19 -4% | 57.2 70% | 53.3 59% | 45.64 36% |
| Asphalt 8: Airborne | |||
| Configurações | Valor | ||
| high | 30 fps | ||
| very low | 30 fps | ||
| Dead Trigger 2 | |||
| Configurações | Valor | ||
| high | 56 fps | ||
(-) A temperatura máxima no lado superior é 49.1 °C / 120 F, em comparação com a média de 35.3 °C / 96 F , variando de 21.9 a 247 °C para a classe Smartphone.
(±) A parte inferior aquece até um máximo de 44.2 °C / 112 F, em comparação com a média de 34 °C / 93 F
(±) Em uso inativo, a temperatura média para o lado superior é 37.7 °C / 100 F, em comparação com a média do dispositivo de 33 °C / ### class_avg_f### F.
Huawei P10 Plus análise de áudio
(±) | o volume do alto-falante é médio, mas bom (###valor### dB)
Graves 100 - 315Hz
(-) | quase nenhum baixo - em média 17.3% menor que a mediana
(±) | a linearidade dos graves é média (12.4% delta para a frequência anterior)
Médios 400 - 2.000 Hz
(+) | médios equilibrados - apenas 3.1% longe da mediana
(+) | médios são lineares (6.9% delta para frequência anterior)
Altos 2 - 16 kHz
(+) | agudos equilibrados - apenas 1% longe da mediana
(+) | os máximos são lineares (3.9% delta da frequência anterior)
Geral 100 - 16.000 Hz
(±) | a linearidade do som geral é média (16.8% diferença em relação à mediana)
Comparado com a mesma classe
» 9% de todos os dispositivos testados nesta classe foram melhores, 7% semelhantes, 84% piores
» O melhor teve um delta de 11%, a média foi 34%, o pior foi 134%
Comparado com todos os dispositivos testados
» 30% de todos os dispositivos testados foram melhores, 7% semelhantes, 63% piores
» O melhor teve um delta de 4%, a média foi 23%, o pior foi 134%
Huawei P10 análise de áudio
(+) | os alto-falantes podem tocar relativamente alto (###valor### dB)
Graves 100 - 315Hz
(-) | quase nenhum baixo - em média 20.9% menor que a mediana
(±) | a linearidade dos graves é média (12.6% delta para a frequência anterior)
Médios 400 - 2.000 Hz
(+) | médios equilibrados - apenas 4.2% longe da mediana
(+) | médios são lineares (6% delta para frequência anterior)
Altos 2 - 16 kHz
(±) | máximos mais altos - em média 5.4% maior que a mediana
(+) | os máximos são lineares (4.9% delta da frequência anterior)
Geral 100 - 16.000 Hz
(±) | a linearidade do som geral é média (23.6% diferença em relação à mediana)
Comparado com a mesma classe
» 54% de todos os dispositivos testados nesta classe foram melhores, 8% semelhantes, 38% piores
» O melhor teve um delta de 11%, a média foi 34%, o pior foi 134%
Comparado com todos os dispositivos testados
» 71% de todos os dispositivos testados foram melhores, 6% semelhantes, 23% piores
» O melhor teve um delta de 4%, a média foi 23%, o pior foi 134%
Apple iPhone 7 Plus análise de áudio
(±) | o volume do alto-falante é médio, mas bom (###valor### dB)
Graves 100 - 315Hz
(-) | quase nenhum baixo - em média 24.1% menor que a mediana
(±) | a linearidade dos graves é média (7.4% delta para a frequência anterior)
Médios 400 - 2.000 Hz
(+) | médios equilibrados - apenas 4.7% longe da mediana
(±) | a linearidade dos médios é média (7.6% delta para frequência anterior)
Altos 2 - 16 kHz
(+) | agudos equilibrados - apenas 4.3% longe da mediana
(+) | os máximos são lineares (6.9% delta da frequência anterior)
Geral 100 - 16.000 Hz
(±) | a linearidade do som geral é média (22% diferença em relação à mediana)
Comparado com a mesma classe
» 46% de todos os dispositivos testados nesta classe foram melhores, 7% semelhantes, 47% piores
» O melhor teve um delta de 11%, a média foi 34%, o pior foi 134%
Comparado com todos os dispositivos testados
» 64% de todos os dispositivos testados foram melhores, 6% semelhantes, 30% piores
» O melhor teve um delta de 4%, a média foi 23%, o pior foi 134%
| desligado | |
| Ocioso | |
| Carga |
|
Key:
min: | |
| Huawei P10 Plus 3750 mAh | Apple iPhone 7 Plus 2915 mAh | Huawei P10 3200 mAh | OnePlus 3T 3400 mAh | Samsung Galaxy S8 Plus 3500 mAh | LG G6 3300 mAh | Lenovo Moto Z 2600 mAh | |
|---|---|---|---|---|---|---|---|
| Power Consumption | 23% | 15% | 21% | 46% | 30% | 44% | |
| Idle Minimum * (Watt) | 1.03 | 0.77 25% | 0.83 19% | 0.61 41% | 0.68 34% | 0.62 40% | 0.66 36% |
| Idle Average * (Watt) | 2.61 | 2.04 22% | 2.1 20% | 1.77 32% | 1.13 57% | 1.43 45% | 1.01 61% |
| Idle Maximum * (Watt) | 2.83 | 2.24 21% | 2.18 23% | 1.81 36% | 1.16 59% | 1.48 48% | 1.09 61% |
| Load Average * (Watt) | 7.03 | 4.69 33% | 6.57 7% | 6.67 5% | 4.69 33% | 5.52 21% | 3.97 44% |
| Load Maximum * (Watt) | 10.08 | 8.66 14% | 9.32 8% | 10.98 -9% | 5.24 48% | 10.47 -4% | 8.34 17% |
* ... menor é melhor
| Huawei P10 Plus 3750 mAh | Apple iPhone 7 Plus 2915 mAh | Huawei P10 3200 mAh | OnePlus 3T 3400 mAh | Samsung Galaxy S8 Plus 3500 mAh | LG G6 3300 mAh | Lenovo Moto Z 2600 mAh | |
|---|---|---|---|---|---|---|---|
| Duração da bateria | 7% | -1% | 5% | 12% | 12% | 4% | |
| Reader / Idle (h) | 27.6 | 30.6 11% | 25.7 -7% | 23.7 -14% | 26.1 -5% | 29.8 8% | 22.9 -17% |
| H.264 (h) | 12.6 | 13.6 8% | 9.7 -23% | 13.5 7% | 12.4 -2% | 13 3% | 12.1 -4% |
| WiFi v1.3 (h) | 12.7 | 9.8 -23% | 16.1 27% | 8.2 -35% | 12.3 -3% | 11.5 -9% | 6.8 -46% |
| Load (h) | 2.9 | 3.8 31% | 2.9 0% | 4.7 62% | 4.6 59% | 4.2 45% | 5.3 83% |
Pro
Contra
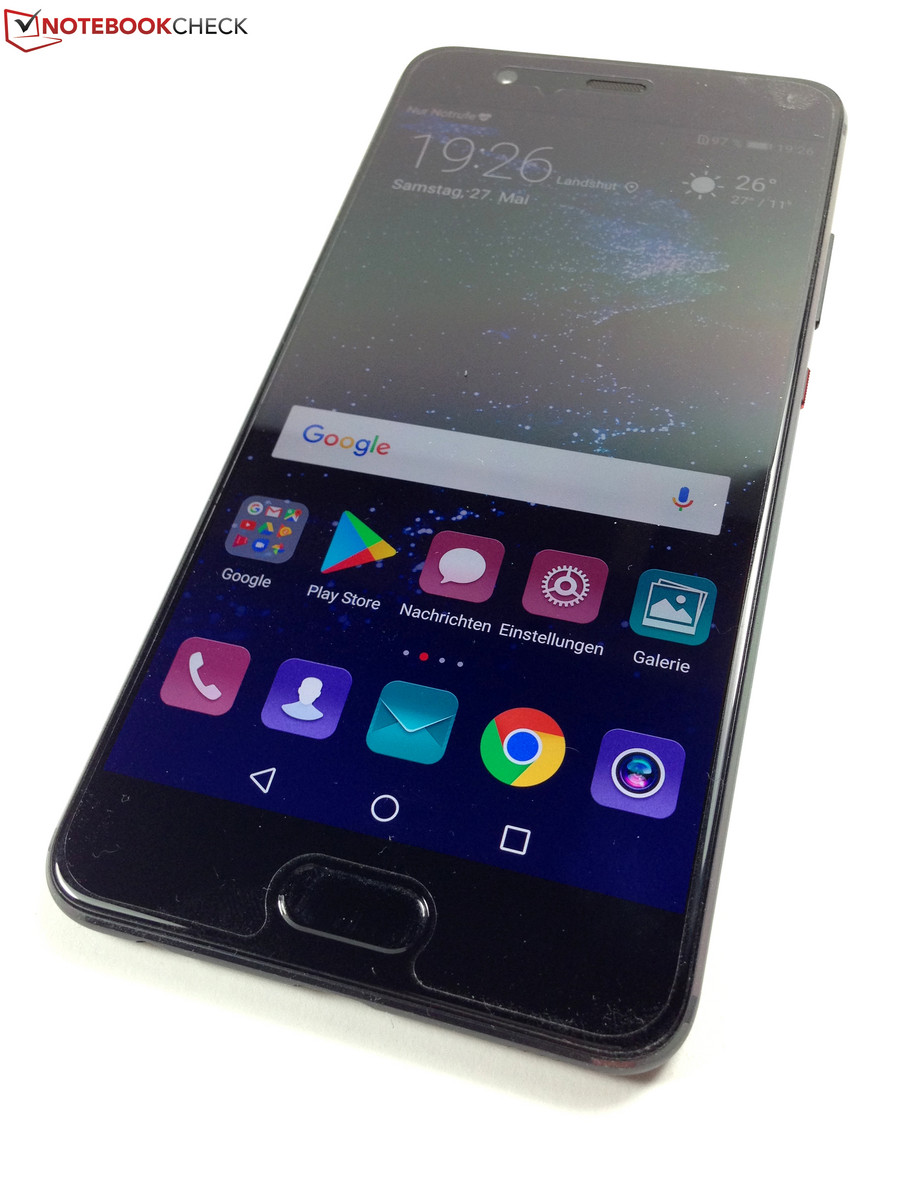
Como com o Huawei P10 de 5,1 polegadas, não há muito que criticar no maior Huawei P10 Plus de 5,5 polegadas. O P10 Plus também vem com abundantes componentes de gama alta - começando com a carcaça impecavelmente construída sobre o armazenamento UFS 2.1 e LTE Cat.12 até o rápido SoC HiSilicon Kirin 960.
Sem dúvida, o P10 Plus da Huawei é um excelente smartphone de gama premium. No entanto, não se destaca decisivamente do Huawei P10 mais barato, apesar da sua configuração superior.
Em comparação com o P10 de 600 Euros (~ $646), ele vem com alguns extras a um preço oficial de 749 euros (~ $700). Ele vem com 6 GB de RAM, 128 GB de armazenamento, uma resolução WQHD em vez de Full HD, uma bateria mais potente e uma câmera Leica dupla ligeiramente melhorada. Essas melhorias tornam o P10 Plus melhor do que o P10 no papel, mas elas não são muito notórias na prática. Além do formato obviamente maior, as diferenças de desempenho são, em última análise, muito insignificantes.
De outra maneira, é um smartphone ainda muito bom que, no entanto, vem com as mesmas deficiências do Huawei P10. Estas incluem o módulo Wi-Fi fraco, o slot microSD lento, o afogamento durante uso intenso, o firmware que consome o armazenamento e o problema de qual memória foi instalada no dispositivo no momento do teste. Provavelmente é um jogo de azar se o comprador obtém um modelo com o veloz armazenamento UFS ou o lento eMMC.
Huawei P10 Plus
- 06/06/2017 v6 (old)
Manuel Masiero