Breve análise do Portátil MSI GT72VR 6RE-015US

| SD Card Reader | |
| average JPG Copy Test (av. of 3 runs) | |
| MSI GT72VR 6RE-015US | |
| Dell XPS 15-9550 i7 | |
| Alienware 17 R3 (A17-9935) | |
| maximum AS SSD Seq Read Test (1GB) | |
| Dell XPS 15-9550 i7 | |
| MSI GT72VR 6RE-015US | |
| Alienware 17 R3 (A17-9935) | |
| Networking | |
| Wi-Fi Client 1m | |
| Wi-Fi Server 1m |
| |||||||||||||||||||||||||
iluminação: 89 %
iluminação com acumulador: 348.7 cd/m²
Contraste: 1080:1 (Preto: 0.323 cd/m²)
ΔE ColorChecker Calman: 4.09 | ∀{0.5-29.43 Ø4.71}
ΔE Greyscale Calman: 2.14 | ∀{0.09-98 Ø4.96}
86.5% sRGB (Argyll 1.6.3 3D)
56.9% AdobeRGB 1998 (Argyll 1.6.3 3D)
63.4% AdobeRGB 1998 (Argyll 3D)
86.7% sRGB (Argyll 3D)
68.3% Display P3 (Argyll 3D)
Gamma: 2.25
CCT: 6885 K
| MSI GT72VR 6RE-015US LG Philips LGD046E, IPS, 17.3", 1920x1080 | Asus G701VO-CS74K IPS, 17.3", 1920x1080 | Acer Predator 17 G9-792-71EF AU Optronics B173ZAN01.0 (AUO109B), IPS, 17.3", 3840x2160 | Alienware 17 R3 (A17-9935) CV69H_173WF4 (LGD0459), IPS, 17.3", 1920x1080 | MSI GT72S 6QF Name: LG Philips LP173WF4-SPF1, ID: LGD0469, IPS, 17.3", 1920x1080 | |
|---|---|---|---|---|---|
| Display | 1% | 33% | -3% | -1% | |
| Display P3 Coverage (%) | 68.3 | 68.8 1% | 86.9 27% | 66.9 -2% | 67.6 -1% |
| sRGB Coverage (%) | 86.7 | 87.7 1% | 100 15% | 83.9 -3% | 86.1 -1% |
| AdobeRGB 1998 Coverage (%) | 63.4 | 64.1 1% | 99.6 57% | 61.4 -3% | 63 -1% |
| Response Times | 5% | -17% | 7% | -20% | |
| Response Time Grey 50% / Grey 80% * (ms) | 34.4 ? | 29.2 ? 15% | 42 ? -22% | 33 ? 4% | 43 ? -25% |
| Response Time Black / White * (ms) | 25.2 ? | 26.4 ? -5% | 28 ? -11% | 23 ? 9% | 29 ? -15% |
| PWM Frequency (Hz) | |||||
| Screen | -9% | -4% | -17% | 1% | |
| Brightness middle (cd/m²) | 348.7 | 368.1 6% | 370 6% | 360 3% | 356.7 2% |
| Brightness (cd/m²) | 327 | 349 7% | 340 4% | 336 3% | 326 0% |
| Brightness Distribution (%) | 89 | 86 -3% | 88 -1% | 90 1% | 85 -4% |
| Black Level * (cd/m²) | 0.323 | 0.365 -13% | 0.42 -30% | 0.44 -36% | 0.282 13% |
| Contrast (:1) | 1080 | 1008 -7% | 881 -18% | 818 -24% | 1265 17% |
| Colorchecker dE 2000 * | 4.09 | 4.16 -2% | 3.56 13% | 4.76 -16% | 4.16 -2% |
| Colorchecker dE 2000 max. * | 9.02 | 8.7 4% | 5.86 35% | 10.8 -20% | |
| Greyscale dE 2000 * | 2.14 | 3.86 -80% | 4.79 -124% | 3.69 -72% | 2.47 -15% |
| Gamma | 2.25 98% | 2.19 100% | 2.31 95% | 2.24 98% | 2.29 96% |
| CCT | 6885 94% | 6892 94% | 6352 102% | 6091 107% | 6860 95% |
| Color Space (Percent of AdobeRGB 1998) (%) | 56.9 | 57.6 1% | 88 55% | 55 -3% | 56 -2% |
| Color Space (Percent of sRGB) (%) | 86.5 | 87.6 1% | 100 16% | 84 -3% | 85 -2% |
| Média Total (Programa/Configurações) | -1% /
-5% | 4% /
1% | -4% /
-11% | -7% /
-3% |
* ... menor é melhor
Exibir tempos de resposta
| ↔ Tempo de resposta preto para branco | ||
|---|---|---|
| 25.2 ms ... ascensão ↗ e queda ↘ combinadas | ↗ 4.8 ms ascensão | 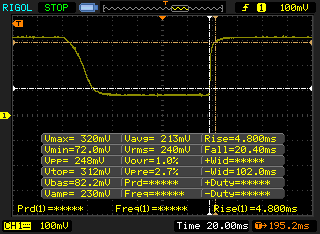 |
| ↘ 20.4 ms queda | ||
| A tela mostra taxas de resposta relativamente lentas em nossos testes e pode ser muito lenta para os jogadores. Em comparação, todos os dispositivos testados variam de 0.1 (mínimo) a 240 (máximo) ms. » 61 % de todos os dispositivos são melhores. Isso significa que o tempo de resposta medido é pior que a média de todos os dispositivos testados (19.8 ms). | ||
| ↔ Tempo de resposta 50% cinza a 80% cinza | ||
| 34.4 ms ... ascensão ↗ e queda ↘ combinadas | ↗ 15.6 ms ascensão | 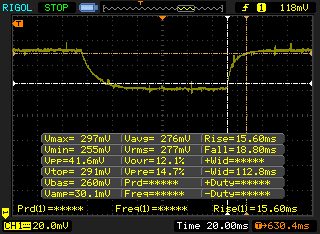 |
| ↘ 18.8 ms queda | ||
| A tela mostra taxas de resposta lentas em nossos testes e será insatisfatória para os jogadores. Em comparação, todos os dispositivos testados variam de 0.165 (mínimo) a 636 (máximo) ms. » 48 % de todos os dispositivos são melhores. Isso significa que o tempo de resposta medido é pior que a média de todos os dispositivos testados (31 ms). | ||
Cintilação da tela / PWM (modulação por largura de pulso)
| Tela tremeluzindo / PWM não detectado | 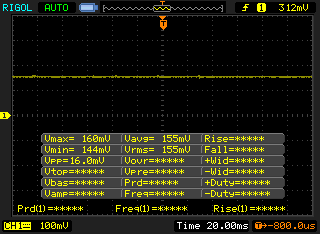 | ||
[pwm_comparison] Em comparação: 52 % de todos os dispositivos testados não usam PWM para escurecer a tela. Se PWM foi detectado, uma média de 7754 (mínimo: 5 - máximo: 343500) Hz foi medida. | |||
| Cinebench R15 | |
| CPU Single 64Bit (classificar por valor) | |
| MSI GT72VR 6RE-015US | |
| DogHouse Systems Mobius SS | |
| Asus G701VO-CS74K | |
| MSI GE62 2QC-468XPL | |
| Toshiba Satellite S70-B-106 | |
| Lenovo ThinkPad P40 Yoga 20GQ-000EUS | |
| CPU Multi 64Bit (classificar por valor) | |
| MSI GT72VR 6RE-015US | |
| DogHouse Systems Mobius SS | |
| Asus G701VO-CS74K | |
| MSI GE62 2QC-468XPL | |
| Toshiba Satellite S70-B-106 | |
| Lenovo ThinkPad P40 Yoga 20GQ-000EUS | |
| Cinebench R11.5 | |
| CPU Single 64Bit (classificar por valor) | |
| MSI GT72VR 6RE-015US | |
| DogHouse Systems Mobius SS | |
| Asus G701VO-CS74K | |
| MSI GE62 2QC-468XPL | |
| Toshiba Satellite S70-B-106 | |
| Lenovo ThinkPad P40 Yoga 20GQ-000EUS | |
| CPU Multi 64Bit (classificar por valor) | |
| MSI GT72VR 6RE-015US | |
| DogHouse Systems Mobius SS | |
| Asus G701VO-CS74K | |
| MSI GE62 2QC-468XPL | |
| Toshiba Satellite S70-B-106 | |
| Lenovo ThinkPad P40 Yoga 20GQ-000EUS | |
| Cinebench R10 | |
| Rendering Multiple CPUs 32Bit (classificar por valor) | |
| MSI GT72VR 6RE-015US | |
| DogHouse Systems Mobius SS | |
| Asus G701VO-CS74K | |
| MSI GE62 2QC-468XPL | |
| Lenovo ThinkPad P40 Yoga 20GQ-000EUS | |
| Rendering Single 32Bit (classificar por valor) | |
| MSI GT72VR 6RE-015US | |
| DogHouse Systems Mobius SS | |
| Asus G701VO-CS74K | |
| MSI GE62 2QC-468XPL | |
| Lenovo ThinkPad P40 Yoga 20GQ-000EUS | |
| wPrime 2.10 - 1024m (classificar por valor) | |
| MSI GT72VR 6RE-015US | |
| DogHouse Systems Mobius SS | |
| Asus G701VO-CS74K | |
| MSI GE62 2QC-468XPL | |
| Lenovo ThinkPad P40 Yoga 20GQ-000EUS | |
| Super Pi Mod 1.5 XS 32M - 32M (classificar por valor) | |
| MSI GT72VR 6RE-015US | |
| DogHouse Systems Mobius SS | |
| Asus G701VO-CS74K | |
| MSI GE62 2QC-468XPL | |
| Lenovo ThinkPad P40 Yoga 20GQ-000EUS | |
* ... menor é melhor
| PCMark 8 | |
| Home Score Accelerated v2 (classificar por valor) | |
| MSI GT72VR 6RE-015US | |
| Asus G701VO-CS74K | |
| Eurocom Sky DLX7 | |
| Alienware 17 R2 | |
| Acer Predator 17 G9-791-75PV | |
| Work Score Accelerated v2 (classificar por valor) | |
| MSI GT72VR 6RE-015US | |
| Asus G701VO-CS74K | |
| Eurocom Sky DLX7 | |
| Alienware 17 R2 | |
| Creative Score Accelerated v2 (classificar por valor) | |
| MSI GT72VR 6RE-015US | |
| Asus G701VO-CS74K | |
| Eurocom Sky DLX7 | |
| Acer Predator 17 G9-791-75PV | |
| PCMark 8 Home Score Accelerated v2 | 4620 pontos | |
| PCMark 8 Creative Score Accelerated v2 | 7636 pontos | |
| PCMark 8 Work Score Accelerated v2 | 5095 pontos | |
Ajuda | ||
| MSI GT72VR 6RE-015US SanDisk SD8SNAT256G1122 | Asus G701VO-CS74K 2x Samsung SM951 MZVPV512HDGL (RAID 0) | Acer Predator 17 G9-791-75PV Lite-On CV1-8B256 | Alienware 17 R3 (A17-9935) Samsung PM951 NVMe 512 GB | MSI GT72S 6QE-071PL 2x Toshiba HG6 THNSNJ128G8NU (RAID 0) | |
|---|---|---|---|---|---|
| CrystalDiskMark 3.0 | 333% | 9% | 91% | 214% | |
| Read Seq (MB/s) | 529 | 3067 480% | 484.5 -8% | 1263 139% | 3047 476% |
| Write Seq (MB/s) | 338.5 | 2434 619% | 357.8 6% | 587 73% | 979 189% |
| Read 512 (MB/s) | 288.9 | 1582 448% | 344.1 19% | 569 97% | 1599 453% |
| Write 512 (MB/s) | 319.2 | 2255 606% | 353.1 11% | 265.2 -17% | 1002 214% |
| Read 4k (MB/s) | 23.1 | 47.25 105% | 20.8 -10% | 42.59 84% | 39.91 73% |
| Write 4k (MB/s) | 99.4 | 110.7 11% | 42.65 -57% | 140.6 41% | 104.7 5% |
| Read 4k QD32 (MB/s) | 147.5 | 584 296% | 275.8 87% | 610 314% | 535 263% |
| Write 4k QD32 (MB/s) | 236.9 | 463.3 96% | 300.6 27% | 232.8 -2% | 325.4 37% |

| 3DMark 11 | |
| 1280x720 Performance GPU (classificar por valor) | |
| MSI GT72VR 6RE-015US | |
| MSI GT80-2QES32SR311BW | |
| Aorus X7 Pro v5 | |
| Asus G701VO-CS74K | |
| MSI GT72S 6QE-071PL | |
| Asus Strix GL502VT-DS74 | |
| MSI GL62-6QFi781H11 | |
| 1280x720 Performance Combined (classificar por valor) | |
| MSI GT72VR 6RE-015US | |
| MSI GT80-2QES32SR311BW | |
| Aorus X7 Pro v5 | |
| Asus G701VO-CS74K | |
| MSI GT72S 6QE-071PL | |
| Asus Strix GL502VT-DS74 | |
| MSI GL62-6QFi781H11 | |
| 3DMark | |
| 1920x1080 Fire Strike Graphics (classificar por valor) | |
| MSI GT72VR 6RE-015US | |
| MSI GT80-2QES32SR311BW | |
| Aorus X7 Pro v5 | |
| Asus G701VO-CS74K | |
| MSI GT72S 6QE-071PL | |
| Asus Strix GL502VT-DS74 | |
| MSI GL62-6QFi781H11 | |
| 3840x2160 Fire Strike Ultra Graphics (classificar por valor) | |
| MSI GT72VR 6RE-015US | |
| Asus G701VO-CS74K | |
| Fire Strike Extreme Graphics (classificar por valor) | |
| MSI GT72VR 6RE-015US | |
| Asus G701VO-CS74K | |
| Asus Strix GL502VT-DS74 | |
| 3DMark 11 Performance | 11913 pontos | |
| 3DMark Ice Storm Standard Score | 124194 pontos | |
| 3DMark Cloud Gate Standard Score | 25315 pontos | |
| 3DMark Fire Strike Score | 13239 pontos | |
| 3DMark Fire Strike Extreme Score | 7386 pontos | |
Ajuda | ||
| BioShock Infinite - 1920x1080 Ultra Preset, DX11 (DDOF) (classificar por valor) | |
| MSI GT72VR 6RE-015US | |
| MSI GT80-2QES32SR311BW | |
| Asus G701VO-CS74K | |
| Aorus X5S v5 | |
| Asus Strix GL502VT-DS74 | |
| Thief - 1920x1080 Very High Preset AA:FXAA & High SS AF:8x (classificar por valor) | |
| MSI GT72VR 6RE-015US | |
| MSI GT80-2QES32SR311BW | |
| Asus G701VO-CS74K | |
| Aorus X5S v5 | |
| Asus Strix GL502VT-DS74 | |
| Batman: Arkham Knight - 1920x1080 High / On AA:SM AF:16x (classificar por valor) | |
| MSI GT72VR 6RE-015US | |
| Asus G701VO-CS74K | |
| Aorus X5S v5 | |
| Aorus X7 Pro v5 | |
| Asus Strix GL502VT-DS74 | |
| Fallout 4 - 1920x1080 Ultra Preset AA:T AF:16x (classificar por valor) | |
| MSI GT72VR 6RE-015US | |
| Asus G701VO-CS74K | |
| Aorus X5S v5 | |
| Aorus X7 Pro v5 | |
| Asus Strix GL502VT-DS74 | |
| Rise of the Tomb Raider - 1920x1080 Very High Preset AA:FX AF:16x (classificar por valor) | |
| MSI GT72VR 6RE-015US | |
| Asus G701VO-CS74K | |
| Aorus X5S v5 | |
| Aorus X7 Pro v5 | |
| Asus Strix GL502VT-DS74 | |
| Doom - 1920x1080 Ultra Preset AA:SM (classificar por valor) | |
| MSI GT72VR 6RE-015US | |
| Asus G701VO-CS74K | |
| Overwatch - 1920x1080 Epic (Render Scale 100 %) AA:SM AF:16x (classificar por valor) | |
| MSI GT72VR 6RE-015US | |
| Asus G701VO-CS74K | |
| baixo | média | alto | ultra | |
|---|---|---|---|---|
| Guild Wars 2 (2012) | 54.7 | |||
| StarCraft II: Heart of the Swarm (2013) | 124.4 | |||
| BioShock Infinite (2013) | 129.5 | |||
| Thief (2014) | 78 | |||
| Batman: Arkham Knight (2015) | 79 | |||
| Metal Gear Solid V (2015) | 60 | |||
| Fallout 4 (2015) | 100.9 | |||
| Rise of the Tomb Raider (2016) | 92.3 | |||
| Need for Speed 2016 (2016) | 142.9 | 128.9 | 104 | 100.3 |
| Doom (2016) | 101.6 | |||
| Overwatch (2016) | 151.7 | |||
| Mirror's Edge Catalyst (2016) | 176 | 137.6 | 117.3 | 92.1 |
Barulho
| Ocioso |
| 32.4 / 32.4 / 32.4 dB |
| Carga |
| 39.4 / 52 dB |
 | ||
30 dB silencioso 40 dB(A) audível 50 dB(A) ruidosamente alto |
||
min: | ||
| MSI GT72VR 6RE-015US GeForce GTX 1070 Mobile, 6700HQ, SanDisk SD8SNAT256G1122 | Asus G701VO-CS74K GeForce GTX 980 (Laptop), 6820HK, 2x Samsung SM951 MZVPV512HDGL (RAID 0) | Acer Predator 17 G9-792-71EF GeForce GTX 980M, 6700HQ, Samsung SSD PM871 MZNLN512HCJH | Alienware 17 R3 (A17-9935) GeForce GTX 980M, 6700HQ, Samsung PM951 NVMe 512 GB | MSI GT72S 6QF GeForce GTX 980 (Laptop), 6820HK, 2x Micron M600 MTFDDAV128MBF NVMe (RAID 0) | |
|---|---|---|---|---|---|
| Noise | 1% | -1% | 1% | -4% | |
| desligado / ambiente * (dB) | 28.9 | 29.1 -1% | 30 -4% | 30 -4% | |
| Idle Minimum * (dB) | 32.4 | 29.1 10% | 31 4% | 31 4% | 33.1 -2% |
| Idle Average * (dB) | 32.4 | 31.9 2% | 32 1% | 32 1% | 33.3 -3% |
| Idle Maximum * (dB) | 32.4 | 31.9 2% | 37 -14% | 33 -2% | 37 -14% |
| Load Average * (dB) | 39.4 | 46 -17% | 40 -2% | 38 4% | 39 1% |
| Load Maximum * (dB) | 52 | 47.5 9% | 48 8% | 50 4% | 52.2 -0% |
* ... menor é melhor
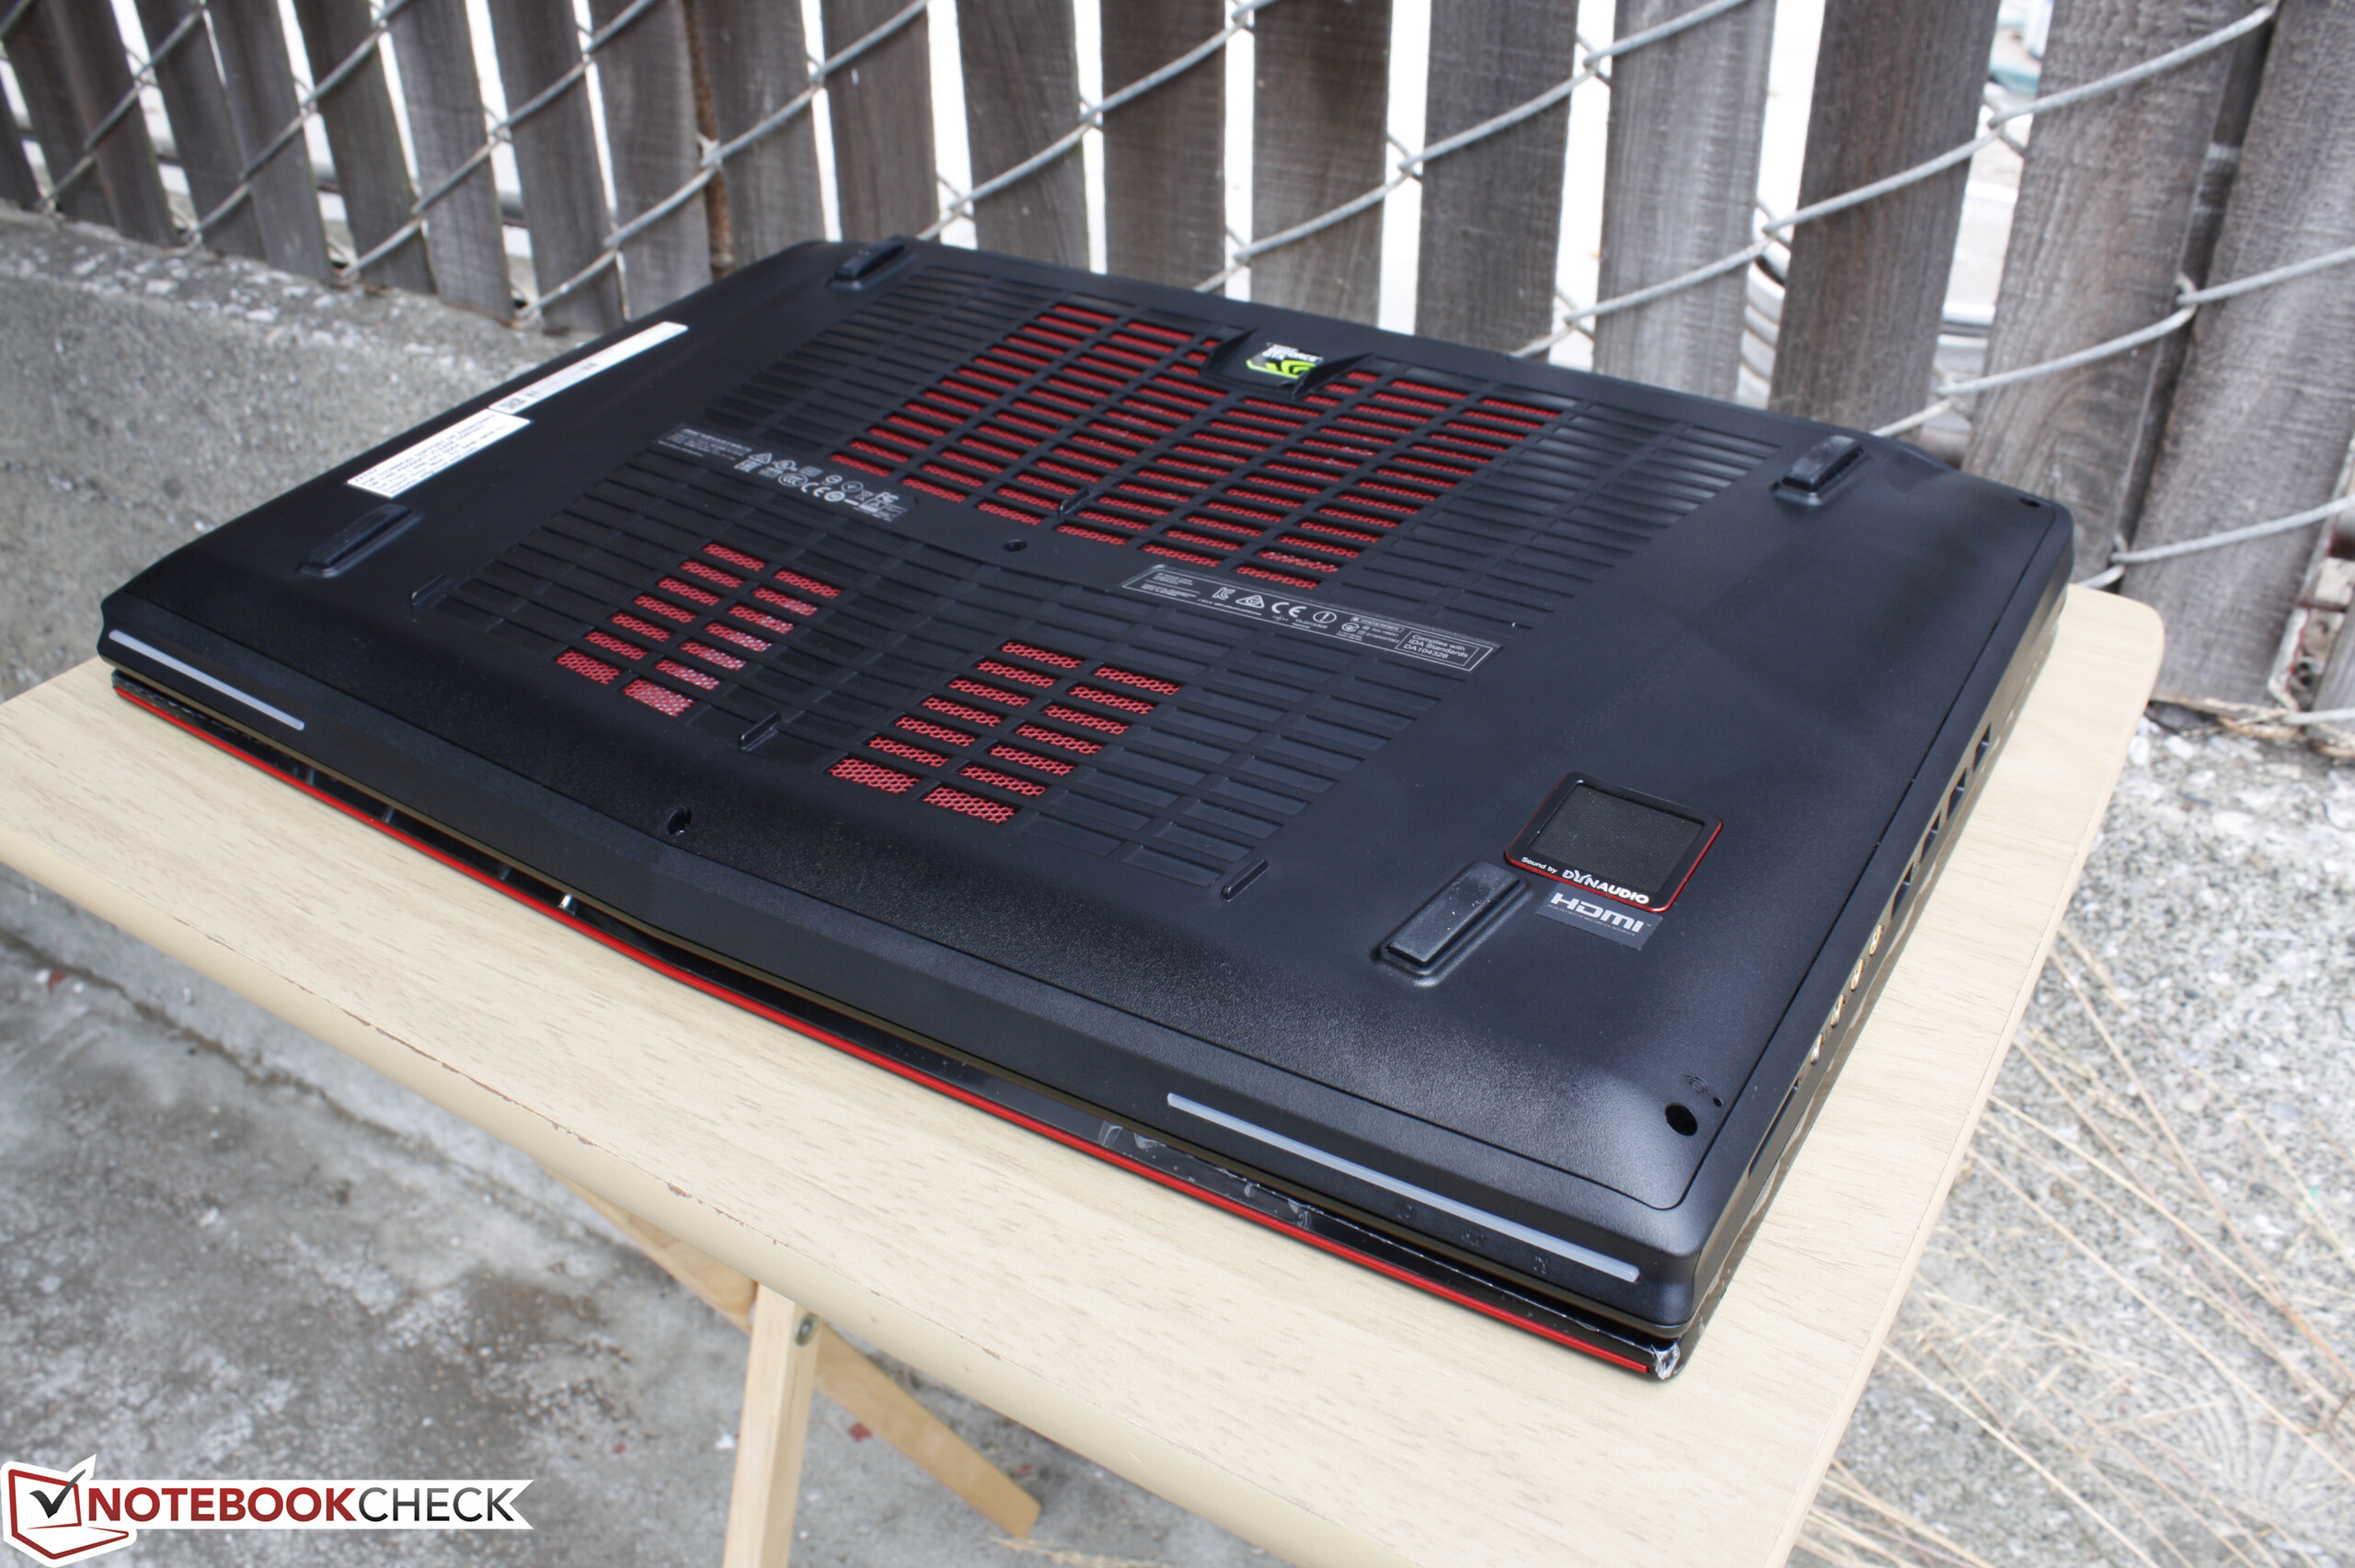
(±) A temperatura máxima no lado superior é 40.6 °C / 105 F, em comparação com a média de 40.4 °C / 105 F , variando de 21.2 a 68.8 °C para a classe Gaming.
(-) A parte inferior aquece até um máximo de 59.4 °C / 139 F, em comparação com a média de 43.2 °C / 110 F
(+) Em uso inativo, a temperatura média para o lado superior é 25.7 °C / 78 F, em comparação com a média do dispositivo de 33.9 °C / ### class_avg_f### F.
(+) Os apoios para as mãos e o touchpad são mais frios que a temperatura da pele, com um máximo de 24 °C / 75.2 F e, portanto, são frios ao toque.
(+) A temperatura média da área do apoio para as mãos de dispositivos semelhantes foi 28.8 °C / 83.8 F (+4.8 °C / 8.6 F).
MSI GT72VR 6RE-015US análise de áudio
(-) | alto-falantes não muito altos (###valor### dB)
Analysis not possible as minimum curve is missing or too high
Apple MacBook 12 (Early 2016) 1.1 GHz análise de áudio
(+) | os alto-falantes podem tocar relativamente alto (###valor### dB)
Graves 100 - 315Hz
(±) | graves reduzidos - em média 11.3% menor que a mediana
(±) | a linearidade dos graves é média (14.2% delta para a frequência anterior)
Médios 400 - 2.000 Hz
(+) | médios equilibrados - apenas 2.4% longe da mediana
(+) | médios são lineares (5.5% delta para frequência anterior)
Altos 2 - 16 kHz
(+) | agudos equilibrados - apenas 2% longe da mediana
(+) | os máximos são lineares (4.5% delta da frequência anterior)
Geral 100 - 16.000 Hz
(+) | o som geral é linear (10.2% diferença em relação à mediana)
Comparado com a mesma classe
» 7% de todos os dispositivos testados nesta classe foram melhores, 2% semelhantes, 90% piores
» O melhor teve um delta de 5%, a média foi 18%, o pior foi 53%
Comparado com todos os dispositivos testados
» 5% de todos os dispositivos testados foram melhores, 1% semelhantes, 94% piores
» O melhor teve um delta de 4%, a média foi 23%, o pior foi 134%
Schenker F516 Flex análise de áudio
(-) | alto-falantes não muito altos (###valor### dB)
Analysis not possible as minimum curve is missing or too high
| desligado | |
| Ocioso | |
| Carga |
|
Key:
min: | |
| MSI GT72VR 6RE-015US 6700HQ, GeForce GTX 1070 Mobile, SanDisk SD8SNAT256G1122, IPS, 1920x1080, 17.3" | Asus G701VO-CS74K 6820HK, GeForce GTX 980 (Laptop), 2x Samsung SM951 MZVPV512HDGL (RAID 0), IPS, 1920x1080, 17.3" | Acer Predator 17 G9-792-71EF 6700HQ, GeForce GTX 980M, Samsung SSD PM871 MZNLN512HCJH, IPS, 3840x2160, 17.3" | Alienware 17 R3 (A17-9935) 6700HQ, GeForce GTX 980M, Samsung PM951 NVMe 512 GB, IPS, 1920x1080, 17.3" | MSI GT72S 6QE-071PL 6820HK, GeForce GTX 980M, 2x Toshiba HG6 THNSNJ128G8NU (RAID 0), IPS, 1920x1080, 17.3" | |
|---|---|---|---|---|---|
| Power Consumption | -9% | 18% | 28% | -6% | |
| Idle Minimum * (Watt) | 22.3 | 28.2 -26% | 14 37% | 12 46% | 14.5 35% |
| Idle Average * (Watt) | 27.3 | 32 -17% | 24 12% | 18 34% | 28.3 -4% |
| Idle Maximum * (Watt) | 30 | 32.6 -9% | 32 -7% | 26 13% | 44 -47% |
| Load Average * (Watt) | 152.2 | 162.2 -7% | 108 29% | 95 38% | 165.5 -9% |
| Load Maximum * (Watt) | 204.2 | 173.5 15% | 164 20% | 188 8% | 214.8 -5% |
* ... menor é melhor
| MSI GT72VR 6RE-015US 6700HQ, GeForce GTX 1070 Mobile, 83 Wh | Asus G701VO-CS74K 6820HK, GeForce GTX 980 (Laptop), 93 Wh | Acer Predator 17 G9-792-71EF 6700HQ, GeForce GTX 980M, Wh | Alienware 17 R3 (A17-9935) 6700HQ, GeForce GTX 980M, 92 Wh | MSI GT72S 6QF 6820HK, GeForce GTX 980 (Laptop), 83 Wh | Eurocom Sky DLX7 6700K, GeForce GTX 980 (Laptop), 82 Wh | |
|---|---|---|---|---|---|---|
| Duração da bateria | -9% | 38% | 87% | 20% | -30% | |
| Reader / Idle (h) | 5.4 | 4 -26% | 8.8 63% | 12.6 133% | 6.5 20% | 2.6 -52% |
| WiFi v1.3 (h) | 3.7 | 3.4 -8% | 5.1 38% | 7.4 100% | 4.9 32% | 2.3 -38% |
| Load (h) | 1.4 | 1.5 7% | 1.6 14% | 1.8 29% | 1.5 7% | 1.4 0% |
Pro
Contra

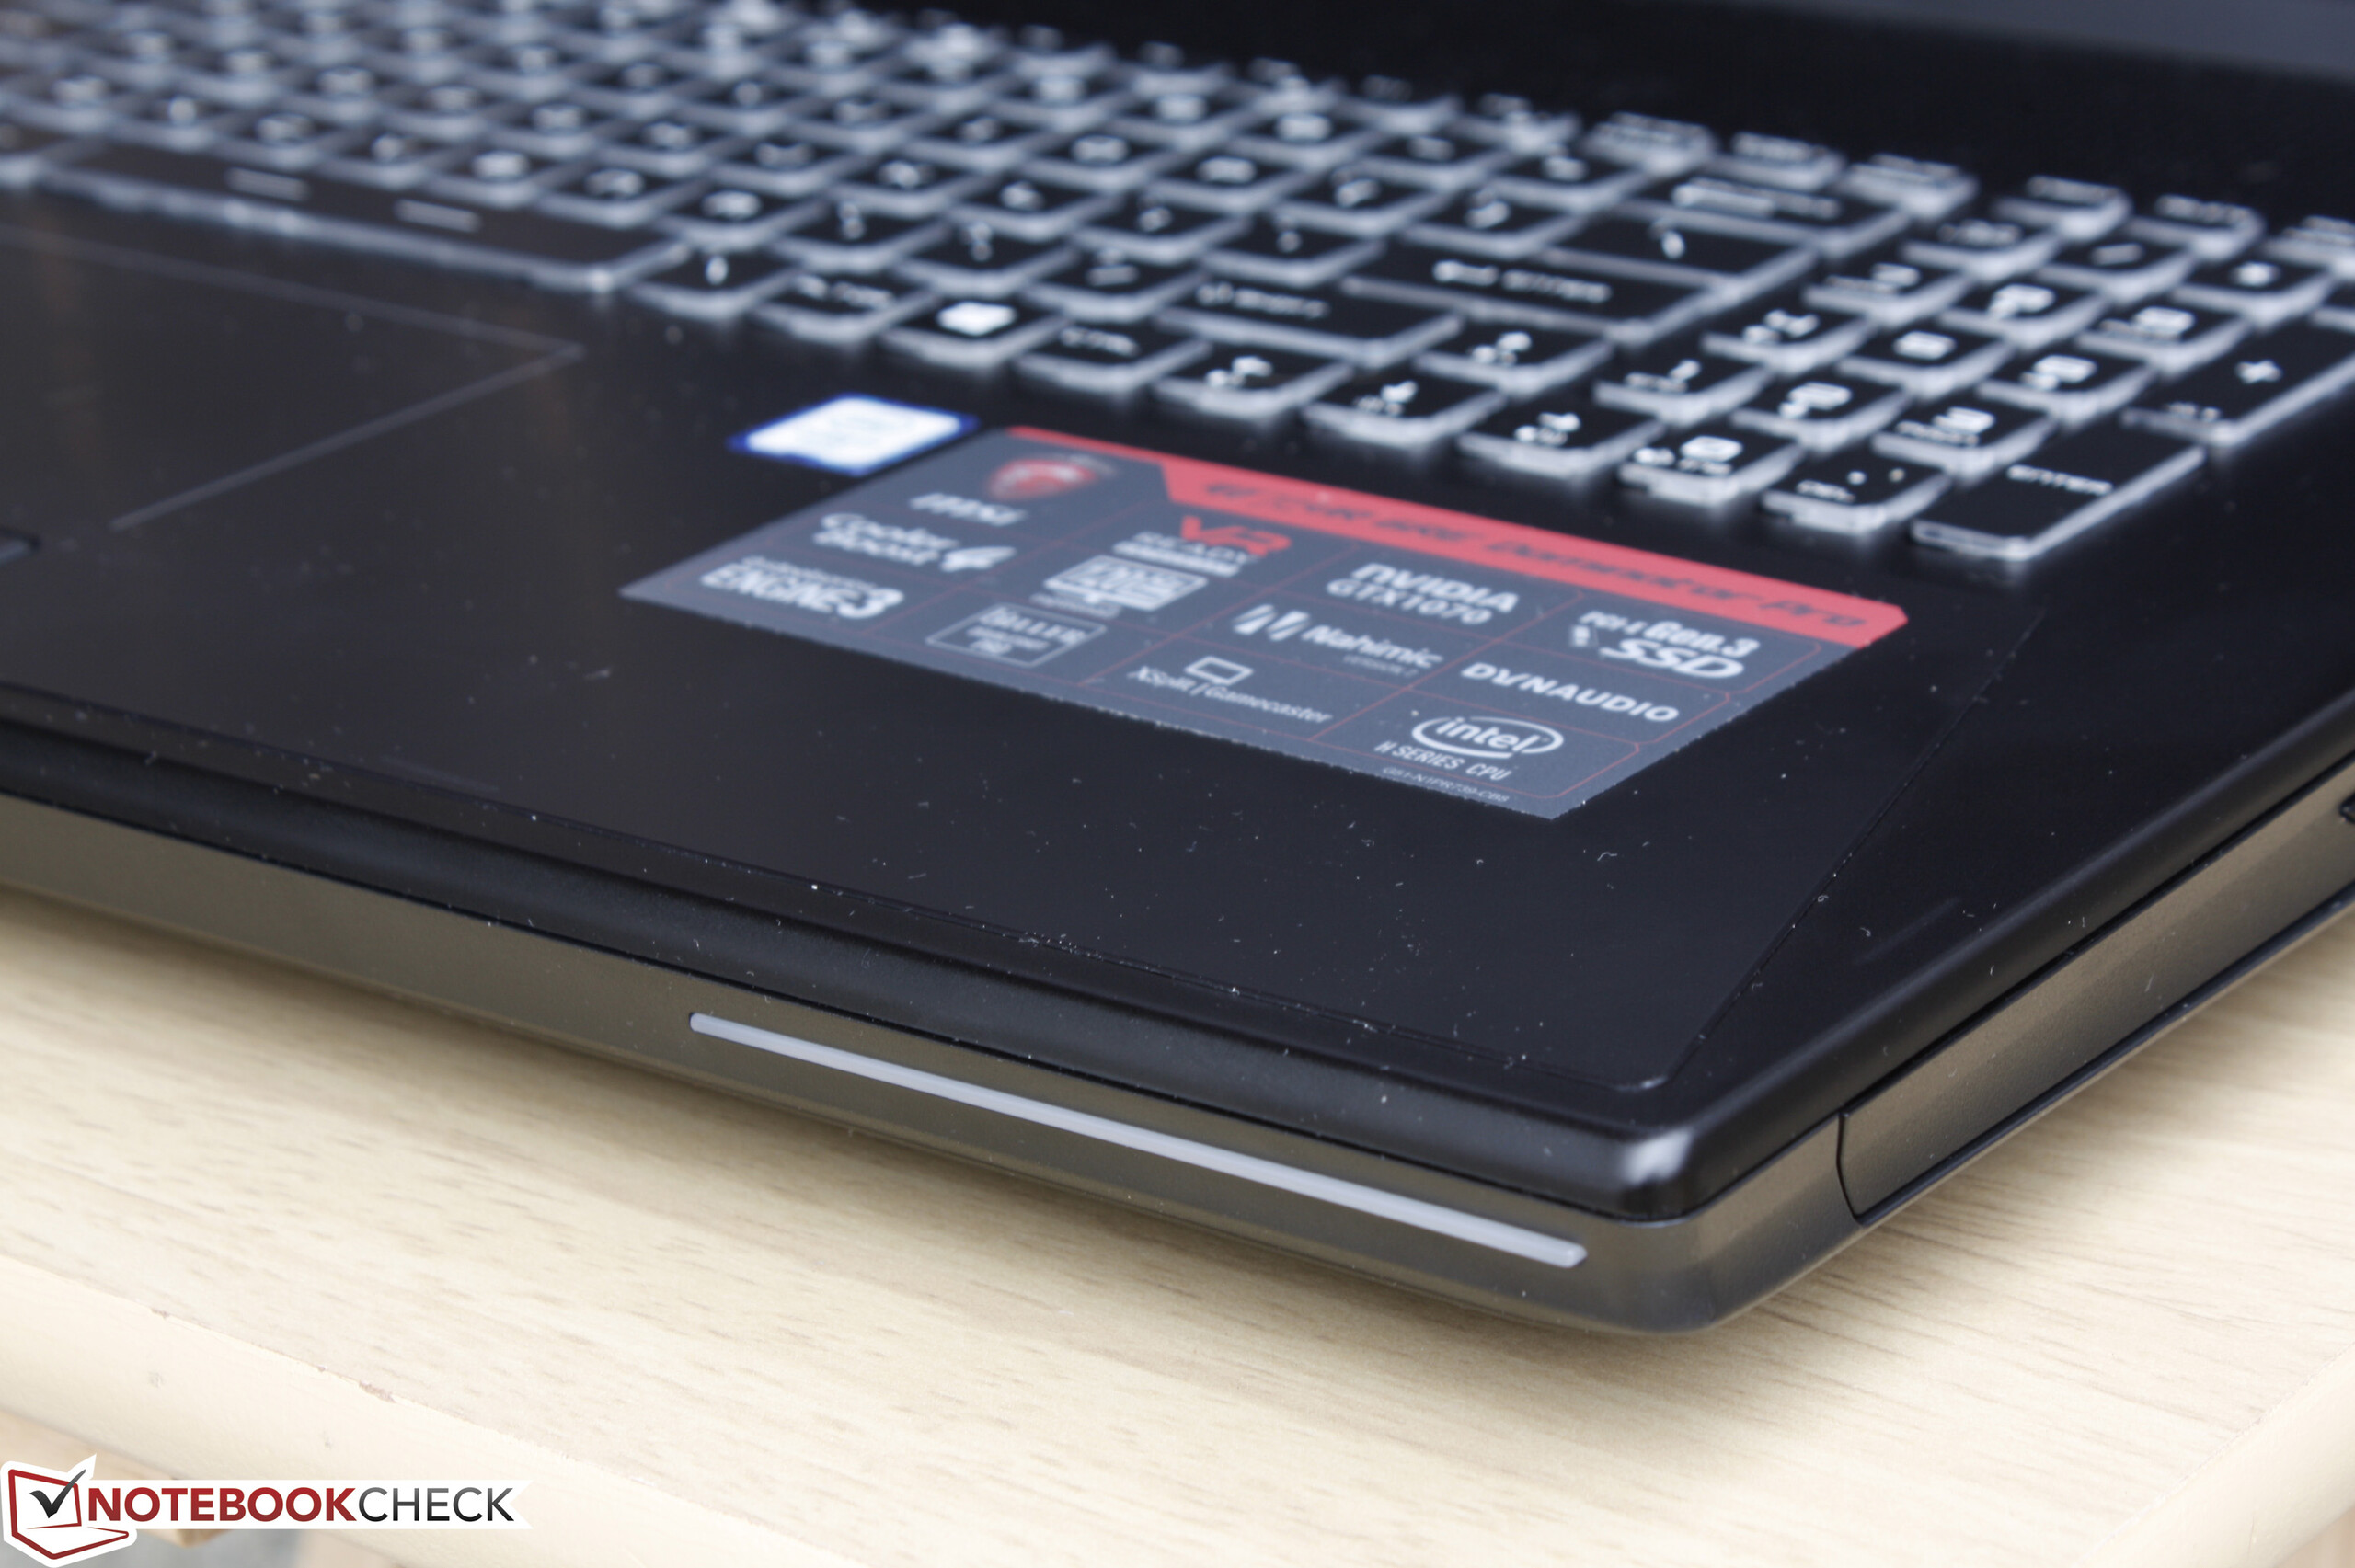
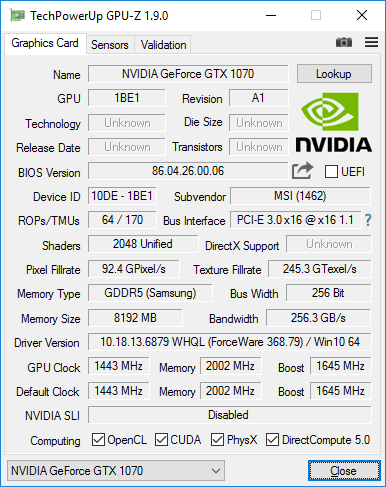
A estrela do show aqui na GPU Pascal GTX 1070. A série Maxwell móvel apenas arranhou a superfície dos jogos 4K, apesar do fato de que muitos fabricantes estiveram empurrando 4K para os portáteis de jogos que evidentemente não conseguiam lidar com a maioria dos títulos em tais resoluções nativas tão altas. O avanço do desempenho sobre a GTX 970M é tão grande que faz considerar muito pular a configuração de 1080p e ir direto para a opção 4K UHD com G-Sync. Embora não estamos certos de como a taxa de atualização do painel de maior resolução se compara com a configuração de 1080p, vamos testar uma SKU GT72VR de gama superior no futuro, para fornecer esses dados. Combinar Pascal com um painel 4K faz muito mais sentido prático ir para frente.
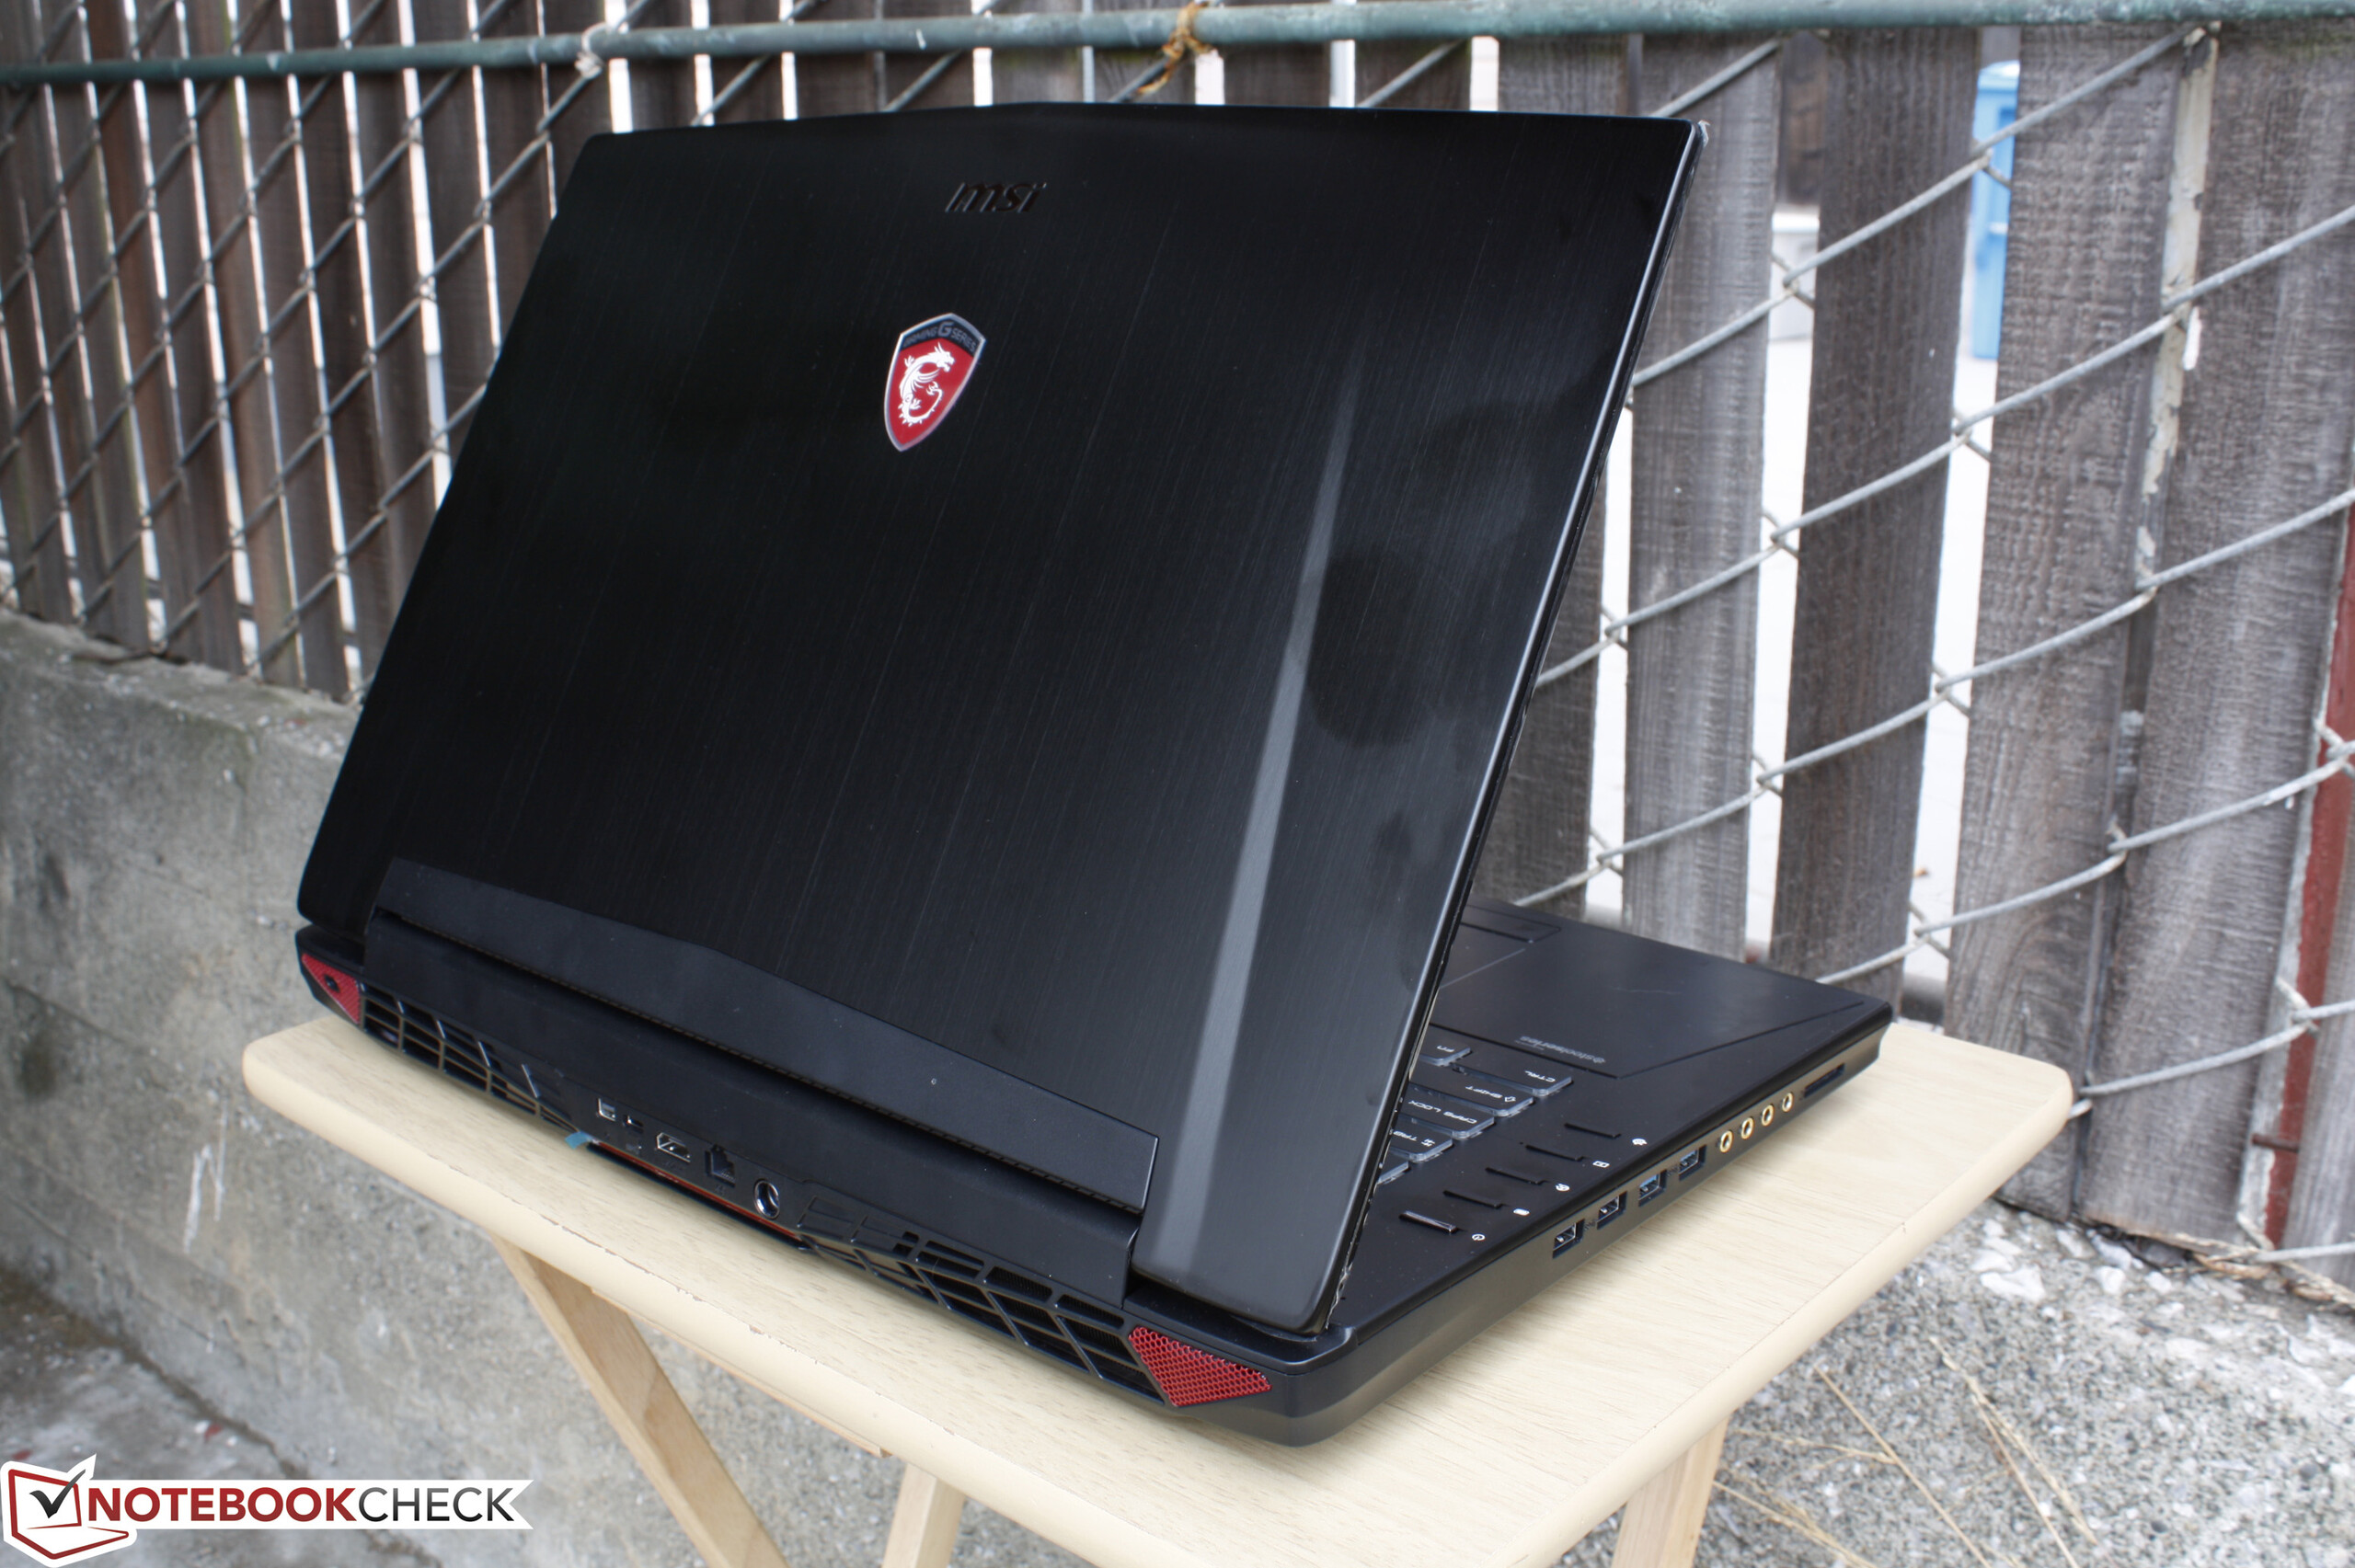
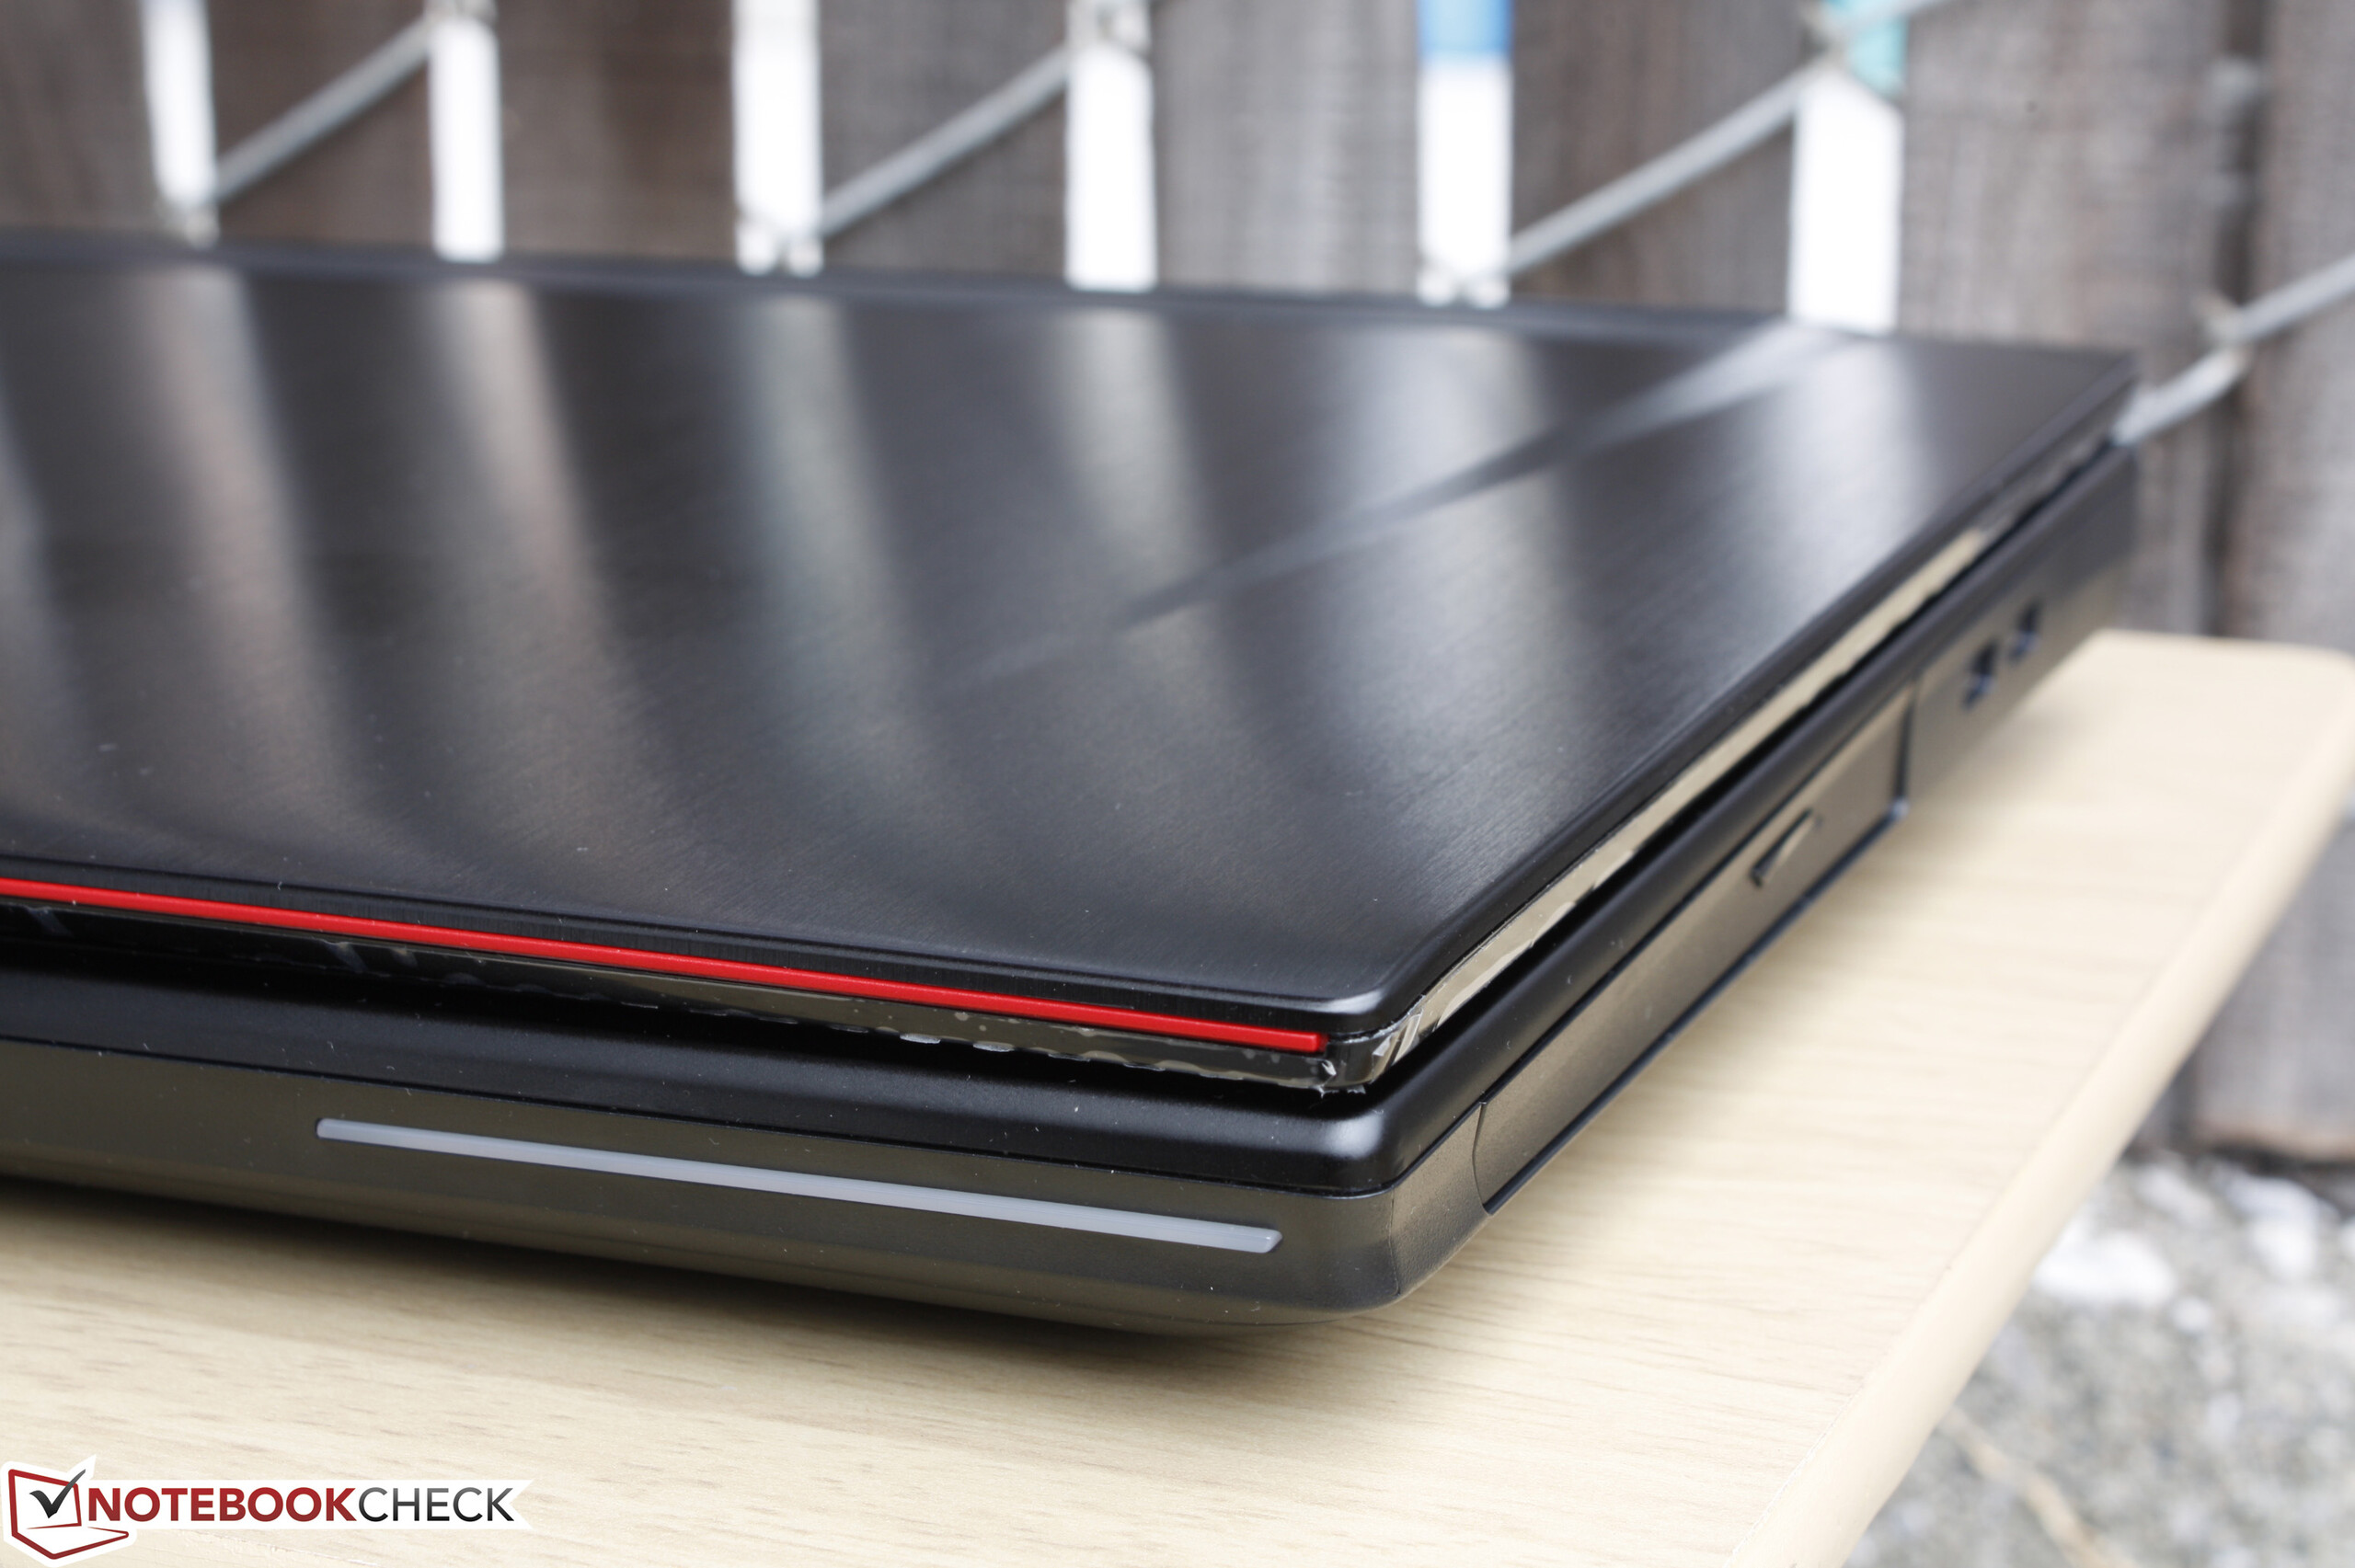
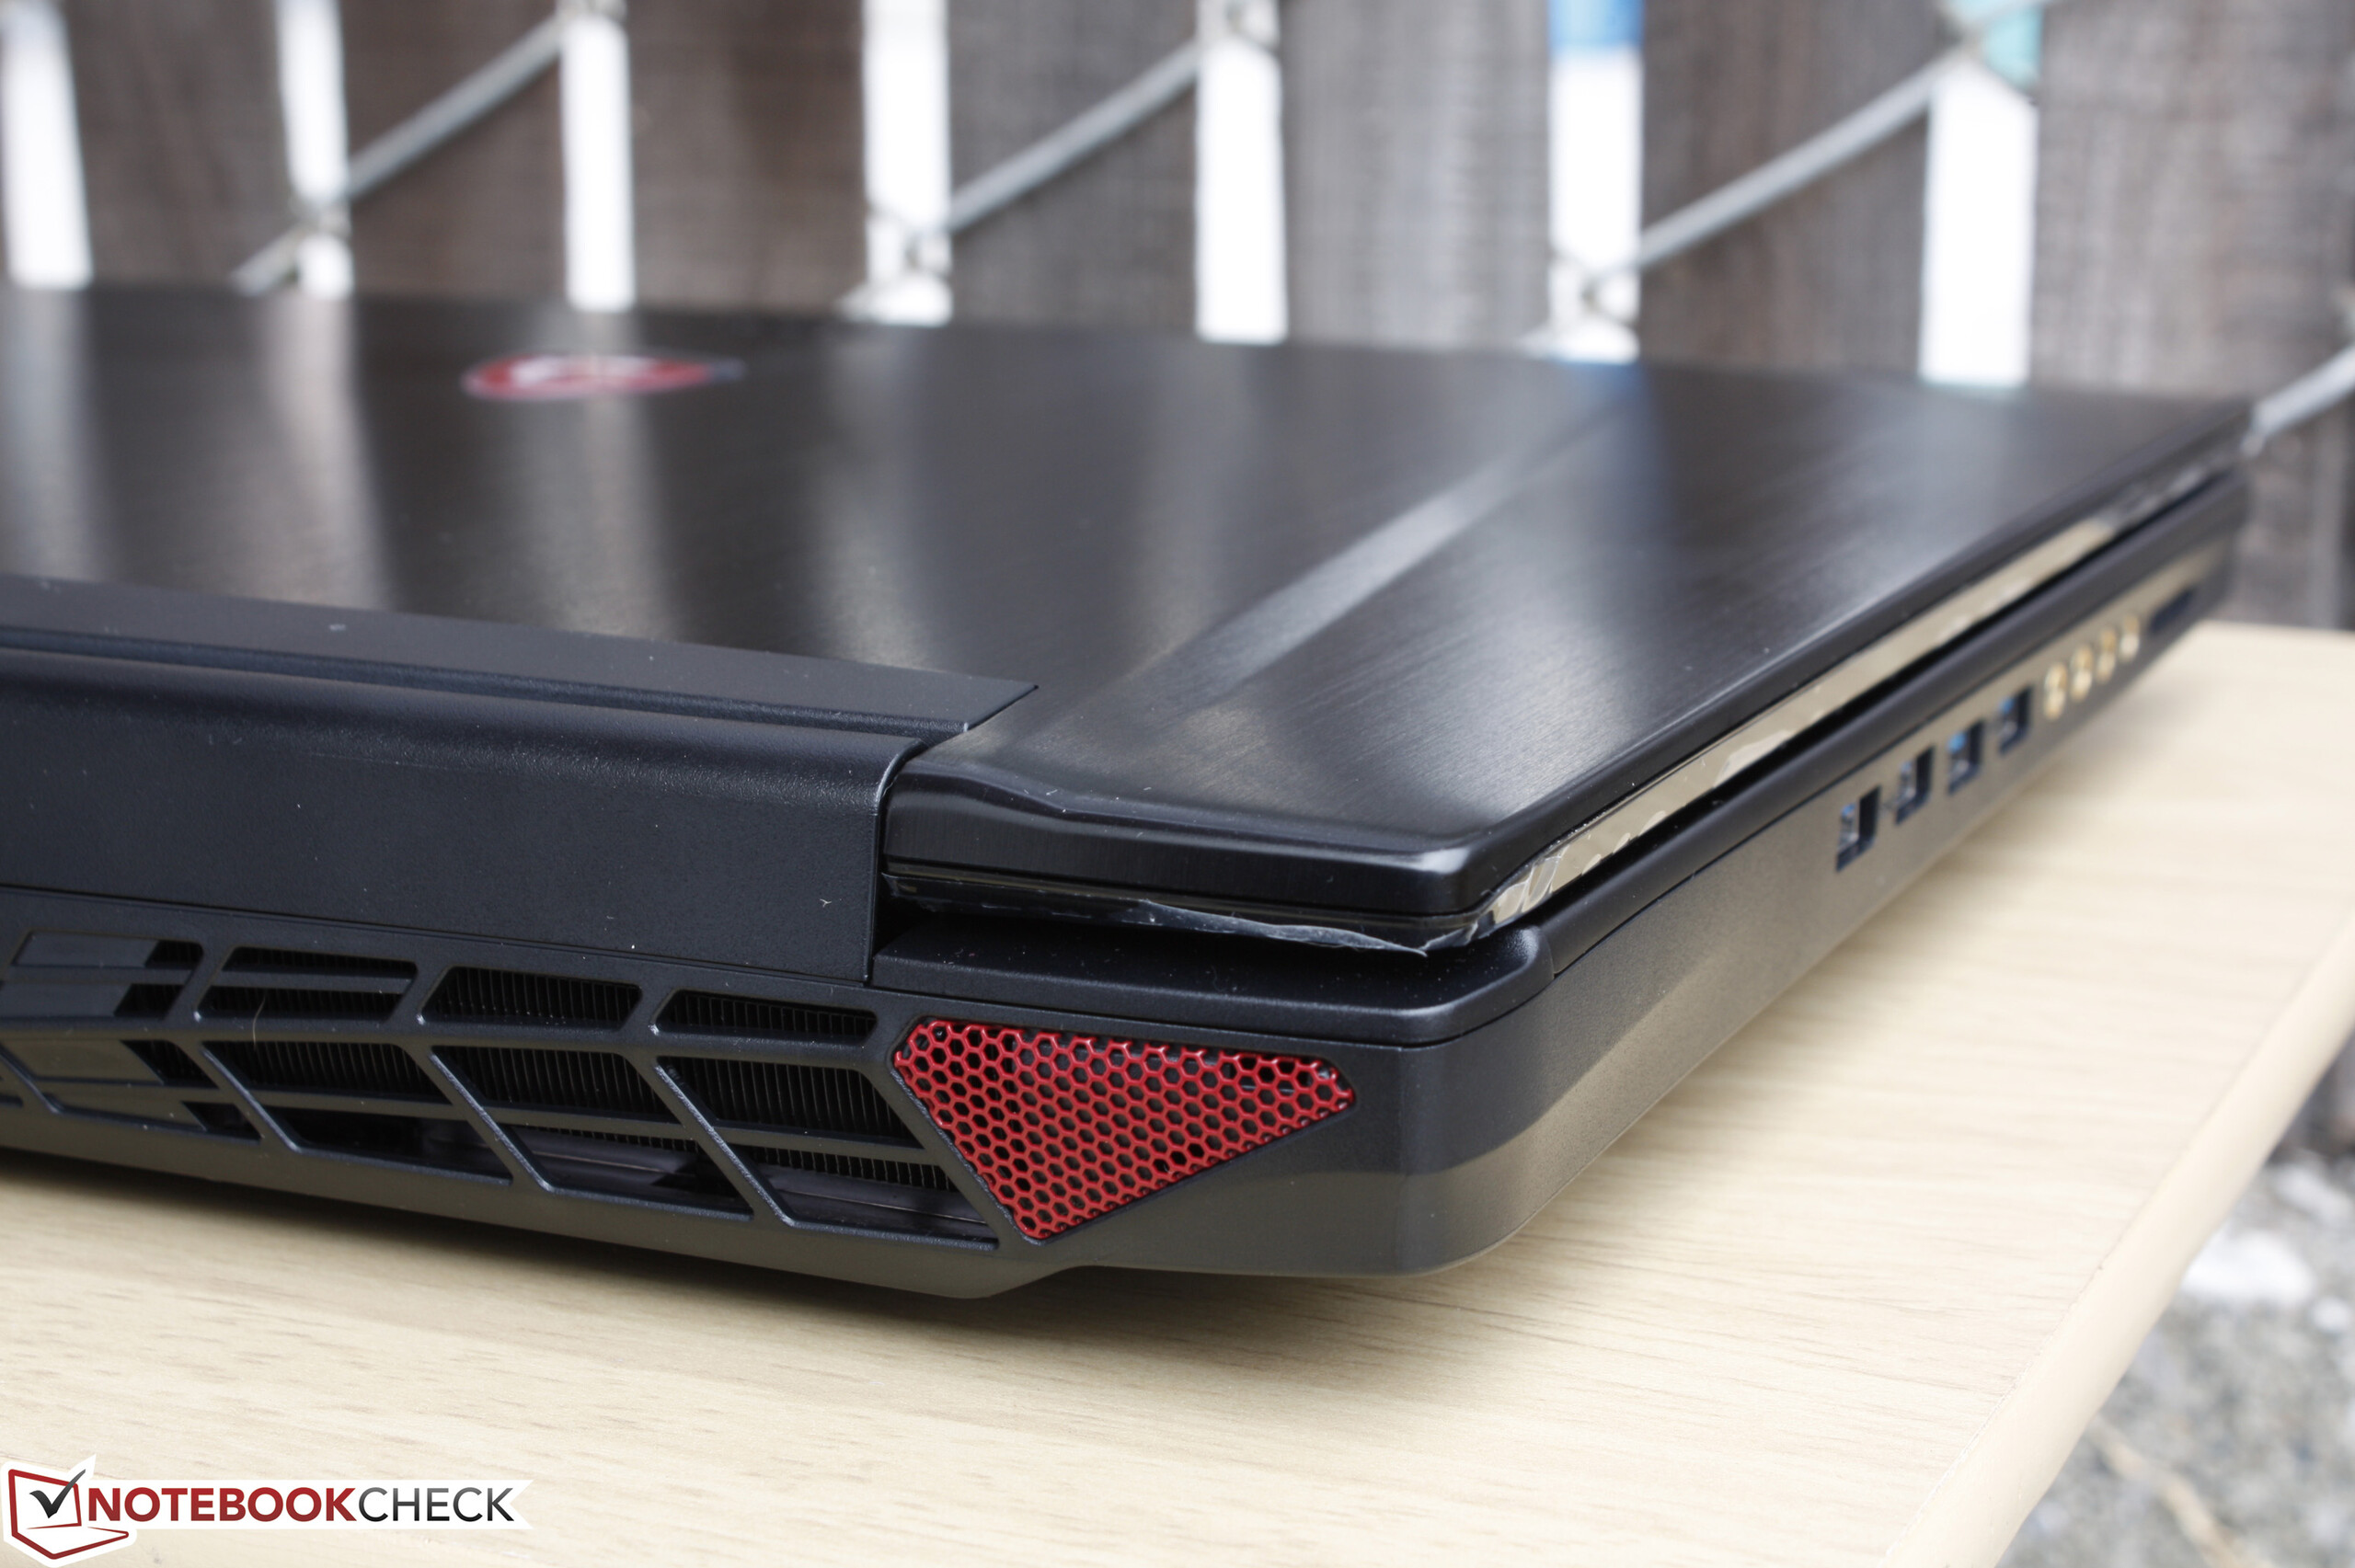
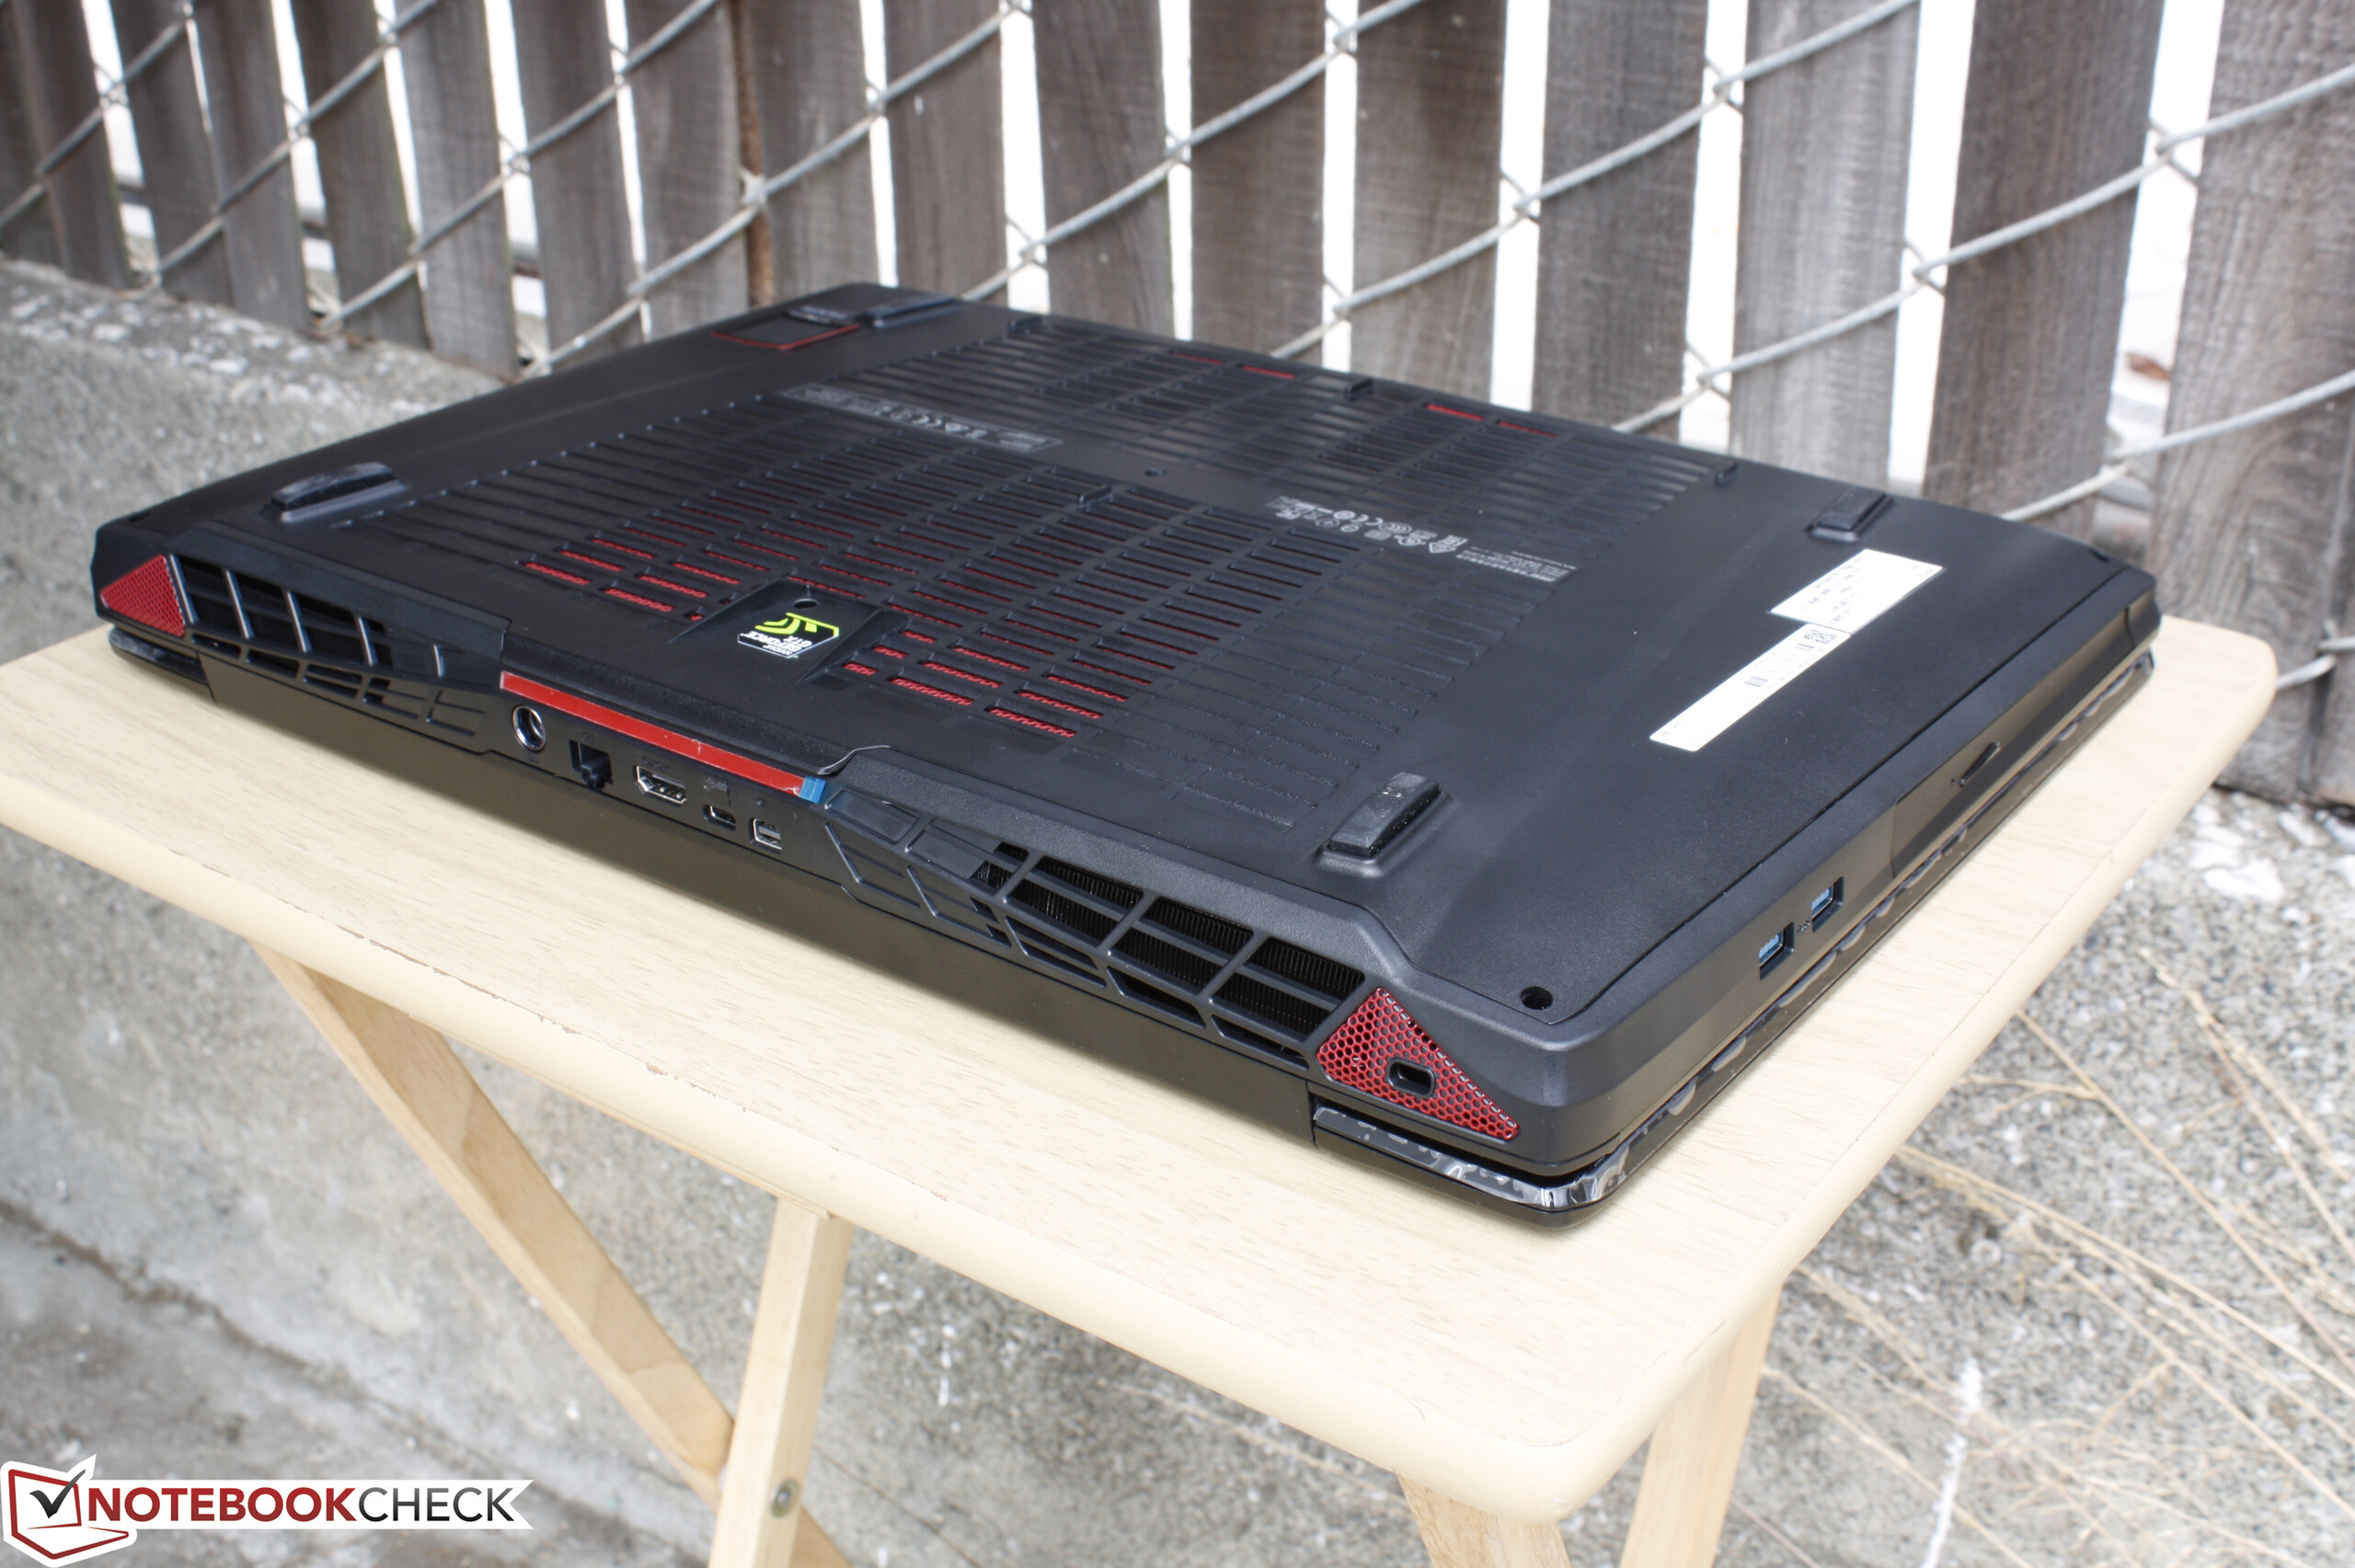
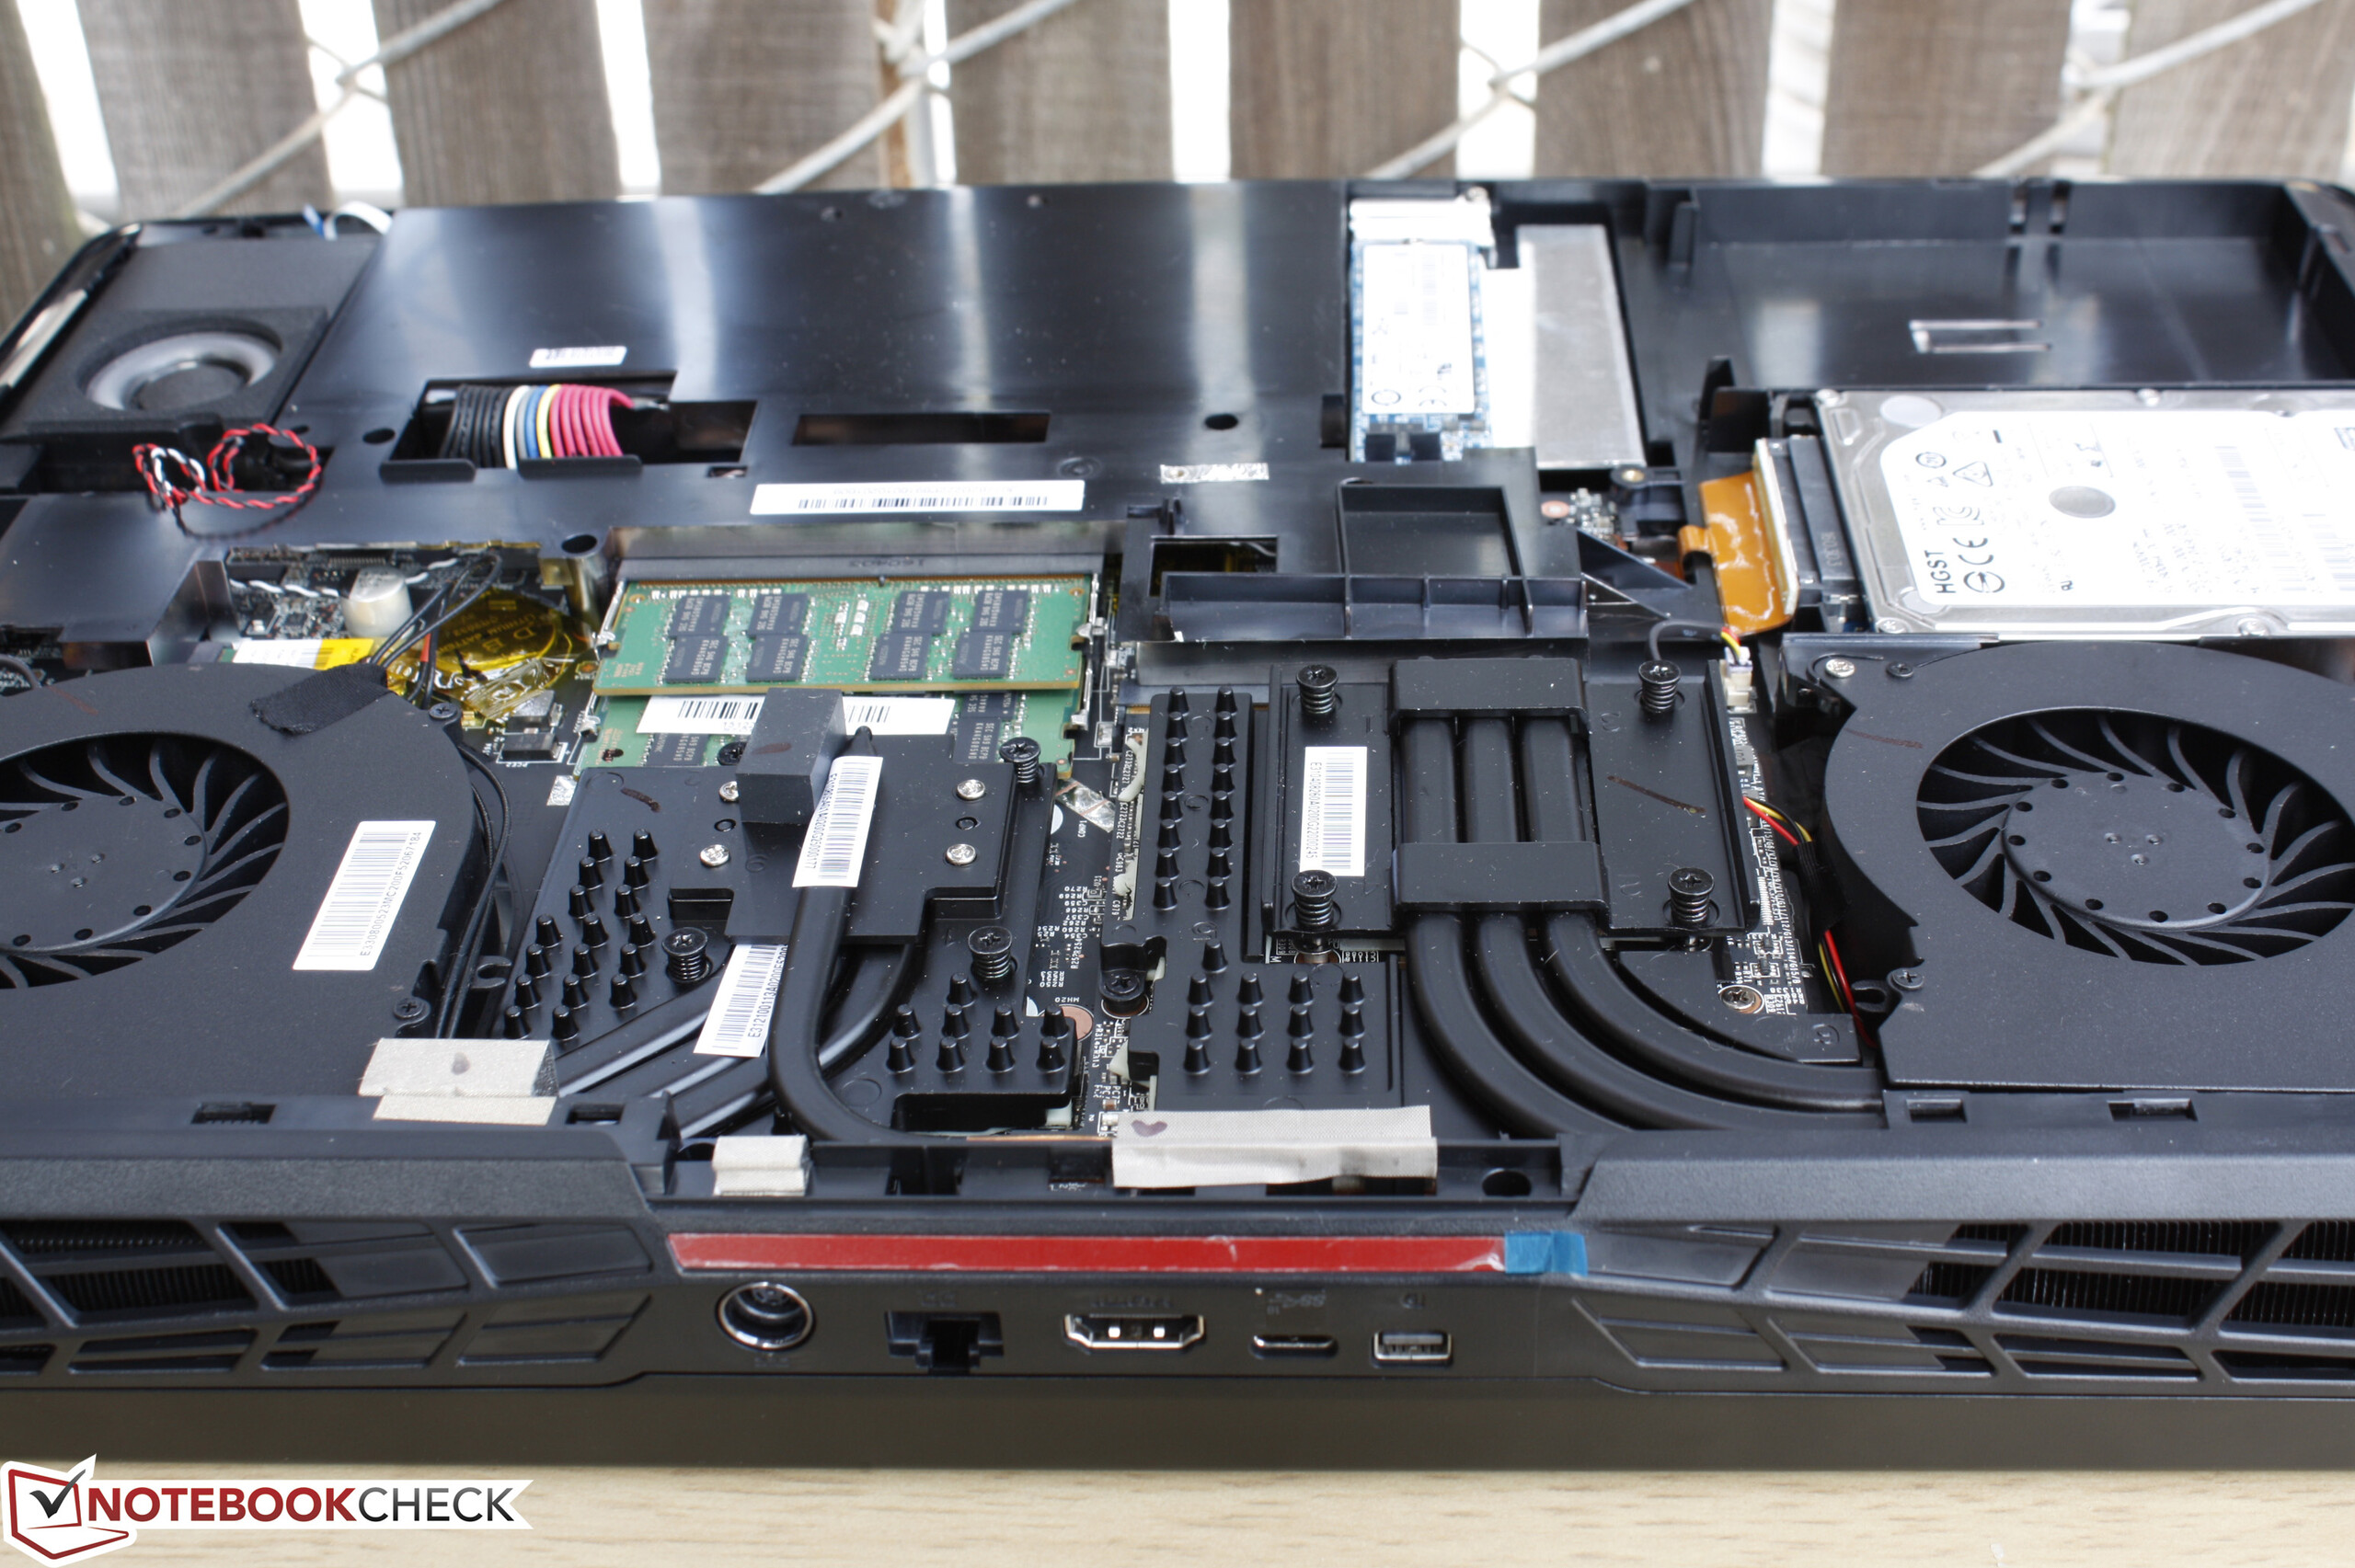
É fácil para os usuários descuidar as muitas mudanças diminutas que a MSI trouxe para a sua venerável série GT72 por causa do lançamento e dos benefícios no desempenho de Pascal, mas isto não os torna menos importantes. Os usuários devem estar cientes de que quando comparada com a GT72S, a GT72VR não possui mais opções de armazenamento interno, não inclui Thunderbolt 3, e retirou todos os recursos de alternação gráfica. Em compensação, os usuários obtêm taxas de atualização opcionais de 120 Hz, tempos de resposta de 5 ms, atualizações de hardware menores, e software atualizado. O sistema foi um pouco reduzido para fazer espaço para os modelos mais novos na série G da MSI, mas, apesar de tudo ainda está em melhores condições que muitos de seus atuais concorrentes.
Esta é uma versão reduzida da análise original. Você pode ler a análise completa em inglês.
MSI GT72VR 6RE-015US
- 08/11/2016 v5.1 (old)
Allen Ngo
Price comparison
