Revisão de laptop Dell G15 5510: Orçamento 120 Hz de laptop para jogos enfrenta sua contraparte AMD
Após a revisão doDell G15 5515 com oAMD Ryzen 7 5800H e oNvidiaGeForce RTX 3050 Ti GPU para notebook no final do ano passado, vamos rever agora o Dell G15 5510. Embora as diferenças não sejam tão grandes, elas ainda são significativas, como mostra nossa revisão. Esta unidade de revisão também oferece a mesma GPU dedicada da Nvidia. Em vez de AMD power, porém, o laptop para jogos, que custa pouco menos de 1.000 Euros (~$1.061) (MSRP), tem umIntel Core i5-10200H emparelhado com apenas 8 GB de RAM sob o capô.
Nossos resultados dos testes mostram como isso afeta o desempenho. Na próxima revisão, discutiremos apenas as áreas em que a Dell G15 5510 da Intel difere da Dell G15 5515 Ryzen Edition, uma vez que esta é uma atualização da revisão. Você pode encontrar todo o resto em nossa revisão da versão AMD.
Além disso, o candidato a teste tem que competir com outros laptops de jogos nesta faixa de preços, incluindo oLenovo IdeaPad Gaming 3 15 G6 com a mesma GPU e uma CPU mais nova, assim como aGigabyte G5 GD com o Nvidia GeForce RTX 3050 GPU para notebooke oIntel Core i5-11400H.
Possíveis concorrentes em comparação
Avaliação | Data | Modelo | Peso | Altura | Size | Resolução | Preço |
|---|---|---|---|---|---|---|---|
| 79.1 % v7 (old) | 05/2022 | Dell G15 5510-43NHT i5-10200H, GeForce RTX 3050 Ti Laptop GPU | 2.5 kg | 23.33 mm | 15.60" | 1920x1080 | |
| 79.7 % v7 (old) | 03/2022 | Lenovo Ideapad Gaming 3 15IHU-82K1002RGE i5-11300H, GeForce RTX 3050 Ti Laptop GPU | 2 kg | 24.2 mm | 15.60" | 1920x1080 | |
| 82.7 % v7 (old) | 10/2021 | Dell G15 5515 R7 5800H, GeForce RTX 3050 Ti Laptop GPU | 2.4 kg | 24.9 mm | 15.60" | 1920x1080 | |
| 80.5 % v7 (old) | 05/2021 | Acer Aspire Nitro 5 AN515-55-57GF i5-10300H, GeForce RTX 3060 Laptop GPU | 2.3 kg | 23.9 mm | 15.60" | 1920x1080 | |
| 81.7 % v7 (old) | 11/2021 | Gigabyte G5 GD i5-11400H, GeForce RTX 3050 4GB Laptop GPU | 2.1 kg | 31.6 mm | 15.60" | 1920x1080 |
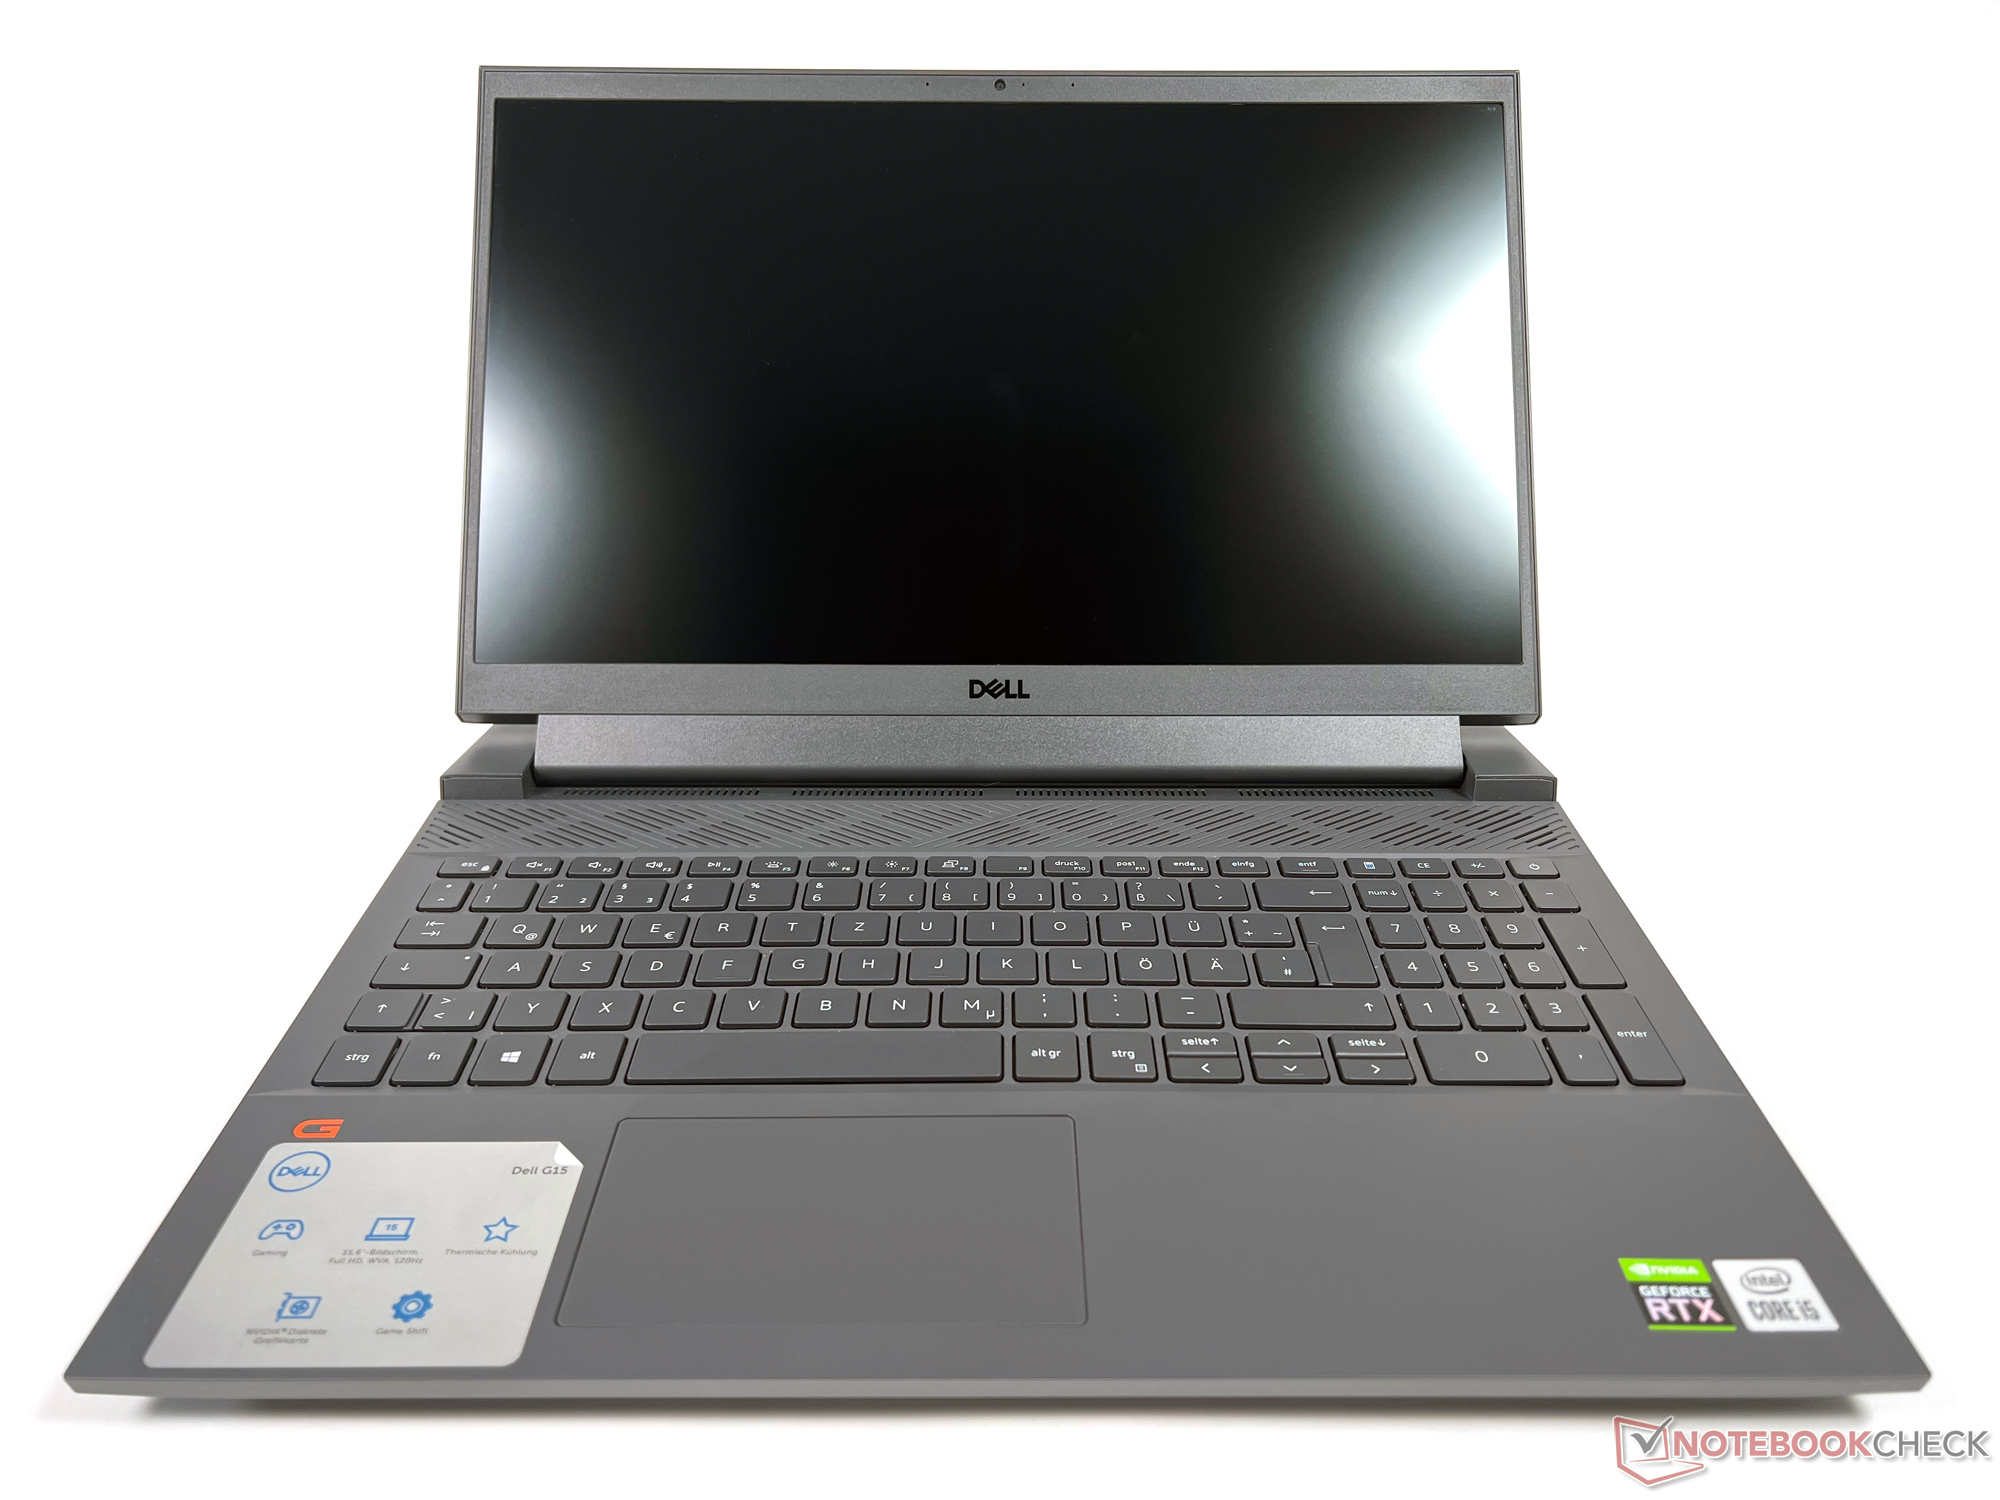
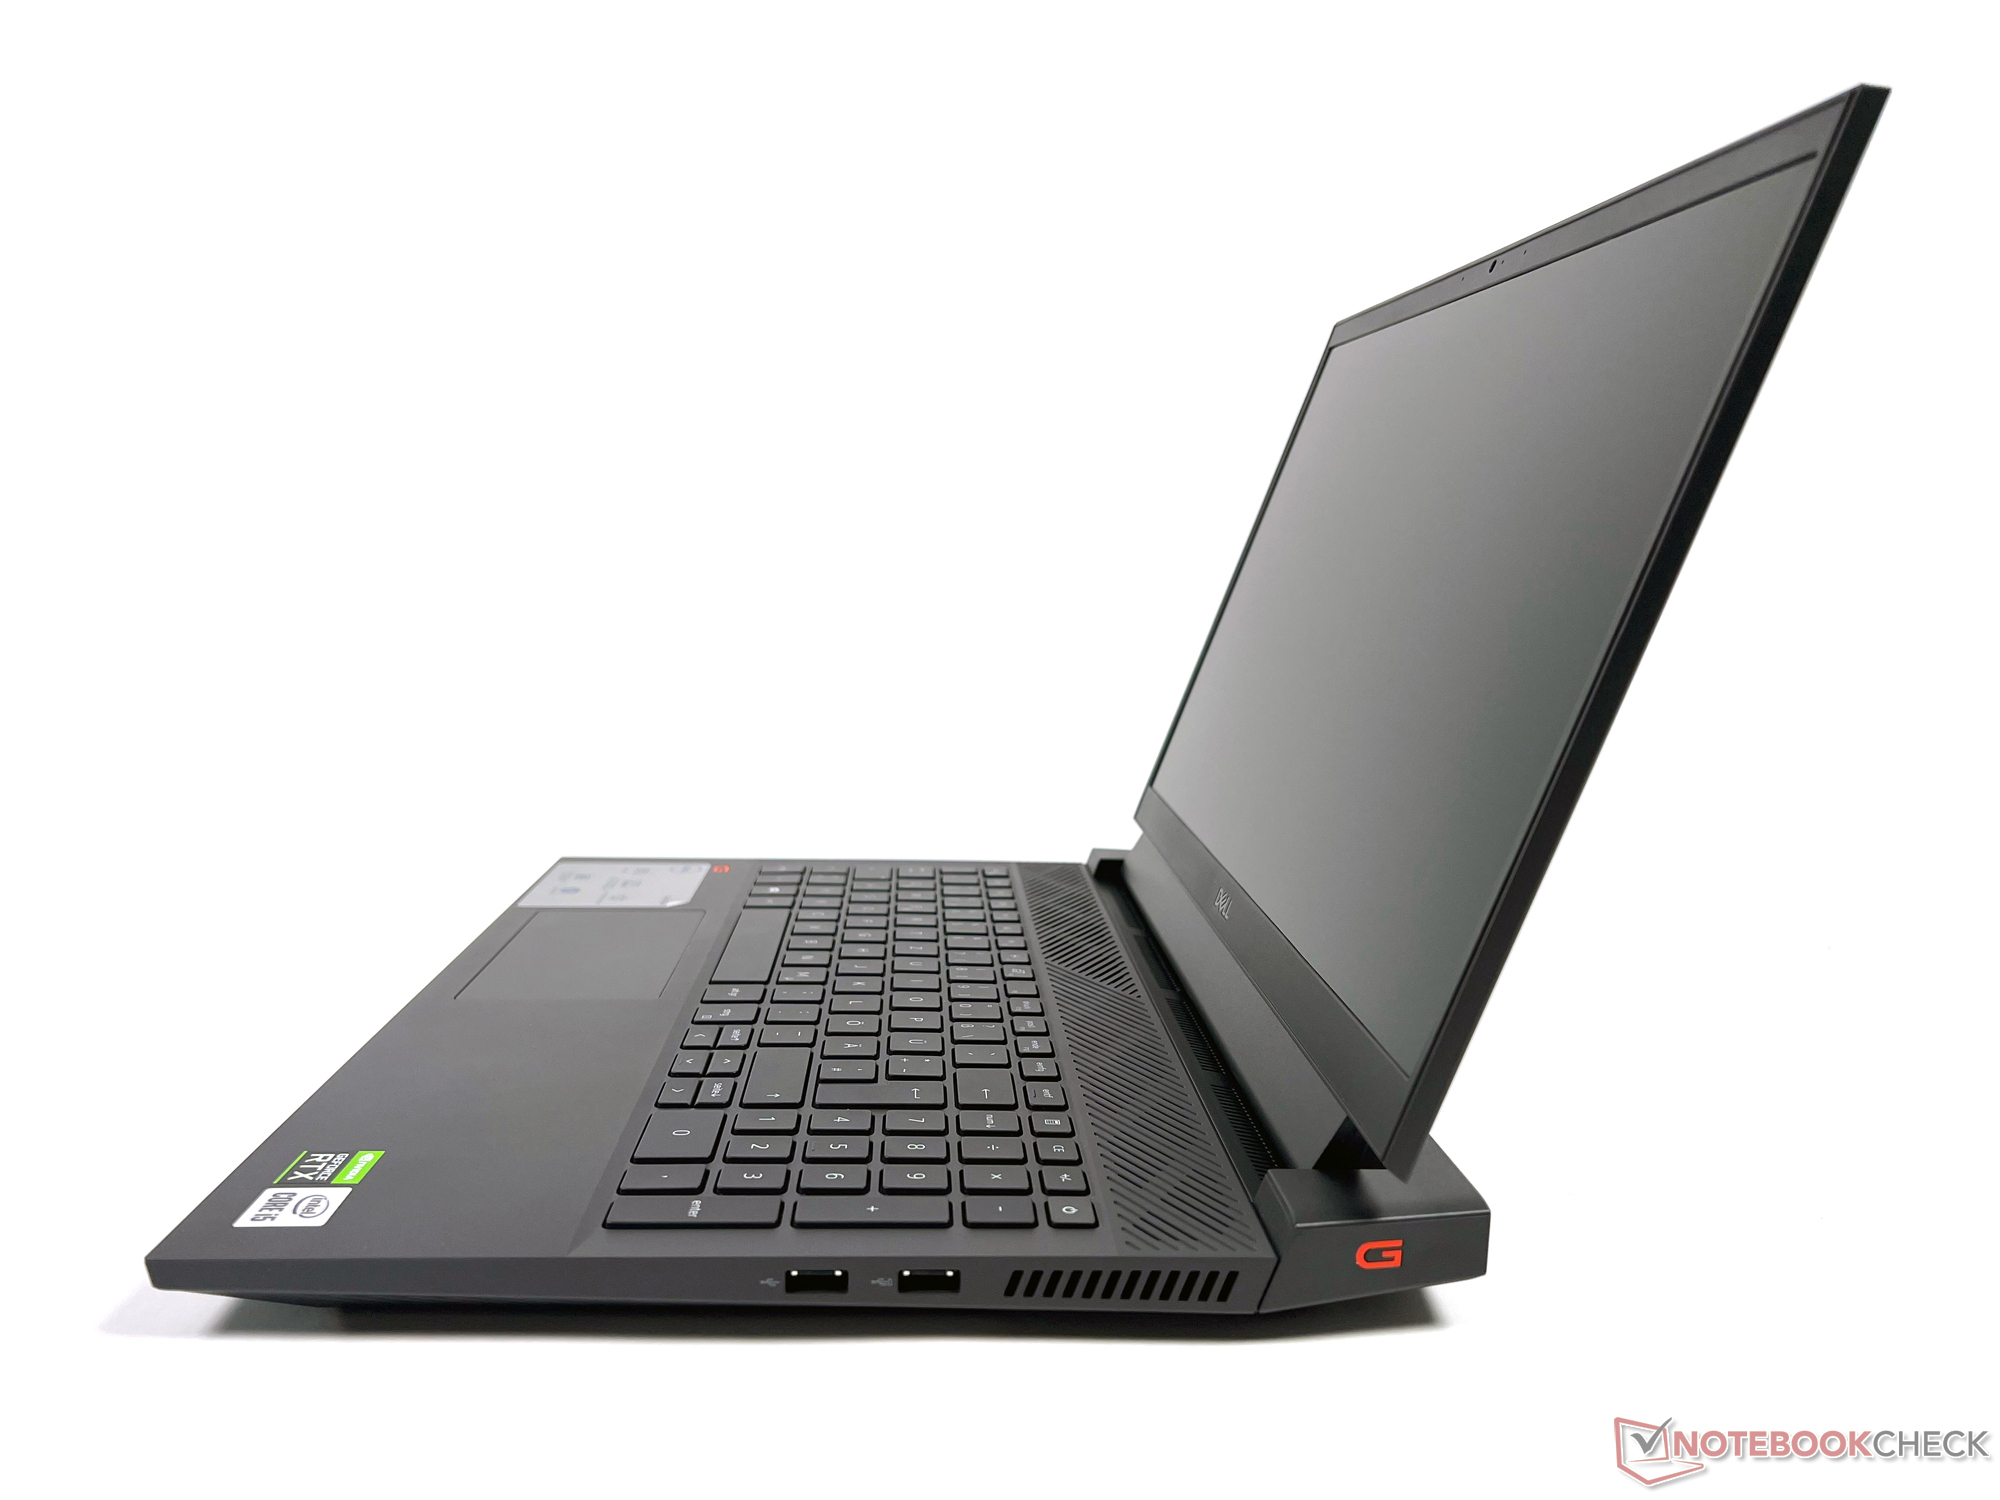
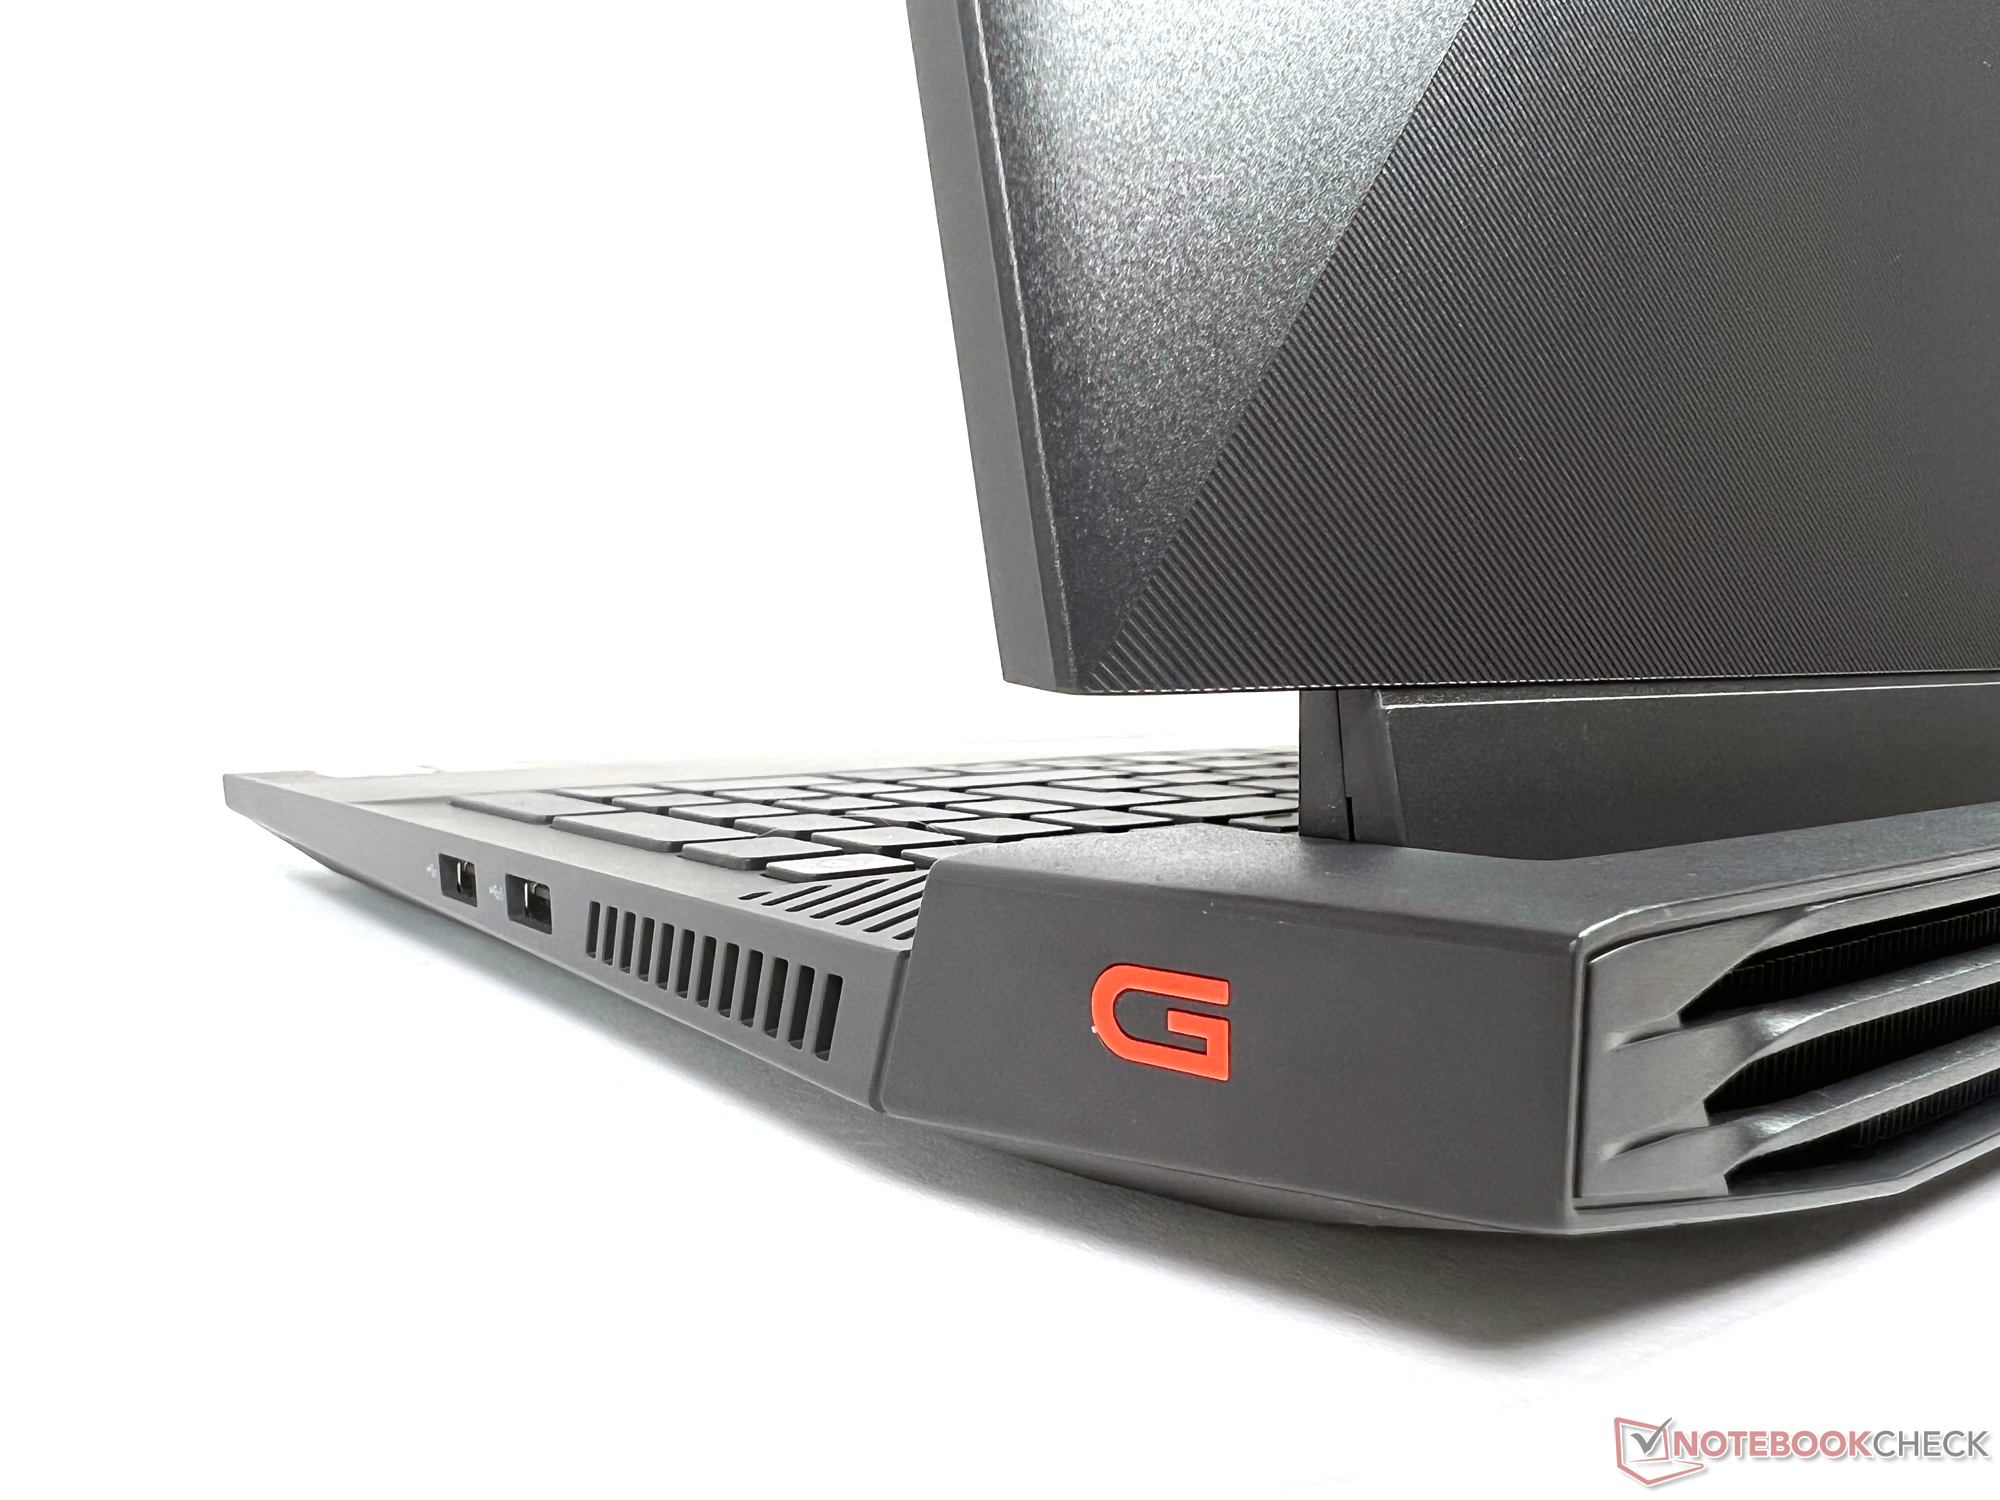
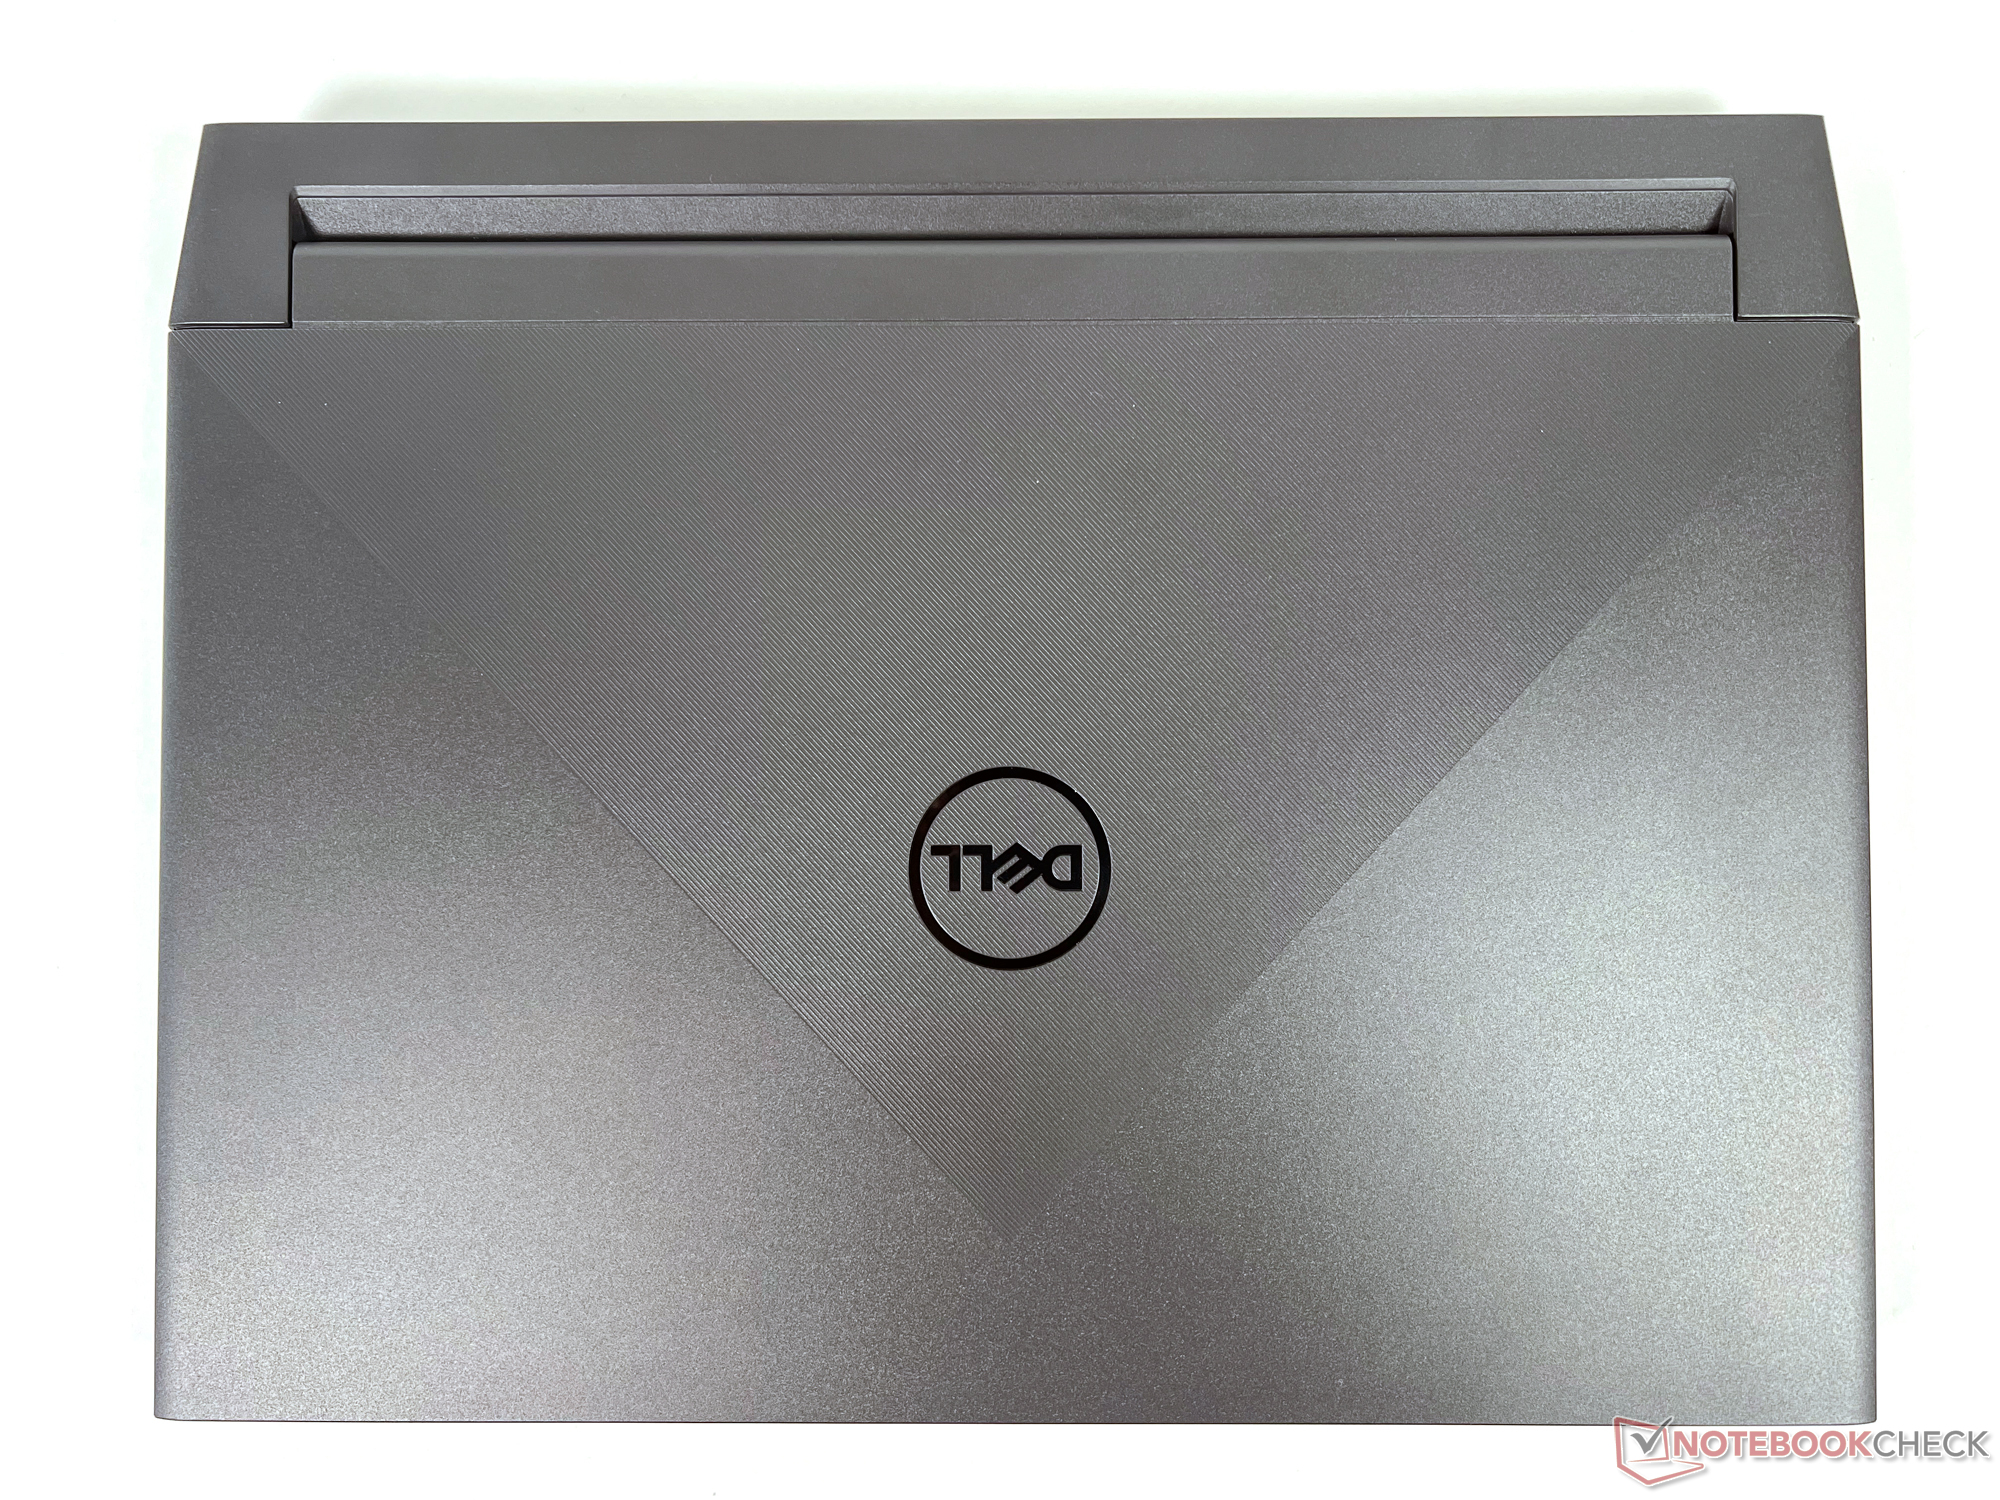
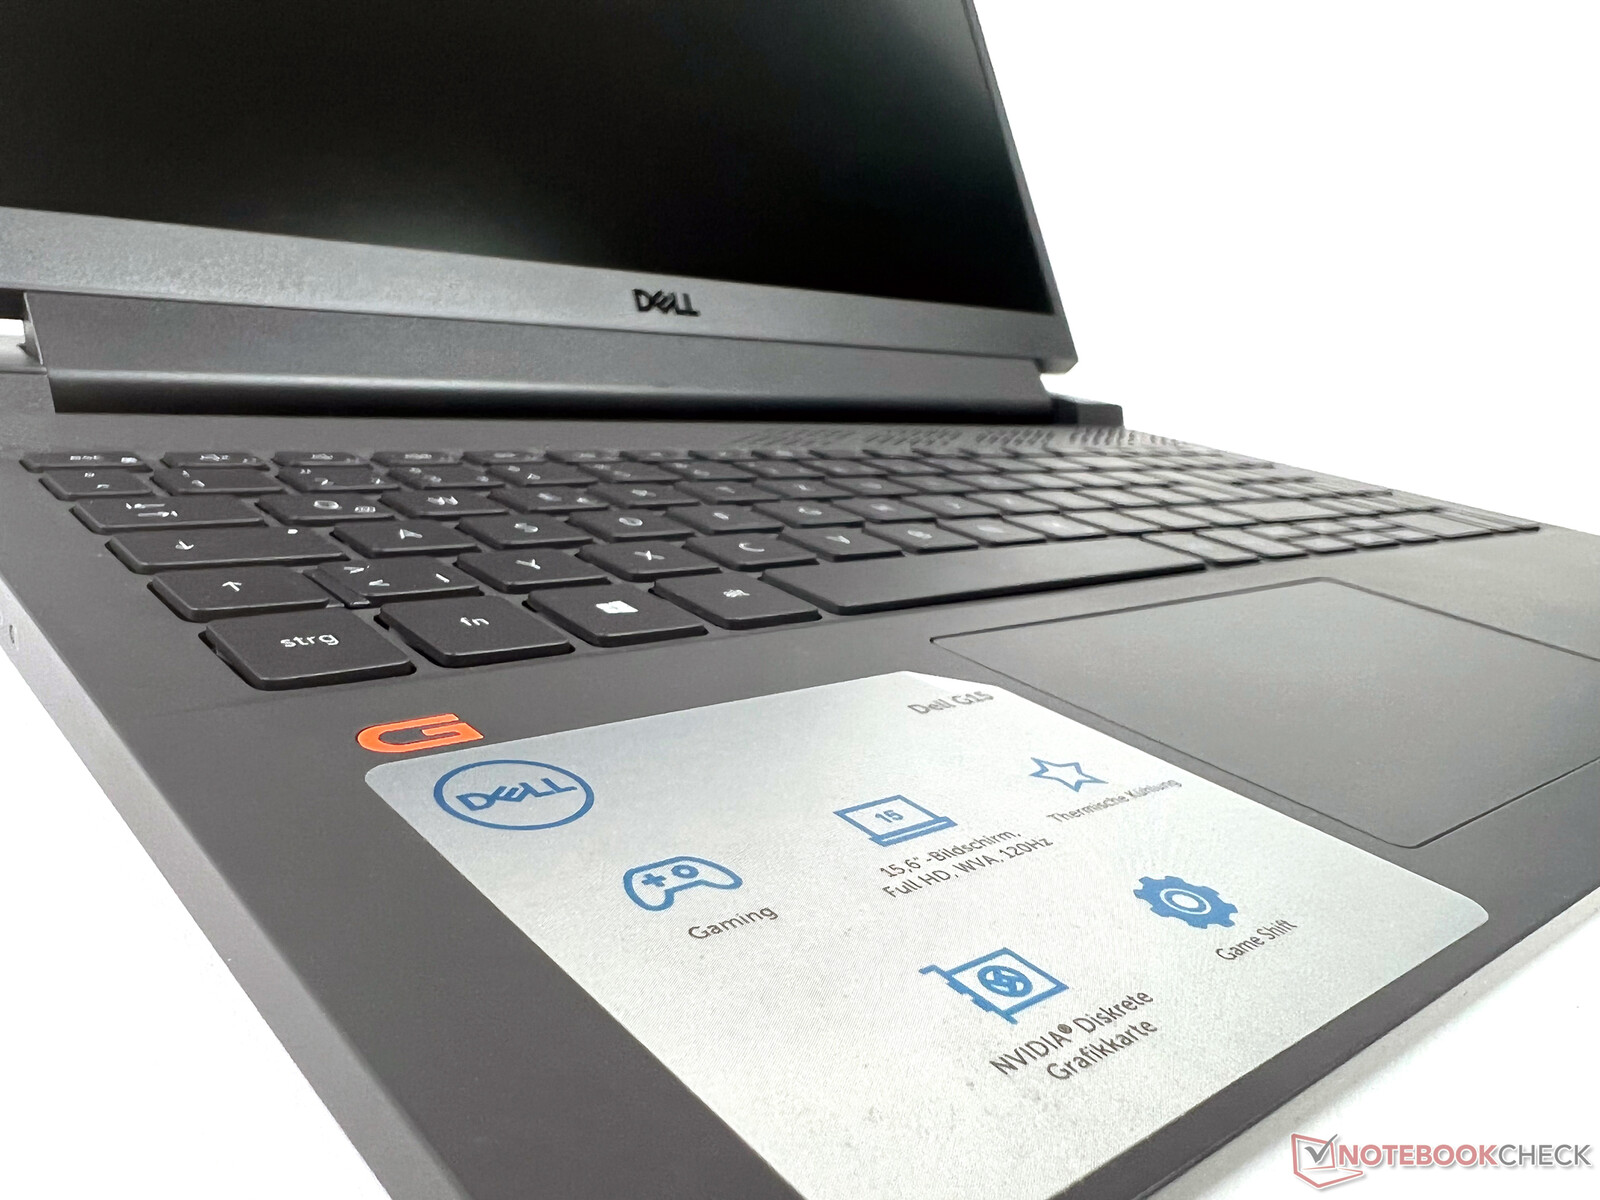
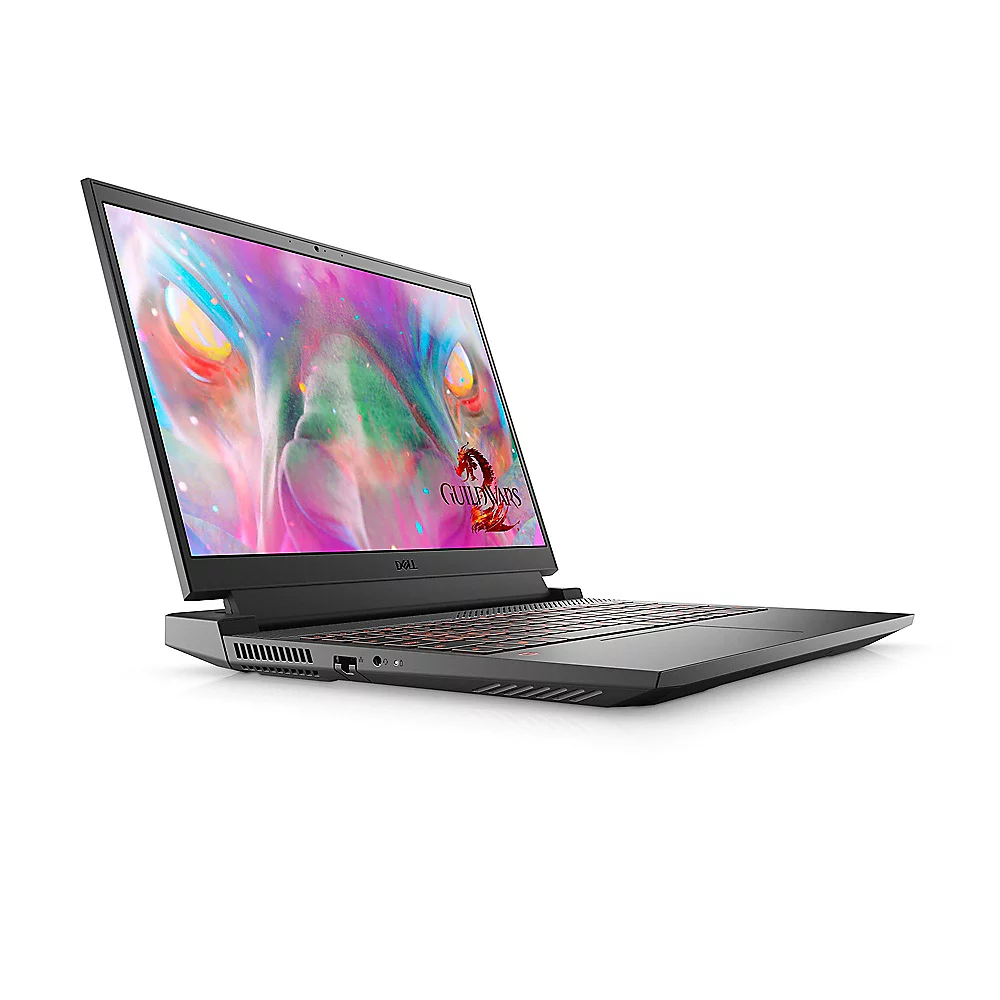
Estojo: Laptop sóbrio de plástico cinza para jogos
Além da cor ("Phantom Gray with Speckles" vs. "Dark Shadow Gray"), não há diferença entre as versões de CPU Intel e AMD do G15 em termos de design. Mais uma vez, o case é bem fabricado e bastante robusto, mas é feito apenas de plástico. Além disso, não parece tão elegante em comparação com o cinzento claro Modelo AMDem vez disso, é muito mais sóbrio
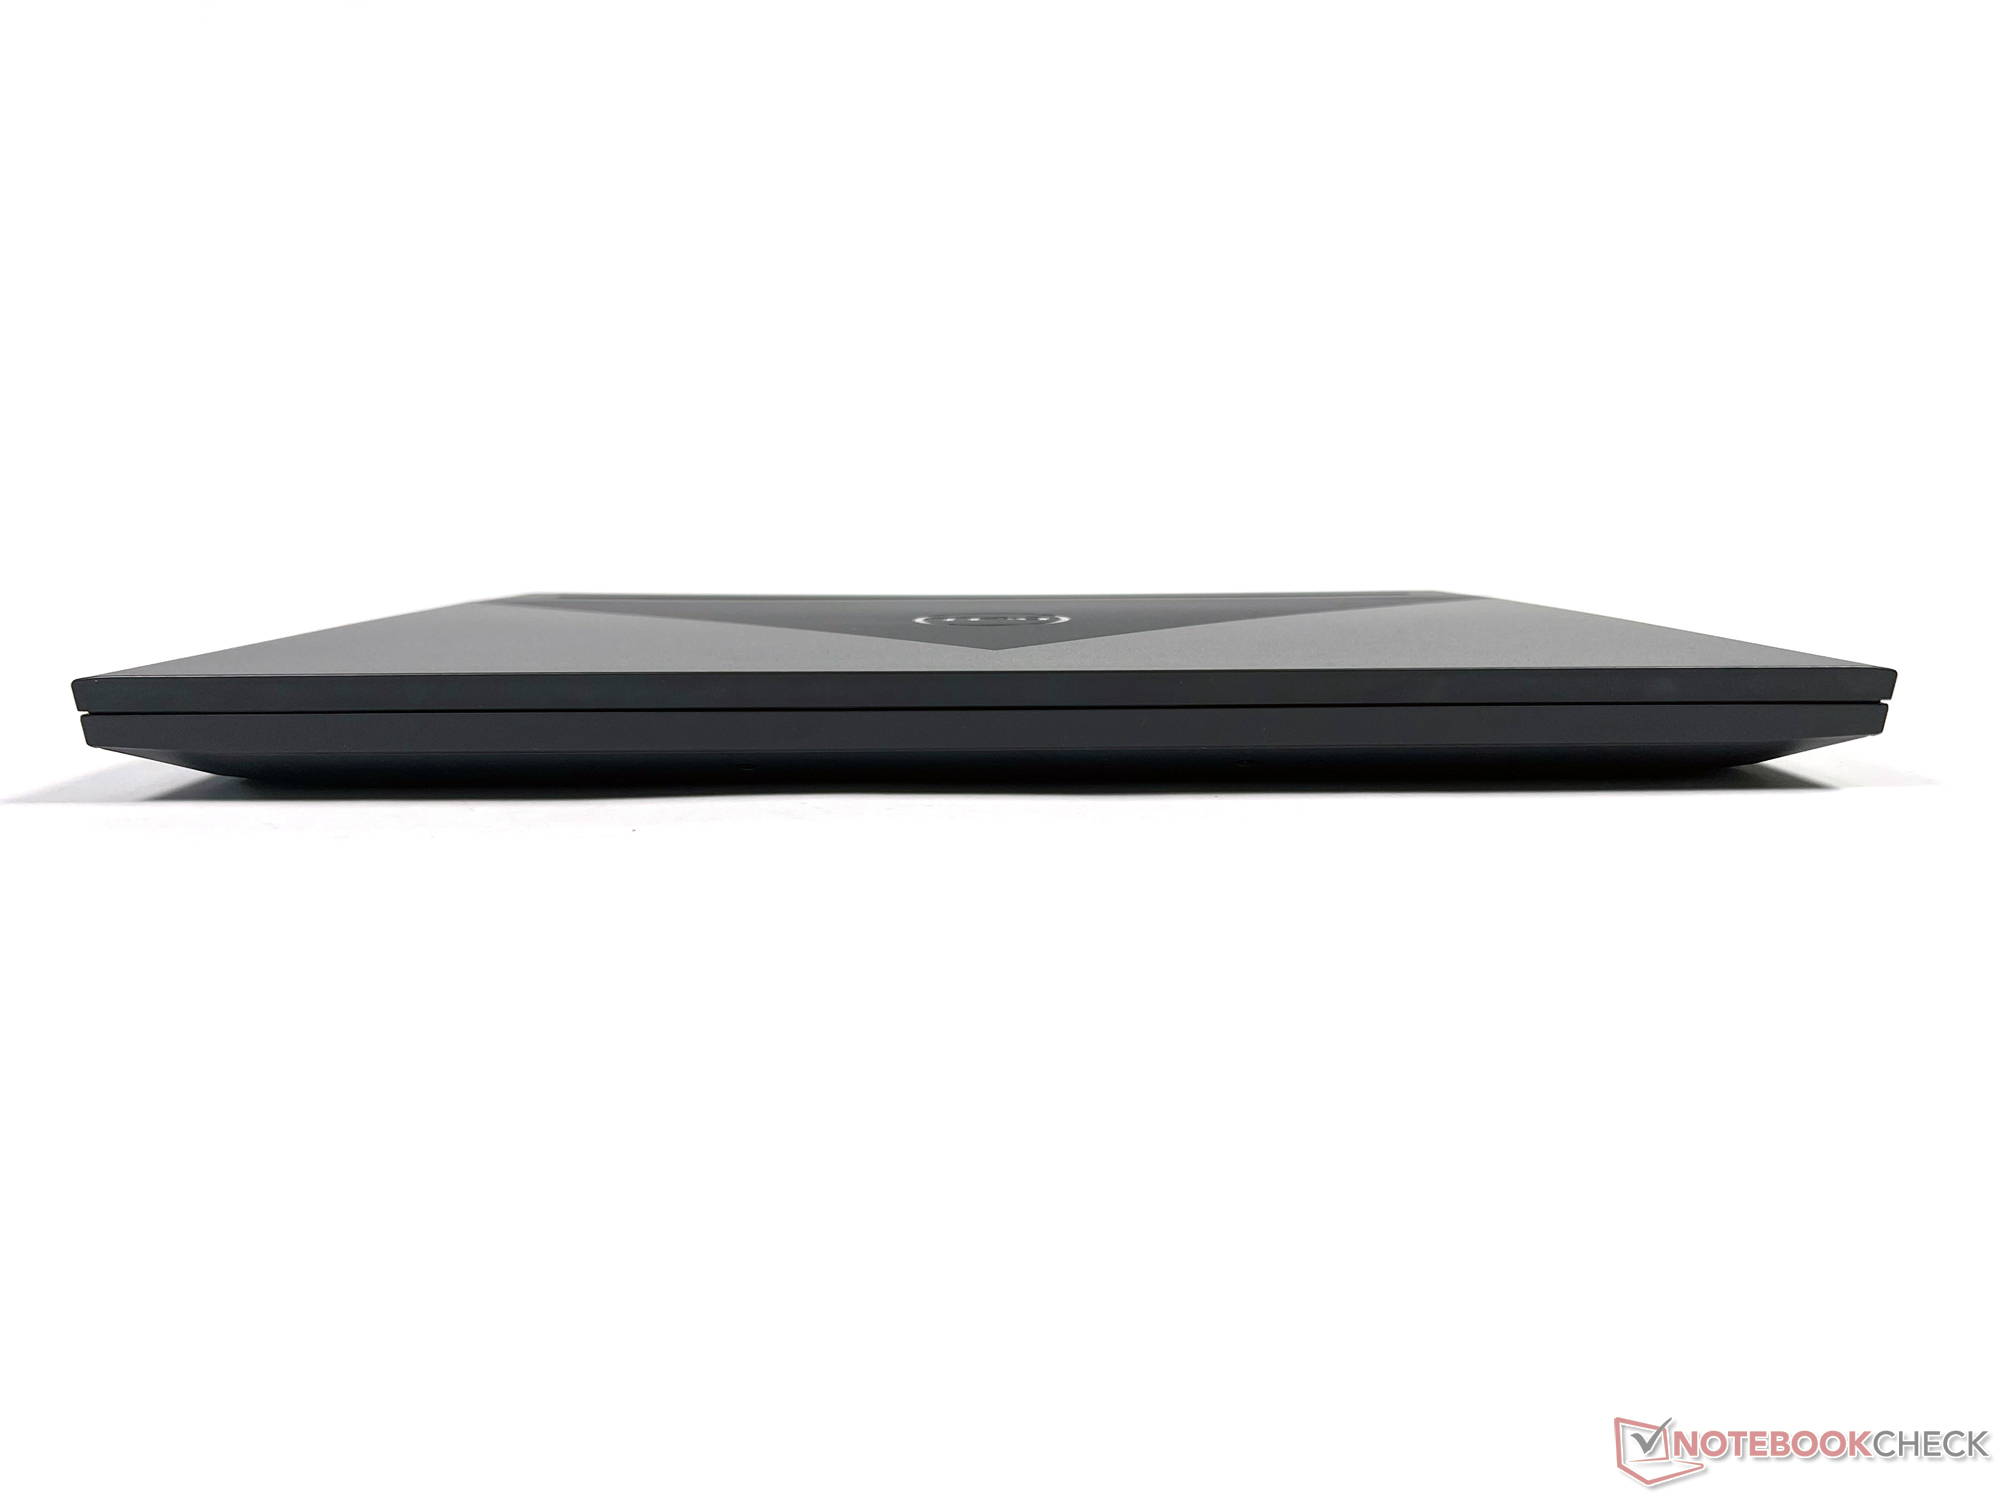
Com pouco menos de 2,5 kg, o Dell G15 5510 pesa um pouco mais. Junto com o adaptador de energia, que pesa cerca de 1 kg, o dispositivo pesa uns bons 3,5 kg. Em troca, é marginalmente mais fino, tem largura e espessura semelhantes às dos outros modelos, mas sua profundidade excede a dos dispositivos dos outros fabricantes na comparação
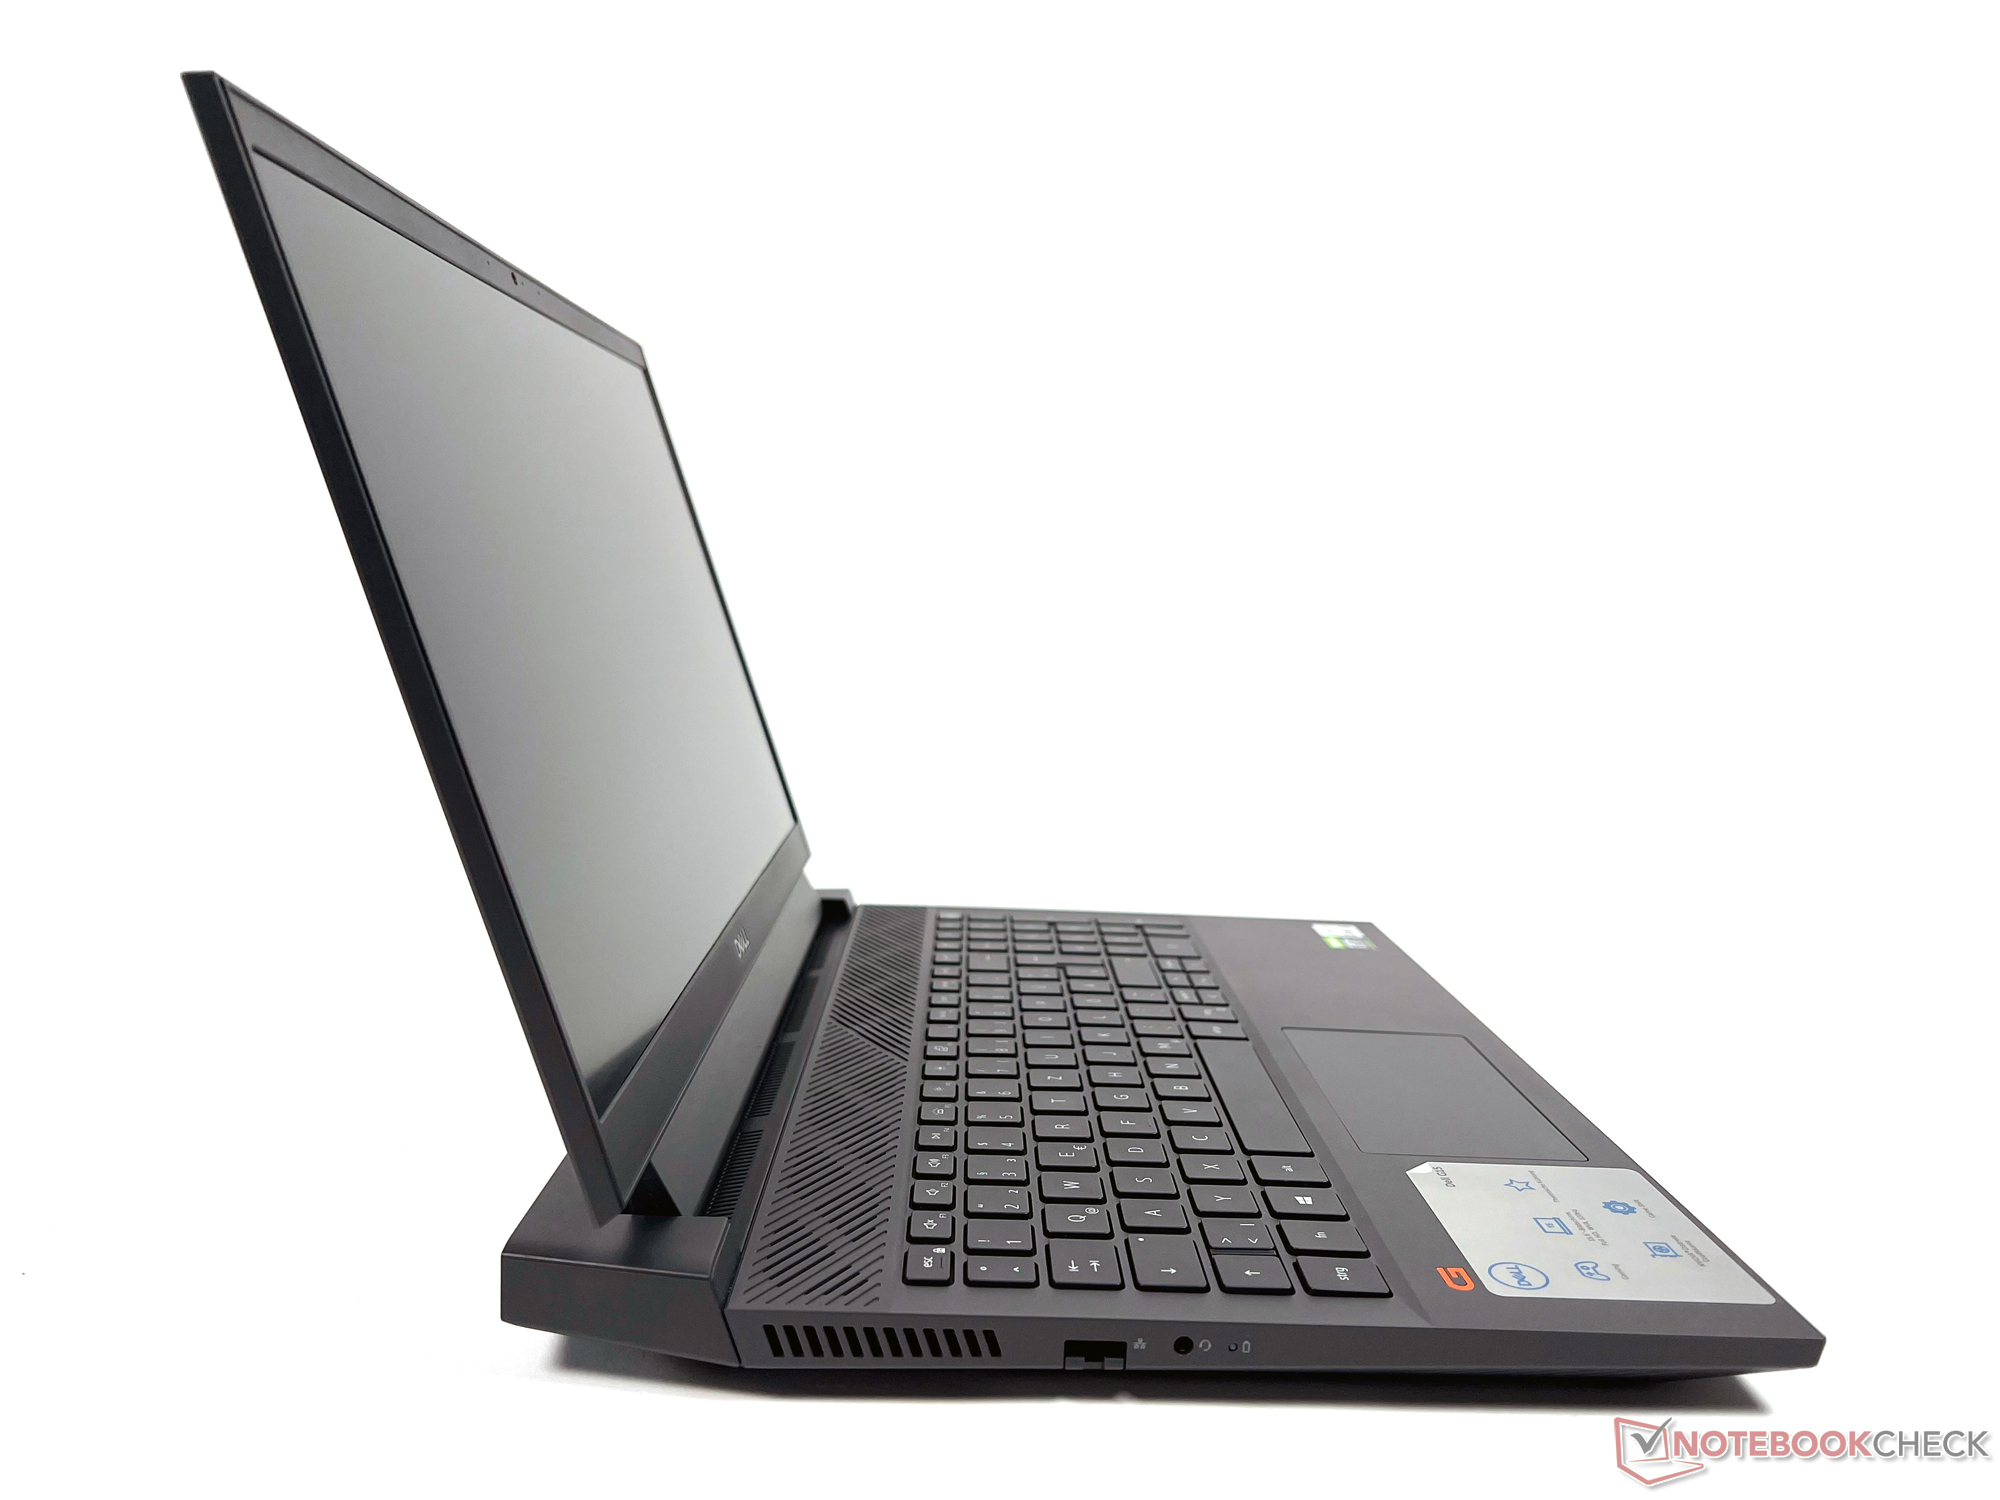
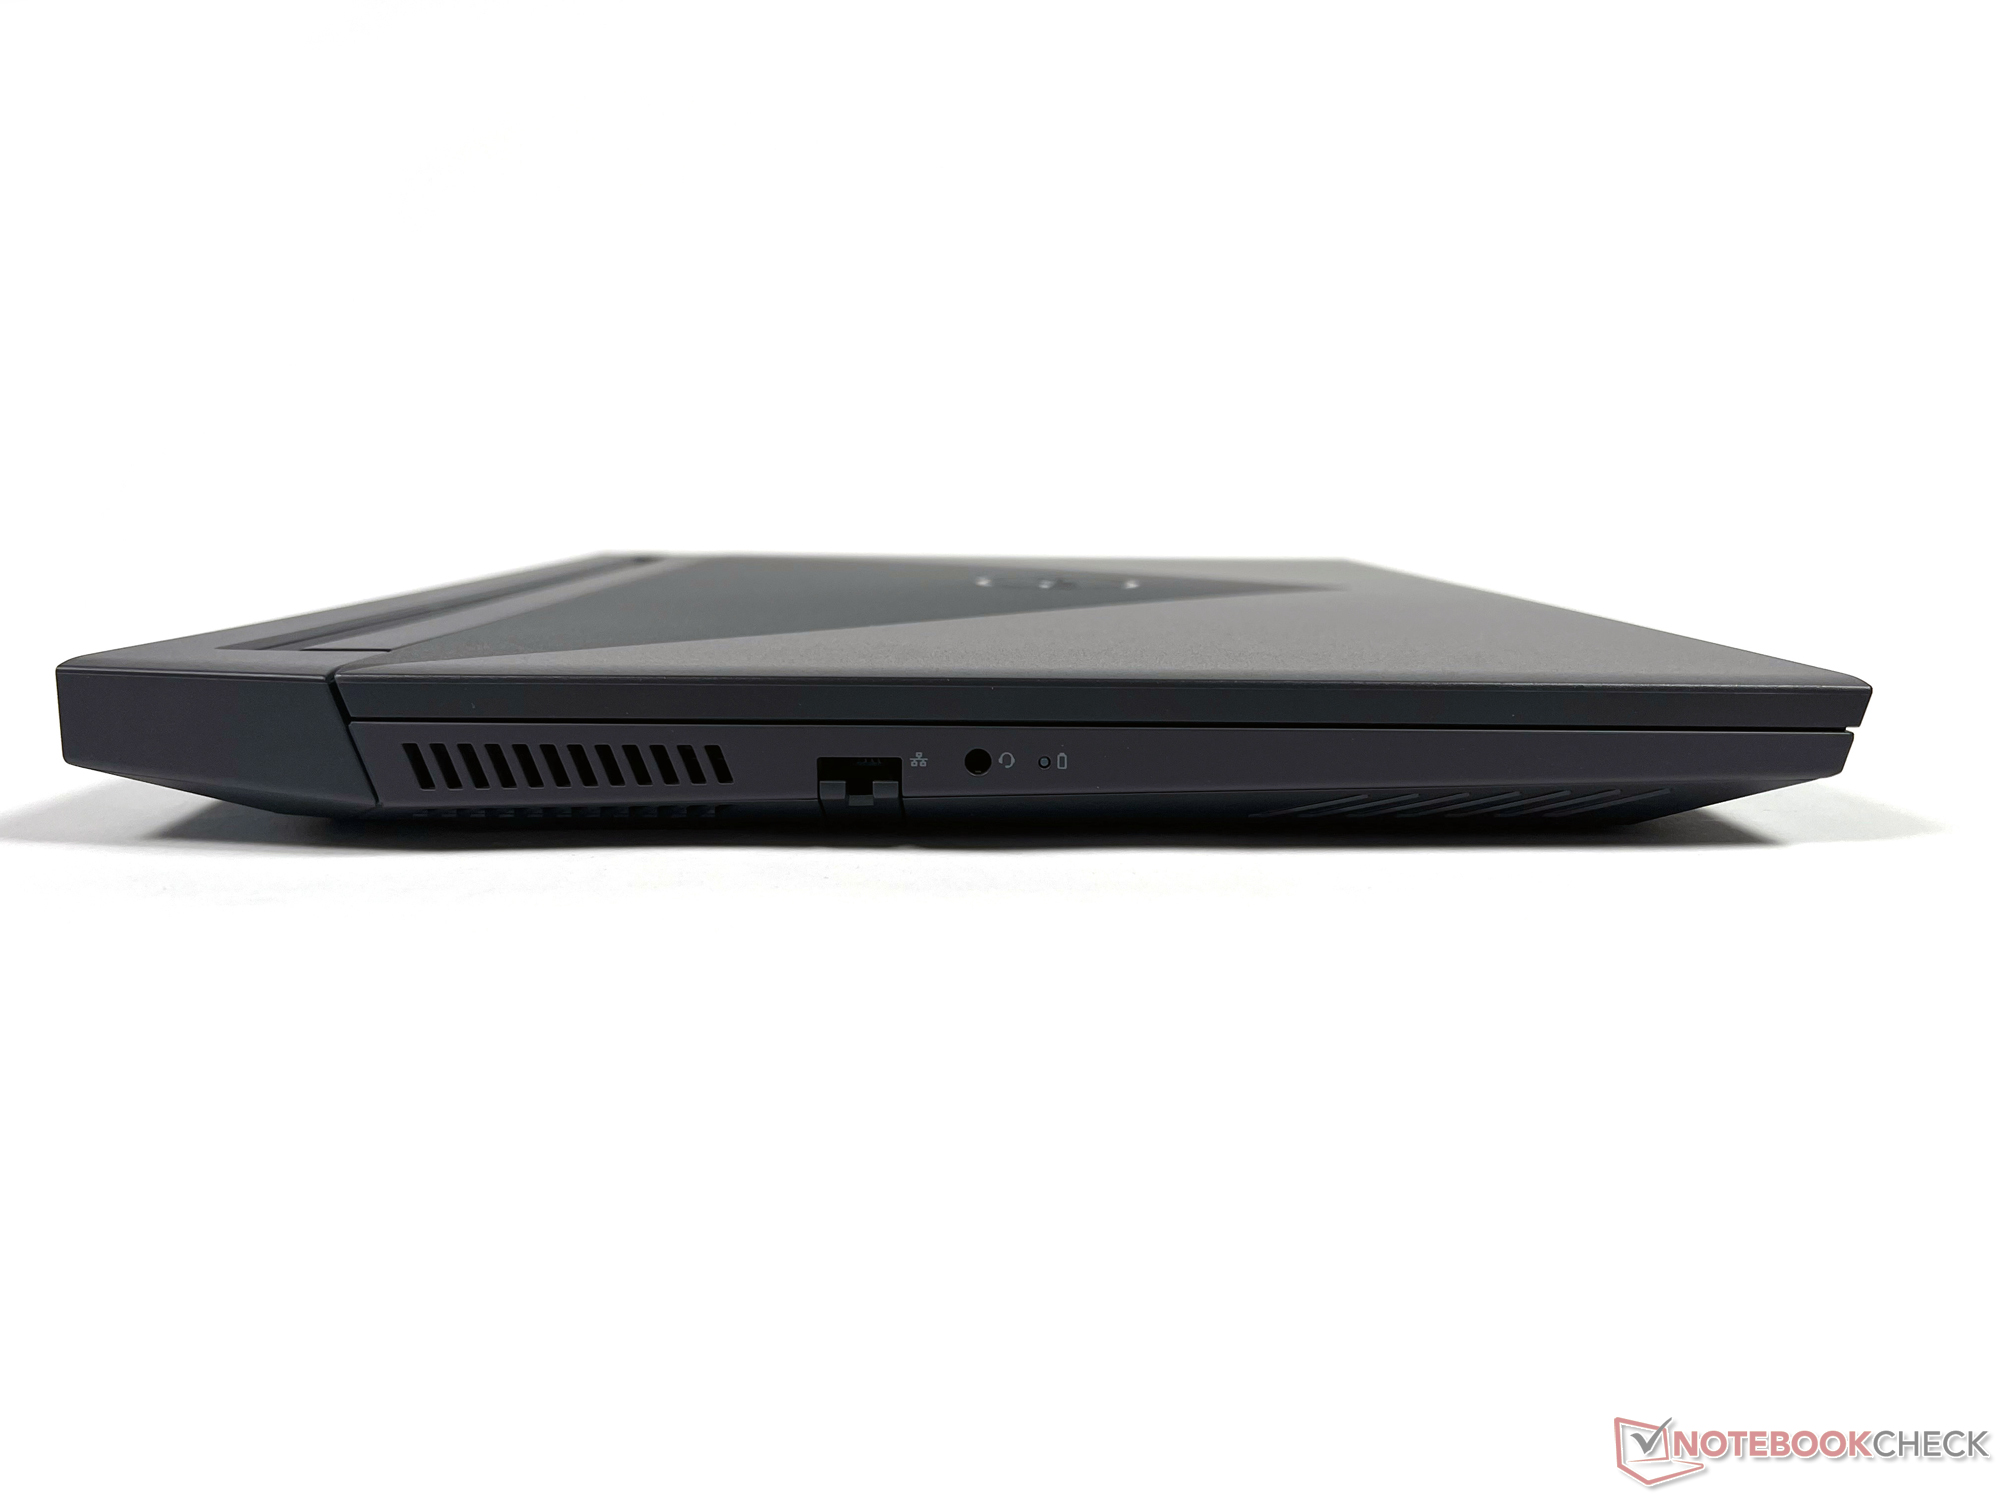
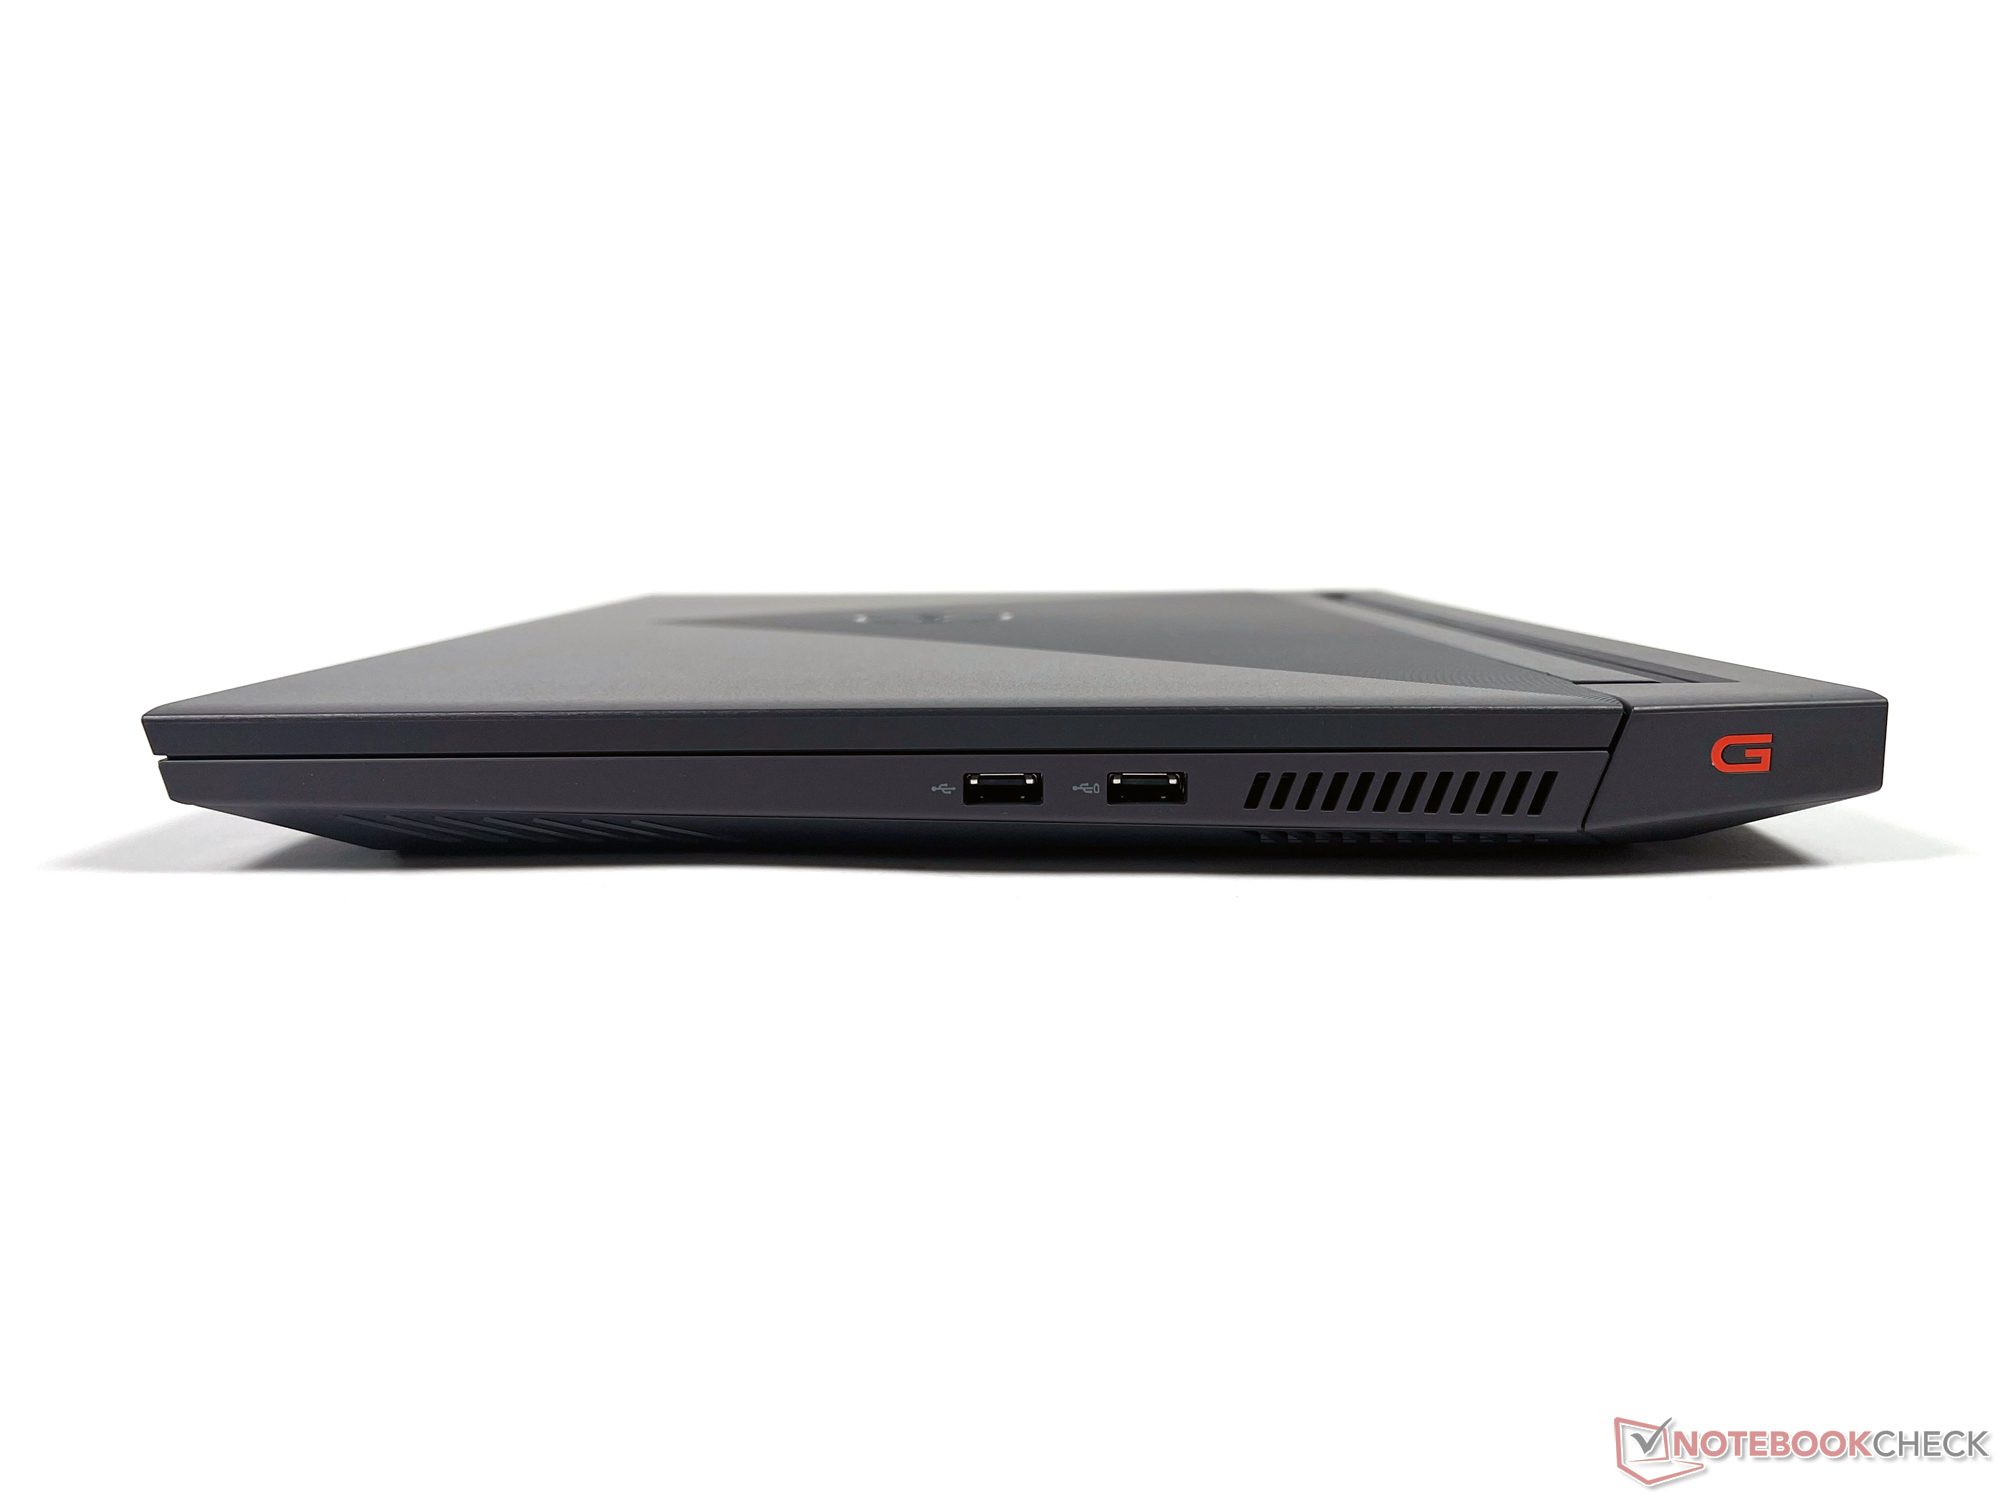
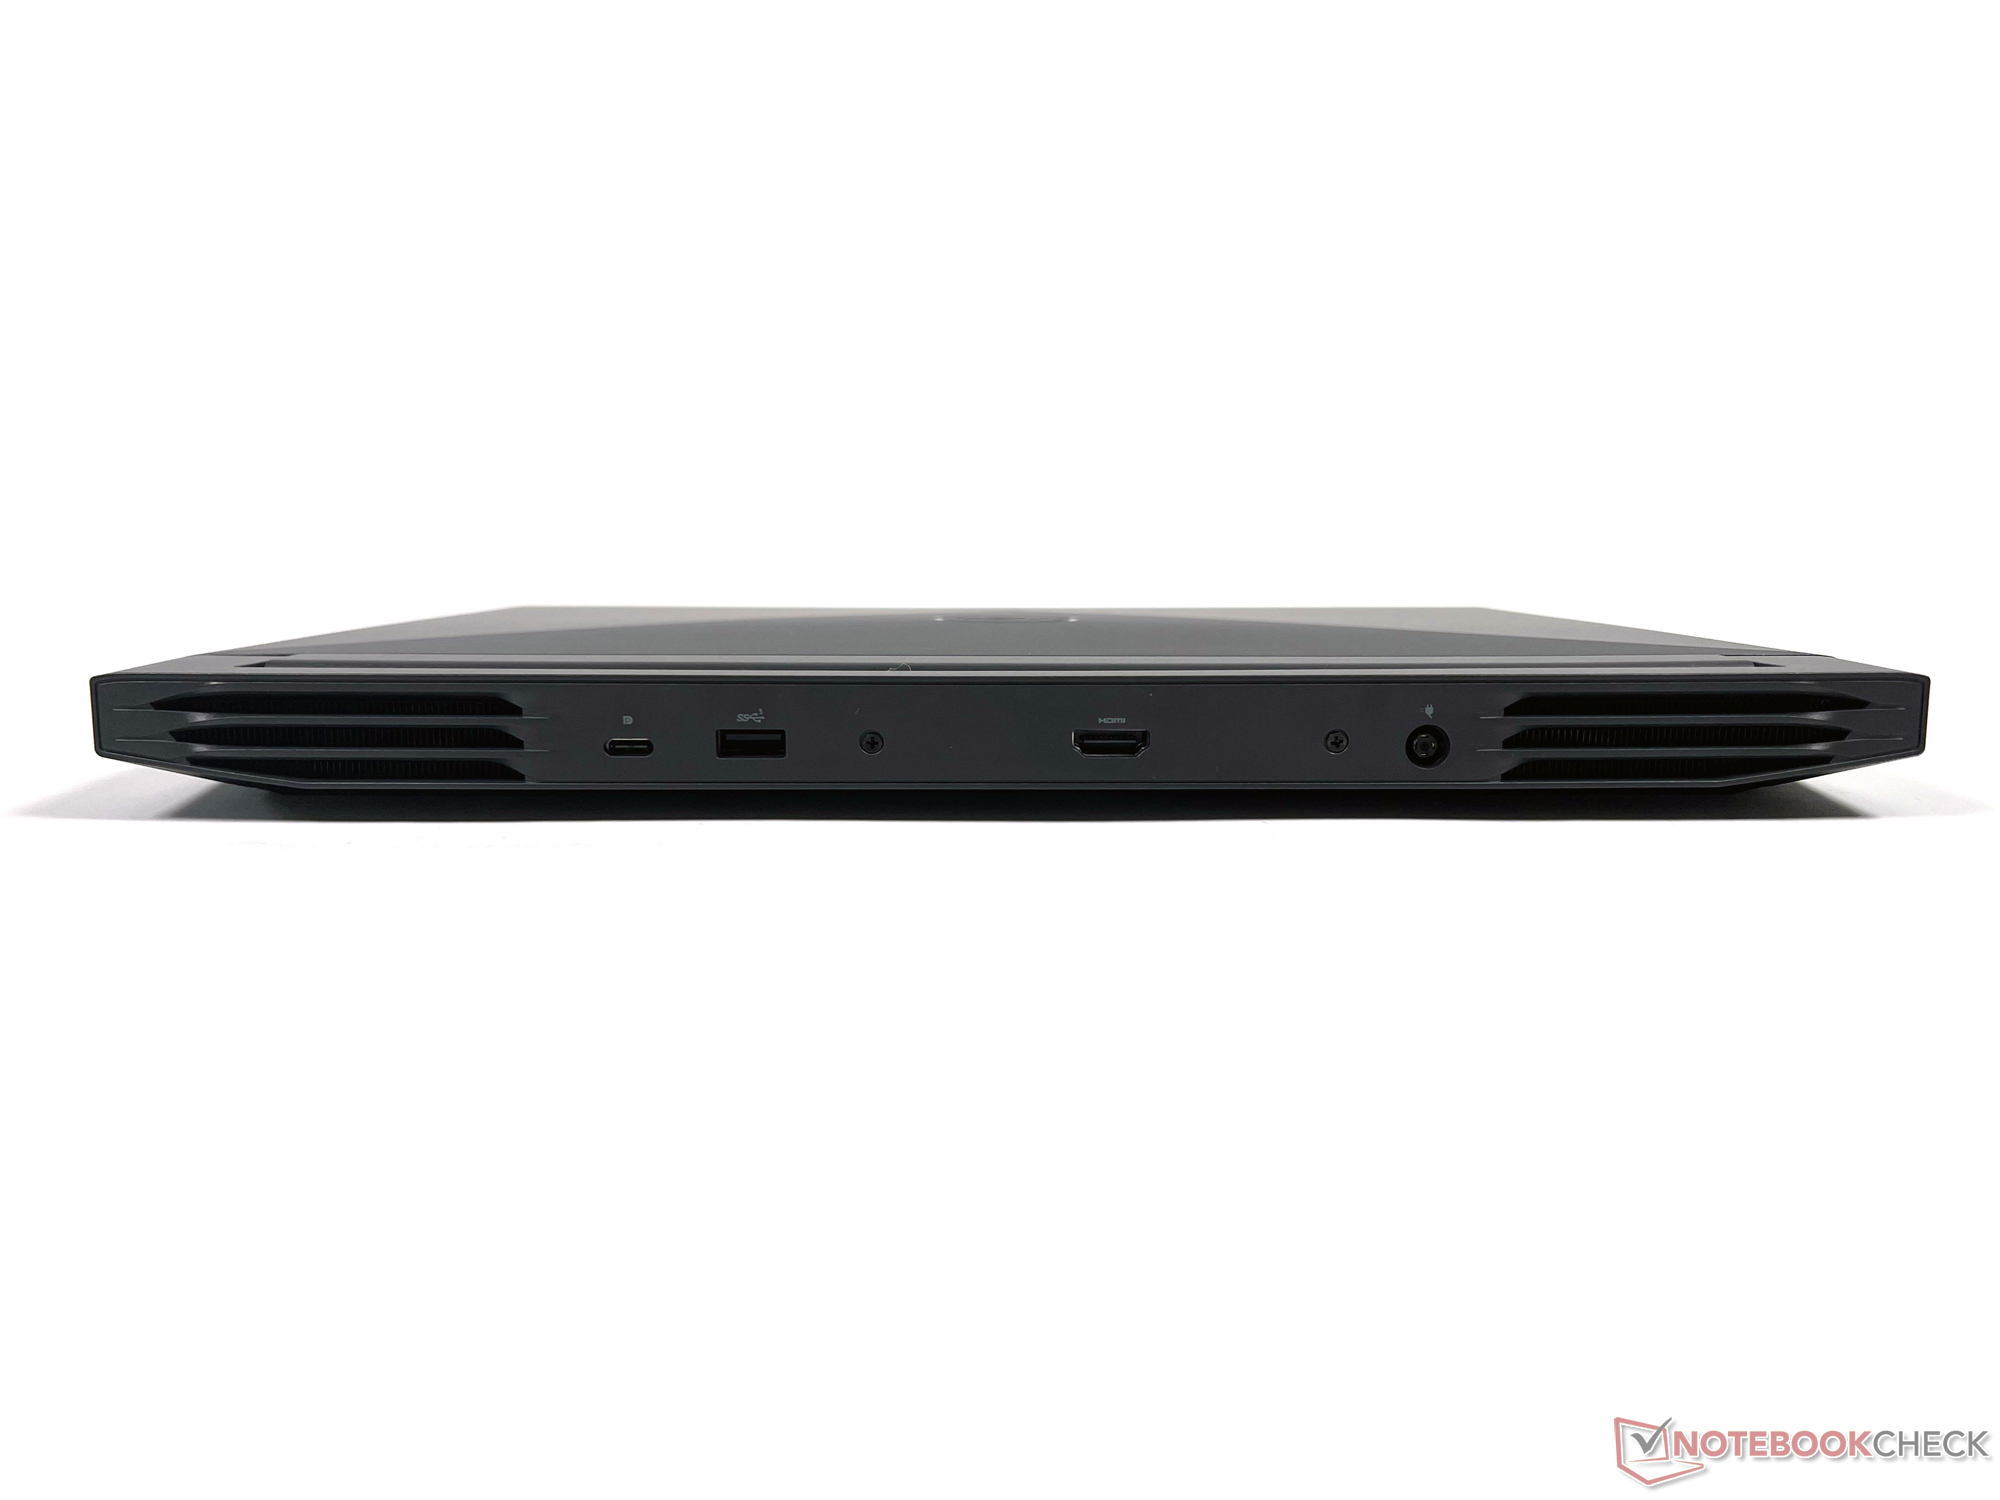
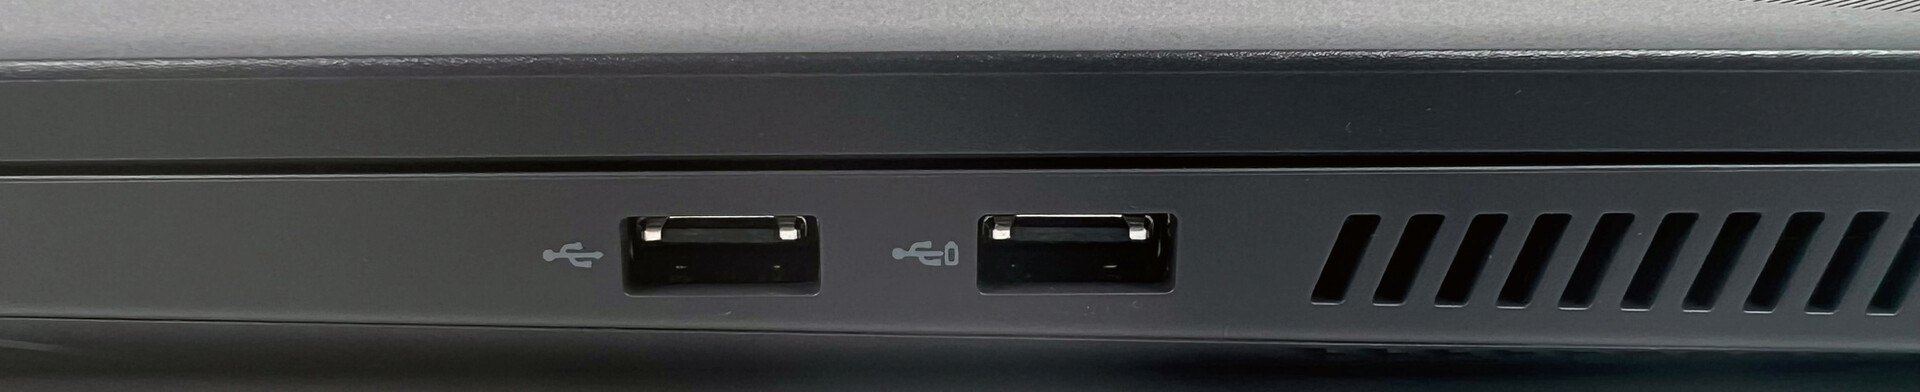
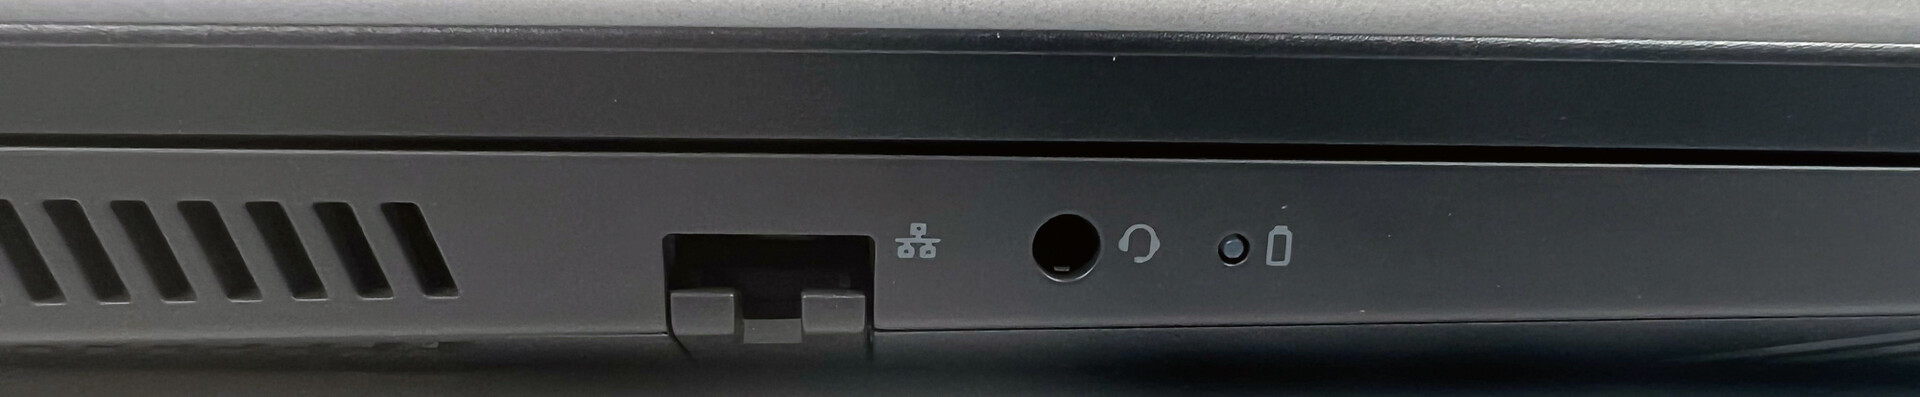
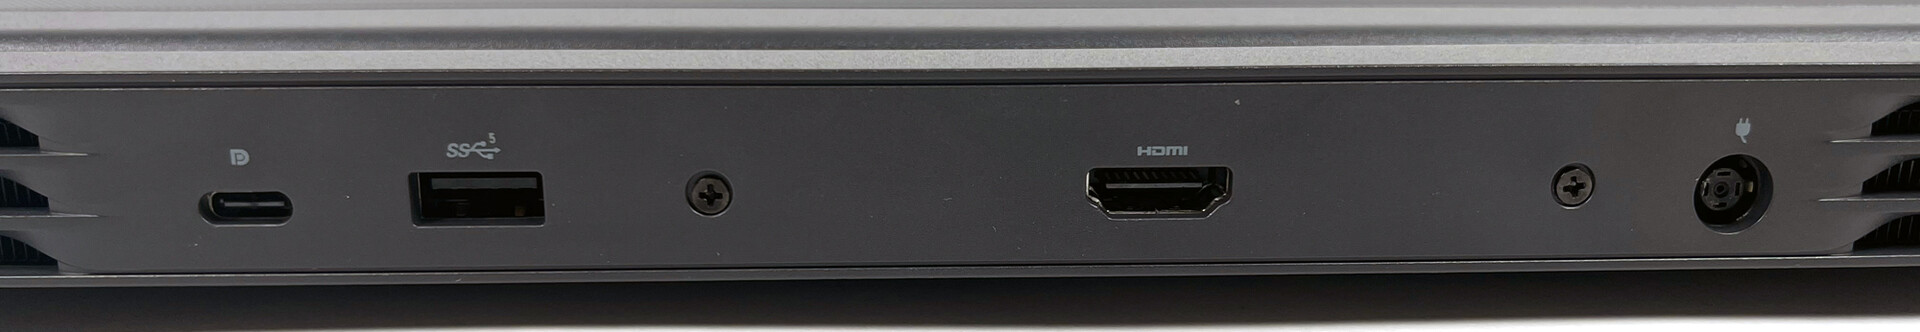
Conectividade: Dell G15 5510 com portas em três lados
Os portos são idênticos aos do Dell G15 5515e estão distribuídos nas bordas esquerda e direita da caixa, assim como nas costas
Comunicação
Ao enviar dados em nosso teste, o módulo integrado Intel Wi-Fi 6 AX201 WLAN tem um desempenho significativamente abaixo da média, e é inferior a todos os concorrentes. Em troca, ele conseguiu subir para o primeiro lugar ao receber dados, deixando todos os rivais para trás
Webcam
Como esperado, a webcam da Dell G15 5510 tem um desempenho semelhante ao da G15 5515, e está na parte inferior do campo em termos de precisão de cor


Acessórios
A Dell inclui um adaptador de energia de 240 watts e a documentação usual com o laptop para jogos
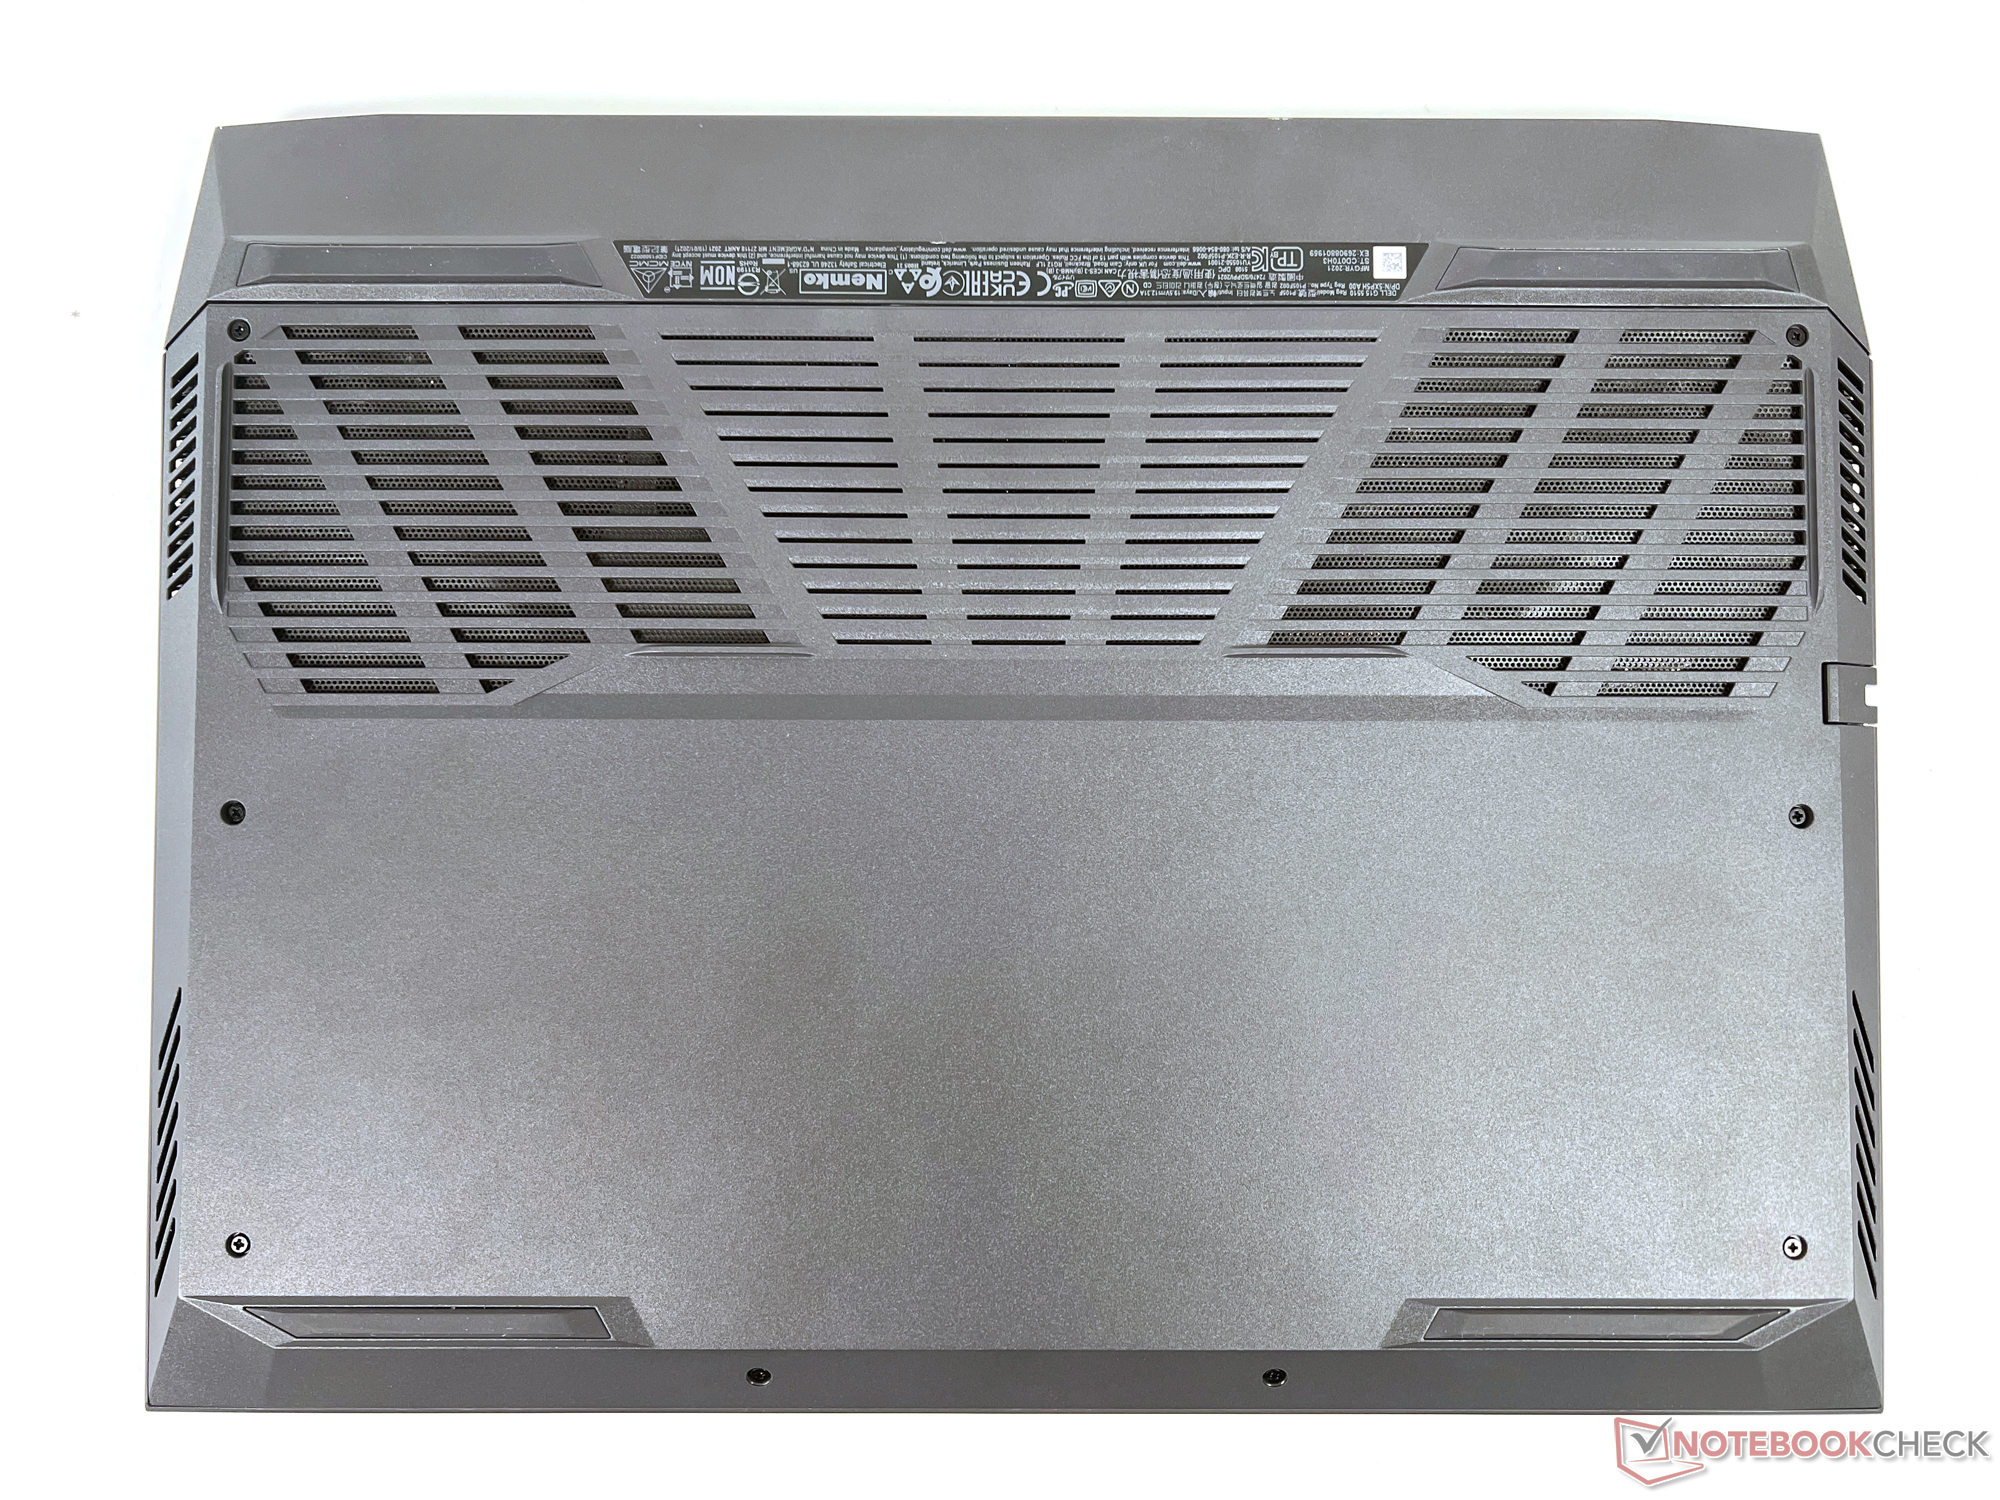
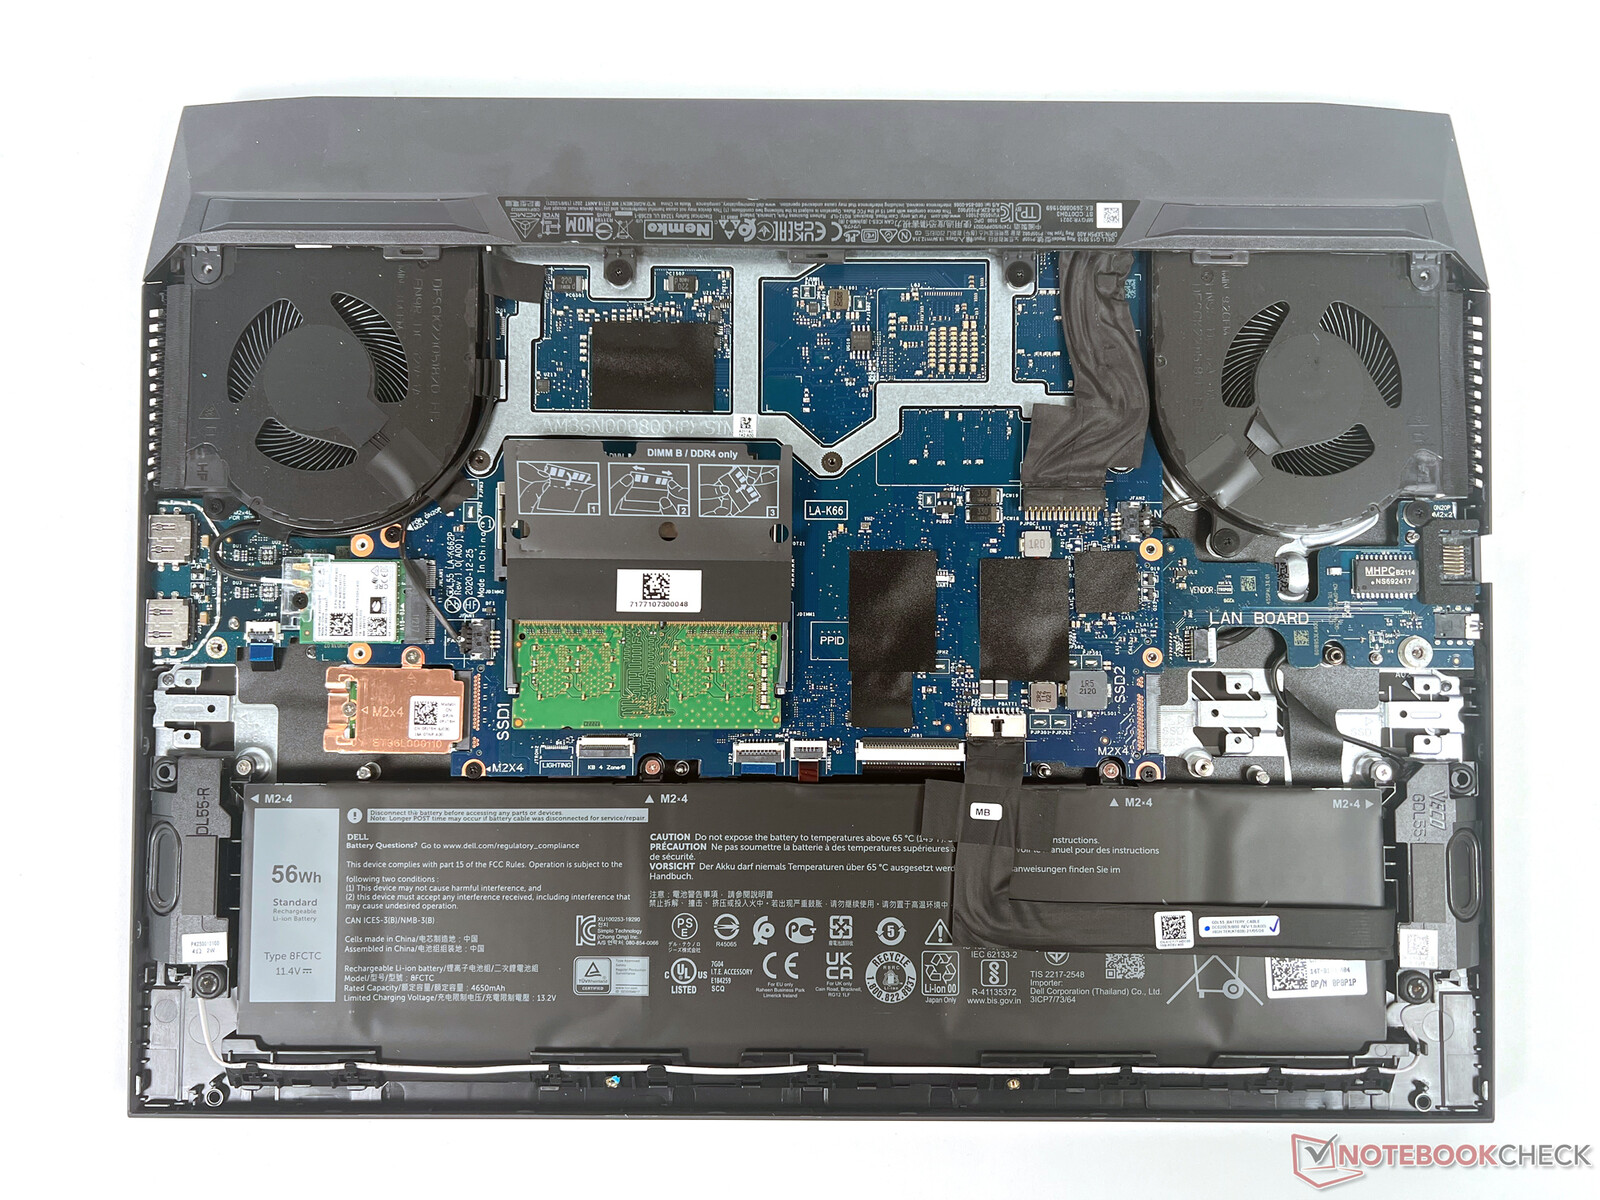
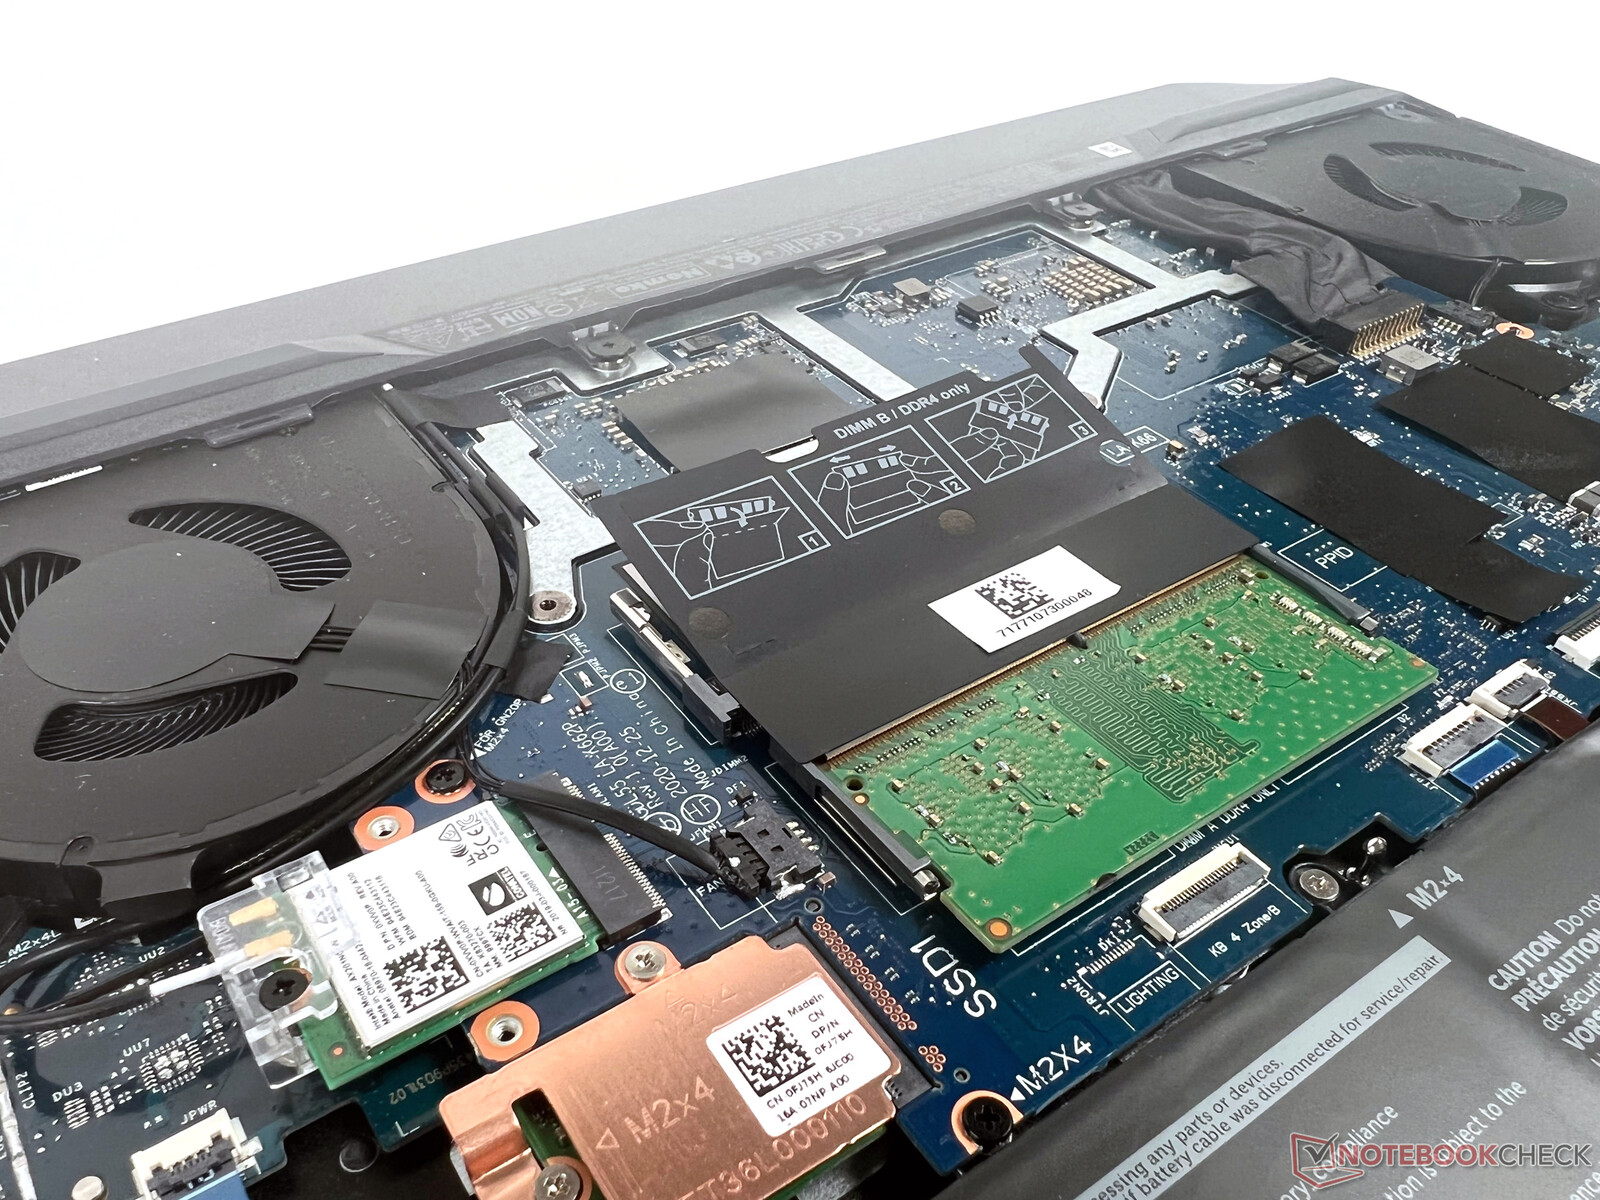
Manutenção
O caminho para dentro é bloqueado por oito pequenos parafusos cruzados. Um slot RAM e um slot SSD permitem a atualização da memória, bem como do espaço de armazenamento. Um máximo de 32 GB de RAM pode ser instalado
Garantia
A Dell oferece apenas uma garantia de 12 meses. As atualizações podem ser adquiridas por um custo adicional, no entanto
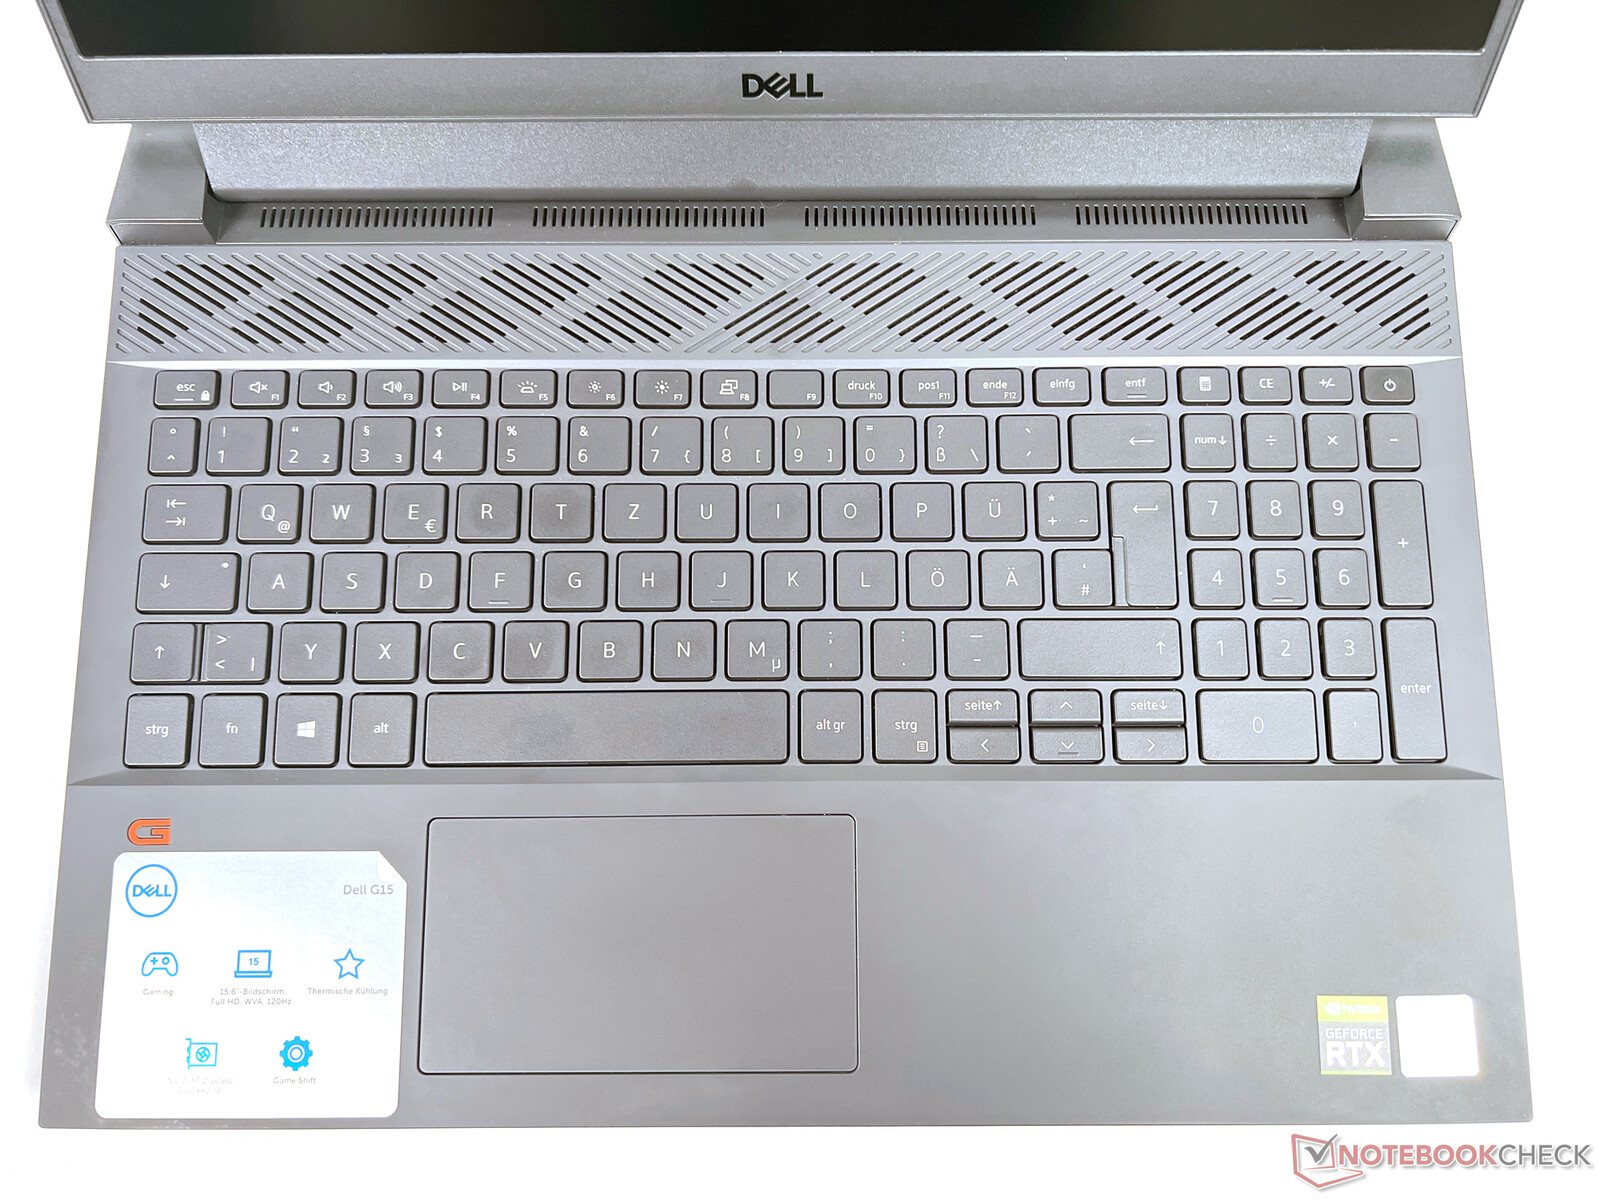
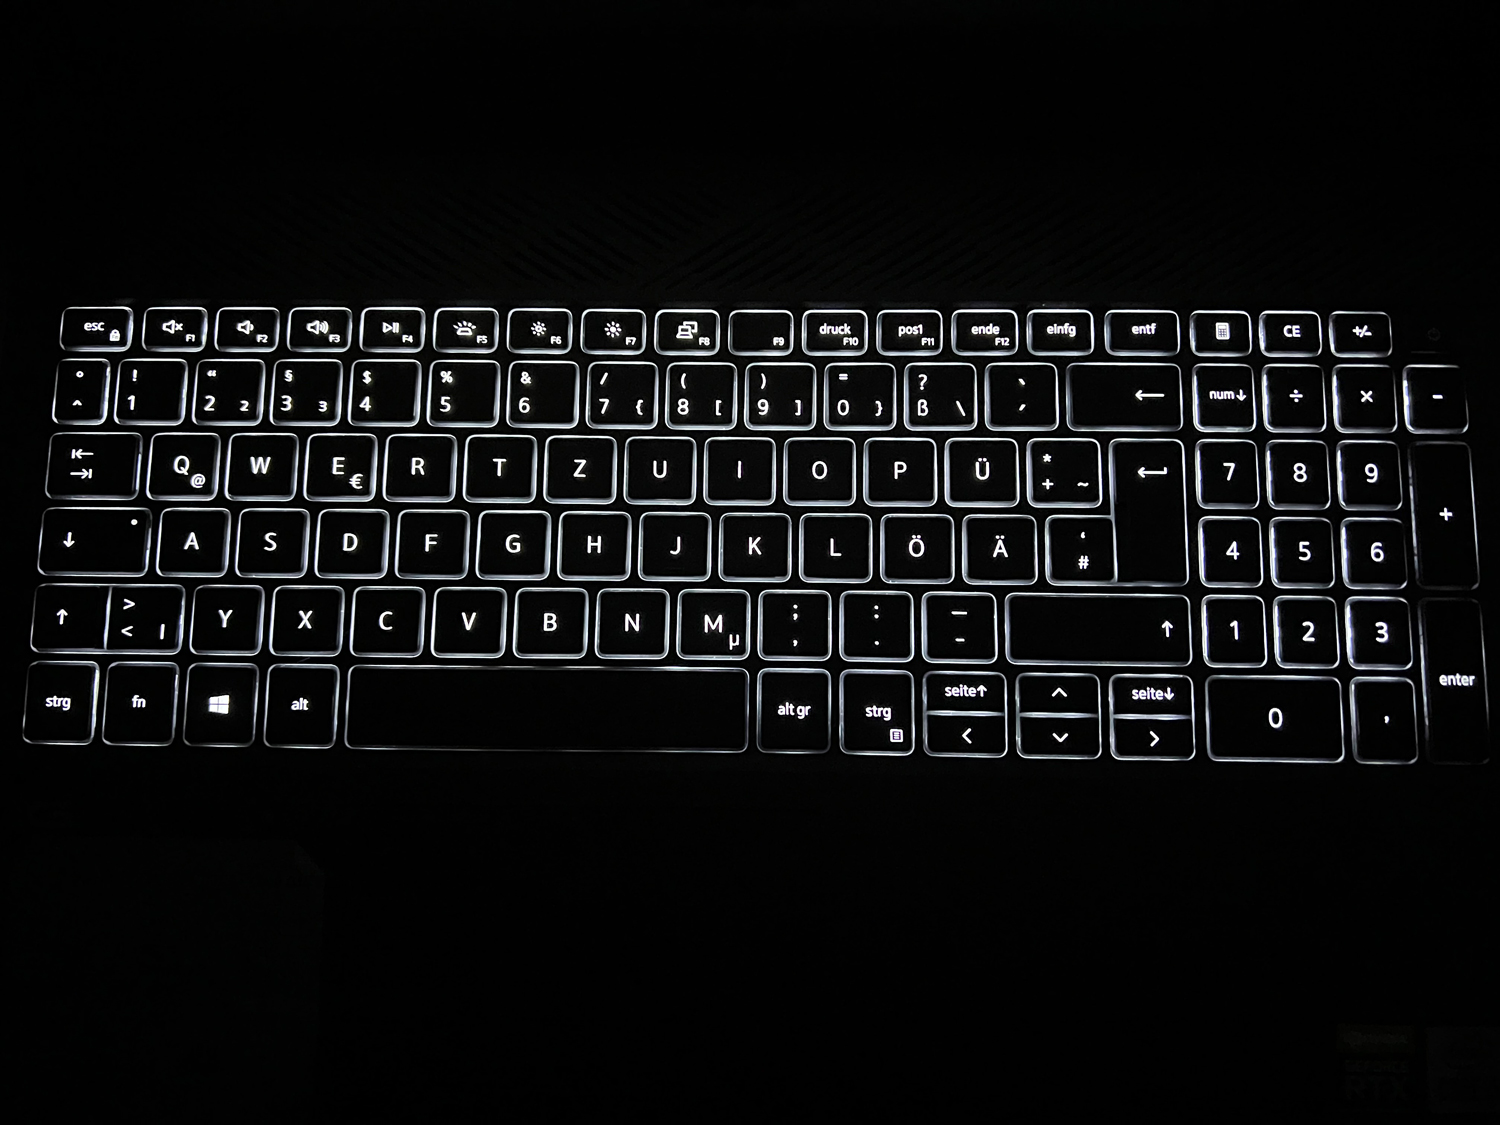
Dispositivos de entrada: Teclado e touchpad sem problemas
O teclado em chiclet iluminado com o teclado numérico que o acompanha é idêntico ao da Edição Ryzen, razão pela qual nos referimos a a revisão desta última neste ponto. Você pode encontrar mais informações sobre a qualidade e a experiência de digitação, assim como o touchpad de 10,5 x 6 cm
Mostrar: Computador portátil para jogos Dell com uma tela rápida de 120 Hz, com baixo contraste


Ao contrário do painel BOE do modelo AMD, a Dell usou seu próprio display IPS neste 5510. As especificações de base são idênticas: 15,6 polegadas diagonal, 1.920x1.080 pixels (Full HD), e uma taxa de atualização de 120 Hz.
Em termos das medidas tradicionais, o painel aqui instalado é, em grande parte, ao par. Enquanto os valores de brilho da tela igualmente mate são marginalmente mais altos, outras medidas, tais como o contraste extremamente baixo, têm pontuação pior.
O que é impressionante é que os tempos de resposta do painel Dell são significativamente mais lentos do que os da variante AMD. Com 27 ms (preto ao branco) e 35 ms (50% cinza a 80% cinza), respectivamente, eles são cerca de 10 ms mais altos em média, o que não é bom para um laptop para jogos. Isto significa que as taxas estão abaixo da média geral, o que diminui ligeiramente a vantagem de um painel de 120 Hz.
| |||||||||||||||||||||||||
iluminação: 87 %
iluminação com acumulador: 289 cd/m²
Contraste: 267:1 (Preto: 1.085 cd/m²)
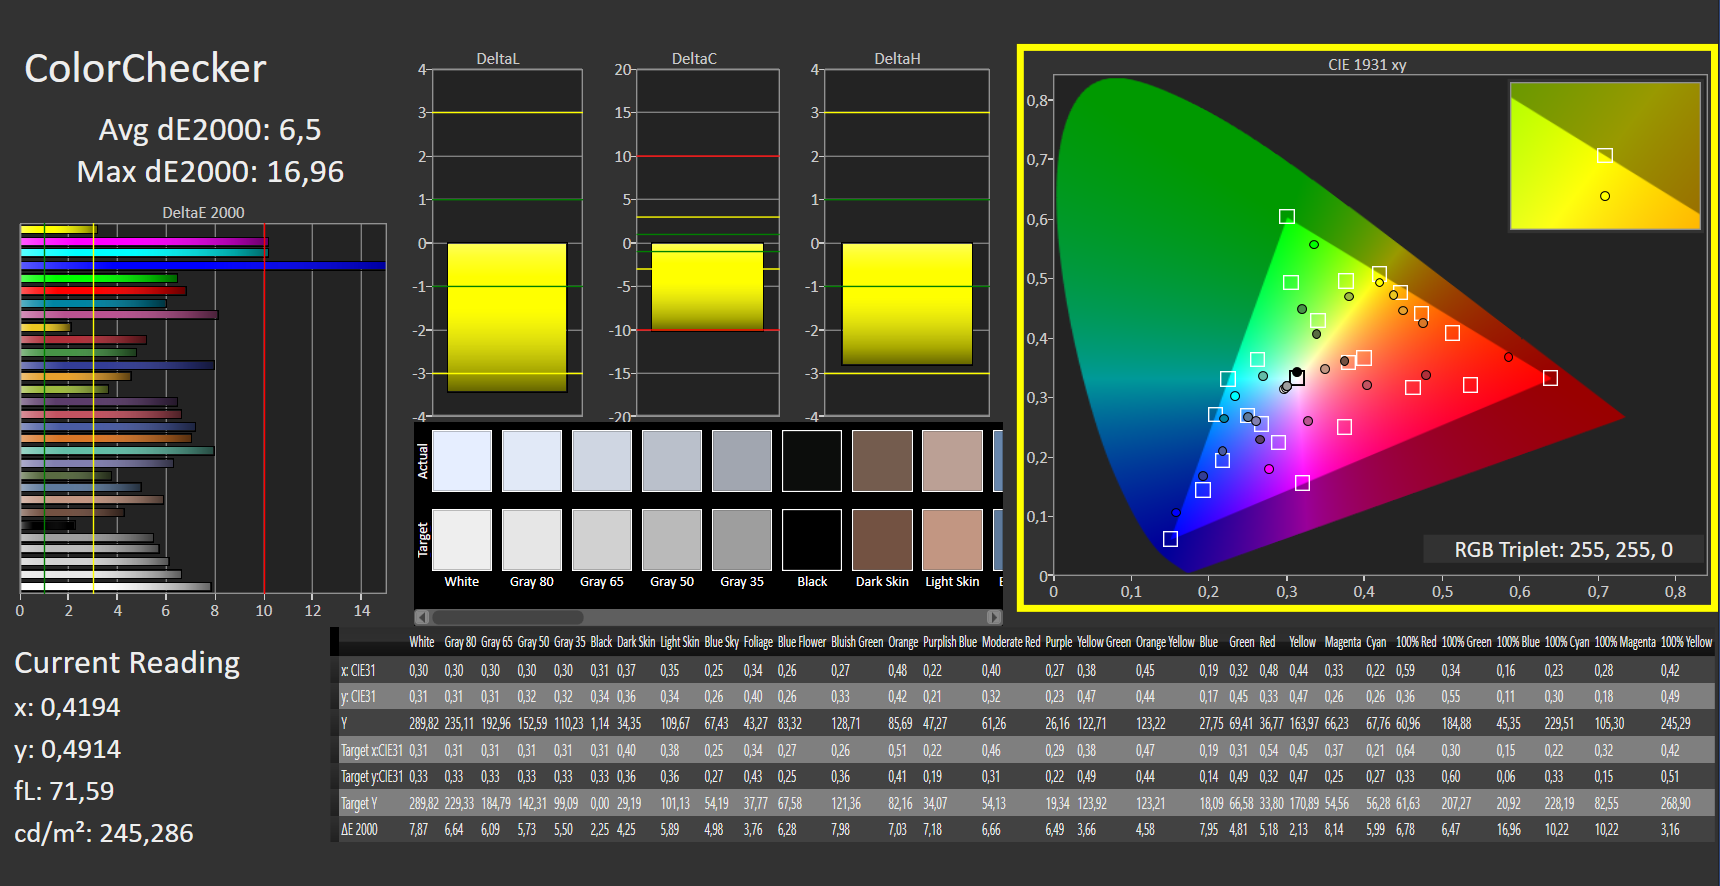
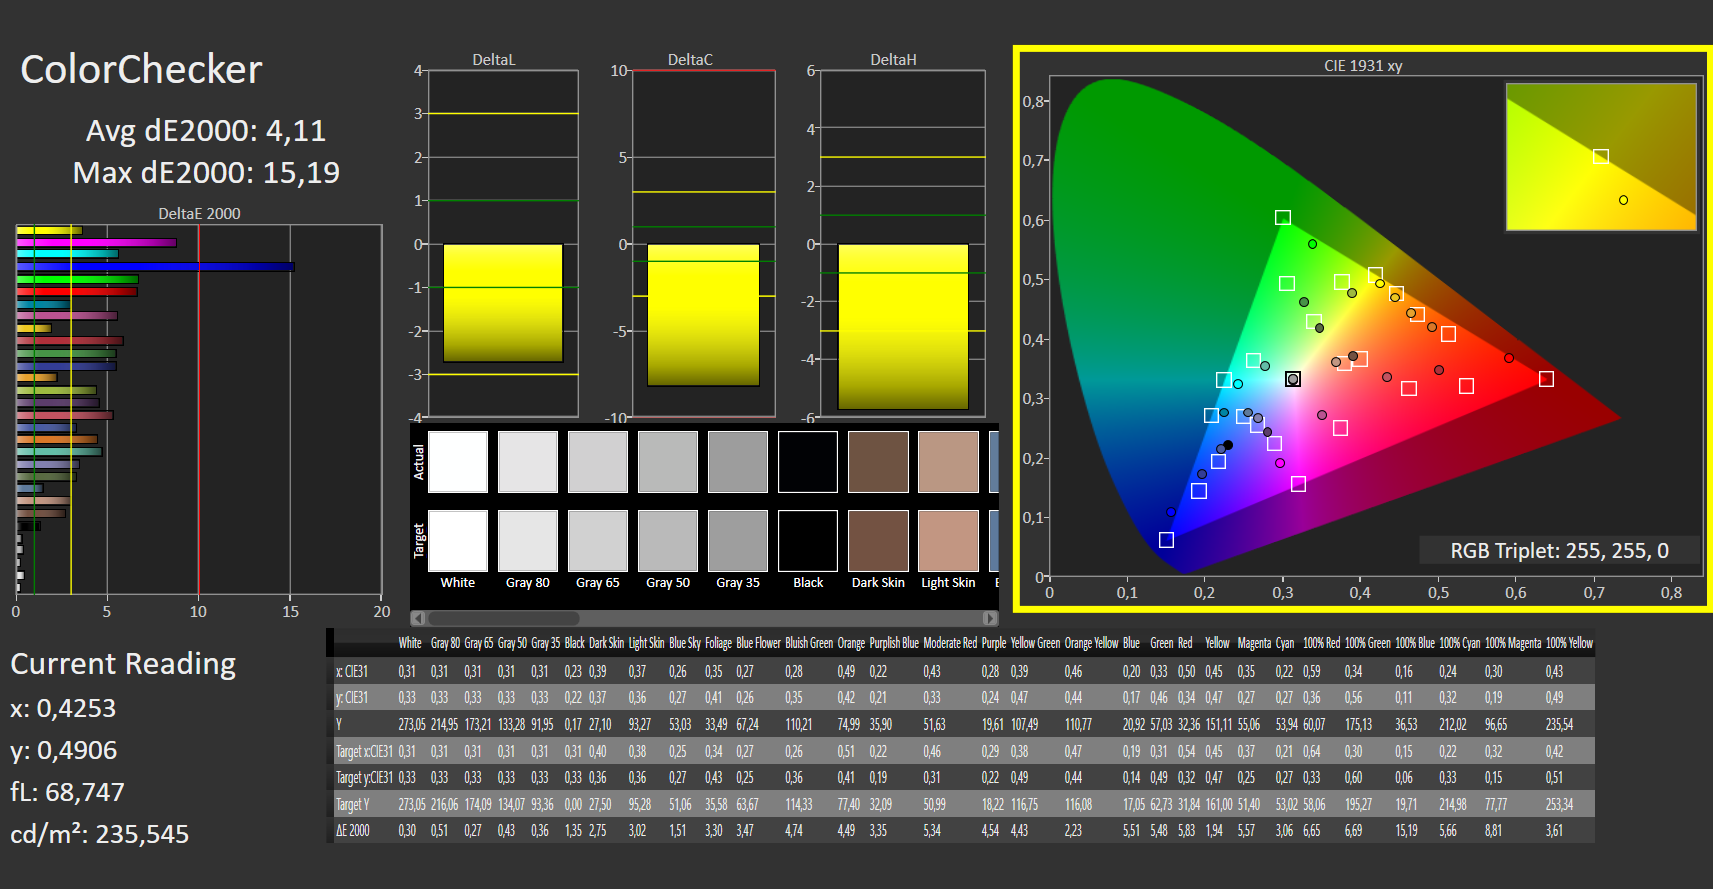
ΔE ColorChecker Calman: 6.5 | ∀{0.5-29.43 Ø4.71}
calibrated: 4.11
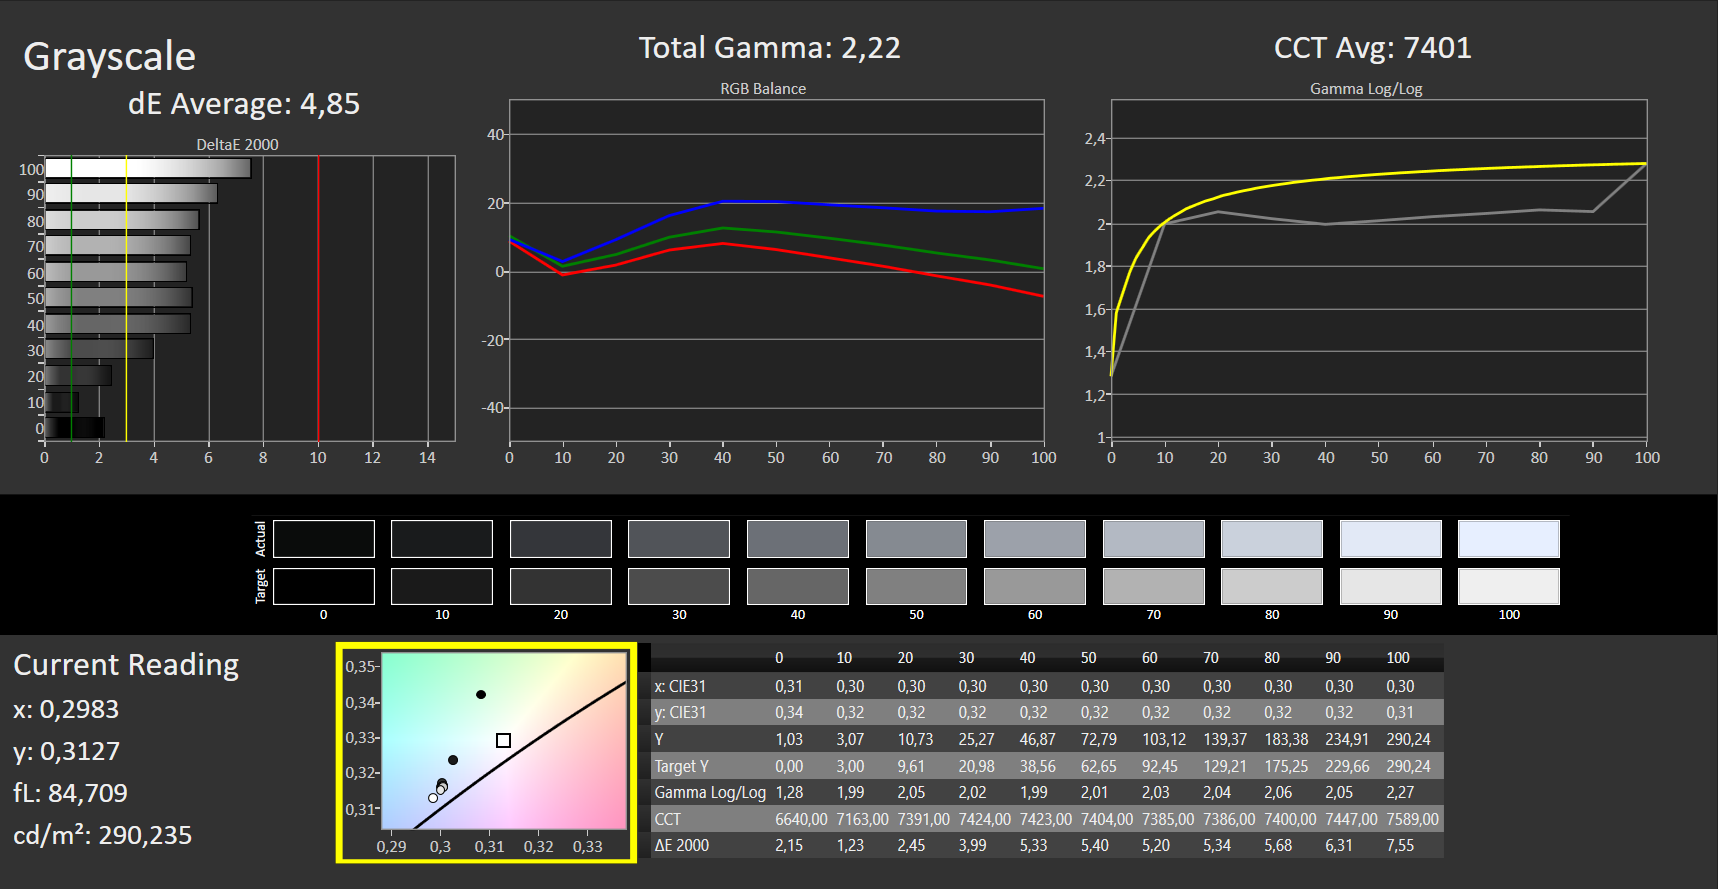
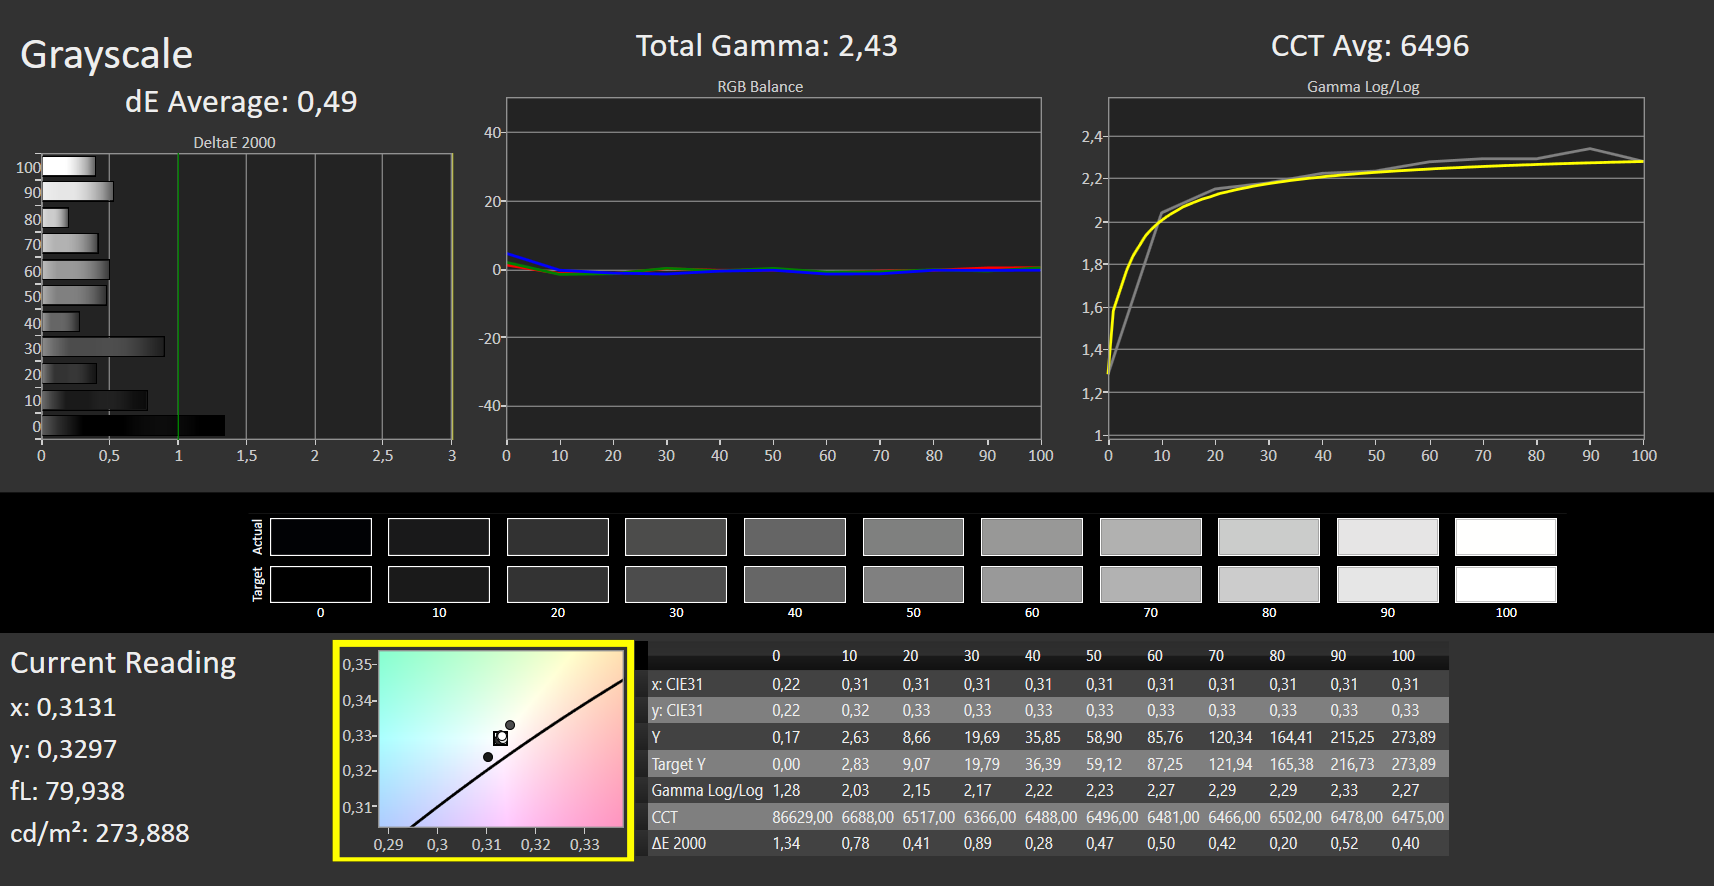
ΔE Greyscale Calman: 4.85 | ∀{0.09-98 Ø4.96}
42.2% AdobeRGB 1998 (Argyll 3D)
61.4% sRGB (Argyll 3D)
40.8% Display P3 (Argyll 3D)
Gamma: 2.22
CCT: 7401 K
| Dell G15 5510-43NHT Dell 156GL05, IPS, 1920x1080, 15.6" | Lenovo Ideapad Gaming 3 15IHU-82K1002RGE LEN156FHD, IPS, 1920x1080, 15.6" | Dell G15 5515 BOE092A, IPS, 1920x1080, 15.6" | Acer Aspire Nitro 5 AN515-55-57GF Chi Mei CMN N156HRA-EA1, IPS, 1920x1080, 15.6" | Gigabyte G5 GD Chi Mei N156HRA-EA1, IPS, 1920x1080, 15.6" | |
|---|---|---|---|---|---|
| Display | -3% | -5% | 4% | 2% | |
| Display P3 Coverage (%) | 40.8 | 39.7 -3% | 39.1 -4% | 42.54 4% | 41.8 2% |
| sRGB Coverage (%) | 61.4 | 59.6 -3% | 56.9 -7% | 63.5 3% | 62.3 1% |
| AdobeRGB 1998 Coverage (%) | 42.2 | 41.1 -3% | 40.4 -4% | 44.02 4% | 43.2 2% |
| Response Times | -32% | 33% | 9% | 8% | |
| Response Time Grey 50% / Grey 80% * (ms) | 35 ? | 46.4 ? -33% | 25.2 ? 28% | 33.8 ? 3% | 34.4 ? 2% |
| Response Time Black / White * (ms) | 27 ? | 35.2 ? -30% | 16.8 ? 38% | 23.2 ? 14% | 23.2 ? 14% |
| PWM Frequency (Hz) | 200 ? | ||||
| Screen | 57% | 29% | 67% | 63% | |
| Brightness middle (cd/m²) | 290 | 307 6% | 278 -4% | 288 -1% | 261 -10% |
| Brightness (cd/m²) | 267 | 292 9% | 262 -2% | 262 -2% | 246 -8% |
| Brightness Distribution (%) | 87 | 88 1% | 83 -5% | 88 1% | 87 0% |
| Black Level * (cd/m²) | 1.085 | 0.21 81% | 0.36 67% | 0.21 81% | 0.19 82% |
| Contrast (:1) | 267 | 1462 448% | 772 189% | 1371 413% | 1374 415% |
| Colorchecker dE 2000 * | 6.5 | 5.9 9% | 5.74 12% | 3.61 44% | 3.9 40% |
| Colorchecker dE 2000 max. * | 16.96 | 21.6 -27% | 19.63 -16% | 18.07 -7% | 19.26 -14% |
| Colorchecker dE 2000 calibrated * | 4.11 | 4.8 -17% | 4.7 -14% | 3.12 24% | 3.24 21% |
| Greyscale dE 2000 * | 4.85 | 4.9 -1% | 3.1 36% | 2.4 51% | 2.7 44% |
| Gamma | 2.22 99% | 2.26 97% | 2.011 109% | 2.216 99% | 2.248 98% |
| CCT | 7401 88% | 6504 100% | 6207 105% | 6675 97% | 6828 95% |
| Color Space (Percent of AdobeRGB 1998) (%) | 44 | ||||
| Color Space (Percent of sRGB) (%) | 62 | ||||
| Média Total (Programa/Configurações) | 7% /
31% | 19% /
22% | 27% /
45% | 24% /
42% |
* ... menor é melhor
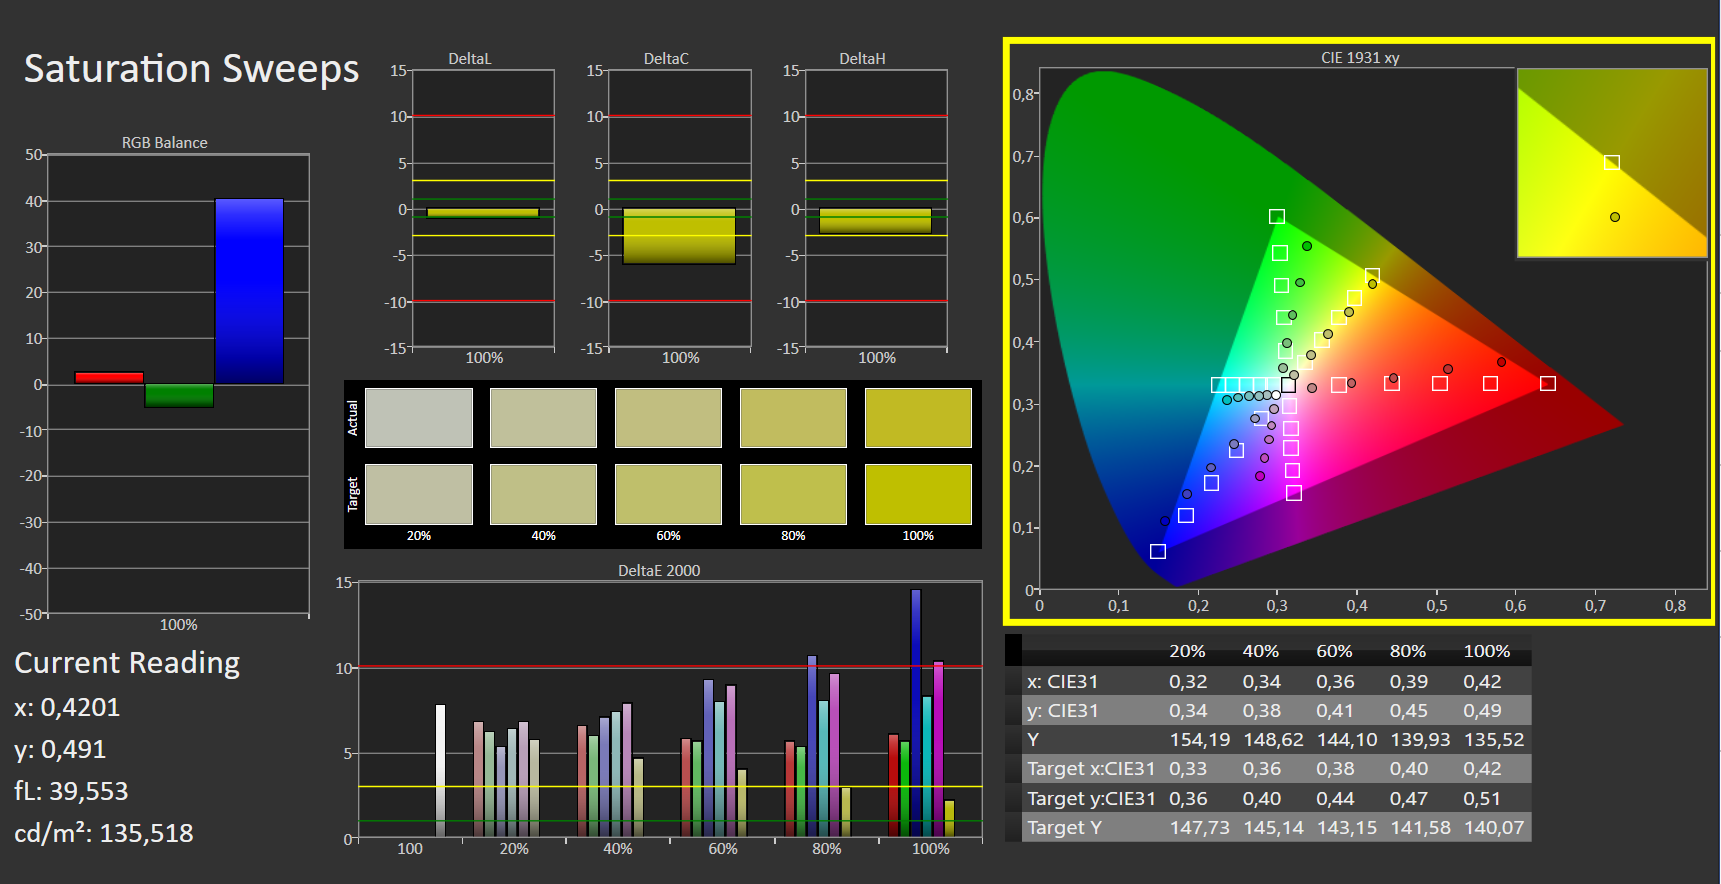
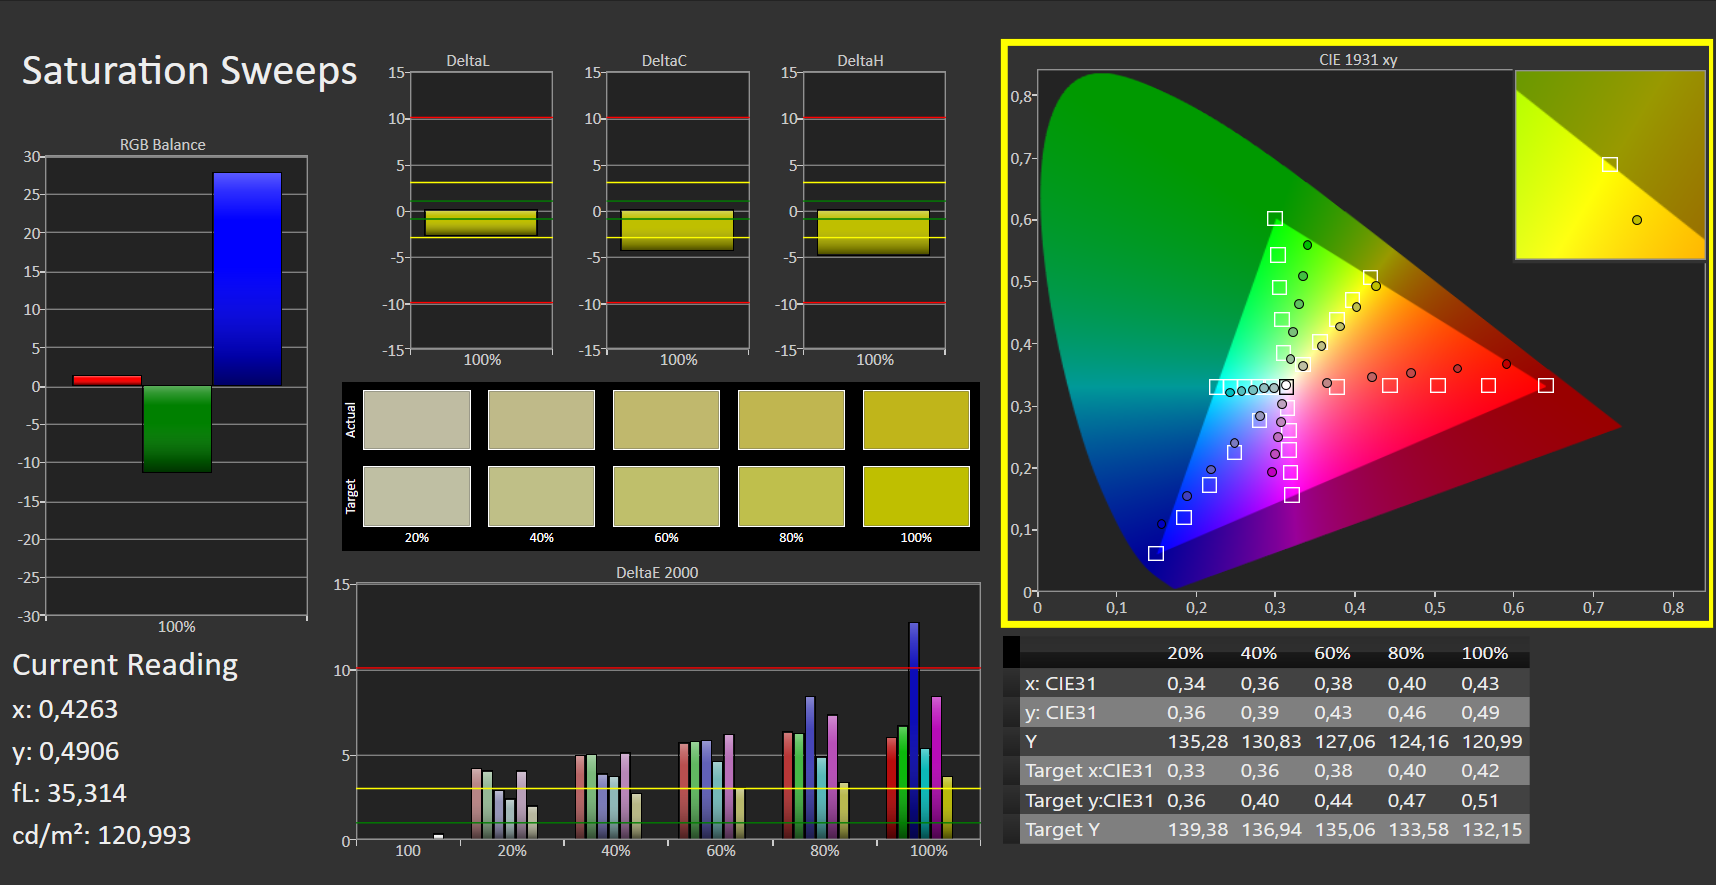
O painel Dell cobre os espaços de cor AdobeRGB (41%), sRGB (61%) e DCI-P3 (42%) melhor do que a alternativa AMD em nossa unidade de revisão. Fora da caixa, a reprodução de cores está abaixo da média, mas pode ser ligeiramente melhorada através de calibração
Exibir tempos de resposta
| ↔ Tempo de resposta preto para branco | ||
|---|---|---|
| 27 ms ... ascensão ↗ e queda ↘ combinadas | ↗ 14 ms ascensão |  |
| ↘ 13 ms queda | ||
| A tela mostra taxas de resposta relativamente lentas em nossos testes e pode ser muito lenta para os jogadores. Em comparação, todos os dispositivos testados variam de 0.1 (mínimo) a 240 (máximo) ms. » 67 % de todos os dispositivos são melhores. Isso significa que o tempo de resposta medido é pior que a média de todos os dispositivos testados (19.8 ms). | ||
| ↔ Tempo de resposta 50% cinza a 80% cinza | ||
| 35 ms ... ascensão ↗ e queda ↘ combinadas | ↗ 17 ms ascensão |  |
| ↘ 18 ms queda | ||
| A tela mostra taxas de resposta lentas em nossos testes e será insatisfatória para os jogadores. Em comparação, todos os dispositivos testados variam de 0.165 (mínimo) a 636 (máximo) ms. » 49 % de todos os dispositivos são melhores. Isso significa que o tempo de resposta medido é pior que a média de todos os dispositivos testados (31 ms). | ||
Cintilação da tela / PWM (modulação por largura de pulso)
| Tela tremeluzindo / PWM não detectado |  | ||
[pwm_comparison] Em comparação: 52 % de todos os dispositivos testados não usam PWM para escurecer a tela. Se PWM foi detectado, uma média de 7754 (mínimo: 5 - máximo: 343500) Hz foi medida. | |||
O painel IPS oferece a estabilidade esperada do ângulo de visão elevado. Portanto, o conteúdo também é legível a partir de ângulos de visão muito oblíquos. Entretanto, o brilho médio do visor de cerca de 270 cd/m² é adequado, no máximo, para usar o dispositivo ao ar livre se você estiver na sombra. Seria bom se o painel fosse mais brilhante


Desempenho: Como esperado, a CPU da Intel não tem nenhuma chance
Fundamentalmente, o G15 5510 da Dell difere do G15 5510 do G15 5510 da Dell 5515 Alternativa aos Ryzen em termos de CPU. No papel, aIntel Core i5-10200H é consideravelmente menos poderoso do que o AMD Ryzen 7 5800H. Além disso, o fabricante também cortou a quantidade de memória pela metade para apenas 8 GB de DDR4-3200 SO-DIMM RAM. Era de se esperar que isto não permanecesse sem consequências nos testes de desempenho - apesar do fato de que ambas as versões utilizam o mesmo NvidiaGeForce RTX 3050 Ti GPU para notebook...
Alternativamente, a Dell também vende o G15 5510 com oIntel Core i5-10500H por um pequeno custo extra, e também oferece agora o modelo com CPUs Intel de última geração.
Condições de teste
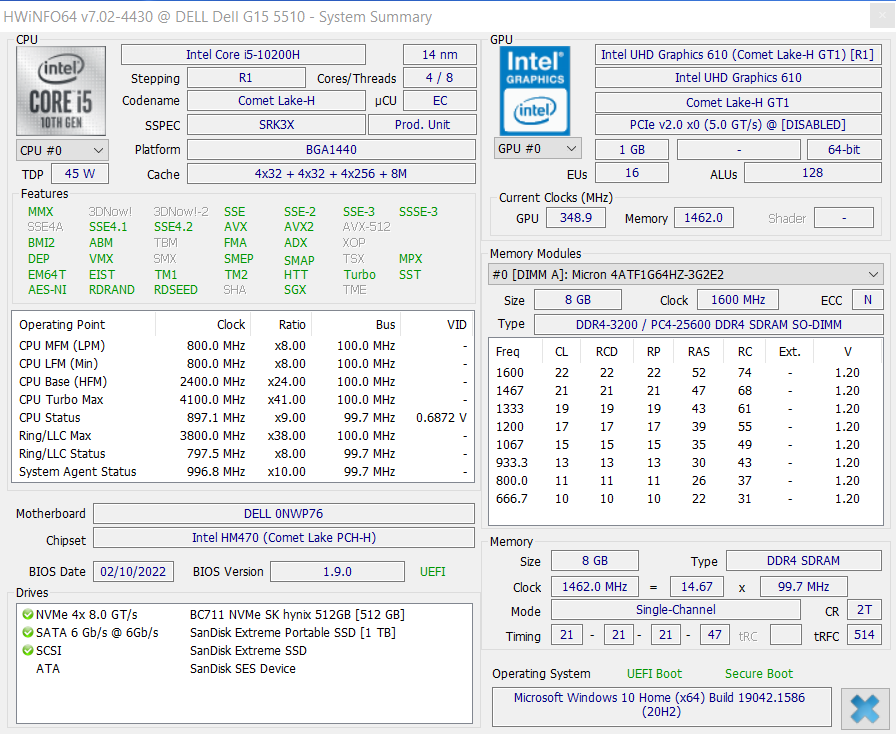
A menos que de outra forma indicado, realizamos os benchmarks com o laptop conectado e usando o modo de desempenho do Windows "Melhor Desempenho". A Dell configurou oIntel Core i5-10200H com um TDP de 45 watts. A CPU consome até 135 watts (PL2) por um curto período de tempo, mas se instala em torno de 45 watts (PL1) a longo prazo
Processador
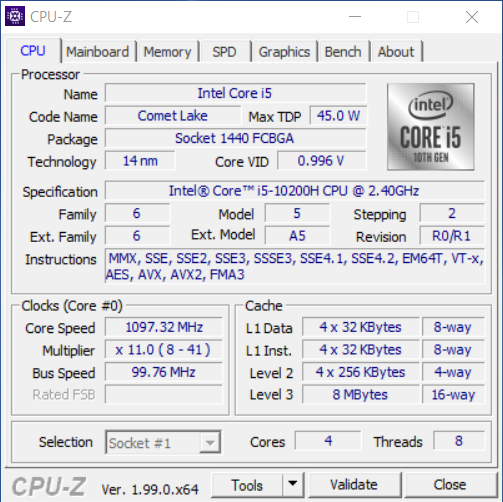
A built-inNúcleo i5-10200H faz parte da 10ª geração de processadores da Intel, e se baseia na arquitetura Comet Lake (4ª geração da arquitetura Skylake), o que significa que não é mais novinha em folha. É composto de quatro núcleos (CPU quad-core) que operam a uma velocidade de 2,4 GHz e a uma velocidade máxima de 4,1 GHz. A Dell o emparelhou com 8 GB de RAM DDR4-3200.
Em comparação com aAMD Ryzen 7 5800H (Cezanne) encontrada no Dell G15 5515o processador usado aqui é completamente inferior, como esperado, mas é também uma geração mais antiga. No teste Cinebench R15 Multi enduro, o modelo AMD atinge pontuações que são mais do dobro. A CPU pelo menos consegue manter seu desempenho constante e quase se mantém a um ritmo um pouco mais rápido.Intel Core i5-10300H encontrado no Acer Aspire Nitro 5. Também está logo atrás do Lenovo IdeaPad Gaming 3que tem umIntel Core i5-11300H isso é uma geração mais nova.
As demais referências de CPU também pintam o mesmo quadro. Como esperado, o G15 5510 normalmente ocupa os lugares mais baixos entre os modelos de comparação, devido a ter a CPU mais fraca. Ele não tem chance contra a potência AMD em seu modelo irmão, especialmente não em aplicações multi-core. As pontuações da CPU Intel de núcleo único estão cerca de 30% abaixo da concorrência da AMD em média. Com a energia da bateria, o desempenho da CPU cai de 10% a 50% em vários pontos de referência.
Cinebench R15 Multi endurance test
Cinebench R23: Multi Core | Single Core
Cinebench R20: CPU (Multi Core) | CPU (Single Core)
Cinebench R15: CPU Multi 64Bit | CPU Single 64Bit
Blender: v2.79 BMW27 CPU
7-Zip 18.03: 7z b 4 | 7z b 4 -mmt1
Geekbench 5.5: Multi-Core | Single-Core
HWBOT x265 Benchmark v2.2: 4k Preset
LibreOffice : 20 Documents To PDF
R Benchmark 2.5: Overall mean
| CPU Performance rating | |
| Média da turma Gaming | |
| Dell G15 5515 | |
| Gigabyte G5 GD | |
| Lenovo Ideapad Gaming 3 15IHU-82K1002RGE | |
| Acer Aspire Nitro 5 AN515-55-57GF | |
| Média Intel Core i5-10200H | |
| Dell G15 5510-43NHT | |
| Cinebench R23 / Multi Core | |
| Média da turma Gaming (10488 - 42661, n=107, últimos 2 anos) | |
| Dell G15 5515 | |
| Gigabyte G5 GD | |
| Lenovo Ideapad Gaming 3 15IHU-82K1002RGE | |
| Dell G15 5510-43NHT | |
| Média Intel Core i5-10200H (n=1) | |
| Acer Aspire Nitro 5 AN515-55-57GF | |
| Cinebench R23 / Single Core | |
| Média da turma Gaming (1166 - 2415, n=107, últimos 2 anos) | |
| Gigabyte G5 GD | |
| Dell G15 5515 | |
| Lenovo Ideapad Gaming 3 15IHU-82K1002RGE | |
| Acer Aspire Nitro 5 AN515-55-57GF | |
| Dell G15 5510-43NHT | |
| Média Intel Core i5-10200H (n=1) | |
| Cinebench R20 / CPU (Multi Core) | |
| Média da turma Gaming (4029 - 16433, n=106, últimos 2 anos) | |
| Dell G15 5515 | |
| Gigabyte G5 GD | |
| Lenovo Ideapad Gaming 3 15IHU-82K1002RGE | |
| Dell G15 5510-43NHT | |
| Média Intel Core i5-10200H (n=1) | |
| Acer Aspire Nitro 5 AN515-55-57GF | |
| Cinebench R20 / CPU (Single Core) | |
| Média da turma Gaming (442 - 913, n=106, últimos 2 anos) | |
| Gigabyte G5 GD | |
| Dell G15 5515 | |
| Lenovo Ideapad Gaming 3 15IHU-82K1002RGE | |
| Acer Aspire Nitro 5 AN515-55-57GF | |
| Dell G15 5510-43NHT | |
| Média Intel Core i5-10200H (n=1) | |
| Cinebench R15 / CPU Multi 64Bit | |
| Média da turma Gaming (1578 - 6330, n=105, últimos 2 anos) | |
| Dell G15 5515 | |
| Gigabyte G5 GD | |
| Lenovo Ideapad Gaming 3 15IHU-82K1002RGE | |
| Acer Aspire Nitro 5 AN515-55-57GF | |
| Dell G15 5510-43NHT | |
| Média Intel Core i5-10200H (n=1) | |
| Cinebench R15 / CPU Single 64Bit | |
| Média da turma Gaming (188.8 - 350, n=106, últimos 2 anos) | |
| Dell G15 5515 | |
| Gigabyte G5 GD | |
| Lenovo Ideapad Gaming 3 15IHU-82K1002RGE | |
| Acer Aspire Nitro 5 AN515-55-57GF | |
| Dell G15 5510-43NHT | |
| Média Intel Core i5-10200H (n=1) | |
| Blender / v2.79 BMW27 CPU | |
| Acer Aspire Nitro 5 AN515-55-57GF | |
| Dell G15 5510-43NHT | |
| Média Intel Core i5-10200H (n=1) | |
| Lenovo Ideapad Gaming 3 15IHU-82K1002RGE | |
| Gigabyte G5 GD | |
| Dell G15 5515 | |
| Média da turma Gaming (79 - 330, n=104, últimos 2 anos) | |
| 7-Zip 18.03 / 7z b 4 | |
| Média da turma Gaming (33491 - 148086, n=105, últimos 2 anos) | |
| Dell G15 5515 | |
| Gigabyte G5 GD | |
| Acer Aspire Nitro 5 AN515-55-57GF | |
| Lenovo Ideapad Gaming 3 15IHU-82K1002RGE | |
| Dell G15 5510-43NHT | |
| Média Intel Core i5-10200H (n=1) | |
| 7-Zip 18.03 / 7z b 4 -mmt1 | |
| Média da turma Gaming (4199 - 7436, n=105, últimos 2 anos) | |
| Dell G15 5515 | |
| Gigabyte G5 GD | |
| Acer Aspire Nitro 5 AN515-55-57GF | |
| Lenovo Ideapad Gaming 3 15IHU-82K1002RGE | |
| Dell G15 5510-43NHT | |
| Média Intel Core i5-10200H (n=1) | |
| Geekbench 5.5 / Multi-Core | |
| Média da turma Gaming (6460 - 28263, n=105, últimos 2 anos) | |
| Dell G15 5515 | |
| Gigabyte G5 GD | |
| Acer Aspire Nitro 5 AN515-55-57GF | |
| Lenovo Ideapad Gaming 3 15IHU-82K1002RGE | |
| Média Intel Core i5-10200H (3564 - 4126, n=2) | |
| Dell G15 5510-43NHT | |
| Geekbench 5.5 / Single-Core | |
| Média da turma Gaming (986 - 2474, n=105, últimos 2 anos) | |
| Gigabyte G5 GD | |
| Dell G15 5515 | |
| Lenovo Ideapad Gaming 3 15IHU-82K1002RGE | |
| Acer Aspire Nitro 5 AN515-55-57GF | |
| Dell G15 5510-43NHT | |
| Média Intel Core i5-10200H (1093 - 1095, n=2) | |
| HWBOT x265 Benchmark v2.2 / 4k Preset | |
| Média da turma Gaming (11.5 - 44.4, n=105, últimos 2 anos) | |
| Dell G15 5515 | |
| Gigabyte G5 GD | |
| Lenovo Ideapad Gaming 3 15IHU-82K1002RGE | |
| Acer Aspire Nitro 5 AN515-55-57GF | |
| Dell G15 5510-43NHT | |
| Média Intel Core i5-10200H (n=1) | |
| LibreOffice / 20 Documents To PDF | |
| Dell G15 5515 | |
| Dell G15 5510-43NHT | |
| Média Intel Core i5-10200H (n=1) | |
| Acer Aspire Nitro 5 AN515-55-57GF | |
| Lenovo Ideapad Gaming 3 15IHU-82K1002RGE | |
| Média da turma Gaming (33.2 - 88.8, n=105, últimos 2 anos) | |
| Gigabyte G5 GD | |
| R Benchmark 2.5 / Overall mean | |
| Dell G15 5510-43NHT | |
| Média Intel Core i5-10200H (n=1) | |
| Acer Aspire Nitro 5 AN515-55-57GF | |
| Lenovo Ideapad Gaming 3 15IHU-82K1002RGE | |
| Gigabyte G5 GD | |
| Dell G15 5515 | |
| Média da turma Gaming (0.3439 - 0.759, n=106, últimos 2 anos) | |
* ... menor é melhor
AIDA64: FP32 Ray-Trace | FPU Julia | CPU SHA3 | CPU Queen | FPU SinJulia | FPU Mandel | CPU AES | CPU ZLib | FP64 Ray-Trace | CPU PhotoWorxx
| Performance rating | |
| Média da turma Gaming | |
| Dell G15 5515 | |
| Gigabyte G5 GD | |
| Lenovo Ideapad Gaming 3 15IHU-82K1002RGE | |
| Acer Aspire Nitro 5 AN515-55-57GF | |
| Dell G15 5510-43NHT | |
| Média Intel Core i5-10200H | |
| AIDA64 / FP32 Ray-Trace | |
| Média da turma Gaming (10227 - 85542, n=105, últimos 2 anos) | |
| Dell G15 5515 | |
| Gigabyte G5 GD | |
| Lenovo Ideapad Gaming 3 15IHU-82K1002RGE | |
| Acer Aspire Nitro 5 AN515-55-57GF | |
| Dell G15 5510-43NHT | |
| Média Intel Core i5-10200H (n=1) | |
| AIDA64 / FPU Julia | |
| Média da turma Gaming (51376 - 238426, n=105, últimos 2 anos) | |
| Dell G15 5515 | |
| Gigabyte G5 GD | |
| Acer Aspire Nitro 5 AN515-55-57GF | |
| Lenovo Ideapad Gaming 3 15IHU-82K1002RGE | |
| Dell G15 5510-43NHT | |
| Média Intel Core i5-10200H (n=1) | |
| AIDA64 / CPU SHA3 | |
| Média da turma Gaming (2180 - 10115, n=105, últimos 2 anos) | |
| Dell G15 5515 | |
| Gigabyte G5 GD | |
| Lenovo Ideapad Gaming 3 15IHU-82K1002RGE | |
| Acer Aspire Nitro 5 AN515-55-57GF | |
| Dell G15 5510-43NHT | |
| Média Intel Core i5-10200H (n=1) | |
| AIDA64 / CPU Queen | |
| Média da turma Gaming (49785 - 173351, n=90, últimos 2 anos) | |
| Dell G15 5515 | |
| Gigabyte G5 GD | |
| Acer Aspire Nitro 5 AN515-55-57GF | |
| Lenovo Ideapad Gaming 3 15IHU-82K1002RGE | |
| Dell G15 5510-43NHT | |
| Média Intel Core i5-10200H (n=1) | |
| AIDA64 / FPU SinJulia | |
| Média da turma Gaming (4424 - 33636, n=105, últimos 2 anos) | |
| Dell G15 5515 | |
| Gigabyte G5 GD | |
| Acer Aspire Nitro 5 AN515-55-57GF | |
| Dell G15 5510-43NHT | |
| Média Intel Core i5-10200H (n=1) | |
| Lenovo Ideapad Gaming 3 15IHU-82K1002RGE | |
| AIDA64 / FPU Mandel | |
| Média da turma Gaming (25115 - 128721, n=105, últimos 2 anos) | |
| Dell G15 5515 | |
| Gigabyte G5 GD | |
| Lenovo Ideapad Gaming 3 15IHU-82K1002RGE | |
| Acer Aspire Nitro 5 AN515-55-57GF | |
| Dell G15 5510-43NHT | |
| Média Intel Core i5-10200H (n=1) | |
| AIDA64 / CPU AES | |
| Dell G15 5515 | |
| Média da turma Gaming (39258 - 247074, n=105, últimos 2 anos) | |
| Gigabyte G5 GD | |
| Lenovo Ideapad Gaming 3 15IHU-82K1002RGE | |
| Acer Aspire Nitro 5 AN515-55-57GF | |
| Dell G15 5510-43NHT | |
| Média Intel Core i5-10200H (n=1) | |
| AIDA64 / CPU ZLib | |
| Média da turma Gaming (574 - 2531, n=105, últimos 2 anos) | |
| Dell G15 5515 | |
| Gigabyte G5 GD | |
| Lenovo Ideapad Gaming 3 15IHU-82K1002RGE | |
| Acer Aspire Nitro 5 AN515-55-57GF | |
| Dell G15 5510-43NHT | |
| Média Intel Core i5-10200H (n=1) | |
| AIDA64 / FP64 Ray-Trace | |
| Média da turma Gaming (5509 - 45446, n=105, últimos 2 anos) | |
| Dell G15 5515 | |
| Gigabyte G5 GD | |
| Lenovo Ideapad Gaming 3 15IHU-82K1002RGE | |
| Acer Aspire Nitro 5 AN515-55-57GF | |
| Dell G15 5510-43NHT | |
| Média Intel Core i5-10200H (n=1) | |
| AIDA64 / CPU PhotoWorxx | |
| Média da turma Gaming (12271 - 89891, n=105, últimos 2 anos) | |
| Gigabyte G5 GD | |
| Acer Aspire Nitro 5 AN515-55-57GF | |
| Dell G15 5515 | |
| Lenovo Ideapad Gaming 3 15IHU-82K1002RGE | |
| Dell G15 5510-43NHT | |
| Média Intel Core i5-10200H (n=1) | |
Desempenho do sistema
Com uma CPU mais lenta e menos - para não dizer quase muito pouca - RAM, obviamente esperamos um desempenho significativamente pior do sistema, algo que também se comprova nos resultados dos testes. O Dell G15 5510 pontua pior do que a concorrência em todos os testes PCMark 10, e repetidamente termina no fundo do campo.
Você não vai notar muito disso em aplicações comuns. Entretanto, se o dispositivo for carregado com vários ou mais programas complexos, seu desempenho atinge rapidamente seu limite.
CrossMark: Overall | Productivity | Creativity | Responsiveness
| PCMark 10 / Score | |
| Média da turma Gaming (5828 - 12414, n=93, últimos 2 anos) | |
| Dell G15 5515 | |
| Gigabyte G5 GD | |
| Lenovo Ideapad Gaming 3 15IHU-82K1002RGE | |
| Acer Aspire Nitro 5 AN515-55-57GF | |
| Dell G15 5510-43NHT | |
| Média Intel Core i5-10200H, NVIDIA GeForce RTX 3050 Ti Laptop GPU (n=1) | |
| PCMark 10 / Essentials | |
| Média da turma Gaming (8810 - 11935, n=97, últimos 2 anos) | |
| Dell G15 5515 | |
| Gigabyte G5 GD | |
| Acer Aspire Nitro 5 AN515-55-57GF | |
| Lenovo Ideapad Gaming 3 15IHU-82K1002RGE | |
| Dell G15 5510-43NHT | |
| Média Intel Core i5-10200H, NVIDIA GeForce RTX 3050 Ti Laptop GPU (n=1) | |
| PCMark 10 / Productivity | |
| Média da turma Gaming (6845 - 25323, n=95, últimos 2 anos) | |
| Lenovo Ideapad Gaming 3 15IHU-82K1002RGE | |
| Dell G15 5515 | |
| Gigabyte G5 GD | |
| Acer Aspire Nitro 5 AN515-55-57GF | |
| Dell G15 5510-43NHT | |
| Média Intel Core i5-10200H, NVIDIA GeForce RTX 3050 Ti Laptop GPU (n=1) | |
| PCMark 10 / Digital Content Creation | |
| Média da turma Gaming (7602 - 19954, n=95, últimos 2 anos) | |
| Dell G15 5515 | |
| Gigabyte G5 GD | |
| Lenovo Ideapad Gaming 3 15IHU-82K1002RGE | |
| Acer Aspire Nitro 5 AN515-55-57GF | |
| Dell G15 5510-43NHT | |
| Média Intel Core i5-10200H, NVIDIA GeForce RTX 3050 Ti Laptop GPU (n=1) | |
| CrossMark / Overall | |
| Média da turma Gaming (1366 - 2409, n=94, últimos 2 anos) | |
| Lenovo Ideapad Gaming 3 15IHU-82K1002RGE | |
| CrossMark / Productivity | |
| Média da turma Gaming (1386 - 2254, n=94, últimos 2 anos) | |
| Lenovo Ideapad Gaming 3 15IHU-82K1002RGE | |
| CrossMark / Creativity | |
| Média da turma Gaming (1343 - 2786, n=94, últimos 2 anos) | |
| Lenovo Ideapad Gaming 3 15IHU-82K1002RGE | |
| CrossMark / Responsiveness | |
| Média da turma Gaming (1226 - 2334, n=94, últimos 2 anos) | |
| Lenovo Ideapad Gaming 3 15IHU-82K1002RGE | |
| PCMark 8 Home Score Accelerated v2 | 3570 pontos | |
| PCMark 8 Creative Score Accelerated v2 | 6662 pontos | |
| PCMark 8 Work Score Accelerated v2 | 5120 pontos | |
| PCMark 10 Score | 4477 pontos | |
Ajuda | ||
| AIDA64 / Memory Copy | |
| Média da turma Gaming (21750 - 129946, n=105, últimos 2 anos) | |
| Gigabyte G5 GD | |
| Dell G15 5515 | |
| Acer Aspire Nitro 5 AN515-55-57GF | |
| Lenovo Ideapad Gaming 3 15IHU-82K1002RGE | |
| Dell G15 5510-43NHT | |
| Média Intel Core i5-10200H (n=1) | |
| AIDA64 / Memory Read | |
| Média da turma Gaming (22956 - 118858, n=105, últimos 2 anos) | |
| Gigabyte G5 GD | |
| Dell G15 5515 | |
| Acer Aspire Nitro 5 AN515-55-57GF | |
| Lenovo Ideapad Gaming 3 15IHU-82K1002RGE | |
| Dell G15 5510-43NHT | |
| Média Intel Core i5-10200H (n=1) | |
| AIDA64 / Memory Write | |
| Média da turma Gaming (22297 - 135096, n=105, últimos 2 anos) | |
| Gigabyte G5 GD | |
| Acer Aspire Nitro 5 AN515-55-57GF | |
| Dell G15 5515 | |
| Lenovo Ideapad Gaming 3 15IHU-82K1002RGE | |
| Dell G15 5510-43NHT | |
| Média Intel Core i5-10200H (n=1) | |
| AIDA64 / Memory Latency | |
| Média da turma Gaming (75.3 - 259, n=105, últimos 2 anos) | |
| Gigabyte G5 GD | |
| Lenovo Ideapad Gaming 3 15IHU-82K1002RGE | |
| Dell G15 5515 | |
| Dell G15 5510-43NHT | |
| Média Intel Core i5-10200H (n=1) | |
| Acer Aspire Nitro 5 AN515-55-57GF | |
* ... menor é melhor
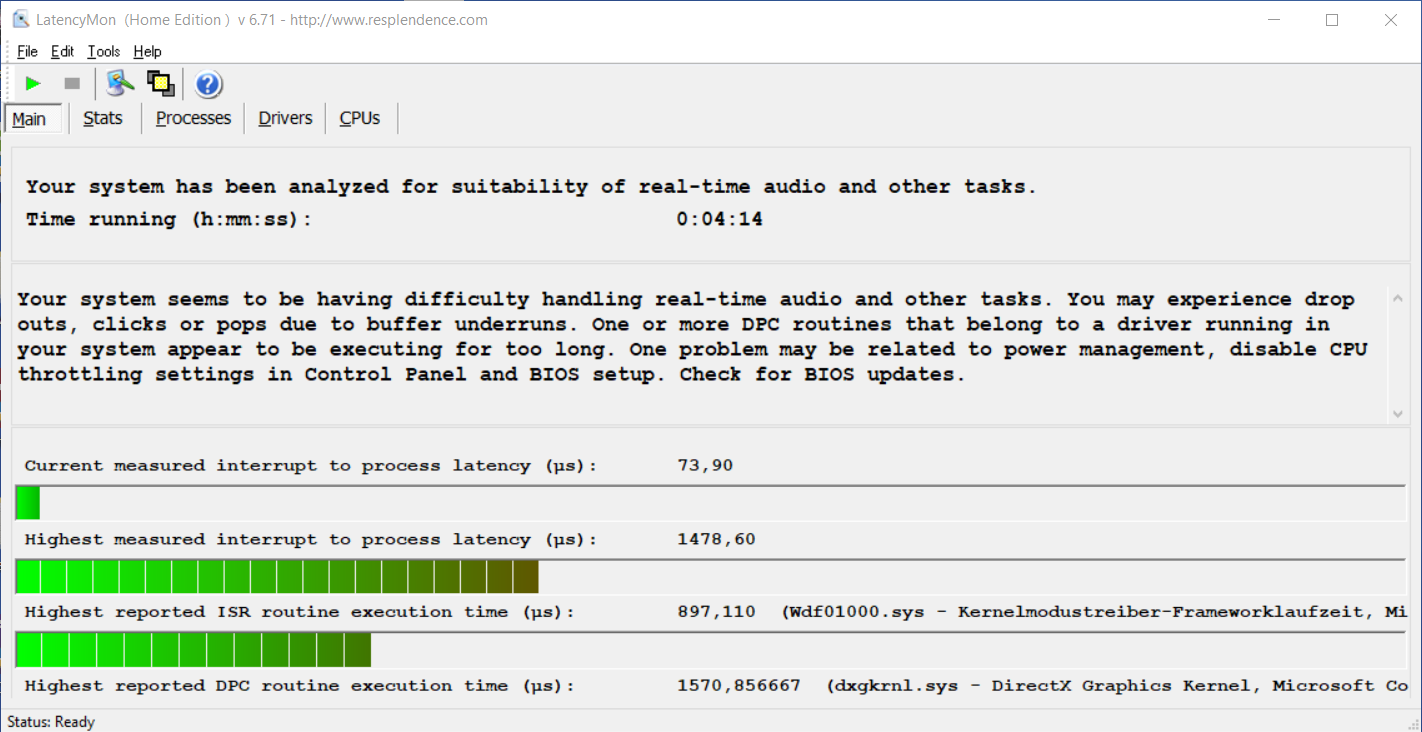
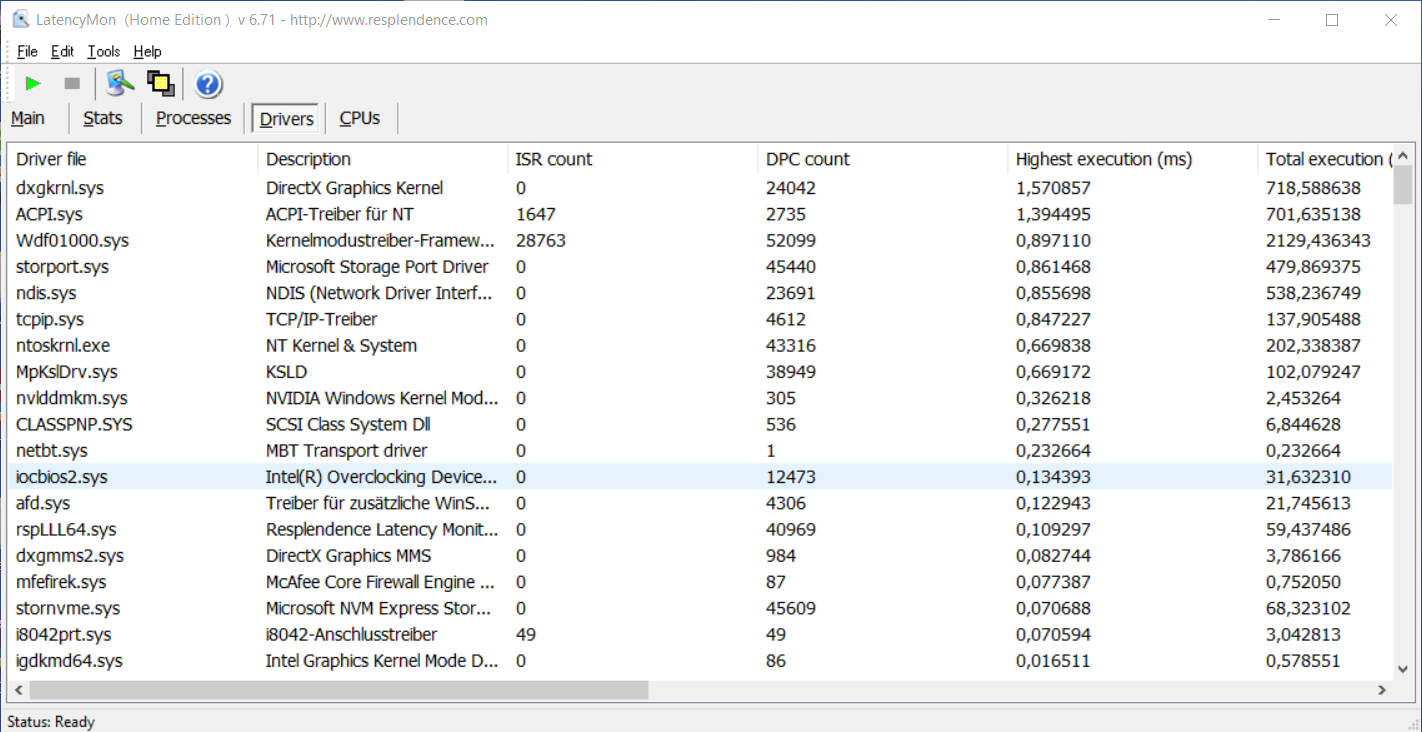
Latências DPC
O Dell G15 5510 também pontua o pior quando se trata de latências DPC, em comparação com os outros modelos no teste. Isto poderia indicar que o dispositivo é bastante inadequado para edição de áudio e vídeo em tempo real. Dito isto, a quantidade de RAM é muito baixa para programas intensivos de qualquer forma. Além disso, é importante notar que o teste é apenas um instantâneo momentâneo
| DPC Latencies / LatencyMon - interrupt to process latency (max), Web, Youtube, Prime95 | |
| Dell G15 5510-43NHT | |
| Lenovo Ideapad Gaming 3 15IHU-82K1002RGE | |
| Dell G15 5515 | |
| Acer Aspire Nitro 5 AN515-55-57GF | |
| Gigabyte G5 GD | |
* ... menor é melhor
Armazenamento
Quanto ao SSD, que também tem 512 GB e, portanto, fica cheio rapidamente se você jogar um par de jogos modernos, a Dell opta por um drive de armazenamento diferente para o modelo Intel, em comparação com a alternativa AMD. Um SSD M.2 PCIe NVMe da SK Hynix está instalado aqui, e fica atrás da unidade Samsung na versão AMD na maioria dos resultados de referência. No entanto, isto não é perceptível no uso diário, a menos que grandes quantidades de dados sejam copiadas

* ... menor é melhor
Continuous load read: DiskSpd Read Loop, Queue Depth 8
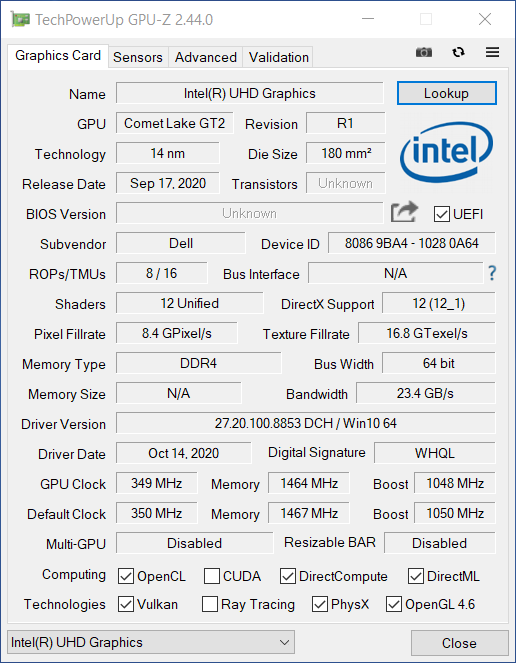
Placa gráfica
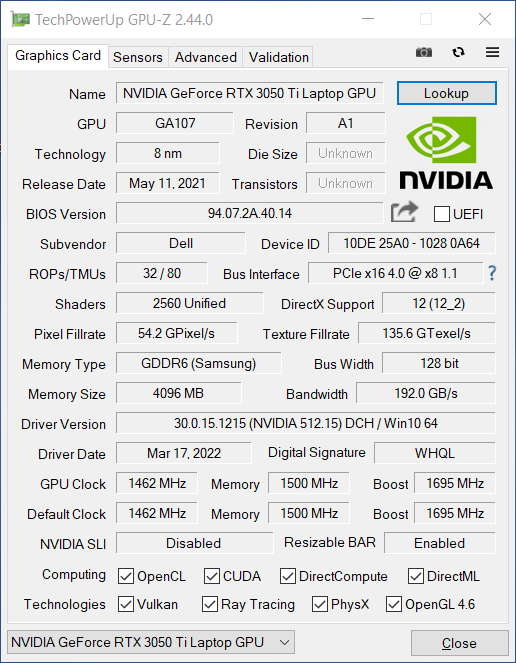
O único aspecto em que o G15 5510 pode acompanhar oG15 5515 em termos de desempenho é quando se trata da placa gráfica. Isto não é surpreendente, já que ambos os modelos estão equipados com a placa gráfica dedicadaNvidiaGeForce RTX 3050 Ti GPU para notebookque vem com 4 GB de memória gráfica GDDR6 rápida da Samsung; a GPU é configurada da mesma forma em ambos os modelos.
Novamente, a Dell escolheu um TGP de 80 watts para a GPU dedicada, permitindo que ela funcione em até 1.695 MHz. Isto é o máximo que a Nvidia permite para esta solução gráfica. Além disso, a GPU integrada da CPU, a UHD Graphics 630esta GPU entra em ação quando os requisitos gráficos não são altos, e opera de forma a economizar energia.
ONvidiaGeForce RTX 3050 Ti GPU para notebook oferece um bom desempenho no teste, e normalmente pode se posicionar acima da média de referência. Sua potência está continuamente disponível como uma pontuação de 99,1% no teste de estresse do 3DMark Time Spy. As pontuações estão no mesmo nível da versão AMD em muitos benchmarks, e são apenas um pouco mais baixas no benchmark Cloud Gate do 3DMark.
Na energia da bateria (configuração Windows "Melhor Desempenho"), o desempenho diminui significativamente. Por exemplo, a pontuação gráfica do benchmark Fire Strike do 3DMark de 6.900 pontos é mais de 50% menor do que quando conectado à tomada.
| 3DMark 11 Performance | 13046 pontos | |
| 3DMark Ice Storm Standard Score | 56573 pontos | |
| 3DMark Cloud Gate Standard Score | 22377 pontos | |
| 3DMark Fire Strike Score | 11989 pontos | |
| 3DMark Time Spy Score | 5303 pontos | |
Ajuda | ||
Desempenho do jogo
O G15 5510 está longe de ser capaz de acompanhar o desempenho do jogo da alternativa AMD, apesar de ter a mesma GPU. Isto pode ser visto quando se comparam diretamente as diferentes taxas de quadros. No entanto, a performance exibida ainda é suficiente para mais do que taxas de quadros sólidas e uma jogabilidade suave em quase todos os jogos testados, mesmo em configurações gráficas altas.
A redução de desempenho anteriormente descrita na potência da bateria faz com que a taxa de quadros do Witcher 3 caia para 30 fps na configuração gráfica mais alta - cerca de 45% menos do que quando conectado à tomada. A velocidade do relógio da GPU é de cerca de 1.000 MHz. Isto é o suficiente para uma experiência de jogo suave com este título, mas isto não é mais verdade para títulos mais novos e mais exigentes.
| Dirt 5 | |
| 1280x720 Ultra Low Preset | |
| Dell G15 5515 | |
| Média NVIDIA GeForce RTX 3050 Ti Laptop GPU (59.8 - 162, n=4) | |
| Dell G15 5510-43NHT | |
| 1920x1080 Medium Preset | |
| Dell G15 5515 | |
| Média NVIDIA GeForce RTX 3050 Ti Laptop GPU (58.9 - 84.3, n=5) | |
| Dell G15 5510-43NHT | |
| 1920x1080 High Preset | |
| Dell G15 5515 | |
| Média NVIDIA GeForce RTX 3050 Ti Laptop GPU (51.2 - 69.1, n=5) | |
| Dell G15 5510-43NHT | |
| 1920x1080 Ultra High Preset | |
| Dell G15 5515 | |
| Média NVIDIA GeForce RTX 3050 Ti Laptop GPU (40.5 - 54.3, n=5) | |
| Dell G15 5510-43NHT | |
| F1 2021 | |
| 1280x720 Ultra Low Preset | |
| Gigabyte G5 GD | |
| Dell G15 5515 | |
| Média NVIDIA GeForce RTX 3050 Ti Laptop GPU (105 - 230, n=11) | |
| Lenovo Ideapad Gaming 3 15IHU-82K1002RGE | |
| Dell G15 5510-43NHT | |
| 1920x1080 Medium Preset AA:T AF:16x | |
| Dell G15 5515 | |
| Gigabyte G5 GD | |
| Média NVIDIA GeForce RTX 3050 Ti Laptop GPU (72 - 150, n=11) | |
| Lenovo Ideapad Gaming 3 15IHU-82K1002RGE | |
| Dell G15 5510-43NHT | |
| 1920x1080 High Preset AA:T AF:16x | |
| Dell G15 5515 | |
| Gigabyte G5 GD | |
| Média NVIDIA GeForce RTX 3050 Ti Laptop GPU (68 - 131, n=11) | |
| Lenovo Ideapad Gaming 3 15IHU-82K1002RGE | |
| Dell G15 5510-43NHT | |
| 1920x1080 Ultra High Preset + Raytracing AA:T AF:16x | |
| Dell G15 5515 | |
| Gigabyte G5 GD | |
| Média NVIDIA GeForce RTX 3050 Ti Laptop GPU (44.4 - 69, n=11) | |
| Dell G15 5510-43NHT | |
| Lenovo Ideapad Gaming 3 15IHU-82K1002RGE | |
| New World | |
| 1280x720 Low Video Quality | |
| Dell G15 5515 | |
| Gigabyte G5 GD | |
| Média NVIDIA GeForce RTX 3050 Ti Laptop GPU (40.1 - 99.3, n=3) | |
| Dell G15 5510-43NHT | |
| 1920x1080 Medium Video Quality | |
| Dell G15 5515 | |
| Gigabyte G5 GD | |
| Média NVIDIA GeForce RTX 3050 Ti Laptop GPU (35.1 - 73.6, n=4) | |
| Dell G15 5510-43NHT | |
| 1920x1080 High Video Quality | |
| Dell G15 5515 | |
| Gigabyte G5 GD | |
| Média NVIDIA GeForce RTX 3050 Ti Laptop GPU (33.6 - 68.9, n=4) | |
| Dell G15 5510-43NHT | |
| 1920x1080 Very High Video Quality | |
| Dell G15 5515 | |
| Gigabyte G5 GD | |
| Média NVIDIA GeForce RTX 3050 Ti Laptop GPU (24.9 - 52.2, n=4) | |
| Dell G15 5510-43NHT | |
| Far Cry 6 | |
| 1280x720 Low Graphics Quality | |
| Média da turma Gaming (n=1últimos 2 anos) | |
| Gigabyte G5 GD | |
| Dell G15 5515 | |
| Média NVIDIA GeForce RTX 3050 Ti Laptop GPU (59 - 107, n=2) | |
| Dell G15 5510-43NHT | |
| 1920x1080 Medium Graphics Quality AA:SM | |
| Média da turma Gaming (n=1últimos 2 anos) | |
| Dell G15 5515 | |
| Gigabyte G5 GD | |
| Média NVIDIA GeForce RTX 3050 Ti Laptop GPU (48 - 86, n=3) | |
| Dell G15 5510-43NHT | |
| 1920x1080 High Graphics Quality AA:T | |
| Média da turma Gaming (n=1últimos 2 anos) | |
| Dell G15 5515 | |
| Gigabyte G5 GD | |
| Média NVIDIA GeForce RTX 3050 Ti Laptop GPU (44 - 79, n=3) | |
| Dell G15 5510-43NHT | |
| 1920x1080 Ultra Graphics Quality + HD Textures AA:T | |
| Média da turma Gaming (n=1últimos 2 anos) | |
| Gigabyte G5 GD | |
| Média NVIDIA GeForce RTX 3050 Ti Laptop GPU (53 - 62, n=2) | |
| Dell G15 5515 | |
| Cyberpunk 2077 1.6 | |
| 1920x1080 Low Preset | |
| Média NVIDIA GeForce RTX 3050 Ti Laptop GPU (48.2 - 81.9, n=9) | |
| Lenovo Ideapad Gaming 3 15IHU-82K1002RGE | |
| Dell G15 5510-43NHT | |
| 1920x1080 Medium Preset | |
| Média NVIDIA GeForce RTX 3050 Ti Laptop GPU (47.4 - 67.4, n=9) | |
| Lenovo Ideapad Gaming 3 15IHU-82K1002RGE | |
| Dell G15 5510-43NHT | |
| 1920x1080 High Preset | |
| Dell G15 5510-43NHT | |
| Média NVIDIA GeForce RTX 3050 Ti Laptop GPU (39 - 51.5, n=9) | |
| Lenovo Ideapad Gaming 3 15IHU-82K1002RGE | |
| 1920x1080 Ultra Preset | |
| Dell G15 5510-43NHT | |
| Média NVIDIA GeForce RTX 3050 Ti Laptop GPU (31 - 50.5, n=9) | |
| Lenovo Ideapad Gaming 3 15IHU-82K1002RGE | |
Como mostra o teste de carga de cerca de uma hora do The Witcher 3 em resolução Full HD e em configurações de qualidade máxima, não apenas a unidade gráfica explora plenamente seu potencial, mas também pode manter esta taxa constante ao longo do tempo
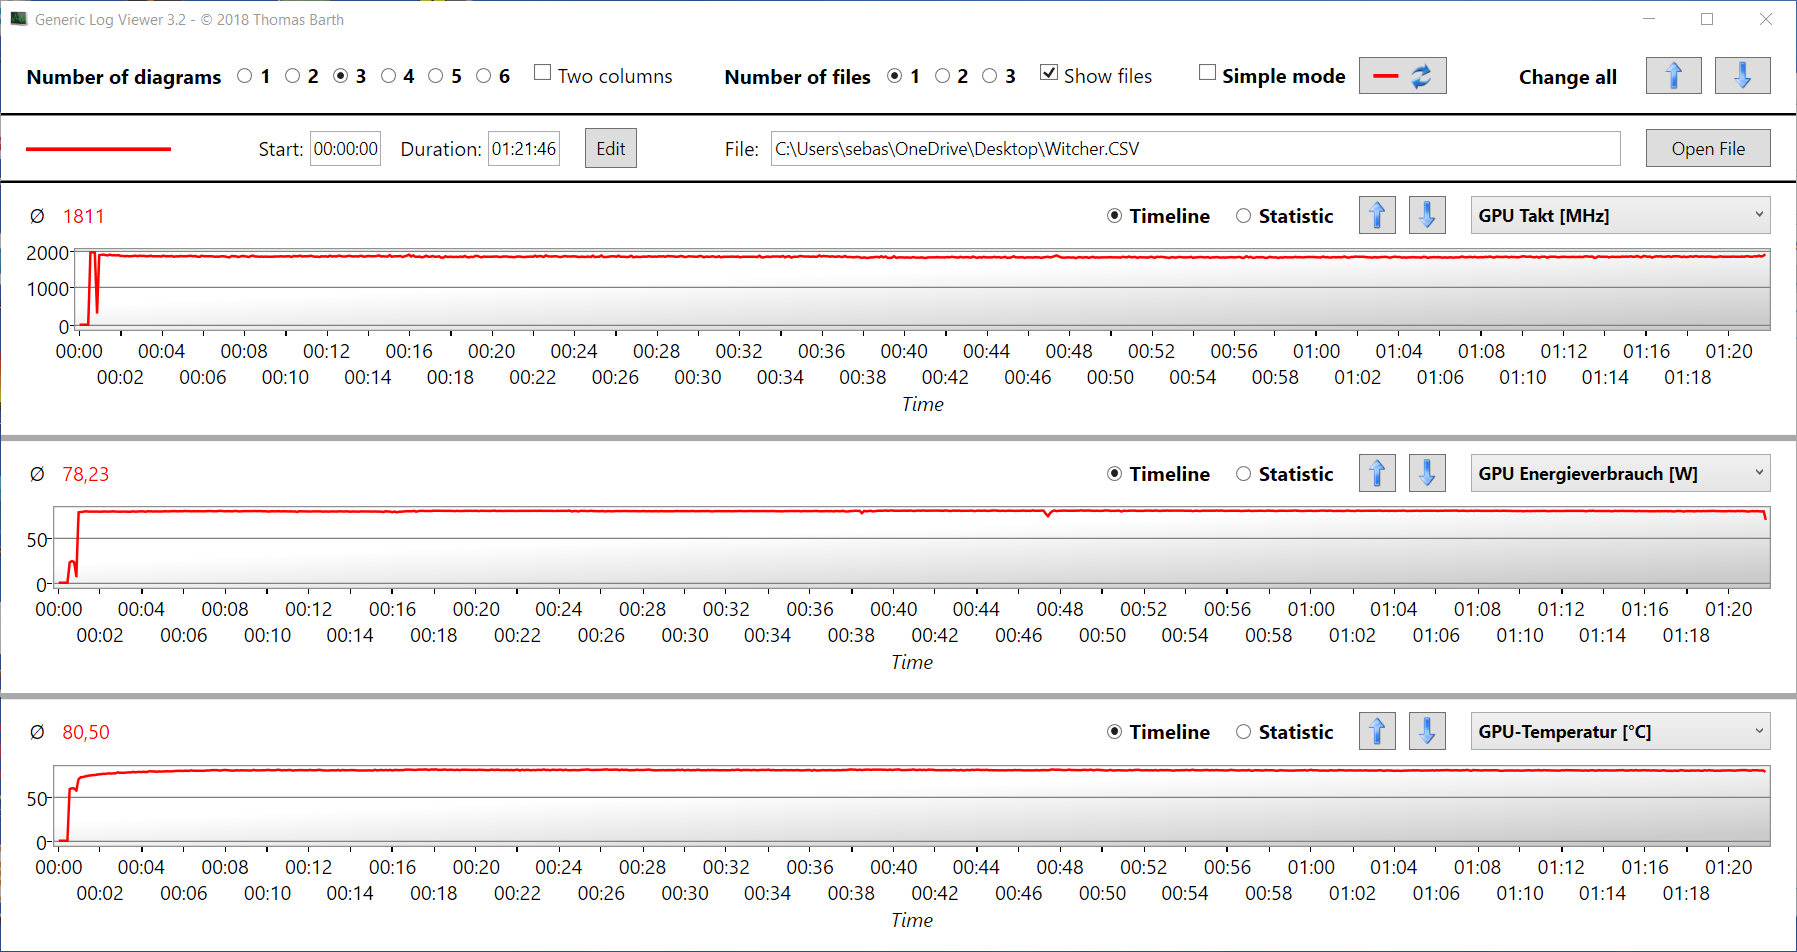
The Witcher 3 FPS diagram
| baixo | média | alto | ultra | |
|---|---|---|---|---|
| GTA V (2015) | 102.7 | 88.4 | 62.2 | 39.6 |
| The Witcher 3 (2015) | 132.9 | 107.5 | 75.3 | 54.4 |
| Dota 2 Reborn (2015) | 101.5 | 88.8 | 78.8 | 73.7 |
| Final Fantasy XV Benchmark (2018) | 67.2 | 51.5 | 39.1 | |
| X-Plane 11.11 (2018) | 64.9 | 54.6 | 48.8 | |
| Far Cry 5 (2018) | 69 | 54 | 52 | 49 |
| Strange Brigade (2018) | 183.7 | 115.9 | 95.1 | 94.9 |
| Dirt 5 (2020) | 59.8 | 58.9 | 52.7 | 44.9 |
| F1 2021 (2021) | 105 | 72 | 68 | 47 |
| New World (2021) | 40.1 | 35.1 | 33.6 | 24.9 |
| Far Cry 6 (2021) | 59 | 48 | 44 | |
| GRID Legends (2022) | 66.6 | 61.8 | 57.1 | 52.9 |
| Cyberpunk 2077 1.6 (2022) | 48.2 | 48 | 50 | 50.5 |
Emissões: O G15 5510 é às vezes silencioso, às vezes barulhento, e às vezes mais ou menos
Emissões sonoras
O Dell G15 5510 permanece discreta e silenciosamente em segundo plano em uso ocioso e sob carga baixa, por exemplo, enquanto navega na web, faz streaming, ou realiza tarefas de escritório. Quando ele passa por seus passos durante os jogos, os dois ventiladores entram em ação e giram a um passo e volume bastante consistentes de até cerca de 52 dB. Isto é mais alto do que a maioria dos modelos de comparação, como o Dell G15 5515, e fica incômodo com o tempo; no entanto, não é muito desconfortável devido ao fato de que o arremesso é consistente, pelo menos. Além disso, a amostra de revisão não emite ruídos irritantes como choro de bobina ou similares
Barulho
| Ocioso |
| 25 / 25 / 25 dB |
| Carga |
| 52.2 / 52.2 dB |
 | ||
30 dB silencioso 40 dB(A) audível 50 dB(A) ruidosamente alto |
||
min: | ||
| Dell G15 5510-43NHT GeForce RTX 3050 Ti Laptop GPU, i5-10200H, SK Hynix BC711 HFM512GD3HX015N | Lenovo Ideapad Gaming 3 15IHU-82K1002RGE GeForce RTX 3050 Ti Laptop GPU, i5-11300H, Micron 2210 MTFDHBA512QFD | Dell G15 5515 GeForce RTX 3050 Ti Laptop GPU, R7 5800H, Samsung PM991a MZ9LQ512HBLU-00BD1 | Acer Aspire Nitro 5 AN515-55-57GF GeForce RTX 3060 Laptop GPU, i5-10300H, WDC PC SN530 SDBPNPZ-512G | Gigabyte G5 GD GeForce RTX 3050 4GB Laptop GPU, i5-11400H, ESR512GTLG-E6GBTNB4 | |
|---|---|---|---|---|---|
| Noise | 2% | 1% | -6% | -11% | |
| desligado / ambiente * (dB) | 25 | 23.9 4% | 24 4% | 25 -0% | 24 4% |
| Idle Minimum * (dB) | 25 | 23.9 4% | 25 -0% | 25 -0% | 29 -16% |
| Idle Average * (dB) | 25 | 26.8 -7% | 26 -4% | 30 -20% | 30 -20% |
| Idle Maximum * (dB) | 25 | 26.8 -7% | 30 -20% | 33 -32% | 32 -28% |
| Load Average * (dB) | 52.2 | 43.5 17% | 44 16% | 46 12% | 53 -2% |
| Load Maximum * (dB) | 52.2 | 53.1 -2% | 48 8% | 50 4% | 54 -3% |
| Witcher 3 ultra * (dB) | 43.5 | 44 | 47 | 52 |
* ... menor é melhor
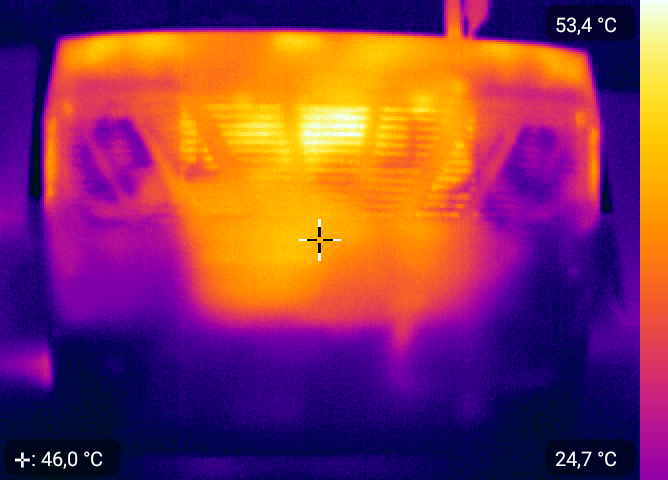
Temperatura
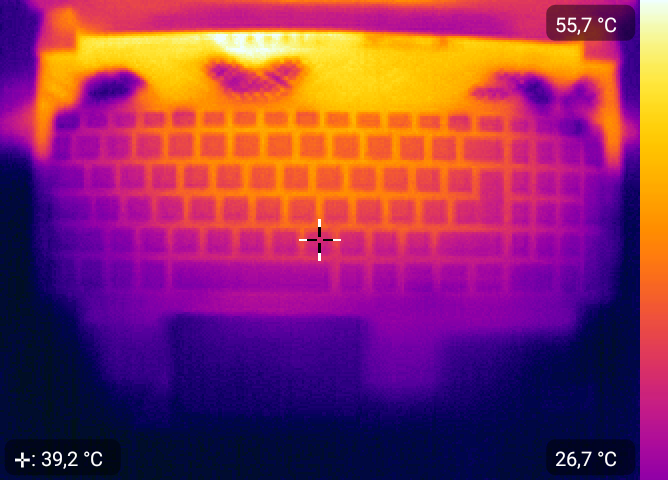
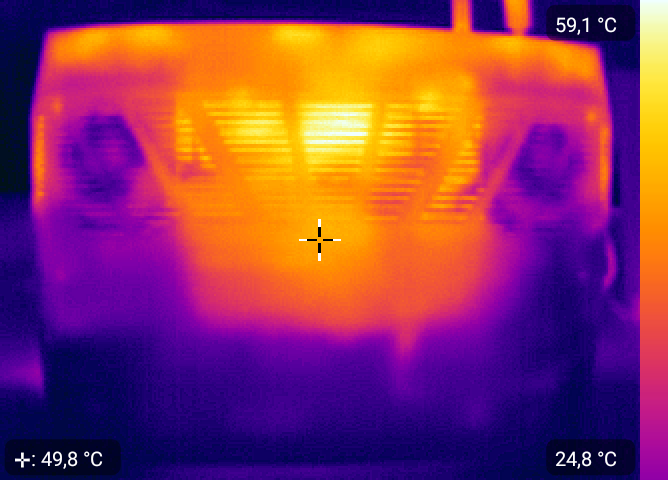
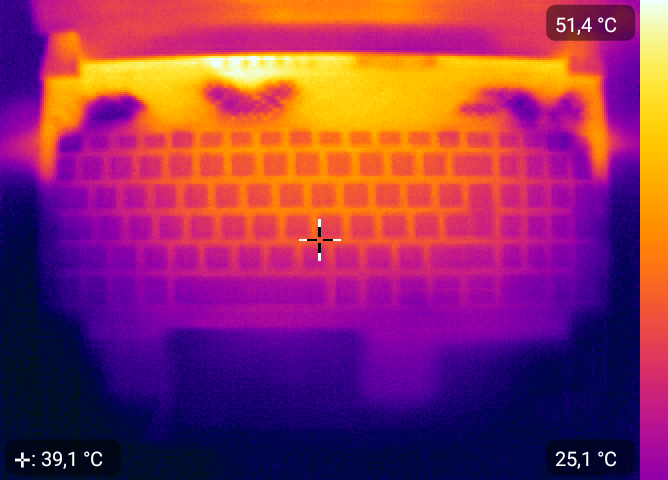
Os componentes internos atingem temperaturas acima de 90 °C (~194 °F) sob carga total. Escusado será dizer que o caso também é afetado por isto. Como de costume, o dispositivo fica particularmente quente nas áreas à frente e atrás do visor, onde não somente o hardware é instalado, mas também as saídas de ventilação para o ar quente residual estão localizadas. O fundo do laptop em particular atinge mais de 50 °C (~122 °F) ali durante os jogos. Os jogos em shorts e com o dispositivo na volta se tornarão rapidamente ("também") quentes.
Entretanto, a área do touchpad e teclado permanece tão fria em todas as situações que é possível usar o laptop sem nenhum problema. No uso ocioso, a maioria das partes do laptop para jogos mal são mais quentes que a temperatura ambiente, mas estão sempre acima dos valores da versão AMD.
(-) A temperatura máxima no lado superior é 45.9 °C / 115 F, em comparação com a média de 40.4 °C / 105 F , variando de 21.2 a 68.8 °C para a classe Gaming.
(-) A parte inferior aquece até um máximo de 51.9 °C / 125 F, em comparação com a média de 43.2 °C / 110 F
(+) Em uso inativo, a temperatura média para o lado superior é 27.2 °C / 81 F, em comparação com a média do dispositivo de 33.9 °C / ### class_avg_f### F.
(+) Os apoios para as mãos e o touchpad são mais frios que a temperatura da pele, com um máximo de 28.3 °C / 82.9 F e, portanto, são frios ao toque.
(±) A temperatura média da área do apoio para as mãos de dispositivos semelhantes foi 28.8 °C / 83.8 F (+0.5 °C / 0.9 F).
| Dell G15 5510-43NHT Intel Core i5-10200H, NVIDIA GeForce RTX 3050 Ti Laptop GPU | Lenovo Ideapad Gaming 3 15IHU-82K1002RGE Intel Core i5-11300H, NVIDIA GeForce RTX 3050 Ti Laptop GPU | Dell G15 5515 AMD Ryzen 7 5800H, NVIDIA GeForce RTX 3050 Ti Laptop GPU | Acer Aspire Nitro 5 AN515-55-57GF Intel Core i5-10300H, NVIDIA GeForce RTX 3060 Laptop GPU | Gigabyte G5 GD Intel Core i5-11400H, NVIDIA GeForce RTX 3050 4GB Laptop GPU | |
|---|---|---|---|---|---|
| Heat | 10% | 6% | 5% | 3% | |
| Maximum Upper Side * (°C) | 45.9 | 43.2 6% | 50 -9% | 49 -7% | 45 2% |
| Maximum Bottom * (°C) | 51.9 | 47.9 8% | 49 6% | 51 2% | 50 4% |
| Idle Upper Side * (°C) | 30.1 | 24.9 17% | 26 14% | 26 14% | 28 7% |
| Idle Bottom * (°C) | 30.1 | 27 10% | 26 14% | 27 10% | 31 -3% |
* ... menor é melhor
Teste de estresse
No teste de estresse (Prime95 e FurMark funcionam por pelo menos uma hora), a CPU se fixa em torno de 3,3 GHz e uma temperatura de cerca de 93 °C (~199 °F) após um breve pico inicial no limite. A uma média de 1.550 MHz, a placa gráfica opera relativamente abaixo de seu máximo a um nível constante e a uma temperatura ligeiramente abaixo de 85 °C (~185 °F). O sistema permanece estável mesmo sob carga máxima.
Com a energia da bateria, a taxa de clock da CPU cai para cerca de 2,3 GHz e a GPU para cerca de 700 MHz. Naturalmente, isto prejudica o desempenho, mas pelo menos é benéfico em termos de ruído e desenvolvimento de calor (60 a 70 °C (~140 °F a ~158 °F)).
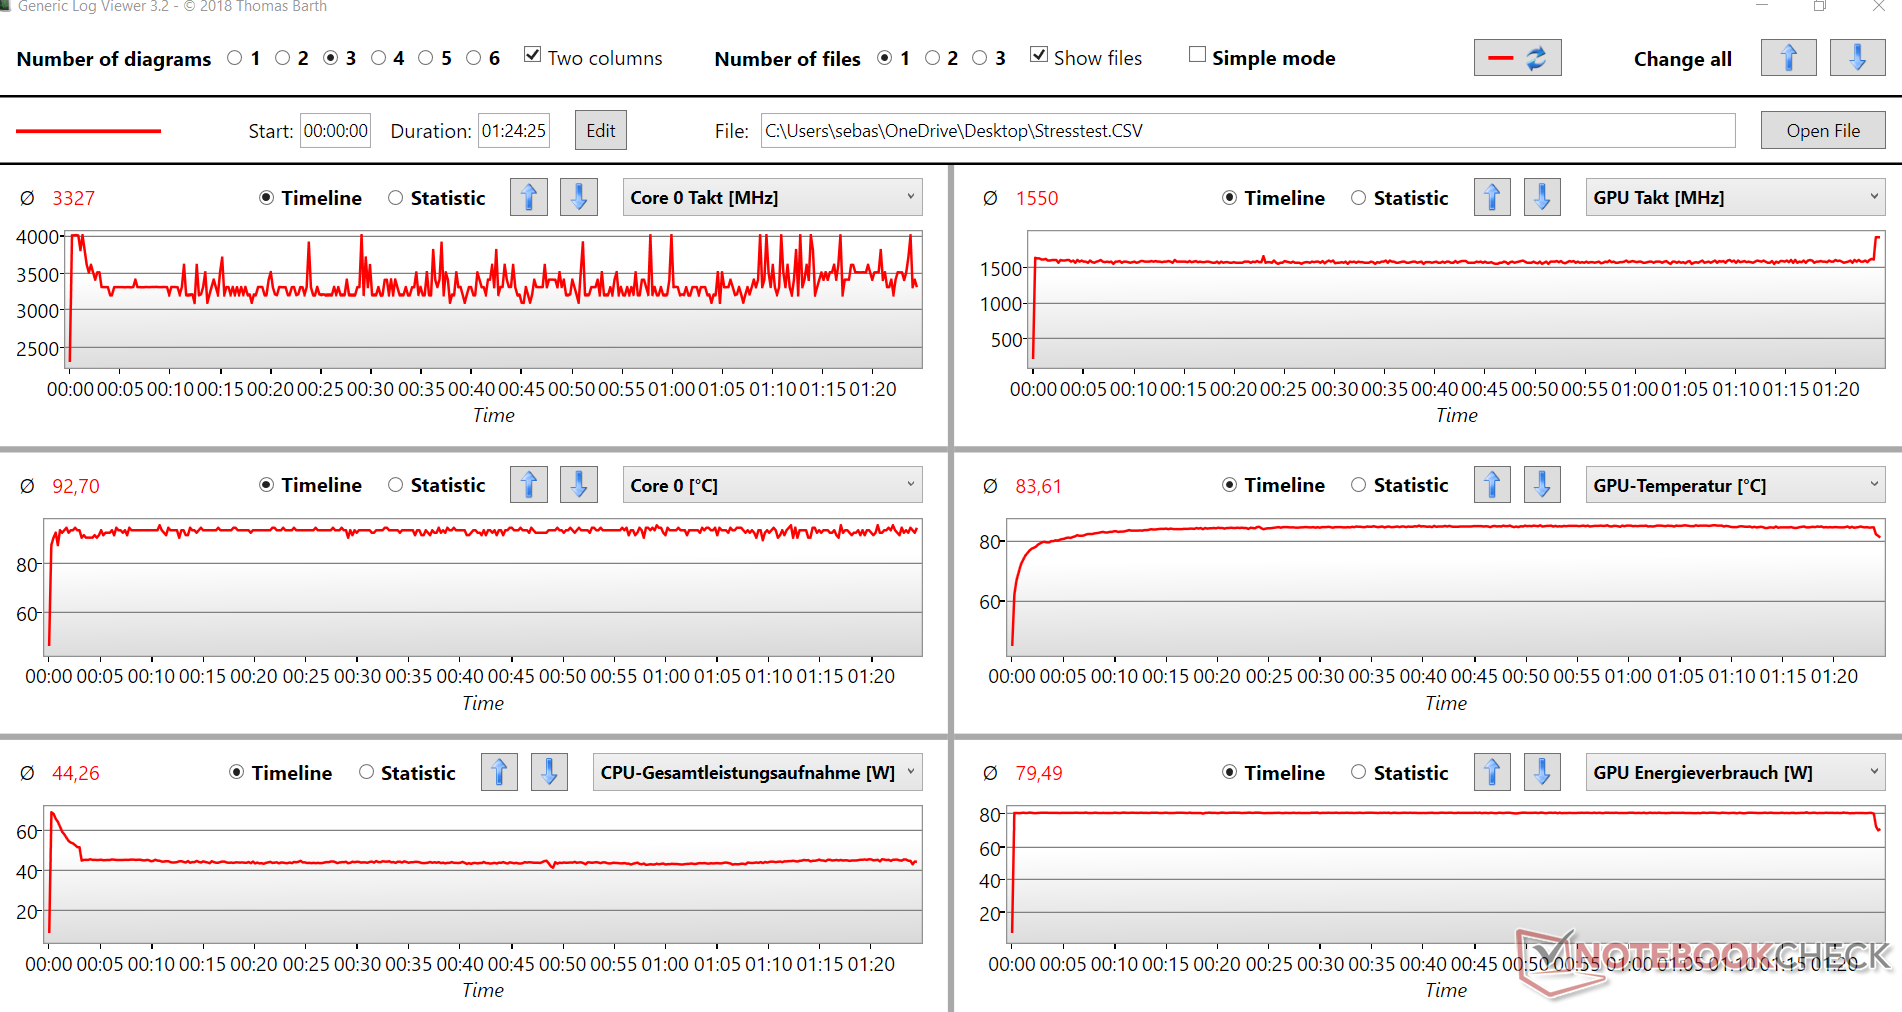
| Velocidade do relógio da CPU (GHz) | Velocidade do relógio da GPU (MHz) | Temperatura média da CPU (°C) | Temperatura média da GPU (°C) | |
| Sistema ocioso | 1.9 | 0 | 45 | 55 |
| Prime95 stress | 3.7 | 350 | 86 | 57 |
| Prime95 + FurMark stress | 3.3 | 1.550 | 93 | 93 |
| O Witcher 3 stress | 3.9 | 1.800 | 87 | 81 |
Oradores
Os alto-falantes embutidos dificilmente fornecem nenhum baixo e, de modo geral, a reprodução do som é sólida, no máximo. Um som mais equilibrado e mais cheio seria desejável para um dispositivo de jogo. Portanto, é recomendado o uso de soluções externas como fones de ouvido ou alto-falantes
Dell G15 5510-43NHT análise de áudio
(±) | o volume do alto-falante é médio, mas bom (###valor### dB)
Graves 100 - 315Hz
(-) | quase nenhum baixo - em média 36.3% menor que a mediana
(±) | a linearidade dos graves é média (11% delta para a frequência anterior)
Médios 400 - 2.000 Hz
(+) | médios equilibrados - apenas 4.9% longe da mediana
(+) | médios são lineares (5.9% delta para frequência anterior)
Altos 2 - 16 kHz
(+) | agudos equilibrados - apenas 2.2% longe da mediana
(+) | os máximos são lineares (3.4% delta da frequência anterior)
Geral 100 - 16.000 Hz
(±) | a linearidade do som geral é média (21.9% diferença em relação à mediana)
Comparado com a mesma classe
» 79% de todos os dispositivos testados nesta classe foram melhores, 6% semelhantes, 16% piores
» O melhor teve um delta de 6%, a média foi 18%, o pior foi 132%
Comparado com todos os dispositivos testados
» 63% de todos os dispositivos testados foram melhores, 7% semelhantes, 30% piores
» O melhor teve um delta de 4%, a média foi 23%, o pior foi 134%
Lenovo Ideapad Gaming 3 15IHU-82K1002RGE análise de áudio
(±) | o volume do alto-falante é médio, mas bom (###valor### dB)
Graves 100 - 315Hz
(-) | quase nenhum baixo - em média 23.8% menor que a mediana
(±) | a linearidade dos graves é média (10.3% delta para a frequência anterior)
Médios 400 - 2.000 Hz
(±) | médios mais altos - em média 6.7% maior que a mediana
(+) | médios são lineares (6% delta para frequência anterior)
Altos 2 - 16 kHz
(+) | agudos equilibrados - apenas 3.6% longe da mediana
(±) | a linearidade dos máximos é média (7.4% delta para frequência anterior)
Geral 100 - 16.000 Hz
(±) | a linearidade do som geral é média (20.7% diferença em relação à mediana)
Comparado com a mesma classe
» 74% de todos os dispositivos testados nesta classe foram melhores, 4% semelhantes, 21% piores
» O melhor teve um delta de 6%, a média foi 18%, o pior foi 132%
Comparado com todos os dispositivos testados
» 56% de todos os dispositivos testados foram melhores, 8% semelhantes, 36% piores
» O melhor teve um delta de 4%, a média foi 23%, o pior foi 134%
Gestão de energia: O Dell G15 5515 também bate o G15 5510 aqui
Consumo de energia
No uso ocioso, o Dell G15 5510 utiliza menos energia do que a versão AMD. Sob carga, porém, a situação é invertida, e o G15 5515 funciona de forma mais frugal. O dispositivo se sobressai na comparação de classes, mas isto também se deve a sua configuração bastante rudimentar pelos padrões de laptops com jogos. O adaptador de energia de 240 watts está acima de qualquer censura e é avaliado adequadamente
| desligado | |
| Ocioso | |
| Carga |
|
Key:
min: | |
| Dell G15 5510-43NHT i5-10200H, GeForce RTX 3050 Ti Laptop GPU, SK Hynix BC711 HFM512GD3HX015N, IPS, 1920x1080, 15.6" | Lenovo Ideapad Gaming 3 15IHU-82K1002RGE i5-11300H, GeForce RTX 3050 Ti Laptop GPU, Micron 2210 MTFDHBA512QFD, IPS, 1920x1080, 15.6" | Dell G15 5515 R7 5800H, GeForce RTX 3050 Ti Laptop GPU, Samsung PM991a MZ9LQ512HBLU-00BD1, IPS, 1920x1080, 15.6" | Acer Aspire Nitro 5 AN515-55-57GF i5-10300H, GeForce RTX 3060 Laptop GPU, WDC PC SN530 SDBPNPZ-512G, IPS, 1920x1080, 15.6" | Gigabyte G5 GD i5-11400H, GeForce RTX 3050 4GB Laptop GPU, ESR512GTLG-E6GBTNB4, IPS, 1920x1080, 15.6" | Média NVIDIA GeForce RTX 3050 Ti Laptop GPU | Média da turma Gaming | |
|---|---|---|---|---|---|---|---|
| Power Consumption | 6% | -17% | -6% | -61% | -37% | -108% | |
| Idle Minimum * (Watt) | 4.6 | 4.9 -7% | 5 -9% | 5 -9% | 13 -183% | 8.2 ? -78% | 13 ? -183% |
| Idle Average * (Watt) | 6.5 | 8.3 -28% | 9 -38% | 9 -38% | 15 -131% | 12.6 ? -94% | 19 ? -192% |
| Idle Maximum * (Watt) | 10.1 | 8.9 12% | 20 -98% | 13 -29% | 20 -98% | 17.2 ? -70% | 24.6 ? -144% |
| Load Average * (Watt) | 129 | 81 37% | 94 27% | 84 35% | 102 21% | 92 ? 29% | 110.7 ? 14% |
| Witcher 3 ultra * (Watt) | 129 | 119 8% | 123 5% | 125 3% | 124 4% | ||
| Load Maximum * (Watt) | 195 | 172 12% | 172 12% | 190 3% | 148 24% | 139.1 ? 29% | 259 ? -33% |
* ... menor é melhor
Energy consumption during The Witcher 3 / stress test
Energy consumption with an external monitor
Duração da bateria
Para um laptop para jogos, o Dell G15 5510 oferece uma sólida vida útil da bateria. Entretanto, estes são inferiores aos da alternativa AMD, apesar do fato de que ambos os modelos têm a mesma bateria de 56 Wh. Acabamos de explicar a razão para isto. A CPU AMD consome menos energia sob carga, portanto uma carga de bateria dura mais tempo no final.
Entretanto, você ainda pode navegar na web por umas boas 6 horas ou assistir vídeos por 8:30 horas. Sob carga, no entanto, a tela fica preta após pouco mais de uma hora. Portanto, não é possível realizar extensas sessões de jogos longe de uma tomada elétrica.
| Dell G15 5510-43NHT i5-10200H, GeForce RTX 3050 Ti Laptop GPU, 56 Wh | Lenovo Ideapad Gaming 3 15IHU-82K1002RGE i5-11300H, GeForce RTX 3050 Ti Laptop GPU, 45 Wh | Dell G15 5515 R7 5800H, GeForce RTX 3050 Ti Laptop GPU, 56 Wh | Acer Aspire Nitro 5 AN515-55-57GF i5-10300H, GeForce RTX 3060 Laptop GPU, 57.5 Wh | Gigabyte G5 GD i5-11400H, GeForce RTX 3050 4GB Laptop GPU, 41 Wh | Média da turma Gaming | |
|---|---|---|---|---|---|---|
| Duração da bateria | -2% | 22% | -1% | -36% | 16% | |
| H.264 (h) | 8.6 | 7.7 -10% | 8.8 2% | 6.2 -28% | 3.6 -58% | 8.32 ? -3% |
| WiFi v1.3 (h) | 6.3 | 6.6 5% | 8 27% | 5.7 -10% | 3.1 -51% | 7.11 ? 13% |
| Load (h) | 1.1 | 1.1 0% | 1.5 36% | 1.5 36% | 1.1 0% | 1.502 ? 37% |
| Reader / Idle (h) | 13.5 | 5.7 | 8.27 ? |
Pro
Contra
Veredicto

O desempenho do jogo da Dell G15 5510 é certamente bom - especialmente considerando seu preço de cerca de 1.000 Euros (~$1.061). A maioria dos jogos, incluindo os mais novos, funciona sem problemas, mesmo em altos níveis gráficos, graças ao poder gráfico disponível.
Infelizmente, a GPU dedicada é o único componente do laptop para jogos que é realmente mais potente. A CPU e a RAM empurram o dispositivo para seus limites muito rapidamente, o que também compromete a performance dos jogos.
ODell G15 5515a versão AMD oferece ainda melhor desempenho gráfico e de jogos, mas também um desempenho significativamente maior do sistema graças a uma CPU mais rápida e o dobro de RAM.
Como a Dell ainda não está cobrando muito mais pela alternativa mais poderosa, aDell G15 5515 (cerca de 850 Euros (~$901) no Cyberport.de) é definitivamente a melhor escolha em comparação com o 5510. Não só é mais rápido, como também é mais silencioso e duradouro, e também parece muito mais elegante na cor "Phantom Gray with Speckles". Da mesma forma, o recentemente revisadoLenovo IdeaPad Gaming 3 15 G6 supera esta amostra de revisão graças à combinação de uma CPU mais nova e a mesma GPU.
Preço e disponibilidade
No momento de escrever, é um pouco difícil encontrar nossa configuração exata de revisão do Dell G15 5510 nos Estados Unidos (Core i5-10200H, GeForce RTX 3050 Ti Laptop GPU, 8 GB de RAM, 512 GB de SSD). A loja online do Walmart tem este modelo exato listado para 1.199,99. Na Amazon, você encontrará uma opção com a GPU para laptop RTX 3050 por US$958 e outro com oCore i5-10500H e o RTX 3050 Ti por US$1.197. A melhor opção, porém, pode ser a oferecida na loja on-line Best Buy com o Core i7-11800H e 16 GB de RAM por US$ 1.199.
Dell G15 5510-43NHT
- 05/01/2022 v7 (old)
Marcus Schwarten
Price comparison

