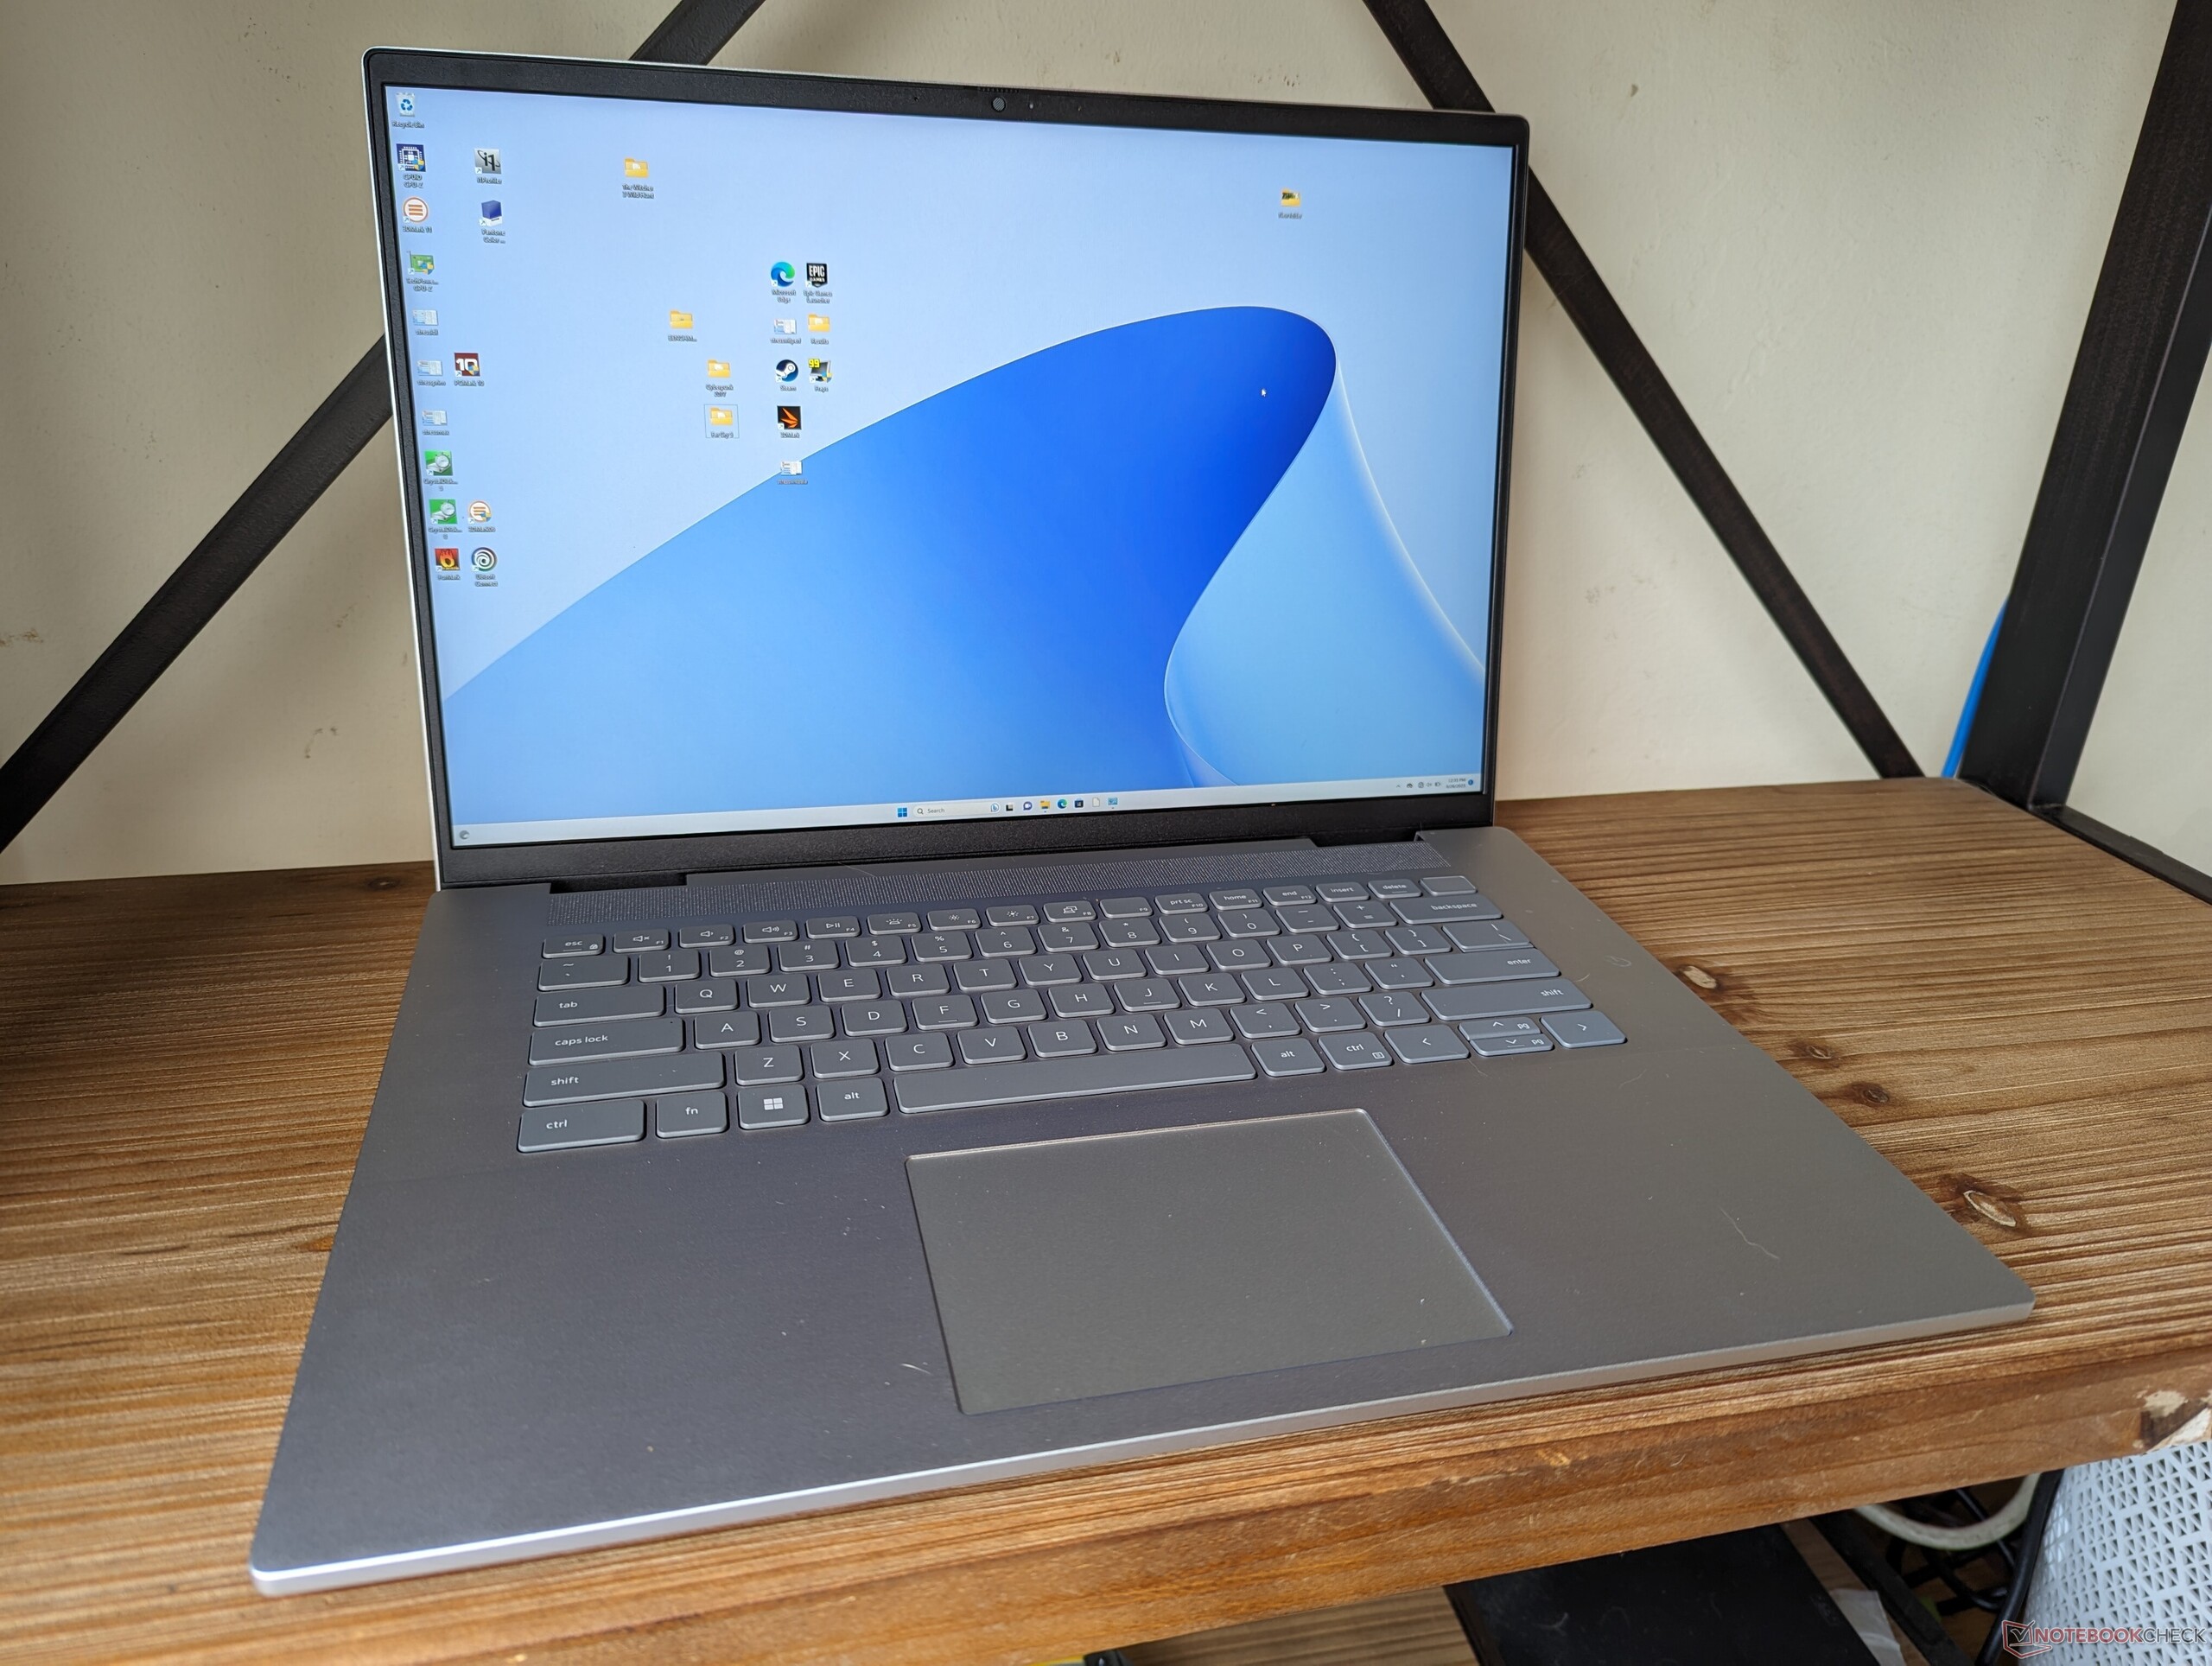
Análise do laptop Dell Inspiron 16 Plus 7630: 60 W GeForce RTX 4060 não é tão ruim assim

O Dell Inspiron 16 Plus 7630 de 2023 sucede o Inspiron 16 Plus 7620 de 2022 do ano passado Revisão Dell Inspiron 16 Plus 7620: O portátil multimídia de fazer-tudo com internos e externos atualizados, apesar do fato de que o modelo de 2022 já era um redesenho completo do Inspiron 16 Plus 7610 de 2021 Quase um XPS 16: Dell Inspiron 16 Plus 7610 revisão de laptop . É raro ver uma série passar por três grandes reformulações três anos seguidos, pois os fabricantes geralmente revisam o exterior apenas uma vez a cada poucos anos. Como outros notebooks multimídia de 2023, o Inspiron 16 Plus 7630 incorpora CPUs Intel Raptor Lake-H de 13ª geração e GPUs Nvidia Ada Lovelace.
Nossa unidade de análise é uma configuração de ponta com CPU Core i7-13700H, GPU GeForce RTX 4060 e tela IPS de 2560 x 1600 120 Hz por aproximadamente US$ 1250. SKUs menores com o Core i5-13500H, iris Xe integrado, RTX 3050, RTX 4050 ou tela de 1200p 60 Hz estão em desenvolvimento. As variantes da AMD com o Ryzen 5 7640HS e o Ryzen 7 7840HS também estão planejadas sob o nome de modelo Inspiron 16 Plus 7635.
As alternativas ao Inspiron 16 Plus 7630 incluem outros laptops multimídia de 16 polegadas, como o Lenovo Slim Pro 9i 16, Asus VivoBook Pro 16X, HP Envy 16, ou MSI Summit E16 Flip. O Inspiron 16 Plus 7630 não deve ser confundido com o Inspiron 16 mais lento padrão ou com o Inspiron 16 Plus 7630 2 em 1, que têm especificações e recursos muito diferentes.
Mais análises da Dell:
Potential Competitors in Comparison
Avaliação | Data | Modelo | Peso | Altura | Size | Resolução | Preço |
|---|---|---|---|---|---|---|---|
| 87.1 % v7 (old) | 08/2023 | Dell Inspiron 16 Plus 7630 i7-13700H, GeForce RTX 4060 Laptop GPU | 2.2 kg | 19.95 mm | 16.00" | 2560x1600 | |
| 87.4 % v7 (old) | 08/2022 | Dell Inspiron 16 Plus 7620 i7-12700H, GeForce RTX 3050 Ti Laptop GPU | 2.1 kg | 18.99 mm | 16.00" | 3072x1920 | |
| 88 % v7 (old) | 08/2023 | Lenovo Slim Pro 9i 16IRP8 i9-13905H, GeForce RTX 4050 Laptop GPU | 2.2 kg | 18.2 mm | 16.00" | 3200x2000 | |
| 86.2 % v7 (old) | 07/2023 | Asus Vivobook Pro 16X K6604JV-MX016W i9-13980HX, GeForce RTX 4060 Laptop GPU | 2.1 kg | 22.8 mm | 16.00" | 3200x2000 | |
| 86.9 % v7 (old) | 09/2022 | HP Envy 16 h0112nr i7-12700H, GeForce RTX 3060 Laptop GPU | 2.3 kg | 19.8 mm | 16.00" | 3840x2400 | |
| 84.2 % v7 (old) | 10/2022 | MSI Summit E16 Flip A12UDT-031 i7-1280P, GeForce RTX 3050 Ti Laptop GPU | 1.9 kg | 16.85 mm | 16.00" | 2560x1600 |
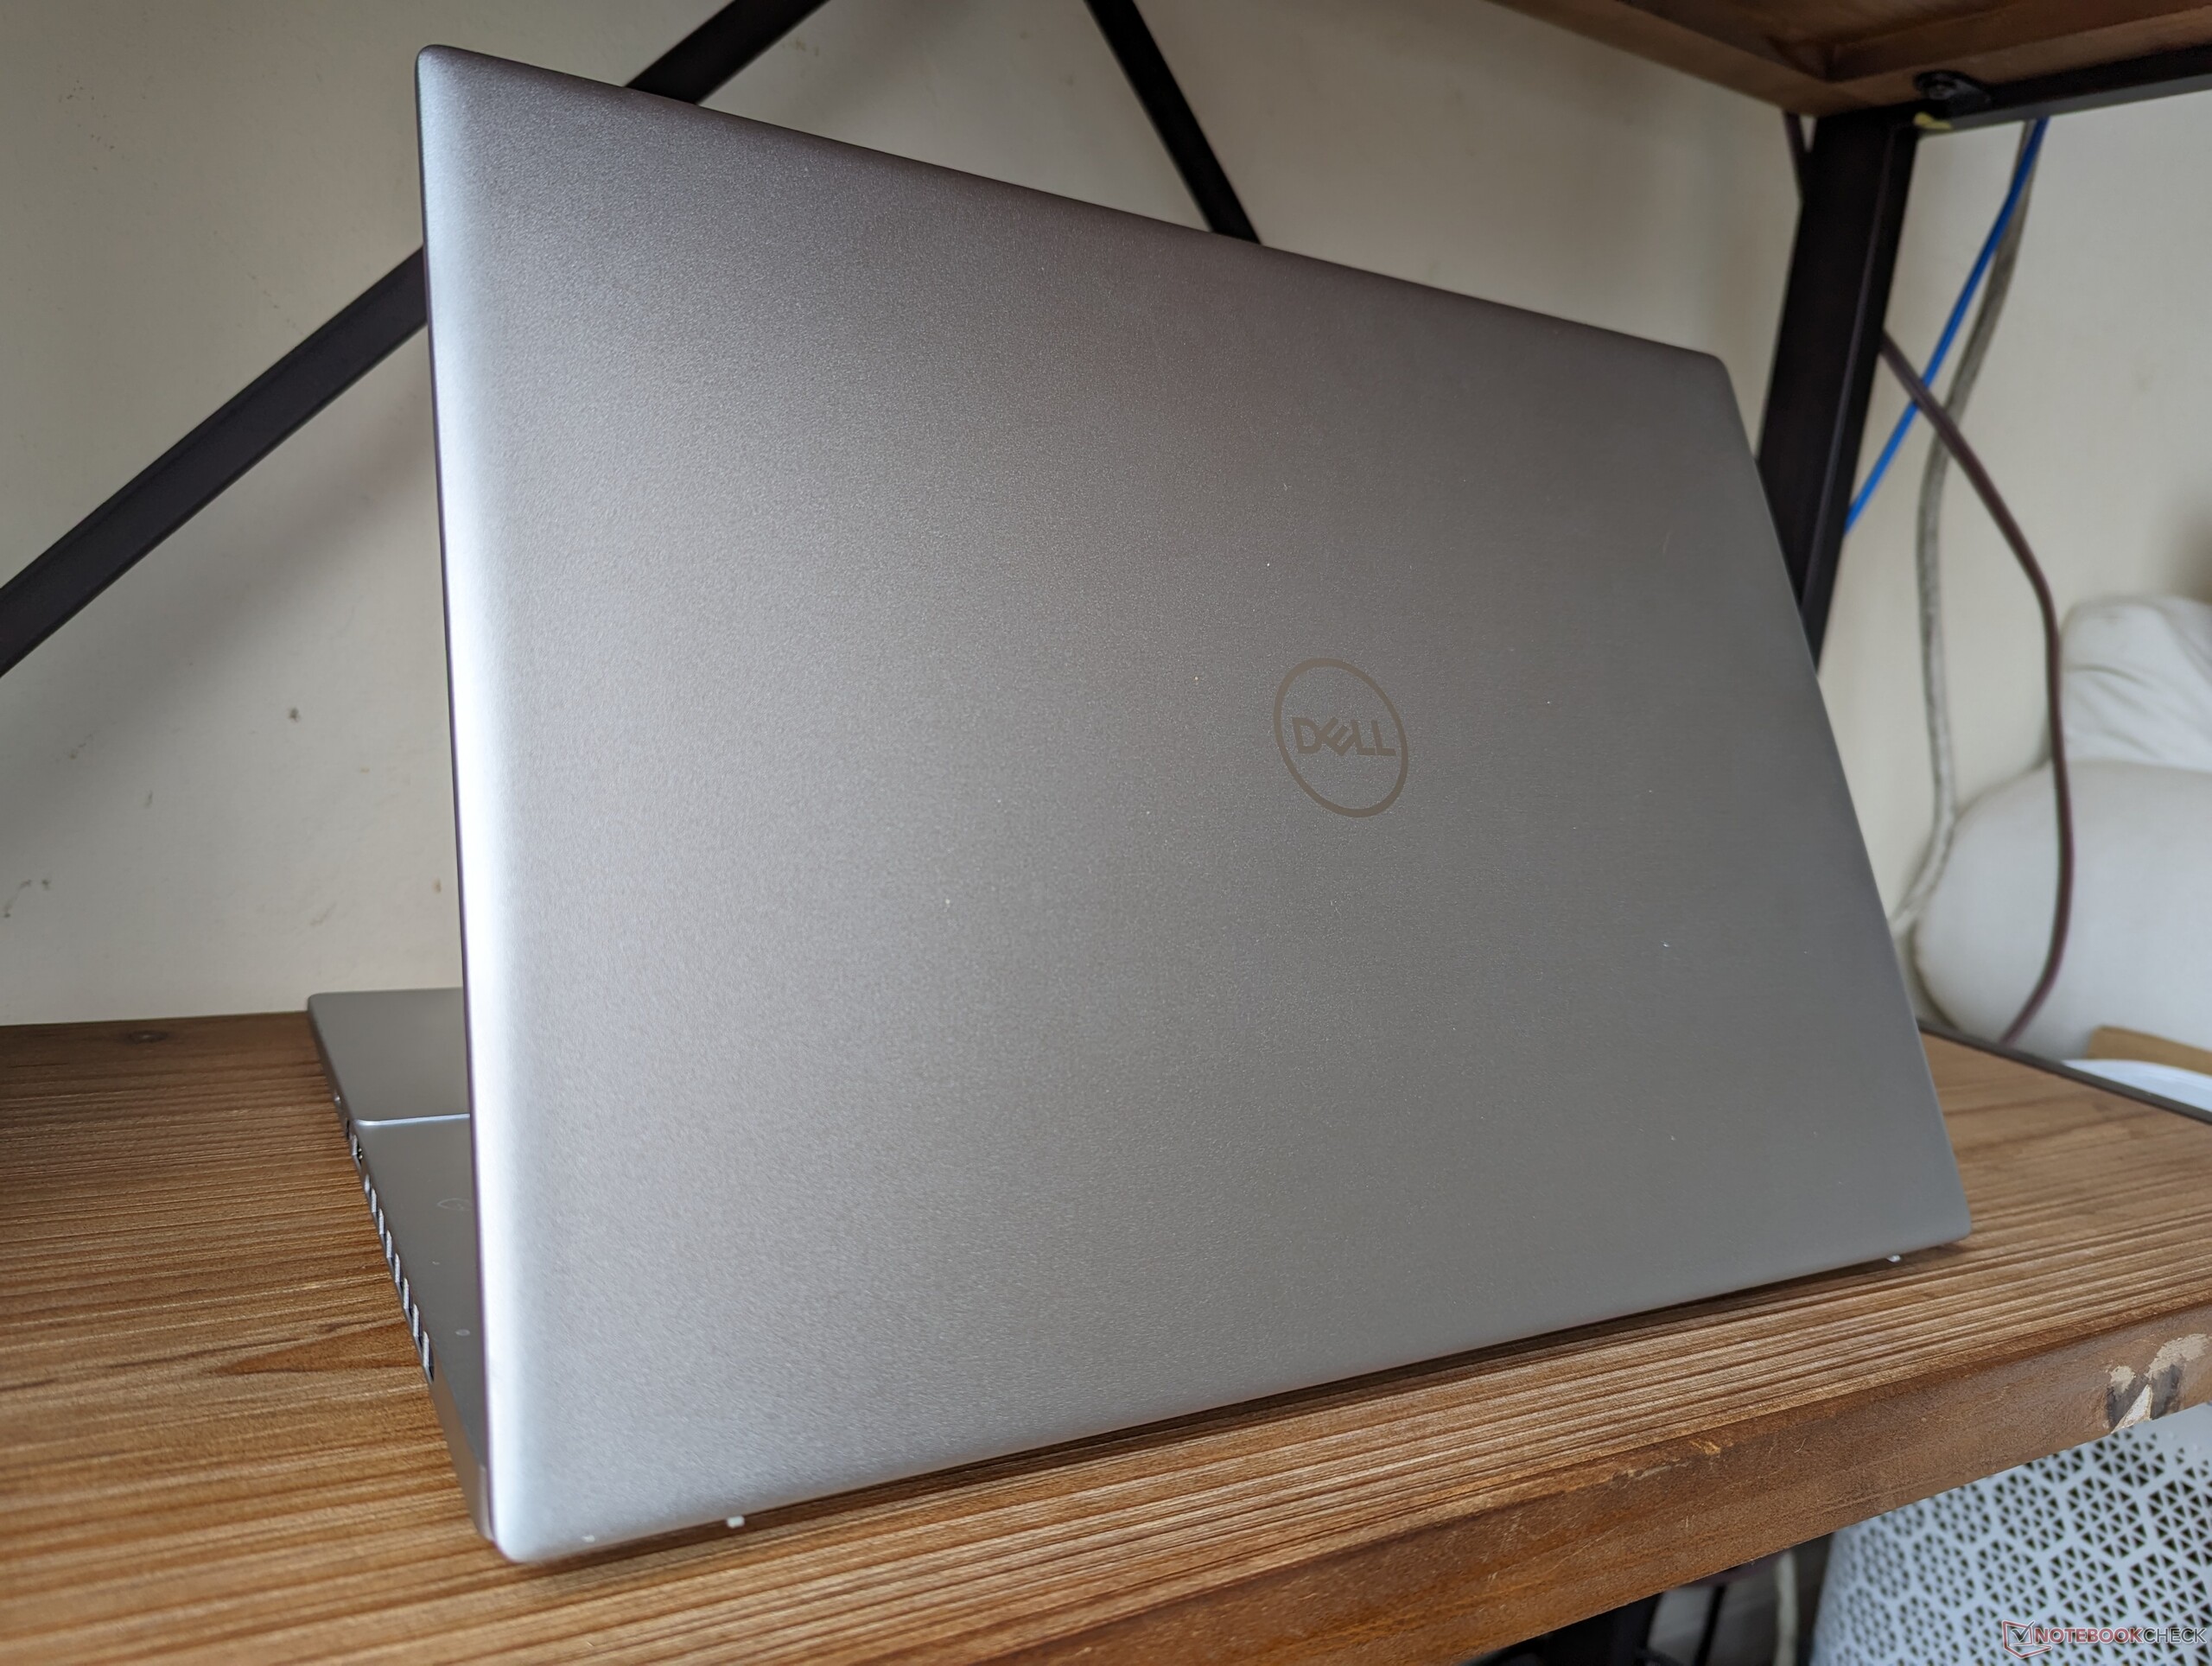
Caso - Mantendo a simplicidade
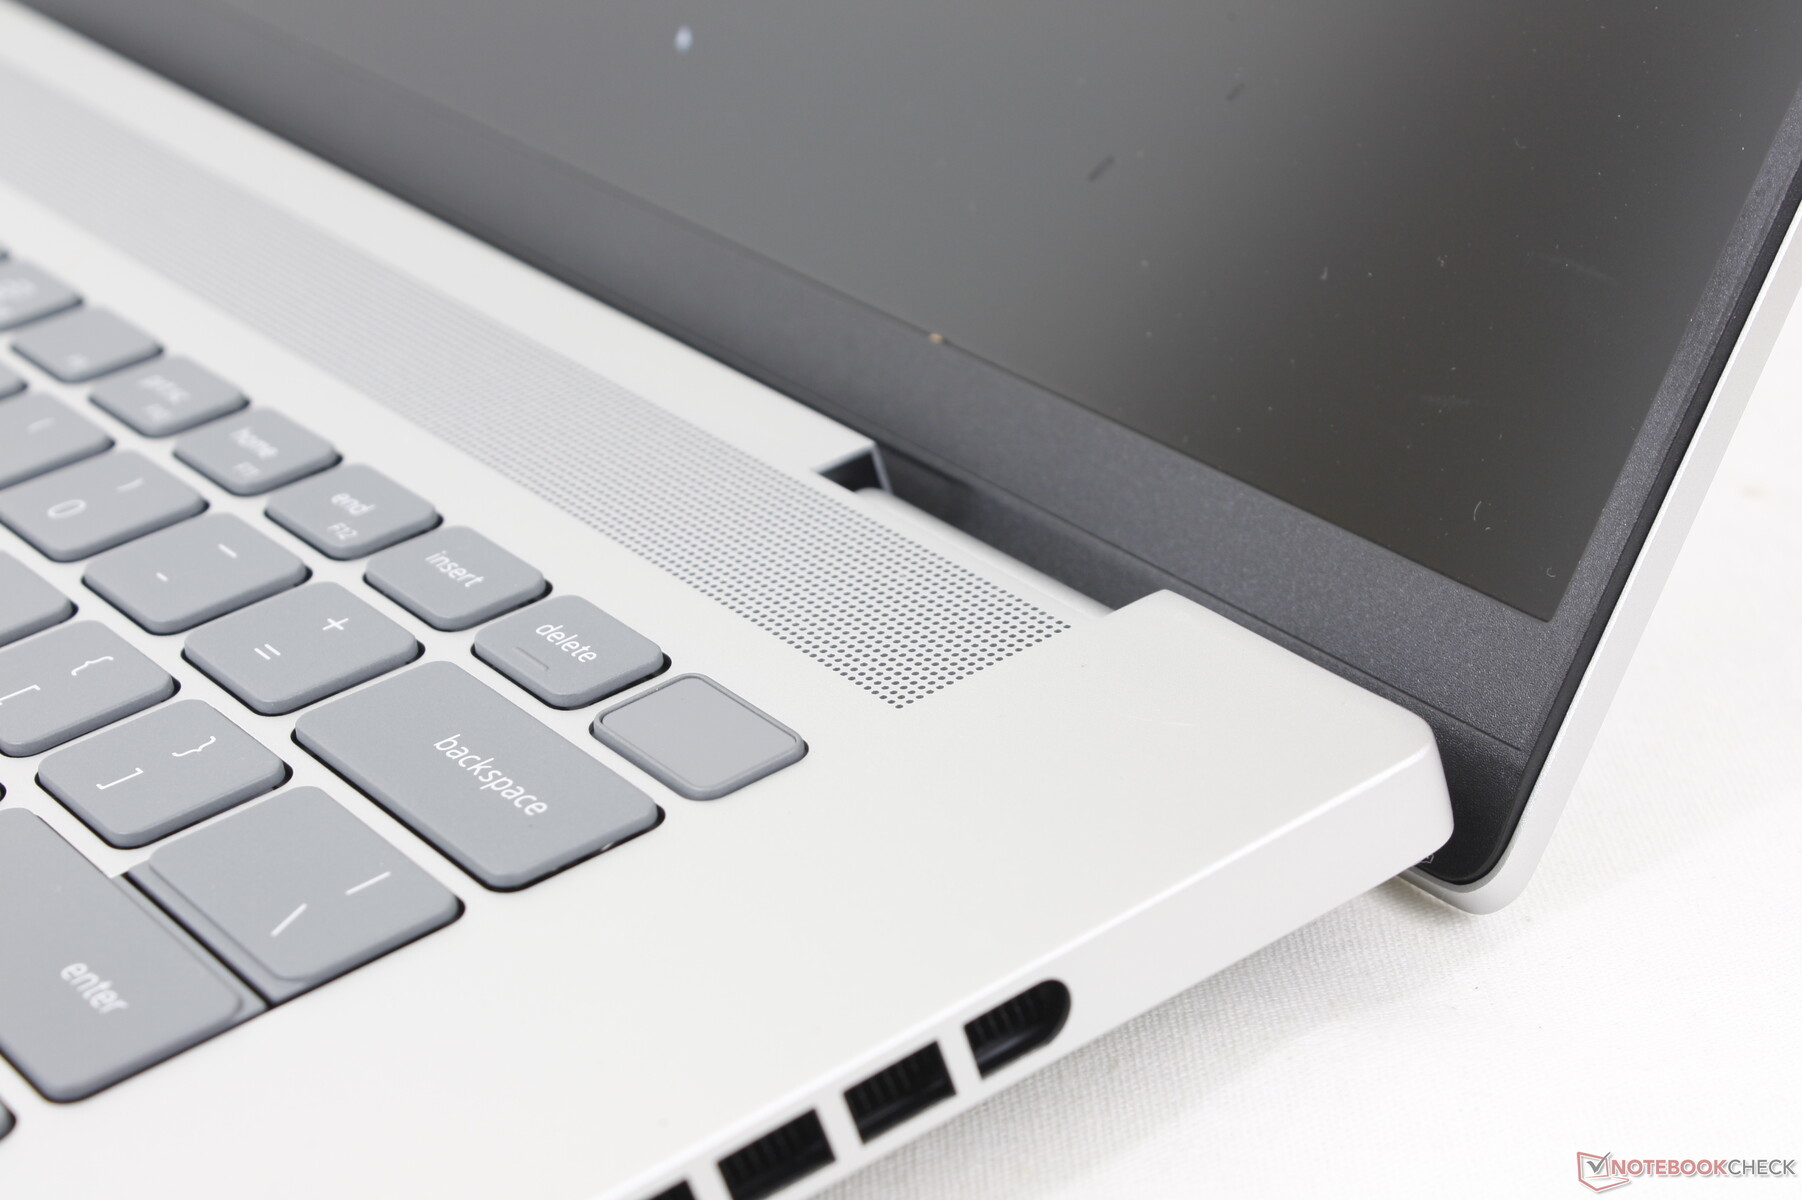
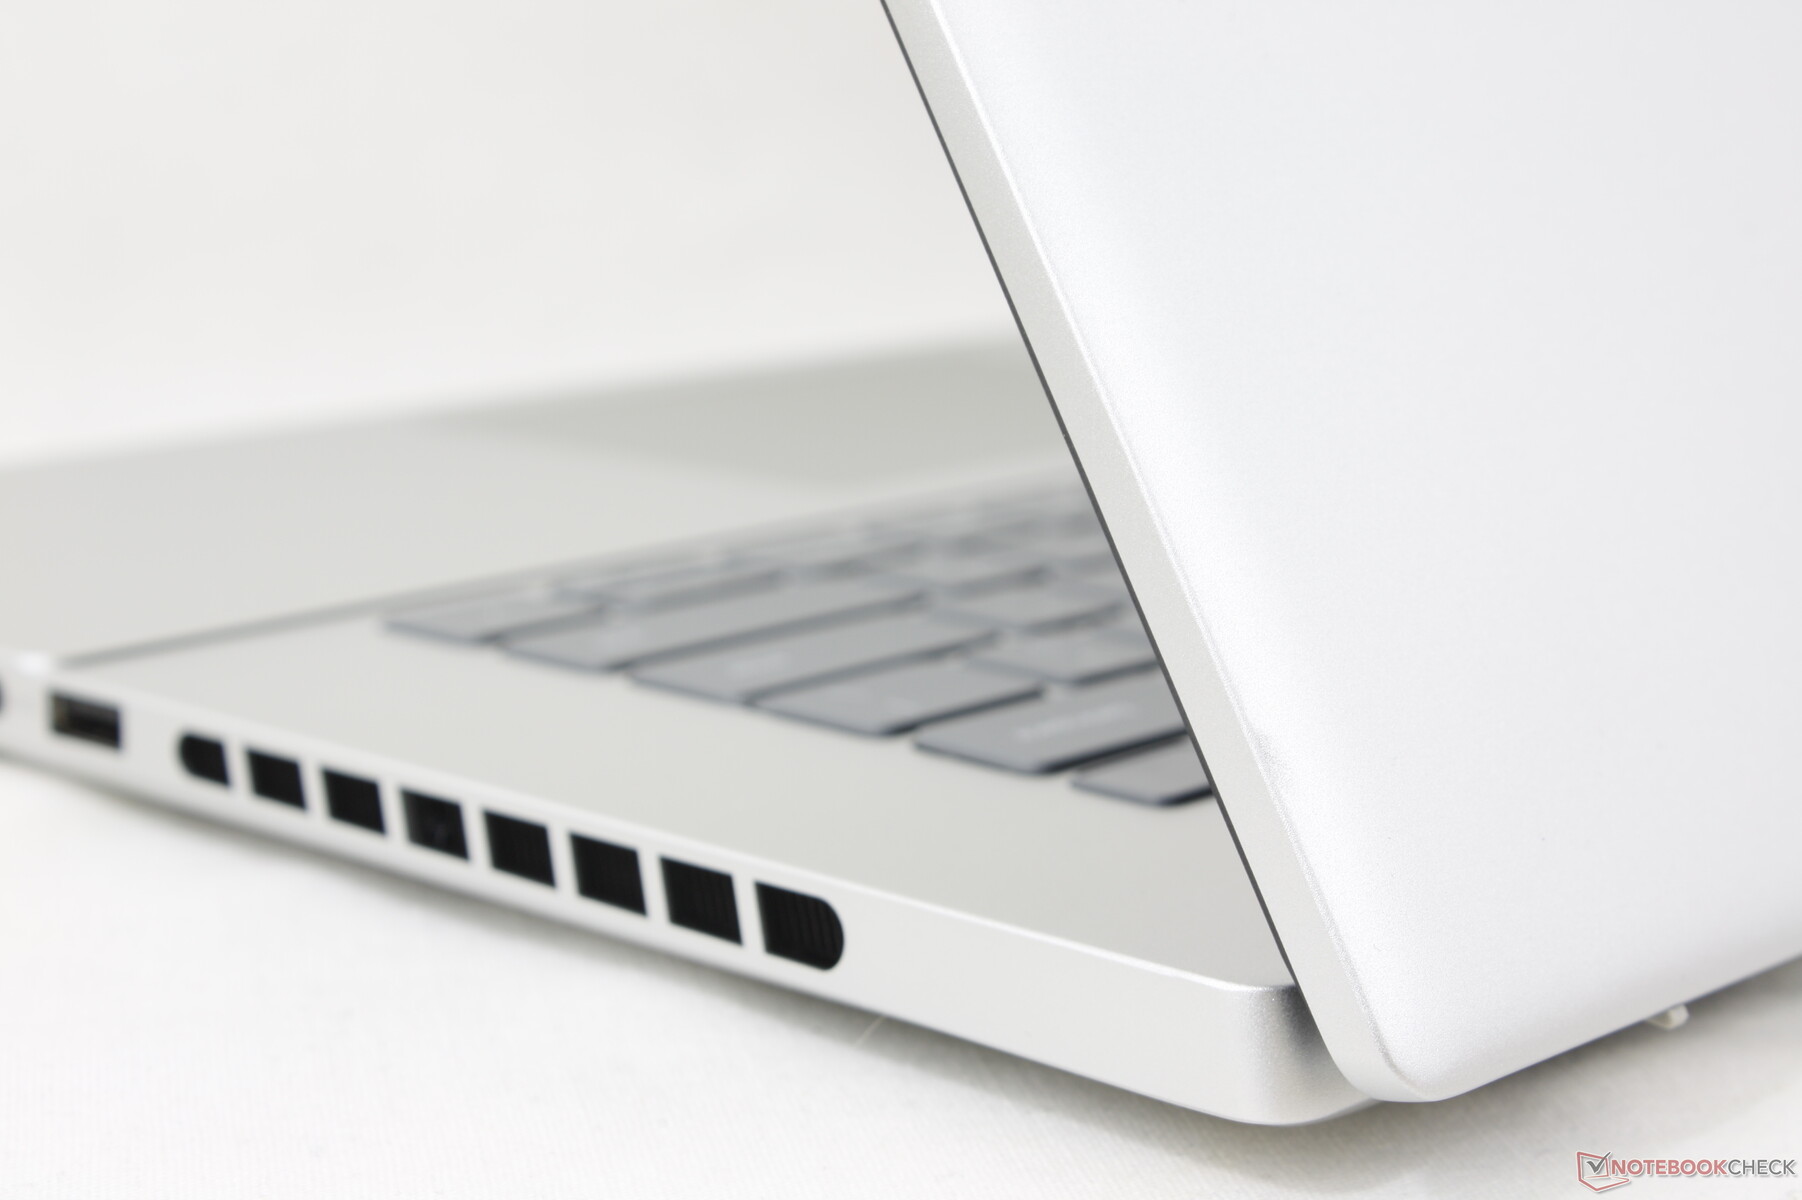
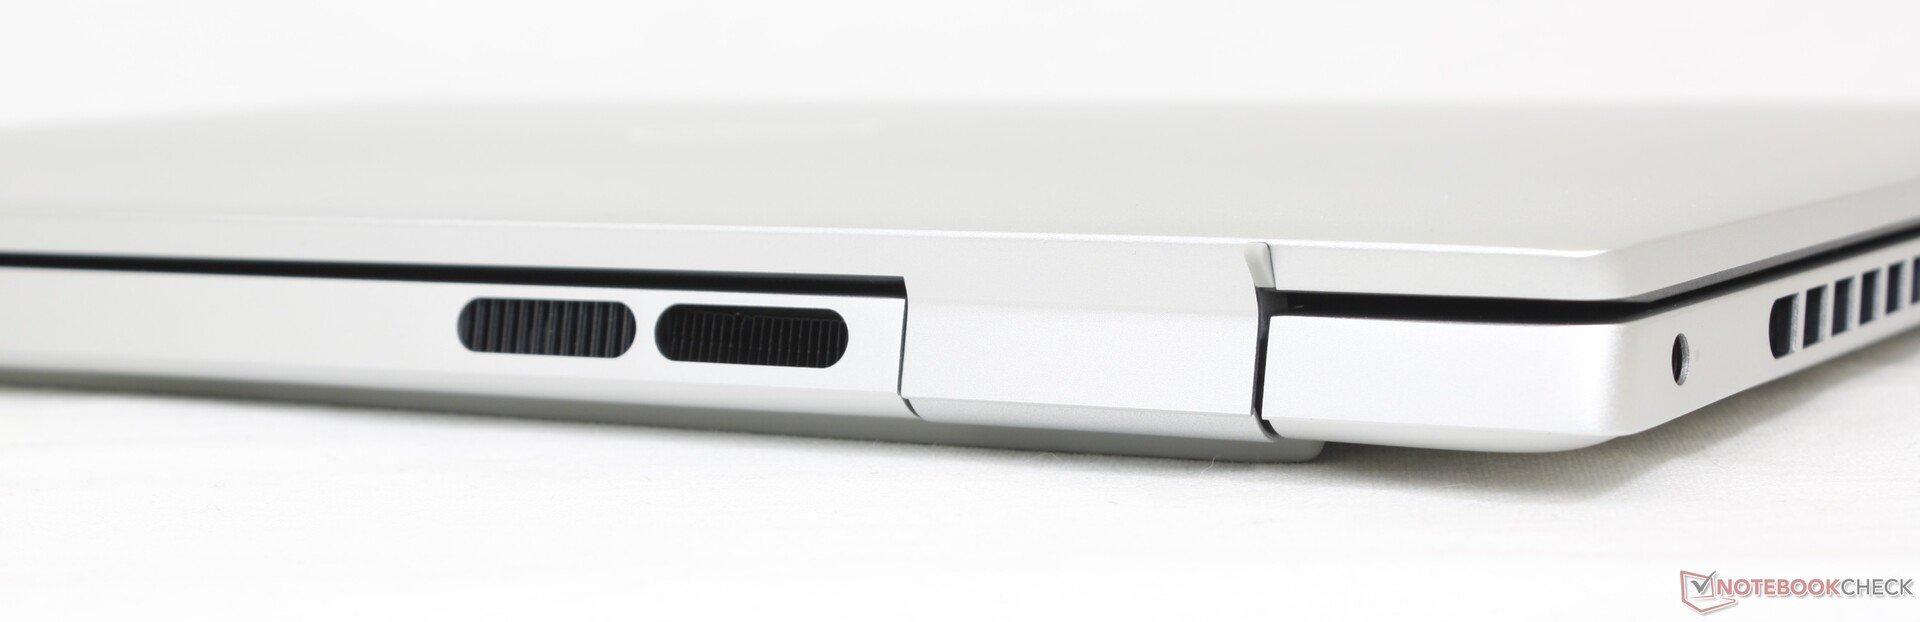
O Inspiron 16 Plus 7630 apresenta três mudanças externas notáveis em relação ao modelo do ano passado. Em primeiro lugar, e talvez o mais importante, as dobradiças foram redesenhadas para serem mais espessas e resistentes do que antes. Em segundo lugar, agora há grades de ventilação adicionais ao longo das bordas para ajudar no resfriamento. E, por último, os apoios para as mãos e o clickpad Mylar foram removidos, como no Inspiron 16 Plus 7635 2 em 1. Espera-se que os dois primeiros, em particular, aumentem a vida útil do sistema, enquanto o último é provavelmente uma medida de economia de custos.
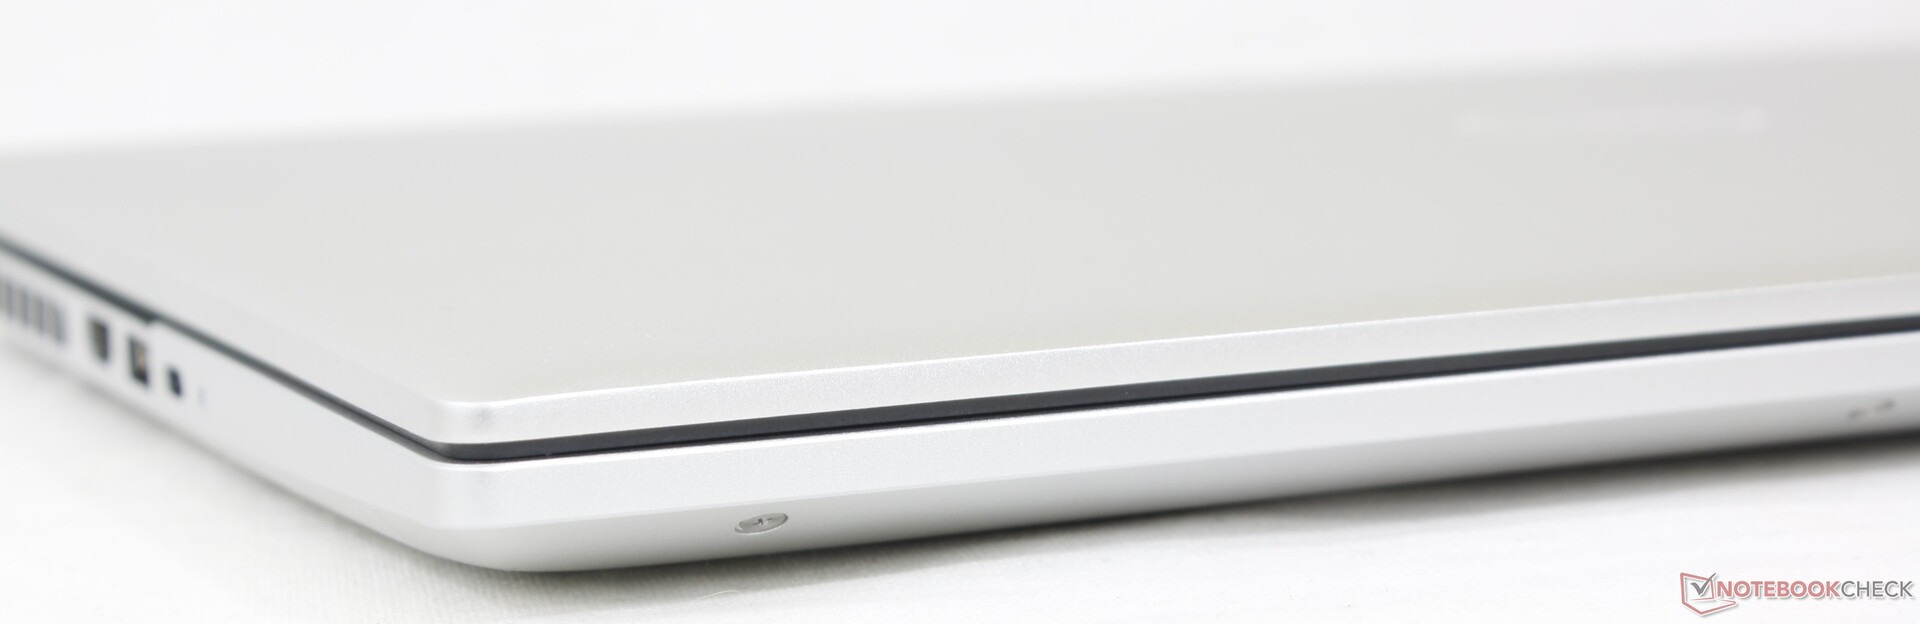
A rigidez geral do chassi é praticamente a mesma que a do Inspiron 16 Plus 7620, já que seus esqueletos são dos mesmos materiais. A unidade parece forte na mão, semelhante ao Envy 16mas com uma tampa um pouco mais fraca, já que o Dell não tem nenhum reforço de Gorilla Glass.
As dimensões e o peso permanecem praticamente os mesmos do design do ano passado, se não forem ligeiramente mais pesados em cerca de 100 g. Embora não seja exatamente leve, o Dell ainda é comparável a alternativas como o Slim Pro 9i 16 ou o Envy 16 nesse quesito.
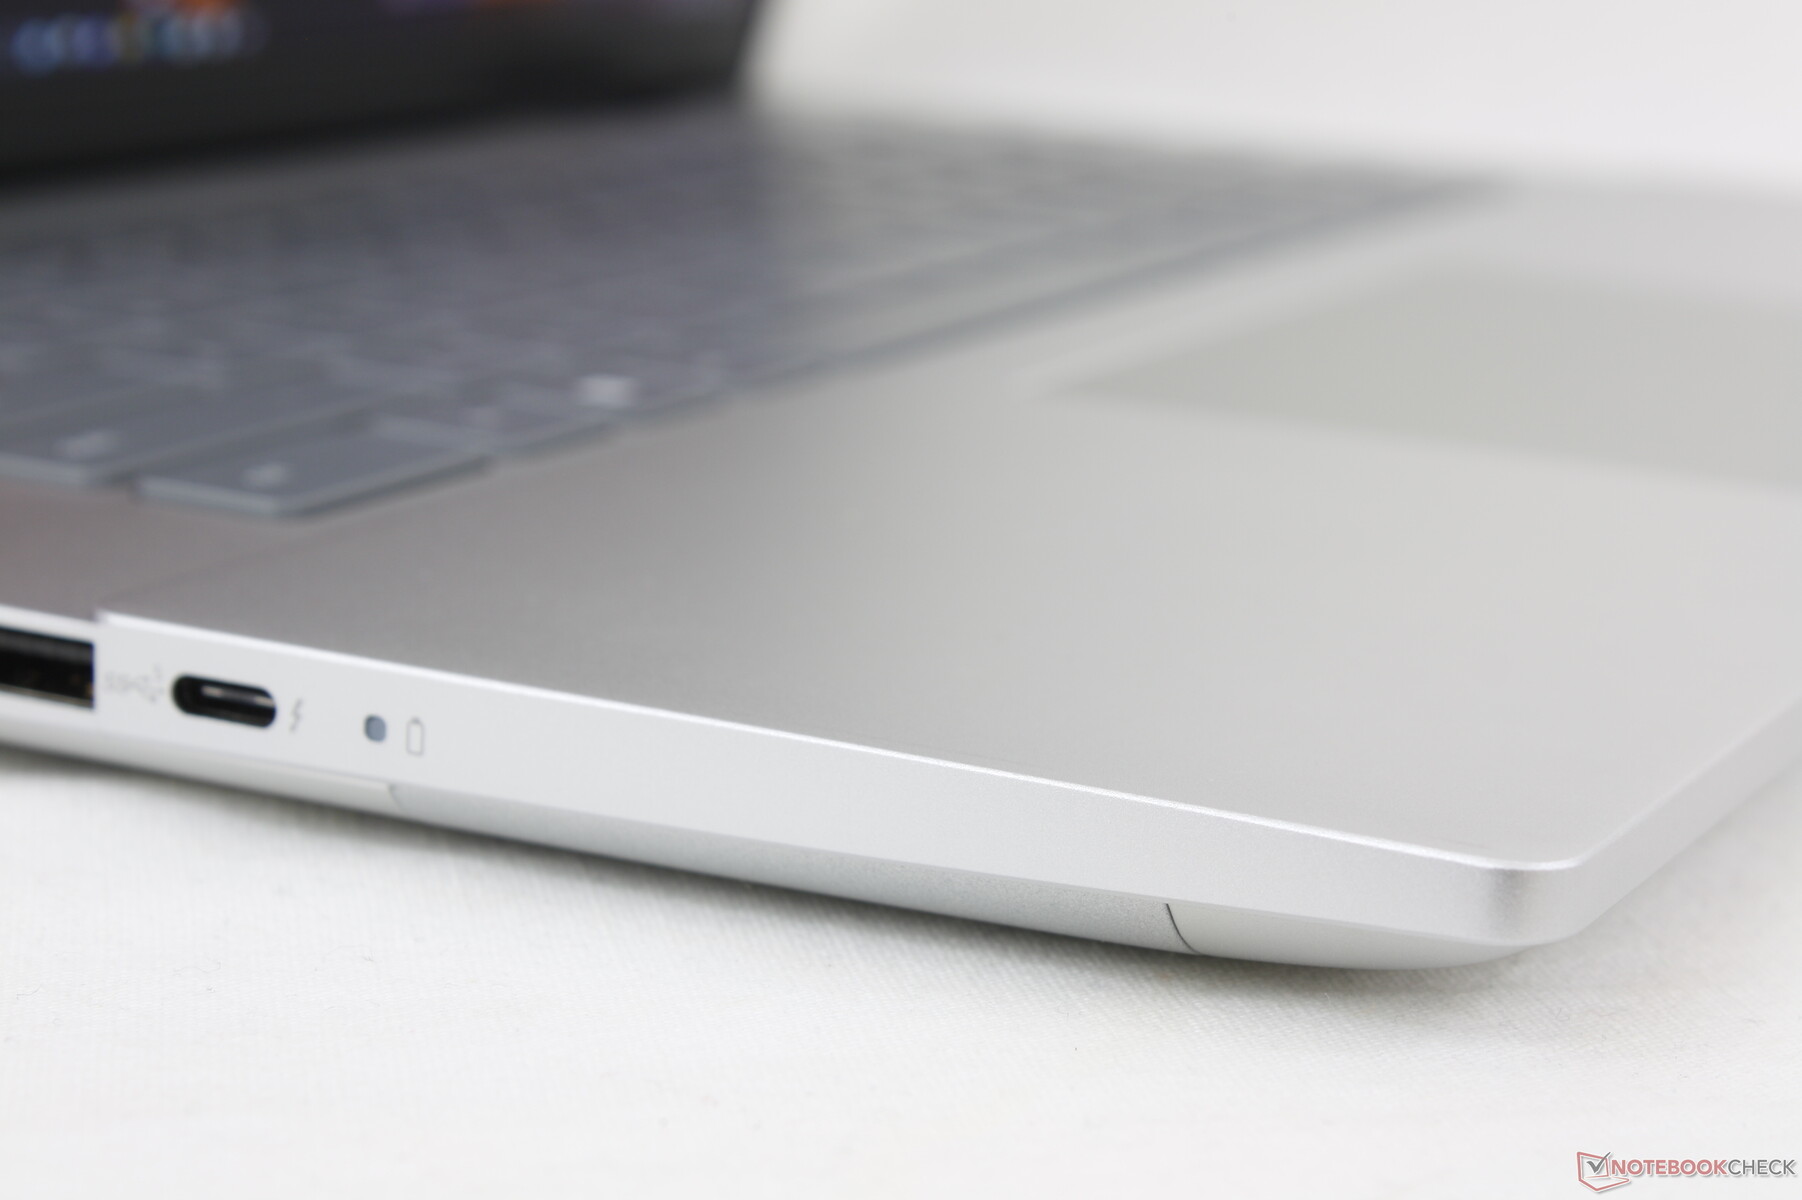
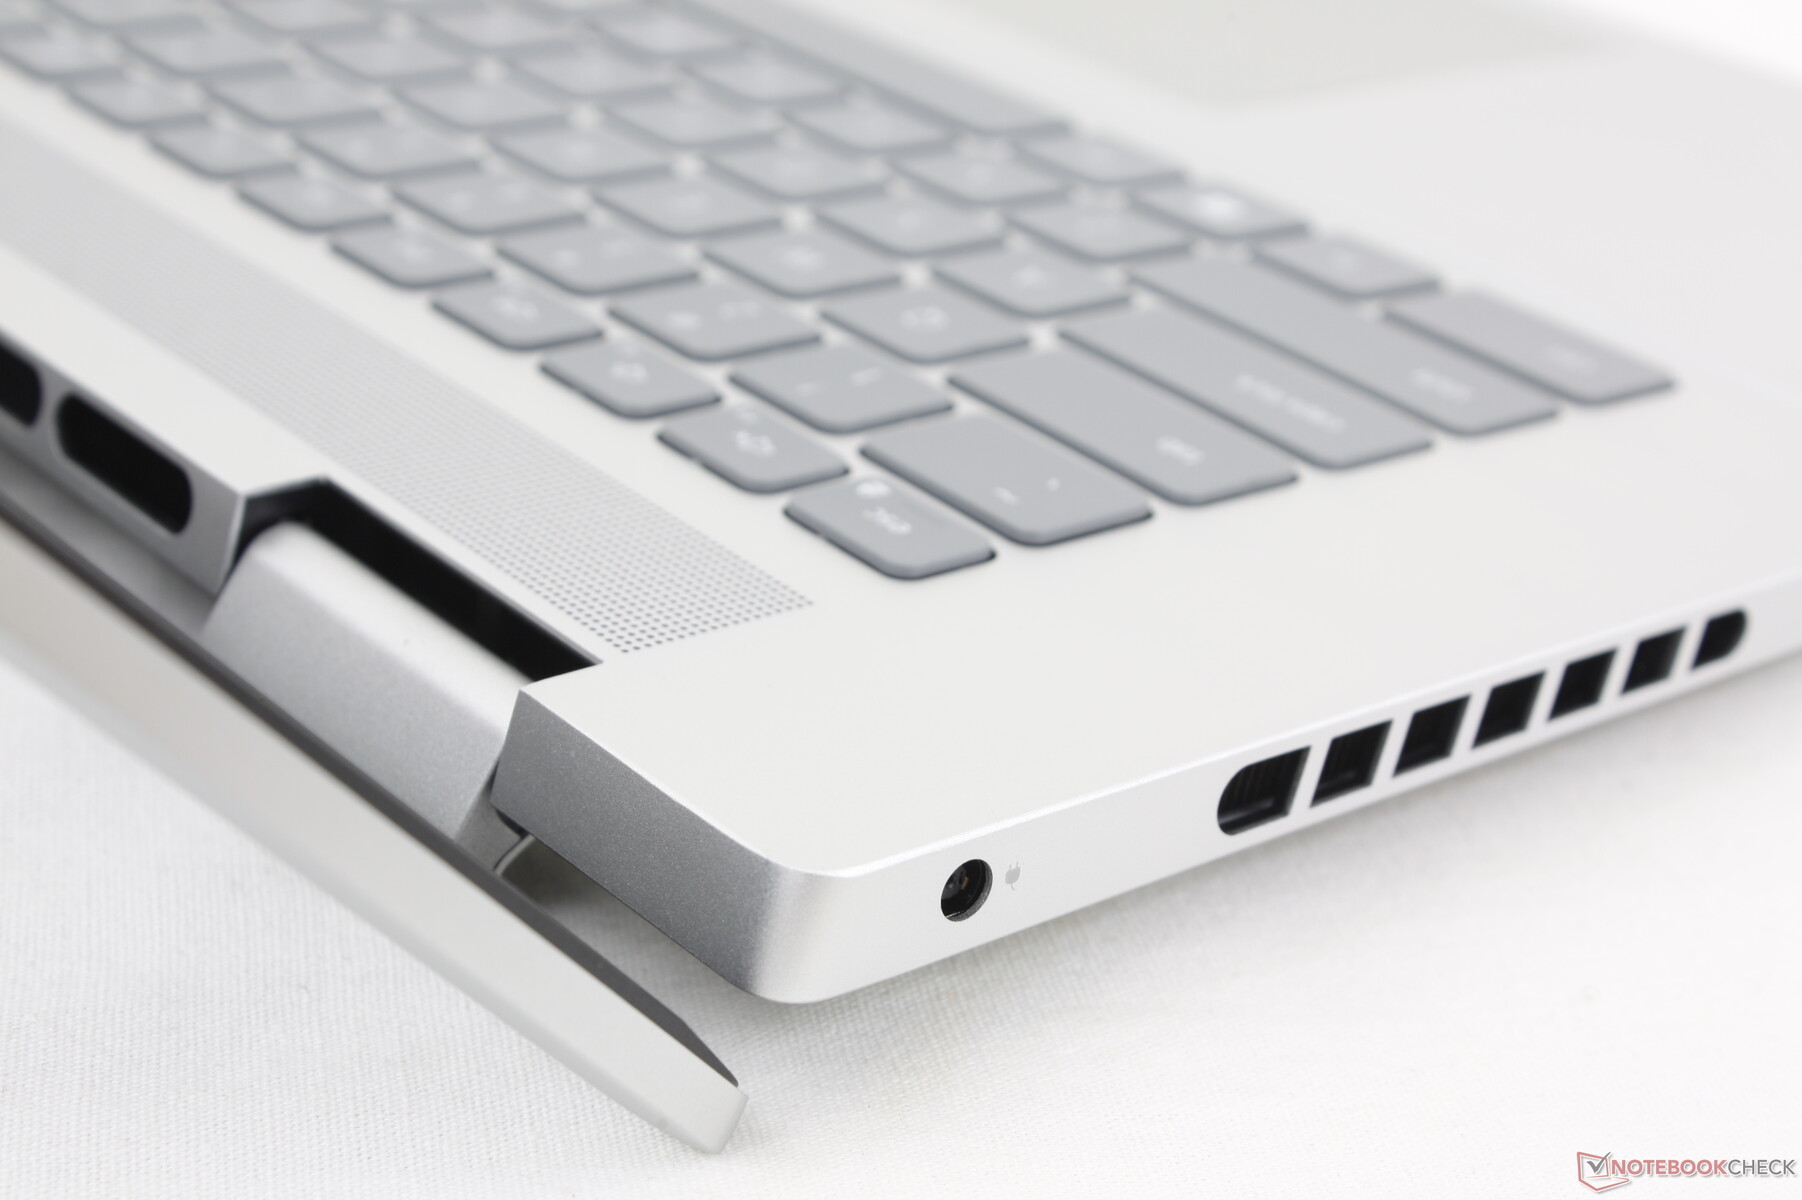
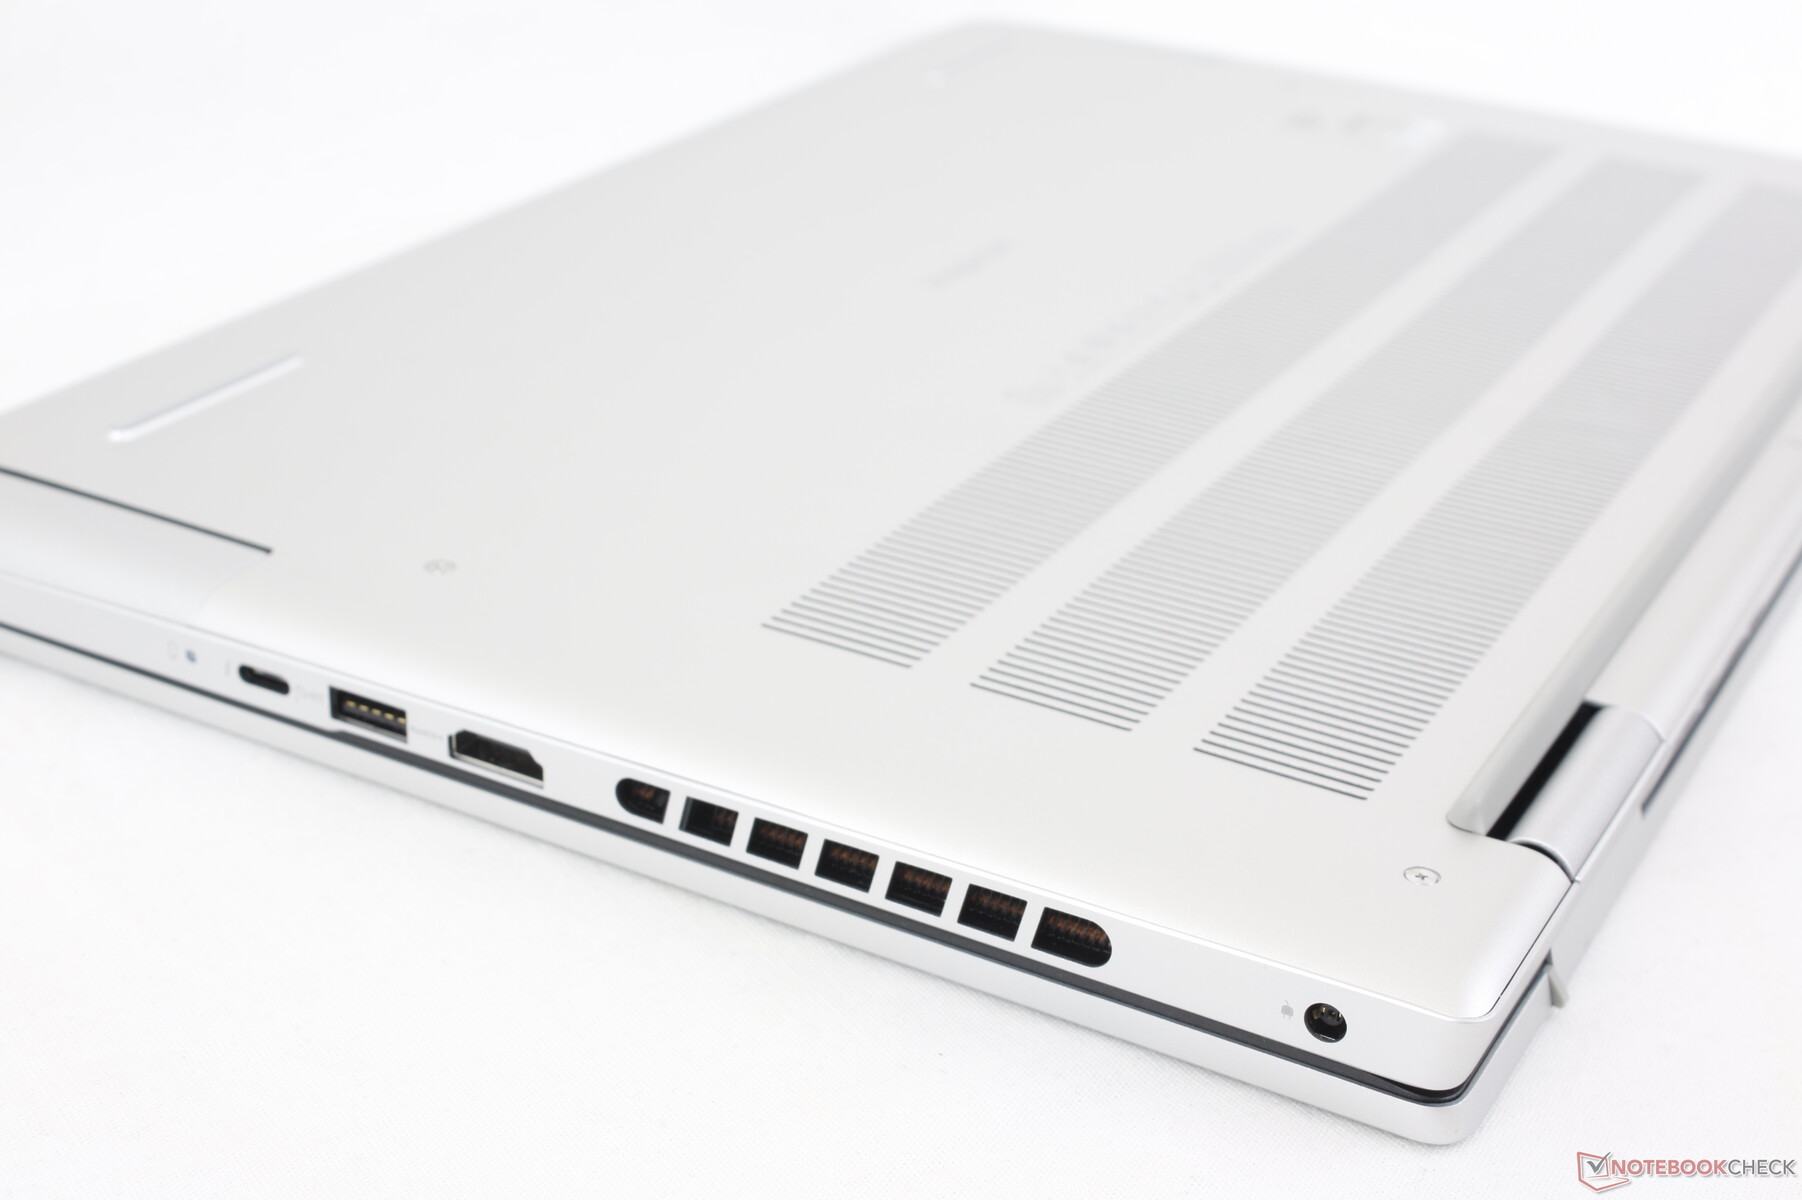
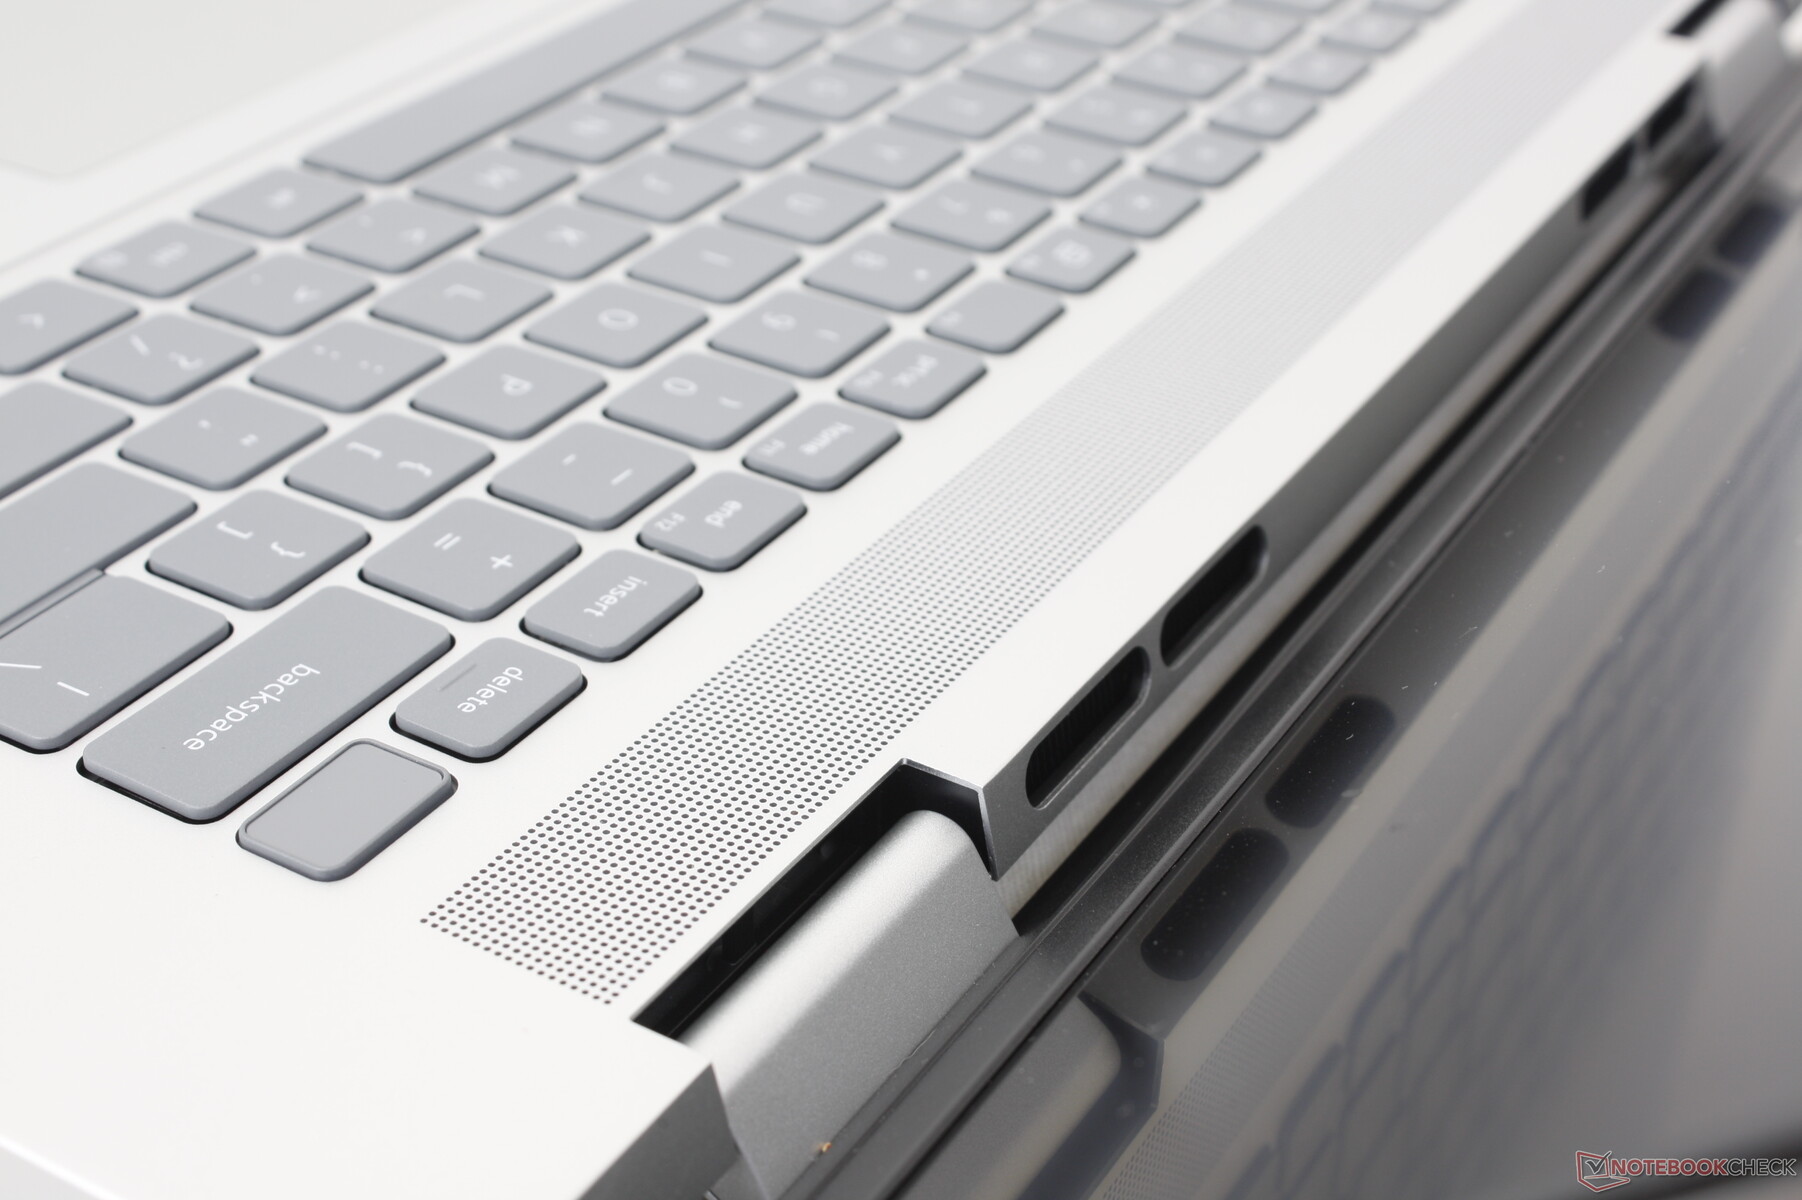
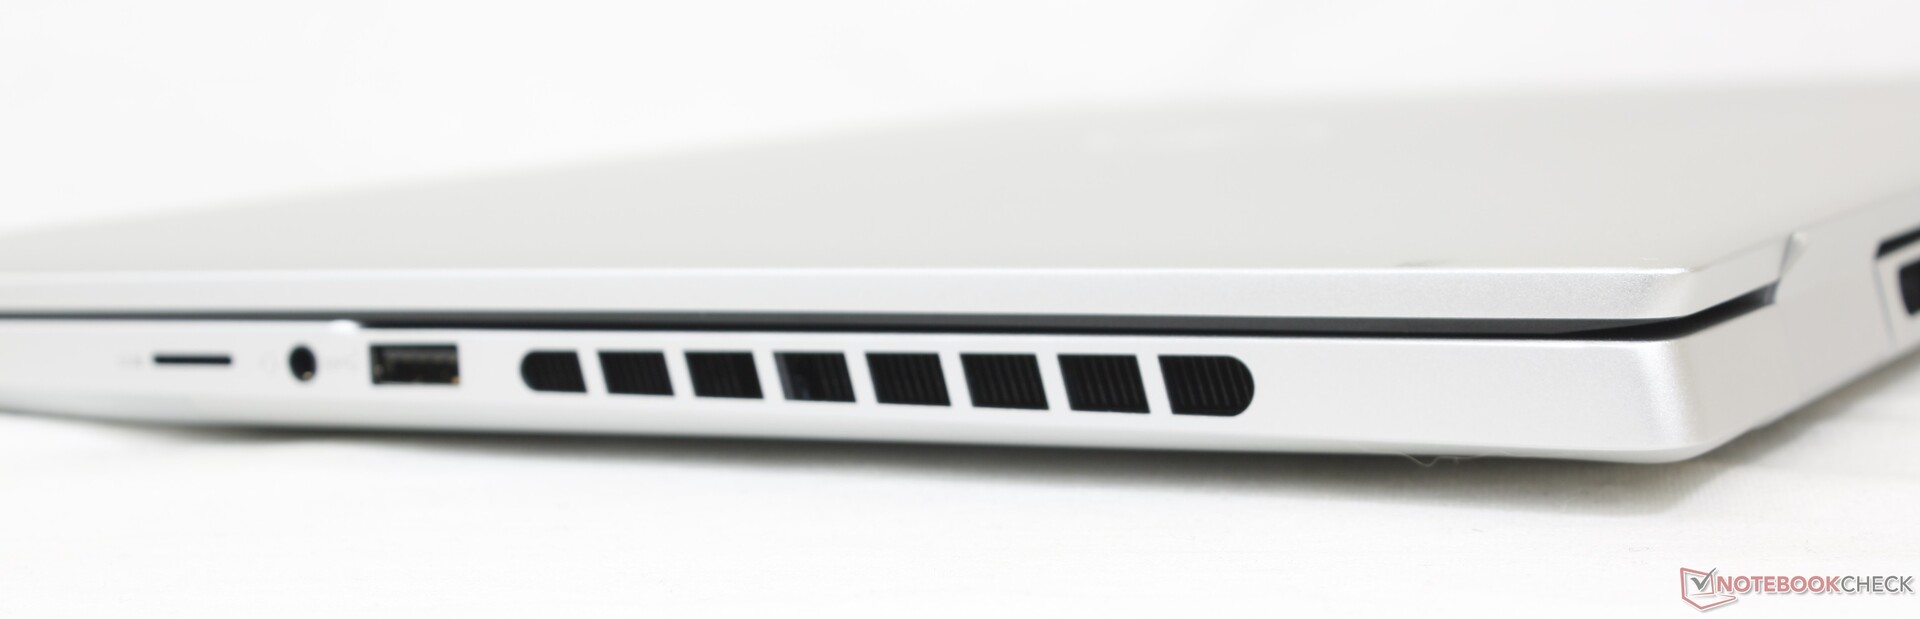
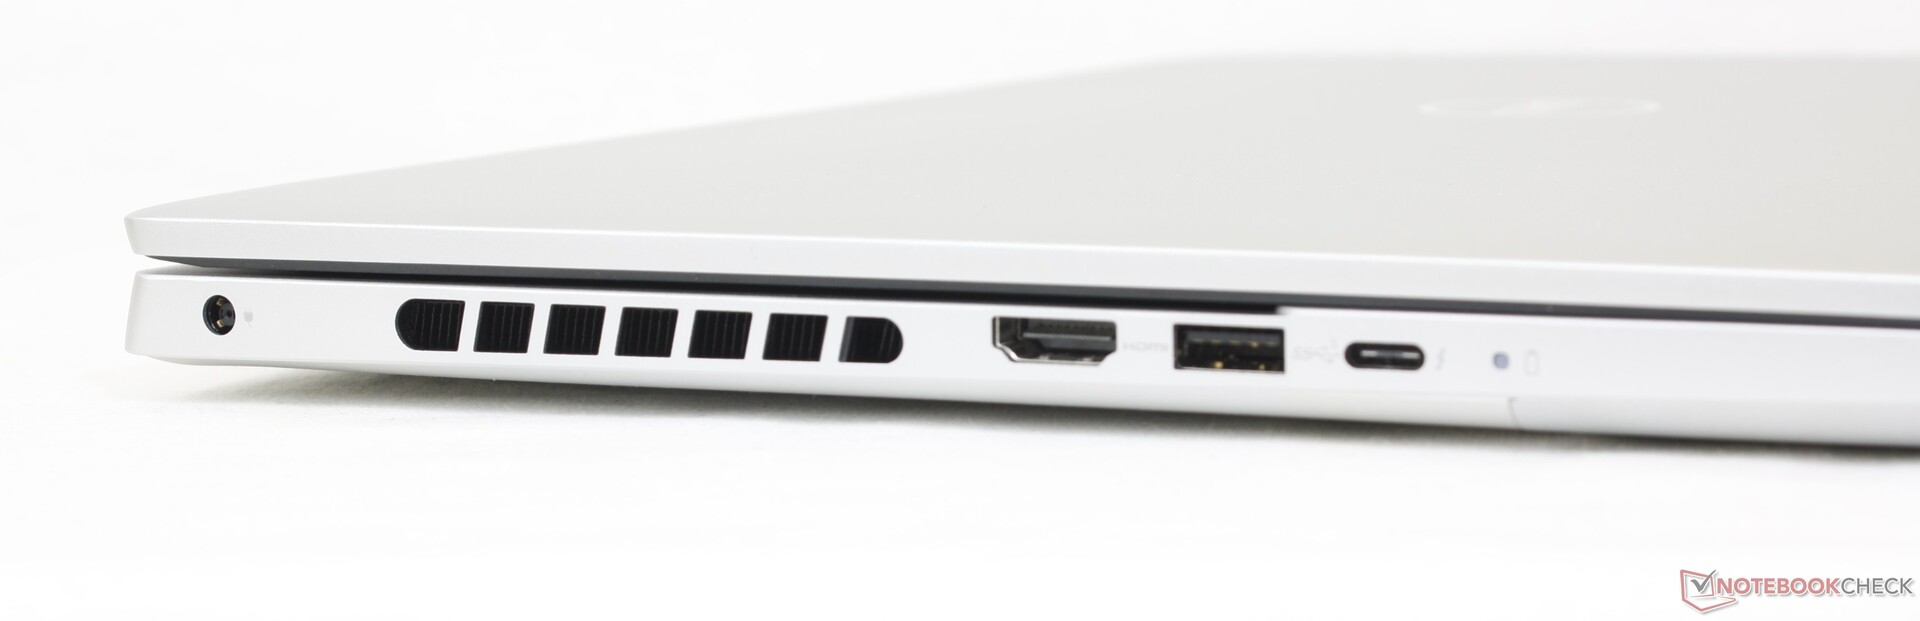
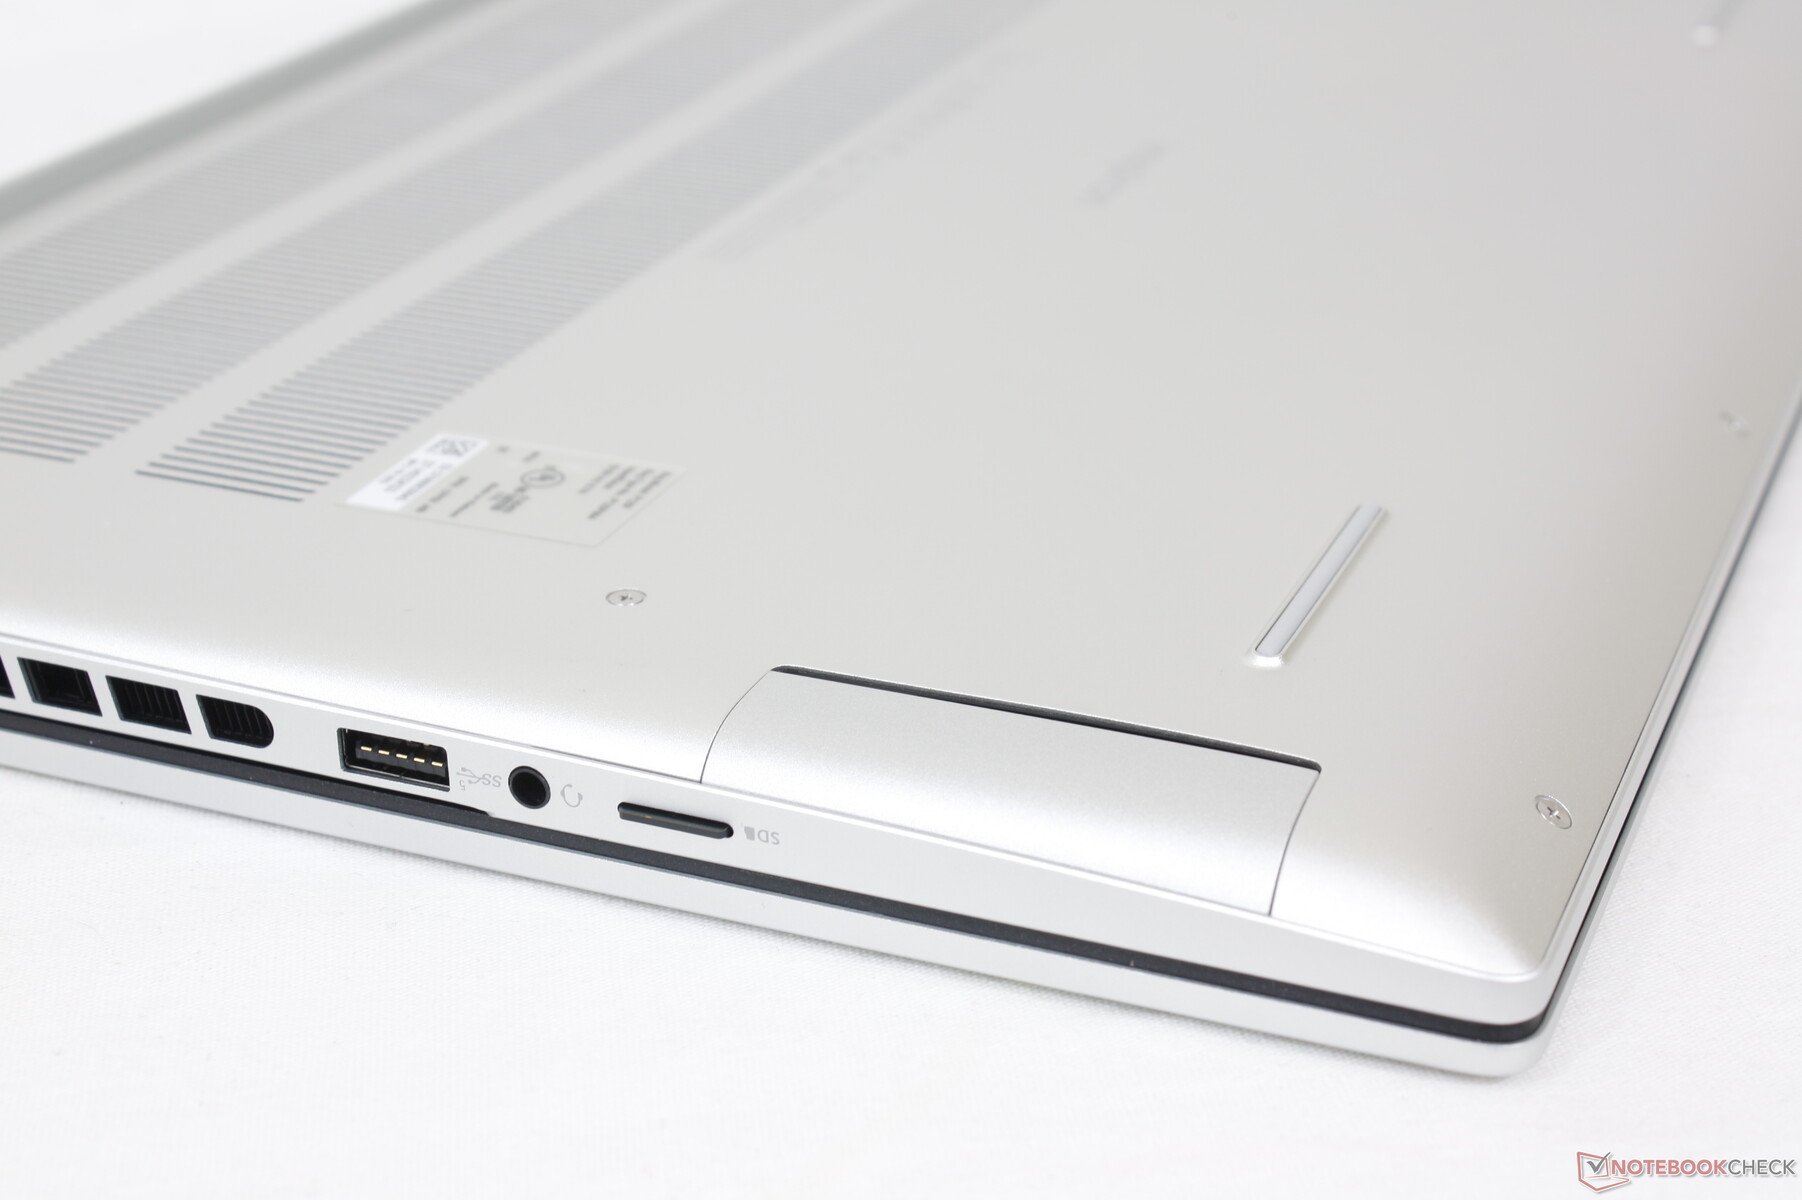
Conectividade - Poderia usar mais USB-C
O posicionamento das portas e as opções incluem tudo do modelo do ano passado, mas com um downgrade notável: o leitor de cartão SD de tamanho normal foi removido para um leitor microSD menor em todas as configurações do RTX 4060. Alternativas como o Envy 16 ou o VivoBook Pro 16X integram mais portas USB-C do que o nosso Dell ou têm leitores de cartão SD de tamanho normal.
Também gostaríamos de ver os futuros modelos Inspiron abandonarem a porta barril do adaptador CA proprietário em favor do carregamento USB-C, como nas séries XPS 15 e XPS 17.
Leitor de cartão SD
Enquanto a série XPS tem alguns dos leitores de cartão SD mais rápidos de todos os laptops, a série Inspiron tem alguns dos mais lentos. Mover 1 GB de fotos do nosso cartão de teste UHS-II para o desktop levaria mais de 50 segundos, em comparação com apenas 5 a 6 segundos em um XPS 15 ou XPS 17.
| SD Card Reader | |
| average JPG Copy Test (av. of 3 runs) | |
| MSI Summit E16 Flip A12UDT-031 (AV Pro SD microSD 128 GB V60) | |
| Asus Vivobook Pro 16X K6604JV-MX016W | |
| Lenovo Slim Pro 9i 16IRP8 (PNY EliteX-Pro60 V60 256 GB) | |
| HP Envy 16 h0112nr (AV Pro SD microSD 128 GB V60) | |
| Dell Inspiron 16 Plus 7620 (Toshiba Exceria Pro SDXC 64 GB UHS-II) | |
| Dell Inspiron 16 Plus 7630 (AV Pro SD microSD 128 GB V60) | |
| maximum AS SSD Seq Read Test (1GB) | |
| MSI Summit E16 Flip A12UDT-031 (AV Pro SD microSD 128 GB V60) | |
| Asus Vivobook Pro 16X K6604JV-MX016W | |
| Lenovo Slim Pro 9i 16IRP8 (PNY EliteX-Pro60 V60 256 GB) | |
| HP Envy 16 h0112nr (AV Pro SD microSD 128 GB V60) | |
| Dell Inspiron 16 Plus 7620 (Toshiba Exceria Pro SDXC 64 GB UHS-II) | |
| Dell Inspiron 16 Plus 7630 (AV Pro SD microSD 128 GB V60) | |
Comunicação
Um Intel AX211 é padrão para conectividade Wi-Fi 6E e Bluetooth 5.3. Tivemos um desempenho estável e confiável quando emparelhado com nossa rede de teste Asus AXE11000 6GHz.
Um módulo MediaTek está incluído, se configurado com uma CPU AMD.
Webcam
A webcam de 2 MP tornou-se padrão na maioria dos laptops multimídia. Os modelos mais caros da HP incluem webcams de 5 MP ou até de 8 MP se a qualidade da webcam for prioritária.
Um controle deslizante físico está incluído para privacidade, mas não há suporte para infravermelho.


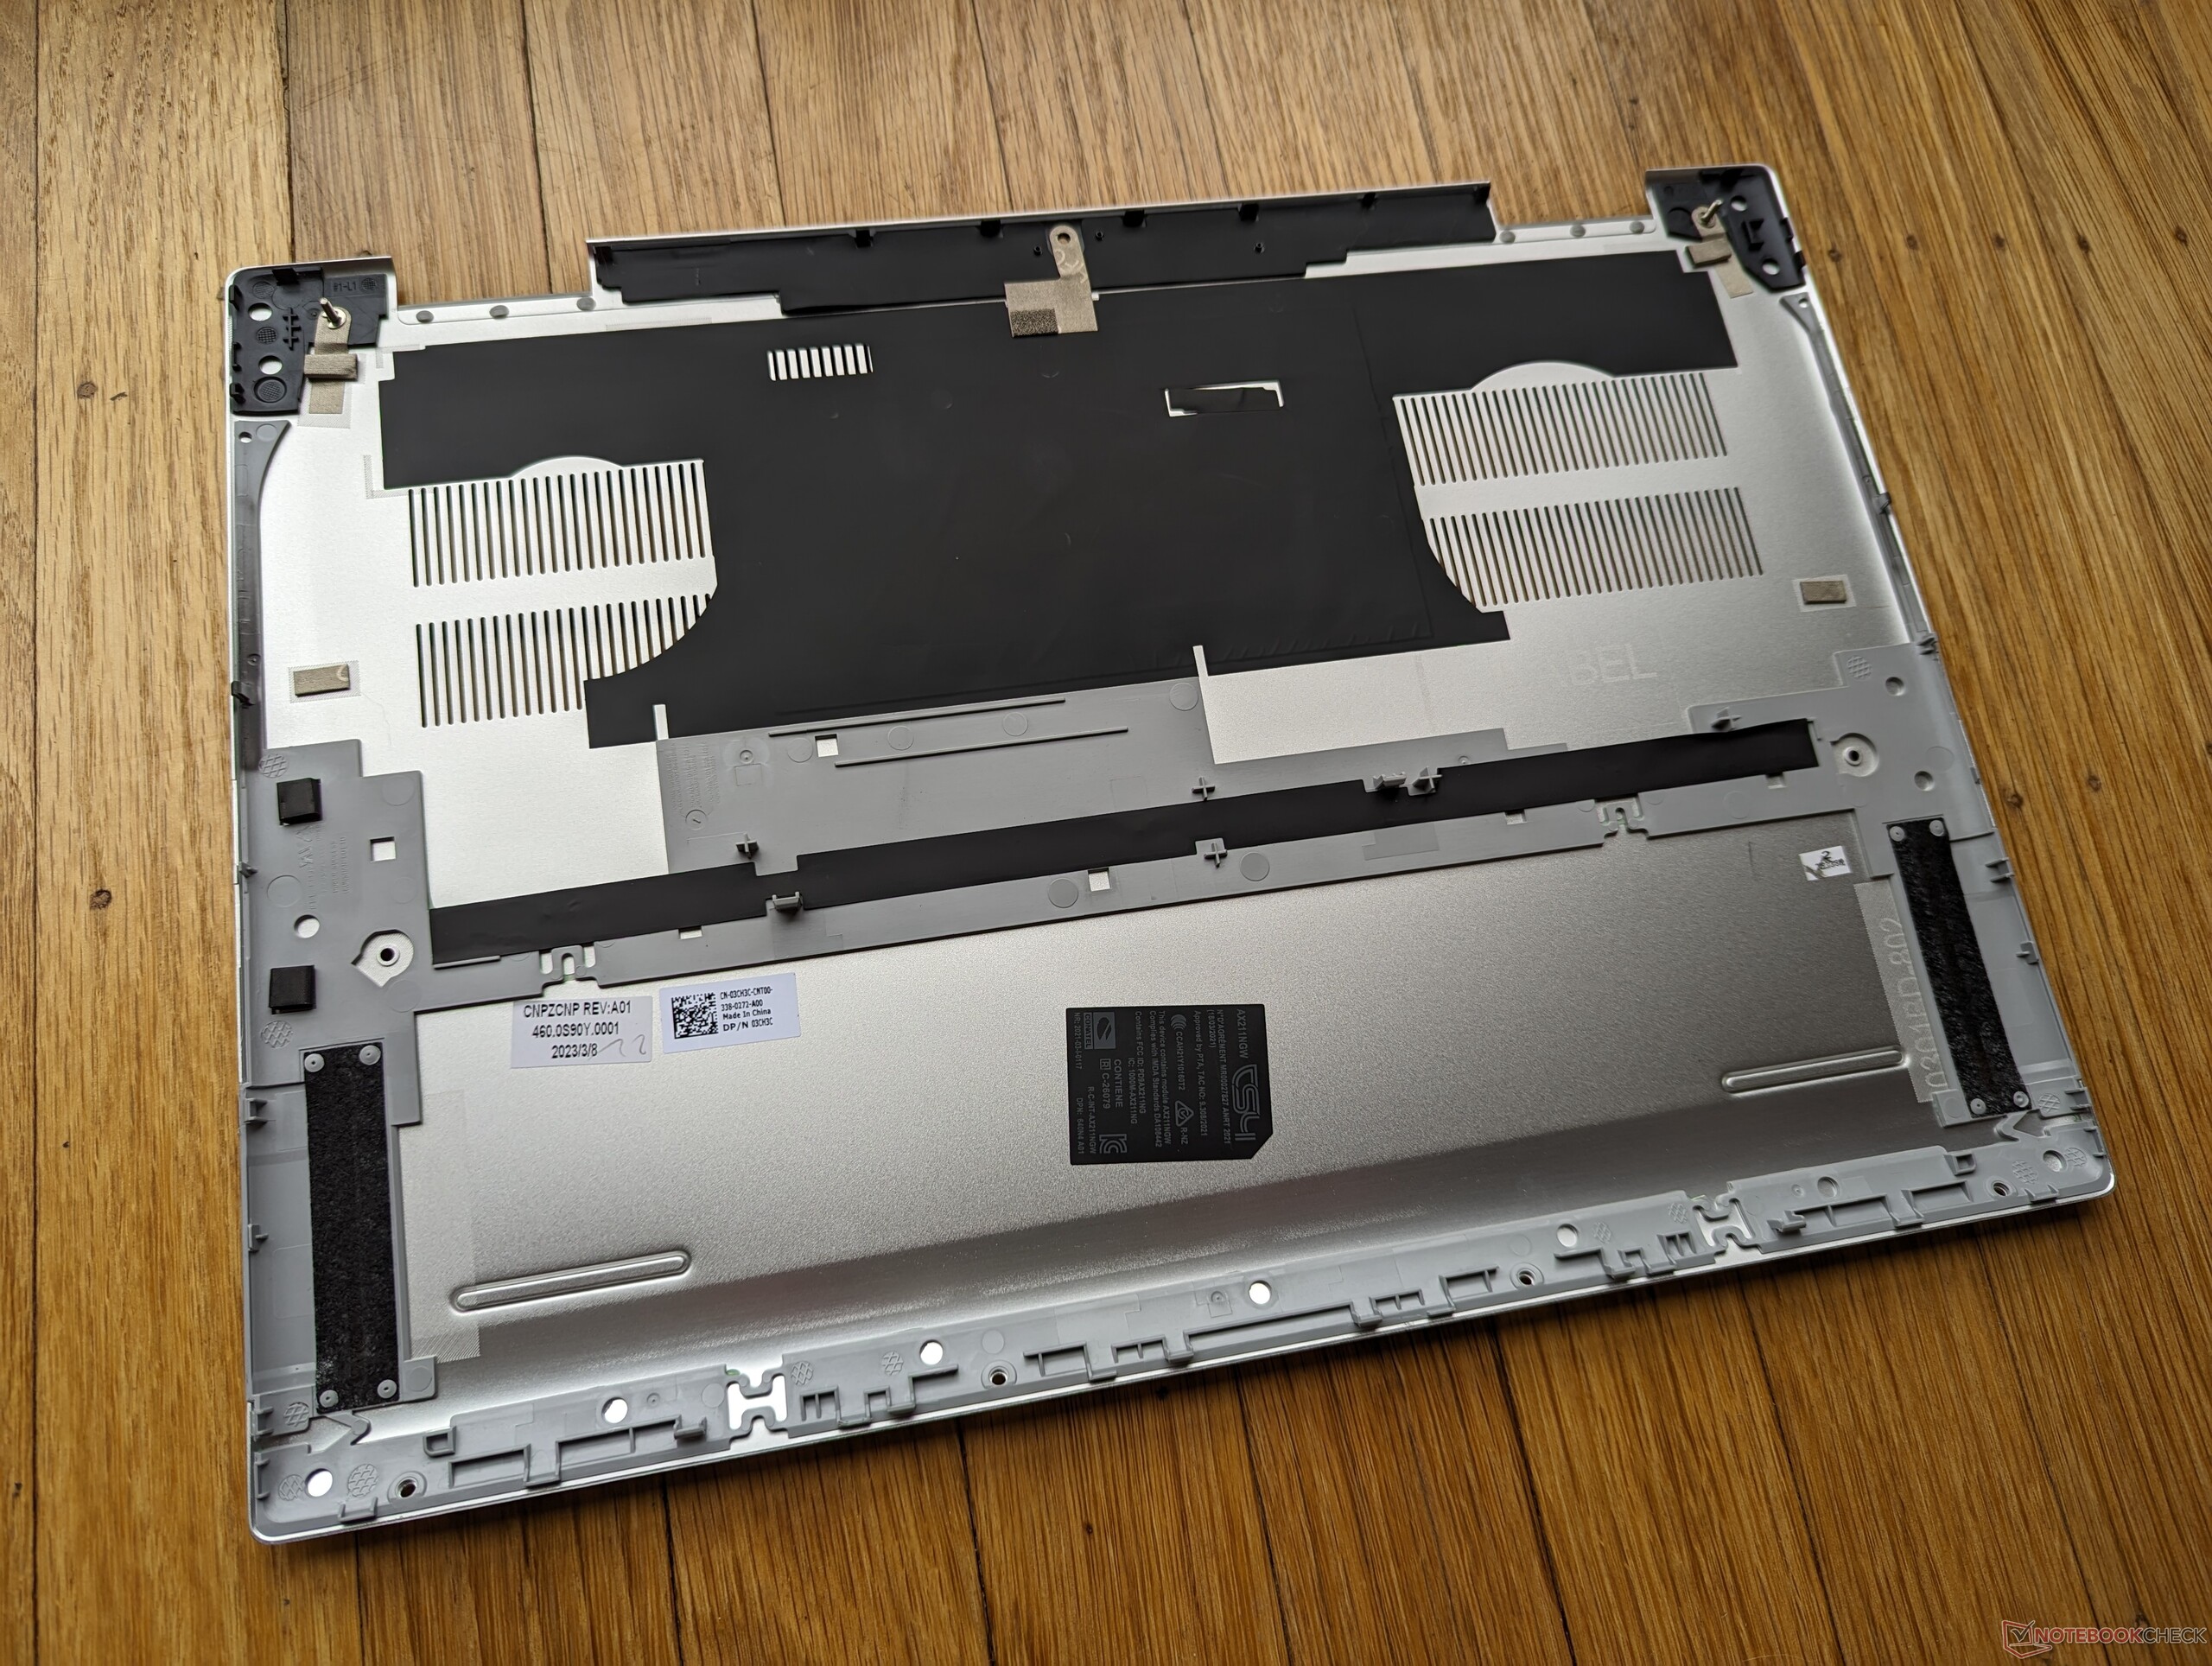
Manutenção
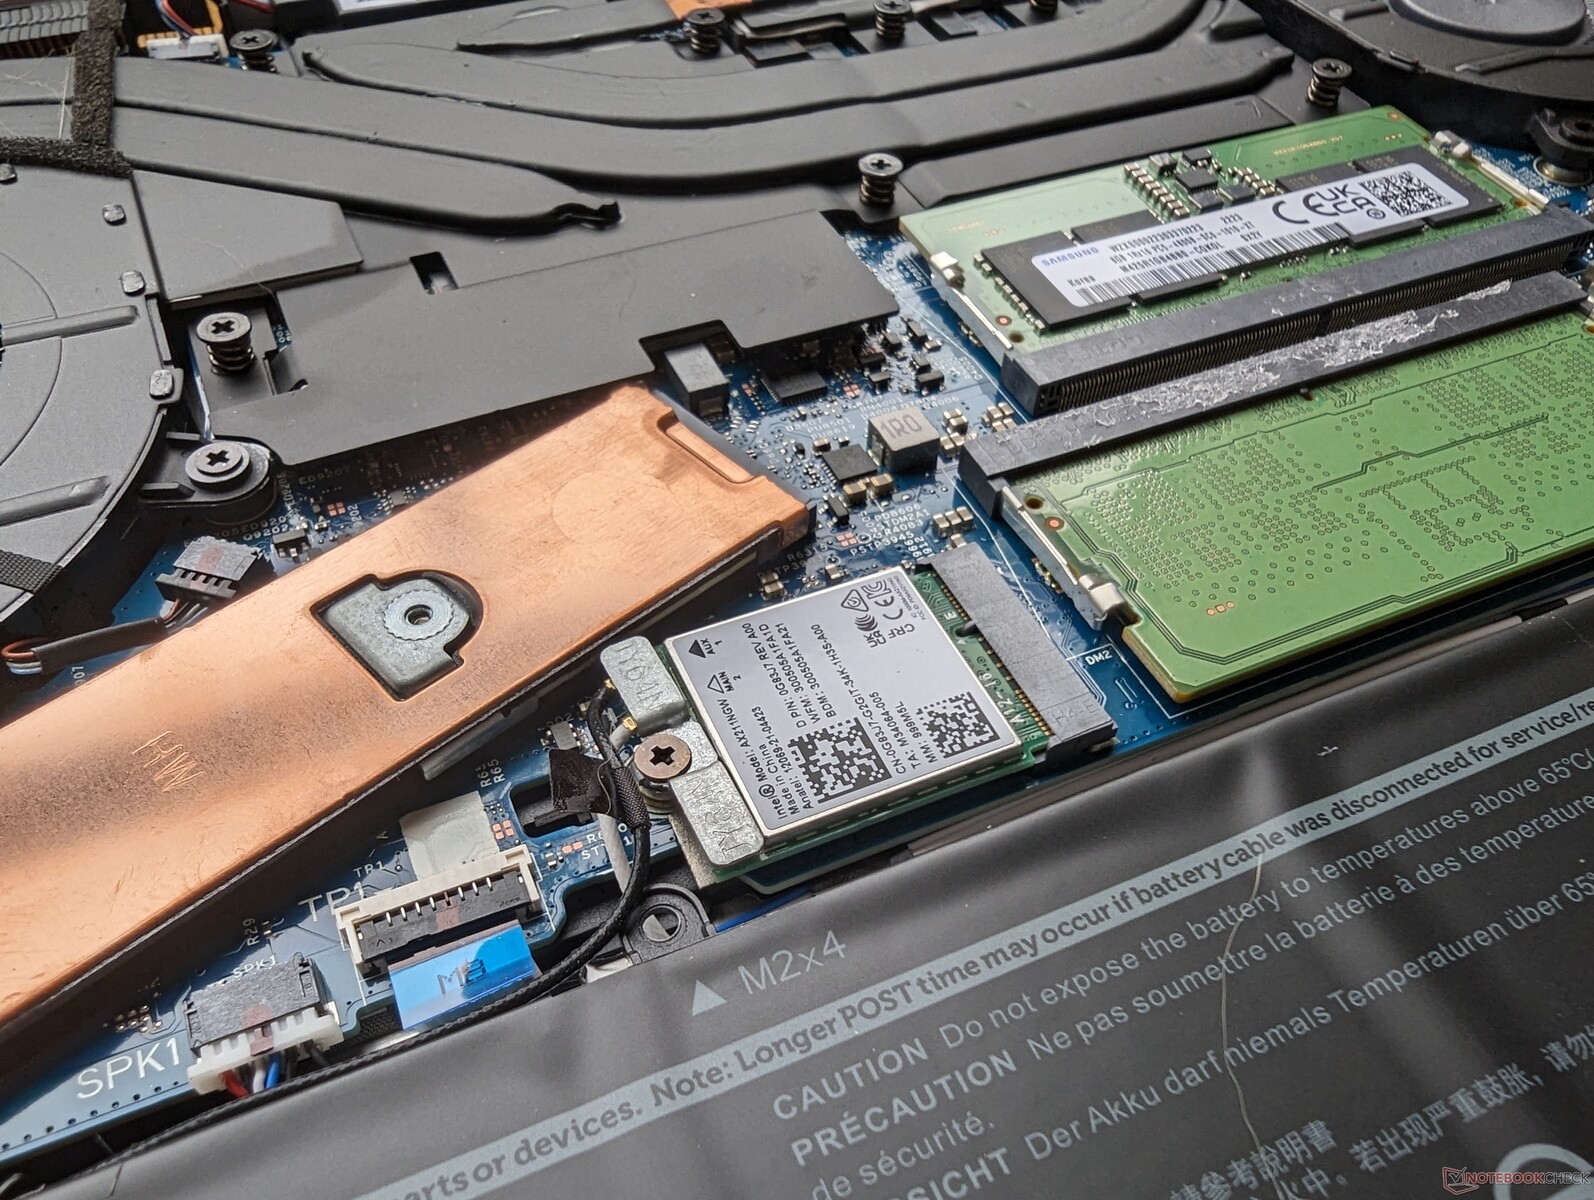
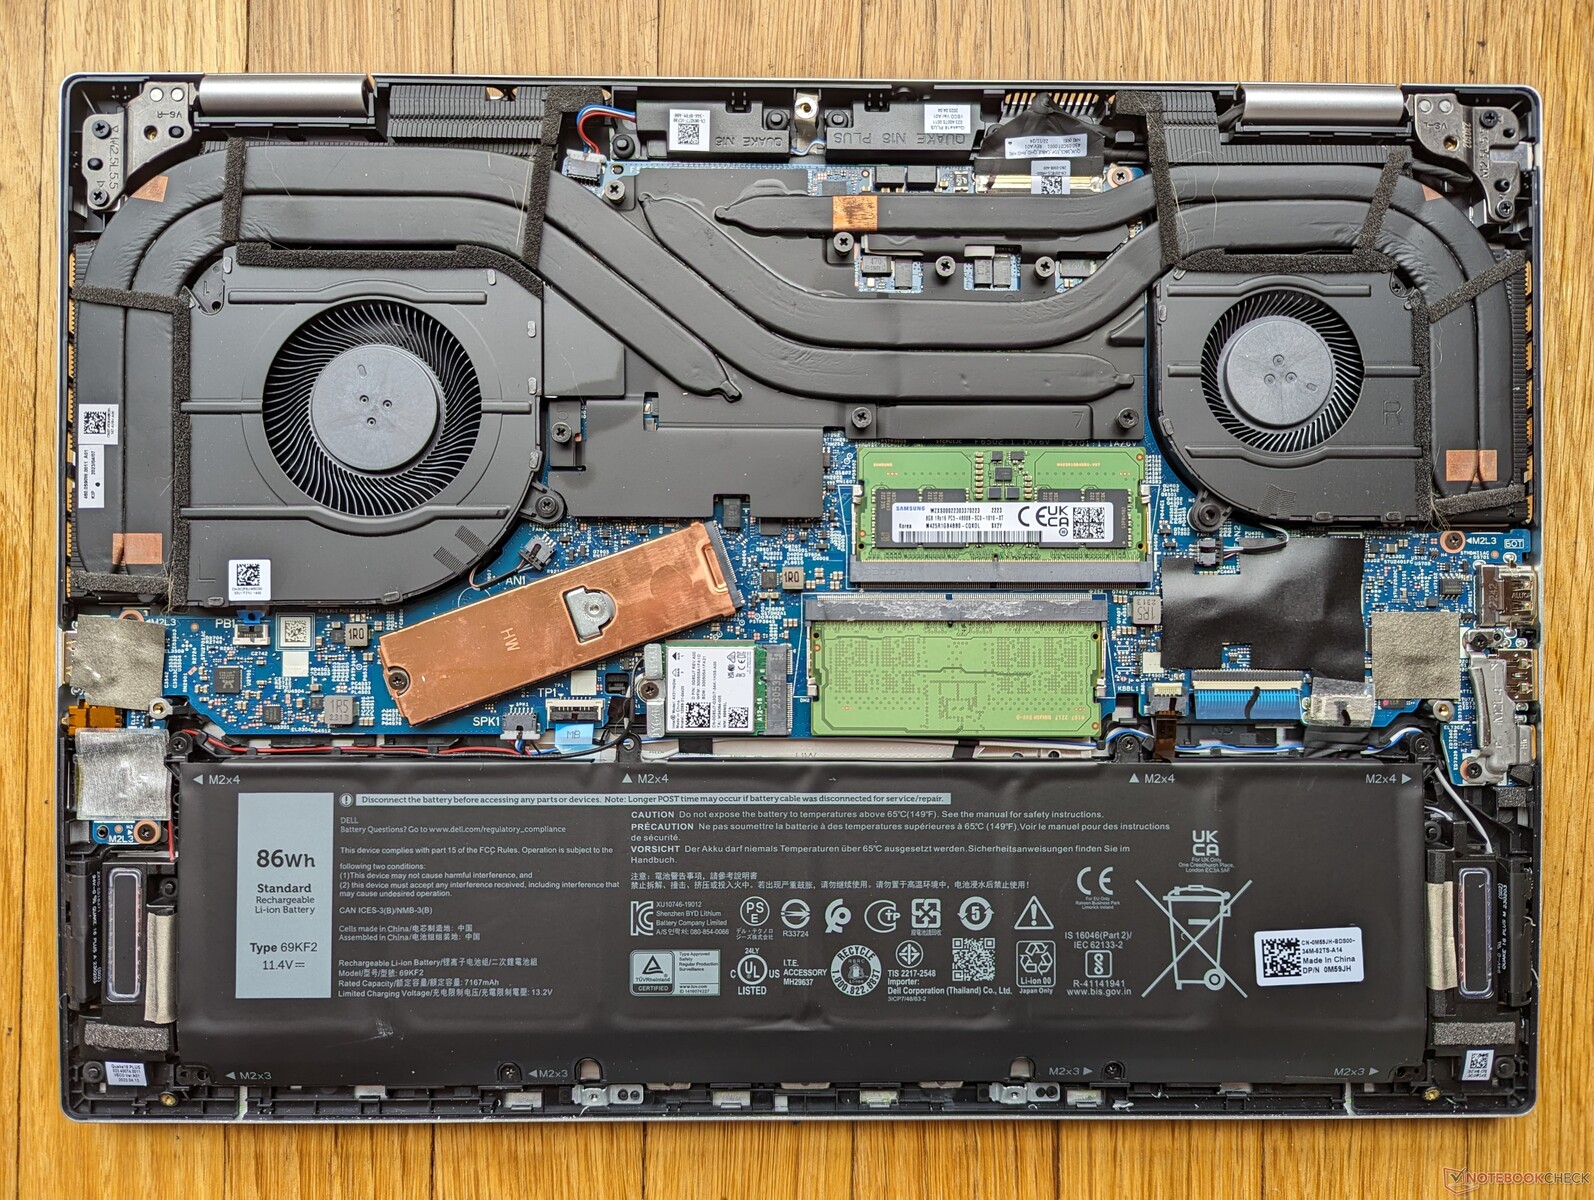
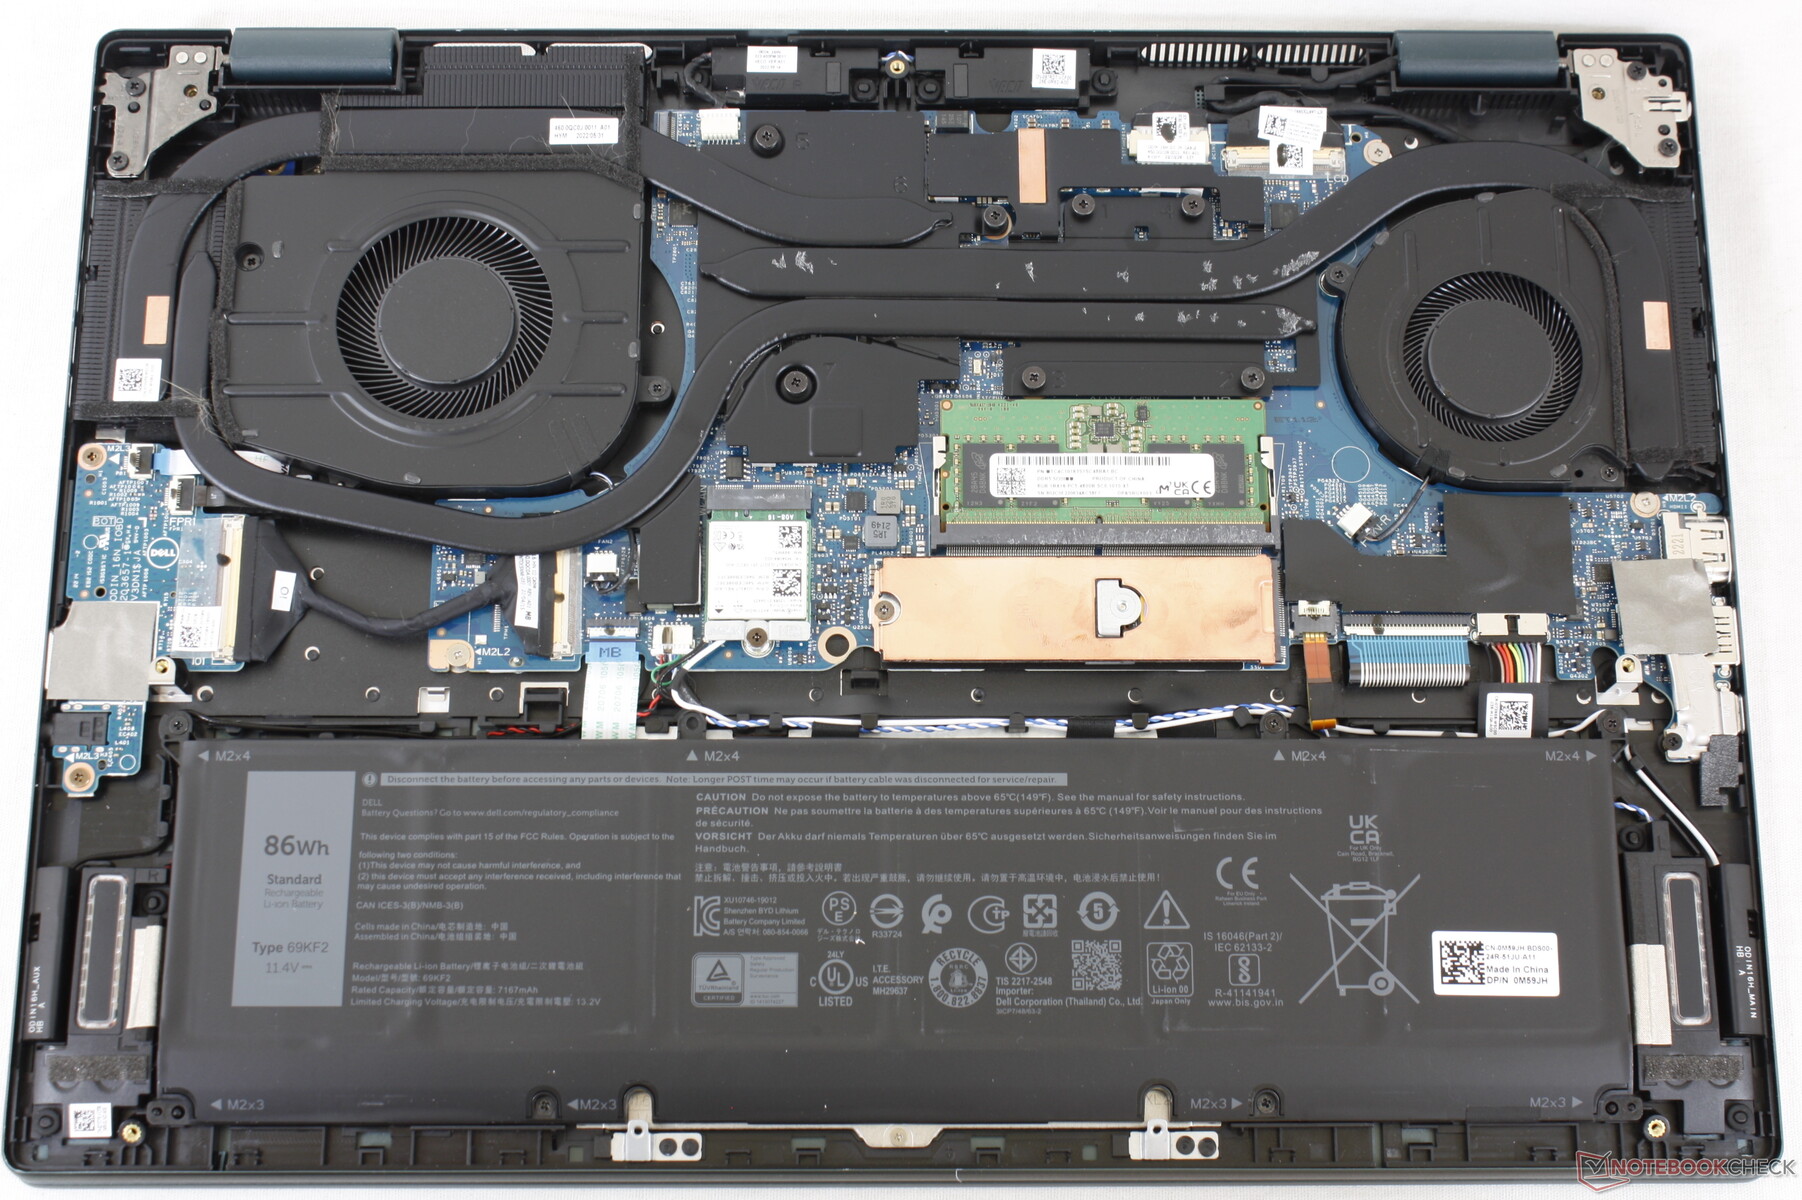
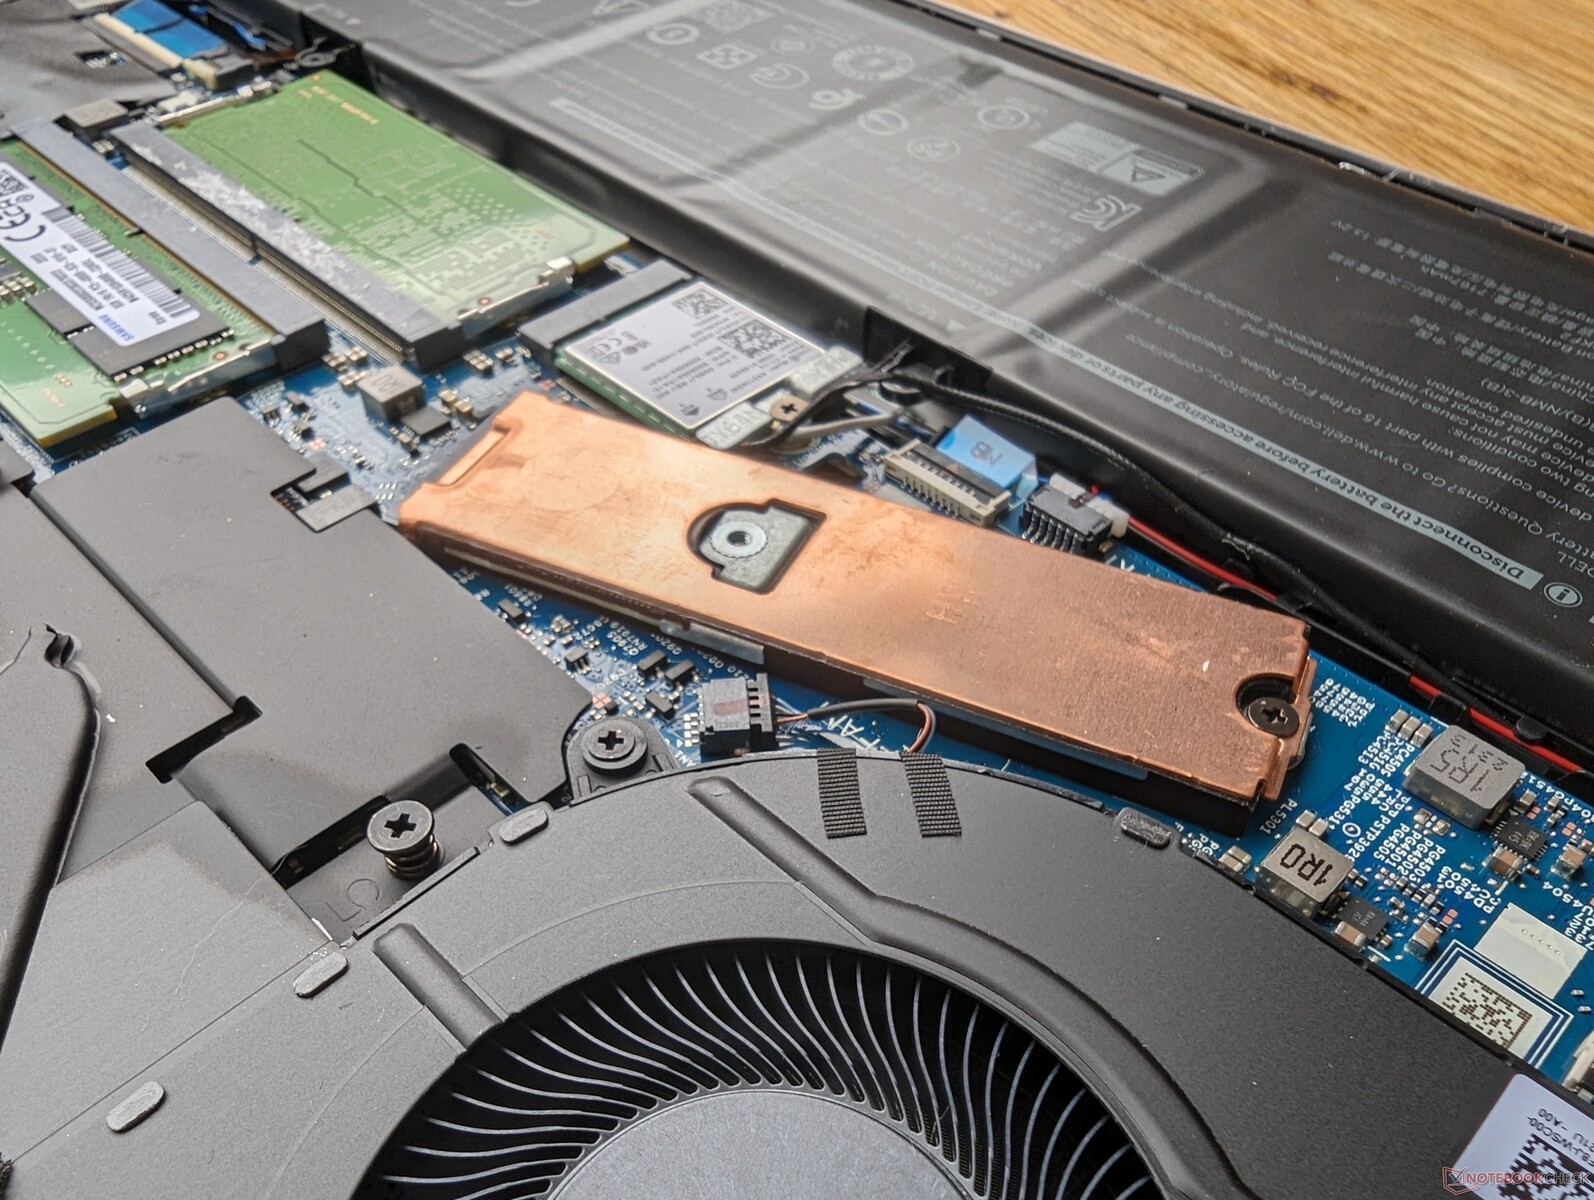
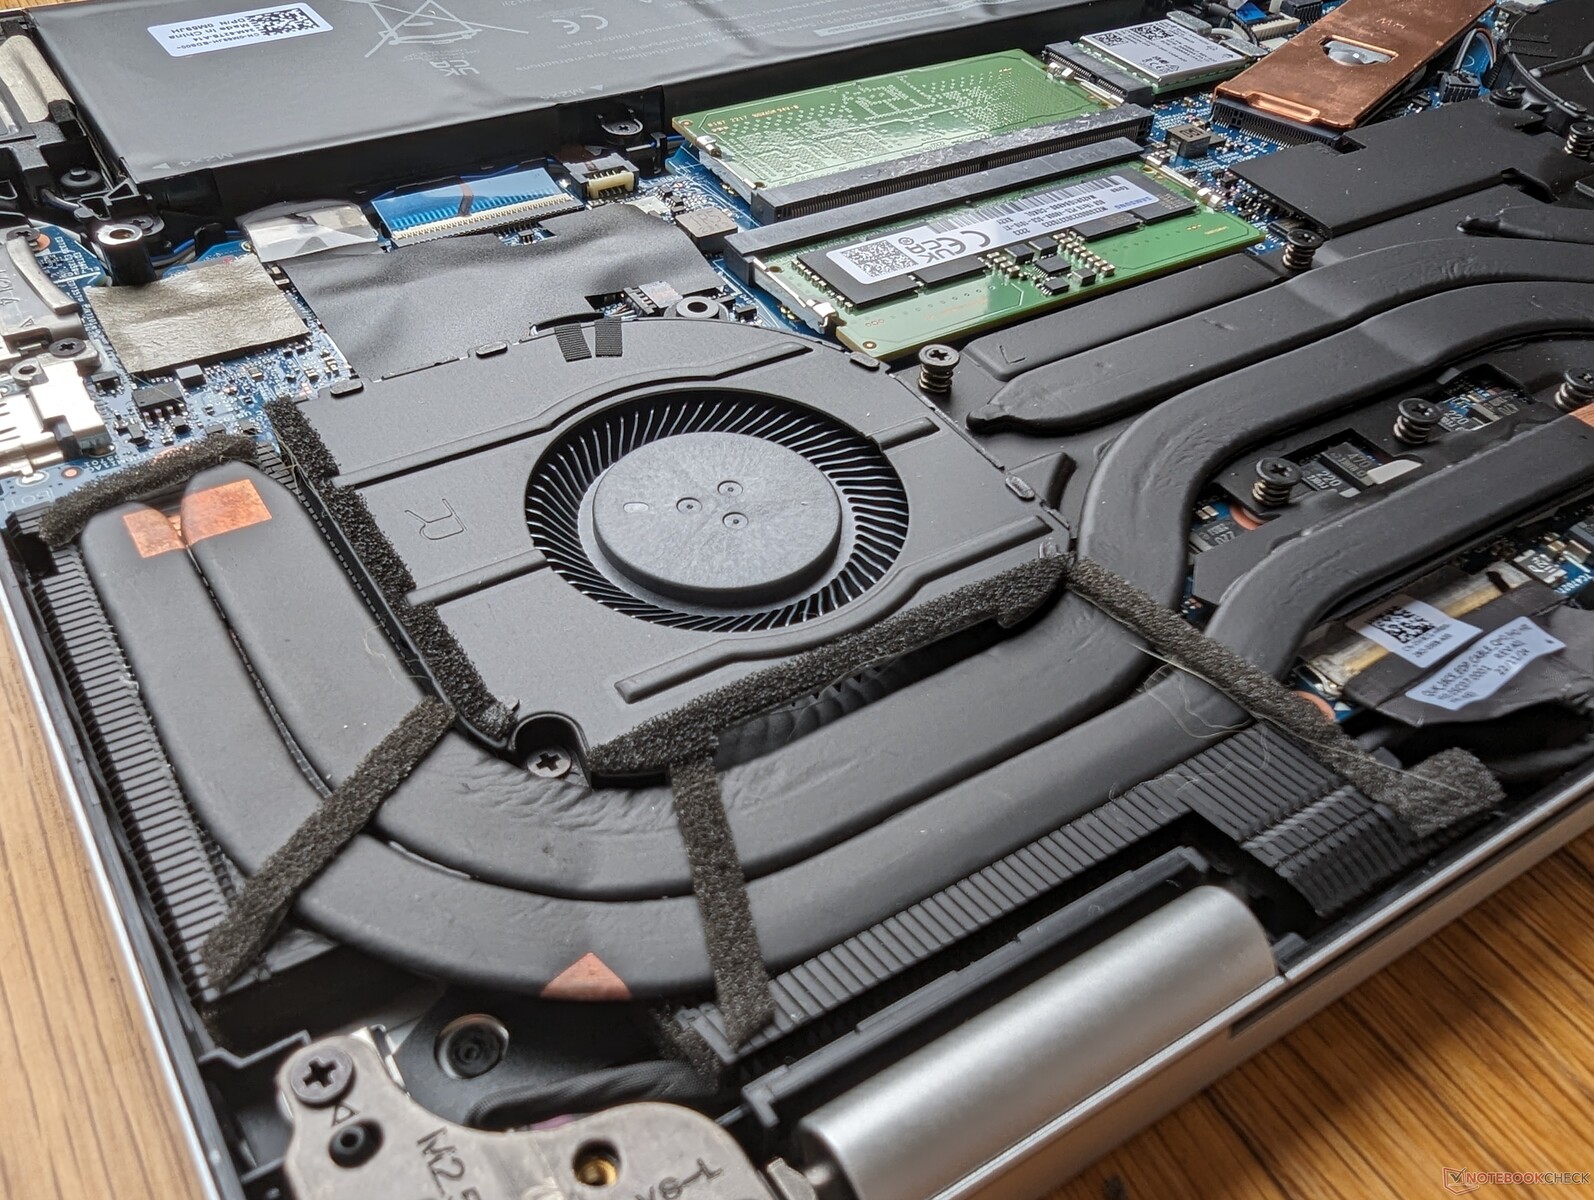
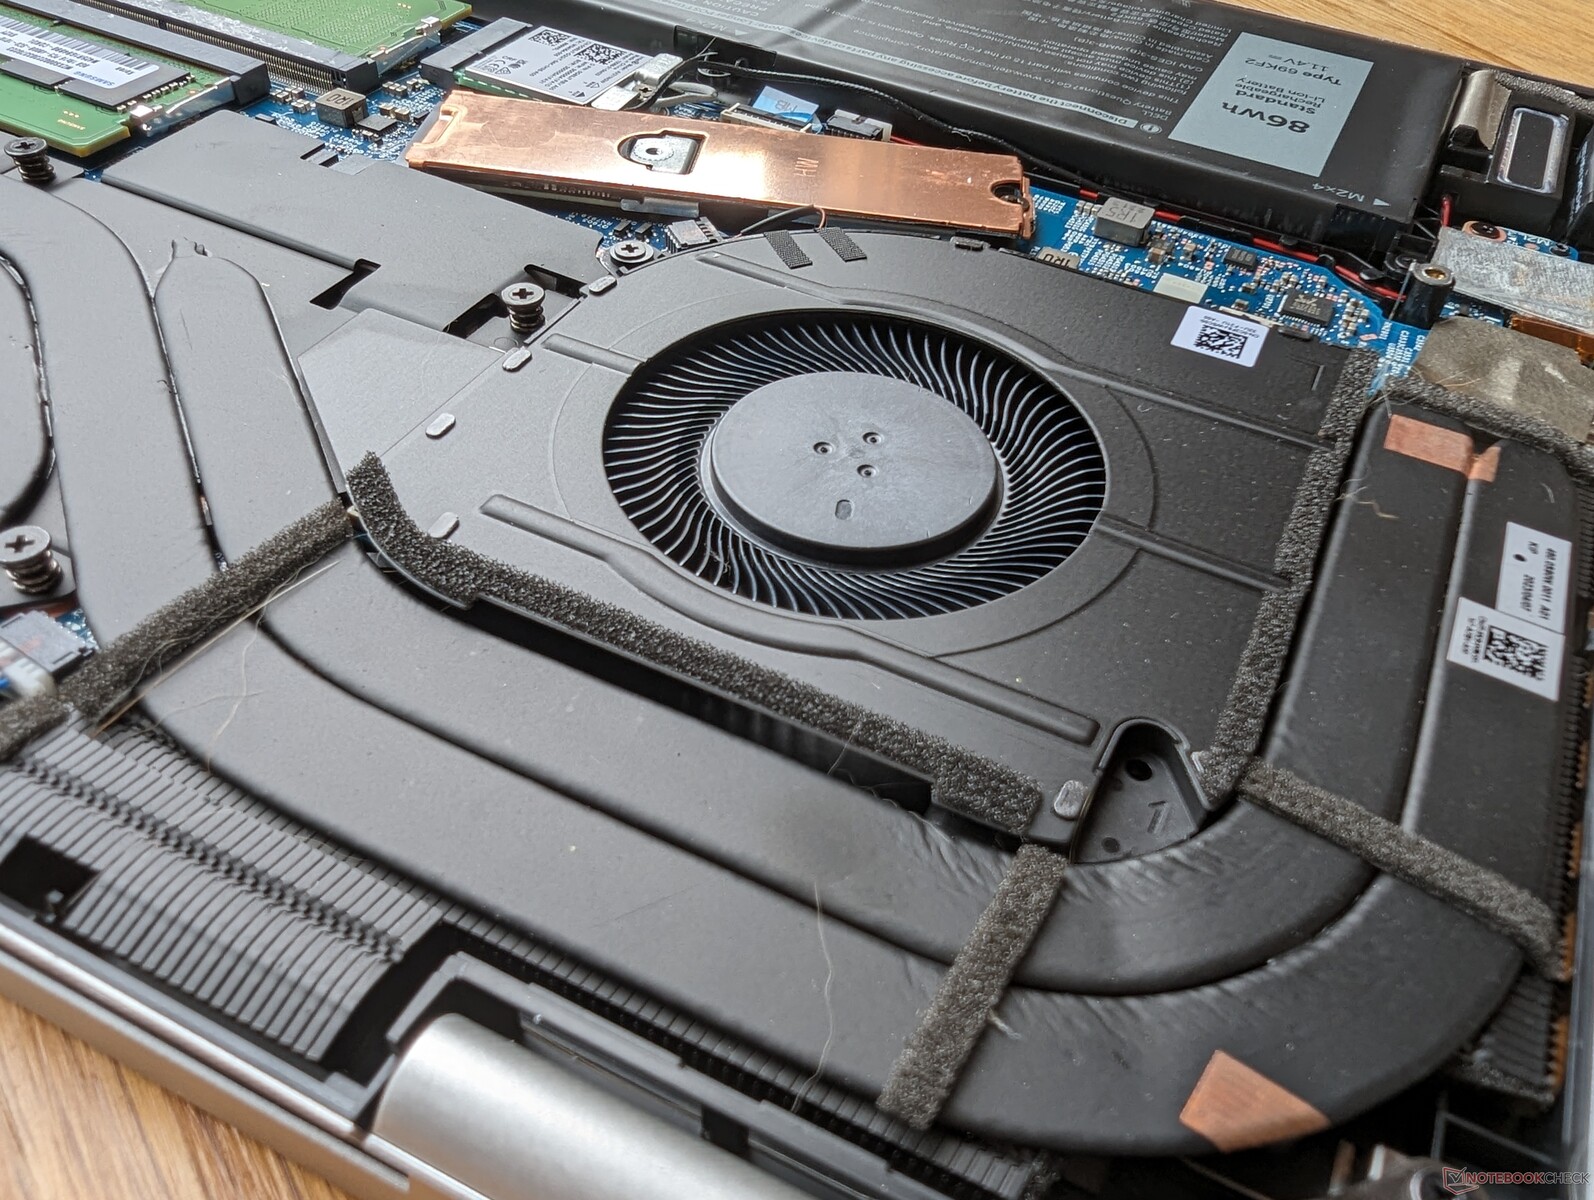
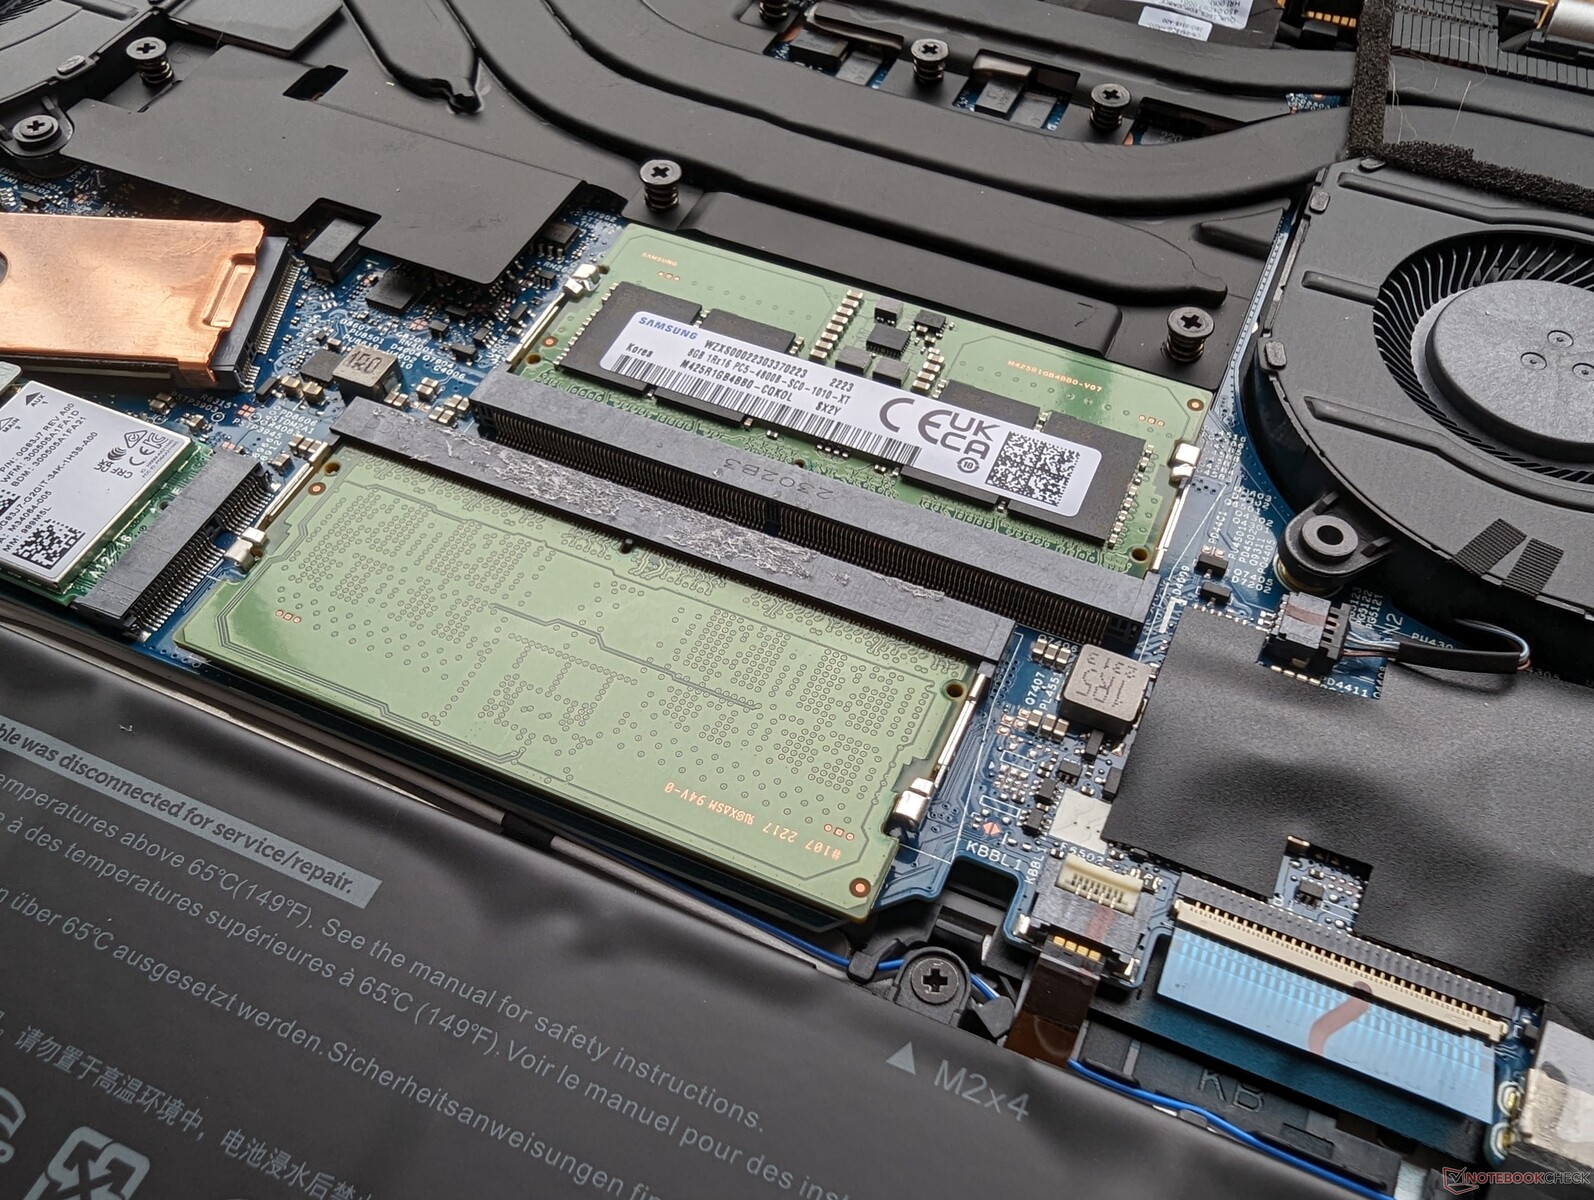
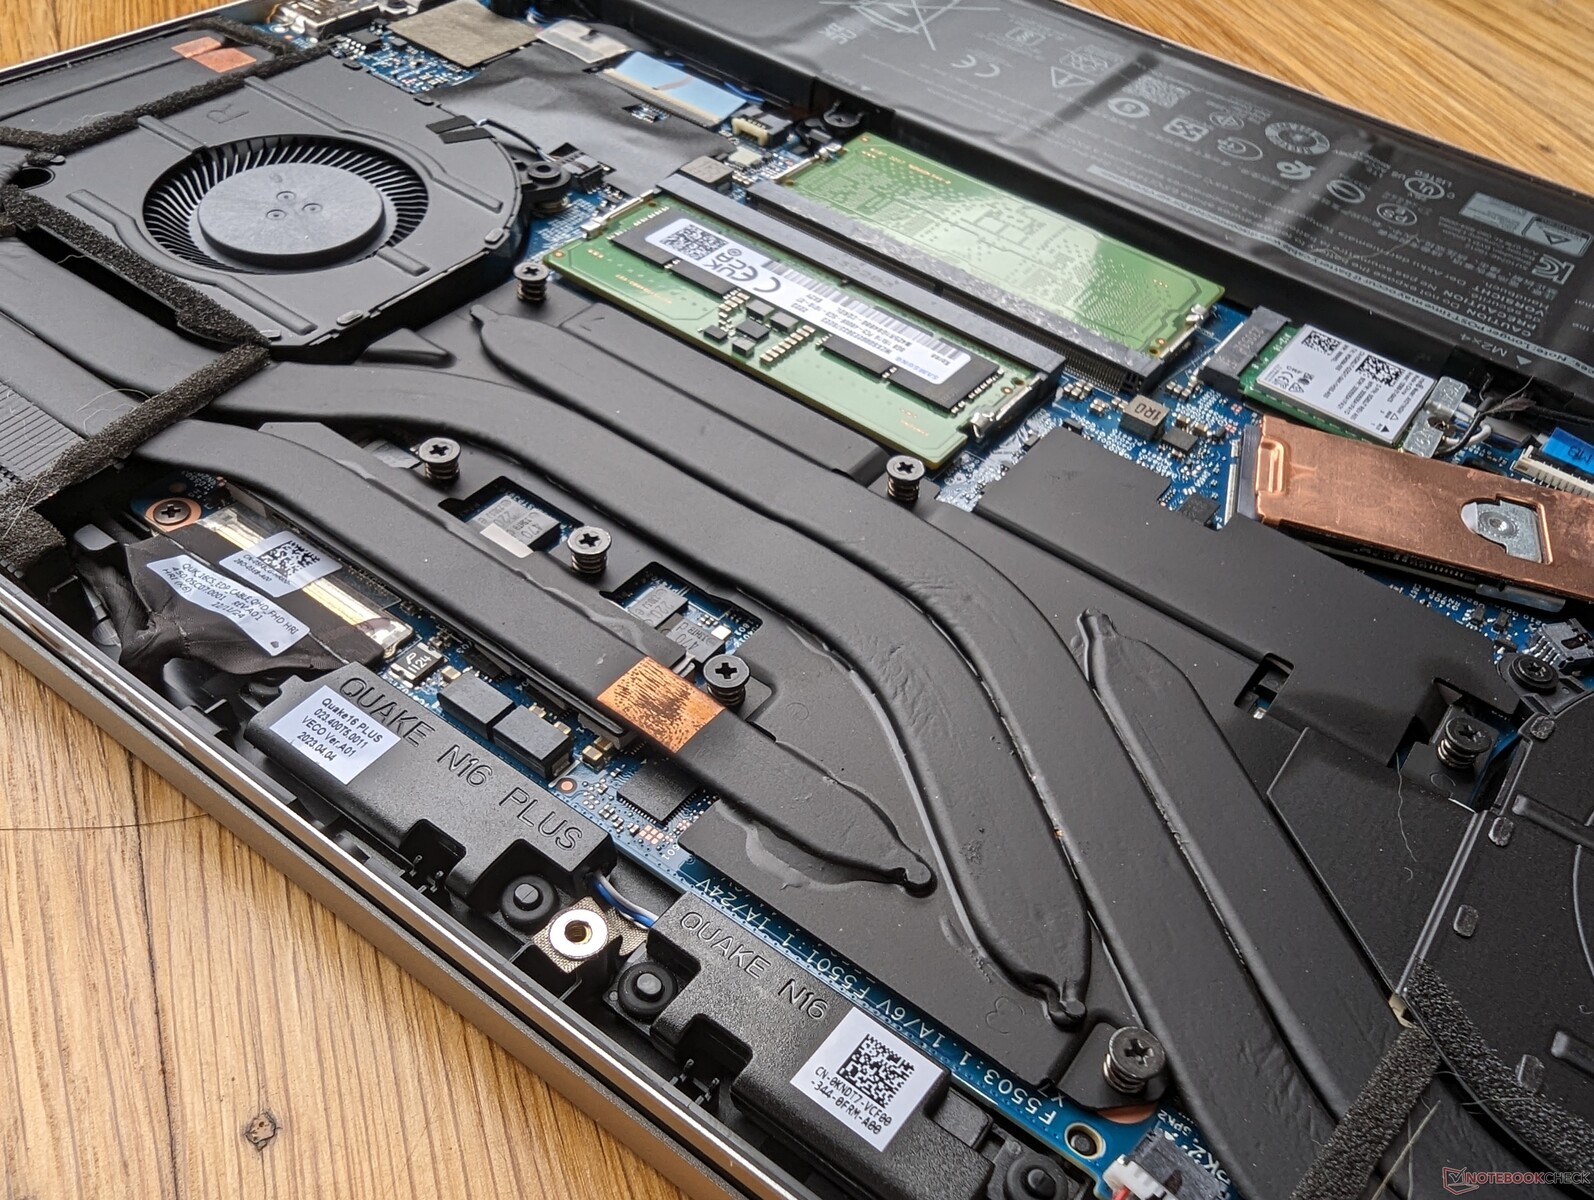
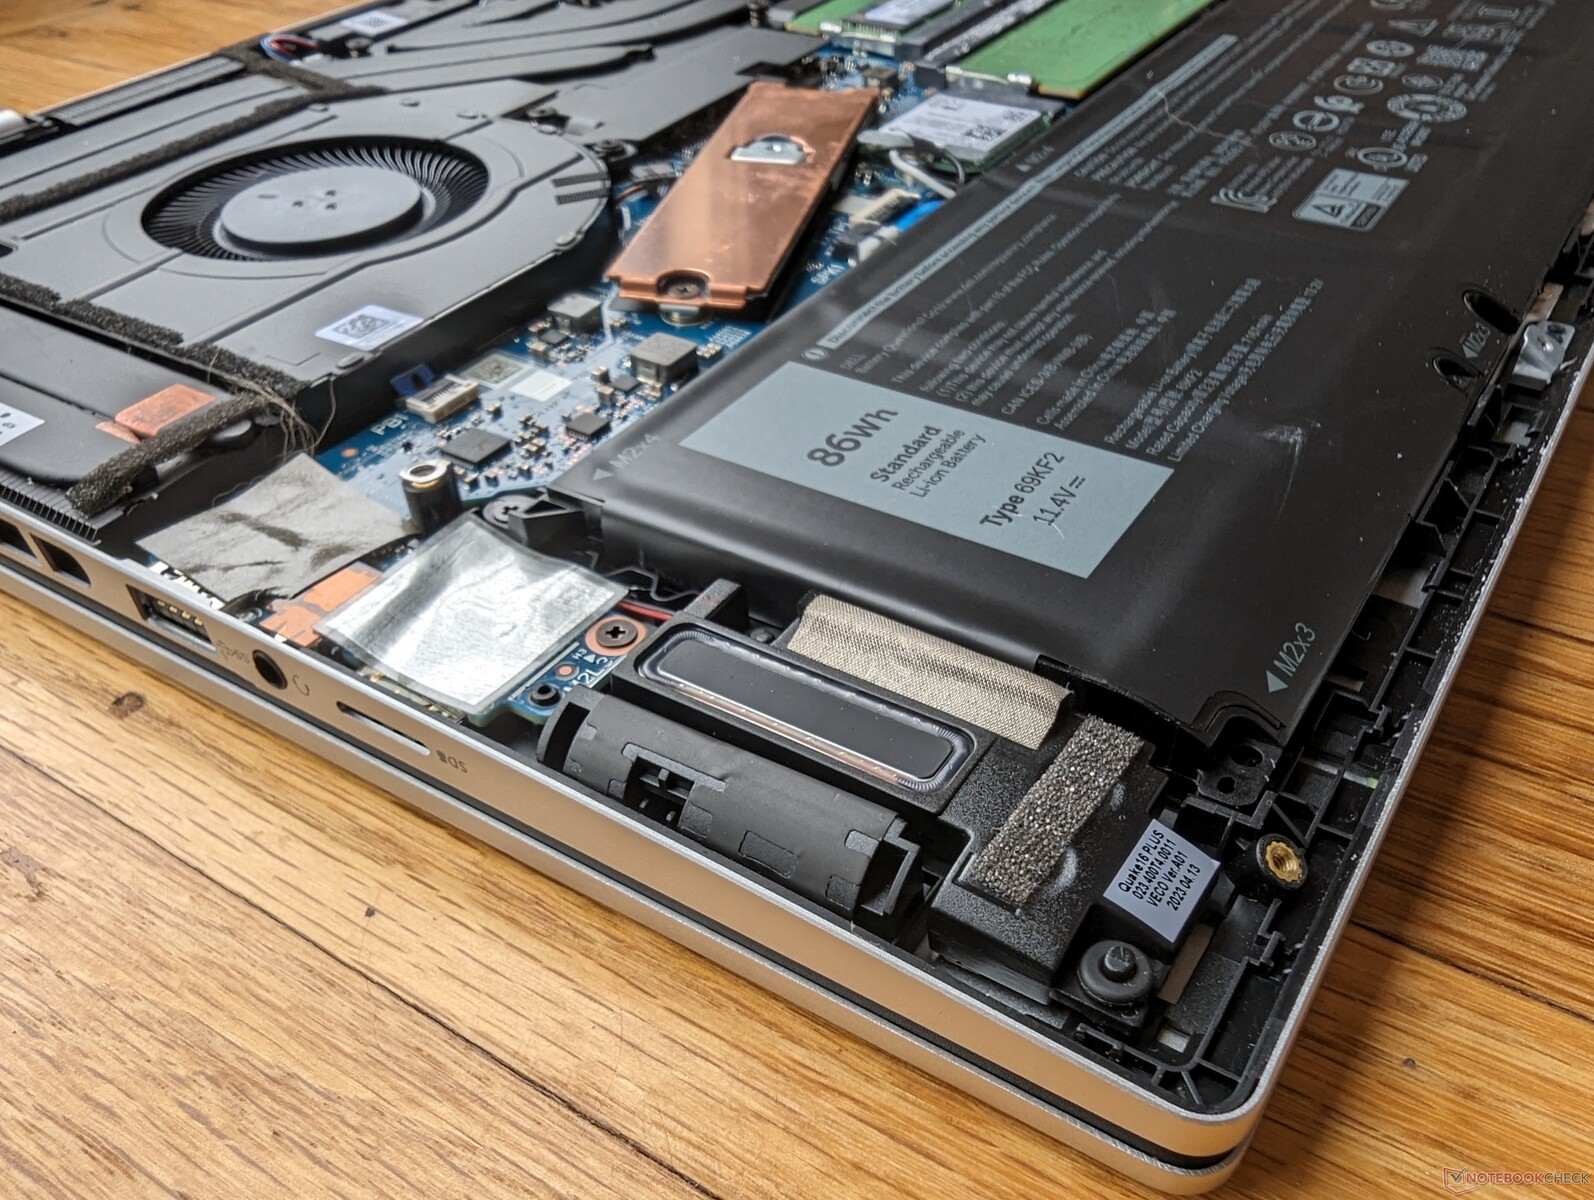
O painel inferior requer apenas uma chave de fenda Phillips e uma borda afiada para uma manutenção relativamente fácil. Os proprietários têm acesso direto aos slots SSD, WLAN e 2 slots SODIMM, enquanto o modelo do ano passado era limitado a apenas 1 slot SODIMM, conforme mostrado nas fotos de comparação abaixo. As ventoinhas também são maiores desta vez e com tubos de calor de cobre mais espessos para melhorar o potencial de resfriamento.
Observe que a versão AMD desse modelo utiliza RAM LPDDR5 soldada, em contraste com a abordagem 2x SODIMM totalmente expansível da nossa versão Intel.
Acessórios e garantia
Não há extras na caixa além do adaptador CA e da documentação. A garantia limitada de um ano do fabricante se aplica se for comprado nos EUA.
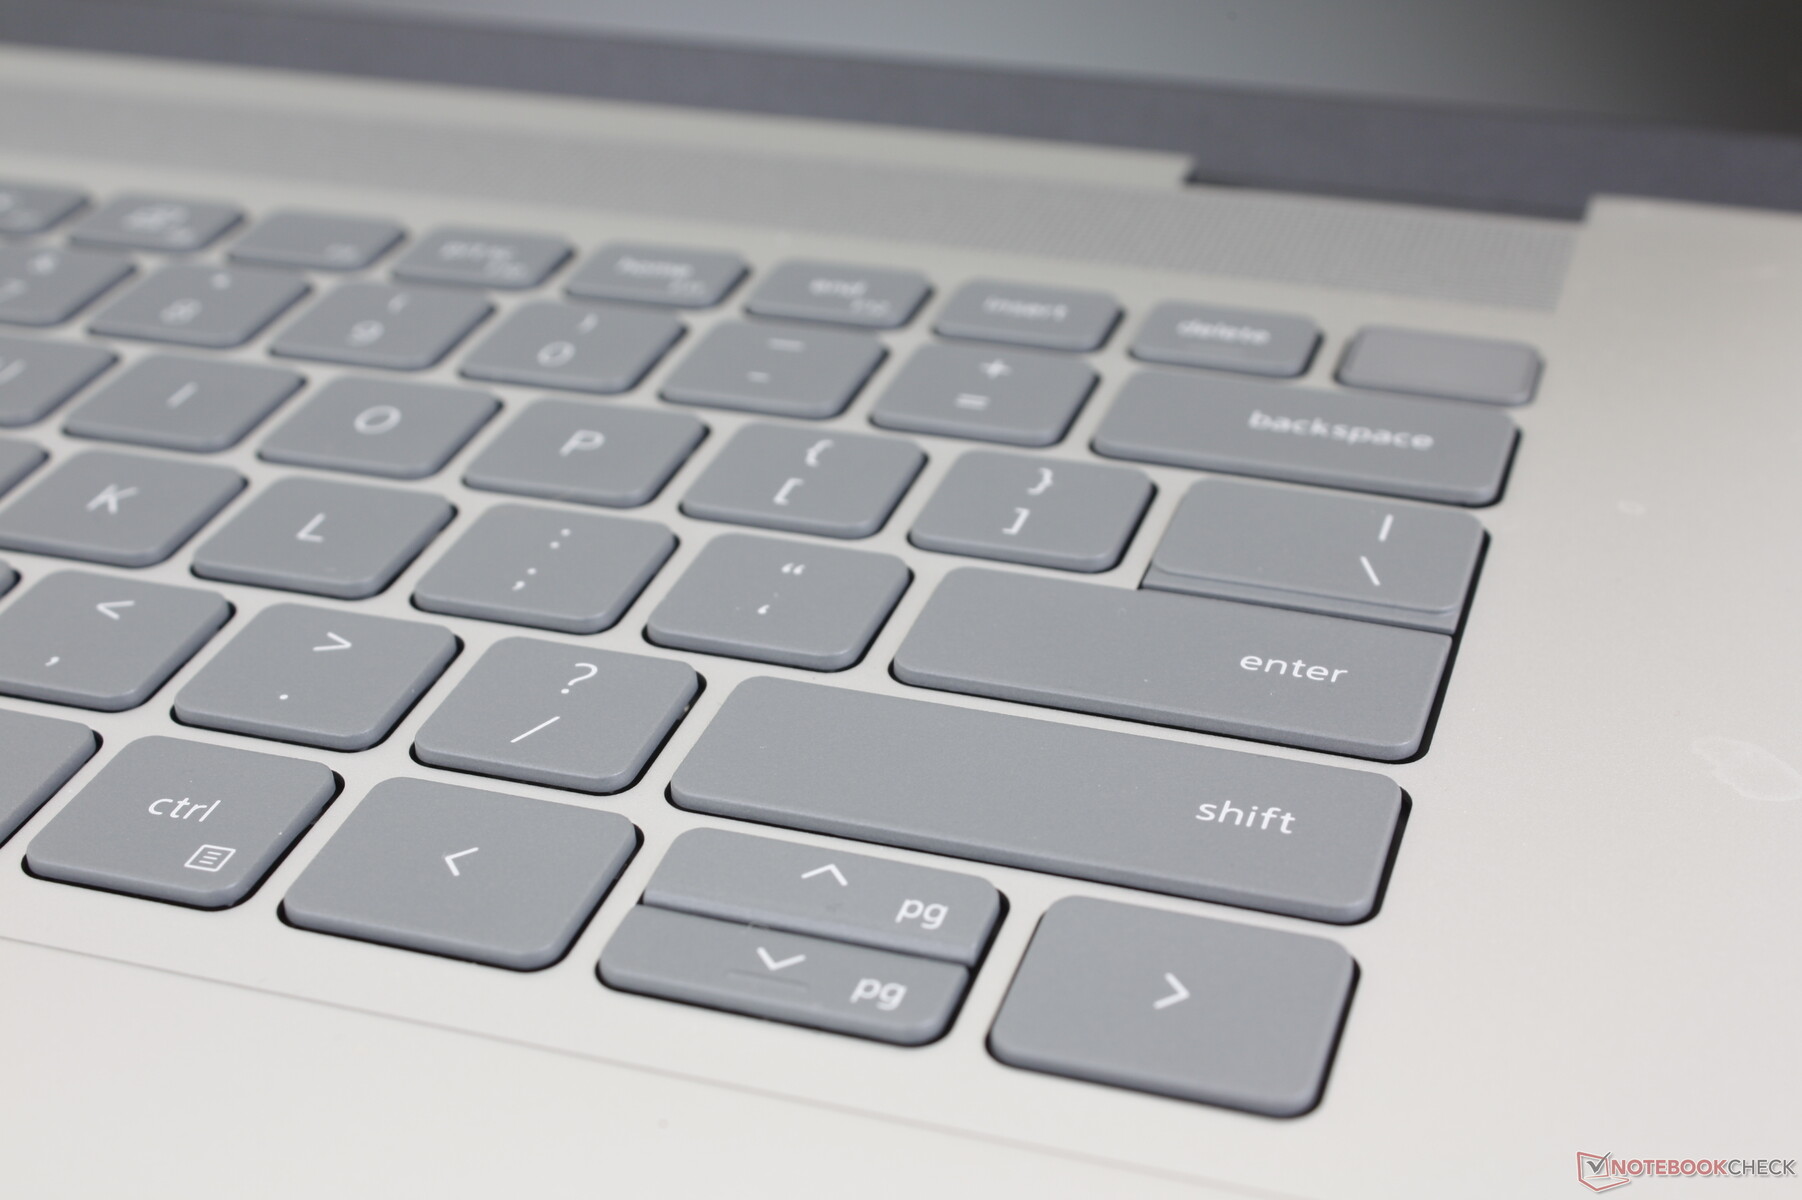
Dispositivos de entrada - Sensação familiar do Inspiron
Teclado
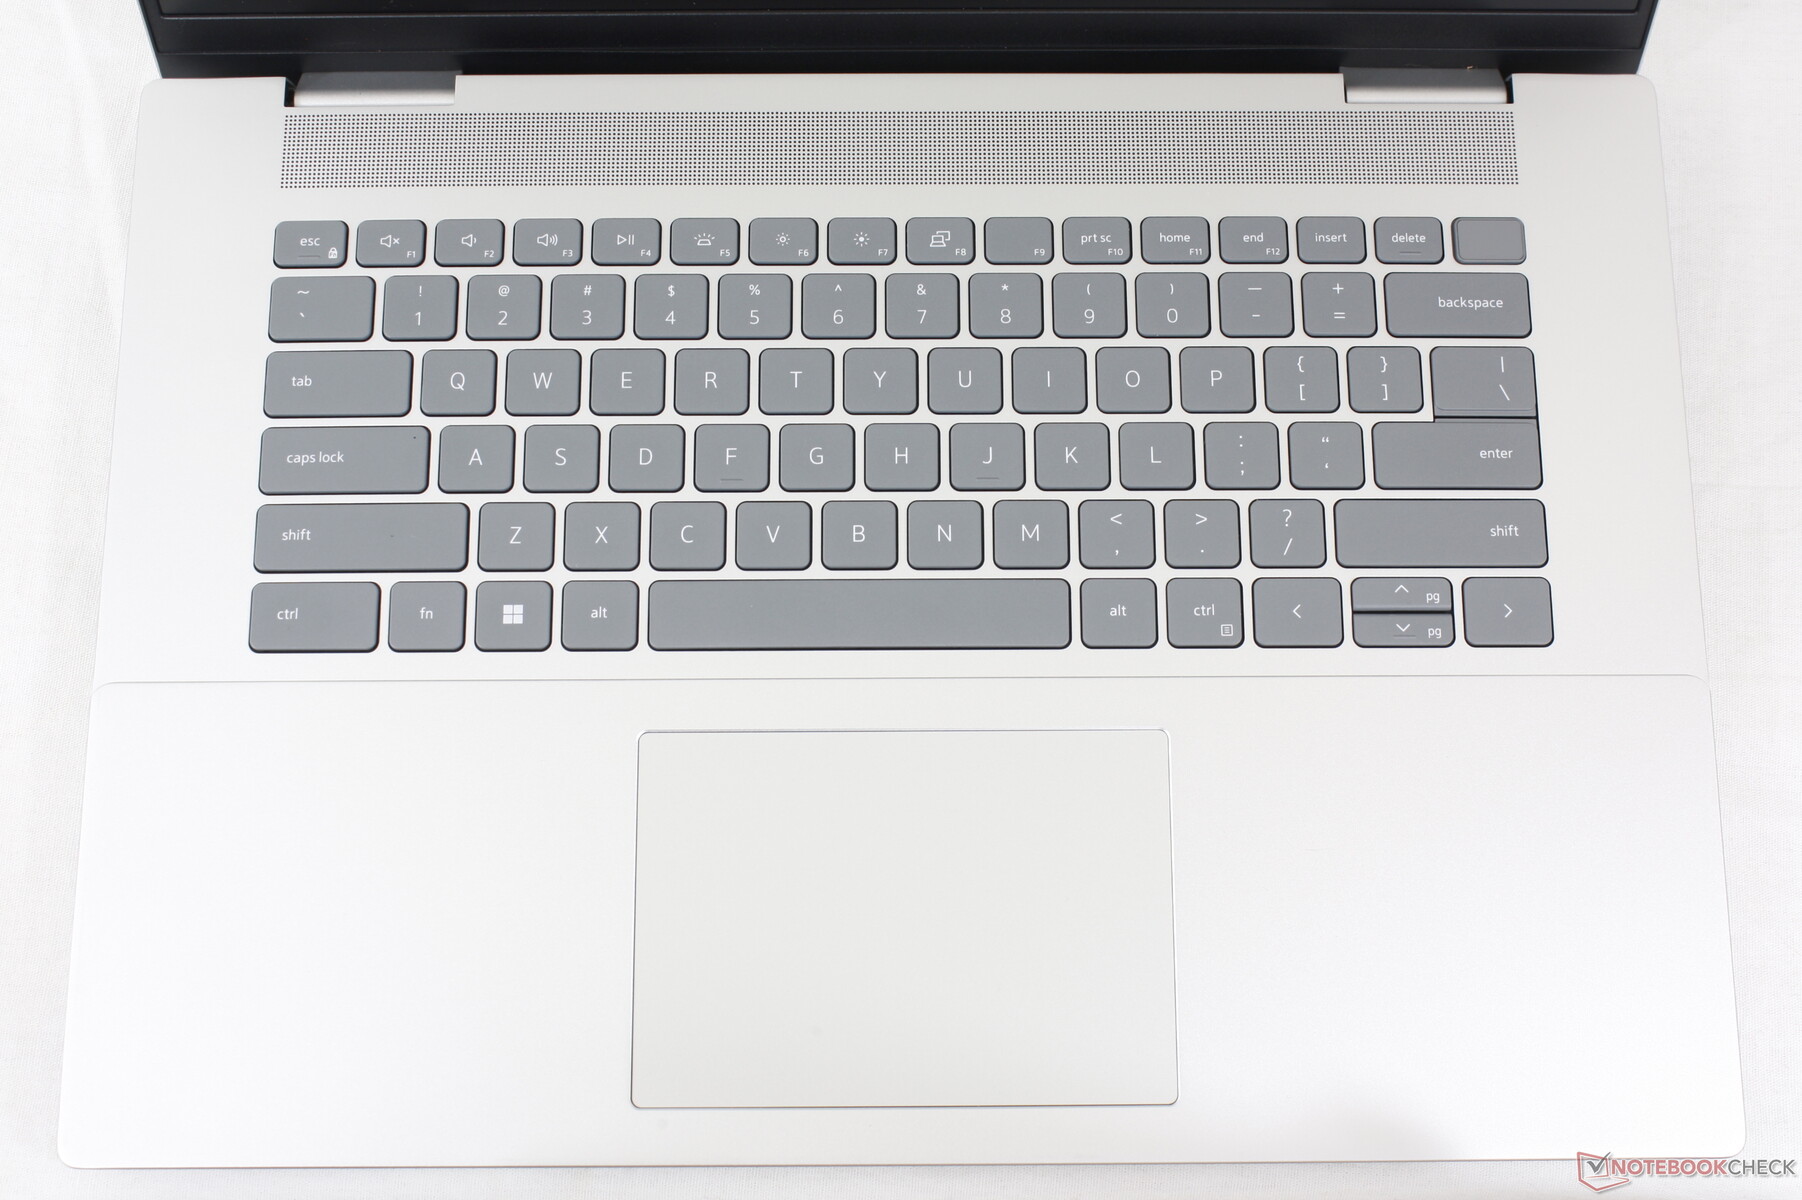
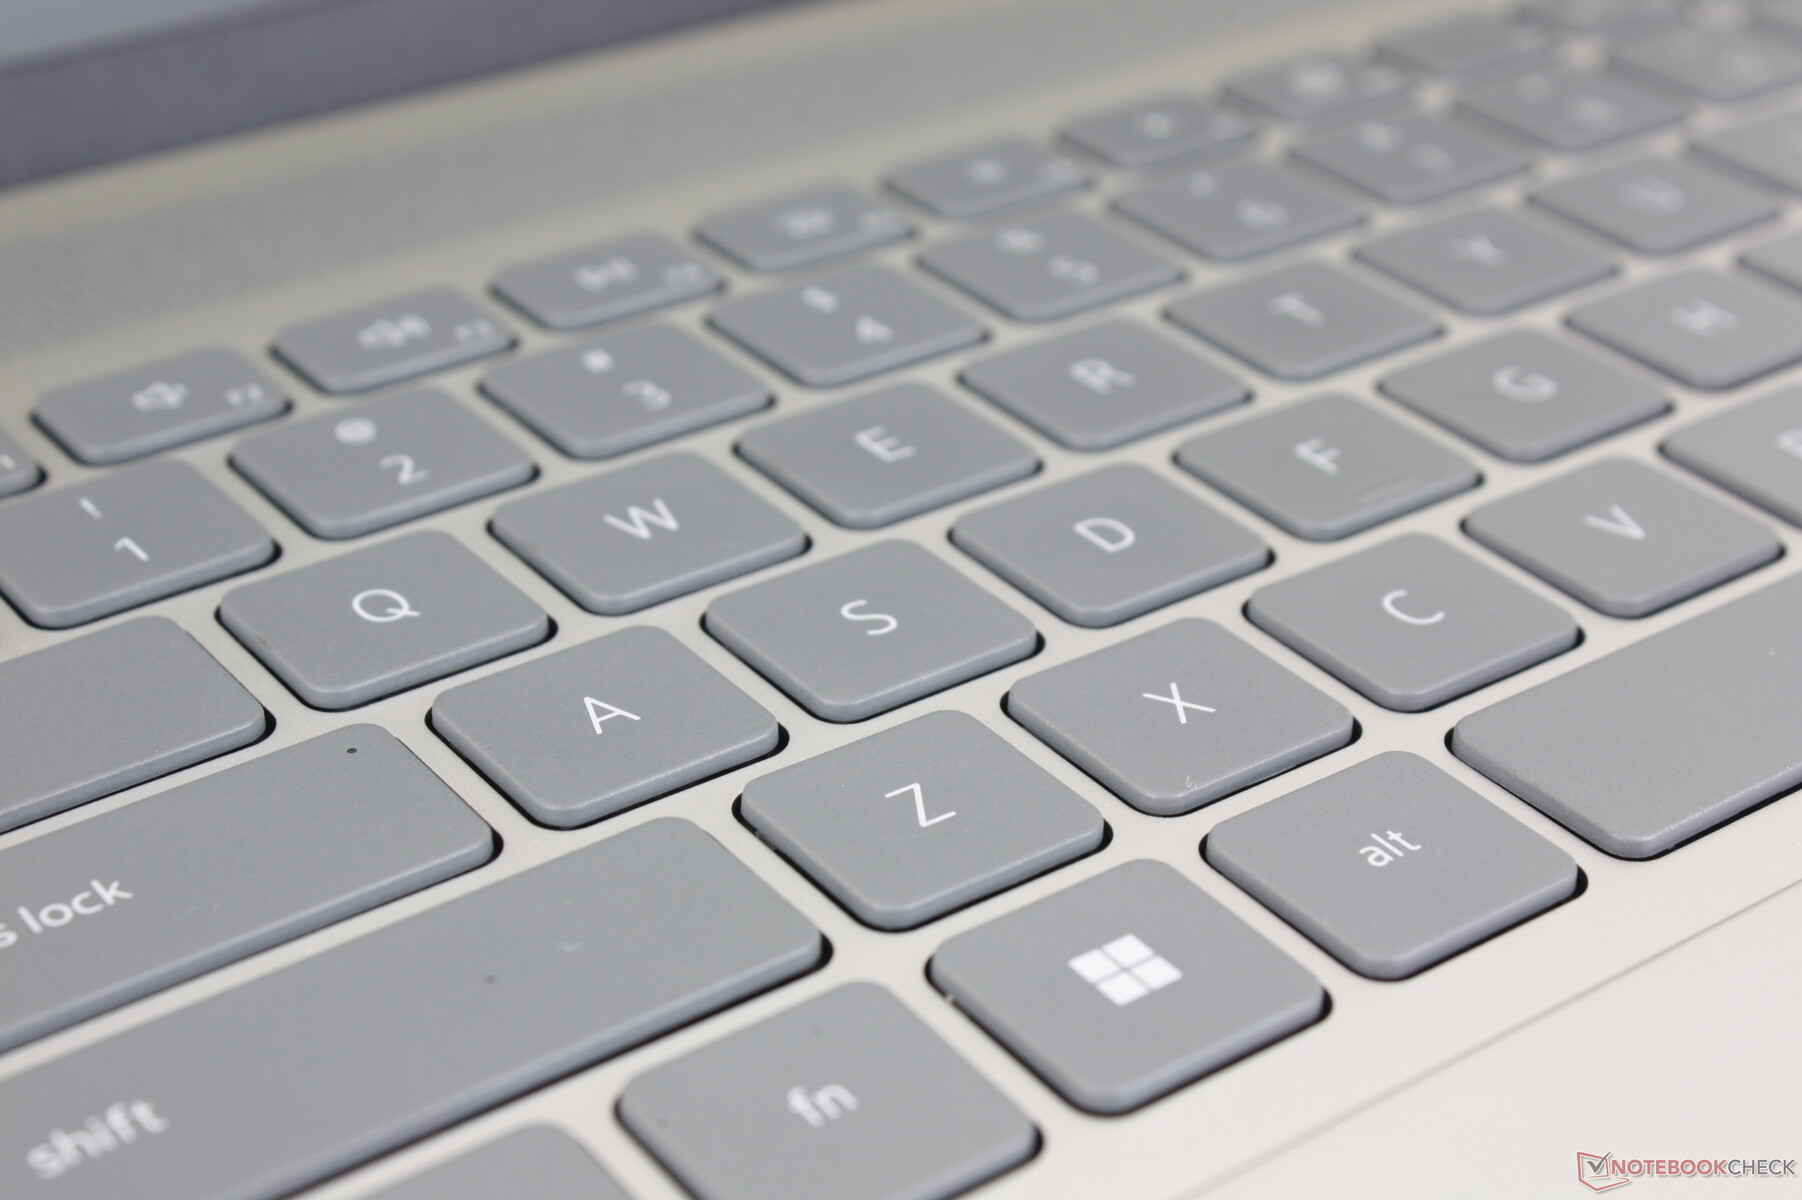
A experiência de digitação permanece idêntica à do Inspiron 16 Plus 7620 até cada tecla de função e ação secundária. Isso não é necessariamente ruim, pois a consistência entre os diferentes modelos Inspiron é apreciada. Entretanto, outros laptops multimídia, como o LG Gram 16 ou o HP Spectre x360 16 têm teclas visivelmente mais firmes e confortáveis.
Touchpad
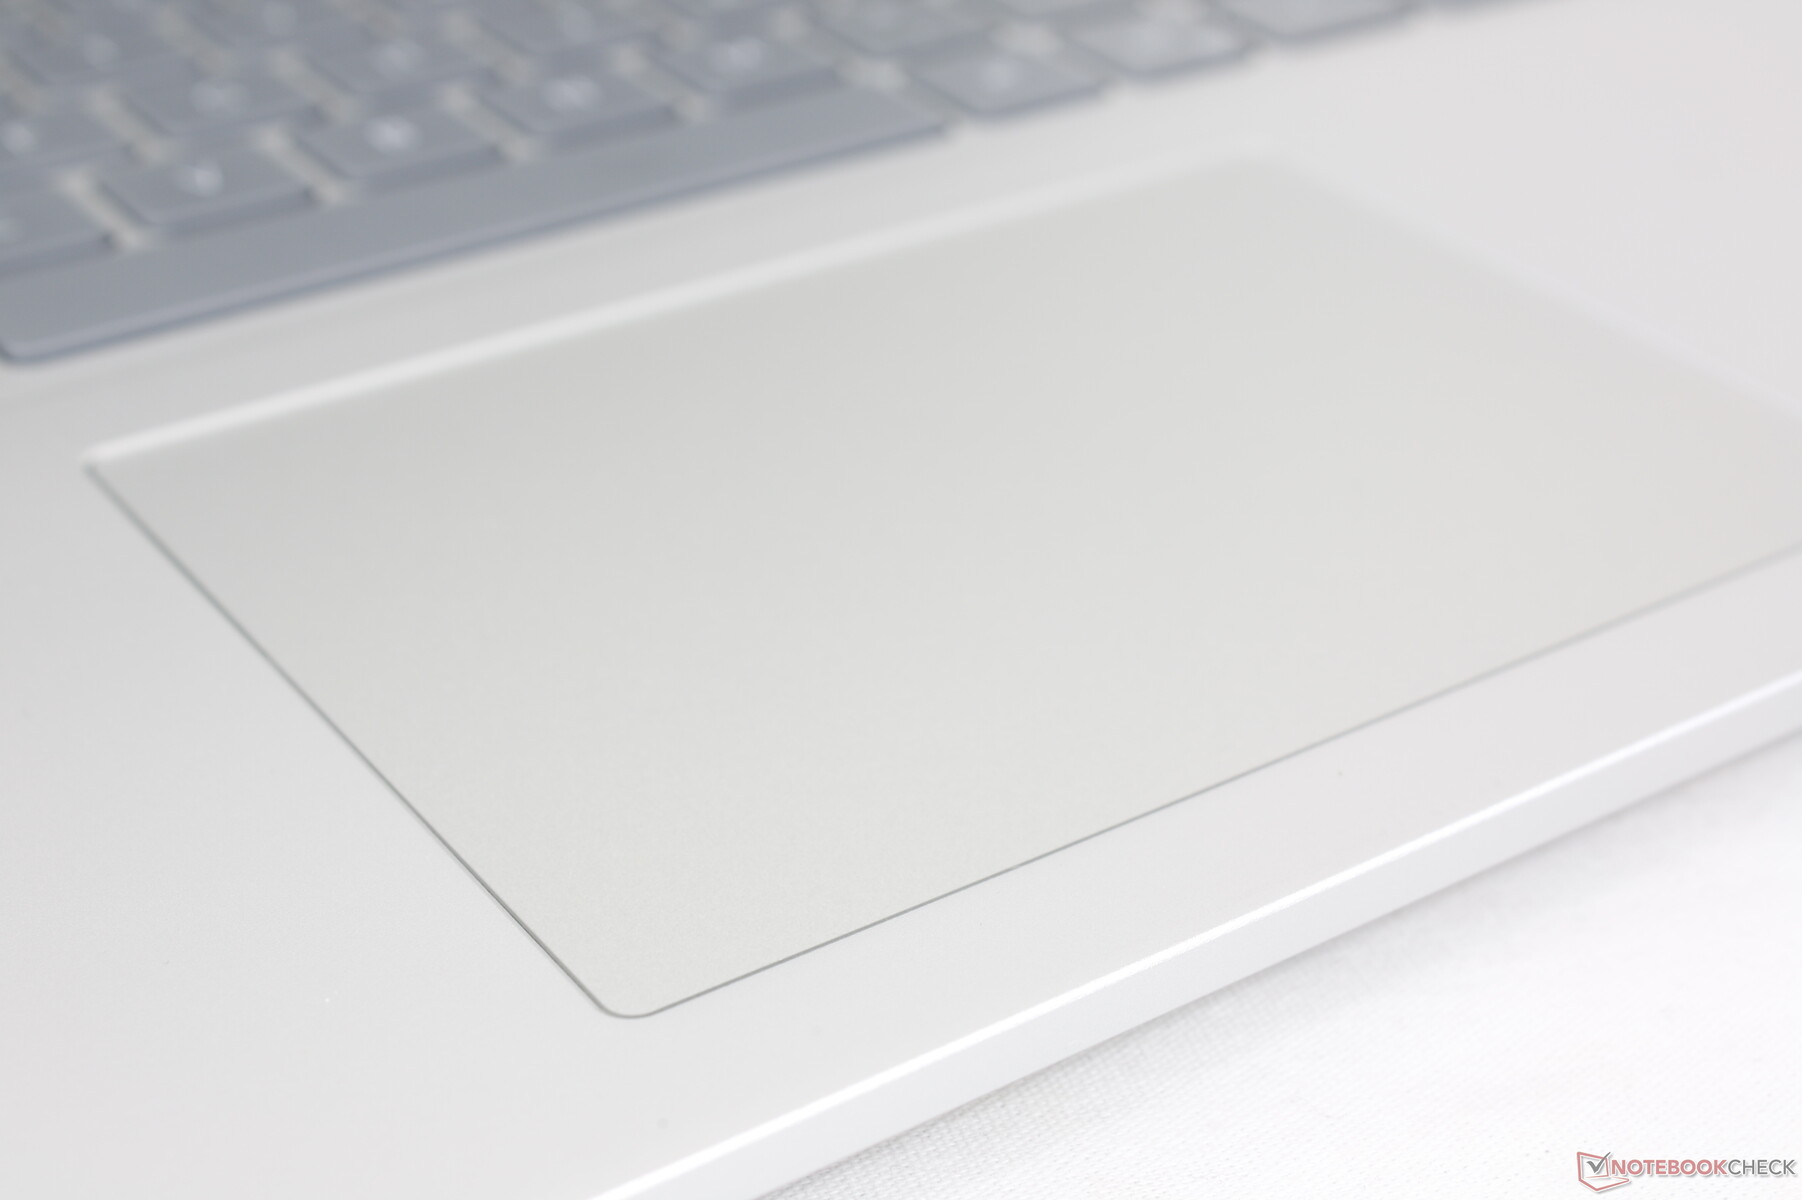
O clickpad tem o mesmo tamanho que o do modelo do ano passado (11,5 x 8 cm). O deslizamento é suave, com um pouco de aderência em velocidades mais lentas para entradas mais precisas. Infelizmente, o feedback ao pressionar o clickpad é um pouco mole, apesar do clique alto.
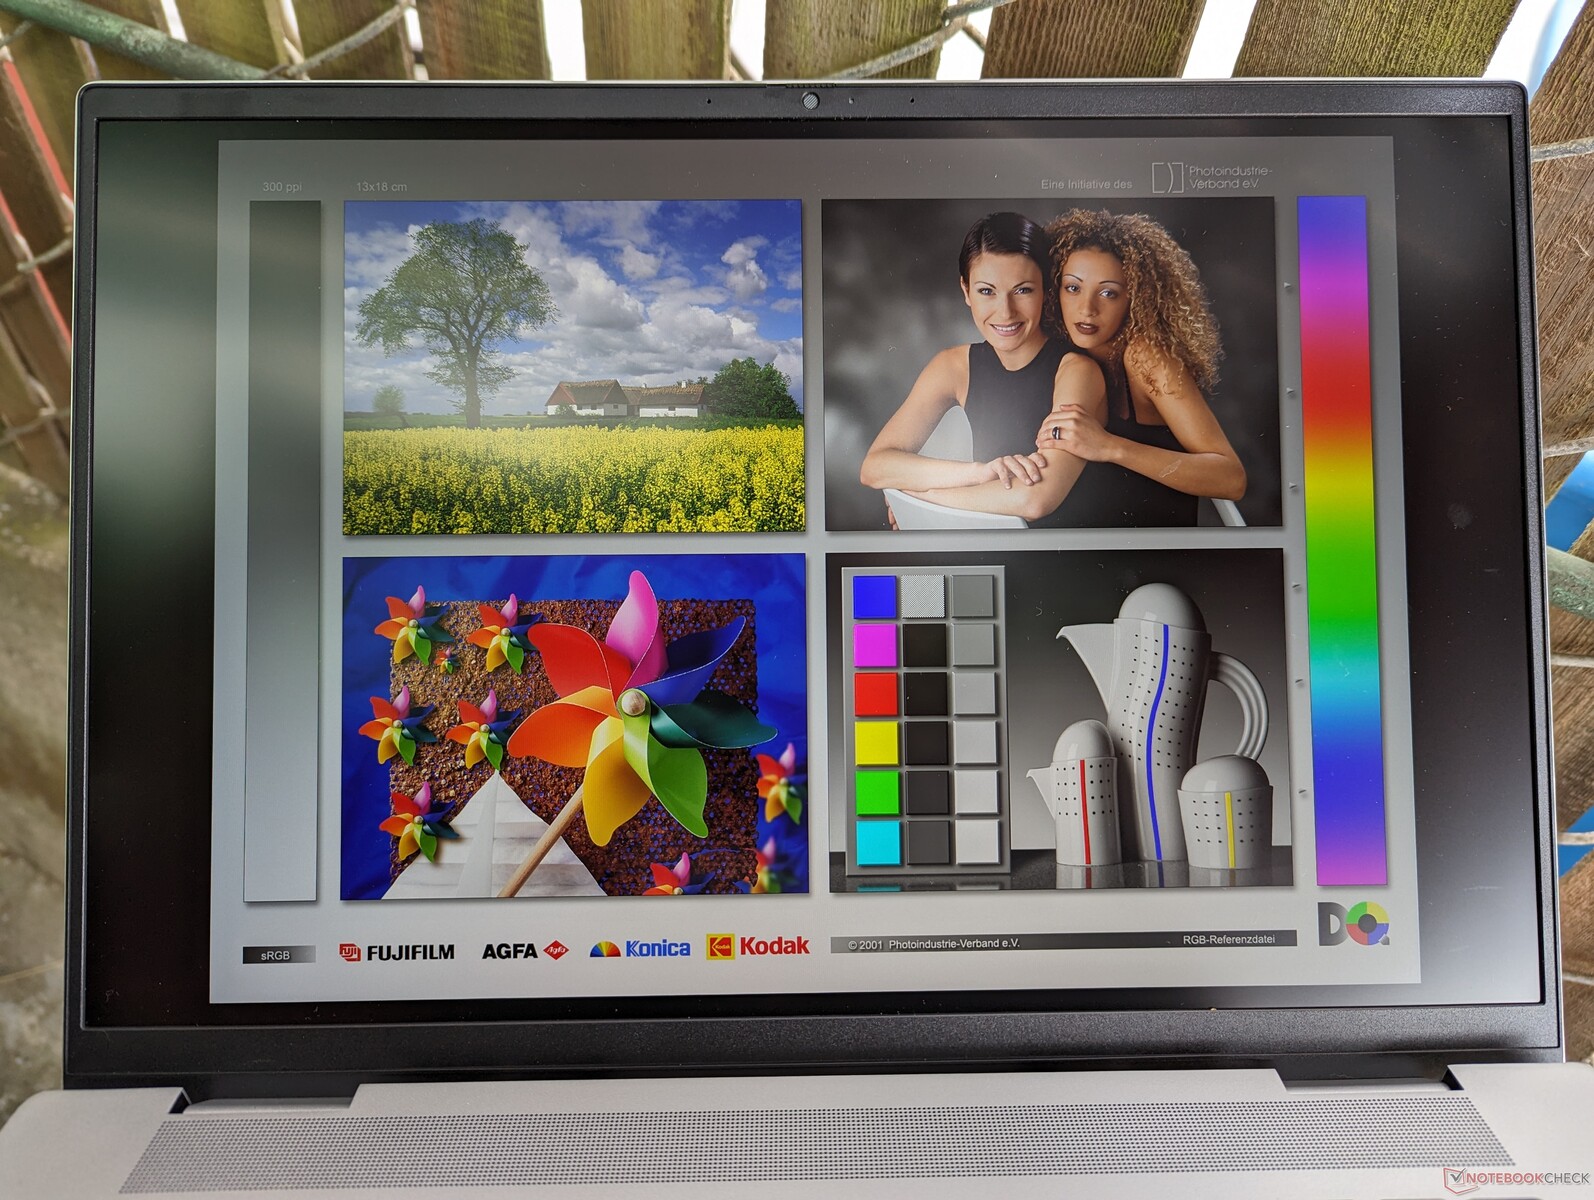
Tela - Decente, mas com opções limitadas
As opções de tela mudaram em relação ao antigo Inspiron 16 Plus 7620. O painel 3K 3072 x 1920 foi substituído por essas duas novas opções:
- 2560 x 1600 (2,5K), 120 Hz
- 1920 x 1200, 60 Hz
Ambas as opções são IPS e não são sensíveis ao toque e não suportam G-Sync. Nossas medições abaixo refletem apenas a opção 1600p em negrito.
Quando comparado ao painel BOE 3K do ano passado, o novo painel LG Philips 2.5K tem o dobro da taxa de atualização nativa ao custo de uma resolução nativa mais baixa. A cobertura sRGB total, o brilho de 300 nits, a taxa de contraste >1000:1 e os tempos médios de resposta são bastante semelhantes entre eles. No entanto, os modelos concorrentes, como o Vivobook Pro 16X ou o Envy 16 oferecem opções de resolução mais alta com cores ainda mais profundas que os criadores de conteúdo podem apreciar. Como resultado, nosso painel LG Philips é mais econômico.
| |||||||||||||||||||||||||
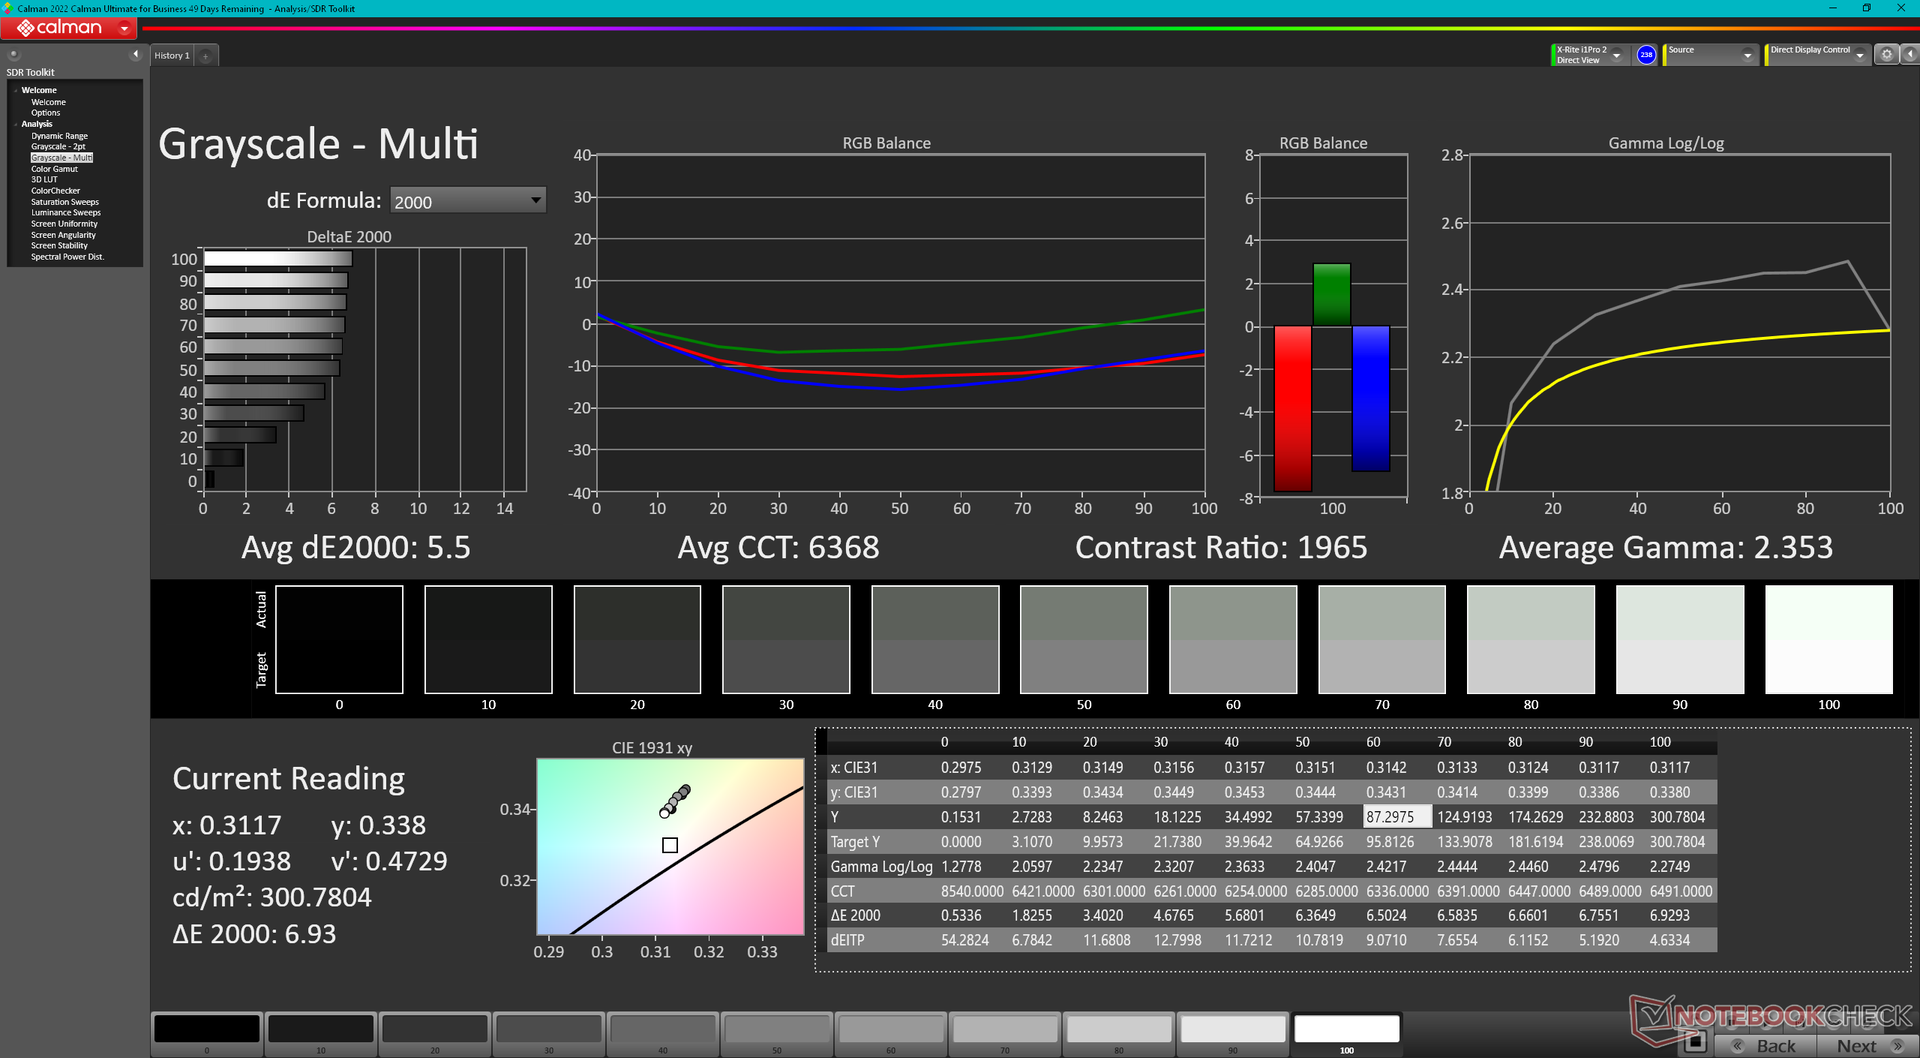
iluminação: 92 %
iluminação com acumulador: 299.4 cd/m²
Contraste: 1426:1 (Preto: 0.21 cd/m²)
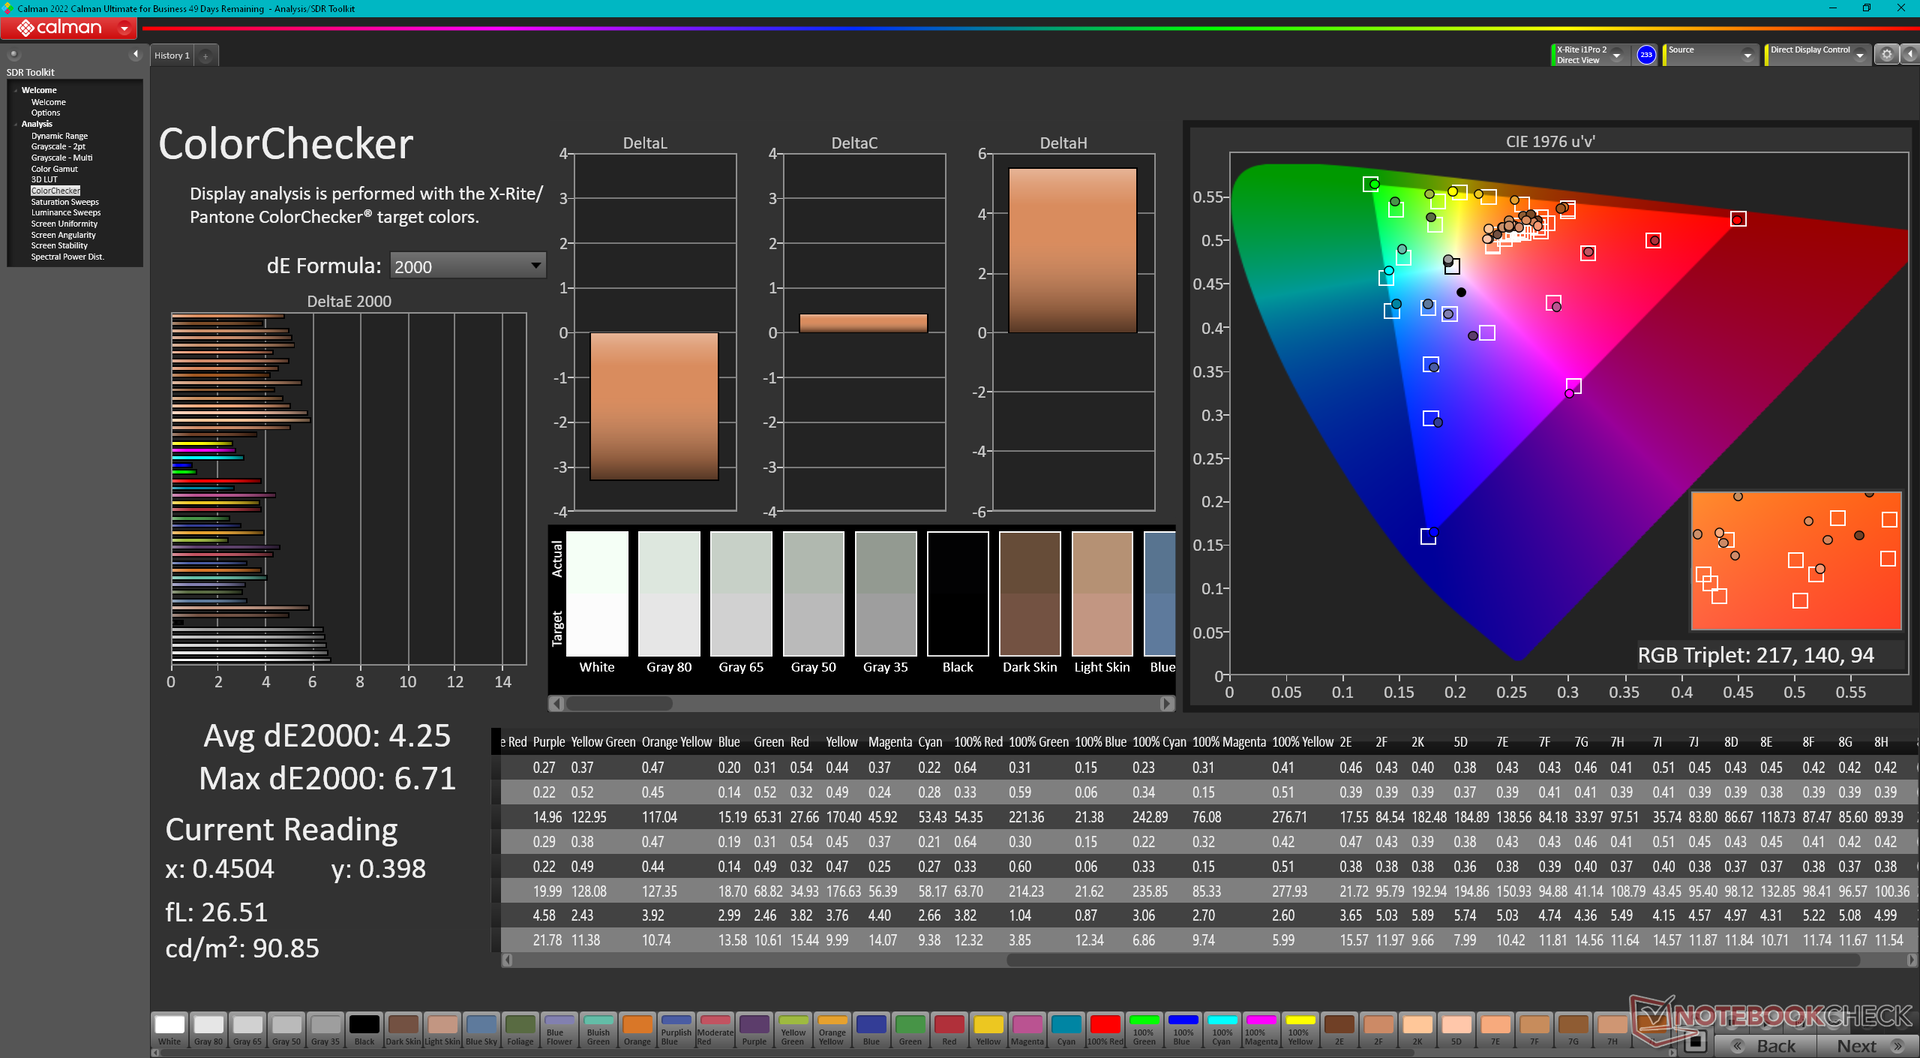
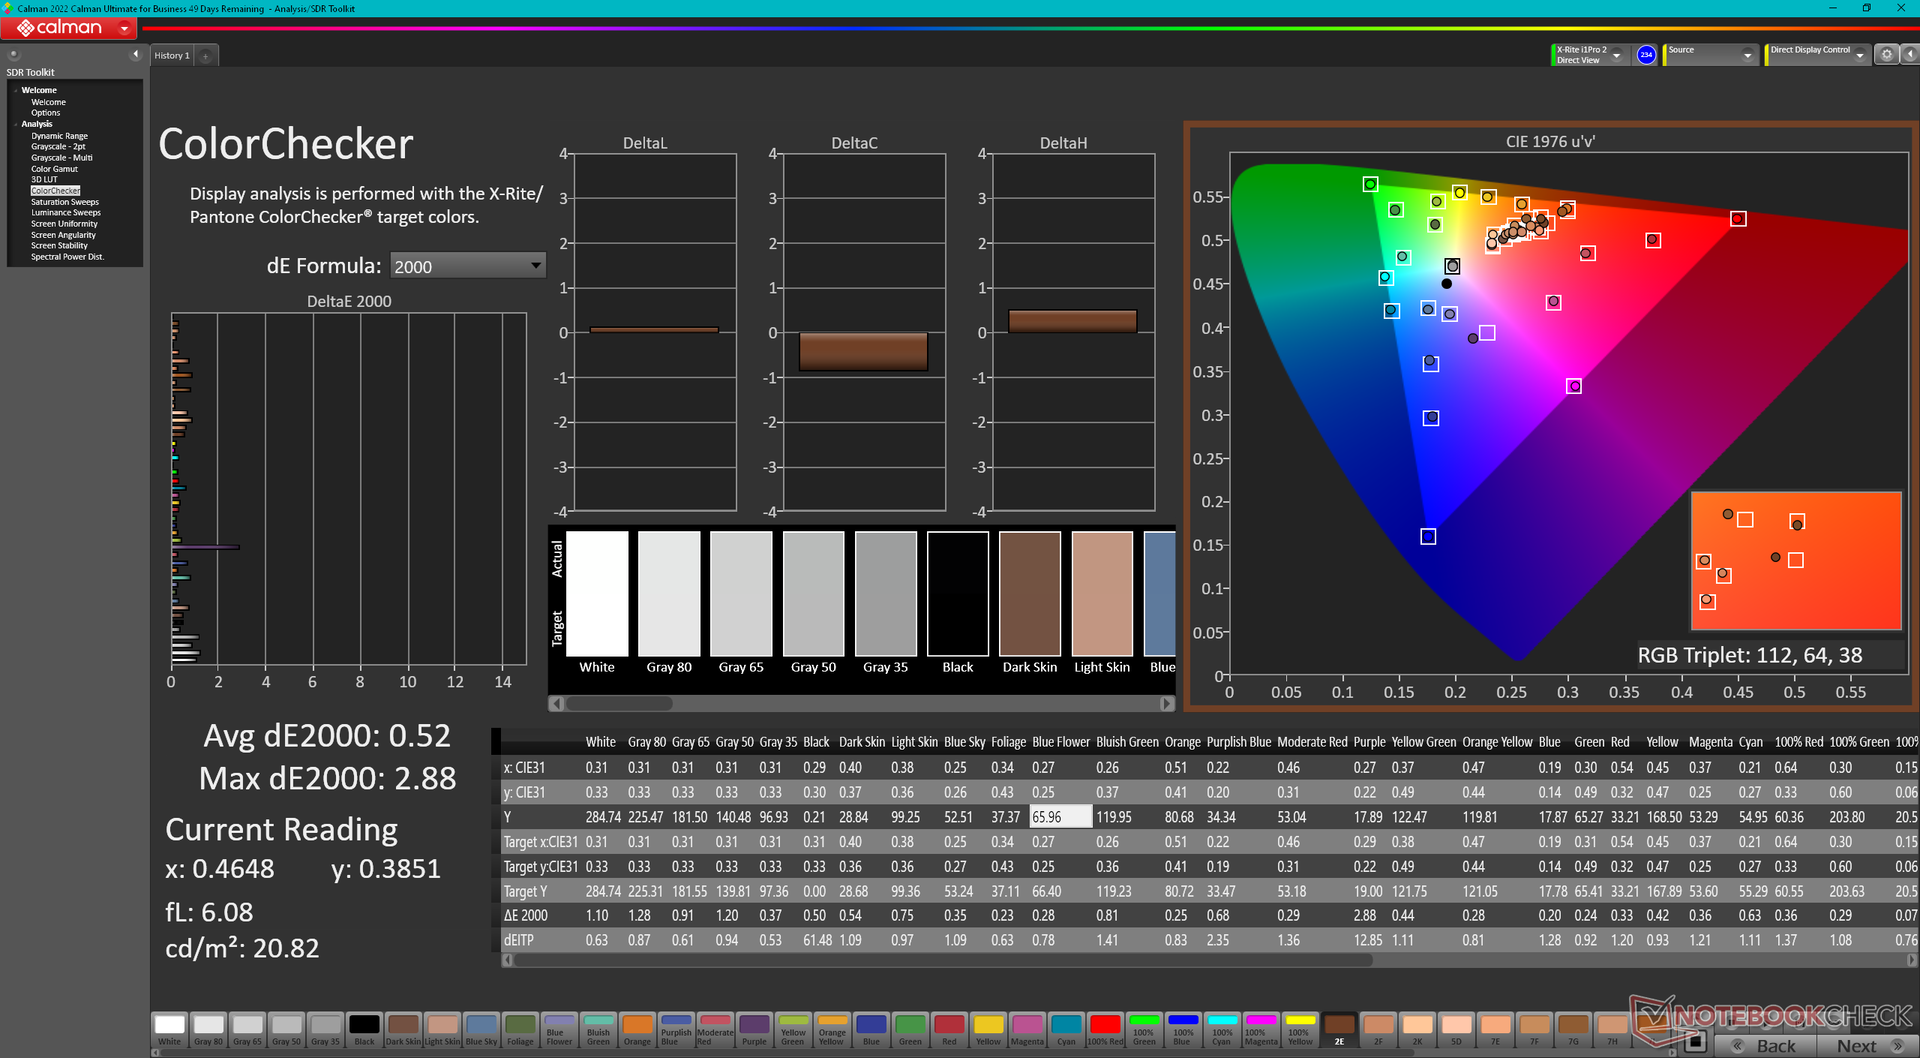
ΔE ColorChecker Calman: 4.25 | ∀{0.5-29.43 Ø4.71}
calibrated: 0.52
ΔE Greyscale Calman: 5.5 | ∀{0.09-98 Ø4.96}
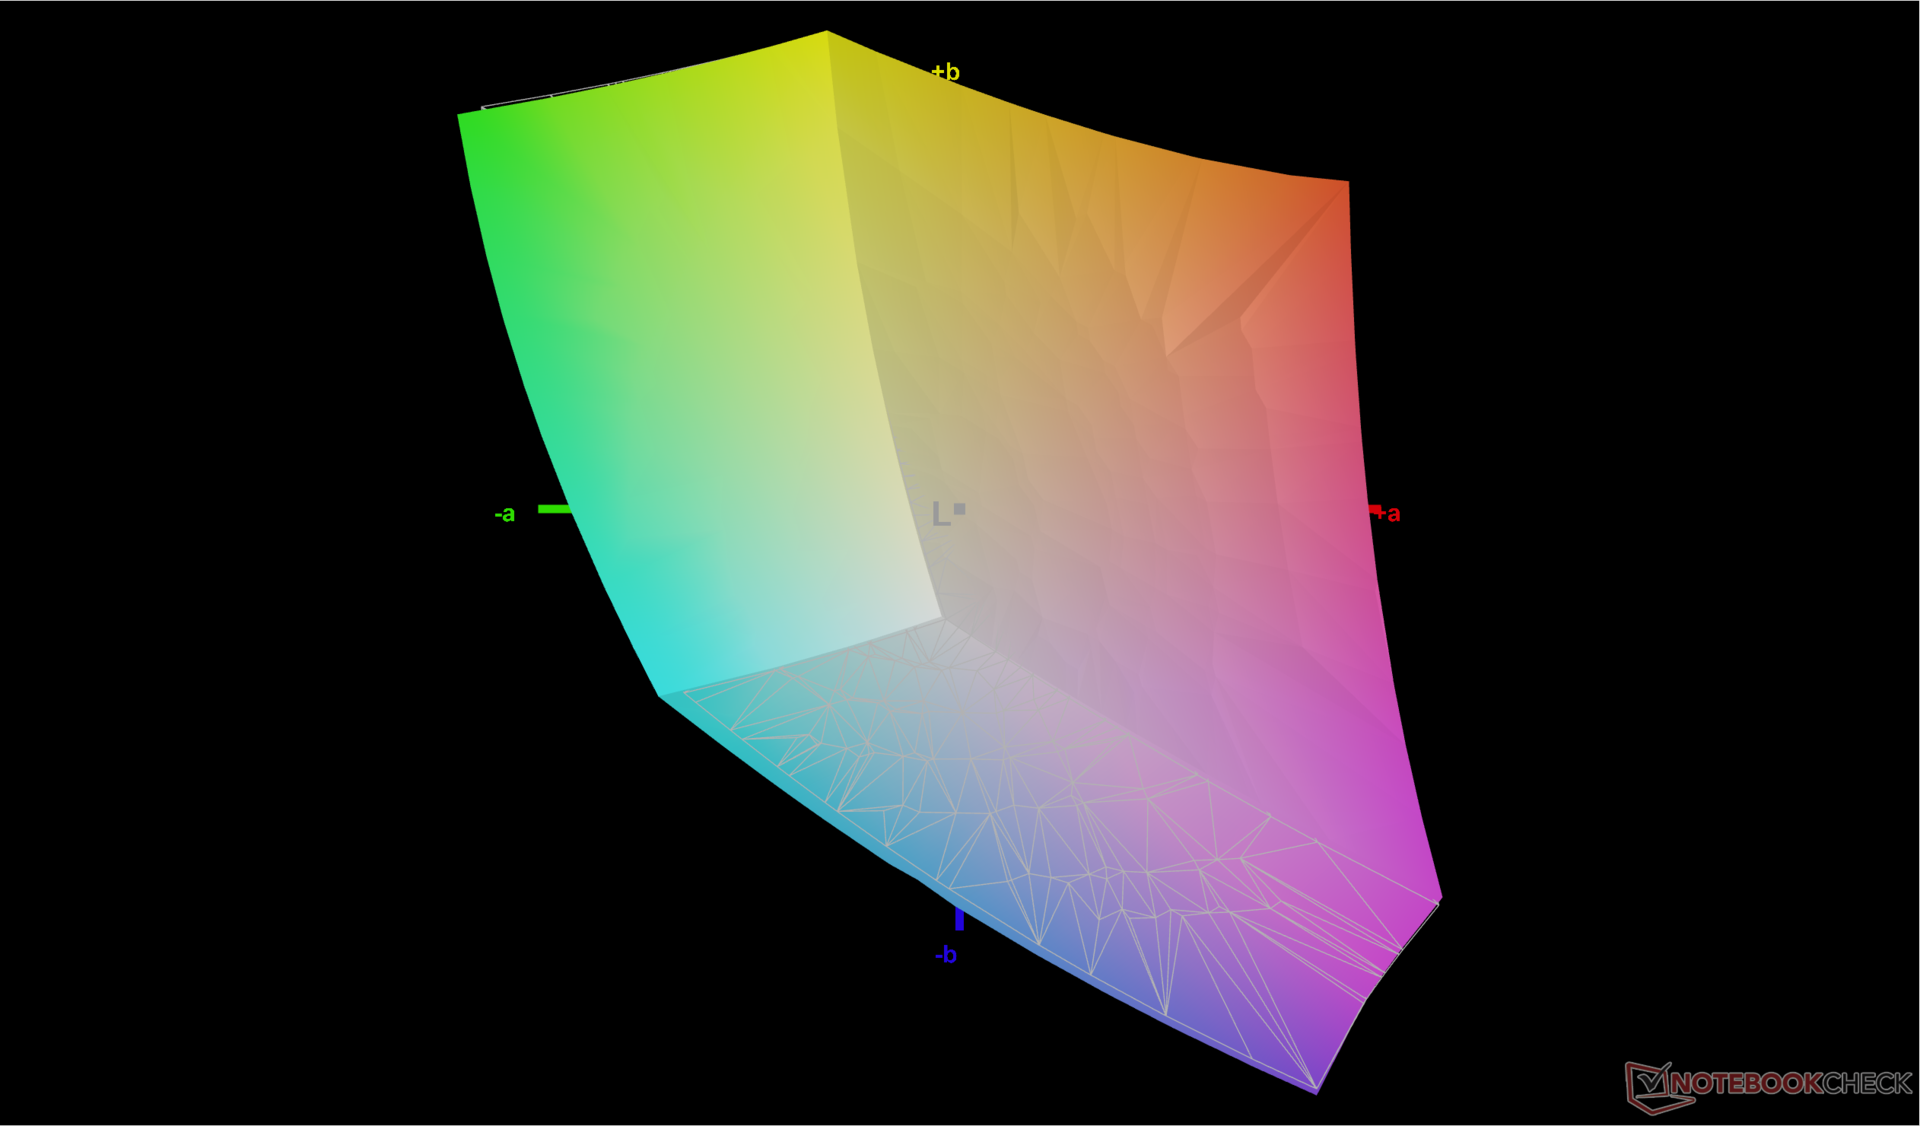
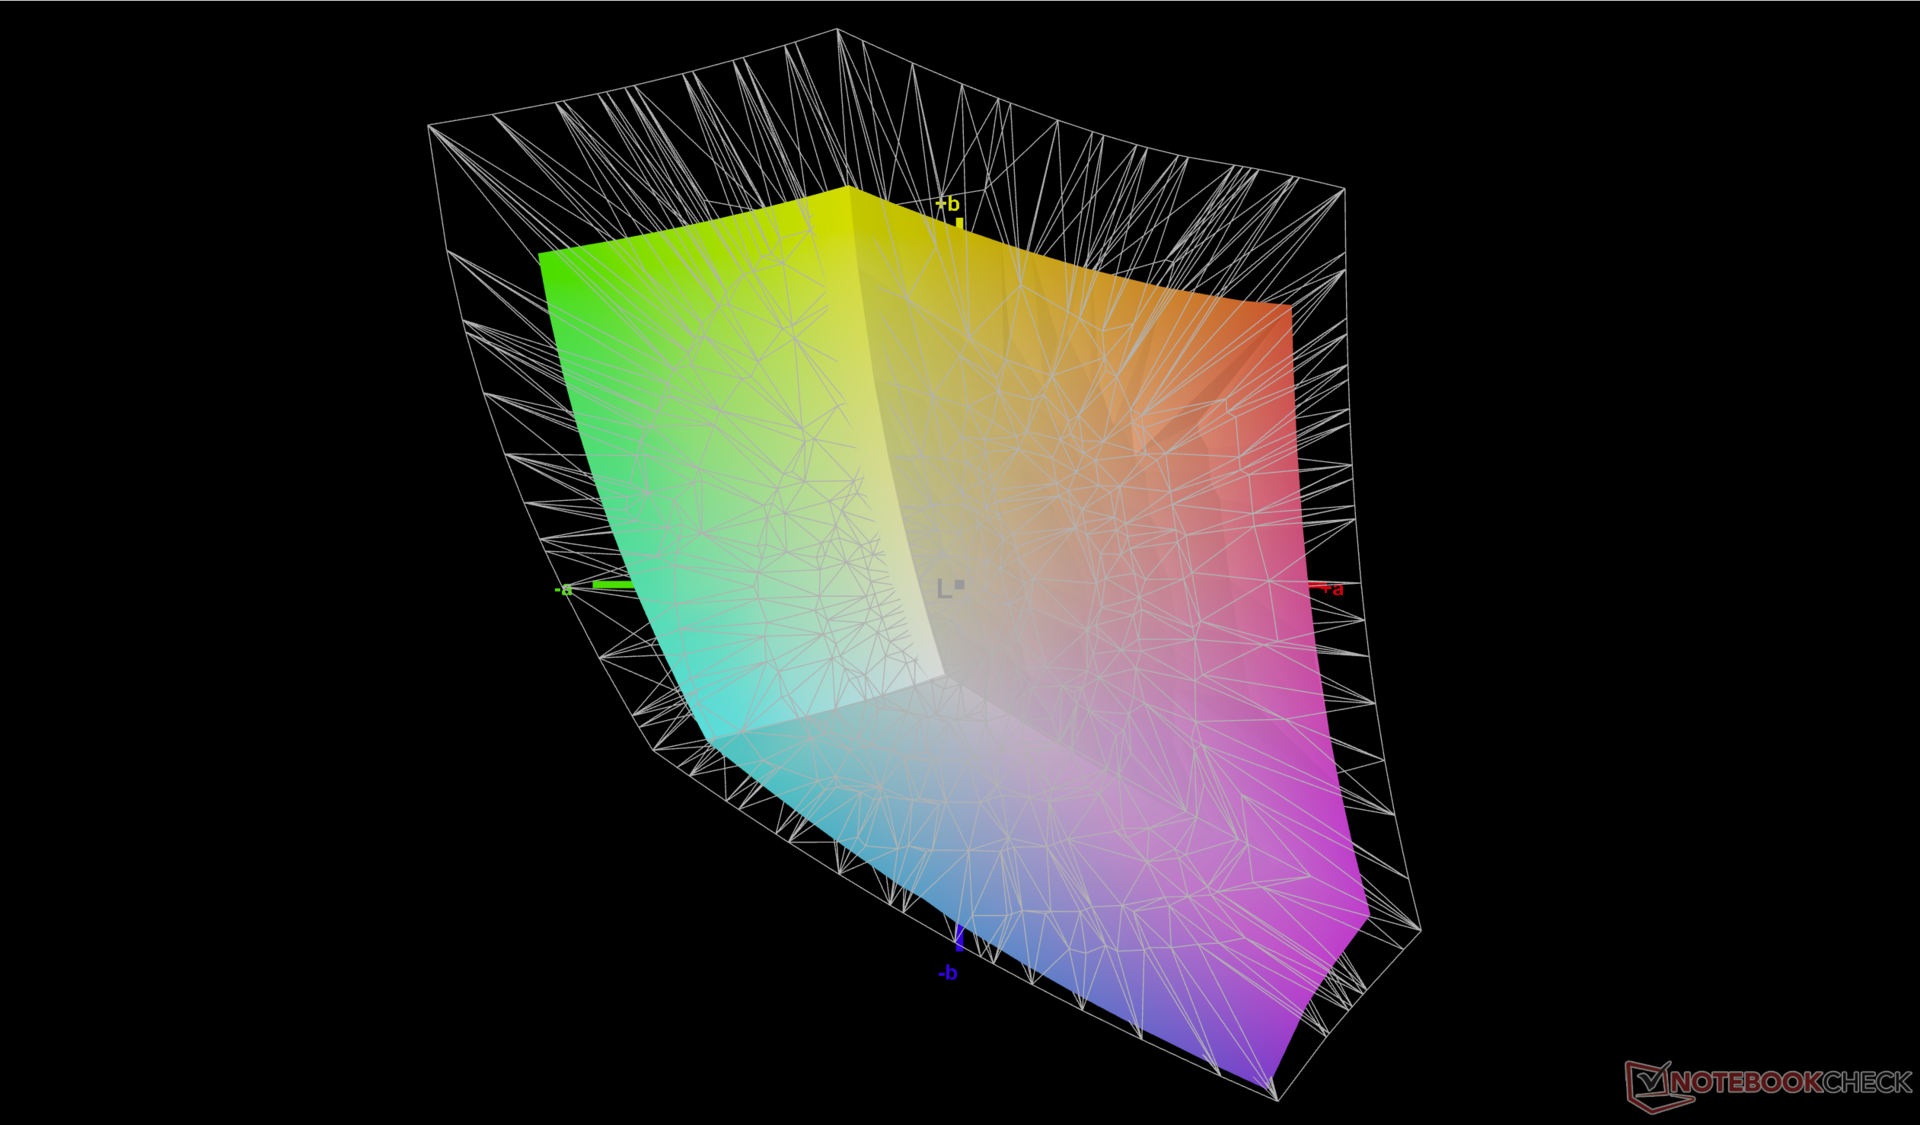
72.3% AdobeRGB 1998 (Argyll 3D)
99.6% sRGB (Argyll 3D)
70.1% Display P3 (Argyll 3D)
Gamma: 2.35
CCT: 6368 K
| Dell Inspiron 16 Plus 7630 LG Philips 160WQ2, IPS, 2560x1600, 16" | Dell Inspiron 16 Plus 7620 BOE NE16N41, IPS, 3072x1920, 16" | Lenovo Slim Pro 9i 16IRP8 LEN160-3.2K, Mini-LED, 3200x2000, 16" | Asus Vivobook Pro 16X K6604JV-MX016W Samsung SDC4178 ATNA60BX01-1, OLED, 3200x2000, 16" | HP Envy 16 h0112nr Samsung SDC4174, OLED, 3840x2400, 16" | MSI Summit E16 Flip A12UDT-031 AU Optronics B16QAN02.N, IPS, 2560x1600, 16" | |
|---|---|---|---|---|---|---|
| Display | 1% | 18% | 24% | 21% | 20% | |
| Display P3 Coverage (%) | 70.1 | 70.8 1% | 95.1 36% | 98.4 40% | 99.3 42% | 98.9 41% |
| sRGB Coverage (%) | 99.6 | 99.5 0% | 99.9 0% | 99.7 0% | 100 0% | 100 0% |
| AdobeRGB 1998 Coverage (%) | 72.3 | 73.2 1% | 84.6 17% | 95.8 33% | 88 22% | 86.5 20% |
| Response Times | -13% | 61% | 95% | 93% | 63% | |
| Response Time Grey 50% / Grey 80% * (ms) | 35 ? | 38 ? -9% | 14 ? 60% | 1.6 ? 95% | 2 ? 94% | 13 ? 63% |
| Response Time Black / White * (ms) | 24.2 ? | 28 ? -16% | 9.2 ? 62% | 1.4 ? 94% | 1.9 ? 92% | 9 ? 63% |
| PWM Frequency (Hz) | 5784 ? | 120 ? | 240.4 ? | |||
| Screen | 14% | -55% | 35% | 30% | -5% | |
| Brightness middle (cd/m²) | 299.4 | 288.9 -4% | 627.4 110% | 347 16% | 328.8 10% | 314 5% |
| Brightness (cd/m²) | 290 | 276 -5% | 618 113% | 346 19% | 332 14% | 294 1% |
| Brightness Distribution (%) | 92 | 92 0% | 95 3% | 97 5% | 97 5% | 89 -3% |
| Black Level * (cd/m²) | 0.21 | 0.26 -24% | 0.19 10% | 0.06 71% | 0.28 -33% | |
| Contrast (:1) | 1426 | 1111 -22% | 3302 132% | 5783 306% | 1121 -21% | |
| Colorchecker dE 2000 * | 4.25 | 1.88 56% | 5.84 -37% | 1.89 56% | 1.53 64% | 3.08 28% |
| Colorchecker dE 2000 max. * | 6.71 | 4.37 35% | 10.22 -52% | 3.26 51% | 6.04 10% | 5.49 18% |
| Colorchecker dE 2000 calibrated * | 0.52 | 0.42 19% | 4.45 -756% | 1.97 -279% | 0.88 -69% | |
| Greyscale dE 2000 * | 5.5 | 1.4 75% | 6.7 -22% | 1.55 72% | 1.3 76% | 3.99 27% |
| Gamma | 2.35 94% | 2.3 96% | 2.77 79% | 2.39 92% | 2.18 101% | 2.3 96% |
| CCT | 6368 102% | 6634 98% | 5795 112% | 6458 101% | 6362 102% | 6219 105% |
| Média Total (Programa/Configurações) | 1% /
8% | 8% /
-23% | 51% /
41% | 48% /
39% | 26% /
10% |
* ... menor é melhor
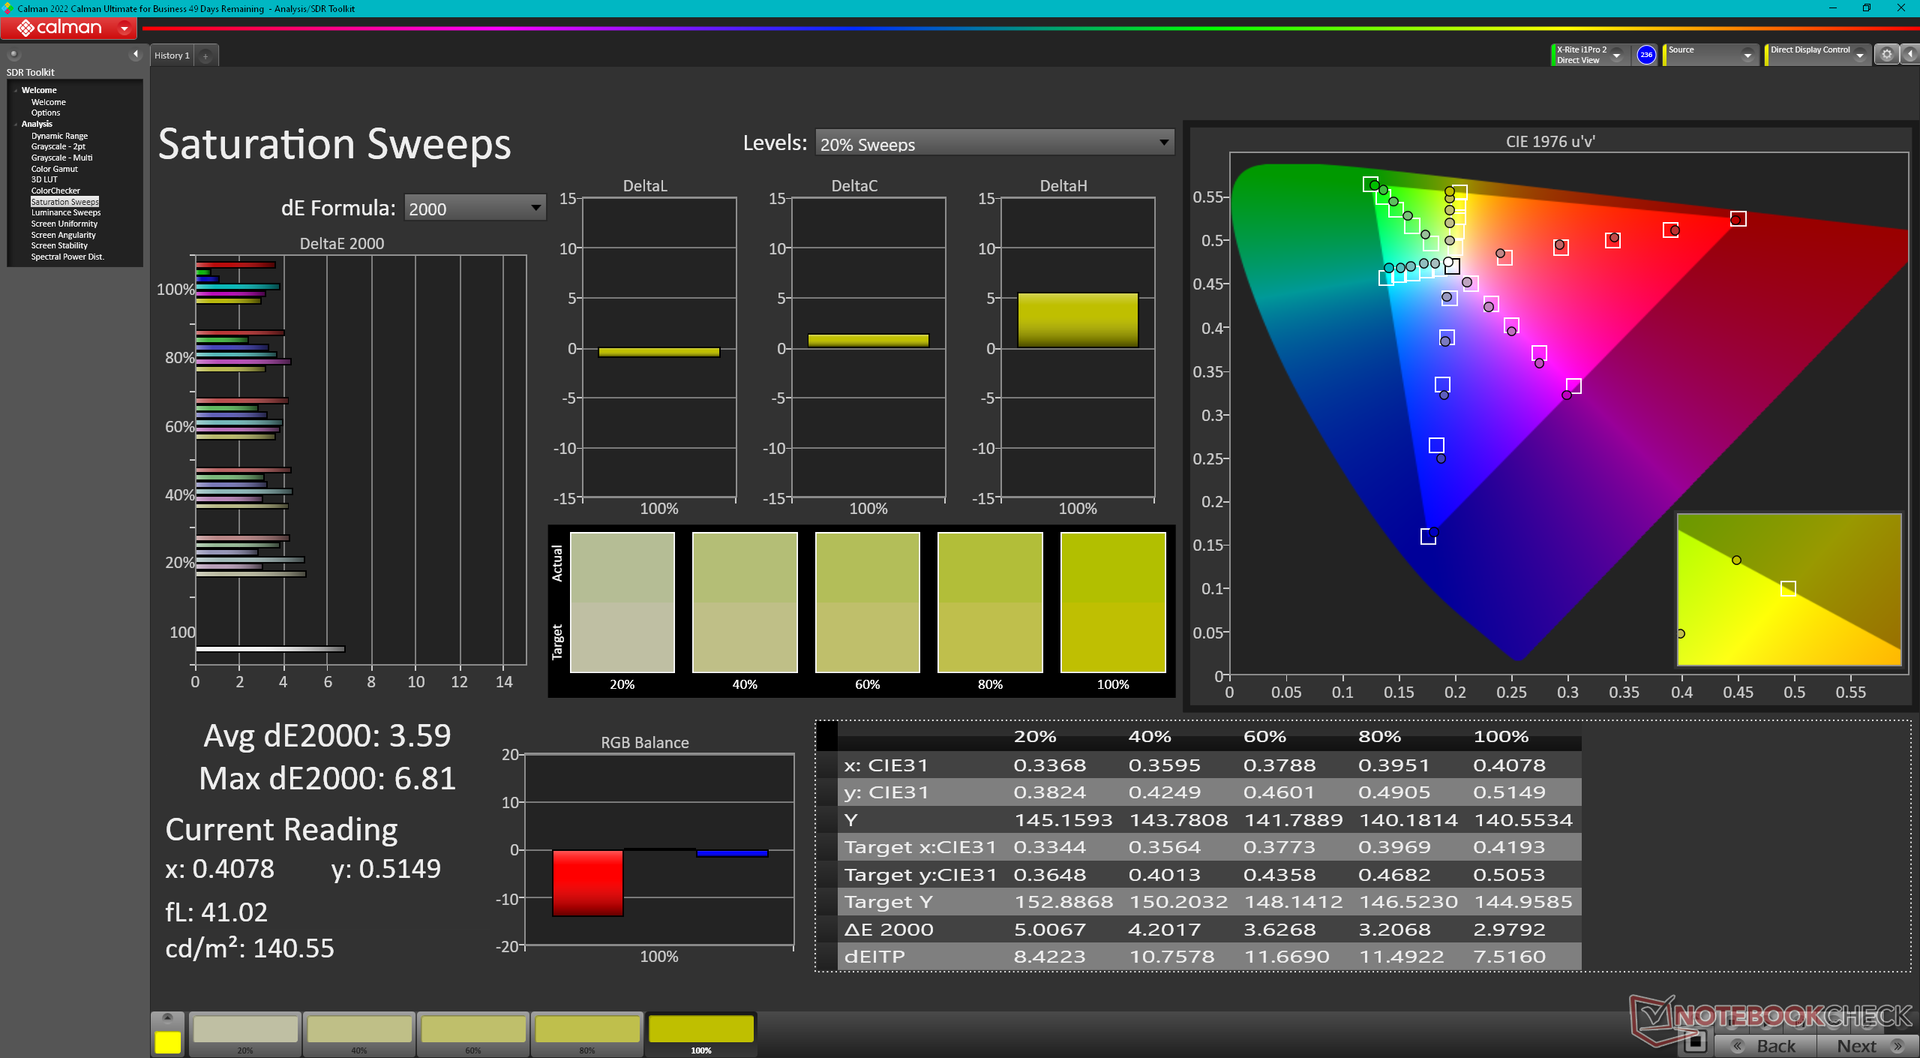
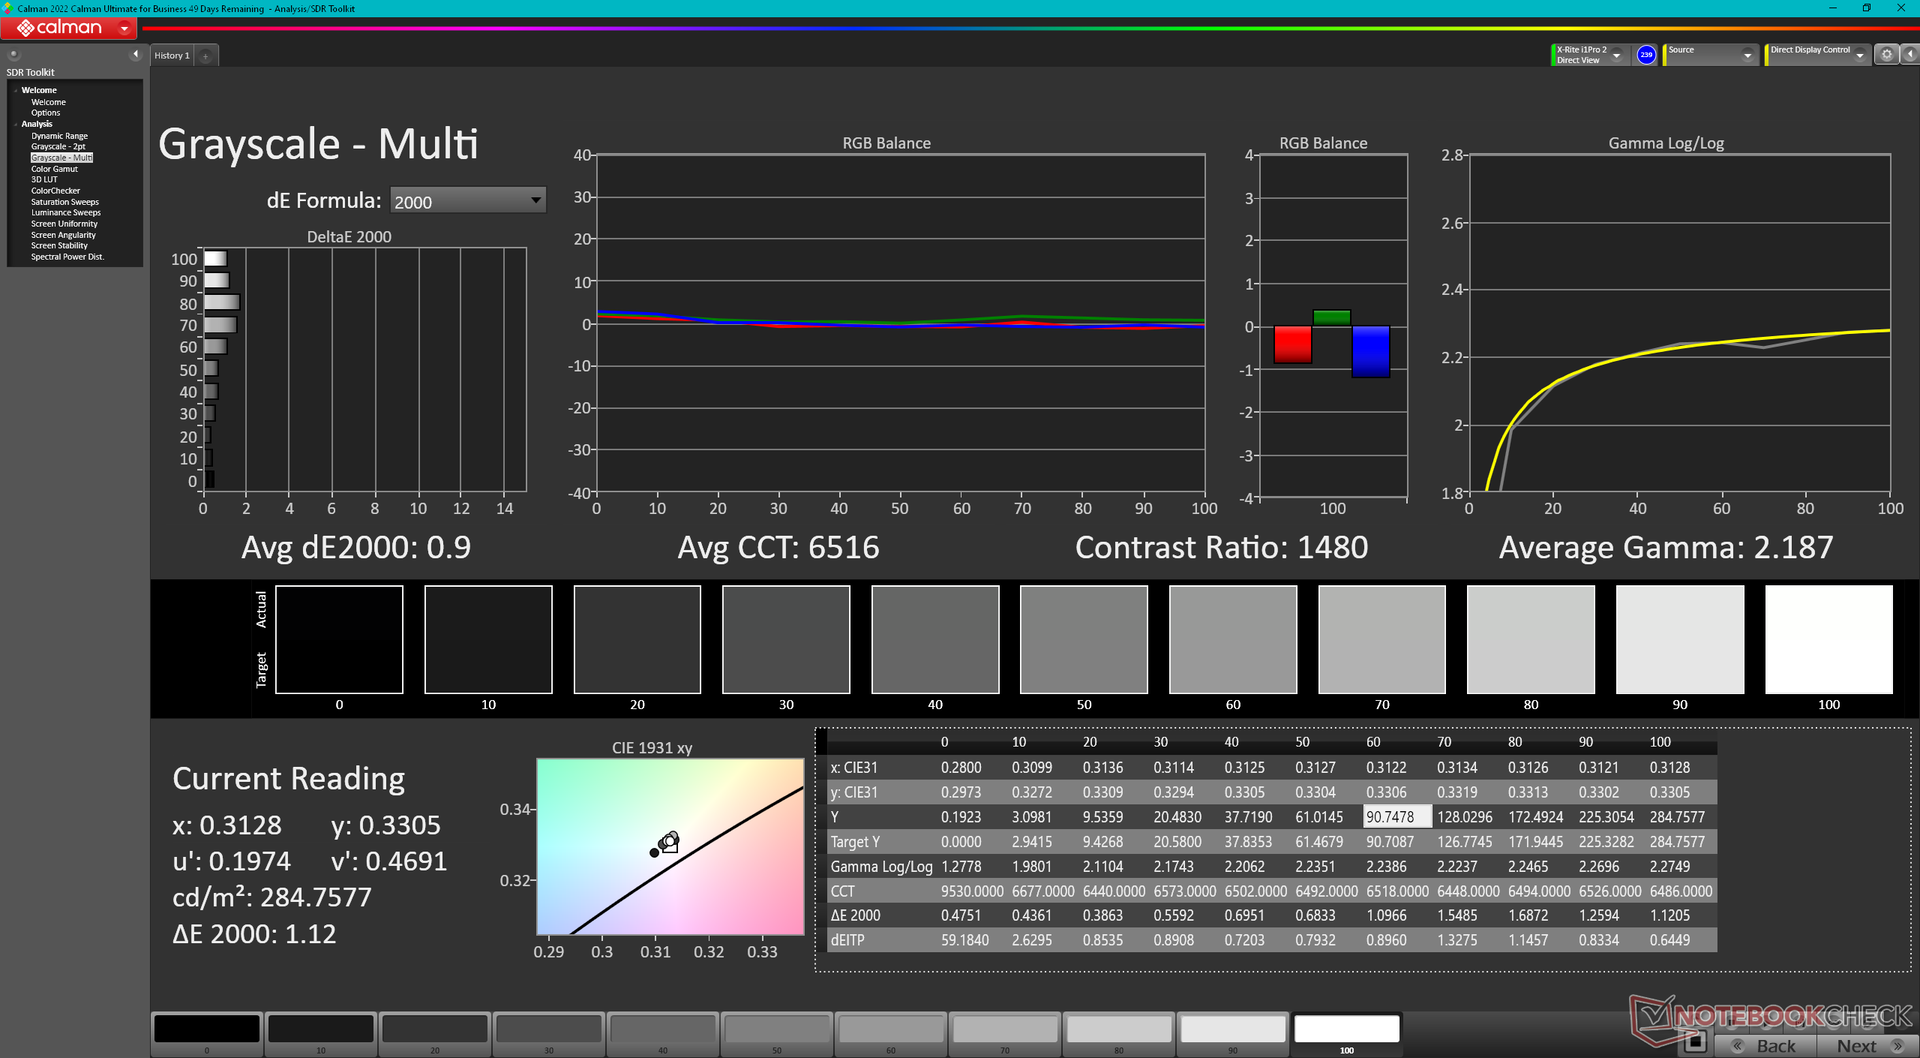
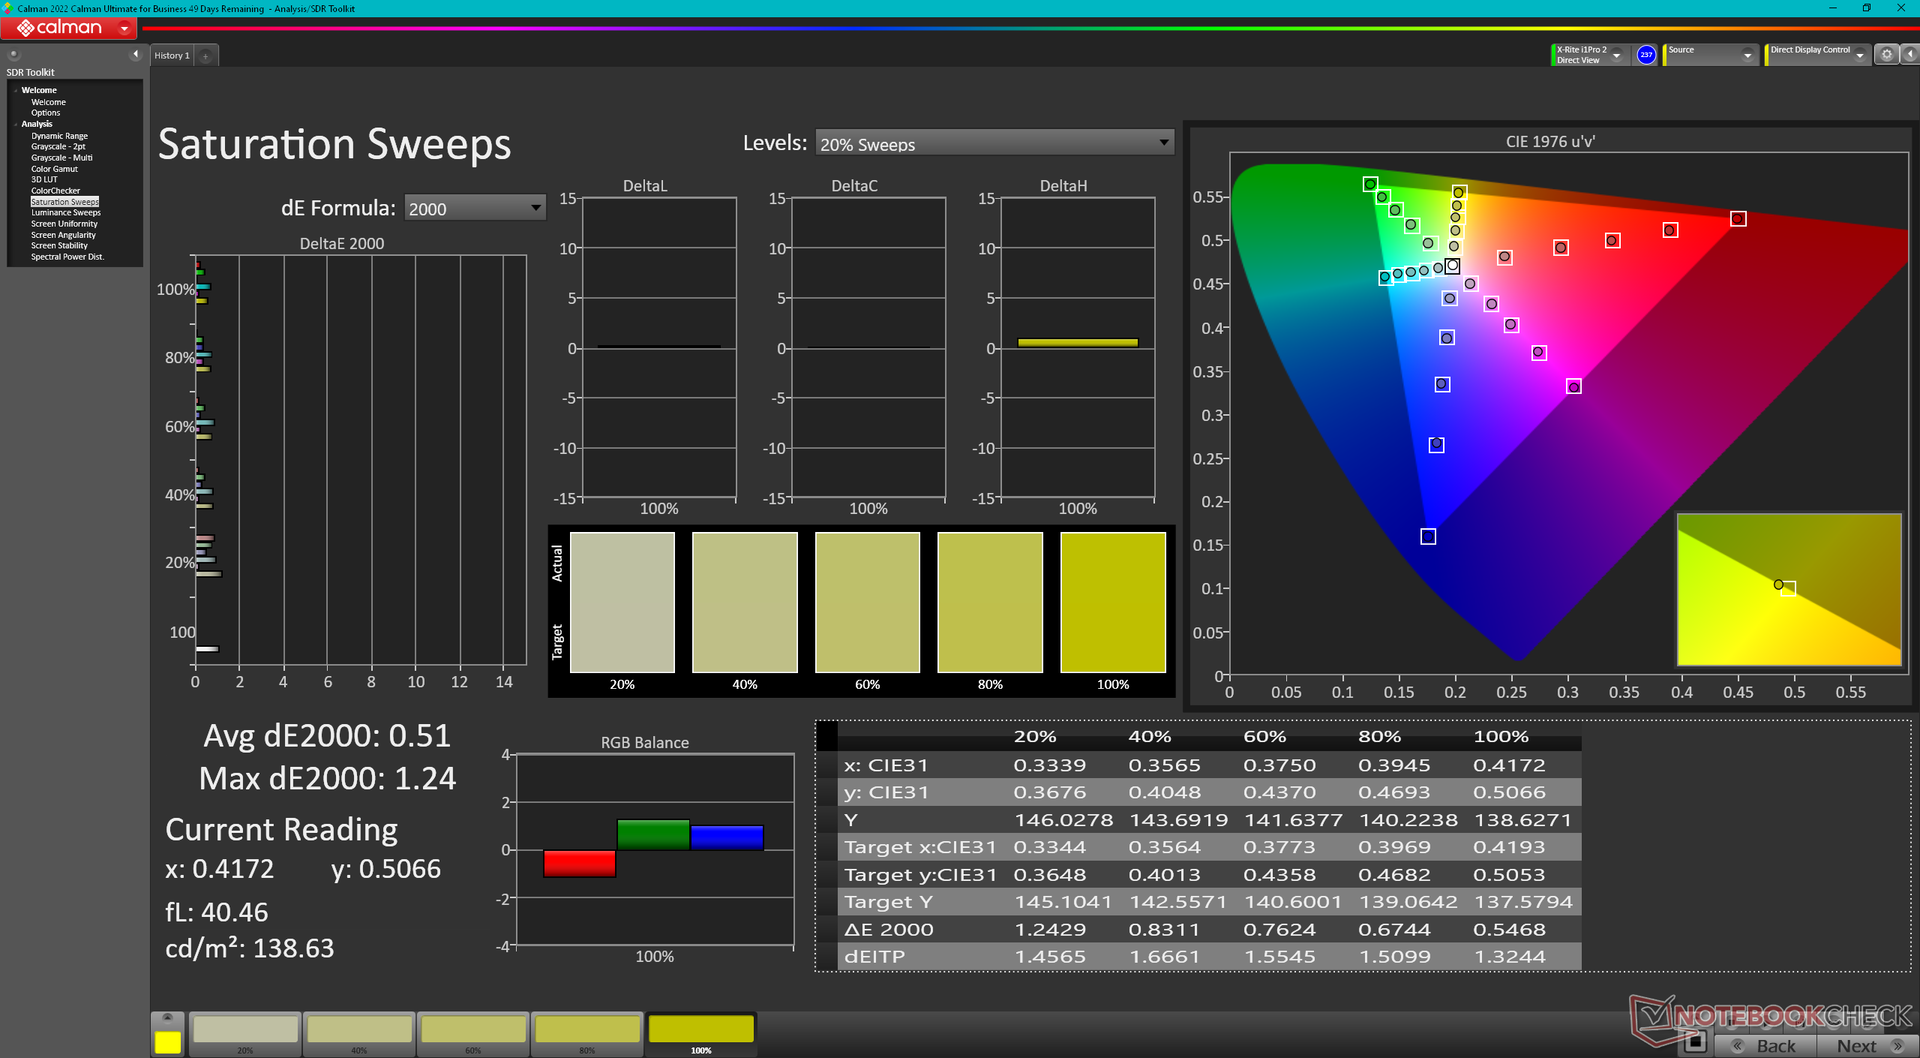
A tela não vem pré-calibrada com valores médios de escala de cinza e deltaE de cor de 5,5 e 4,25, respectivamente. A temperatura da cor também está mais quente do que o normal, em 6368. Uma calibração adequada com o nosso colorímetro X-Rite resolveria todos esses problemas para uma tela visivelmente mais precisa, como mostram os resultados do CalMAN abaixo. Nosso perfil ICM calibrado está disponível para download gratuito caso os proprietários não tenham suas próprias ferramentas de calibração.
Exibir tempos de resposta
| ↔ Tempo de resposta preto para branco | ||
|---|---|---|
| 24.2 ms ... ascensão ↗ e queda ↘ combinadas | ↗ 10.8 ms ascensão | 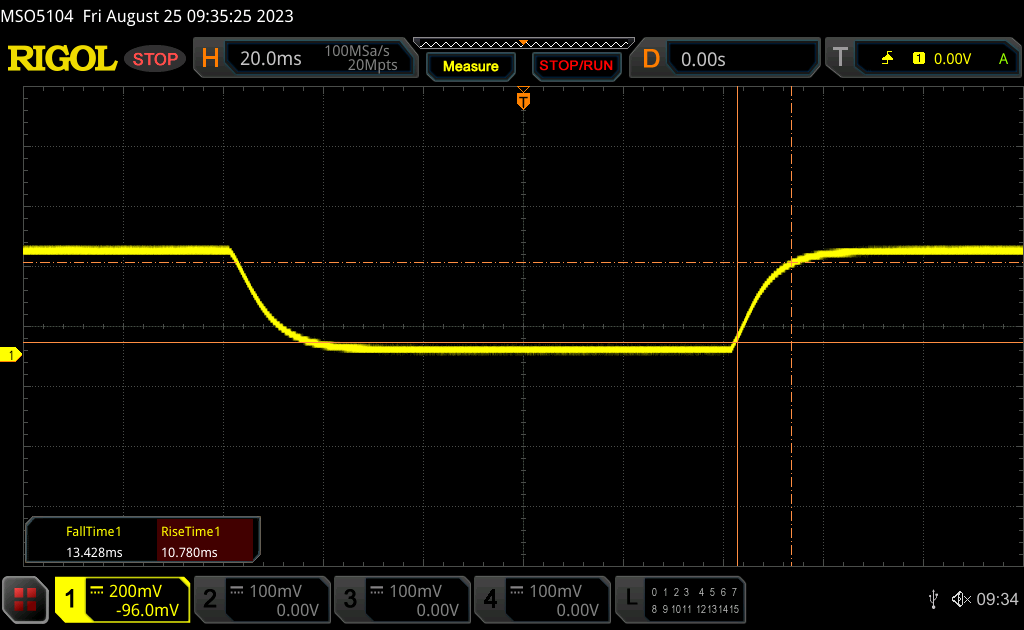 |
| ↘ 13.4 ms queda | ||
| A tela mostra boas taxas de resposta em nossos testes, mas pode ser muito lenta para jogadores competitivos. Em comparação, todos os dispositivos testados variam de 0.1 (mínimo) a 240 (máximo) ms. » 58 % de todos os dispositivos são melhores. Isso significa que o tempo de resposta medido é pior que a média de todos os dispositivos testados (19.8 ms). | ||
| ↔ Tempo de resposta 50% cinza a 80% cinza | ||
| 35 ms ... ascensão ↗ e queda ↘ combinadas | ↗ 15.7 ms ascensão | 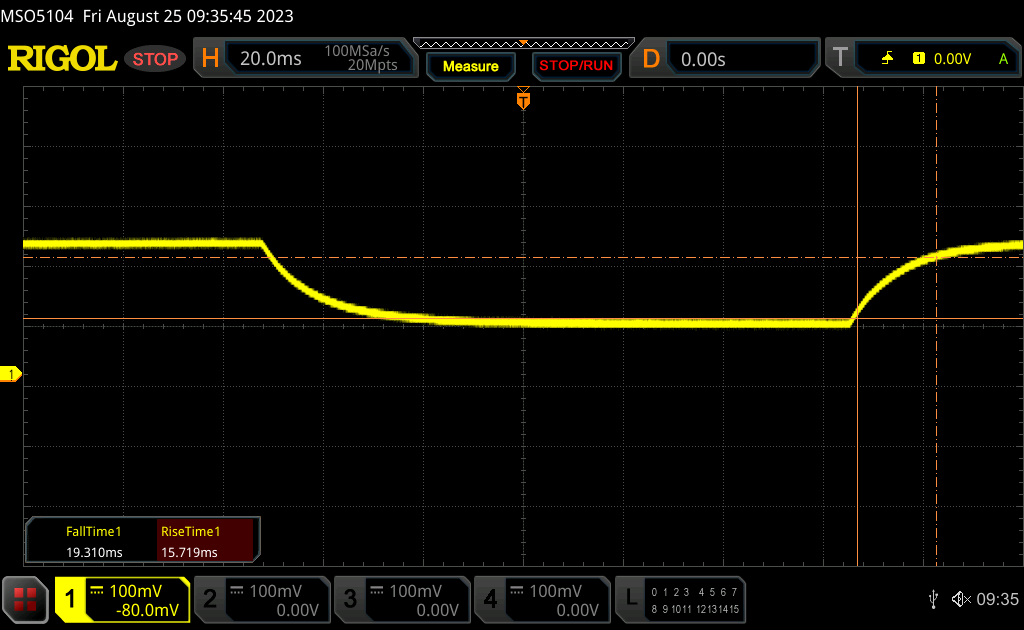 |
| ↘ 19.3 ms queda | ||
| A tela mostra taxas de resposta lentas em nossos testes e será insatisfatória para os jogadores. Em comparação, todos os dispositivos testados variam de 0.165 (mínimo) a 636 (máximo) ms. » 49 % de todos os dispositivos são melhores. Isso significa que o tempo de resposta medido é pior que a média de todos os dispositivos testados (30.9 ms). | ||
Cintilação da tela / PWM (modulação por largura de pulso)
| Tela tremeluzindo / PWM não detectado | 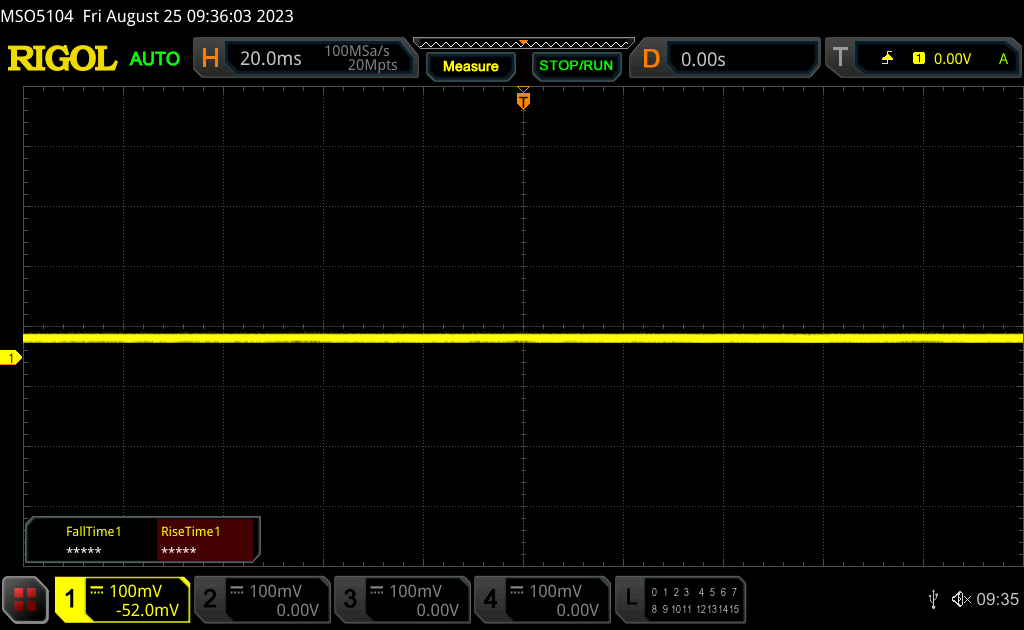 | ||
[pwm_comparison] Em comparação: 52 % de todos os dispositivos testados não usam PWM para escurecer a tela. Se PWM foi detectado, uma média de 7741 (mínimo: 5 - máximo: 343500) Hz foi medida. | |||
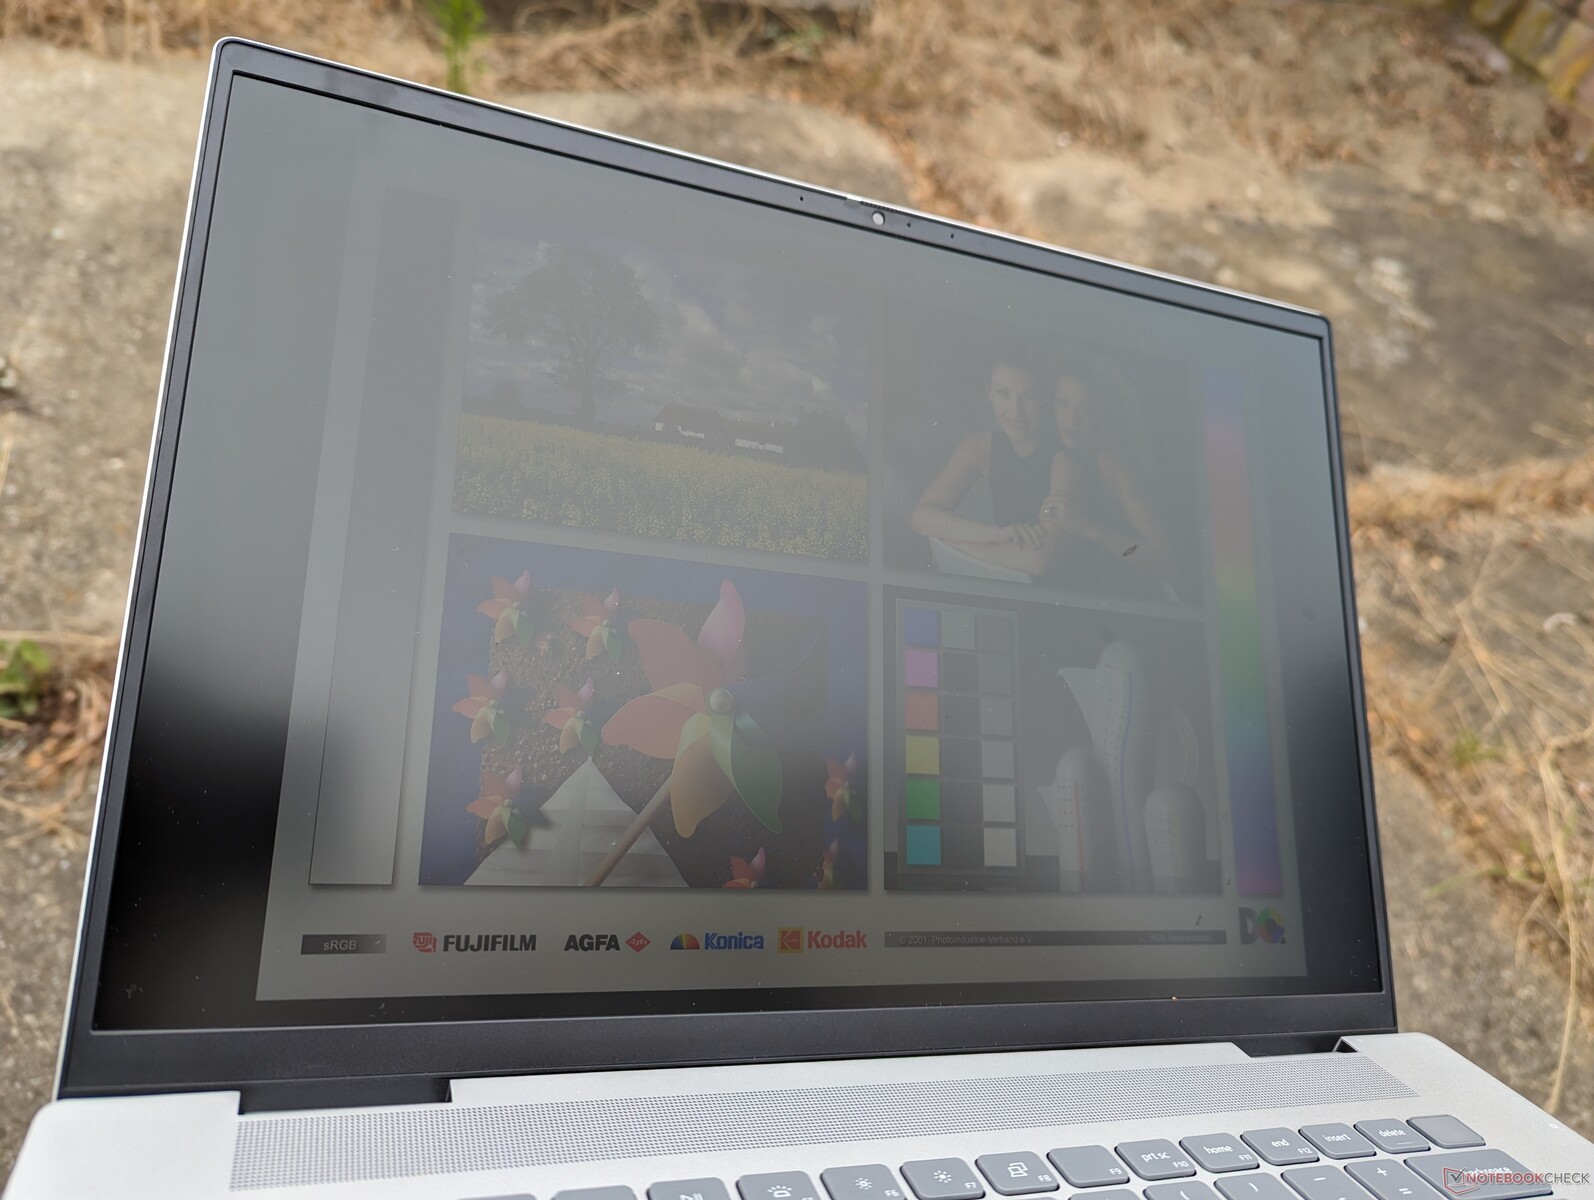
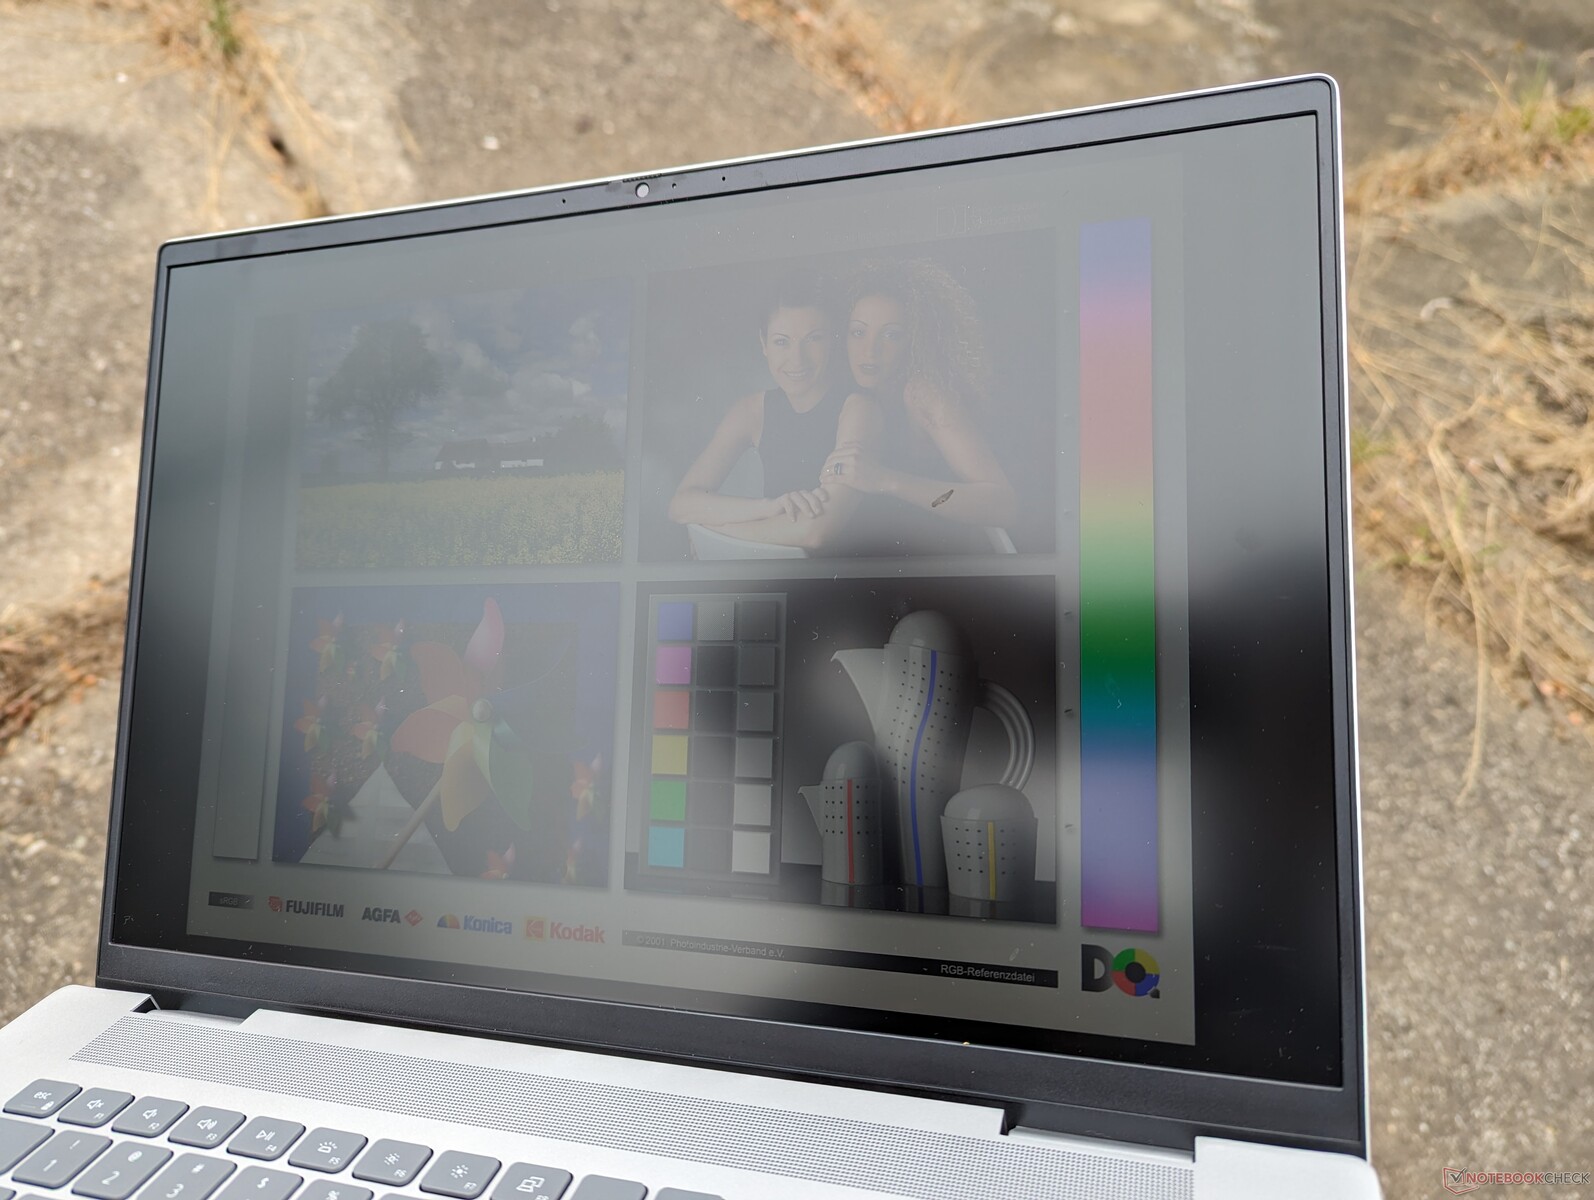
A visibilidade em ambientes externos é comparável à do modelo do ano passado e é decente apenas quando está sob a sombra para minimizar o brilho. Outros notebooks de 16 polegadas com mini-LED ou OLED, como o Yoga 9i 16 ou o Razer Blade 16 tendem a ser mais brilhantes para melhorar a visibilidade em ambientes externos, mas também são muito mais caros do que o nosso Dell.
Desempenho - Intel Raptor Lake-H de 13ª geração
Condições de teste
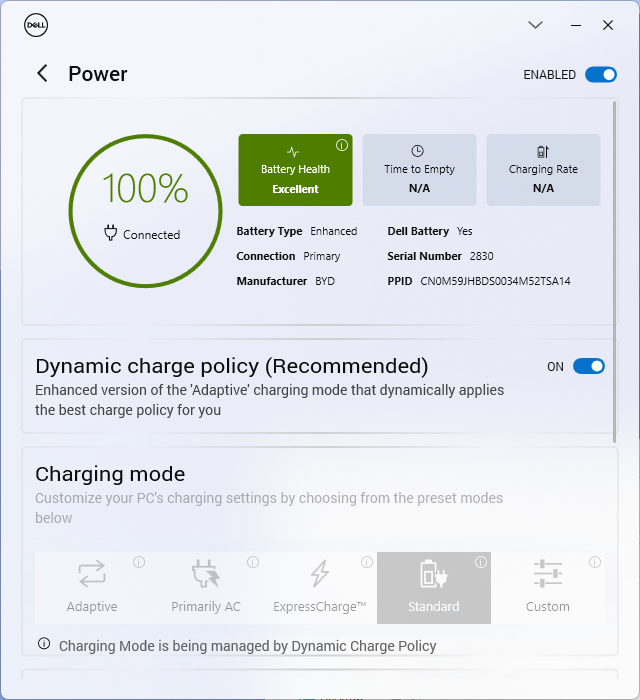
Definimos nossa unidade para o modo Desempenho por meio do software MyDell pré-instalado antes de executar os benchmarks abaixo. Os perfis de energia do MyDell podem ser sincronizados com os perfis de energia do Windows para reduzir a confusão e evitar configurações conflitantes.
O Inspiron não suporta Advanced Optimus ou MUX, que são recursos comuns em modelos dedicados a jogos da série Dell G ou da série Alienware.
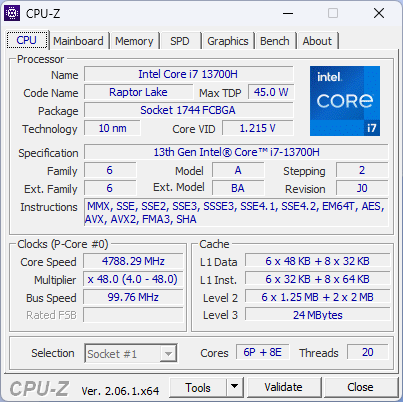
Processador
Desempenho da CPU de nossa 13ª geração Core i7-13700H é apenas até 10% mais rápido do que o Core i7-12700H de 12ª geração Core i7-12700H do Inspiron 16 Plus 7620 do ano passado. No entanto, quando os respectivos benefícios do Turbo Boost diminuem, as diferenças de desempenho se tornam ainda mais estreitas, como mostram os resultados do loop CineBench R15 xT abaixo. Em outras palavras, o Inspiron 16 Plus 7630 é apenas marginalmente mais rápido do que o modelo do ano passado, na melhor das hipóteses, quando se trata do desempenho do processador.
O downgrade para o Core i5-13500H deverá afetar o desempenho do processador em apenas cerca de 10%, com base em nossa experiência com o Asus VivoBook 14X. Enquanto isso, o processador AMD Ryzen 7 7840HS baseado na AMD, deverá ter um desempenho equivalente ao do nosso Core i7-13700H.
Cinebench R15 Multi Loop
Cinebench R23: Multi Core | Single Core
Cinebench R20: CPU (Multi Core) | CPU (Single Core)
Cinebench R15: CPU Multi 64Bit | CPU Single 64Bit
Blender: v2.79 BMW27 CPU
7-Zip 18.03: 7z b 4 | 7z b 4 -mmt1
Geekbench 5.5: Multi-Core | Single-Core
HWBOT x265 Benchmark v2.2: 4k Preset
LibreOffice : 20 Documents To PDF
R Benchmark 2.5: Overall mean
* ... menor é melhor
AIDA64: FP32 Ray-Trace | FPU Julia | CPU SHA3 | CPU Queen | FPU SinJulia | FPU Mandel | CPU AES | CPU ZLib | FP64 Ray-Trace | CPU PhotoWorxx
| Performance rating | |
| Asus Vivobook Pro 16X K6604JV-MX016W | |
| Lenovo Slim Pro 9i 16IRP8 | |
| Média Intel Core i7-13700H | |
| Dell Inspiron 16 Plus 7630 | |
| MSI Summit E16 Flip A12UDT-031 | |
| HP Envy 16 h0112nr | |
| Dell Inspiron 16 Plus 7620 | |
| AIDA64 / FP32 Ray-Trace | |
| Asus Vivobook Pro 16X K6604JV-MX016W | |
| Lenovo Slim Pro 9i 16IRP8 | |
| Média Intel Core i7-13700H (4986 - 18908, n=29) | |
| Dell Inspiron 16 Plus 7630 | |
| MSI Summit E16 Flip A12UDT-031 | |
| Dell Inspiron 16 Plus 7620 | |
| HP Envy 16 h0112nr | |
| AIDA64 / FPU Julia | |
| Asus Vivobook Pro 16X K6604JV-MX016W | |
| Lenovo Slim Pro 9i 16IRP8 | |
| Média Intel Core i7-13700H (25360 - 92359, n=29) | |
| Dell Inspiron 16 Plus 7630 | |
| MSI Summit E16 Flip A12UDT-031 | |
| Dell Inspiron 16 Plus 7620 | |
| HP Envy 16 h0112nr | |
| AIDA64 / CPU SHA3 | |
| Asus Vivobook Pro 16X K6604JV-MX016W | |
| Lenovo Slim Pro 9i 16IRP8 | |
| Média Intel Core i7-13700H (1339 - 4224, n=29) | |
| Dell Inspiron 16 Plus 7630 | |
| MSI Summit E16 Flip A12UDT-031 | |
| Dell Inspiron 16 Plus 7620 | |
| HP Envy 16 h0112nr | |
| AIDA64 / CPU Queen | |
| Asus Vivobook Pro 16X K6604JV-MX016W | |
| Lenovo Slim Pro 9i 16IRP8 | |
| Dell Inspiron 16 Plus 7630 | |
| HP Envy 16 h0112nr | |
| MSI Summit E16 Flip A12UDT-031 | |
| Média Intel Core i7-13700H (59324 - 107159, n=29) | |
| Dell Inspiron 16 Plus 7620 | |
| AIDA64 / FPU SinJulia | |
| Asus Vivobook Pro 16X K6604JV-MX016W | |
| Lenovo Slim Pro 9i 16IRP8 | |
| Dell Inspiron 16 Plus 7630 | |
| Média Intel Core i7-13700H (4800 - 11050, n=29) | |
| MSI Summit E16 Flip A12UDT-031 | |
| Dell Inspiron 16 Plus 7620 | |
| HP Envy 16 h0112nr | |
| AIDA64 / FPU Mandel | |
| Asus Vivobook Pro 16X K6604JV-MX016W | |
| Lenovo Slim Pro 9i 16IRP8 | |
| Média Intel Core i7-13700H (12321 - 45118, n=29) | |
| Dell Inspiron 16 Plus 7630 | |
| MSI Summit E16 Flip A12UDT-031 | |
| Dell Inspiron 16 Plus 7620 | |
| HP Envy 16 h0112nr | |
| AIDA64 / CPU AES | |
| HP Envy 16 h0112nr | |
| Asus Vivobook Pro 16X K6604JV-MX016W | |
| Lenovo Slim Pro 9i 16IRP8 | |
| Média Intel Core i7-13700H (28769 - 151254, n=29) | |
| Dell Inspiron 16 Plus 7620 | |
| MSI Summit E16 Flip A12UDT-031 | |
| Dell Inspiron 16 Plus 7630 | |
| AIDA64 / CPU ZLib | |
| Asus Vivobook Pro 16X K6604JV-MX016W | |
| Lenovo Slim Pro 9i 16IRP8 | |
| Dell Inspiron 16 Plus 7620 | |
| Média Intel Core i7-13700H (389 - 1215, n=29) | |
| MSI Summit E16 Flip A12UDT-031 | |
| Dell Inspiron 16 Plus 7630 | |
| HP Envy 16 h0112nr | |
| AIDA64 / FP64 Ray-Trace | |
| Asus Vivobook Pro 16X K6604JV-MX016W | |
| Lenovo Slim Pro 9i 16IRP8 | |
| Média Intel Core i7-13700H (2540 - 10135, n=29) | |
| Dell Inspiron 16 Plus 7630 | |
| MSI Summit E16 Flip A12UDT-031 | |
| Dell Inspiron 16 Plus 7620 | |
| HP Envy 16 h0112nr | |
| AIDA64 / CPU PhotoWorxx | |
| Lenovo Slim Pro 9i 16IRP8 | |
| Asus Vivobook Pro 16X K6604JV-MX016W | |
| MSI Summit E16 Flip A12UDT-031 | |
| Média Intel Core i7-13700H (12872 - 52727, n=29) | |
| Dell Inspiron 16 Plus 7630 | |
| HP Envy 16 h0112nr | |
| Dell Inspiron 16 Plus 7620 | |
Desempenho do sistema
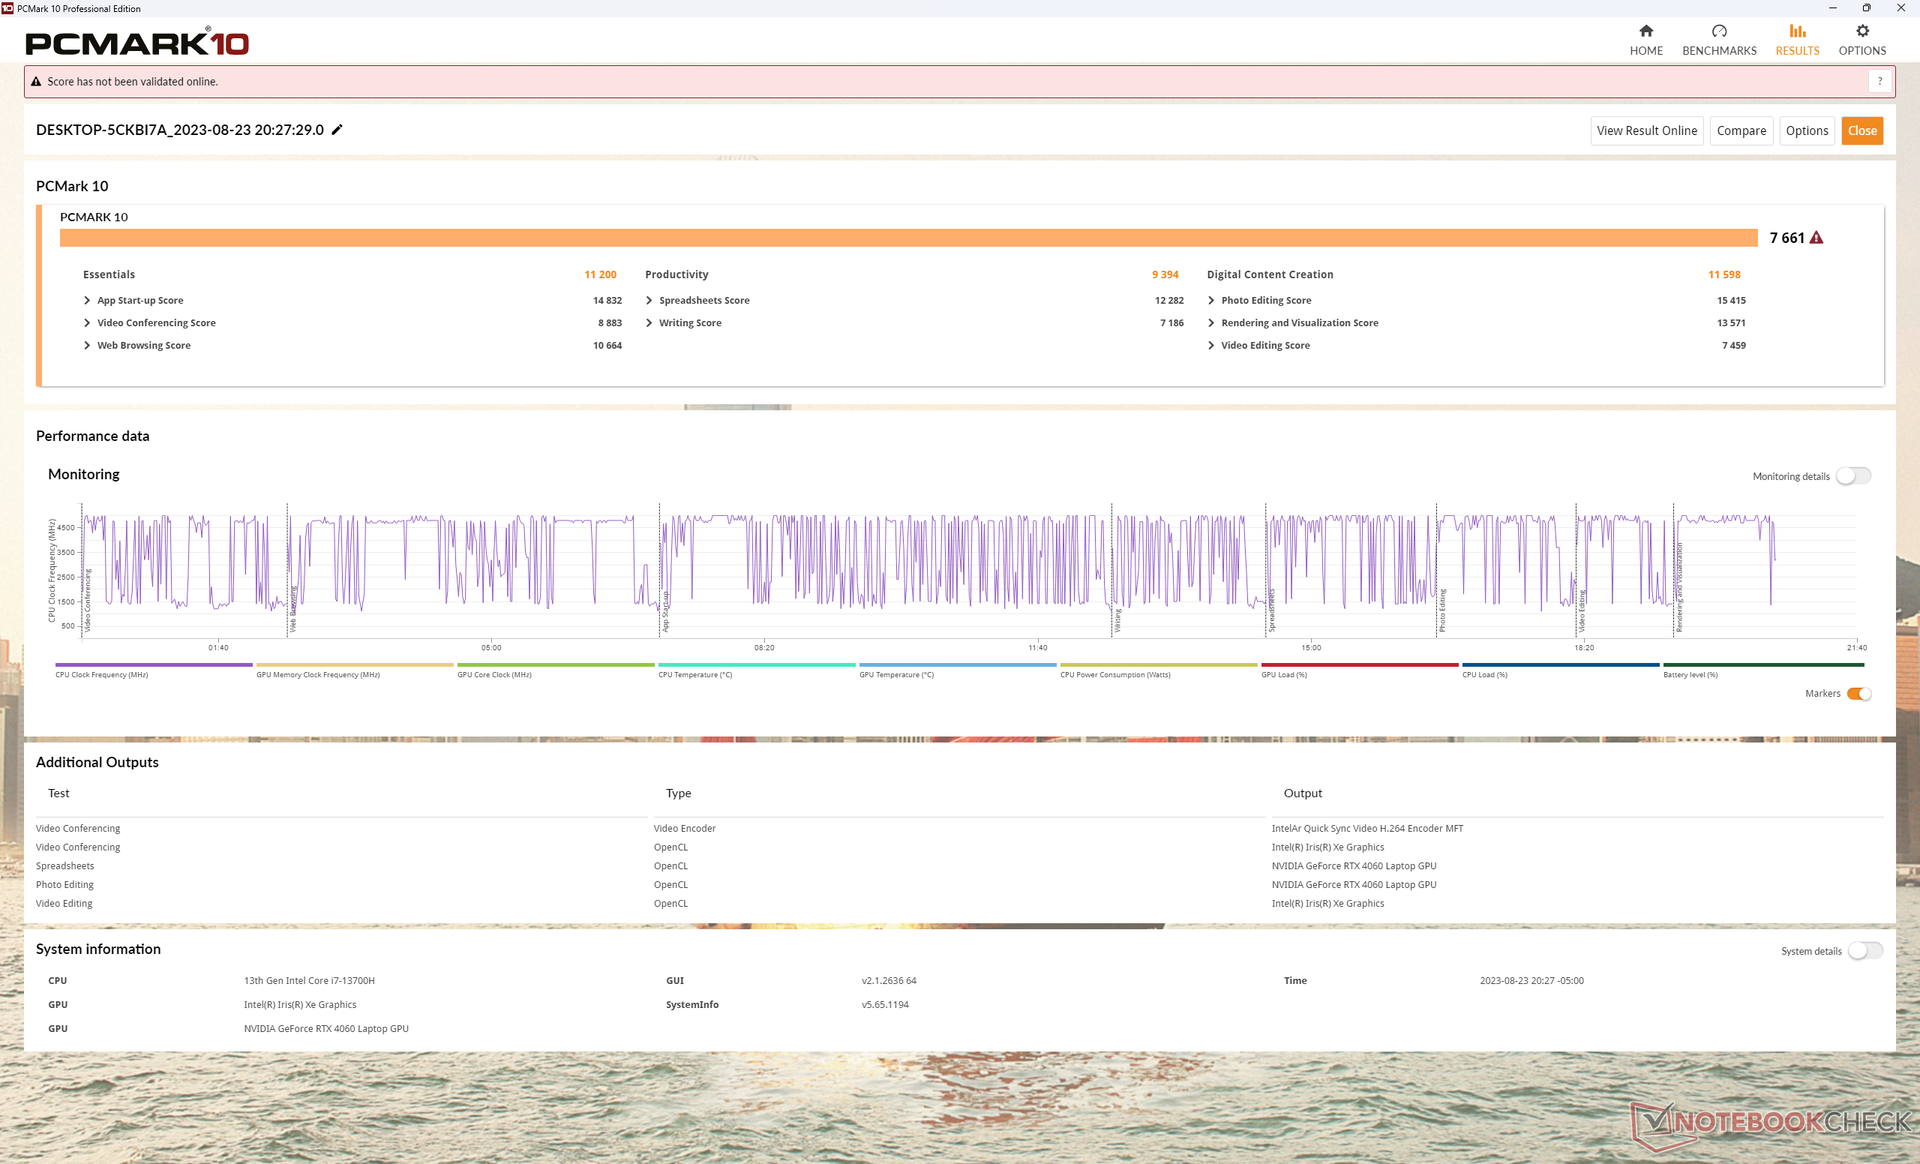
As pontuações do PCMark são consistentemente mais altas do que as do Inspiron 16 Plus 7620 do ano passado, especialmente no subteste Criação de conteúdo digital, em que o desempenho da GPU é mais importante.
Não tivemos nenhum problema de despertar do modo de suspensão ou BSODs, ao contrário do recente Alienware m16 R1.
CrossMark: Overall | Productivity | Creativity | Responsiveness
| PCMark 10 / Score | |
| Lenovo Slim Pro 9i 16IRP8 | |
| Dell Inspiron 16 Plus 7630 | |
| HP Envy 16 h0112nr | |
| Média Intel Core i7-13700H, NVIDIA GeForce RTX 4060 Laptop GPU (7157 - 7661, n=5) | |
| Asus Vivobook Pro 16X K6604JV-MX016W | |
| Dell Inspiron 16 Plus 7620 | |
| MSI Summit E16 Flip A12UDT-031 | |
| PCMark 10 / Essentials | |
| HP Envy 16 h0112nr | |
| Lenovo Slim Pro 9i 16IRP8 | |
| Dell Inspiron 16 Plus 7630 | |
| Média Intel Core i7-13700H, NVIDIA GeForce RTX 4060 Laptop GPU (10179 - 11200, n=5) | |
| Asus Vivobook Pro 16X K6604JV-MX016W | |
| Dell Inspiron 16 Plus 7620 | |
| MSI Summit E16 Flip A12UDT-031 | |
| PCMark 10 / Productivity | |
| Lenovo Slim Pro 9i 16IRP8 | |
| Média Intel Core i7-13700H, NVIDIA GeForce RTX 4060 Laptop GPU (8238 - 10249, n=5) | |
| Dell Inspiron 16 Plus 7630 | |
| HP Envy 16 h0112nr | |
| Dell Inspiron 16 Plus 7620 | |
| Asus Vivobook Pro 16X K6604JV-MX016W | |
| MSI Summit E16 Flip A12UDT-031 | |
| PCMark 10 / Digital Content Creation | |
| Dell Inspiron 16 Plus 7630 | |
| Lenovo Slim Pro 9i 16IRP8 | |
| Média Intel Core i7-13700H, NVIDIA GeForce RTX 4060 Laptop GPU (10308 - 11862, n=5) | |
| HP Envy 16 h0112nr | |
| Dell Inspiron 16 Plus 7620 | |
| Asus Vivobook Pro 16X K6604JV-MX016W | |
| MSI Summit E16 Flip A12UDT-031 | |
| CrossMark / Overall | |
| Asus Vivobook Pro 16X K6604JV-MX016W | |
| Dell Inspiron 16 Plus 7630 | |
| HP Envy 16 h0112nr | |
| Lenovo Slim Pro 9i 16IRP8 | |
| Dell Inspiron 16 Plus 7620 | |
| Média Intel Core i7-13700H, NVIDIA GeForce RTX 4060 Laptop GPU (1629 - 1849, n=5) | |
| MSI Summit E16 Flip A12UDT-031 | |
| CrossMark / Productivity | |
| Asus Vivobook Pro 16X K6604JV-MX016W | |
| Dell Inspiron 16 Plus 7630 | |
| HP Envy 16 h0112nr | |
| Dell Inspiron 16 Plus 7620 | |
| Lenovo Slim Pro 9i 16IRP8 | |
| Média Intel Core i7-13700H, NVIDIA GeForce RTX 4060 Laptop GPU (1561 - 1743, n=5) | |
| MSI Summit E16 Flip A12UDT-031 | |
| CrossMark / Creativity | |
| Asus Vivobook Pro 16X K6604JV-MX016W | |
| Lenovo Slim Pro 9i 16IRP8 | |
| Dell Inspiron 16 Plus 7630 | |
| HP Envy 16 h0112nr | |
| Dell Inspiron 16 Plus 7620 | |
| Média Intel Core i7-13700H, NVIDIA GeForce RTX 4060 Laptop GPU (1691 - 2064, n=5) | |
| MSI Summit E16 Flip A12UDT-031 | |
| CrossMark / Responsiveness | |
| Asus Vivobook Pro 16X K6604JV-MX016W | |
| HP Envy 16 h0112nr | |
| Dell Inspiron 16 Plus 7630 | |
| MSI Summit E16 Flip A12UDT-031 | |
| Dell Inspiron 16 Plus 7620 | |
| Média Intel Core i7-13700H, NVIDIA GeForce RTX 4060 Laptop GPU (1381 - 1656, n=5) | |
| Lenovo Slim Pro 9i 16IRP8 | |
| PCMark 10 Score | 7661 pontos | |
Ajuda | ||
| AIDA64 / Memory Copy | |
| Lenovo Slim Pro 9i 16IRP8 | |
| Asus Vivobook Pro 16X K6604JV-MX016W | |
| MSI Summit E16 Flip A12UDT-031 | |
| Média Intel Core i7-13700H (24334 - 78081, n=29) | |
| Dell Inspiron 16 Plus 7630 | |
| HP Envy 16 h0112nr | |
| Dell Inspiron 16 Plus 7620 | |
| AIDA64 / Memory Read | |
| Asus Vivobook Pro 16X K6604JV-MX016W | |
| Lenovo Slim Pro 9i 16IRP8 | |
| Dell Inspiron 16 Plus 7630 | |
| HP Envy 16 h0112nr | |
| MSI Summit E16 Flip A12UDT-031 | |
| Média Intel Core i7-13700H (23681 - 79656, n=29) | |
| Dell Inspiron 16 Plus 7620 | |
| AIDA64 / Memory Write | |
| Lenovo Slim Pro 9i 16IRP8 | |
| Asus Vivobook Pro 16X K6604JV-MX016W | |
| Média Intel Core i7-13700H (22986 - 99898, n=29) | |
| Dell Inspiron 16 Plus 7630 | |
| HP Envy 16 h0112nr | |
| MSI Summit E16 Flip A12UDT-031 | |
| Dell Inspiron 16 Plus 7620 | |
| AIDA64 / Memory Latency | |
| MSI Summit E16 Flip A12UDT-031 | |
| Lenovo Slim Pro 9i 16IRP8 | |
| Dell Inspiron 16 Plus 7620 | |
| Média Intel Core i7-13700H (82.4 - 136.8, n=29) | |
| Dell Inspiron 16 Plus 7630 | |
| HP Envy 16 h0112nr | |
| Asus Vivobook Pro 16X K6604JV-MX016W | |
* ... menor é melhor
Latência DPC
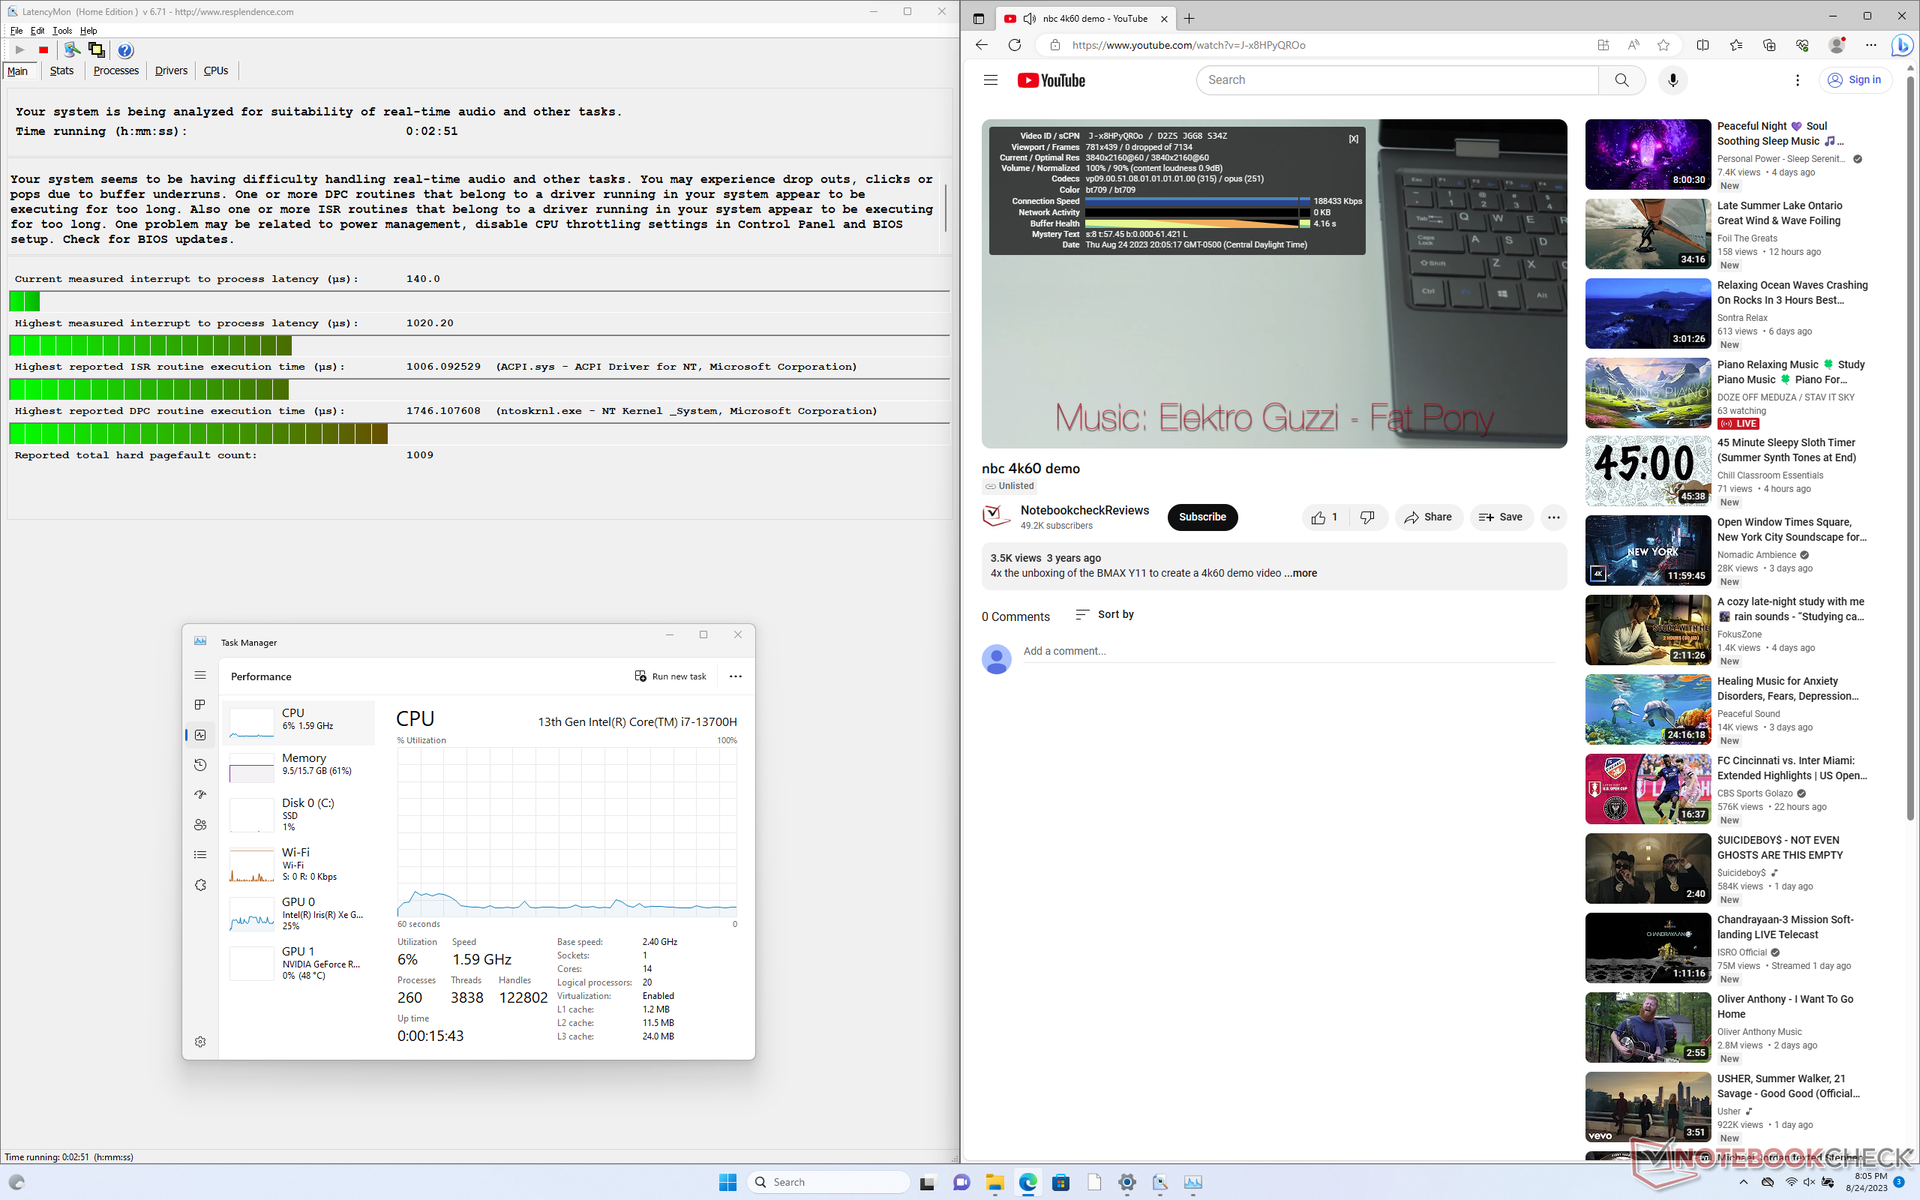
O LatencyMon mostra apenas pequenos problemas de DPC ao abrir várias guias do navegador em nossa página inicial. a reprodução de vídeo 4K a 60 FPS é perfeita, sem perda de quadros registrada, ao contrário do recente Alienware m16 R1, em que os saltos de quadros eram persistentes.
| DPC Latencies / LatencyMon - interrupt to process latency (max), Web, Youtube, Prime95 | |
| Asus Vivobook Pro 16X K6604JV-MX016W | |
| Lenovo Slim Pro 9i 16IRP8 | |
| Dell Inspiron 16 Plus 7630 | |
| Dell Inspiron 16 Plus 7620 | |
| MSI Summit E16 Flip A12UDT-031 | |
| HP Envy 16 h0112nr | |
* ... menor é melhor
Dispositivos de armazenamento - Suporta apenas um SSD
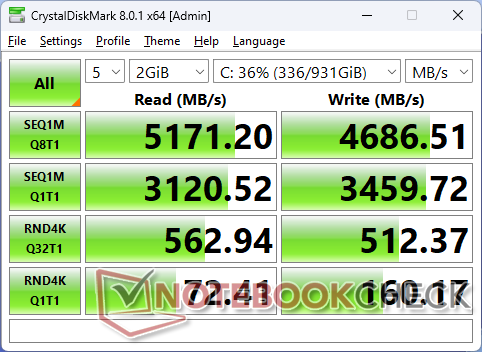
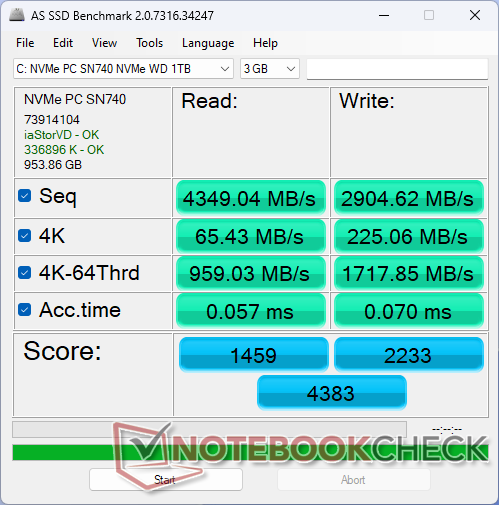
Nossa unidade vem com uma unidade de médio porte Western Digital SN740 PCIe4 x4 NVMe SSD de médio porte que oferece taxas de transferência de até 5200 MB/s. No entanto, esse máximo só é sustentável por cerca de um minuto, antes de ser reduzido para 2400 MB/s, conforme mostrado pelos resultados do teste de loop do DiskSpd abaixo. Essa limitação não é um problema para o desempenho em jogos e para a grande maioria dos cenários de uso.
O modelo suporta apenas um SSD interno, enquanto alguns outros notebooks de 16 polegadas, como o Envy 16 podem suportar até duas unidades.

| Drive Performance rating - Percent | |
| MSI Summit E16 Flip A12UDT-031 | |
| Lenovo Slim Pro 9i 16IRP8 | |
| HP Envy 16 h0112nr | |
| Dell Inspiron 16 Plus 7630 | |
| Asus Vivobook Pro 16X K6604JV-MX016W | |
| Dell Inspiron 16 Plus 7620 | |
* ... menor é melhor
Disk Throttling: DiskSpd Read Loop, Queue Depth 8
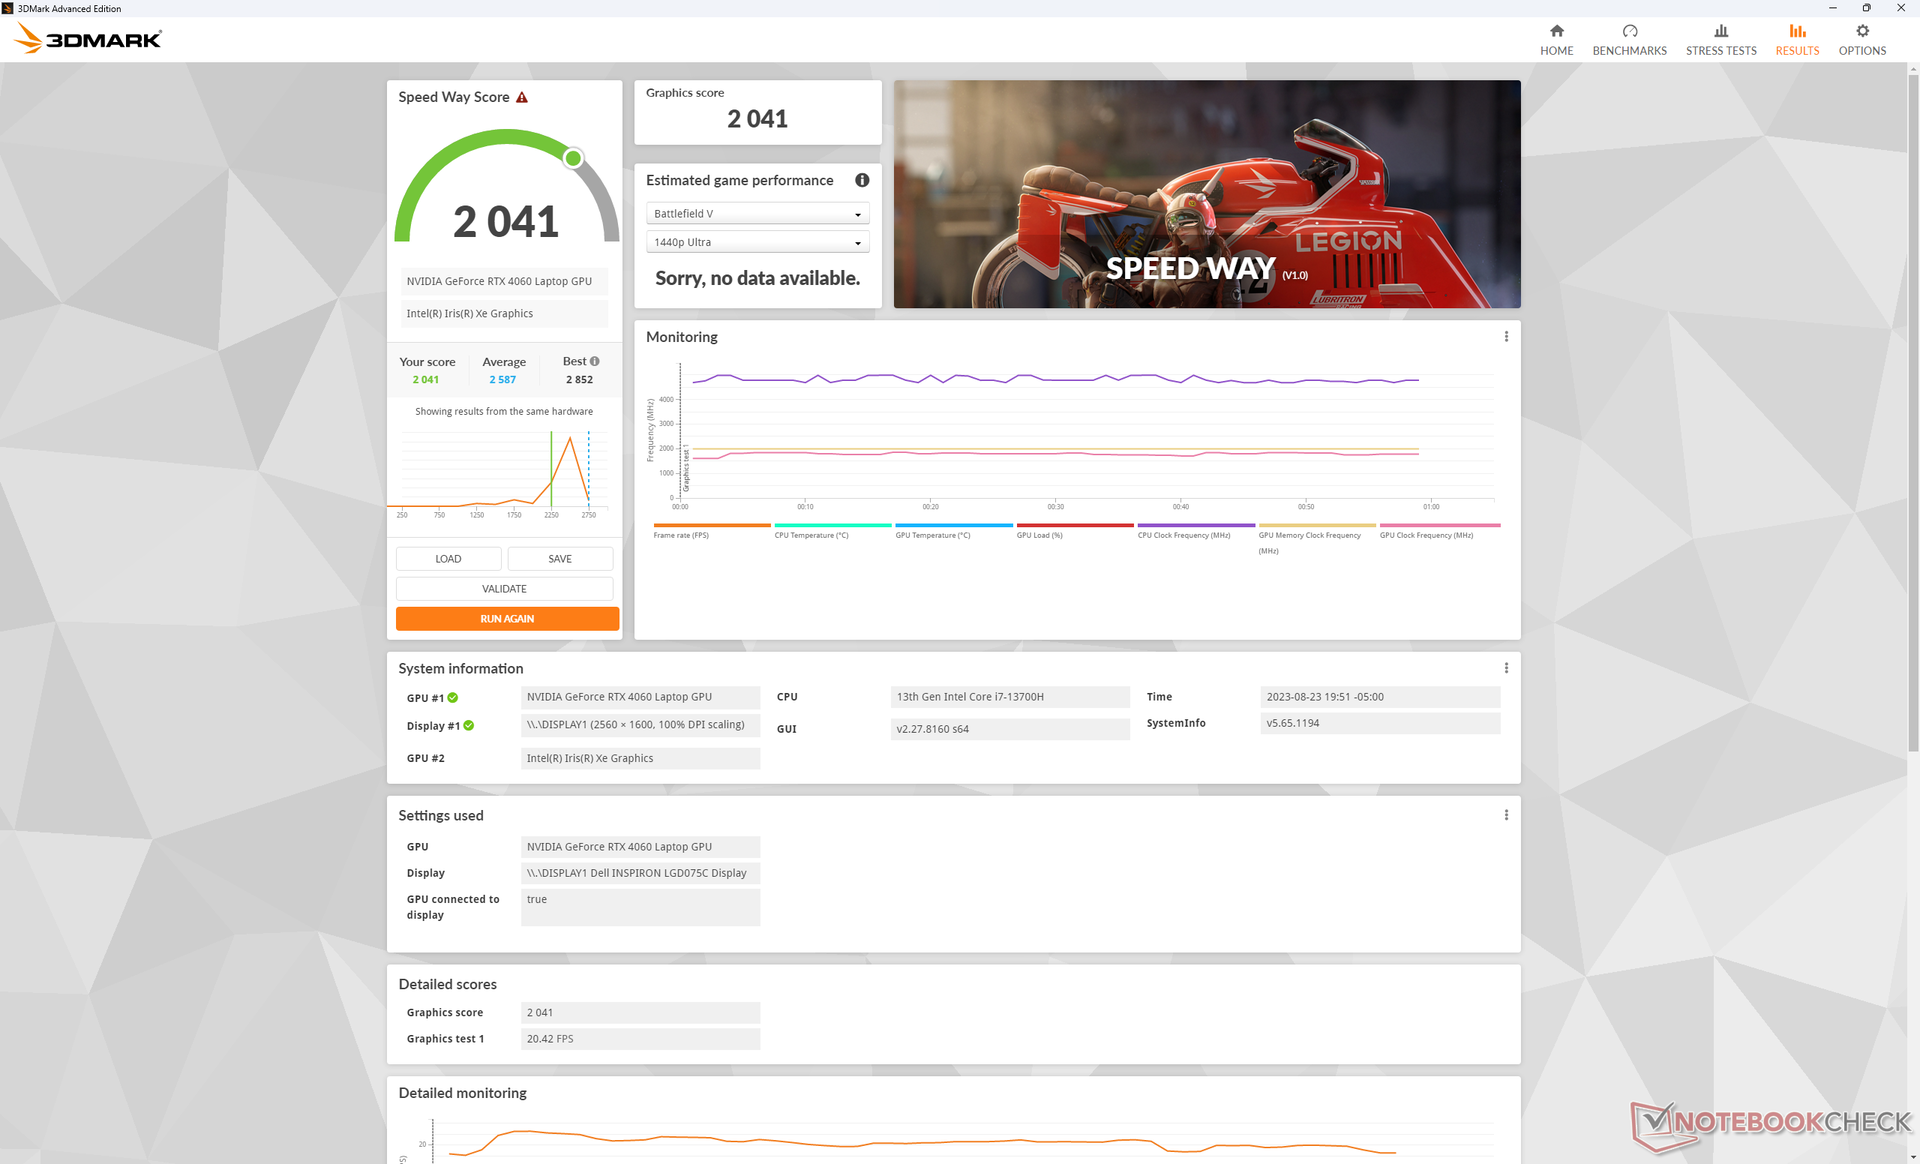
Desempenho da GPU
A GeForce RTX 4060 em nosso Dell é cerca de 10 a 15% mais lenta do que a média dos notebooks em nosso banco de dados equipados com a mesma GPU. O delta provavelmente se deve à meta de TGP de 60 W relativamente baixa do Inspiron 16 Plus 7630, já que a maioria dos laptops com a RTX 4060 tende a ser dedicada a jogos e otimizada para faixas de potência de GPU mais altas, de 90 W ou mais. Portanto, o desempenho geral é mais comparável ao da GeForce RTX 4050 no Lenovo Slim Pro 9i 16, o que é um pouco decepcionante. No entanto, a atualização de desempenho de uma geração para outra em relação ao RTX 3050 Ti no Inspiron 16 Plus 7620 do ano passado ainda é significativa, de 40 a 60%.
Os usuários podem considerar a possibilidade de configurar o Inspiron 16 Plus 7630 com a RTX 4050 mais barata, já que a opção RTX 4060 tem um desempenho inferior. Todas as opções de GPU têm como alvo o mesmo TGP de 60 W.
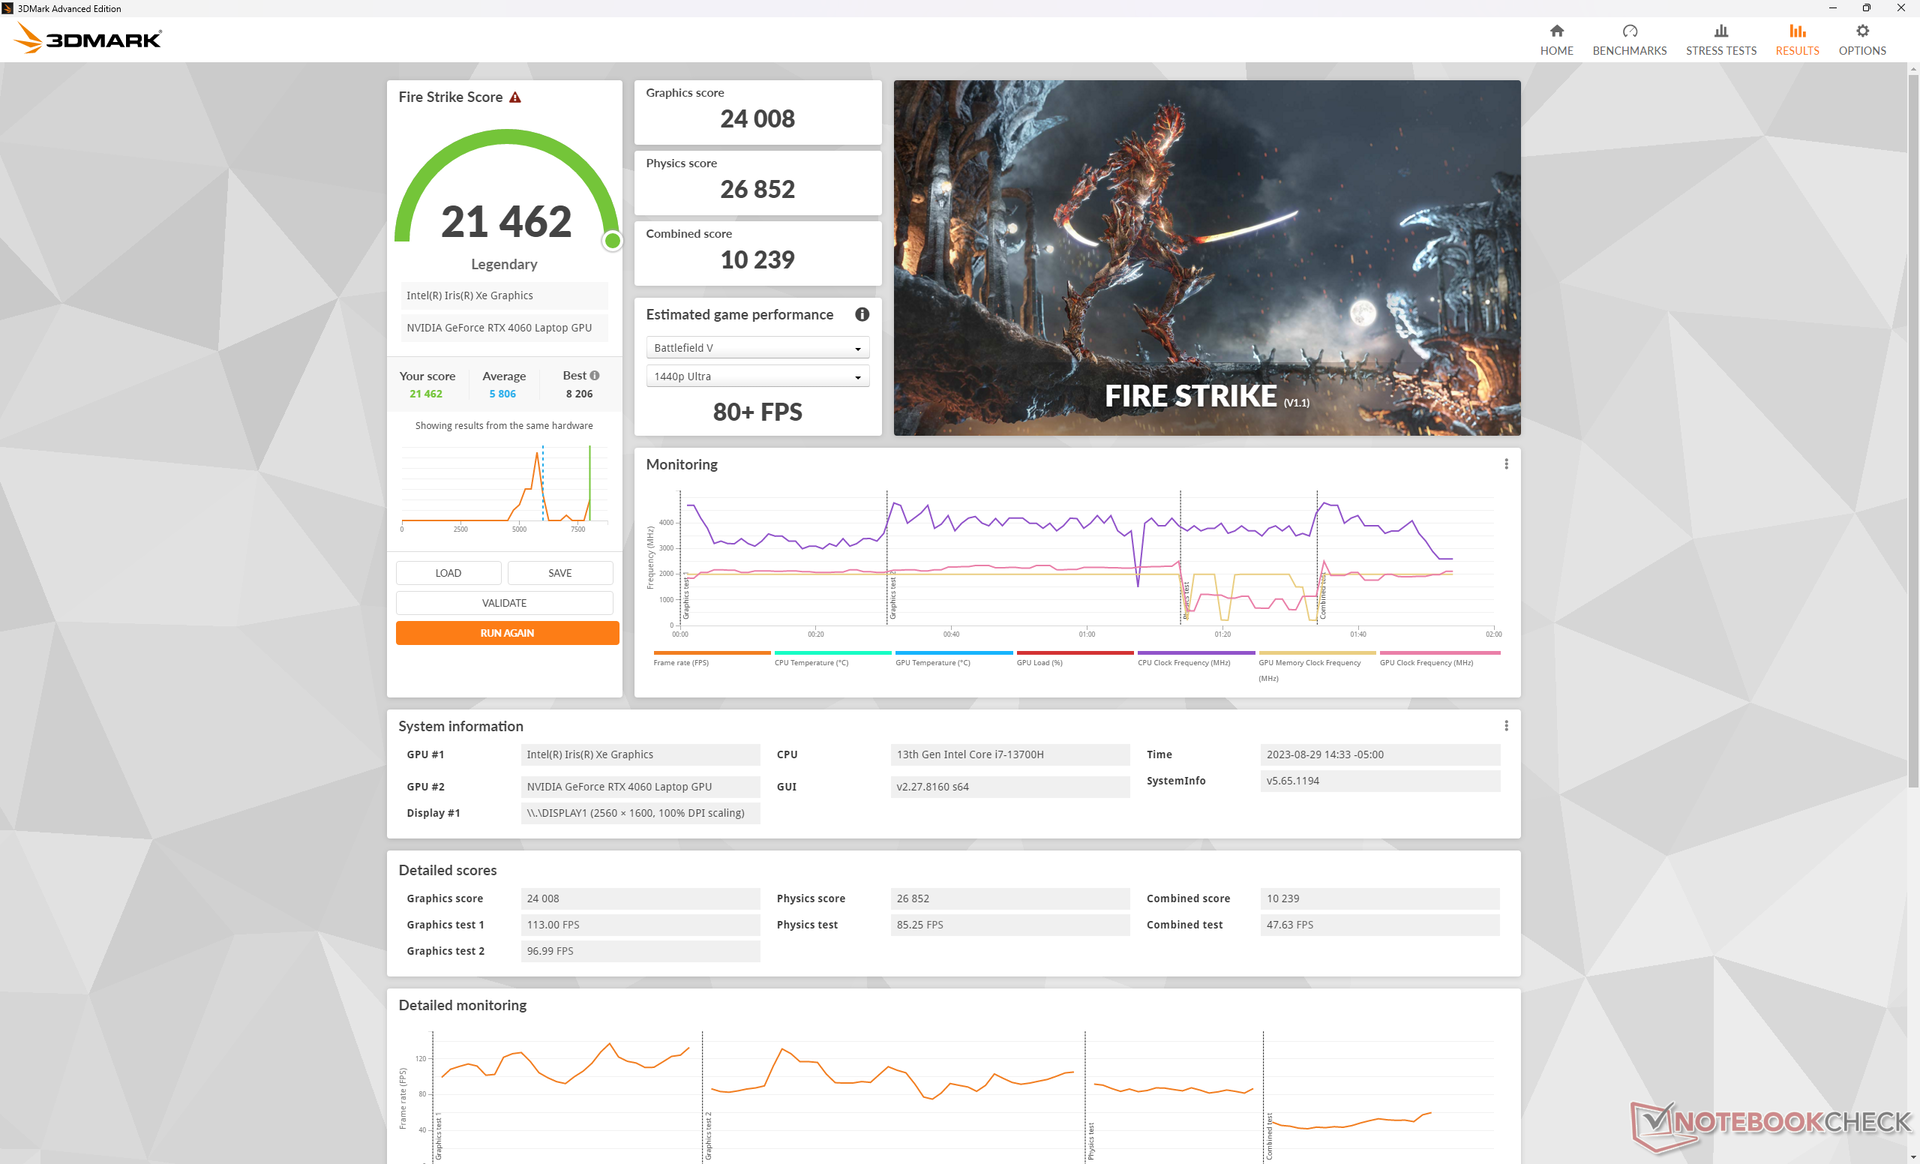
Mudar do modo Desempenho para o modo Equilibrado afeta bastante o desempenho da CPU, enquanto o desempenho da GPU permaneceria praticamente o mesmo, como mostram os resultados do site Fire Strike abaixo. Certifique-se de estar no modo Performance se estiver executando tarefas que exigem muito da CPU.
| Perfil de energia | Pontuação de gráficos | Pontuação de física | Pontuação combinada |
| Energia da bateria | 19574 (-9%) | 10010 (-61%) | 4793 (-46%) |
| Modo equilibrado | 23511 (-2%) | 15963 (-41%) | 8110 (-21%) |
| Modo de desempenho | 24008 | 26852 | 10239 |

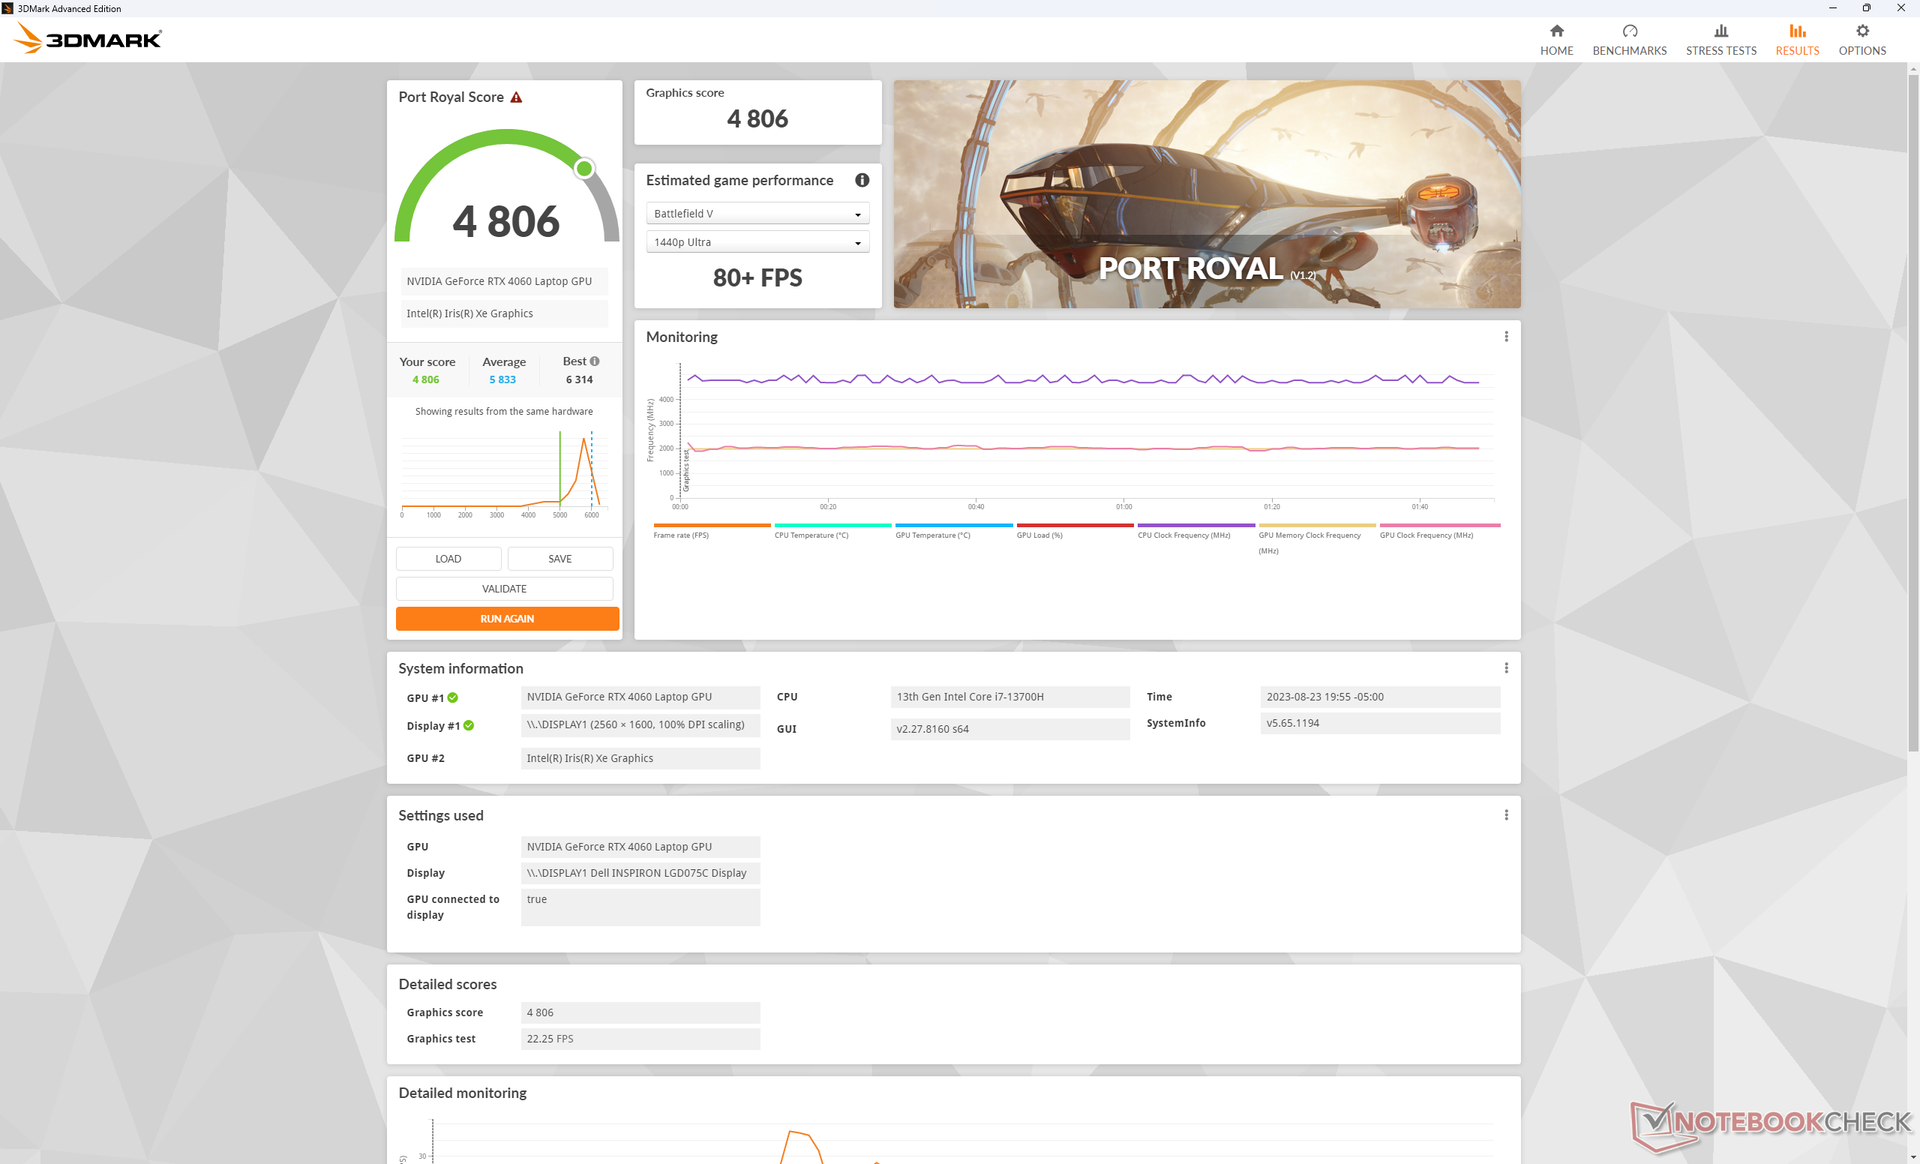
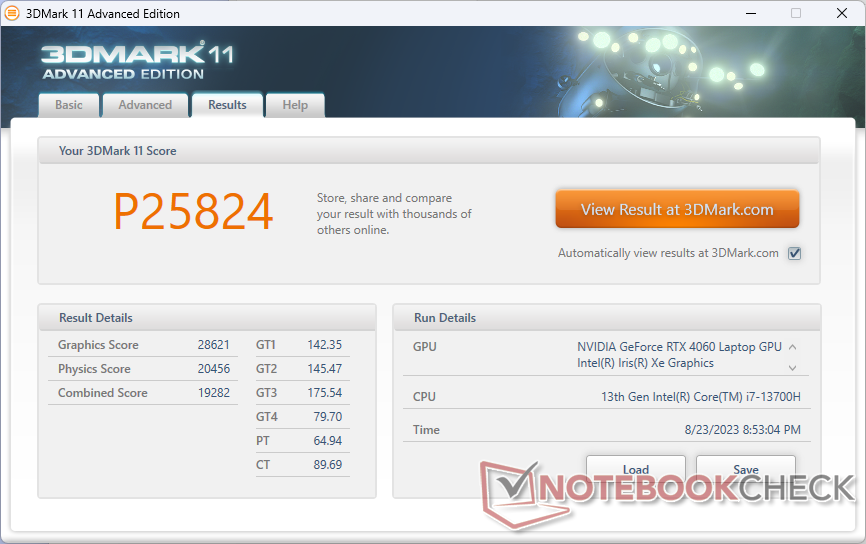
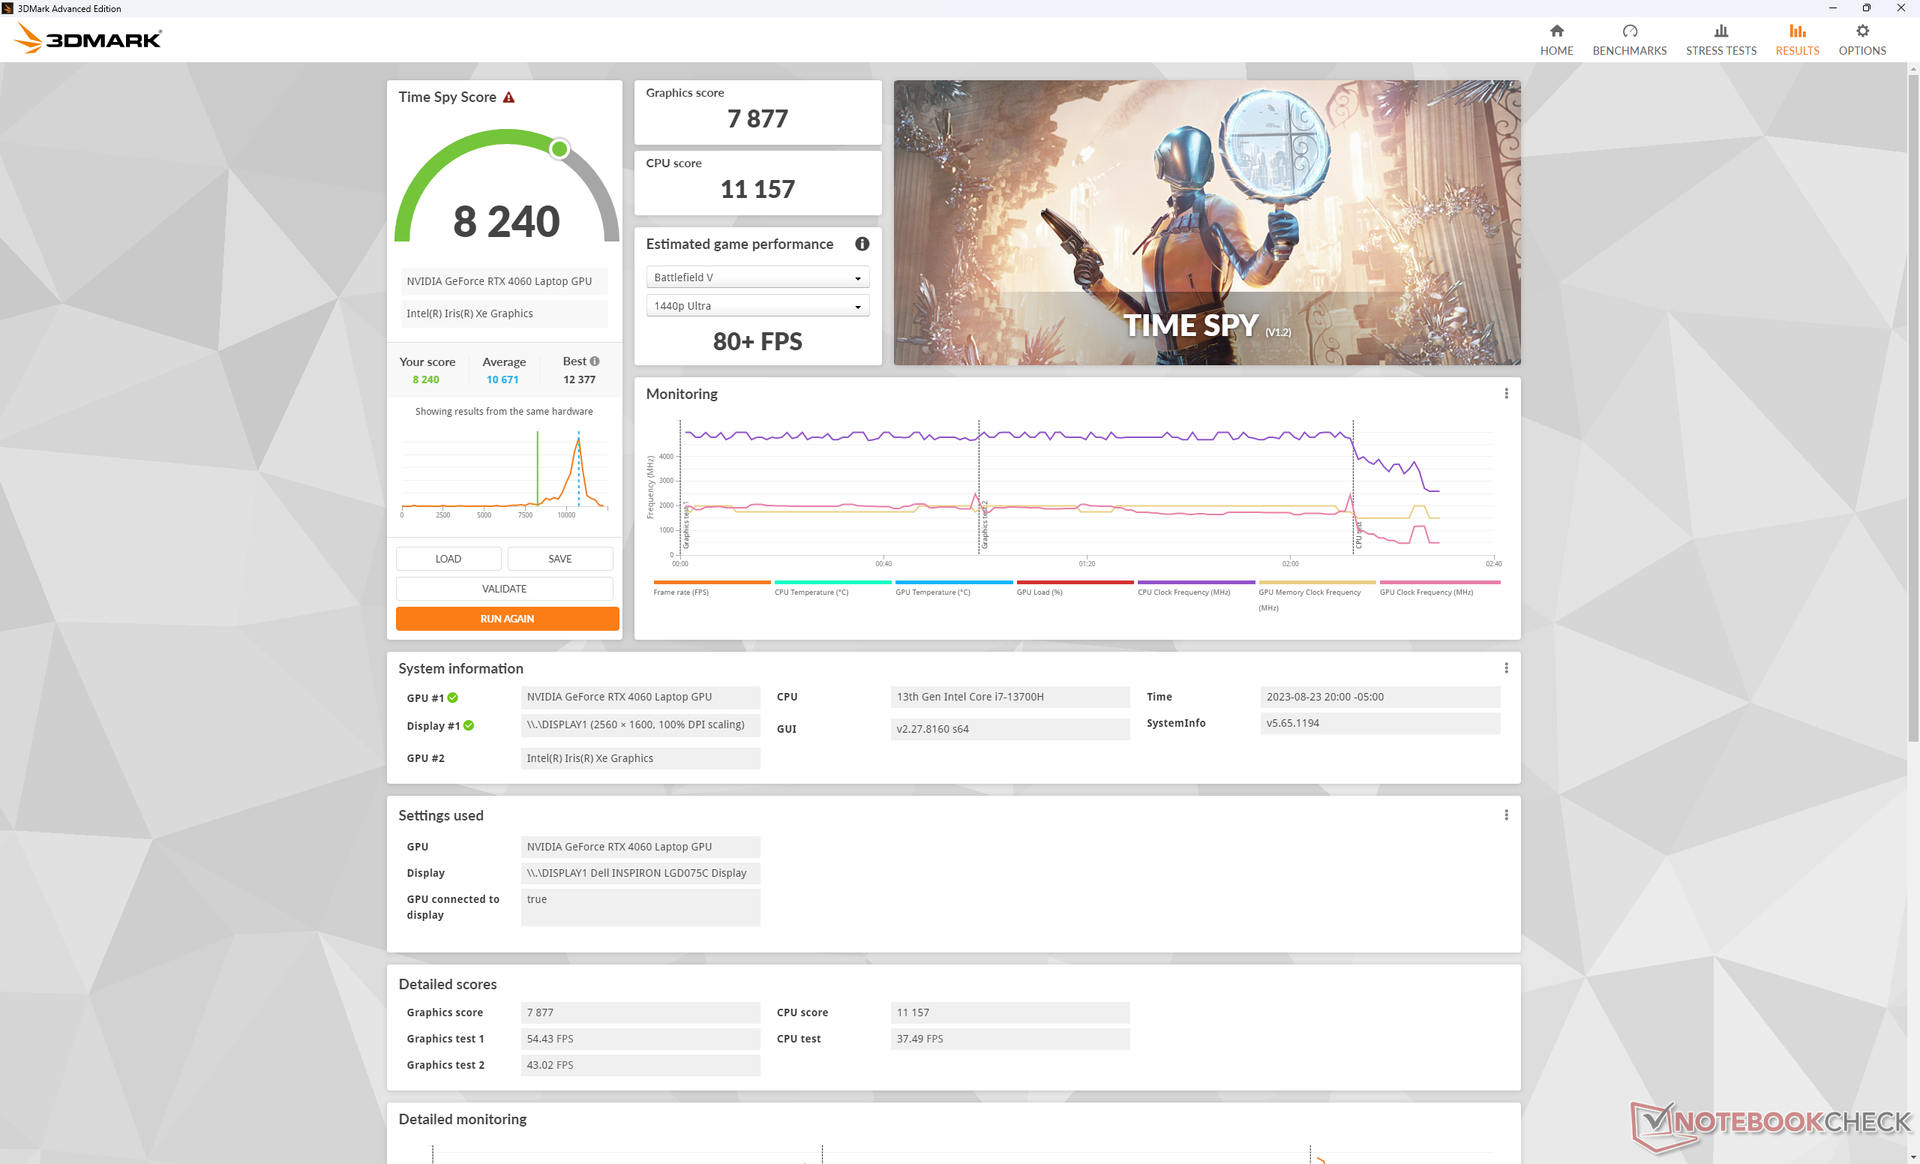
| 3DMark 11 Performance | 25824 pontos | |
| 3DMark Fire Strike Score | 19289 pontos | |
| 3DMark Time Spy Score | 8240 pontos | |
Ajuda | ||
* ... menor é melhor
Desempenho em jogos
Conforme previsto pelos resultados do 3DMark acima, o desempenho geral em jogos está um pouco abaixo da média para um laptop com placa de vídeo RTX 4060. O jogo Tiny Tina's Wonderlands, por exemplo, é executado a 48 FPS nas configurações máximas de 1440p, em comparação com 57 FPS na maioria dos outros notebooks RTX 4060. Infelizmente, o G-Sync não é compatível com a série Inspiron 7630, o que teria suavizado o rompimento de quadros.
Witcher 3 FPS Chart
| baixo | média | alto | ultra | QHD | |
|---|---|---|---|---|---|
| The Witcher 3 (2015) | 409.3 | 275.3 | 169.5 | 90.9 | 68 |
| Dota 2 Reborn (2015) | 184.7 | 166.6 | 157.9 | 146.1 | |
| Final Fantasy XV Benchmark (2018) | 172.2 | 122.2 | 88.9 | 64.4 | |
| X-Plane 11.11 (2018) | 153.5 | 135.7 | 109.7 | ||
| Far Cry 5 (2018) | 133 | 120 | 115 | 103 | 83 |
| Strange Brigade (2018) | 378 | 234 | 185.9 | 161 | 110.9 |
| Cyberpunk 2077 1.6 (2022) | 108.1 | 84.2 | 72.9 | 65.7 | 40.8 |
| Tiny Tina's Wonderlands (2022) | 169.5 | 141.5 | 92.1 | 71.4 | 48 |
| F1 22 (2022) | 205 | 201 | 148.4 | 53.8 | 34.1 |
| Returnal (2023) | 71 | 68 | 63 | 57 | 39 |
Emissões
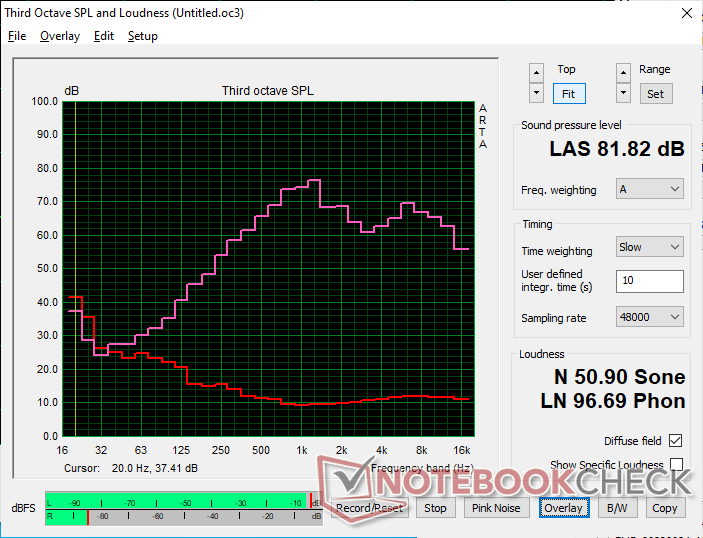
Ruído do sistema - mais silencioso e mais alto do que antes
As ventoinhas internas podem ser silenciosas quando estão em marcha lenta na área de trabalho, mas, na maioria das vezes, ficam em torno de 26 a 28 dB(A) ao executar cargas comuns, como navegadores da Web ou transmissões de vídeo. O que é mais impressionante é que elas podem permanecer relativamente silenciosas por um bom tempo, mesmo quando são introduzidas cargas mais altas, enquanto as ventoinhas do Inspiron 16 Plus 7620 pulsam mais rápida e prontamente. Ao executar o 3DMark 06, por exemplo, o ruído da ventoinha só aumentaria para 35 dB(A) no final da primeira cena de benchmark de 90 segundos.
O ruído da ventoinha aumenta significativamente durante a execução de jogos. Embora o Inspiron 16 Plus 7630 seja, em geral, mais silencioso do que o modelo do ano passado ao executar cargas pouco exigentes, o oposto é verdadeiro ao jogar. O ruído do ventilador chegaria a quase 53 dB(A) ao executar o Witcher 3, em comparação com pouco mais de 49 dB(A) no Inspiron 16 Plus 7620. No entanto, a faixa baixa de 50 dB(A) é comparável à de concorrentes como oSlim Pro 9i 16 ou o Envy 16.
É interessante notar que a alteração do perfil de energia entre os modos Equilibrado e Desempenho não afeta o teto de ruído do ventilador durante os jogos, pois ele ainda atinge o máximo de 52,5 dB(A) em qualquer configuração.
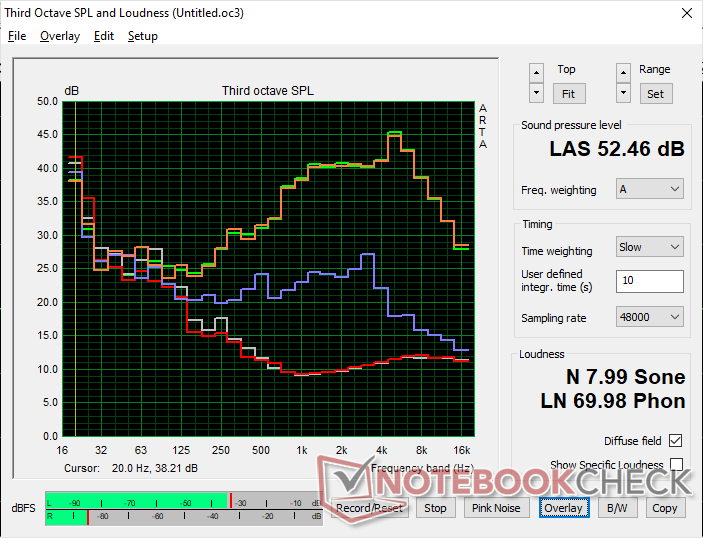
Barulho
| Ocioso |
| 23.2 / 23.2 / 23.2 dB |
| Carga |
| 35.1 / 52.5 dB |
 | ||
30 dB silencioso 40 dB(A) audível 50 dB(A) ruidosamente alto |
||
min: | ||
| Dell Inspiron 16 Plus 7630 GeForce RTX 4060 Laptop GPU, i7-13700H, WD PC SN740 SDDPTQD-1T00 | Dell Inspiron 16 Plus 7620 GeForce RTX 3050 Ti Laptop GPU, i7-12700H, Kioxia BG5 KBG50ZNS512G | Lenovo Slim Pro 9i 16IRP8 GeForce RTX 4050 Laptop GPU, i9-13905H, Samsung PM9A1 MZVL21T0HCLR | Asus Vivobook Pro 16X K6604JV-MX016W GeForce RTX 4060 Laptop GPU, i9-13980HX, Solidigm P41 Plus SSDPFKNU010TZ | HP Envy 16 h0112nr GeForce RTX 3060 Laptop GPU, i7-12700H, Micron 3400 1TB MTFDKBA1T0TFH | MSI Summit E16 Flip A12UDT-031 GeForce RTX 3050 Ti Laptop GPU, i7-1280P, Samsung PM9A1 MZVL22T0HBLB | |
|---|---|---|---|---|---|---|
| Noise | -11% | 1% | -21% | -6% | -14% | |
| desligado / ambiente * (dB) | 23.2 | 23.3 -0% | 22.7 2% | 25.2 -9% | 22.8 2% | 25 -8% |
| Idle Minimum * (dB) | 23.2 | 25.7 -11% | 22.7 2% | 26.6 -15% | 22.9 1% | 25 -8% |
| Idle Average * (dB) | 23.2 | 26.1 -13% | 22.7 2% | 26.6 -15% | 22.9 1% | 25 -8% |
| Idle Maximum * (dB) | 23.2 | 30.6 -32% | 27.5 -19% | 29.2 -26% | 30.5 -31% | 28.9 -25% |
| Load Average * (dB) | 35.1 | 46.2 -32% | 28.9 18% | 53.4 -52% | 41.4 -18% | 49.3 -40% |
| Witcher 3 ultra * (dB) | 52.5 | 49.2 6% | 52.6 -0% | 51.1 3% | ||
| Load Maximum * (dB) | 52.5 | 49.4 6% | 52.5 -0% | 56.9 -8% | 51.4 2% | 48.2 8% |
* ... menor é melhor
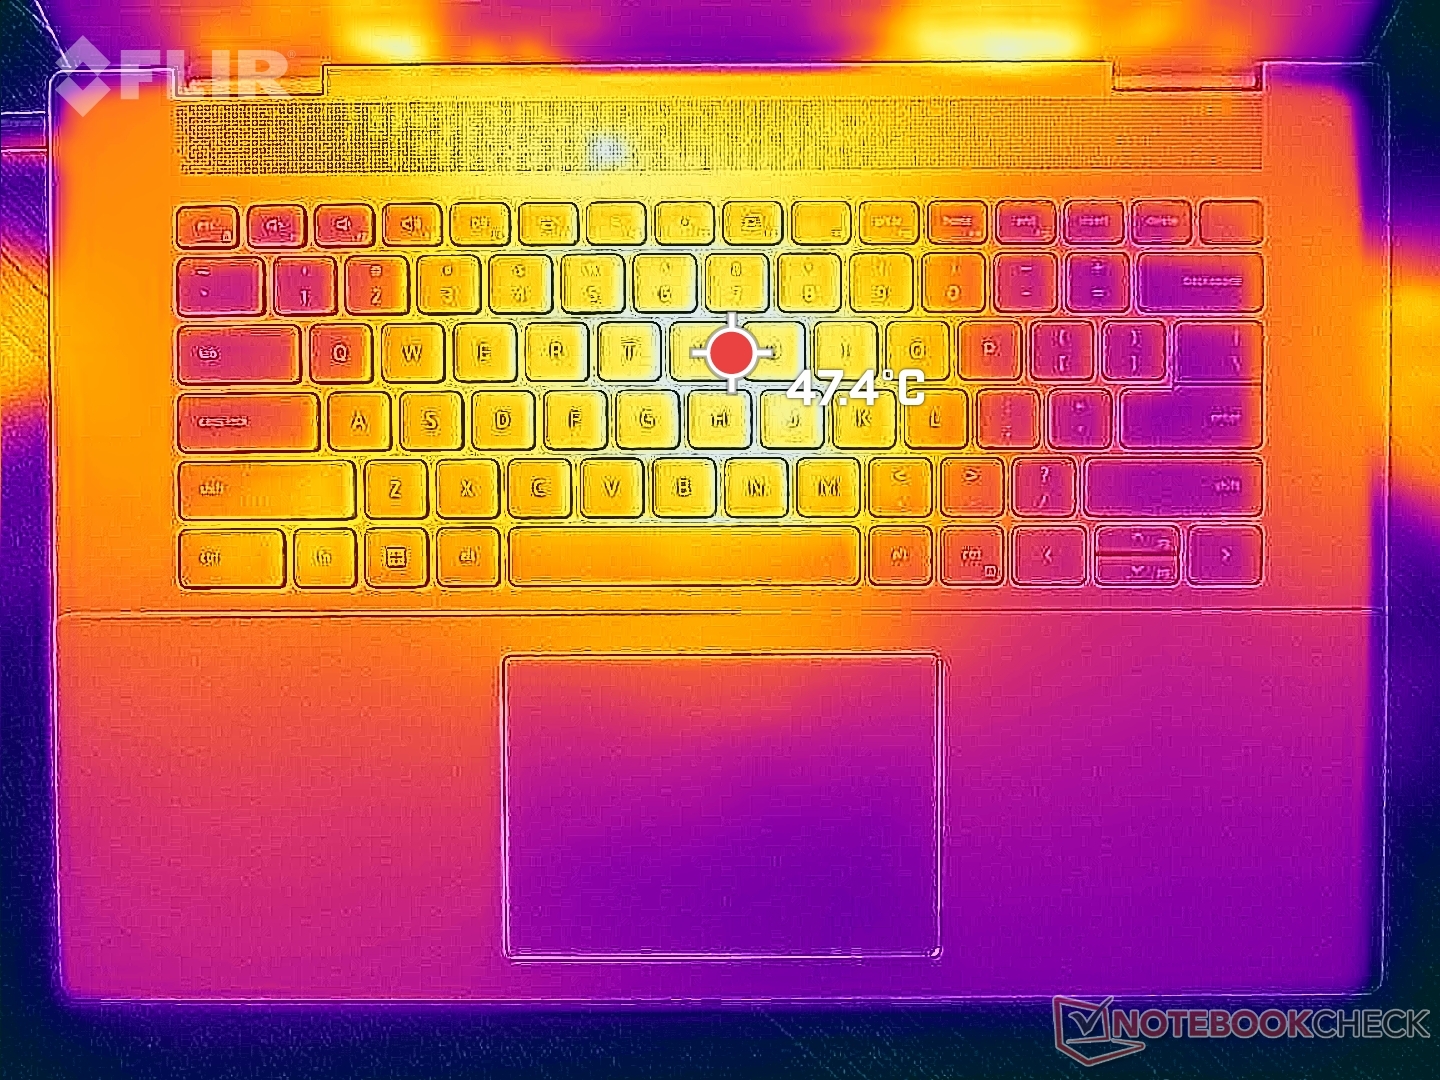
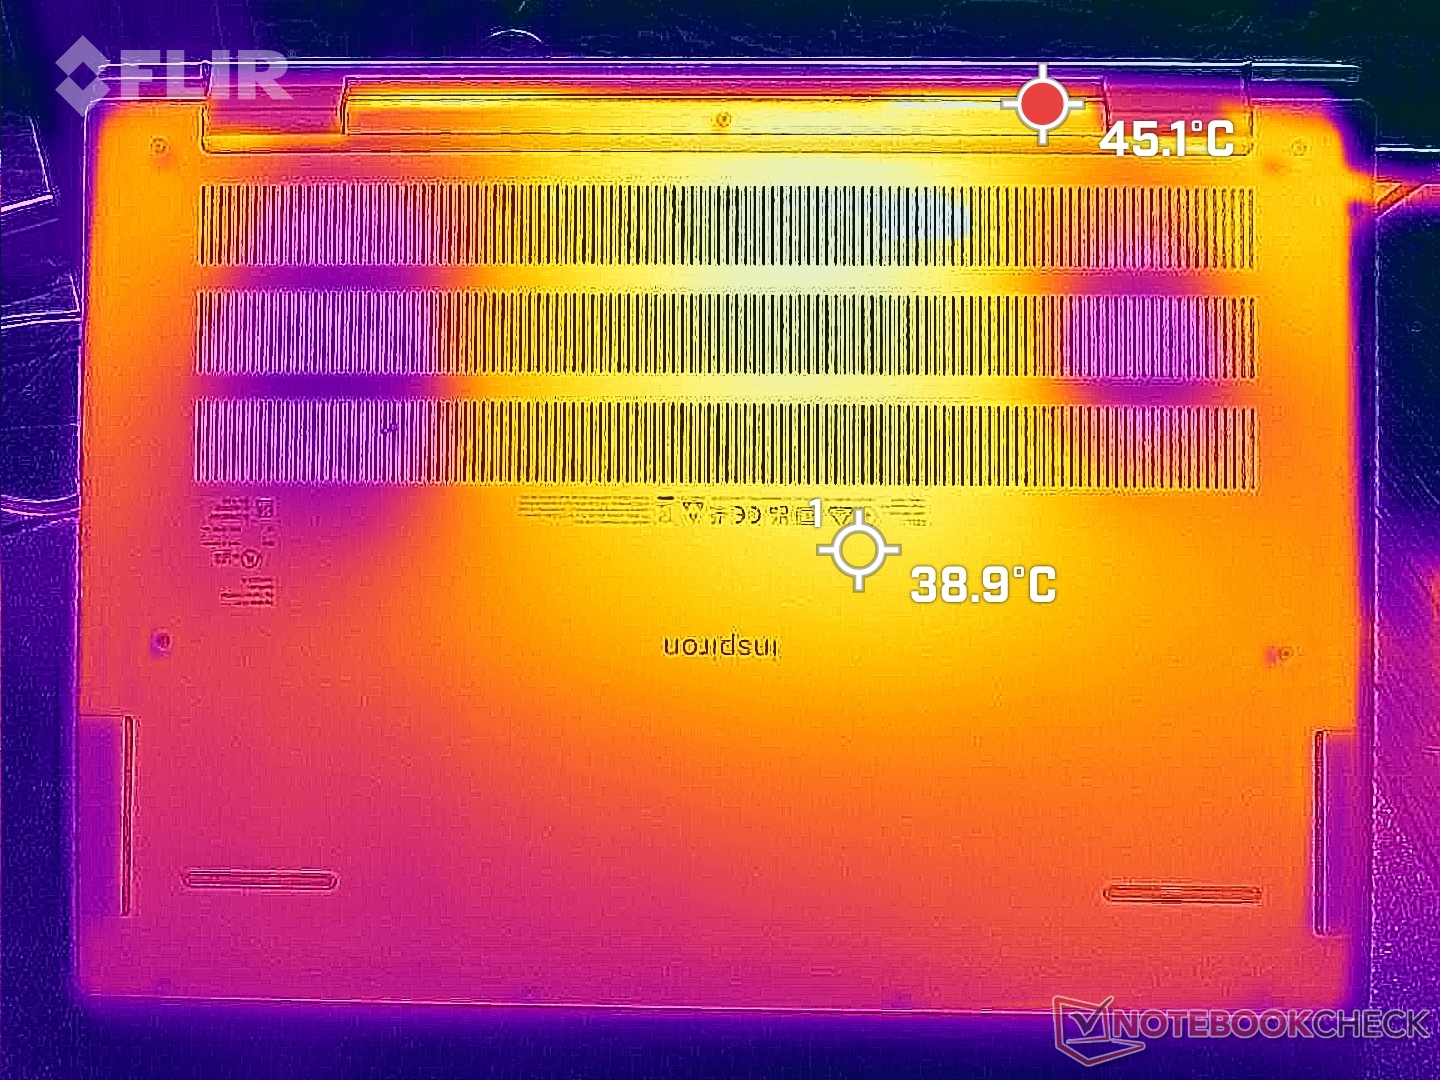
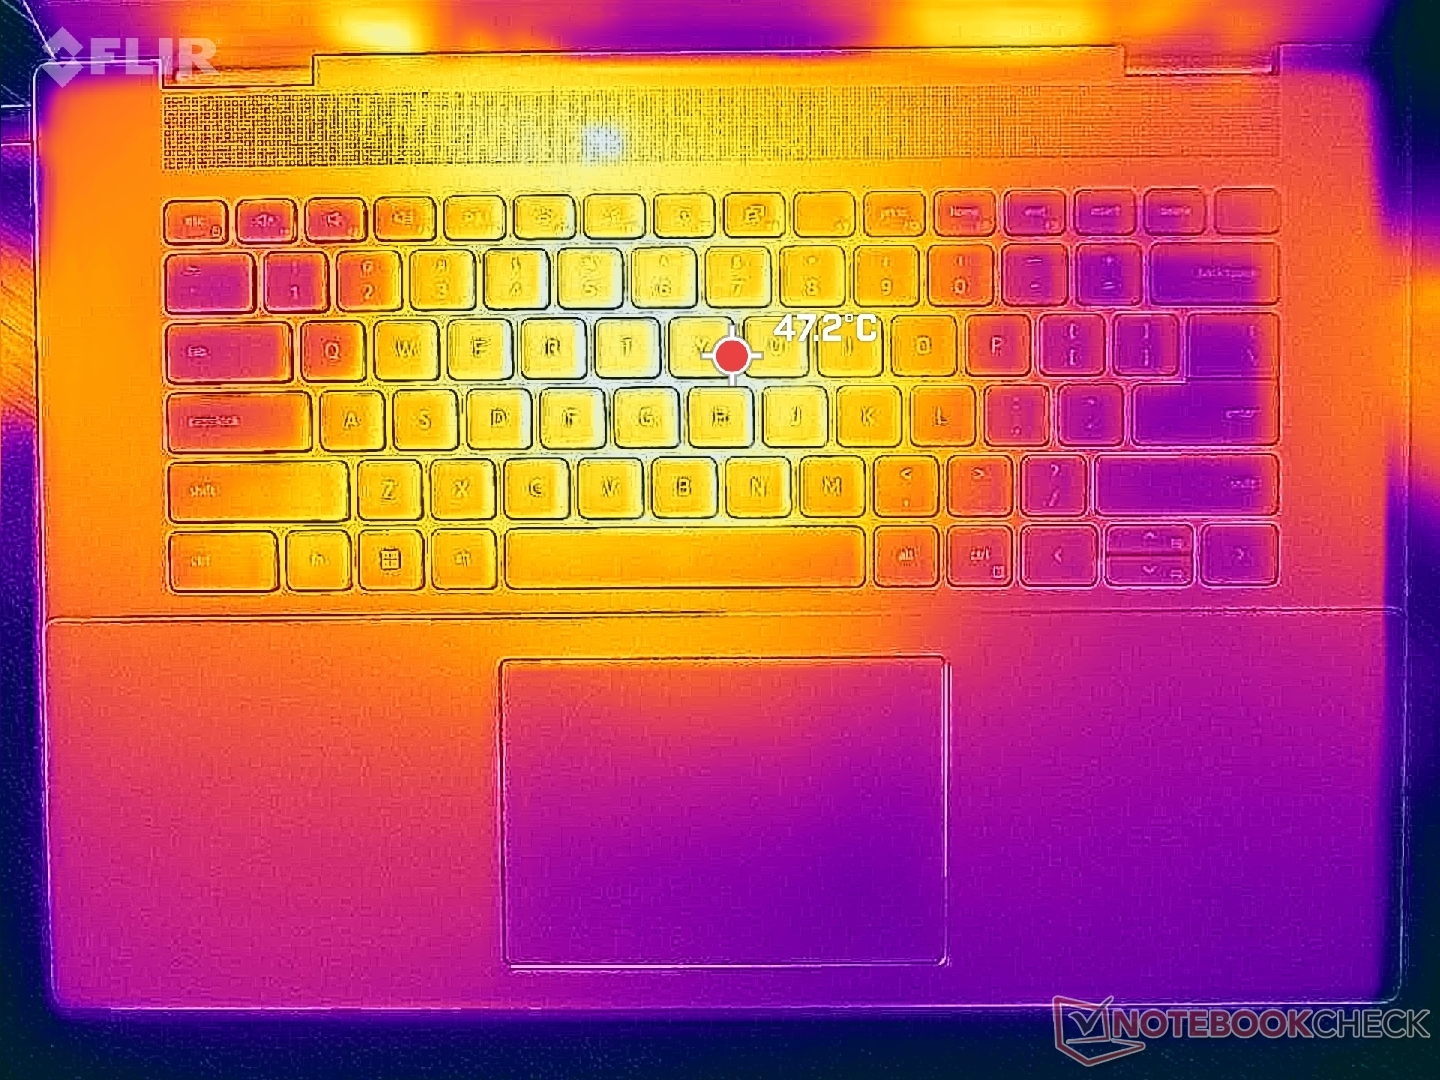
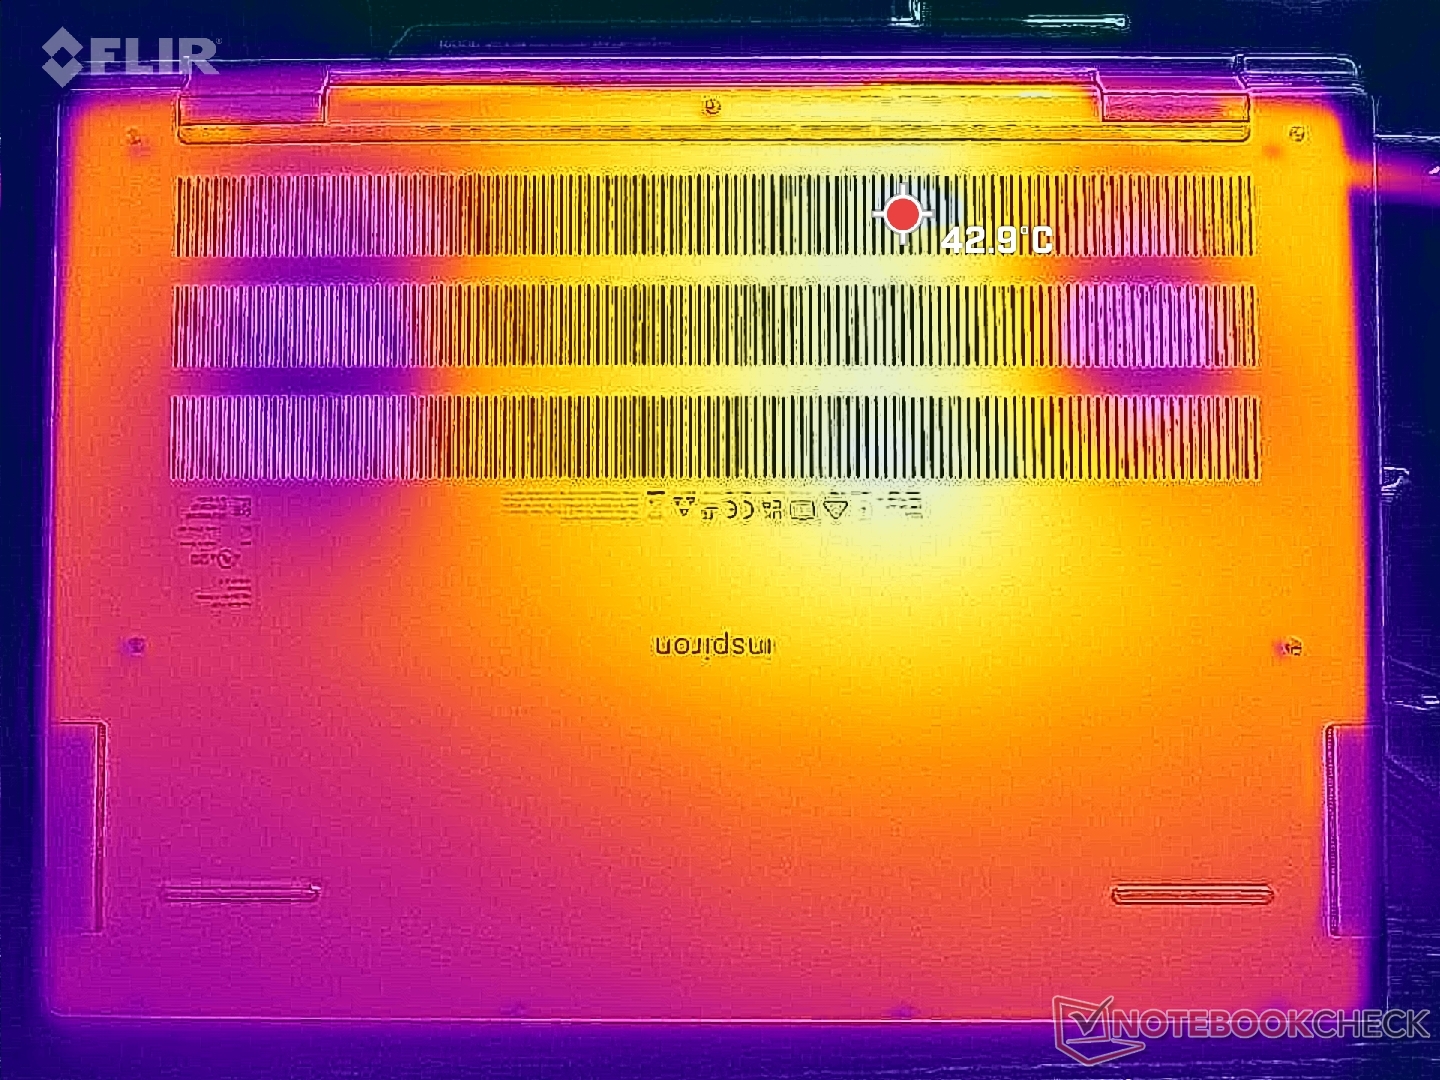
Temperatura
As temperaturas da superfície ao executar cargas exigentes, como jogos, são mais quentes do que o esperado. Os pontos quentes na parte superior e inferior podem chegar a 48 °C e 43 °C, respectivamente, perto do centro do teclado. Os apoios para as mãos também podem esquentar muito, chegando a 37 °C, em comparação com apenas 31 °C noAsus Vivobook Pro 16X ou no HP Envy 16. Isso certamente aquece mais as mãos quando comparado a outros laptops.
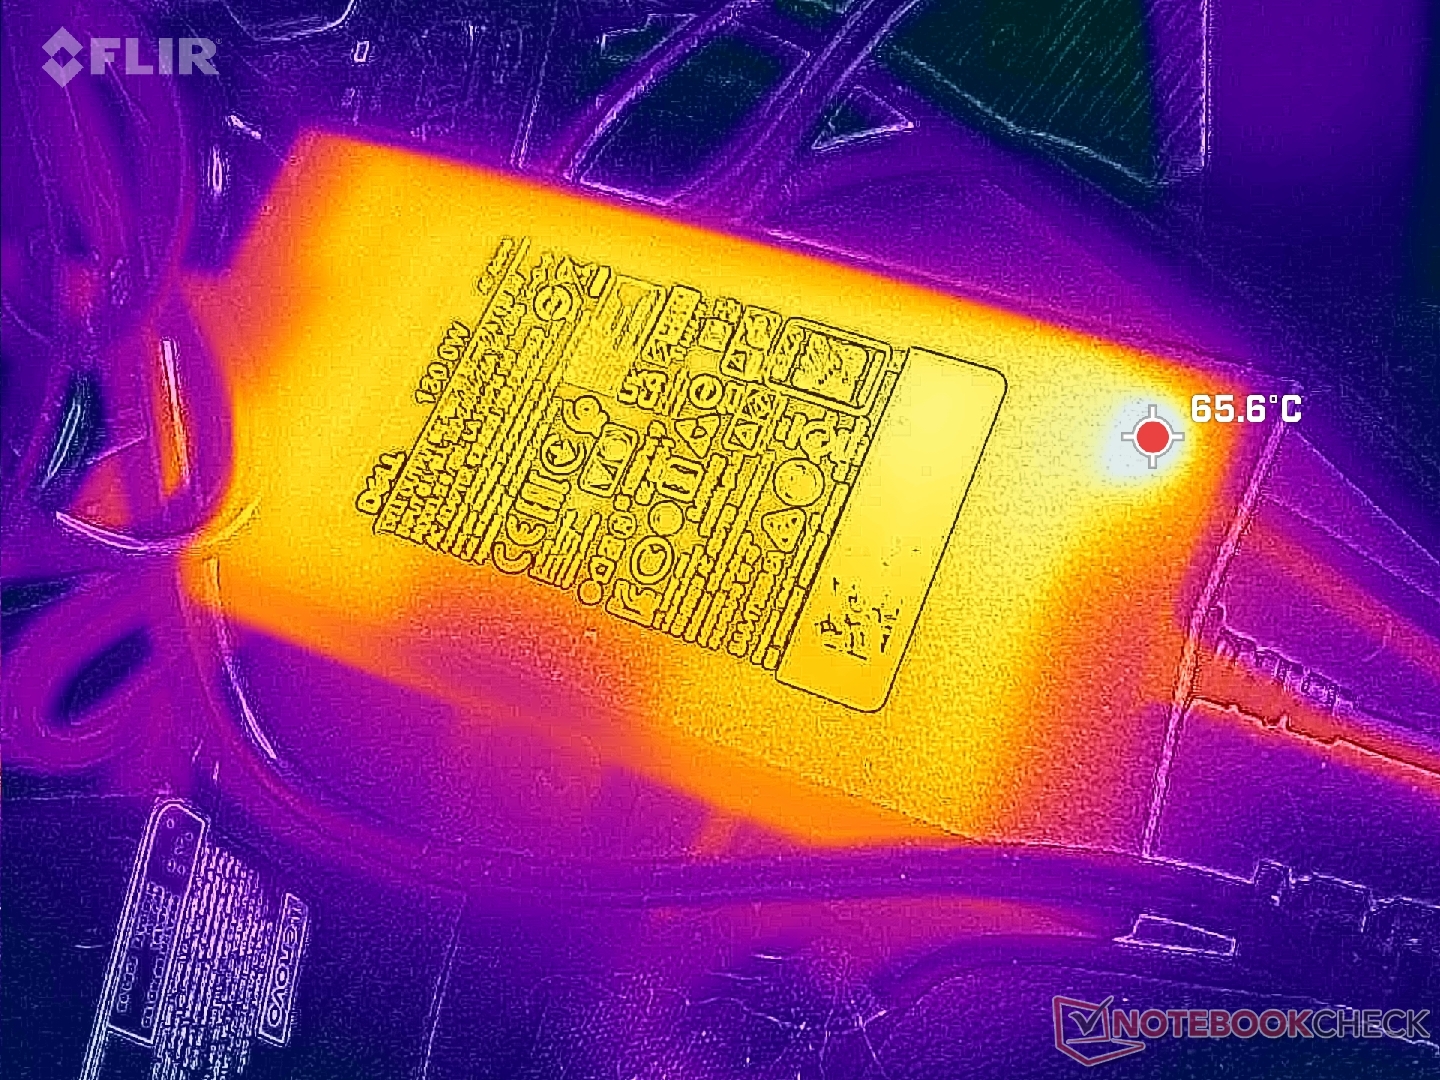
Além disso, o adaptador CA é visivelmente mais quente do que a média, com mais de 65 °C. Você deve deixar um amplo espaço para o adaptador CA, por precaução.
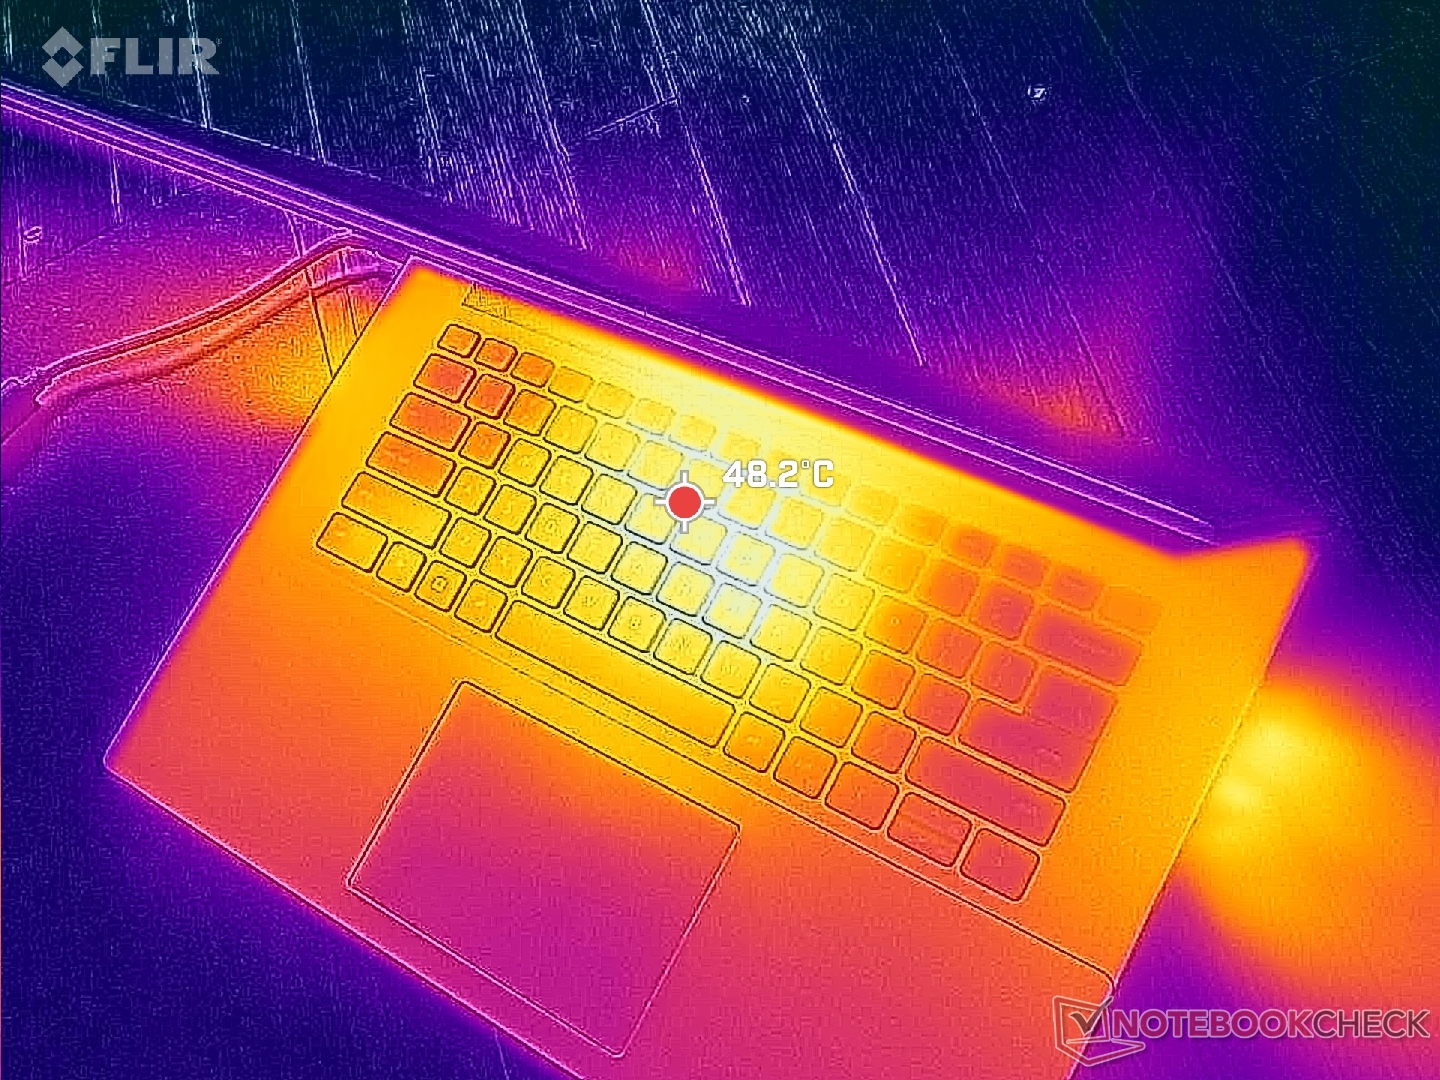
(-) A temperatura máxima no lado superior é 47.8 °C / 118 F, em comparação com a média de 36.8 °C / 98 F , variando de 21 a 71 °C para a classe Multimedia.
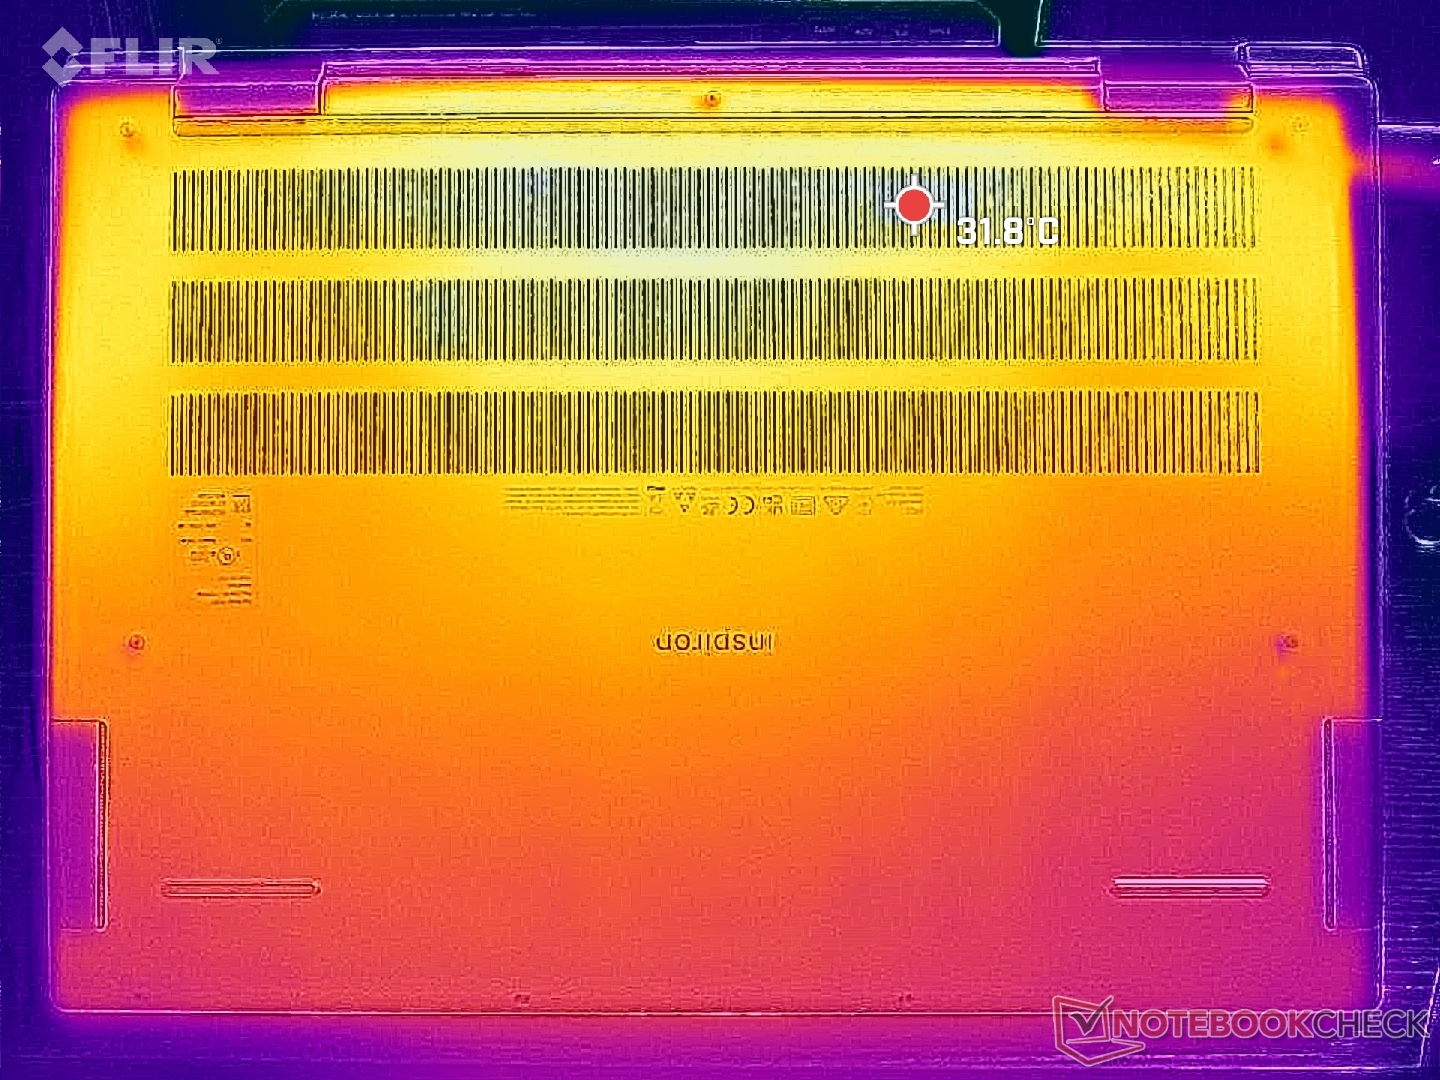
(±) A parte inferior aquece até um máximo de 42.2 °C / 108 F, em comparação com a média de 39.1 °C / 102 F
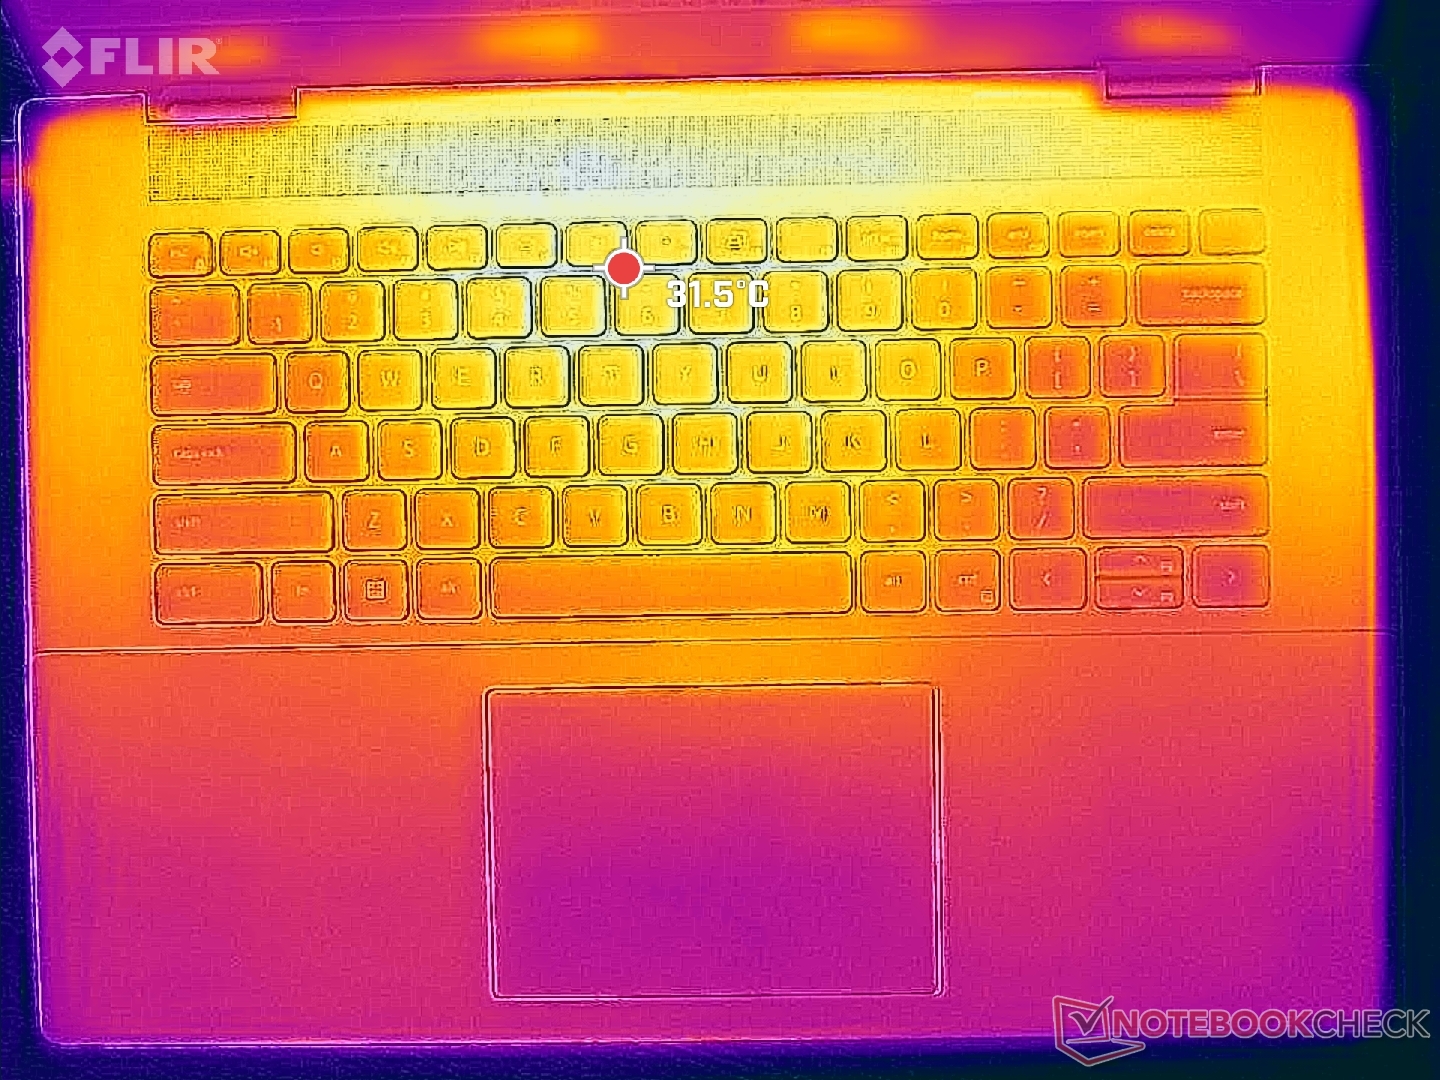
(±) Em uso inativo, a temperatura média para o lado superior é 32 °C / 90 F, em comparação com a média do dispositivo de 31.3 °C / ### class_avg_f### F.
(-) Jogando The Witcher 3, a temperatura média para o lado superior é 40.6 °C / 105 F, em comparação com a média do dispositivo de 31.3 °C / ## #class_avg_f### F.
(±) Os apoios para as mãos e o touchpad podem ficar muito quentes ao toque, com um máximo de 36.6 °C / 97.9 F.
(-) A temperatura média da área do apoio para as mãos de dispositivos semelhantes foi 28.7 °C / 83.7 F (-7.9 °C / -14.2 F).
| Dell Inspiron 16 Plus 7630 Intel Core i7-13700H, NVIDIA GeForce RTX 4060 Laptop GPU | Dell Inspiron 16 Plus 7620 Intel Core i7-12700H, NVIDIA GeForce RTX 3050 Ti Laptop GPU | Lenovo Slim Pro 9i 16IRP8 Intel Core i9-13905H, NVIDIA GeForce RTX 4050 Laptop GPU | Asus Vivobook Pro 16X K6604JV-MX016W Intel Core i9-13980HX, NVIDIA GeForce RTX 4060 Laptop GPU | HP Envy 16 h0112nr Intel Core i7-12700H, NVIDIA GeForce RTX 3060 Laptop GPU | MSI Summit E16 Flip A12UDT-031 Intel Core i7-1280P, NVIDIA GeForce RTX 3050 Ti Laptop GPU | |
|---|---|---|---|---|---|---|
| Heat | 6% | 10% | -3% | 3% | 2% | |
| Maximum Upper Side * (°C) | 47.8 | 46 4% | 37.8 21% | 39.7 17% | 45.2 5% | 49.2 -3% |
| Maximum Bottom * (°C) | 42.2 | 45.8 -9% | 44.8 -6% | 60 -42% | 44 -4% | 50.2 -19% |
| Idle Upper Side * (°C) | 35.2 | 29.2 17% | 30.6 13% | 30.9 12% | 33.6 5% | 29.4 16% |
| Idle Bottom * (°C) | 35 | 31 11% | 31 11% | 34.7 1% | 32.6 7% | 30 14% |
* ... menor é melhor
Teste de estresse
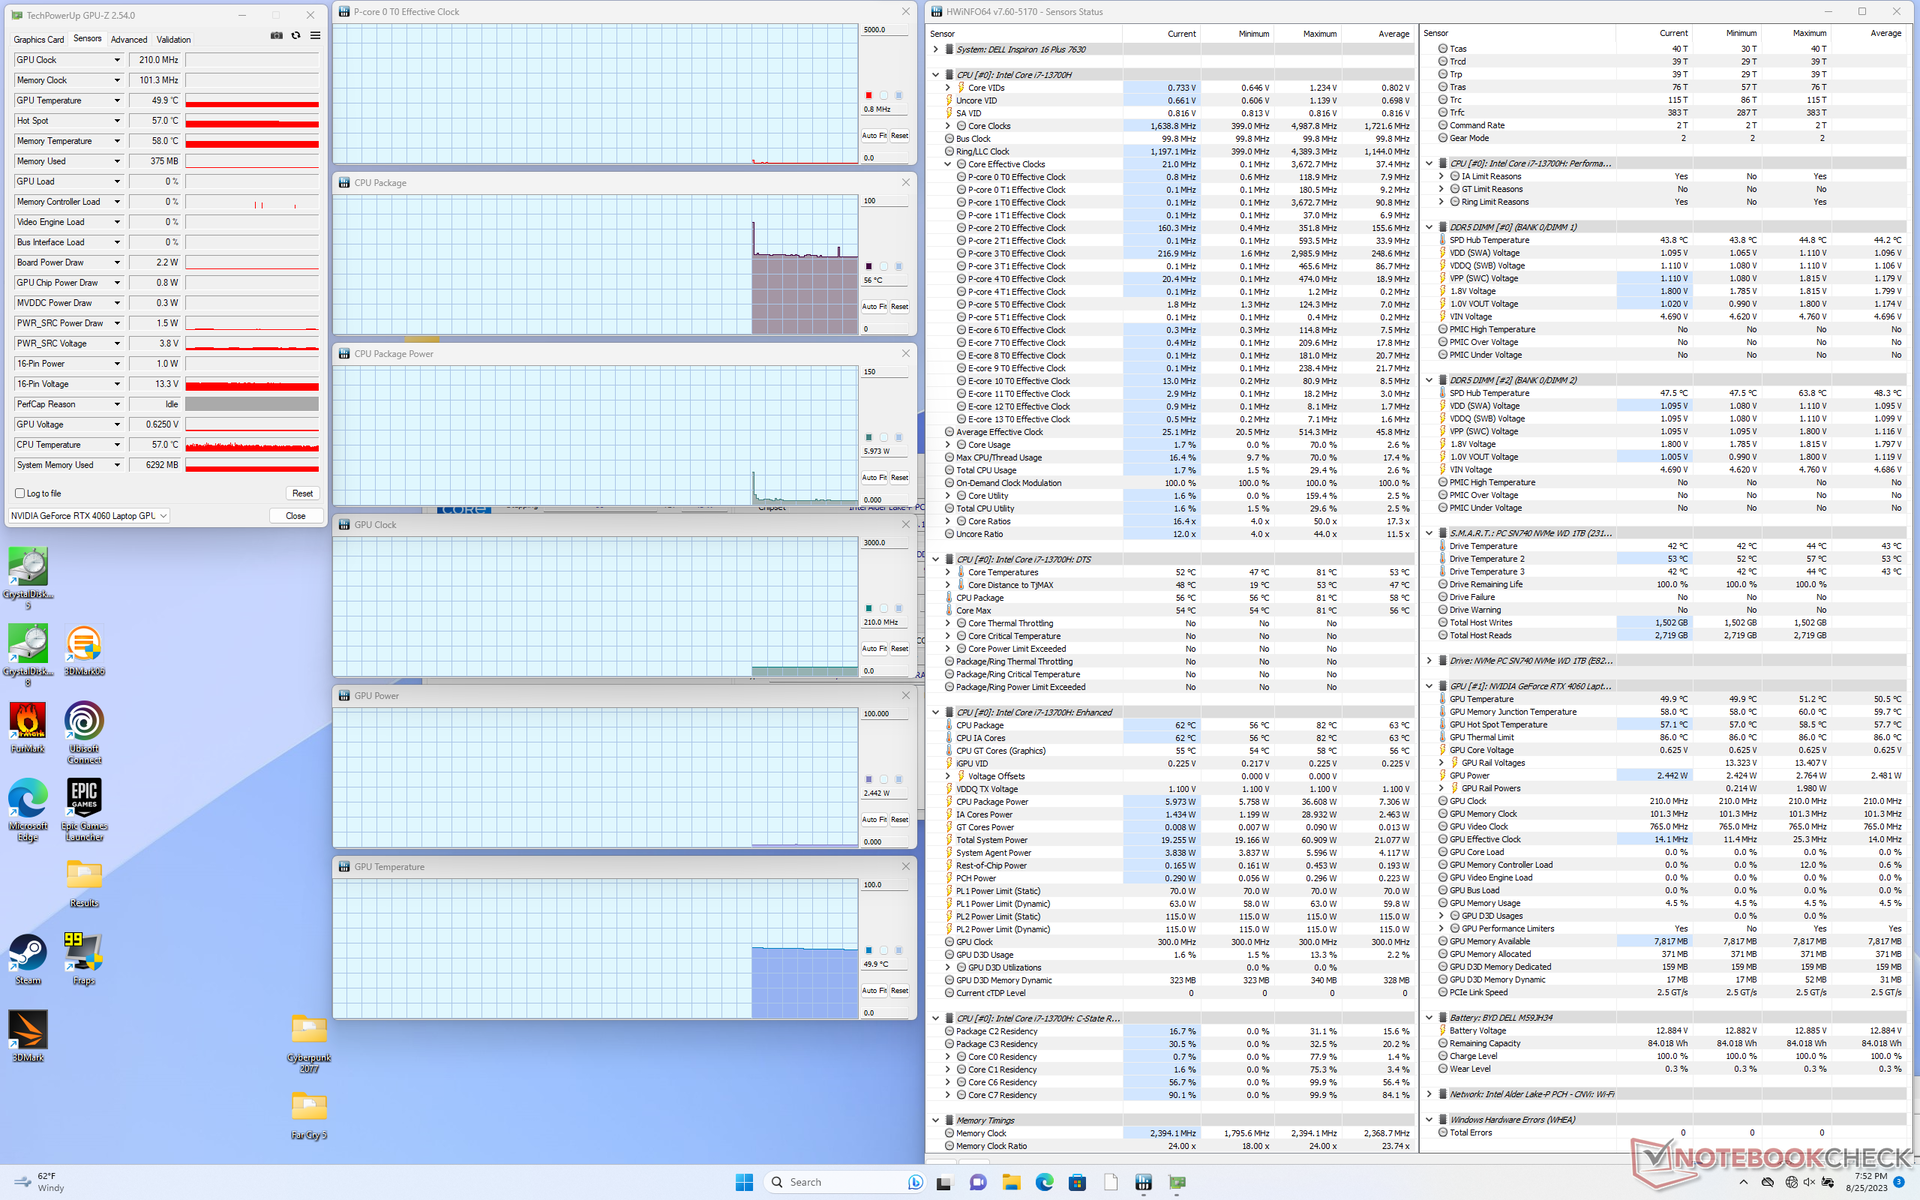
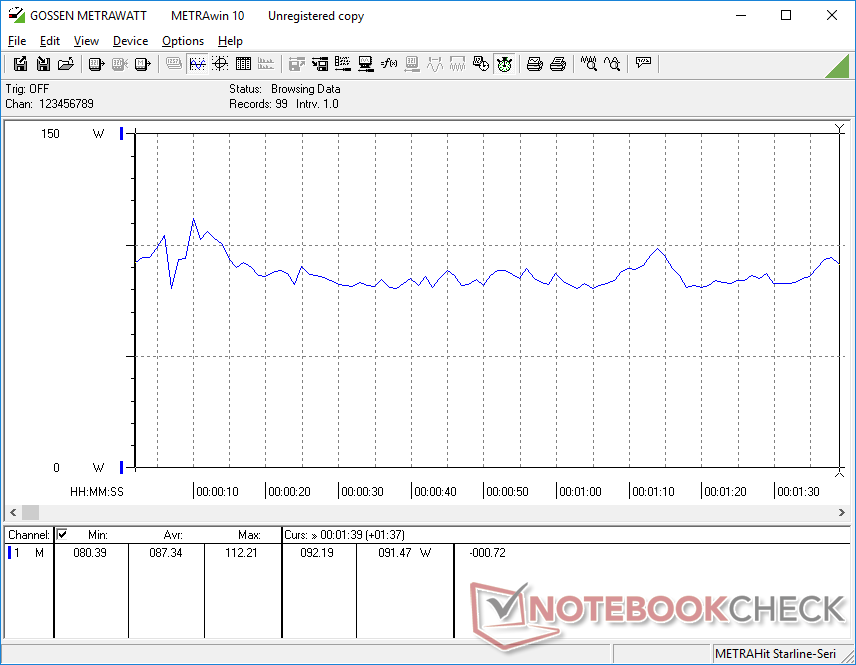
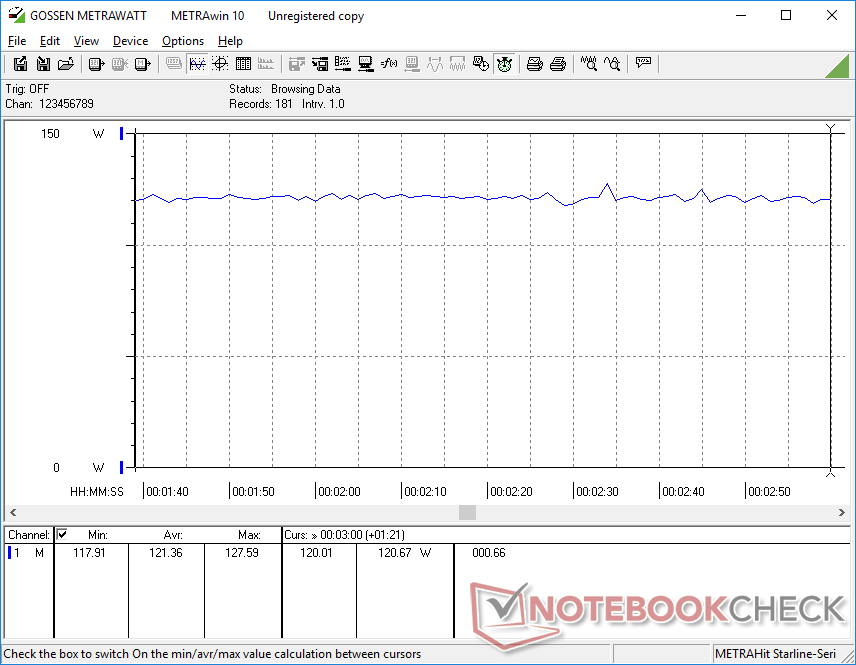
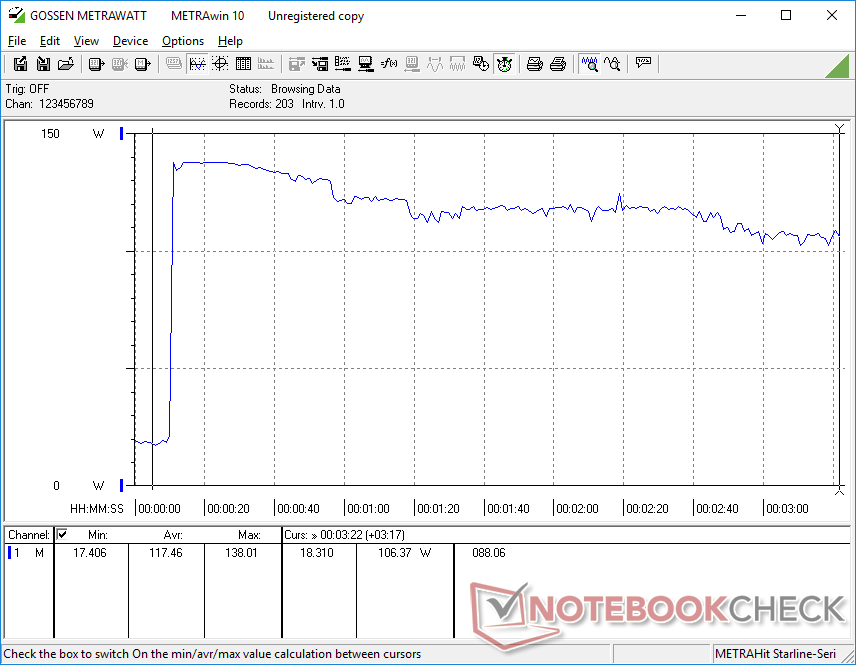
Ao executar o Prime95, a CPU aumentava para 3,4 GHz, 89 W e 100 °C por apenas alguns segundos antes de se estabilizar em cerca de 2,3 GHz e 50 W para manter uma temperatura de núcleo mais razoável de 84 °C. O modelo do ano passado também se estabilizava em torno dos mesmos valores ao executar o mesmo teste.
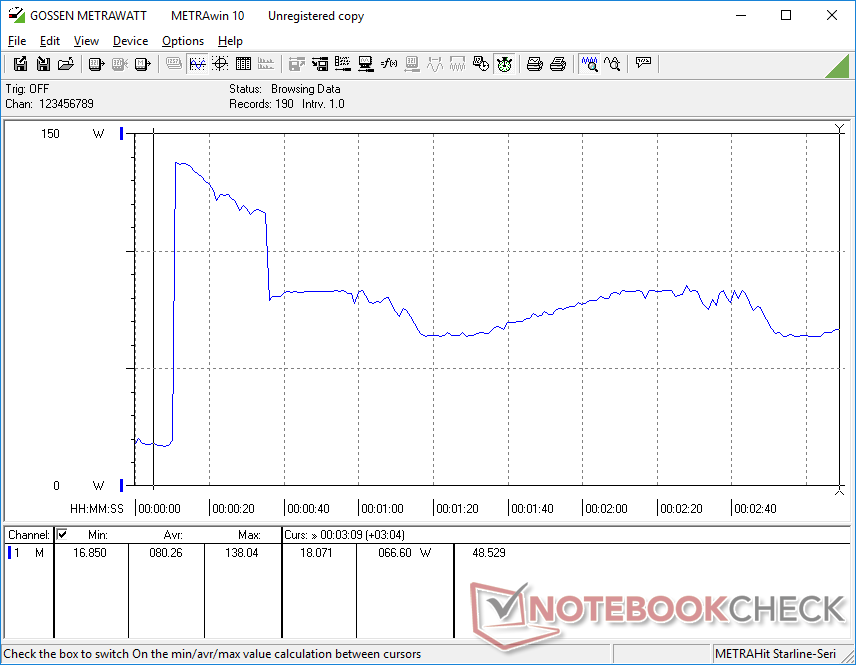
Ao executar Witcher 3 no modo Performance para representar cargas típicas de jogos, a GPU da Nvidia se estabilizaria em 2235 MHz, 71 C e 69 W, de acordo com o HWiNFO. A redução para o modo Balanced não afeta significativamente esses valores, o que se alinha com nossas observações do site Fire Strike acima. É interessante notar que as temperaturas do núcleo seriam muito mais baixas do que as registradas no Inspiron 16 Plus 7620 ao executar o mesmo jogo, provavelmente devido ao ruído mais alto da ventoinha e às melhorias gerais na solução de resfriamento.
Observe que, embora o HWiNFO informe um consumo de energia da GPU de 69 W durante os jogos, a Dell anuncia uma potência de GPU de apenas 60 W. O Painel de Controle da Nvidia informa uma potência de GPU alvo de 70 W.
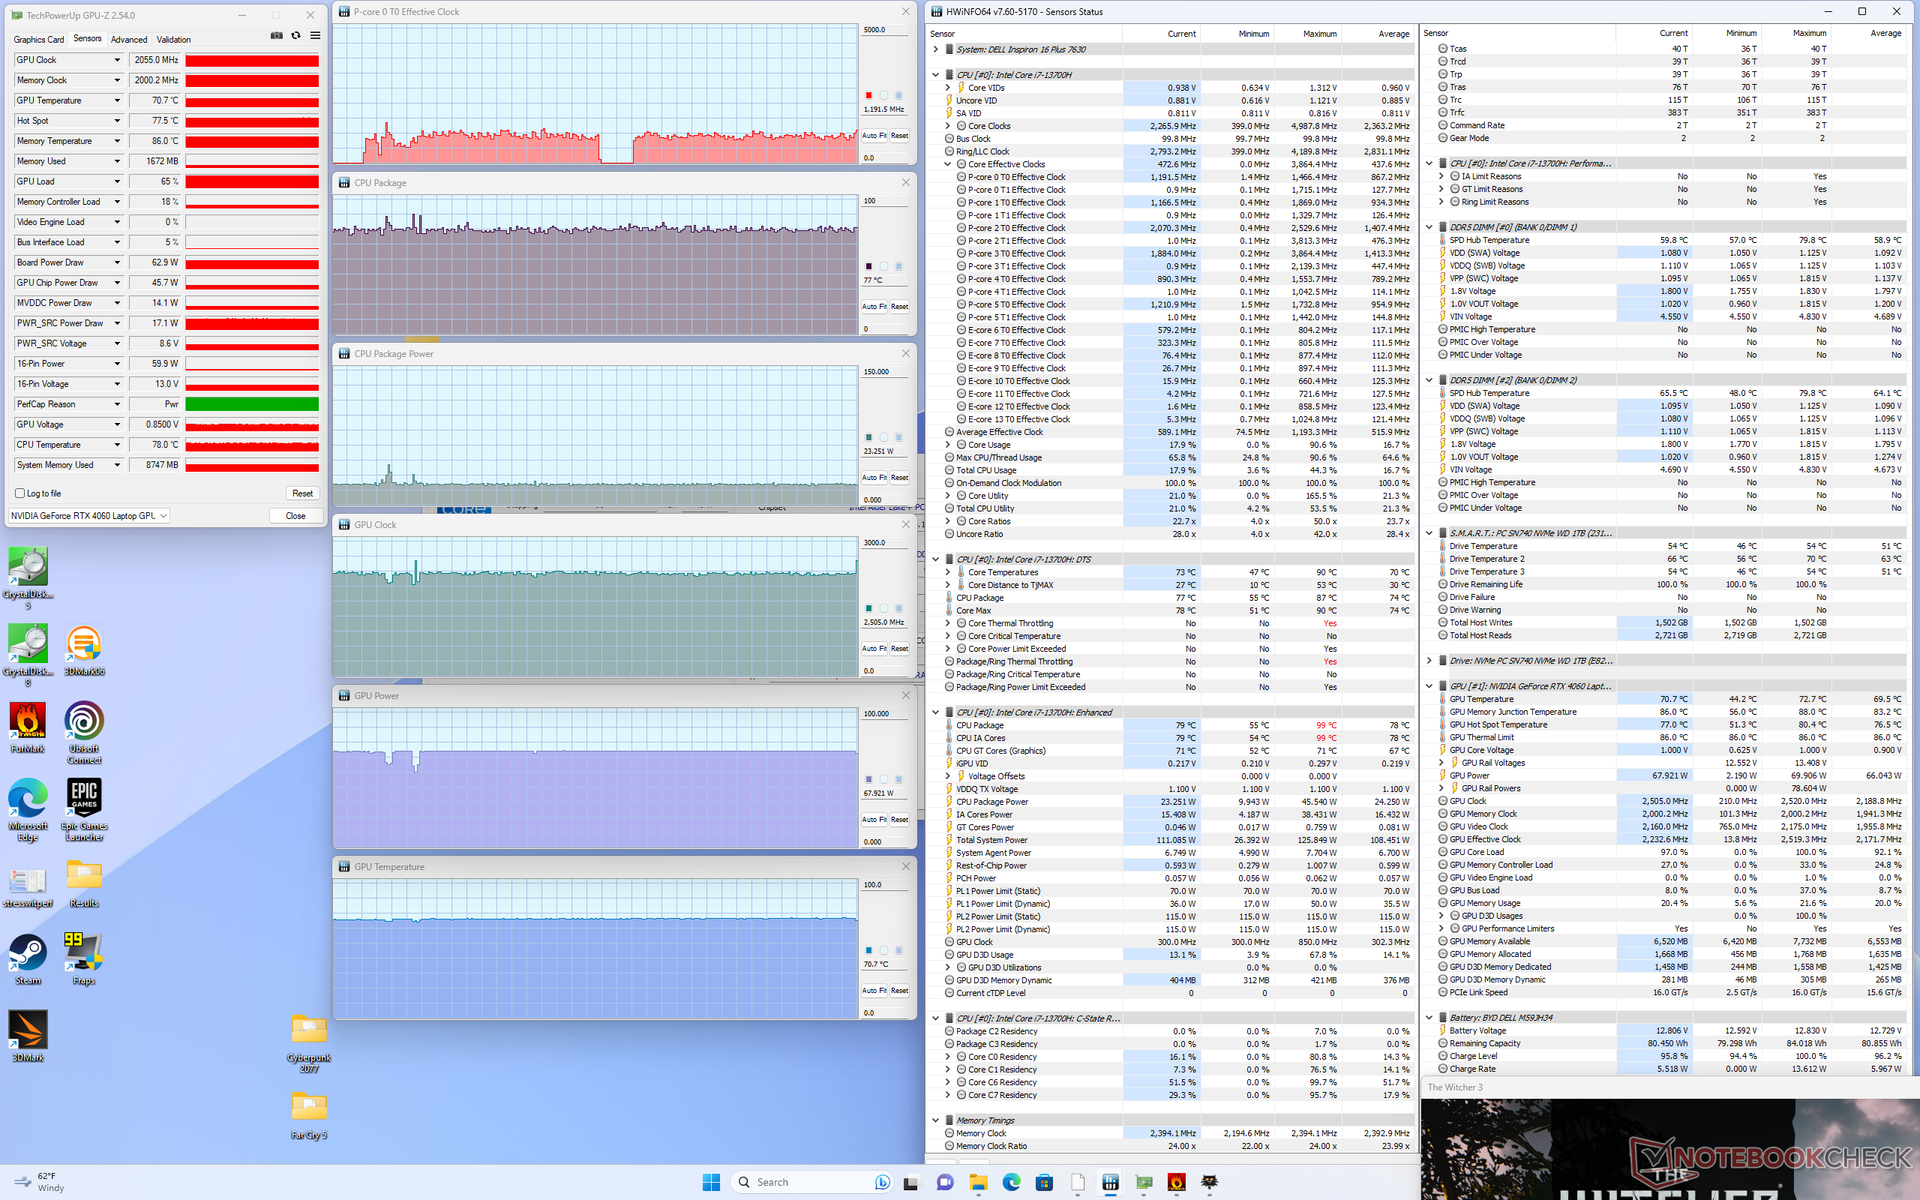
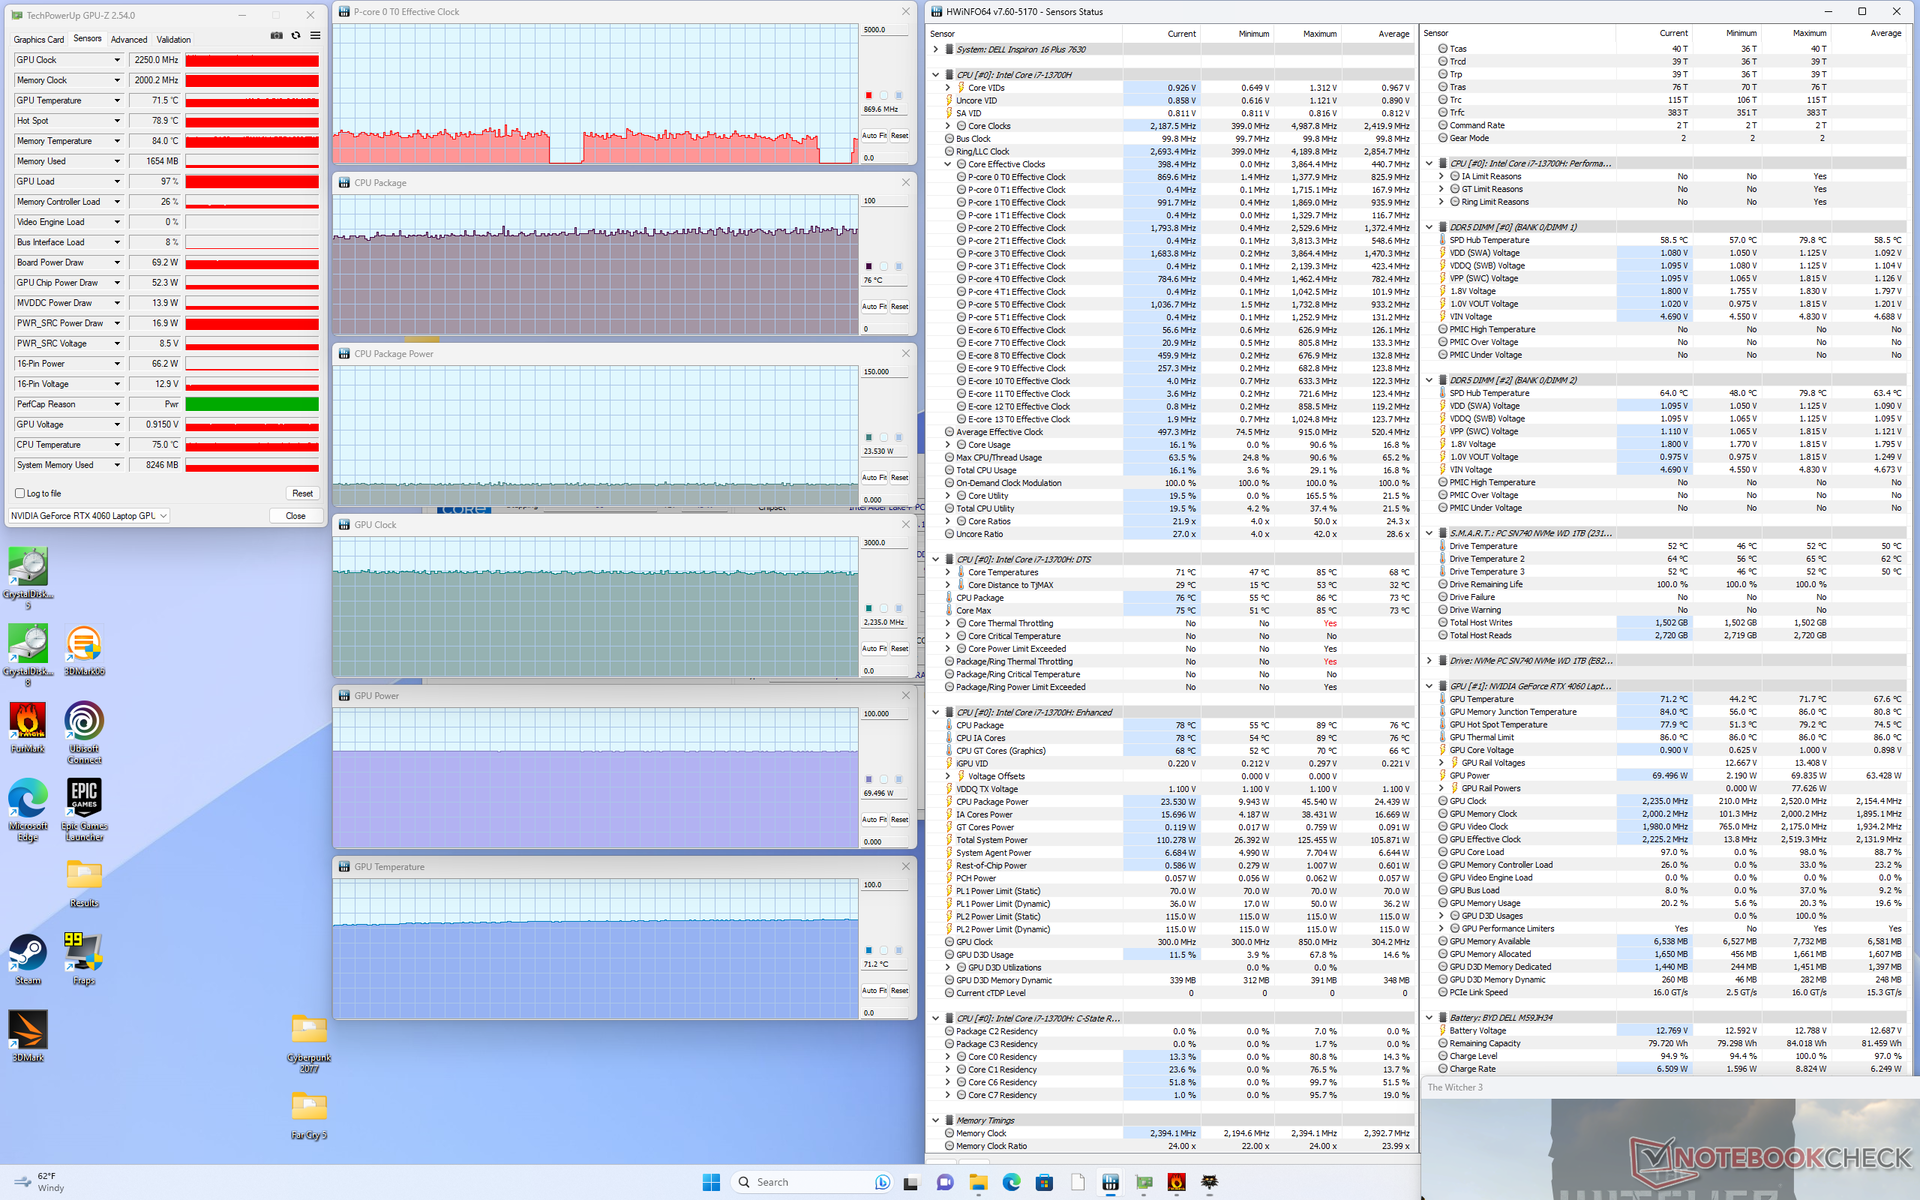
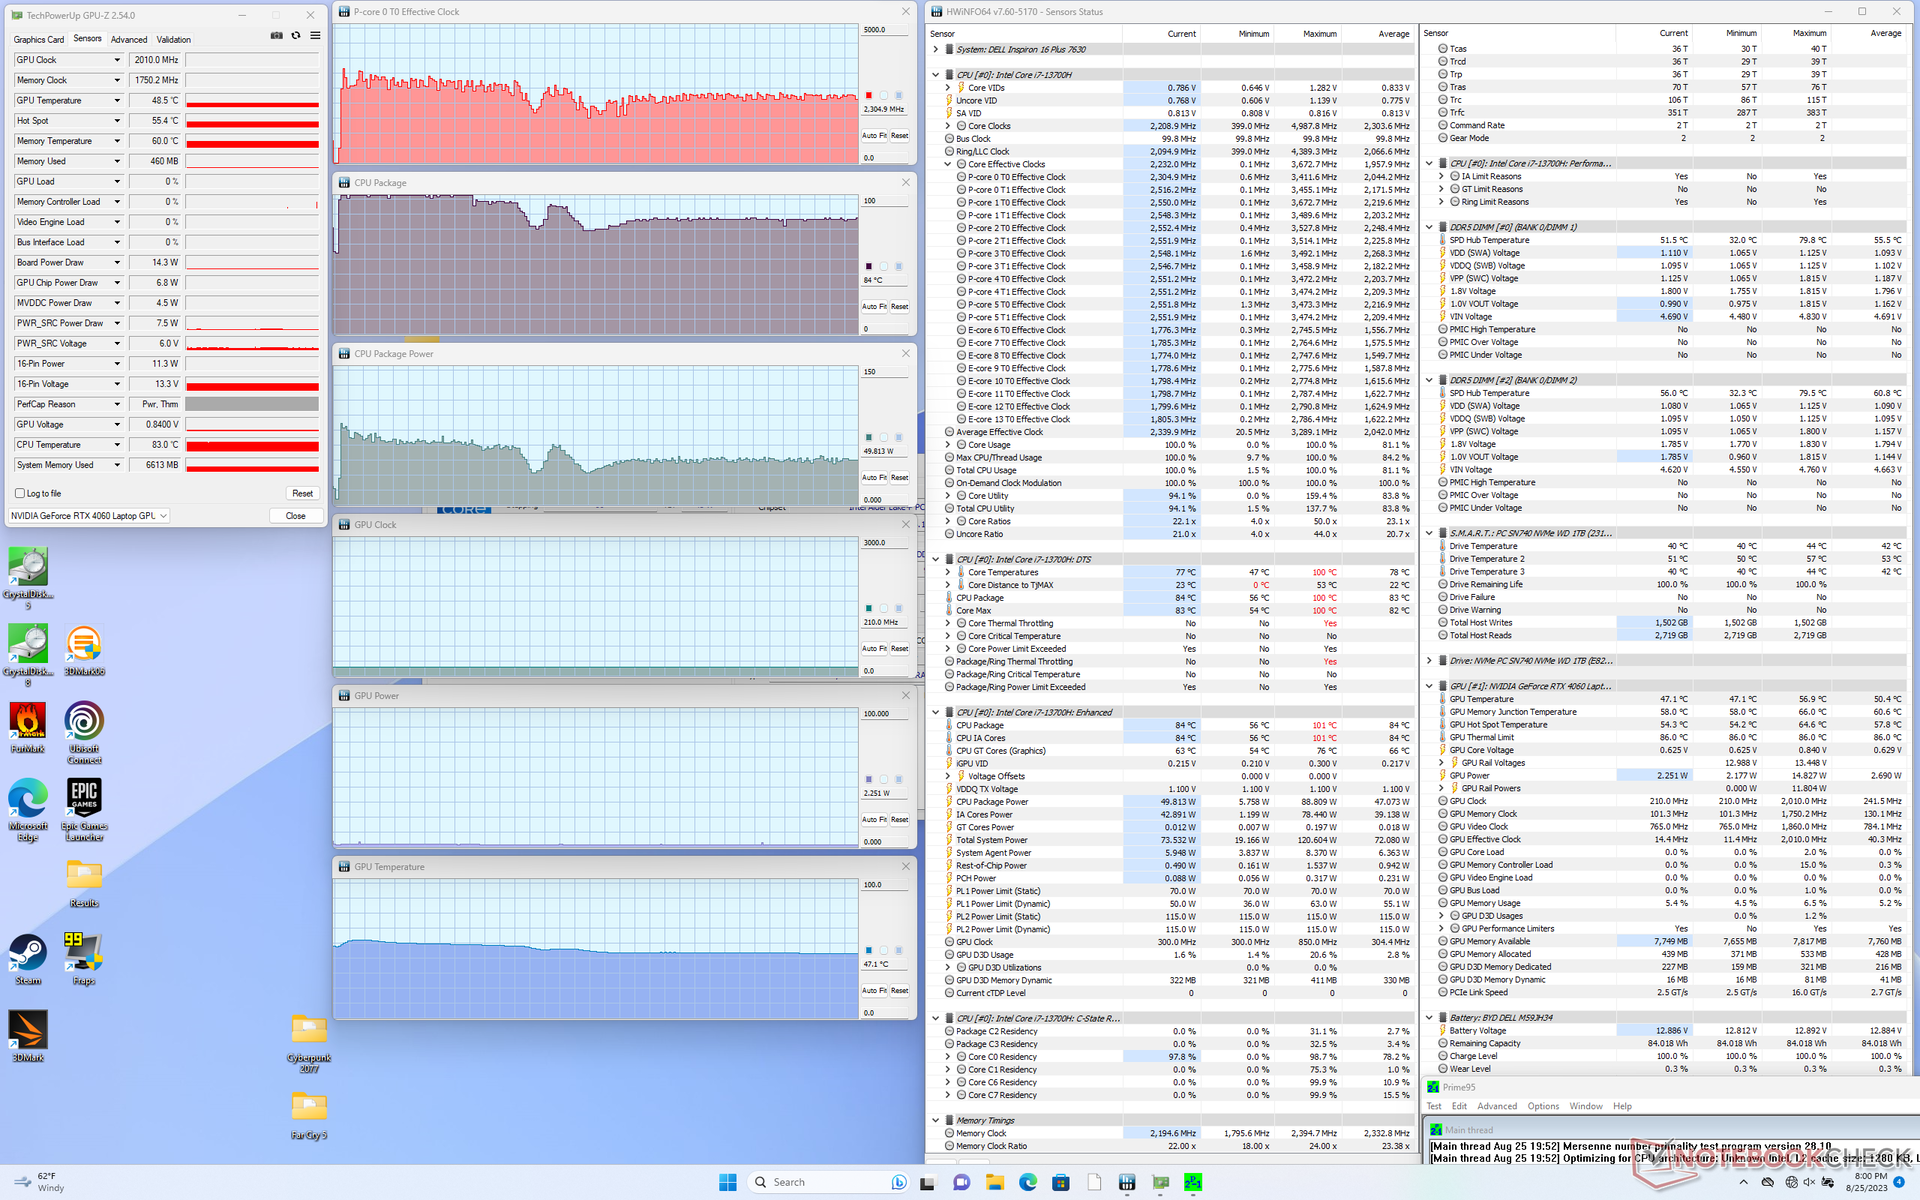
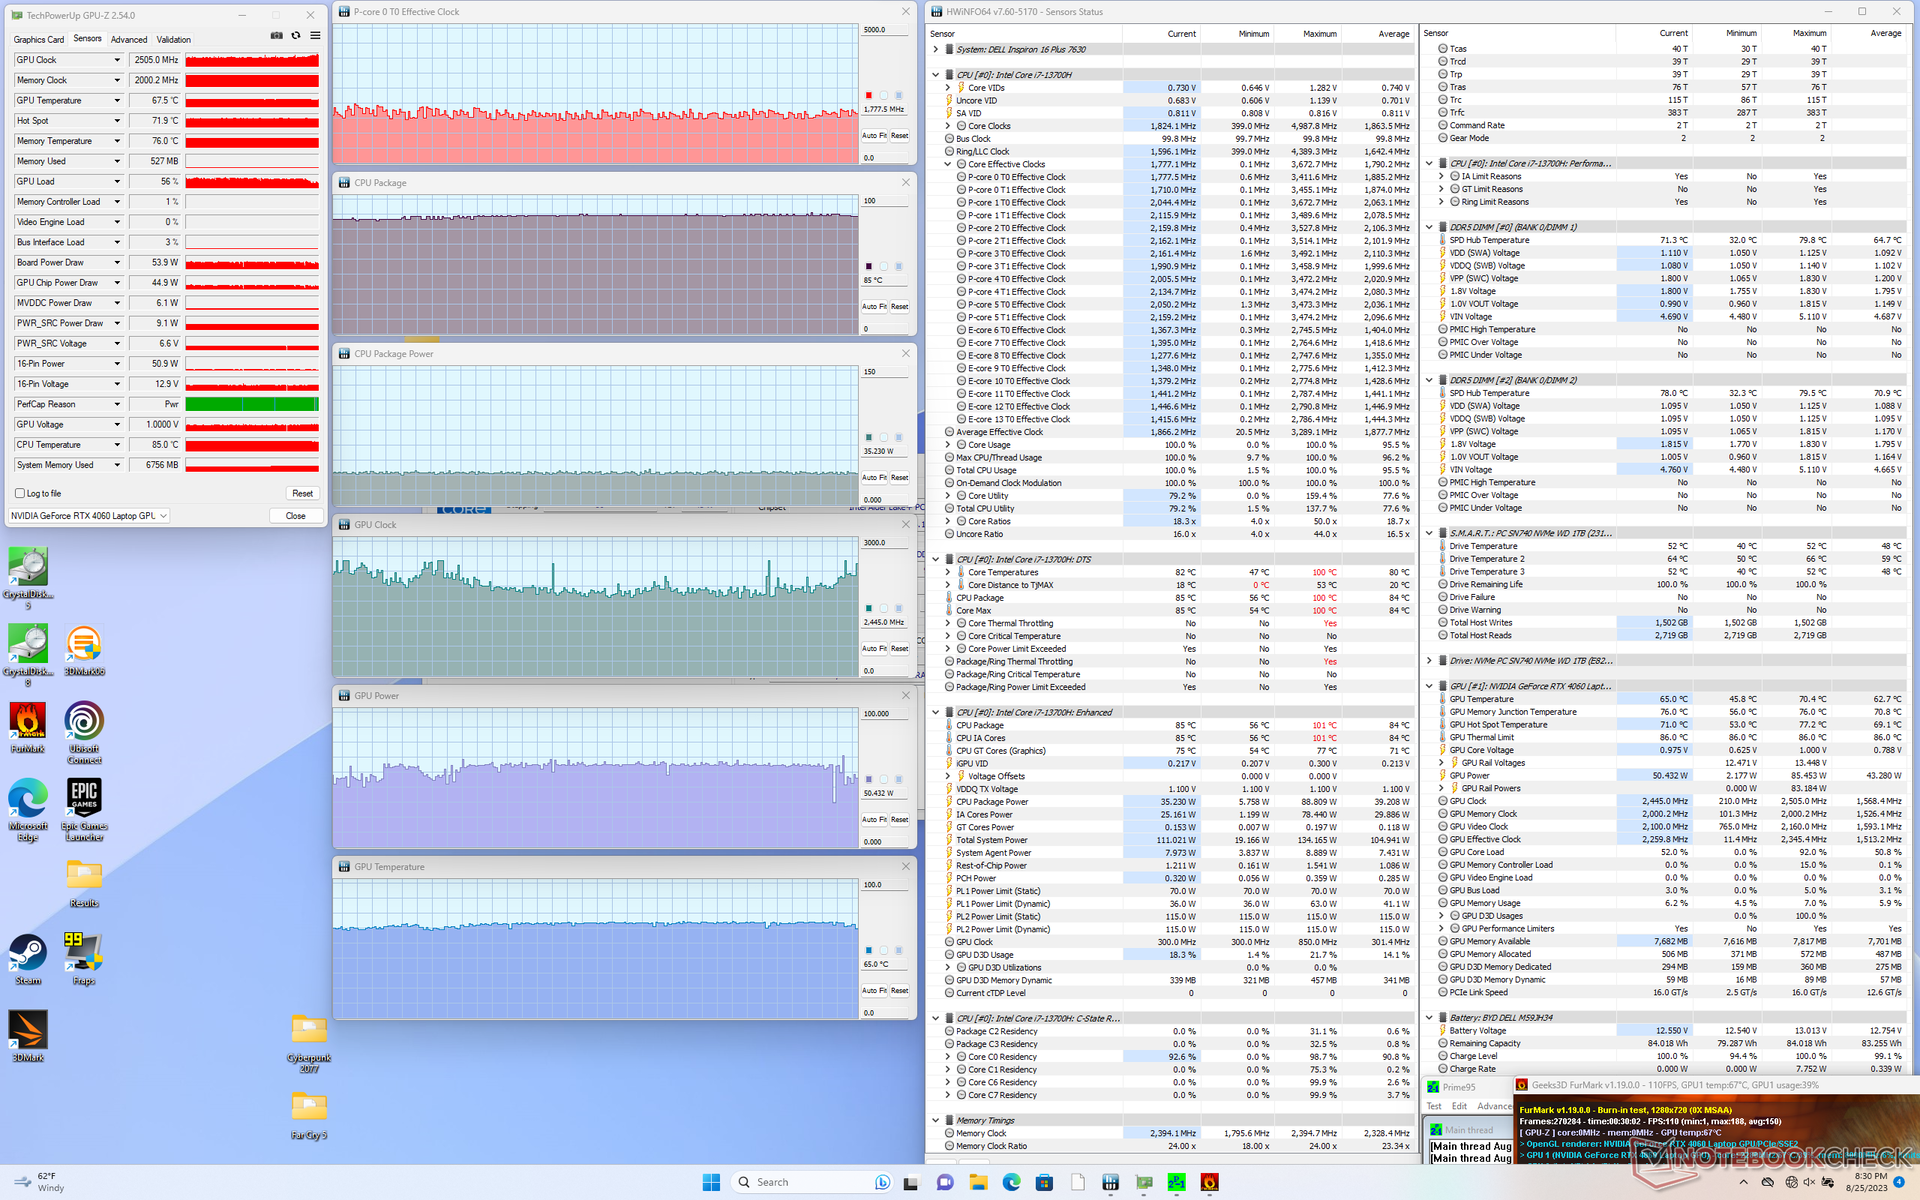
| Clock da CPU (GHz) | Clock da GPU (MHz) | Temperatura média da CPU (°C) | Temperatura média da GPU (°C) | |
| Sistema ocioso | -- | -- | 56 | 50 |
| Estresse doPrime95 | 2.3 - 2.4 | -- | 84 | 47 |
| Estresse doPrime95 + FurMark | ~1,8 | ~2445 | 85 | 65 |
| Witcher 3 Estresse(modo balanceado) | ~1,1 | 2055 | 77 | 71 |
| Witcher 3 Estresse(modo de desempenho) | ~1,1 | 2250 | 76 | 71 |
Alto-falantes
Dell Inspiron 16 Plus 7630 análise de áudio
(±) | o volume do alto-falante é médio, mas bom (###valor### dB)
Graves 100 - 315Hz
(-) | quase nenhum baixo - em média 17% menor que a mediana
(±) | a linearidade dos graves é média (8.4% delta para a frequência anterior)
Médios 400 - 2.000 Hz
(±) | médios mais altos - em média 6.3% maior que a mediana
(+) | médios são lineares (6.2% delta para frequência anterior)
Altos 2 - 16 kHz
(+) | agudos equilibrados - apenas 2.2% longe da mediana
(+) | os máximos são lineares (5.6% delta da frequência anterior)
Geral 100 - 16.000 Hz
(±) | a linearidade do som geral é média (15.9% diferença em relação à mediana)
Comparado com a mesma classe
» 40% de todos os dispositivos testados nesta classe foram melhores, 6% semelhantes, 54% piores
» O melhor teve um delta de 5%, a média foi 17%, o pior foi 45%
Comparado com todos os dispositivos testados
» 25% de todos os dispositivos testados foram melhores, 5% semelhantes, 70% piores
» O melhor teve um delta de 4%, a média foi 23%, o pior foi 134%
Apple MacBook Pro 16 2021 M1 Pro análise de áudio
(+) | os alto-falantes podem tocar relativamente alto (###valor### dB)
Graves 100 - 315Hz
(+) | bons graves - apenas 3.8% longe da mediana
(+) | o baixo é linear (5.2% delta para a frequência anterior)
Médios 400 - 2.000 Hz
(+) | médios equilibrados - apenas 1.3% longe da mediana
(+) | médios são lineares (2.1% delta para frequência anterior)
Altos 2 - 16 kHz
(+) | agudos equilibrados - apenas 1.9% longe da mediana
(+) | os máximos são lineares (2.7% delta da frequência anterior)
Geral 100 - 16.000 Hz
(+) | o som geral é linear (4.6% diferença em relação à mediana)
Comparado com a mesma classe
» 0% de todos os dispositivos testados nesta classe foram melhores, 0% semelhantes, 100% piores
» O melhor teve um delta de 5%, a média foi 17%, o pior foi 45%
Comparado com todos os dispositivos testados
» 0% de todos os dispositivos testados foram melhores, 0% semelhantes, 100% piores
» O melhor teve um delta de 4%, a média foi 23%, o pior foi 134%
Gerenciamento de energia
Consumo de energia - alto desempenho da GPU por watt
O consumo é um pouco maior do que o do modelo do ano passado quando está ocioso na área de trabalho ou executando jogos. O aumento de 8% na execução de jogos, no entanto, é insignificante em comparação com o aumento de 40 a 60% no desempenho gráfico em relação ao RTX 3050 Ti. Portanto, o desempenho por watt ainda favorece nosso modelo mais novo, mesmo que o consumo de energia possa ser um pouco maior.
Laptops para jogos com a mesma CPU e GPU do nosso Dell Inspiron, como oAcer Nitro 17tendem a consumir mais energia, pois visam níveis de energia mais altos para obter mais desempenho dos processadores. Em jogos, por exemplo, o Acer exigiria cerca de 30 W a mais.
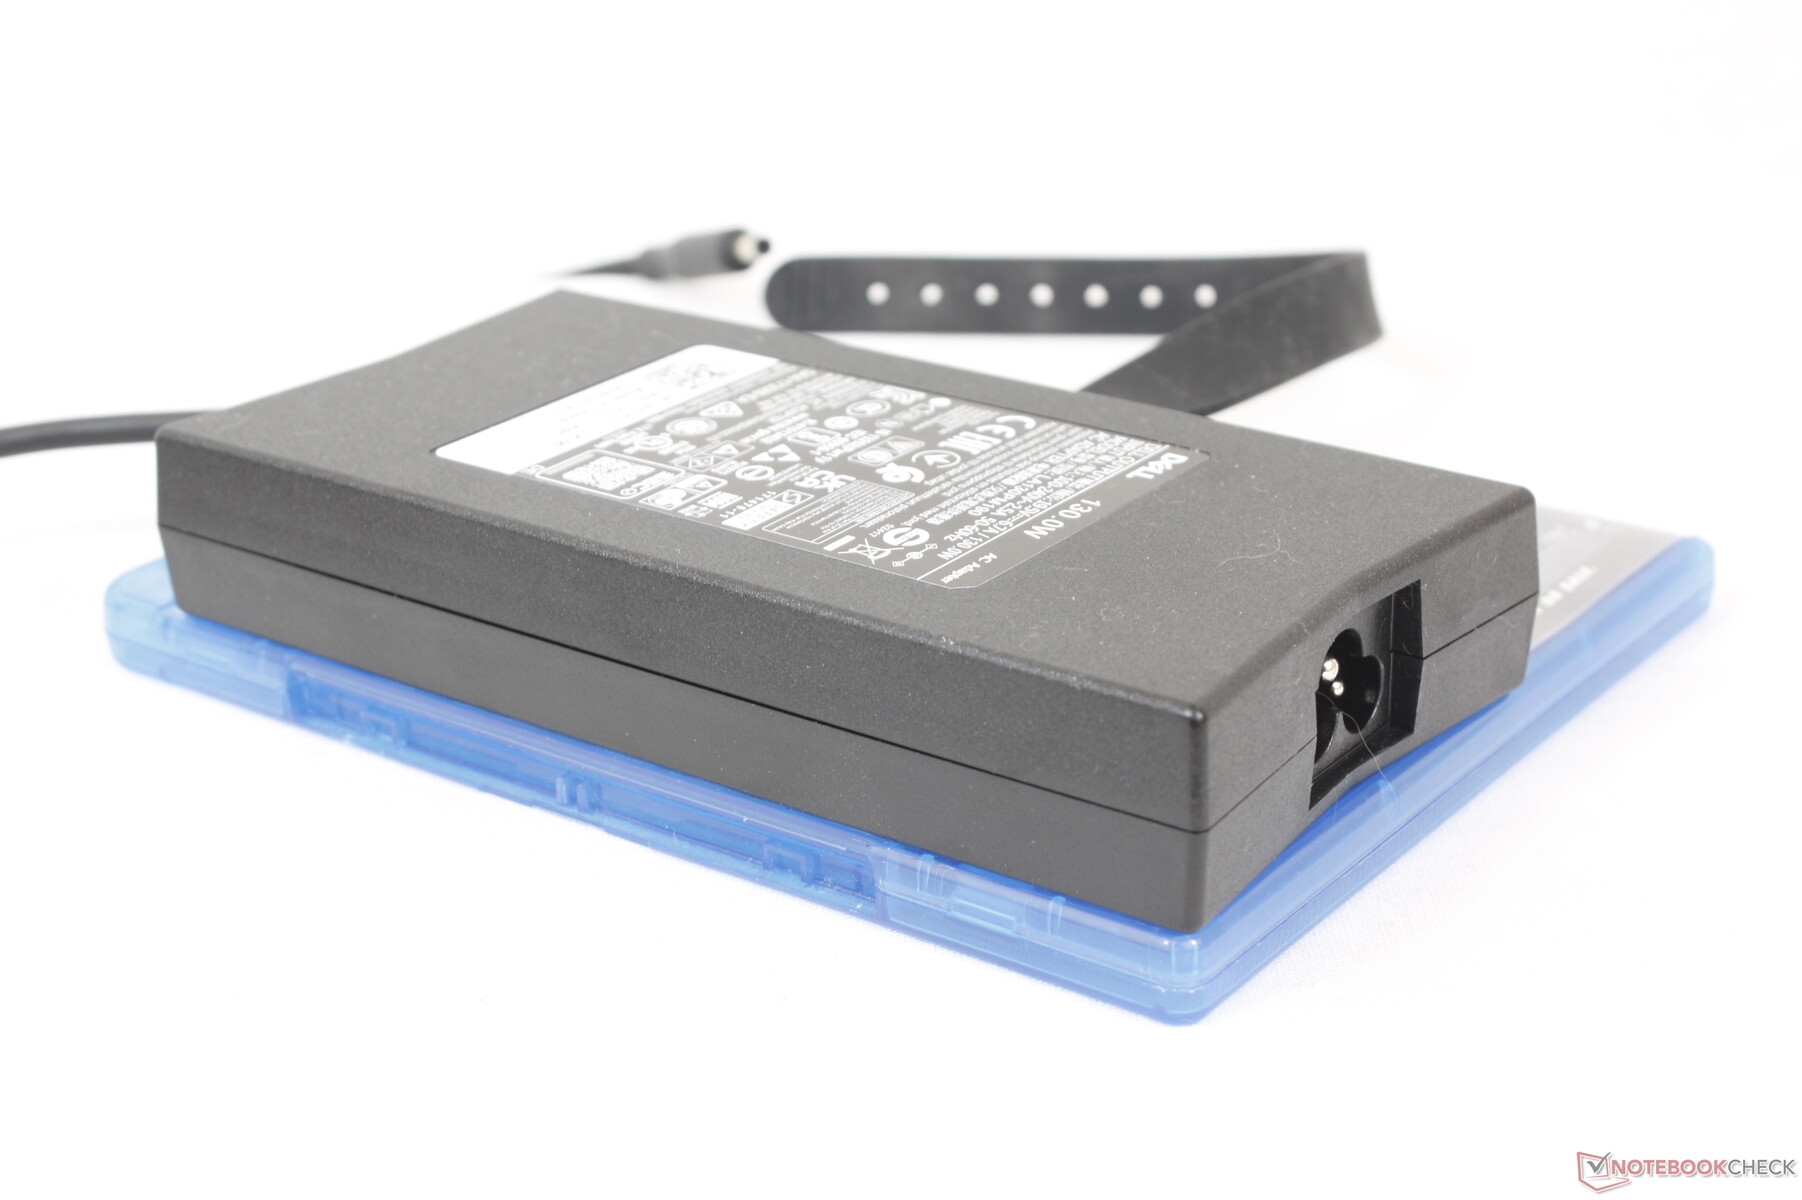
Conseguimos medir um consumo máximo temporário de 138 W do adaptador CA de 130 W de tamanho médio (~15 x 7,4 x 2,5 cm) quando a CPU e a GPU estão com 100% de utilização. Observe que as configurações sem gráficos discretos são fornecidas com um adaptador CA menor, de 90 W.
| desligado | |
| Ocioso | |
| Carga |
|
Key:
min: | |
| Dell Inspiron 16 Plus 7630 i7-13700H, GeForce RTX 4060 Laptop GPU, WD PC SN740 SDDPTQD-1T00, IPS, 2560x1600, 16" | Dell Inspiron 16 Plus 7620 i7-12700H, GeForce RTX 3050 Ti Laptop GPU, Kioxia BG5 KBG50ZNS512G, IPS, 3072x1920, 16" | Lenovo Slim Pro 9i 16IRP8 i9-13905H, GeForce RTX 4050 Laptop GPU, Samsung PM9A1 MZVL21T0HCLR, Mini-LED, 3200x2000, 16" | Asus Vivobook Pro 16X K6604JV-MX016W i9-13980HX, GeForce RTX 4060 Laptop GPU, Solidigm P41 Plus SSDPFKNU010TZ, OLED, 3200x2000, 16" | HP Envy 16 h0112nr i7-12700H, GeForce RTX 3060 Laptop GPU, Micron 3400 1TB MTFDKBA1T0TFH, OLED, 3840x2400, 16" | MSI Summit E16 Flip A12UDT-031 i7-1280P, GeForce RTX 3050 Ti Laptop GPU, Samsung PM9A1 MZVL22T0HBLB, IPS, 2560x1600, 16" | |
|---|---|---|---|---|---|---|
| Power Consumption | 15% | -28% | -23% | -9% | 22% | |
| Idle Minimum * (Watt) | 15.6 | 6.8 56% | 16 -3% | 13.8 12% | 10 36% | 9.8 37% |
| Idle Average * (Watt) | 17.7 | 9.6 46% | 30 -69% | 16 10% | 10.9 38% | 15.3 14% |
| Idle Maximum * (Watt) | 20.6 | 17 17% | 30.4 -48% | 19 8% | 27.8 -35% | 16.3 21% |
| Load Average * (Watt) | 87.4 | 117.5 -34% | 78.9 10% | 147 -68% | 116.4 -33% | 87 -0% |
| Witcher 3 ultra * (Watt) | 121.7 | 113.1 7% | 155.3 -28% | 147.8 -21% | 133.7 -10% | 86.1 29% |
| Load Maximum * (Watt) | 138 | 137.4 -0% | 180.4 -31% | 244 -77% | 209.8 -52% | 100 28% |
* ... menor é melhor
Power Consumption Witcher 3 / Stresstest
Power Consumption external Monitor
Duração da bateria
Tanto a capacidade quanto a duração da bateria permanecem as mesmas de antes. Conseguimos registrar 9,5 horas de navegação WLAN no mundo real no modo balanceado, o que é mais longo do que nos modelos concorrentes, como oLenovo Slim Pro 9i 16IRP8 ou HP Envy 16 por pelo menos duas horas cada.
O carregamento da capacidade vazia até a capacidade total leva cerca de 90 minutos com o adaptador CA incluído. O sistema também pode ser recarregado com adaptadores USB-C, como os que acompanham a série XPS.
| Dell Inspiron 16 Plus 7630 i7-13700H, GeForce RTX 4060 Laptop GPU, 86 Wh | Dell Inspiron 16 Plus 7620 i7-12700H, GeForce RTX 3050 Ti Laptop GPU, 86 Wh | Lenovo Slim Pro 9i 16IRP8 i9-13905H, GeForce RTX 4050 Laptop GPU, 75 Wh | Asus Vivobook Pro 16X K6604JV-MX016W i9-13980HX, GeForce RTX 4060 Laptop GPU, 90 Wh | HP Envy 16 h0112nr i7-12700H, GeForce RTX 3060 Laptop GPU, 83 Wh | MSI Summit E16 Flip A12UDT-031 i7-1280P, GeForce RTX 3050 Ti Laptop GPU, 82 Wh | |
|---|---|---|---|---|---|---|
| Duração da bateria | -2% | -30% | -12% | -0% | -24% | |
| Reader / Idle (h) | 17.6 | 18.6 6% | 17.8 1% | |||
| WiFi v1.3 (h) | 9.4 | 9.6 2% | 6.6 -30% | 6.5 -31% | 7.9 -16% | 7.1 -24% |
| Load (h) | 1.4 | 1.2 -14% | 1.5 7% | 1.6 14% | ||
| H.264 (h) | 5.3 |
Pro
Contra
Veredicto - Faça um upgrade para uma GPU mais rápida
As atualizações em relação ao Inspiron 16 Plus 7620 do ano passado são mais significativas do que o esperado inicialmente em muitos aspectos. Além do enorme aumento no desempenho gráfico ao passar da RTX 3050 Ti para a RTX 4060, o ruído mais alto e mais silencioso do ventilador entre os dois modelos é notável, assim como as temperaturas mais baixas do núcleo no modelo mais novo. As opções de tela são diferentes, pois agora incluem uma taxa de atualização opcional de 120 Hz, enquanto os upgrades de SODIMM agora oferecem dois slots em vez de um. As dobradiças mais rígidas também são uma mudança bem-vinda para reduzir as chances de quebra prematura. A experiência do usuário foi suficientemente aprimorada, mesmo que o desempenho da CPU esteja obsoleto e o teclado permaneça o mesmo de antes.
O Inspiron 16 Plus 7630 tem tudo a ver com equilíbrio. Seus recursos e desempenho são suficientes para satisfazer a maioria das finalidades de multimídia e jogos sem a necessidade de gastar muito.
No entanto, por ser um laptop multimídia e para jogos que faz de tudo, o Inspiron 16 Plus 7630 carece de alguns recursos que os laptops multimídia hardcore e os laptops para jogos hardcore tendem a ter. No que diz respeito à multimídia, os proprietários do Inspiron 16 Plus 7630 não terão acesso a cores DCi-P3 mais intensas, resoluções nativas mais altas e um rápido leitor de cartão SD integrado. Em relação aos jogos, o sistema omite o G-Sync e o MUX e sua RTX 4060 é geralmente mais lenta do que a média. O Inspiron 16 Plus 7630 é excelente para criação de conteúdo e jogos, mas os usuários que se inclinam mais para a criação de conteúdo devem considerar um HP Envy 16 ou Asus ZenBook Pro Duo enquanto os jogadores mais experientes devem procurar máquinas dedicadas a jogos, como um Modelo Dell G ou um Asus ROG.
Preço e disponibilidade
A Dell agora está enviando o Inspiron 16 Plus 7630 com Core i7 e RTX 4060 por US$ 1250.
Dell Inspiron 16 Plus 7630
- 08/30/2023 v7 (old)
Allen Ngo
Transparência
A seleção dos dispositivos a serem analisados é feita pela nossa equipe editorial. A amostra de teste foi fornecida ao autor como empréstimo pelo fabricante ou varejista para fins desta revisão. O credor não teve influência nesta revisão, nem o fabricante recebeu uma cópia desta revisão antes da publicação. Não houve obrigação de publicar esta revisão. Como empresa de mídia independente, a Notebookcheck não está sujeita à autoridade de fabricantes, varejistas ou editores.
É assim que o Notebookcheck está testando
Todos os anos, o Notebookcheck analisa de forma independente centenas de laptops e smartphones usando procedimentos padronizados para garantir que todos os resultados sejam comparáveis. Desenvolvemos continuamente nossos métodos de teste há cerca de 20 anos e definimos padrões da indústria no processo. Em nossos laboratórios de teste, equipamentos de medição de alta qualidade são utilizados por técnicos e editores experientes. Esses testes envolvem um processo de validação em vários estágios. Nosso complexo sistema de classificação é baseado em centenas de medições e benchmarks bem fundamentados, o que mantém a objetividade.Price comparison

