Estreia do desempenho da Radeon RX 6550M: Análise do laptop Lenovo ThinkPad Z16 Gen 2

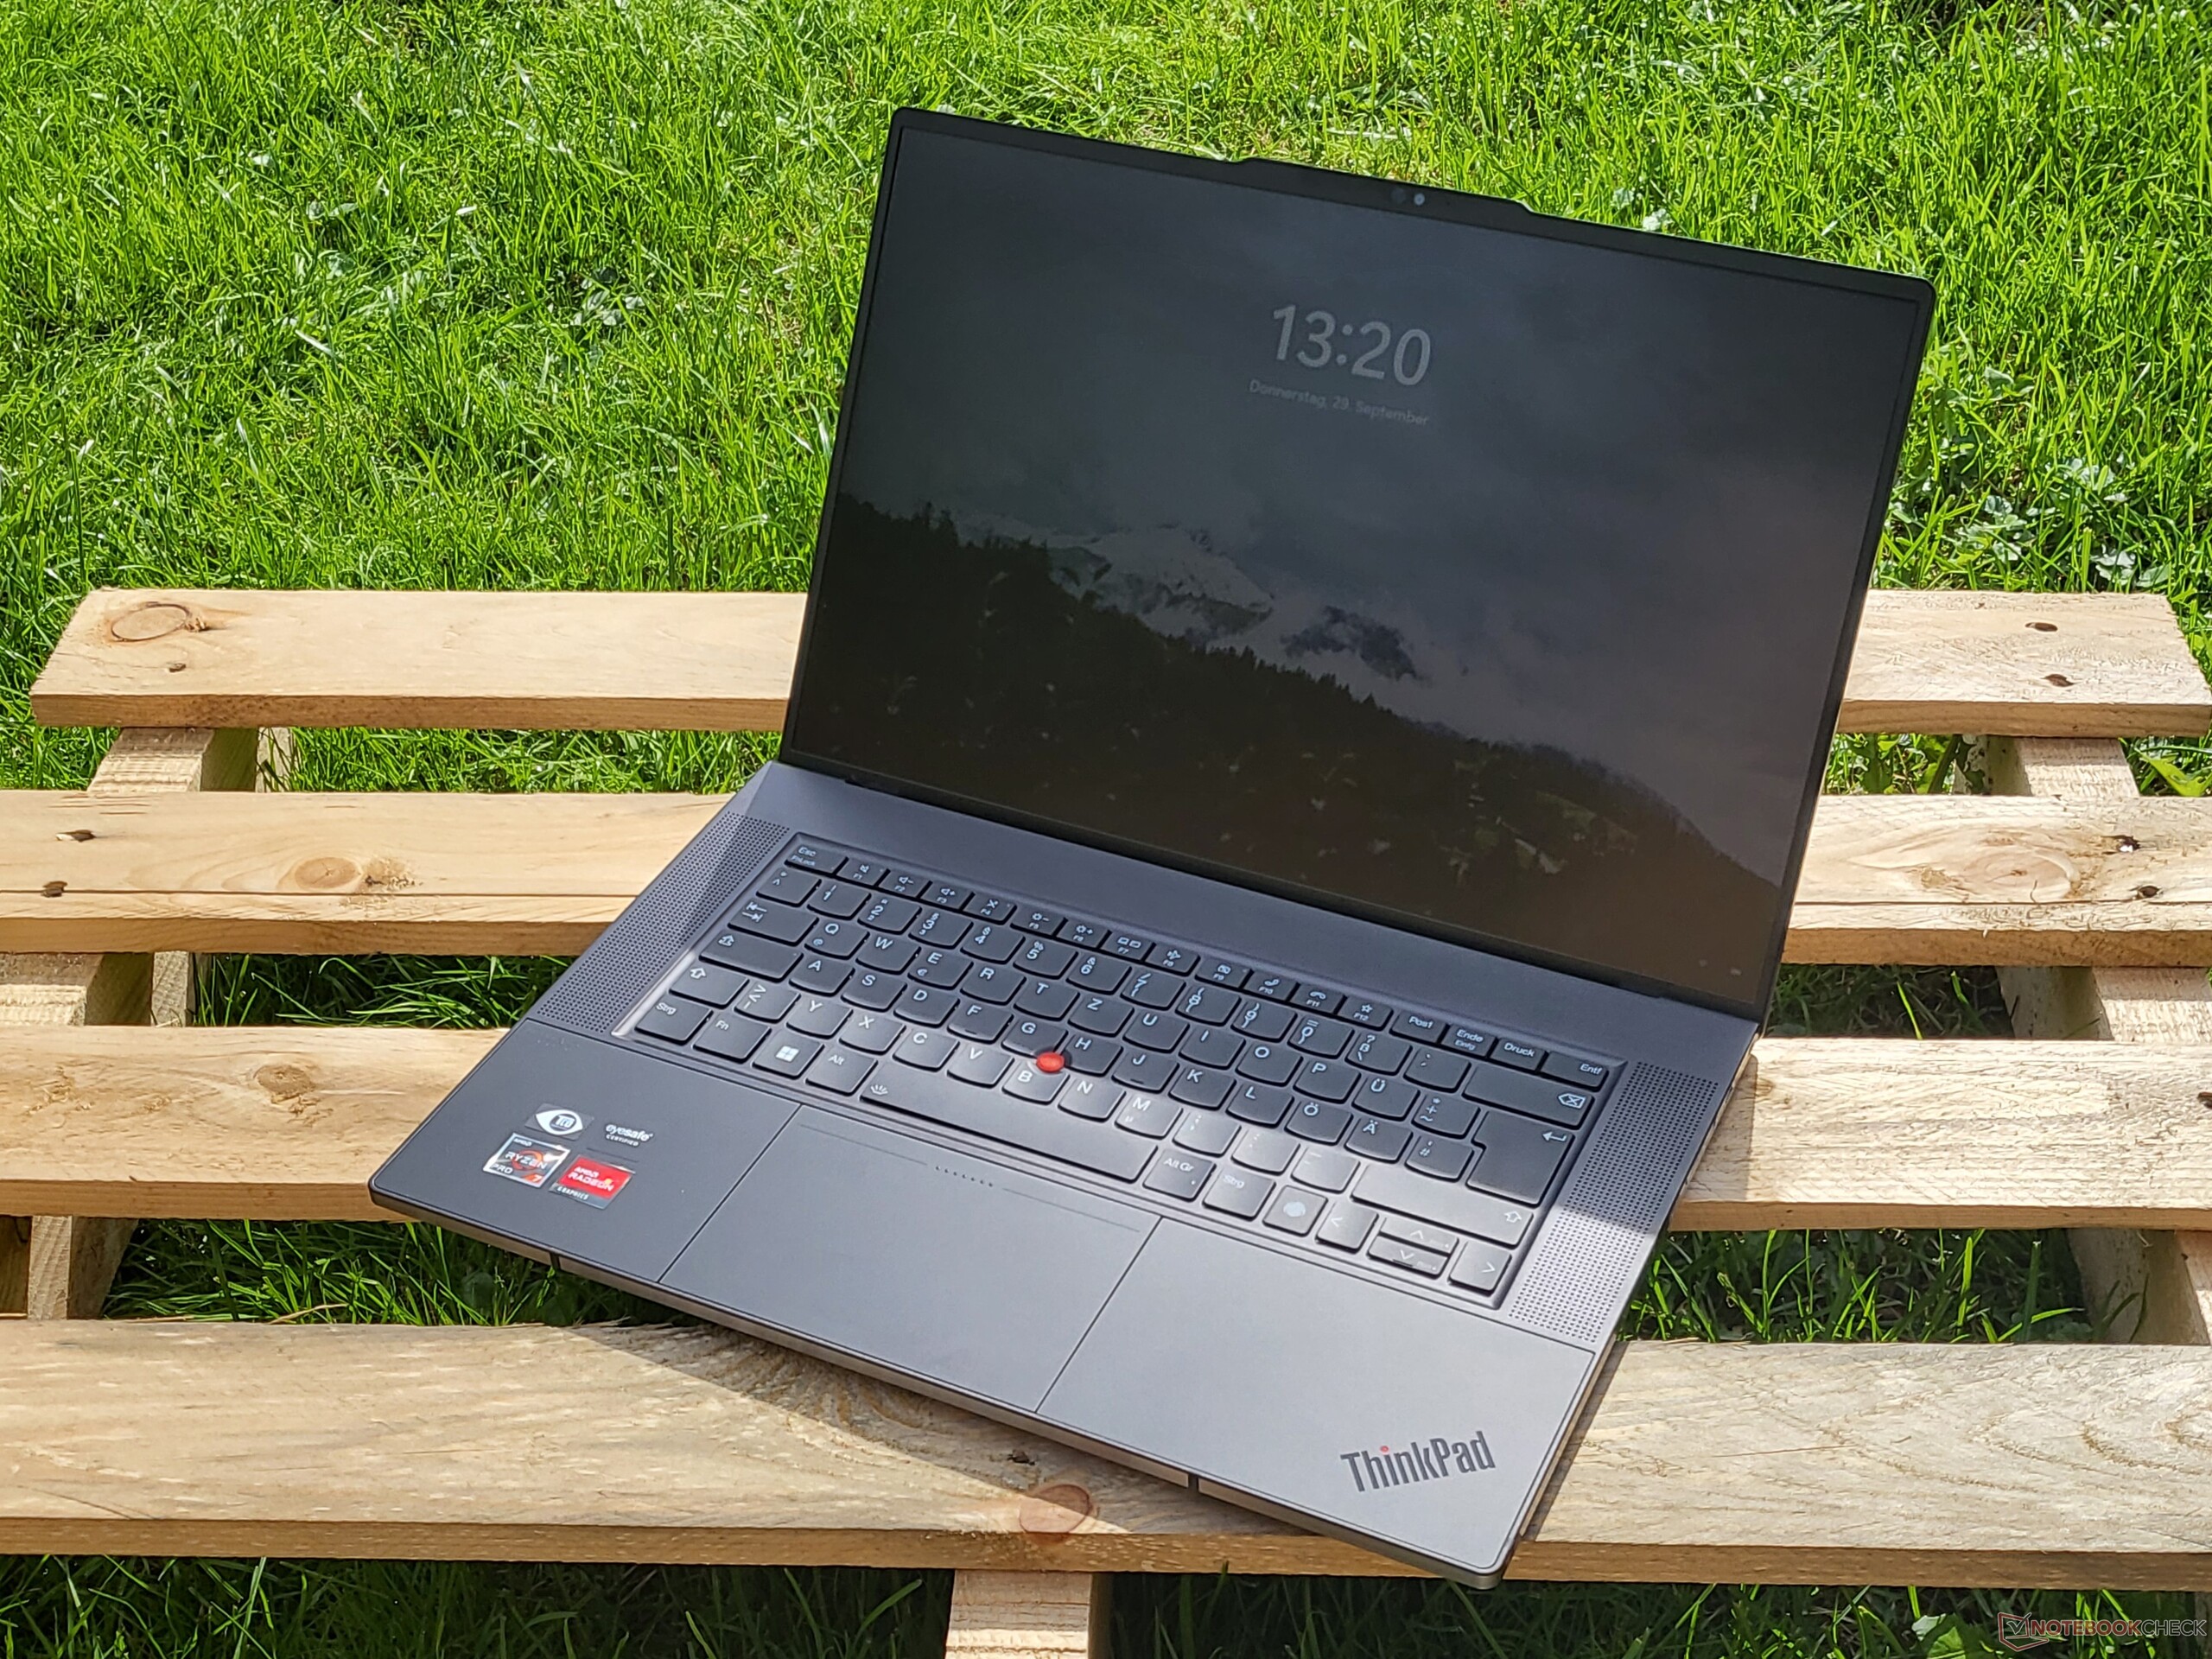
O ThinkPad Z16 G2 sucede o ThinkPad Z16 G1 de um ano de idade com novas opções de CPU AMD Zen 4, gráficos Radeon RX mais rápidos e uma nova tela sensível ao toque OLED de 2400p. Ele também é um dos poucos notebooks com a incomum Radeon RX 6550M de nível básico. O chassi é idêntico ao do ThinkPad Z16 G1 e, por isso, recomendamos que o senhor confira nossa análise do modelo de primeira geração para saber mais sobre os recursos físicos e as opções de conectividade da série.
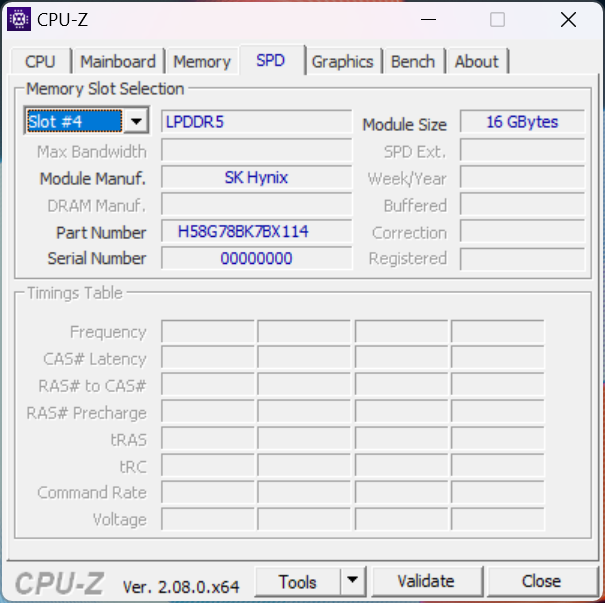
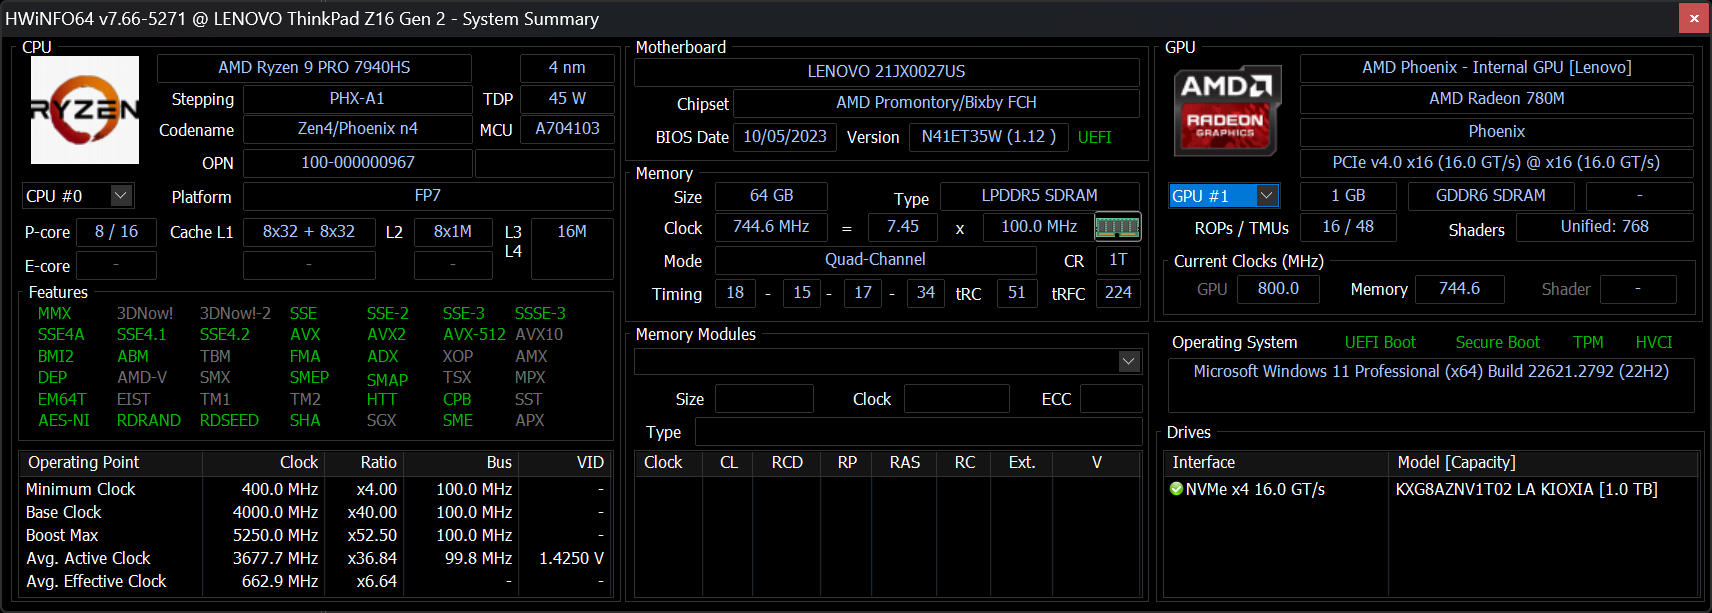
Nossa unidade de análise específica é a configuração mais avançada com o Ryzen 9 Pro 7940HS, Radeon RX 6550M, tela sensível ao toque OLED e 64 GB de RAM por aproximadamente US$ 2.600. As SKUs menores começam com o Ryzen 5 Pro 7640HS, gráficos integrados e uma tela IPS de 1200p por US$ 1.600. O ThinkPad Z16 pode ser considerado como um laptop semiprofissional multimídia ou criador de conteúdo, já que possui CPUs Ryzen Pro em vez das opções típicas não-Pro.
As alternativas ao ThinkPad Z16 G2 incluem outros notebooks de 16 polegadas de última geração para criadores de conteúdo, como o MSI Creator Z16P, Apple MacBook Pro 16, Asus Vivobook Pro 16Xou a Série Dell XPS.
Mais análises da Lenovo:
Possíveis concorrentes em comparação
Avaliação | Data | Modelo | Peso | Altura | Size | Resolução | Preço |
|---|---|---|---|---|---|---|---|
| 88.6 % v7 (old) | 12/2023 | Lenovo ThinkPad Z16 Gen 2 R9 PRO 7940HS, Radeon RX 6550M | 1.8 kg | 15.8 mm | 16.00" | 3840x2400 | |
| 87.3 % v7 (old) | 10/2022 | Lenovo ThinkPad Z16 G1 21D5S00T00 R7 PRO 6850H, Radeon RX 6500M | 1.9 kg | 15.8 mm | 16.00" | 1920x1200 | |
| 85.7 % v7 (old) | 11/2023 | Lenovo ThinkBook 16 G6 ABP R5 7530U, Vega 7 | 1.8 kg | 17.5 mm | 16.00" | 1920x1200 | |
| 83.7 % v7 (old) | 06/2022 | MSI Creator Z16P B12UHST i9-12900H, GeForce RTX 3080 Ti Laptop GPU | 2.4 kg | 20.4 mm | 16.00" | 2560x1600 | |
| 93.7 % v7 (old) | 11/2023 | Apple MacBook Pro 16 2023 M3 Pro Apple M3 Pro 12-Core, M3 Pro 18-Core GPU | 2.1 kg | 16.9 mm | 16.20" | 3456x2234 | |
| 86.2 % v7 (old) | 07/2023 | Asus Vivobook Pro 16X K6604JV-MX016W i9-13980HX, GeForce RTX 4060 Laptop GPU | 2.1 kg | 22.8 mm | 16.00" | 3200x2000 |
Caso
Leitor de cartão SD
| SD Card Reader | |
| average JPG Copy Test (av. of 3 runs) | |
| Lenovo ThinkPad Z16 Gen 2 (Toshiba Exceria Pro SDXC 64 GB UHS-II) | |
| Asus Vivobook Pro 16X K6604JV-MX016W | |
| Lenovo ThinkPad Z16 G1 21D5S00T00 | |
| Lenovo ThinkBook 16 G6 ABP (Angelbird AV Pro V60) | |
| MSI Creator Z16P B12UHST (AV PRO microSD 128 GB V60) | |
| maximum AS SSD Seq Read Test (1GB) | |
| Lenovo ThinkPad Z16 G1 21D5S00T00 | |
| Lenovo ThinkPad Z16 Gen 2 (Toshiba Exceria Pro SDXC 64 GB UHS-II) | |
| Asus Vivobook Pro 16X K6604JV-MX016W | |
| Lenovo ThinkBook 16 G6 ABP (Angelbird AV Pro V60) | |
Comunicação
A Lenovo trocou o Qualcomm WCN685x do modelo do ano passado por um MediaTek MT7922 no modelo deste ano. As taxas de transferência permanecem estáveis e excelentes quando emparelhadas com nossas redes Wi-Fi 6 ou Wi-Fi 6E.
| Networking | |
| iperf3 transmit AXE11000 | |
| Lenovo ThinkPad Z16 G1 21D5S00T00 | |
| Asus Vivobook Pro 16X K6604JV-MX016W | |
| Lenovo ThinkPad Z16 Gen 2 | |
| Lenovo ThinkBook 16 G6 ABP | |
| iperf3 receive AXE11000 | |
| Lenovo ThinkPad Z16 G1 21D5S00T00 | |
| Asus Vivobook Pro 16X K6604JV-MX016W | |
| MSI Creator Z16P B12UHST | |
| Lenovo ThinkPad Z16 Gen 2 | |
| Lenovo ThinkBook 16 G6 ABP | |
| iperf3 transmit AXE11000 6GHz | |
| Lenovo ThinkPad Z16 G1 21D5S00T00 | |
| Asus Vivobook Pro 16X K6604JV-MX016W | |
| Lenovo ThinkPad Z16 Gen 2 | |
| iperf3 receive AXE11000 6GHz | |
| Lenovo ThinkPad Z16 G1 21D5S00T00 | |
| Asus Vivobook Pro 16X K6604JV-MX016W | |
| Lenovo ThinkPad Z16 Gen 2 | |
Webcam
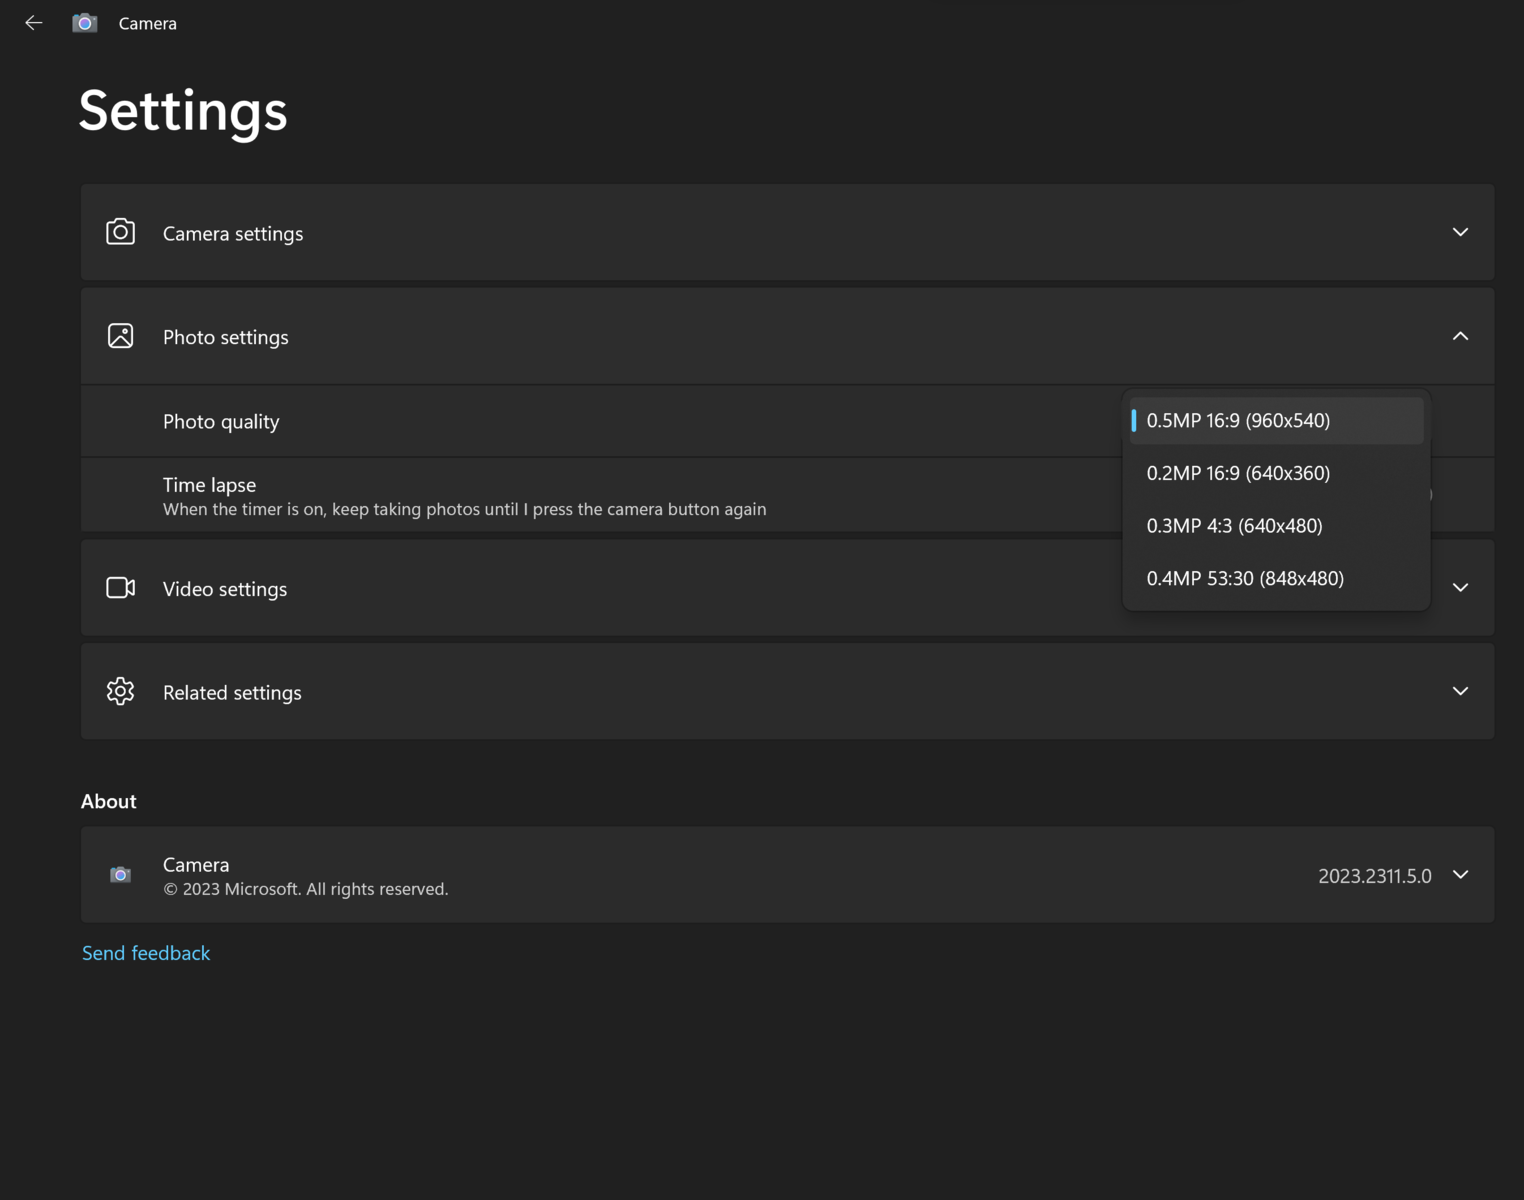
Embora a Lenovo anuncie uma webcam de 2 MP, só conseguimos selecionar até 0,5 MP com o aplicativo de câmera integrado, conforme mostrado na captura de tela à direita. Notificamos a Lenovo sobre o erro e atualizaremos esta seção se recebermos uma resposta.


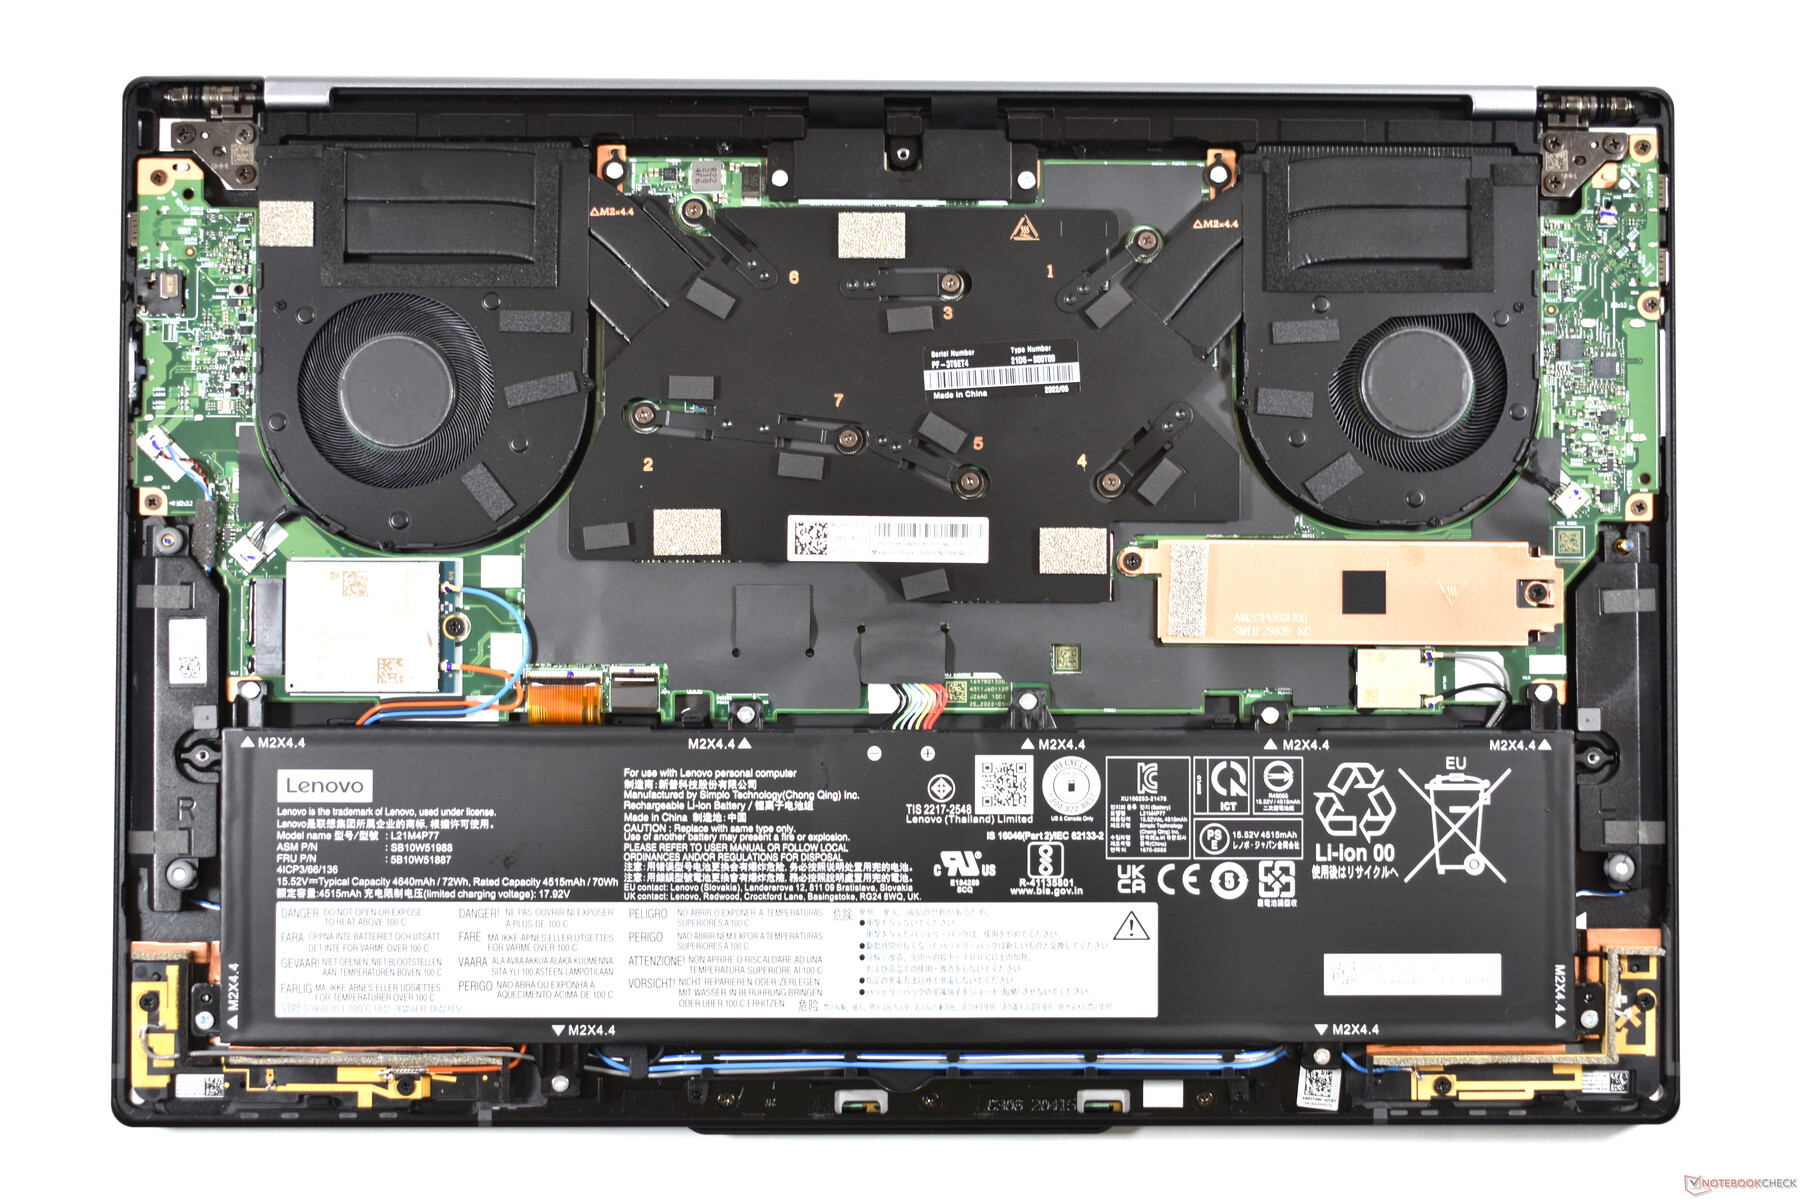
Manutenção
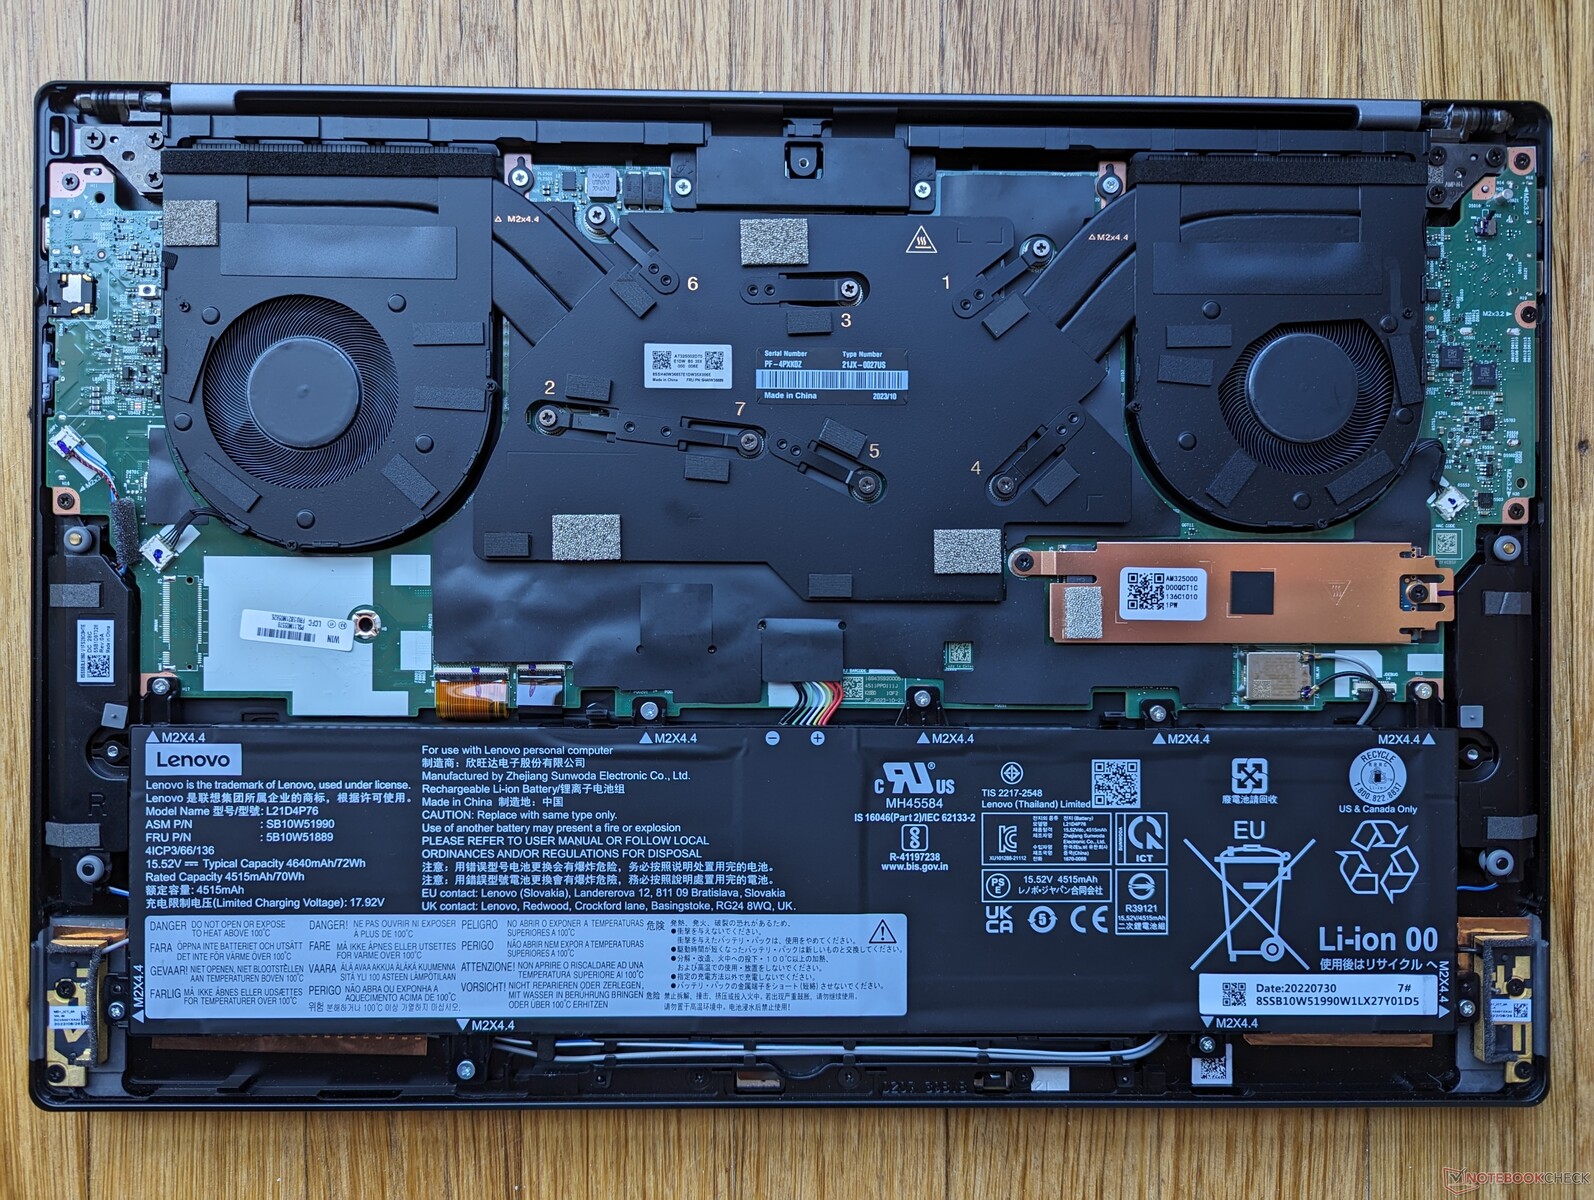
A remoção do painel inferior não mostra grandes diferenças internas entre as versões Gen 1 e Gen 2. Nossa configuração da geração 2, no entanto, não inclui suporte a WAN e, portanto, o slot M.2 WAN e a antena estão ausentes. Infelizmente, isso significa que os usuários não podem comprar uma SKU sem WAN com a intenção de adicionar um módulo WAN no futuro.
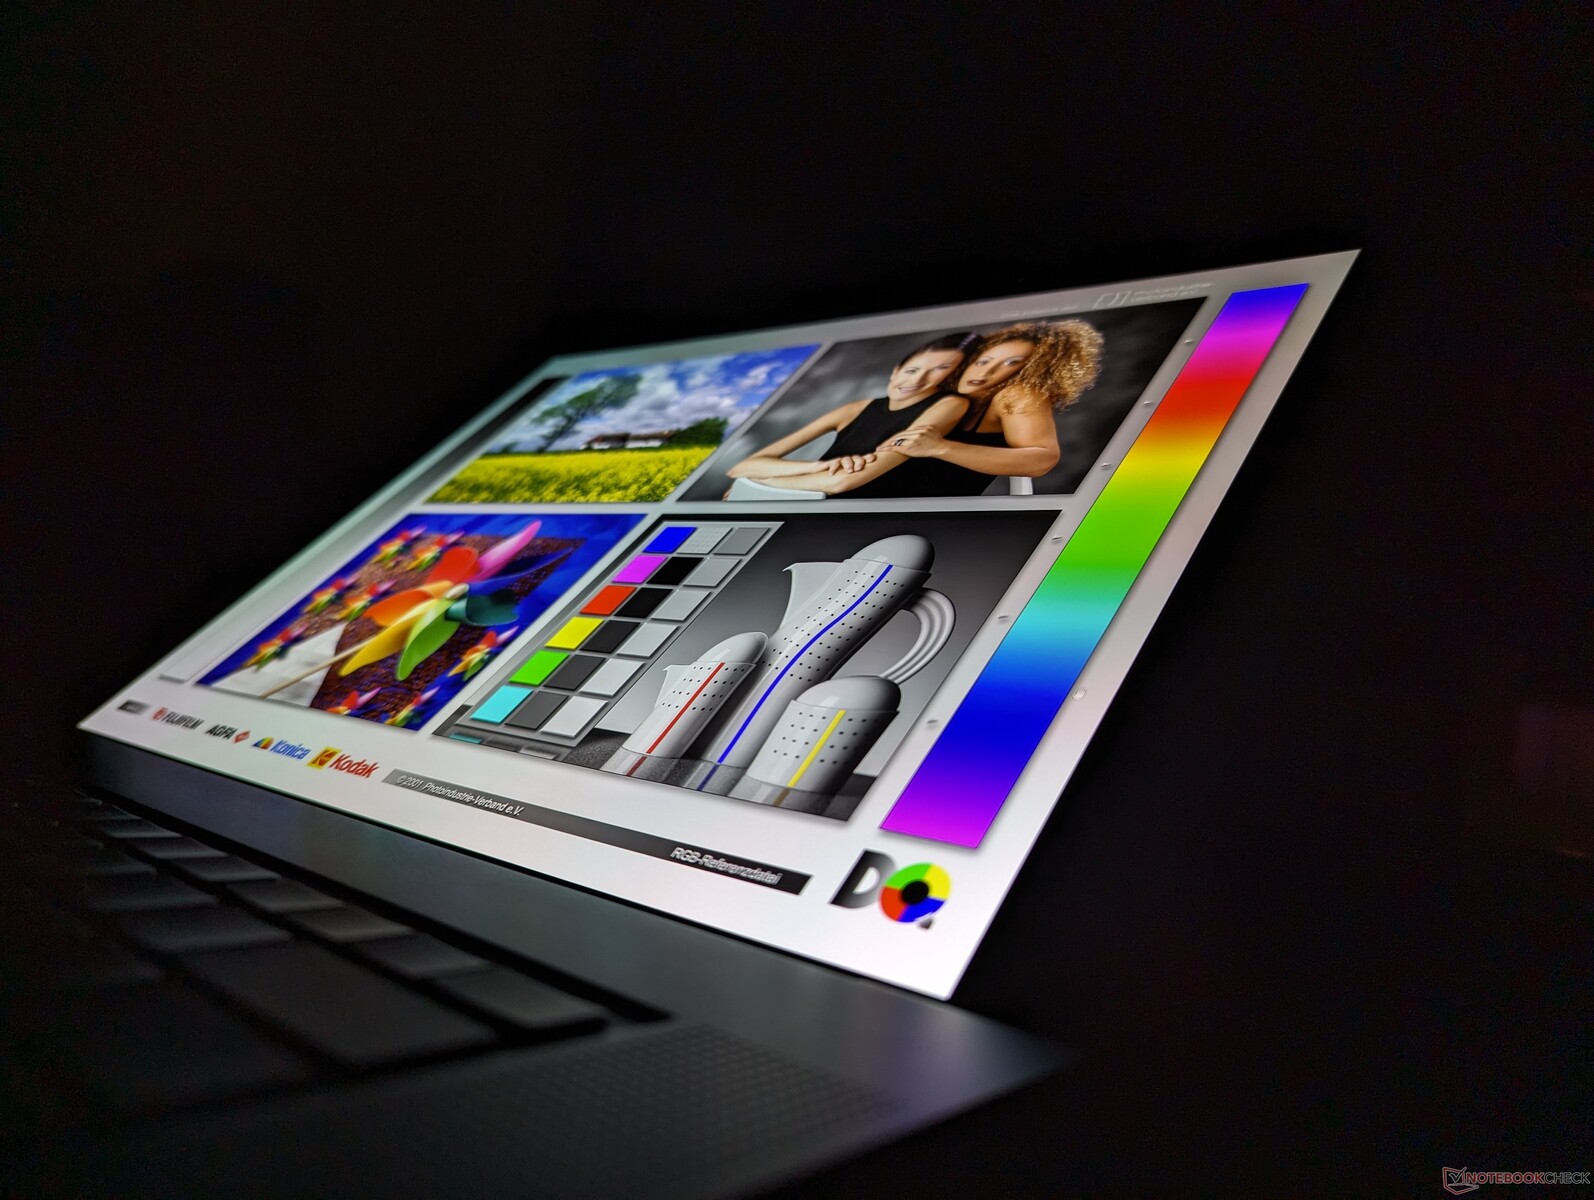
Tela
A Lenovo oferece quatro opções de tela, todas com 60 Hz apenas e sem suporte para FreeSync:
- 1920 x 1200, IPS, fosco, sem toque, 100% sRGB, 400 nits
- 1920 x 1200, IPS, brilhante, sensível ao toque, 100% sRGB, 400 nits
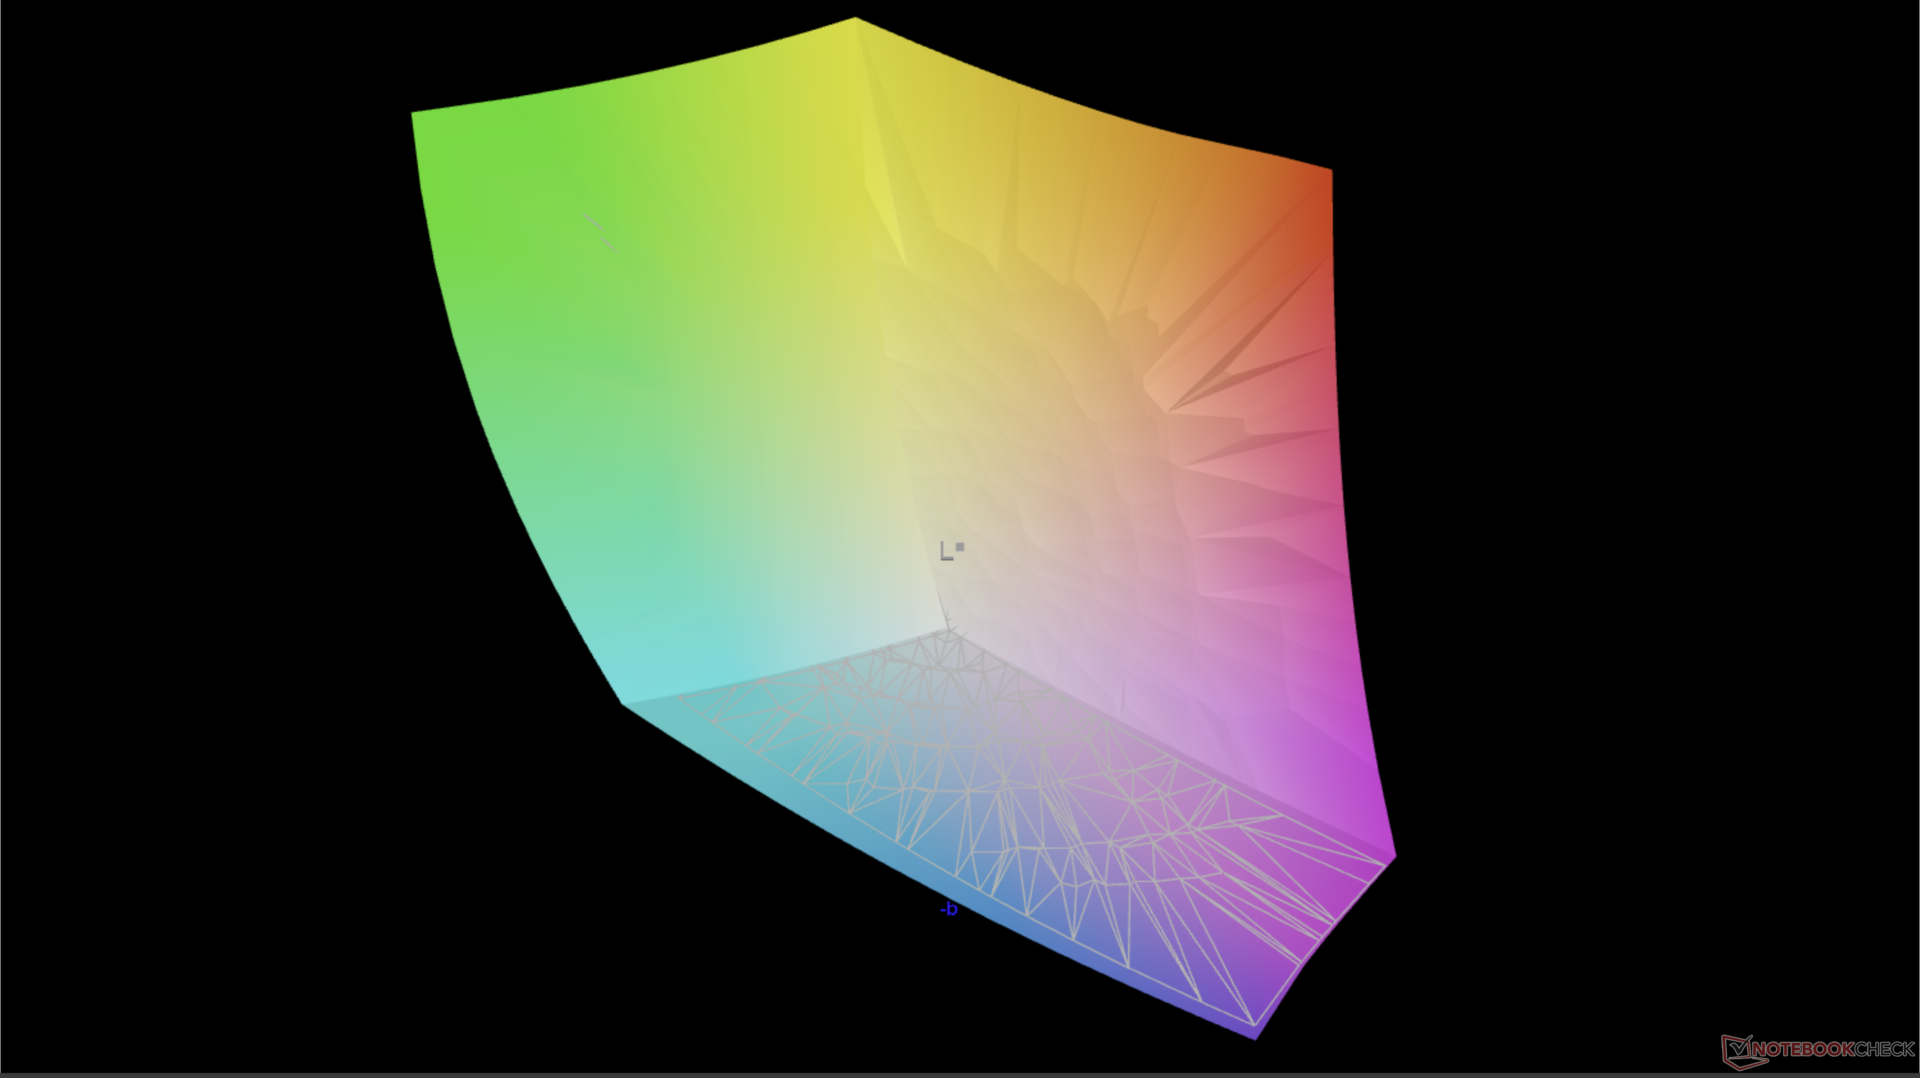
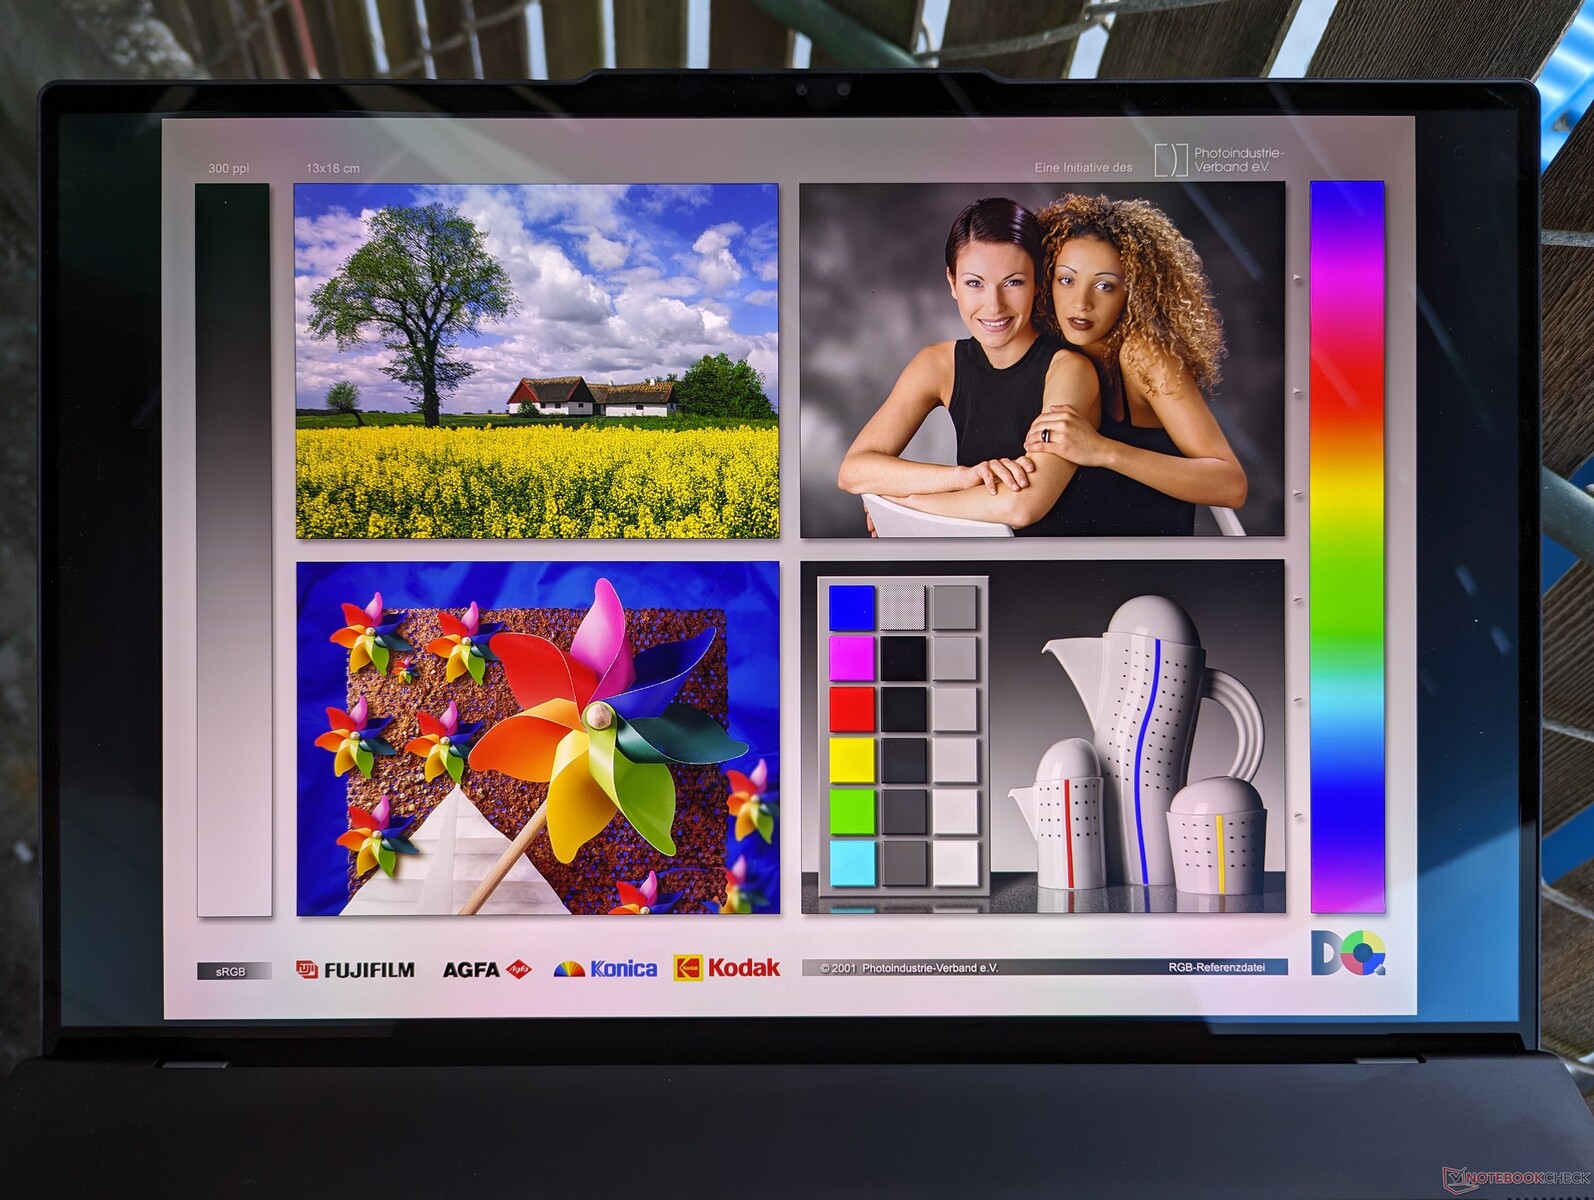
- 3840 x 2400, OLED, brilhante, sensível ao toque, 100% DCI-P3, 400 nits, HDR400
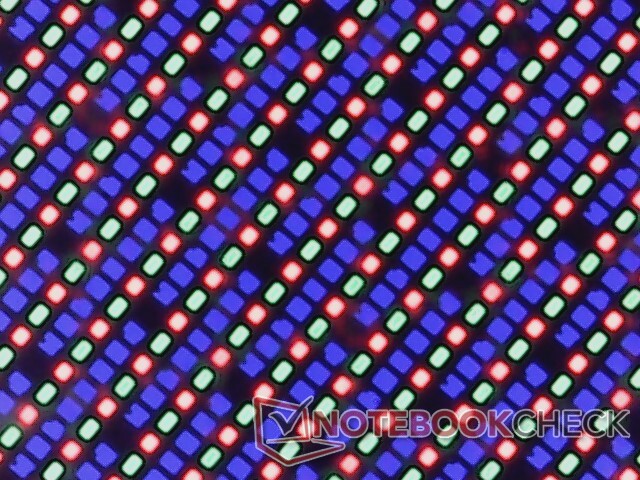
O mesmo painel OLED Samsung ATNA60YV04-0 da nossa unidade de análise também pode ser encontrado no recente ThinkPad P1 G6 e, portanto, a experiência de visualização é semelhante entre esses dois modelos. Não é incomum que um fabricante utilize as mesmas opções de painel em vários modelos.
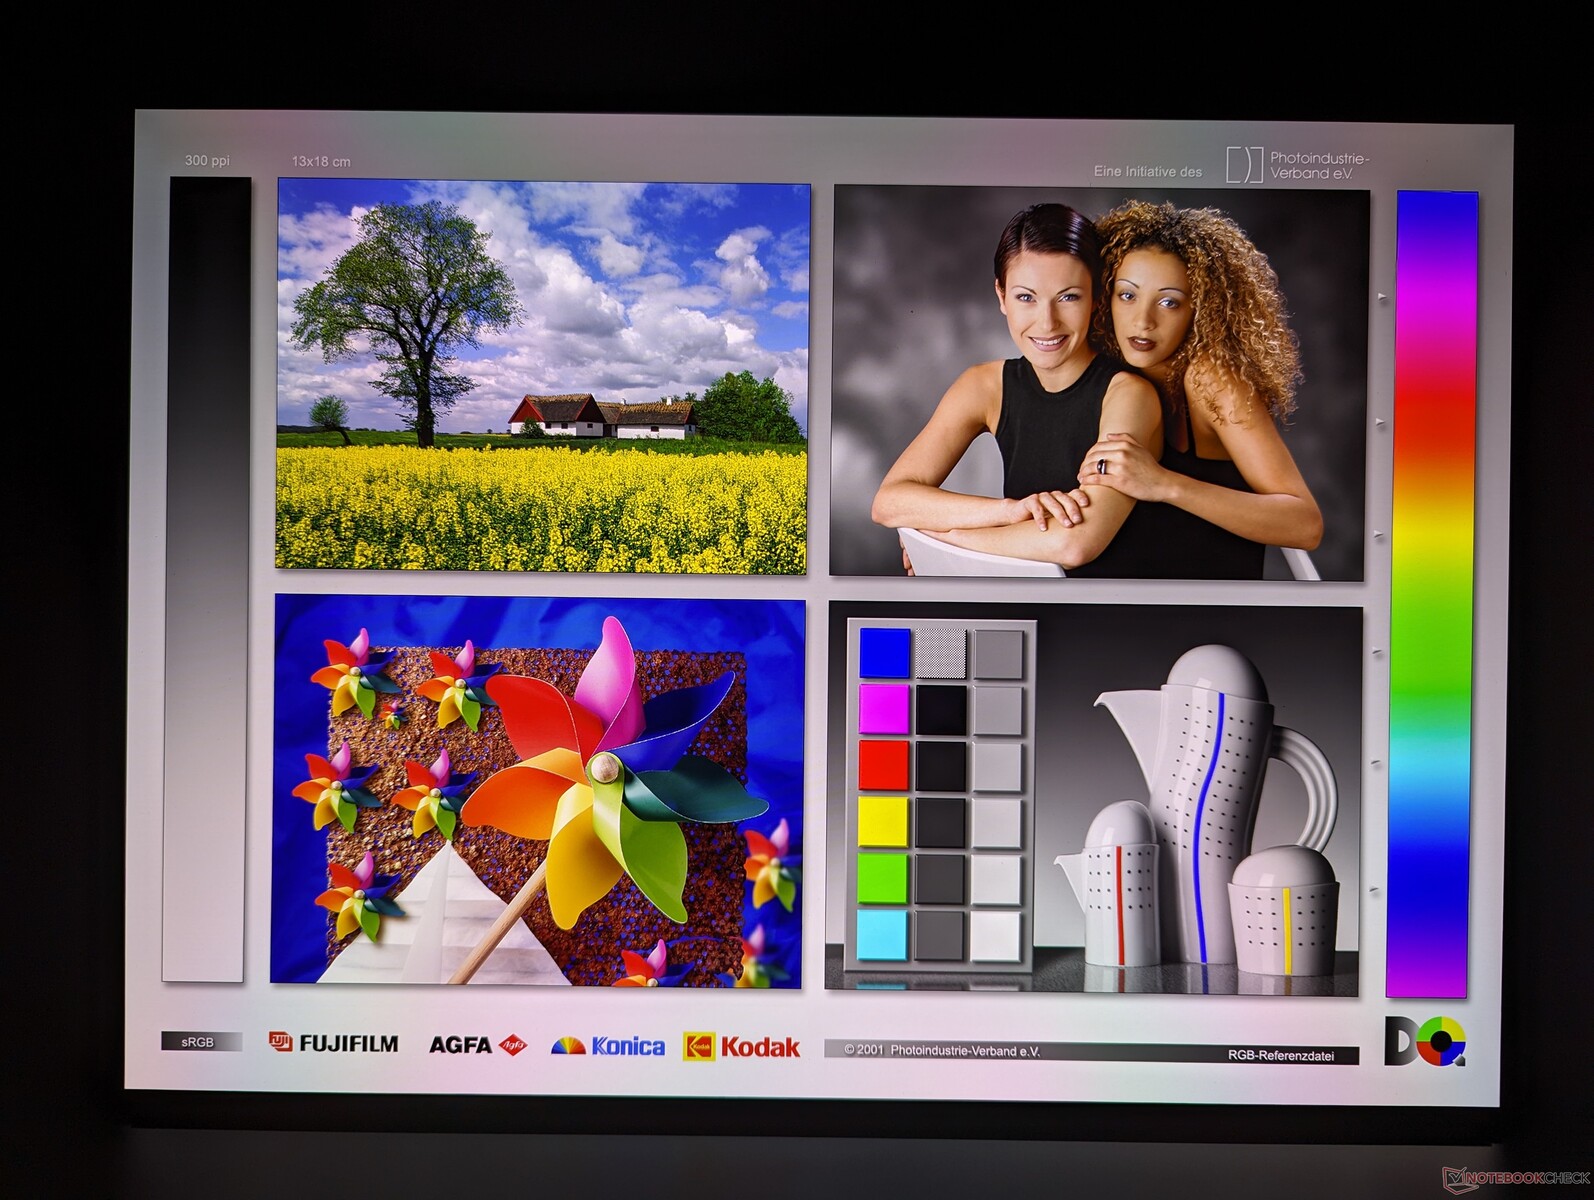
Quando comparado ao painel de 1200p em nossa unidade Gen 1, o painel OLED oferece níveis de preto mais profundos, suporte a HDR, tempos de resposta preto-branco mais rápidos, cores mais vibrantes e uma resolução nativa mais alta. Independentemente da opção, estamos satisfeitos em ver que a cobertura sRGB completa é padrão, sem SKUs de baixo custo a serem evitados. Esperamos que as futuras revisões incluam painéis de alta atualização como os da série Asus VivoBook.

| |||||||||||||||||||||||||
iluminação: 97 %
iluminação com acumulador: 390.1 cd/m²
Contraste: ∞:1 (Preto: 0 cd/m²)
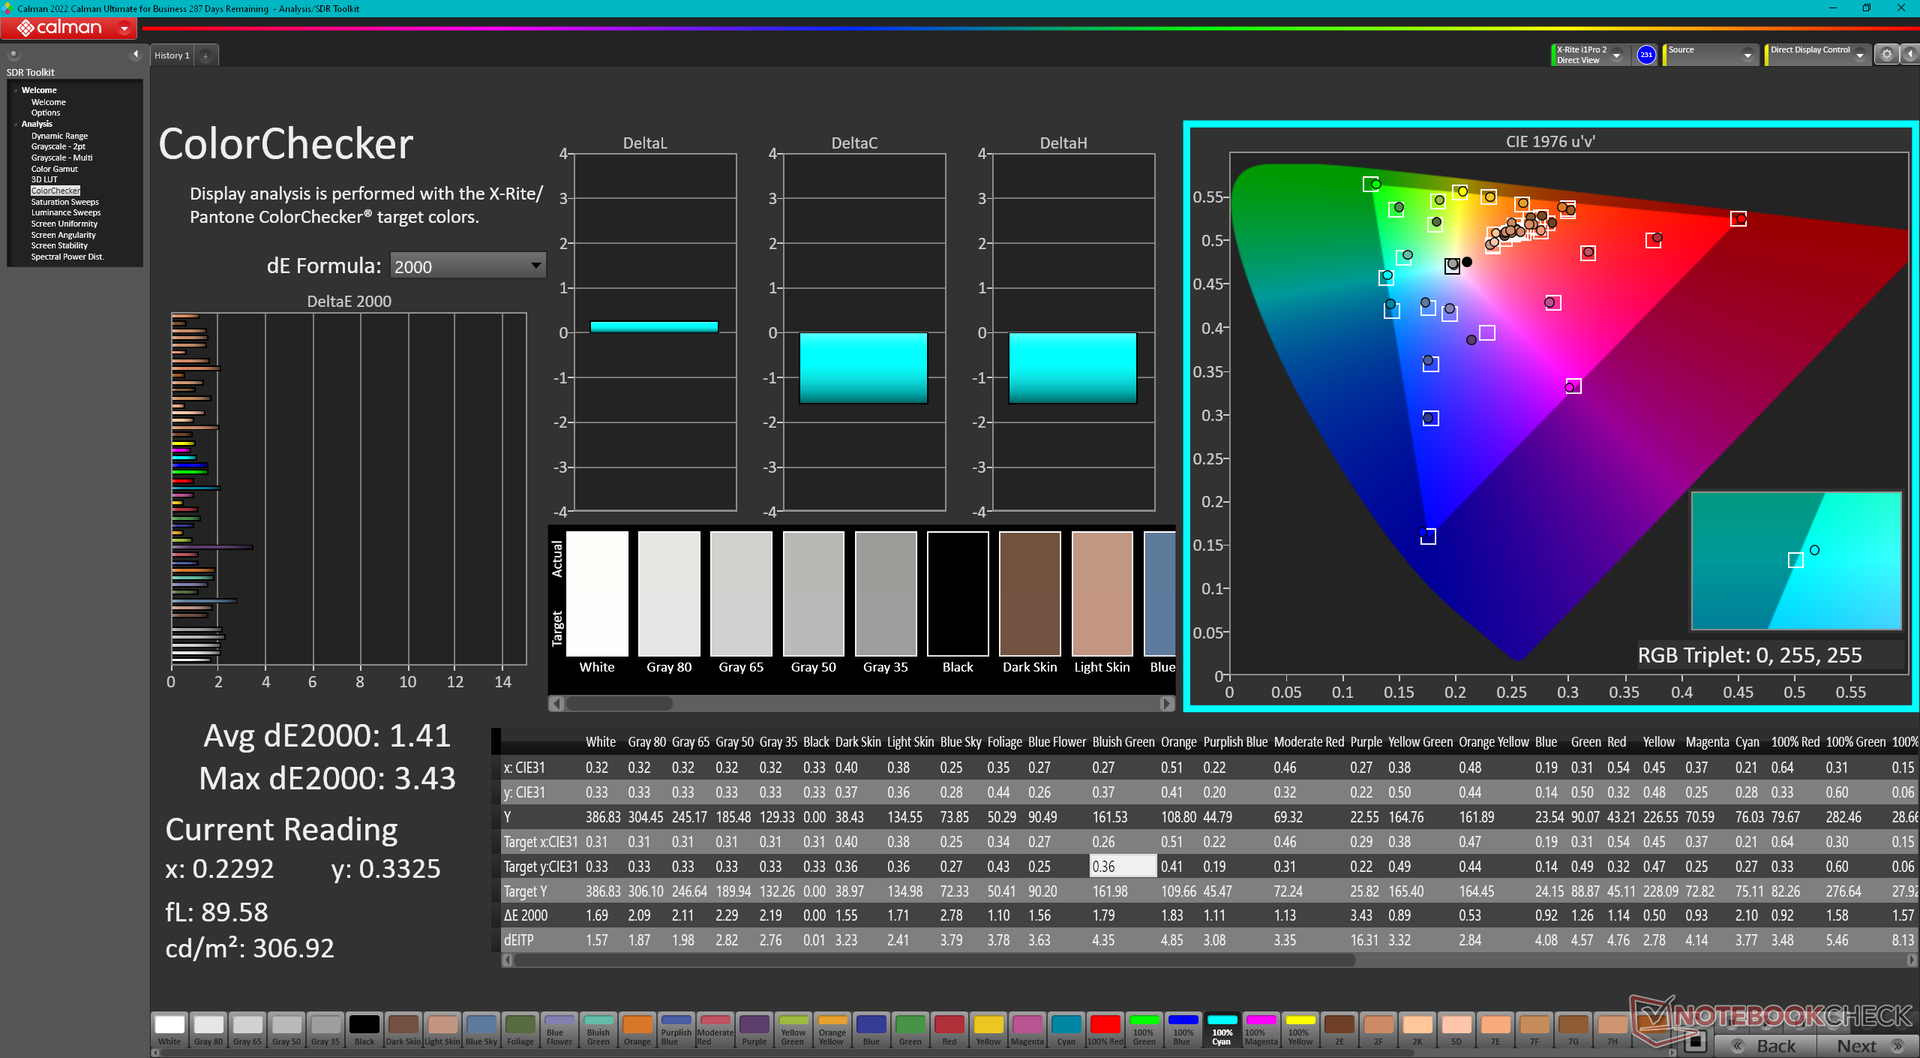
ΔE ColorChecker Calman: 1.41 | ∀{0.5-29.43 Ø4.71}
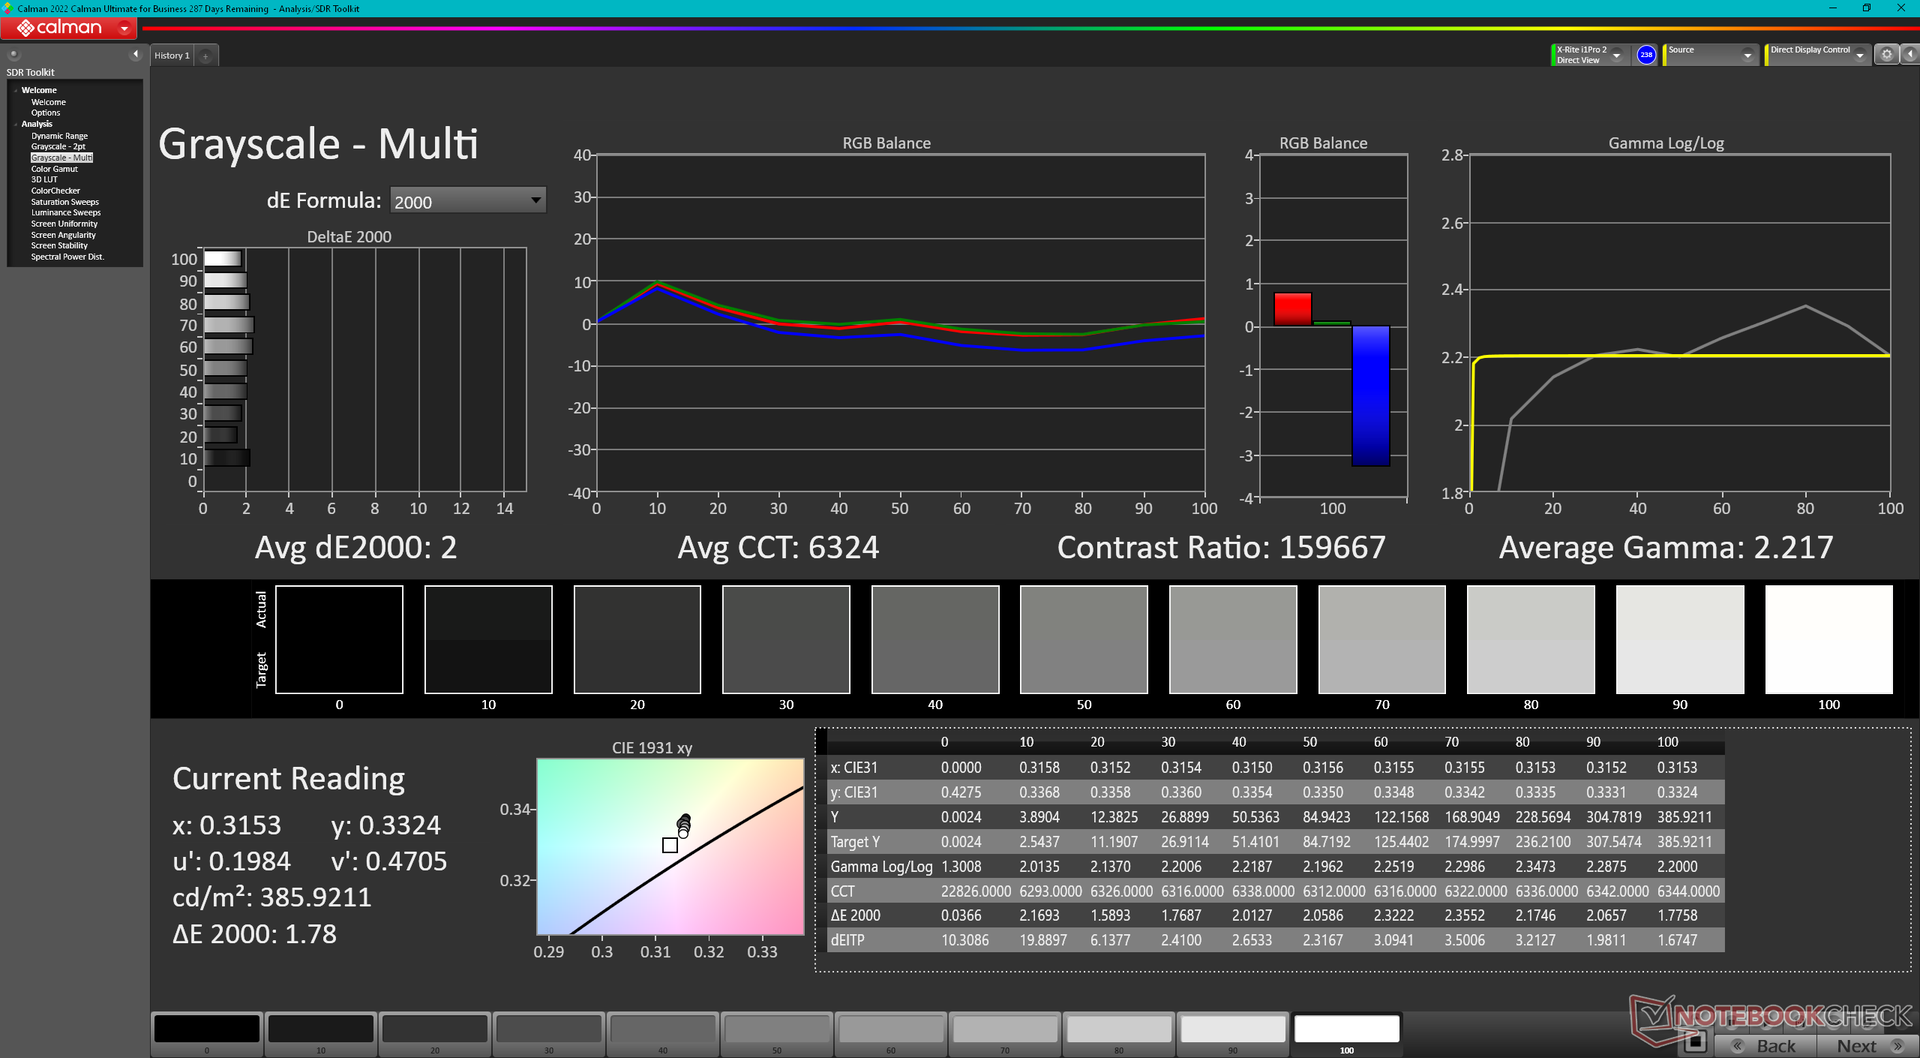
ΔE Greyscale Calman: 2 | ∀{0.09-98 Ø4.96}
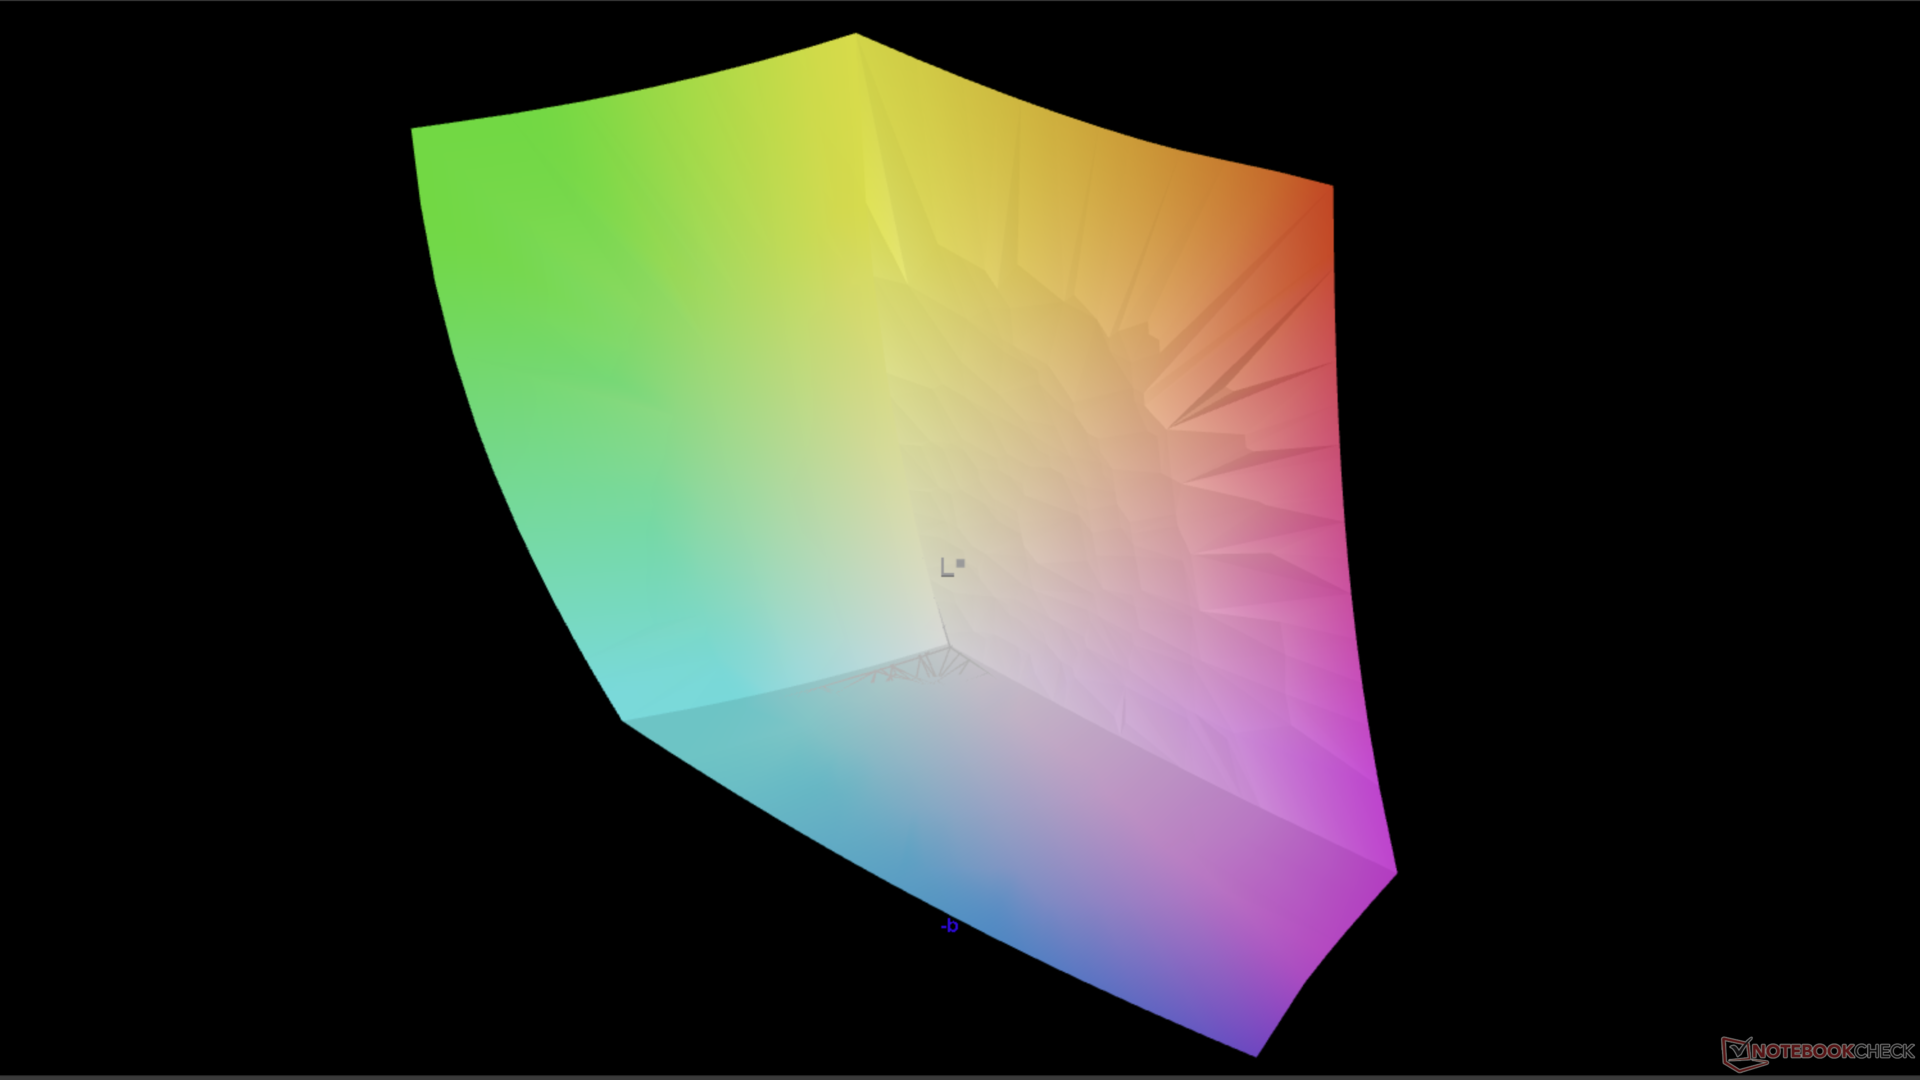
96.7% AdobeRGB 1998 (Argyll 3D)
100% sRGB (Argyll 3D)
99.7% Display P3 (Argyll 3D)
Gamma: 2.22
CCT: 6324 K
| Lenovo ThinkPad Z16 Gen 2 Samsung ATNA60YV04-0, OLED, 3840x2400, 16" | Lenovo ThinkPad Z16 G1 21D5S00T00 NE160WUM-N62 , IPS LED, 1920x1200, 16" | Lenovo ThinkBook 16 G6 ABP LEN160WUXGA, IPS, 1920x1200, 16" | MSI Creator Z16P B12UHST AUOD298, IPS True Pixel (~100% DCI-P3), 2560x1600, 16" | Asus Vivobook Pro 16X K6604JV-MX016W Samsung SDC4178 ATNA60BX01-1, OLED, 3200x2000, 16" | Apple MacBook Pro 16 2023 M3 Max Mini-LED, 3456x2234, 16" | |
|---|---|---|---|---|---|---|
| Display | -18% | -52% | -4% | -1% | -1% | |
| Display P3 Coverage (%) | 99.7 | 70 -30% | 40.4 -59% | 97.6 -2% | 98.4 -1% | 99.2 -1% |
| sRGB Coverage (%) | 100 | 99.7 0% | 59.8 -40% | 99.9 0% | 99.7 0% | |
| AdobeRGB 1998 Coverage (%) | 96.7 | 72.1 -25% | 42 -57% | 86.8 -10% | 95.8 -1% | |
| Response Times | -1637% | -1414% | -417% | 20% | -2852% | |
| Response Time Grey 50% / Grey 80% * (ms) | 1.86 ? | 40 ? -2051% | 32.8 ? -1663% | 12.9 ? -594% | 1.6 ? 14% | 66.9 ? -3497% |
| Response Time Black / White * (ms) | 1.89 ? | 25 ? -1223% | 23.9 ? -1165% | 6.4 ? -239% | 1.4 ? 26% | 43.6 ? -2207% |
| PWM Frequency (Hz) | 60 ? | 120 ? | 14877 | |||
| Screen | -3% | -185% | -23% | -5% | 25% | |
| Brightness middle (cd/m²) | 390.1 | 487 25% | 310 -21% | 428 10% | 347 -11% | 630 61% |
| Brightness (cd/m²) | 393 | 446 13% | 290 -26% | 394 0% | 346 -12% | 604 54% |
| Brightness Distribution (%) | 97 | 83 -14% | 86 -11% | 86 -11% | 97 0% | 94 -3% |
| Black Level * (cd/m²) | 0.31 | 0.22 | 0.42 | 0.06 | ||
| Colorchecker dE 2000 * | 1.41 | 1.8 -28% | 6.2 -340% | 1.67 -18% | 1.89 -34% | 1.2 15% |
| Colorchecker dE 2000 max. * | 3.43 | 3.3 4% | 24.7 -620% | 5.71 -66% | 3.26 5% | 2.8 18% |
| Greyscale dE 2000 * | 2 | 2.3 -15% | 3.8 -90% | 3.1 -55% | 1.55 22% | 1.9 5% |
| Gamma | 2.22 99% | 2.16 102% | 2.22 99% | 2.195 100% | 2.39 92% | 2.29 96% |
| CCT | 6324 103% | 6867 95% | 6011 108% | 6498 100% | 6458 101% | 6812 95% |
| Contrast (:1) | 1571 | 1409 | 1019 | 5783 | ||
| Colorchecker dE 2000 calibrated * | 0.8 | 5.3 | 0.71 | 1.97 | ||
| Média Total (Programa/Configurações) | -553% /
-304% | -550% /
-372% | -148% /
-90% | 5% /
1% | -943% /
-617% |
* ... menor é melhor
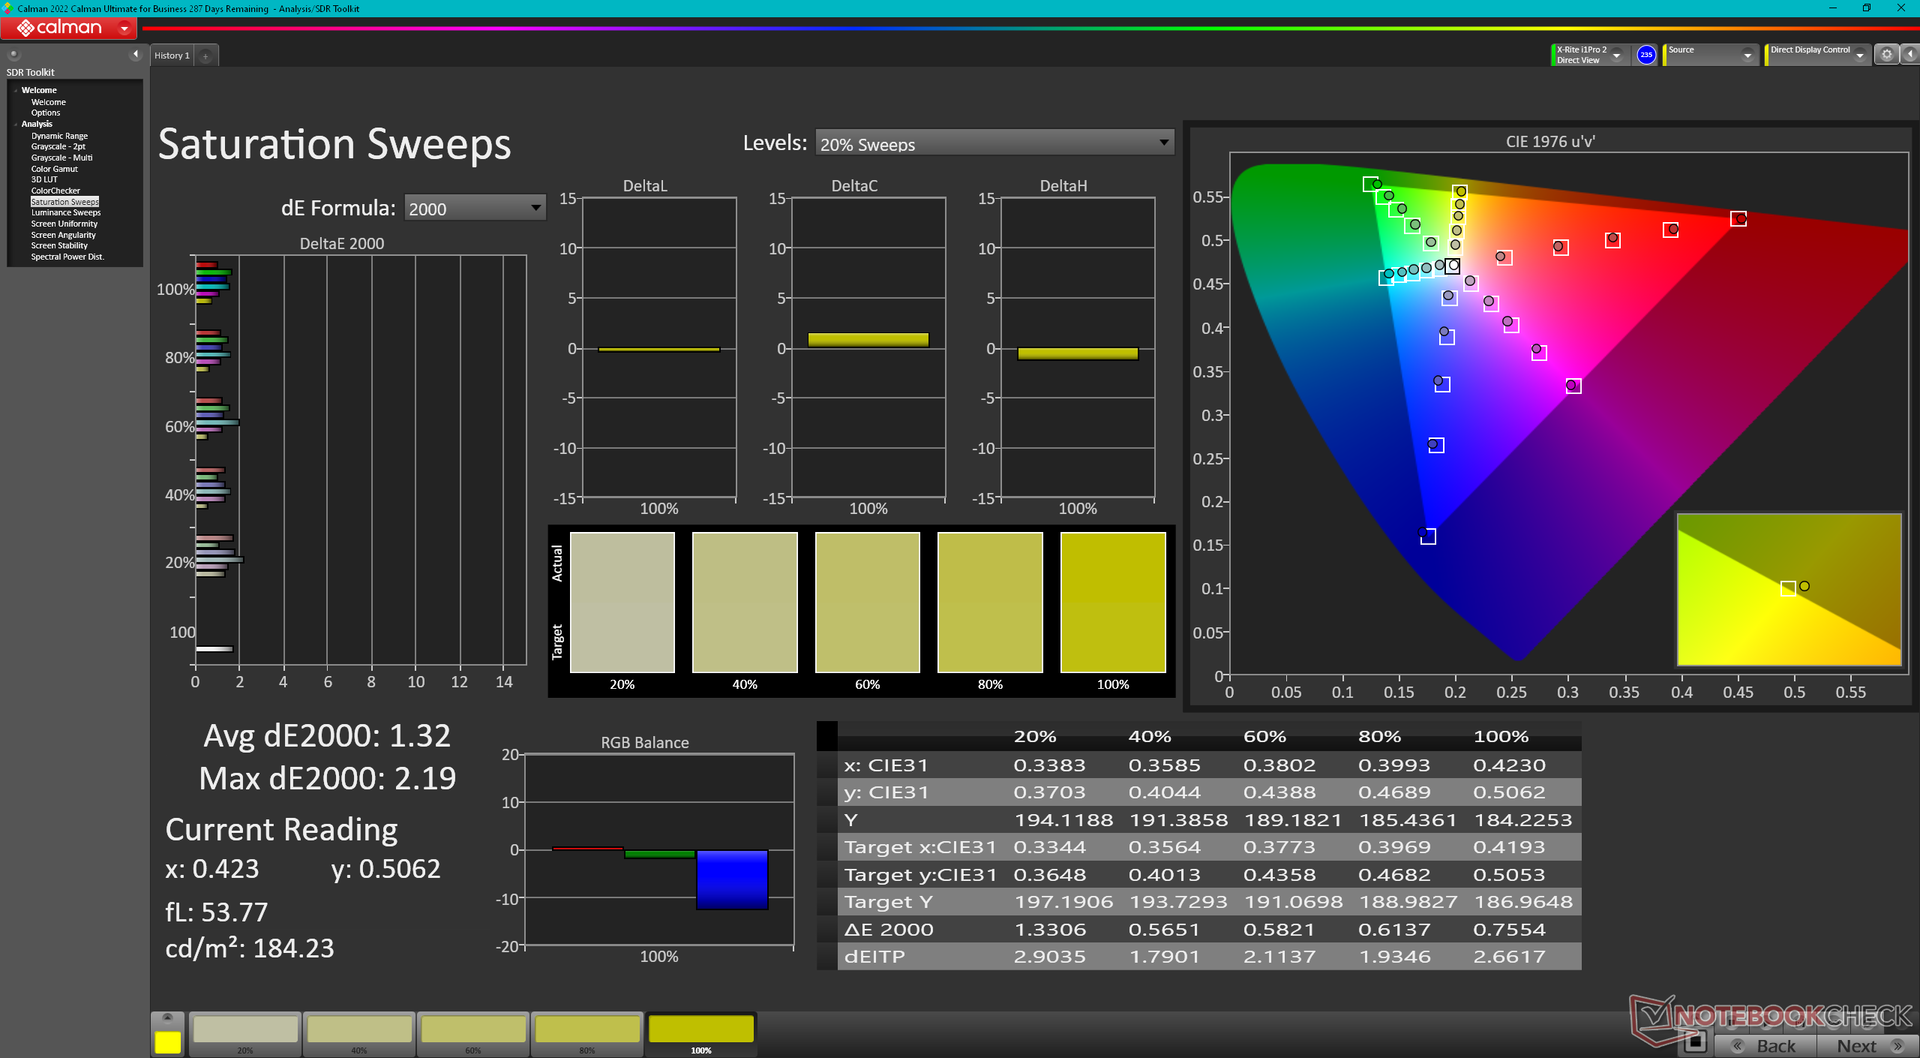
A tela OLED é bem calibrada logo que sai da caixa, com valores médios de deltaE de escala de cinza e cor de apenas 2,0 e 1,41, respectivamente. Portanto, a calibração do usuário final não é necessária para a grande maioria dos usuários.
Exibir tempos de resposta
| ↔ Tempo de resposta preto para branco | ||
|---|---|---|
| 1.89 ms ... ascensão ↗ e queda ↘ combinadas | ↗ ms ascensão | 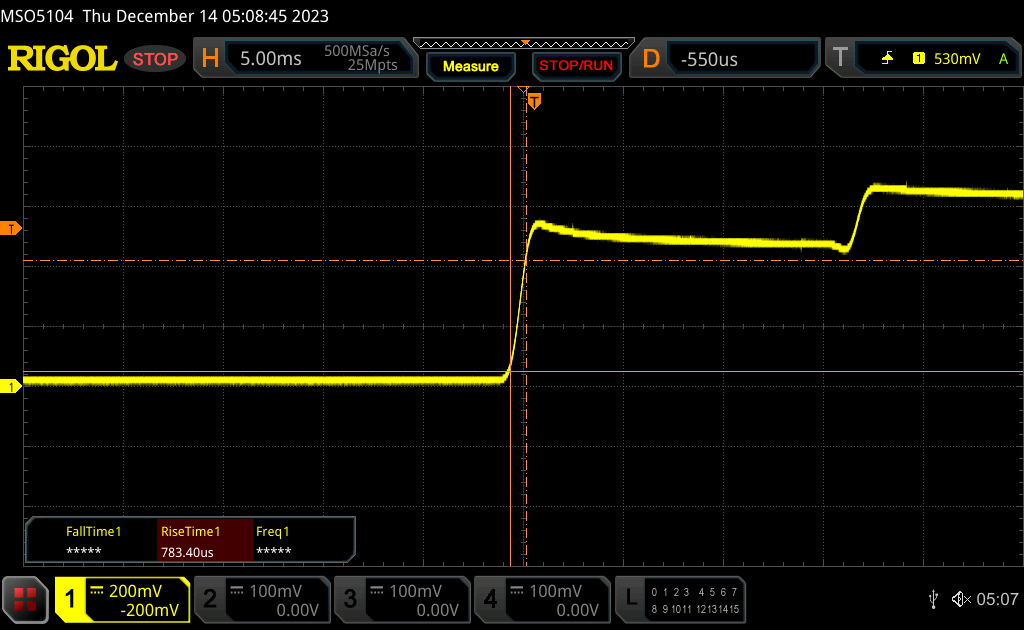 |
| ↘ 0.89 ms queda | ||
| A tela mostra taxas de resposta muito rápidas em nossos testes e deve ser muito adequada para jogos em ritmo acelerado. Em comparação, todos os dispositivos testados variam de 0.1 (mínimo) a 240 (máximo) ms. » 11 % de todos os dispositivos são melhores. Isso significa que o tempo de resposta medido é melhor que a média de todos os dispositivos testados (19.8 ms). | ||
| ↔ Tempo de resposta 50% cinza a 80% cinza | ||
| 1.86 ms ... ascensão ↗ e queda ↘ combinadas | ↗ 0.96 ms ascensão | 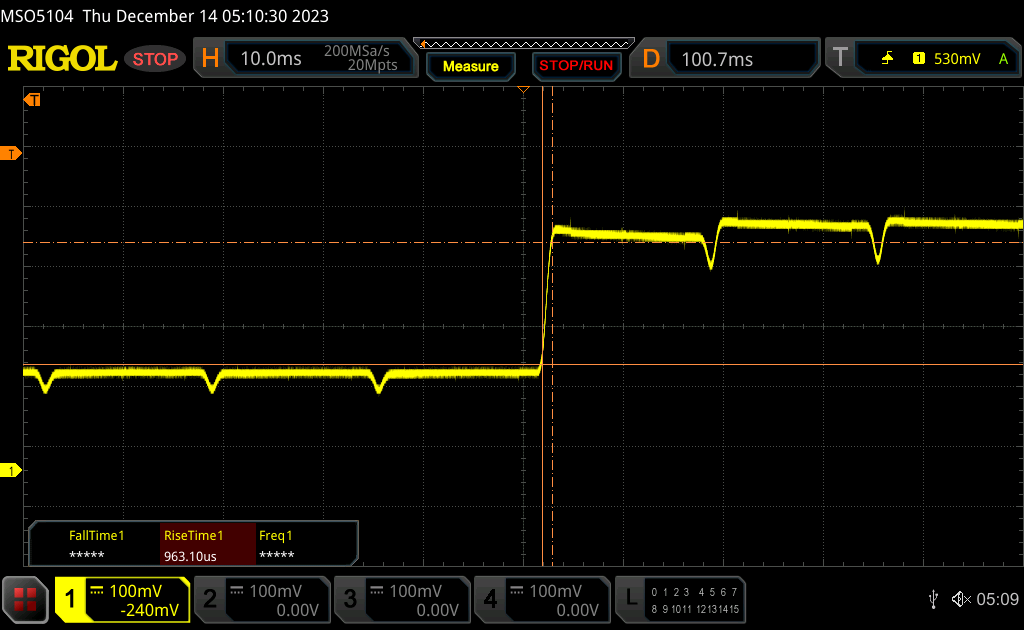 |
| ↘ 0.9 ms queda | ||
| A tela mostra taxas de resposta muito rápidas em nossos testes e deve ser muito adequada para jogos em ritmo acelerado. Em comparação, todos os dispositivos testados variam de 0.165 (mínimo) a 636 (máximo) ms. » 9 % de todos os dispositivos são melhores. Isso significa que o tempo de resposta medido é melhor que a média de todos os dispositivos testados (31 ms). | ||
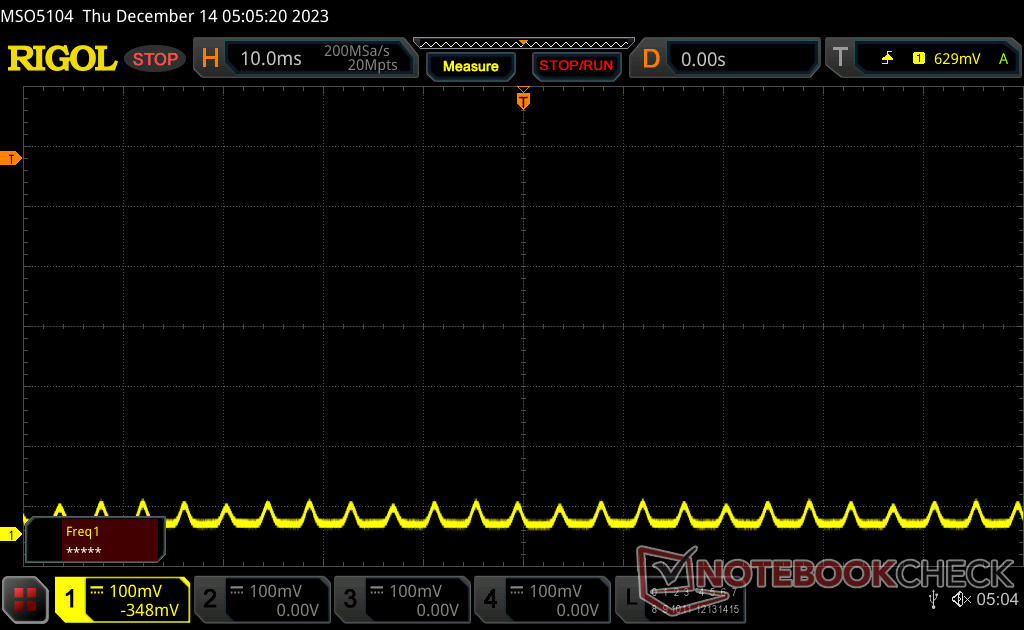
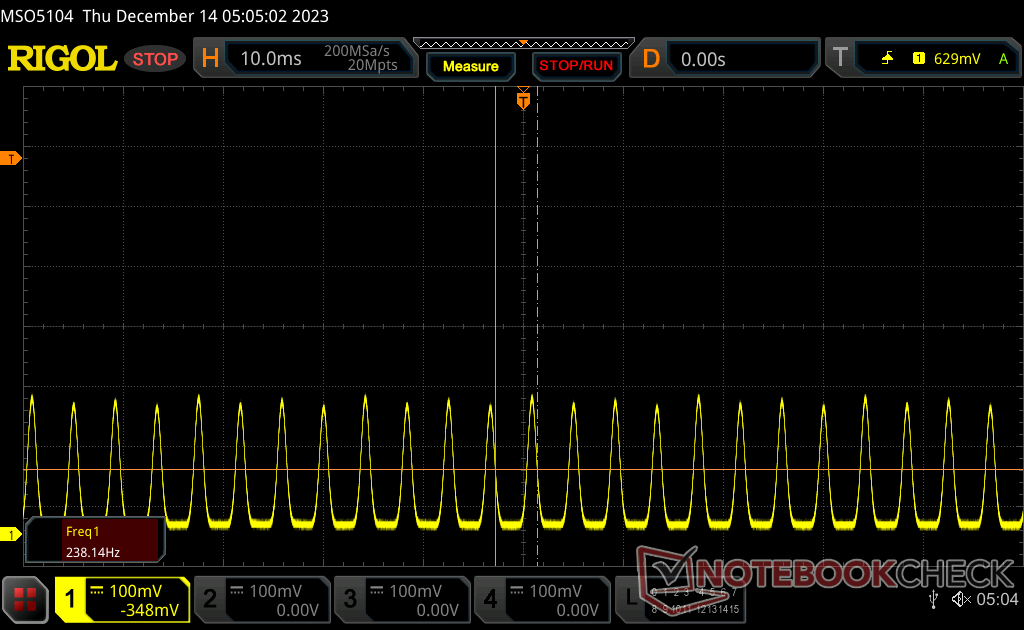
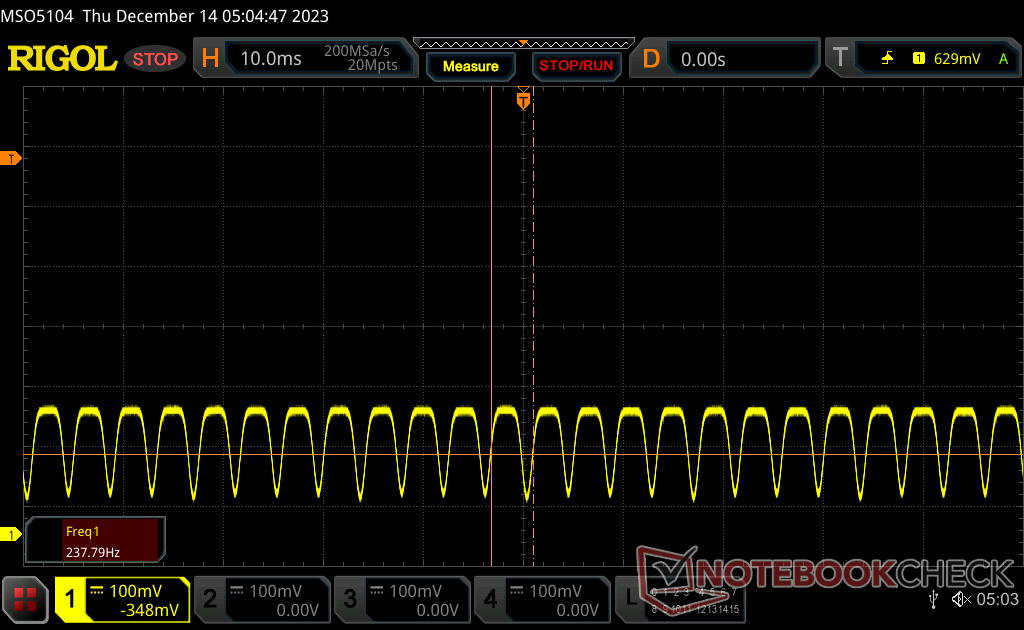
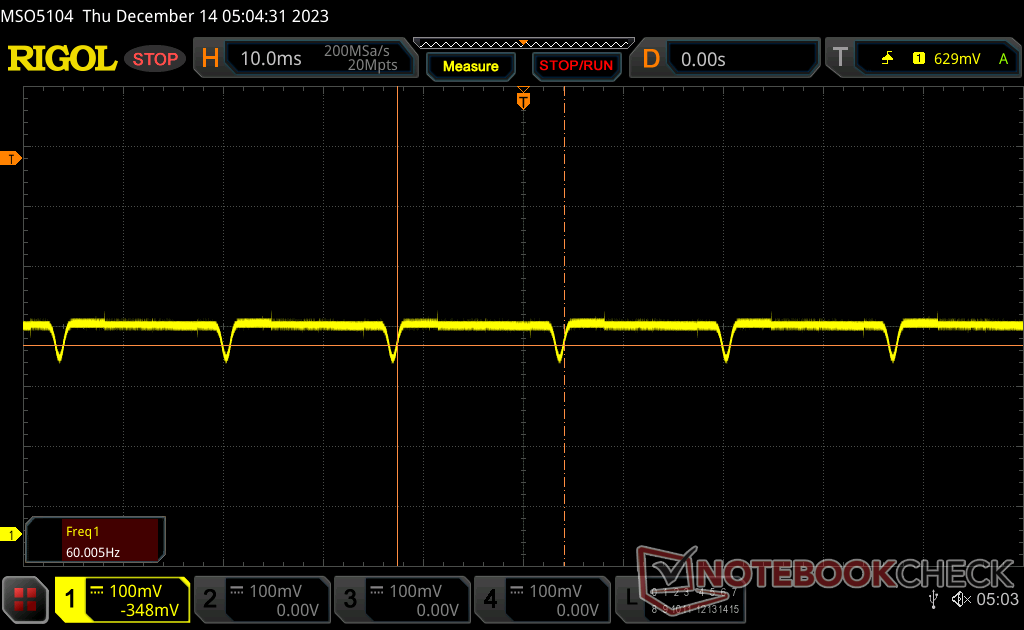
Cintilação da tela / PWM (modulação por largura de pulso)
| Tela tremeluzindo/PWM detectado | 60 Hz | ≤ 100 % configuração de brilho | 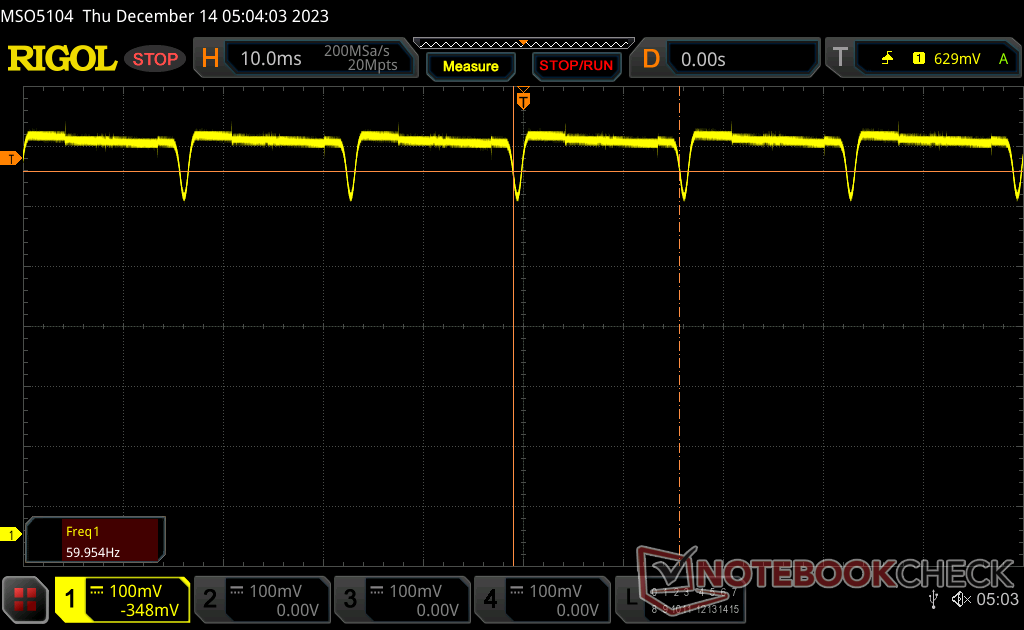 |
A luz de fundo da tela pisca em 60 Hz (pior caso, por exemplo, utilizando PWM) Cintilação detectada em uma configuração de brilho de 100 % e abaixo. Não deve haver cintilação ou PWM acima desta configuração de brilho. A frequência de 60 Hz é muito baixa, portanto a oscilação pode causar fadiga ocular e dores de cabeça após uso prolongado. [pwm_comparison] Em comparação: 52 % de todos os dispositivos testados não usam PWM para escurecer a tela. Se PWM foi detectado, uma média de 7757 (mínimo: 5 - máximo: 343500) Hz foi medida. | |||
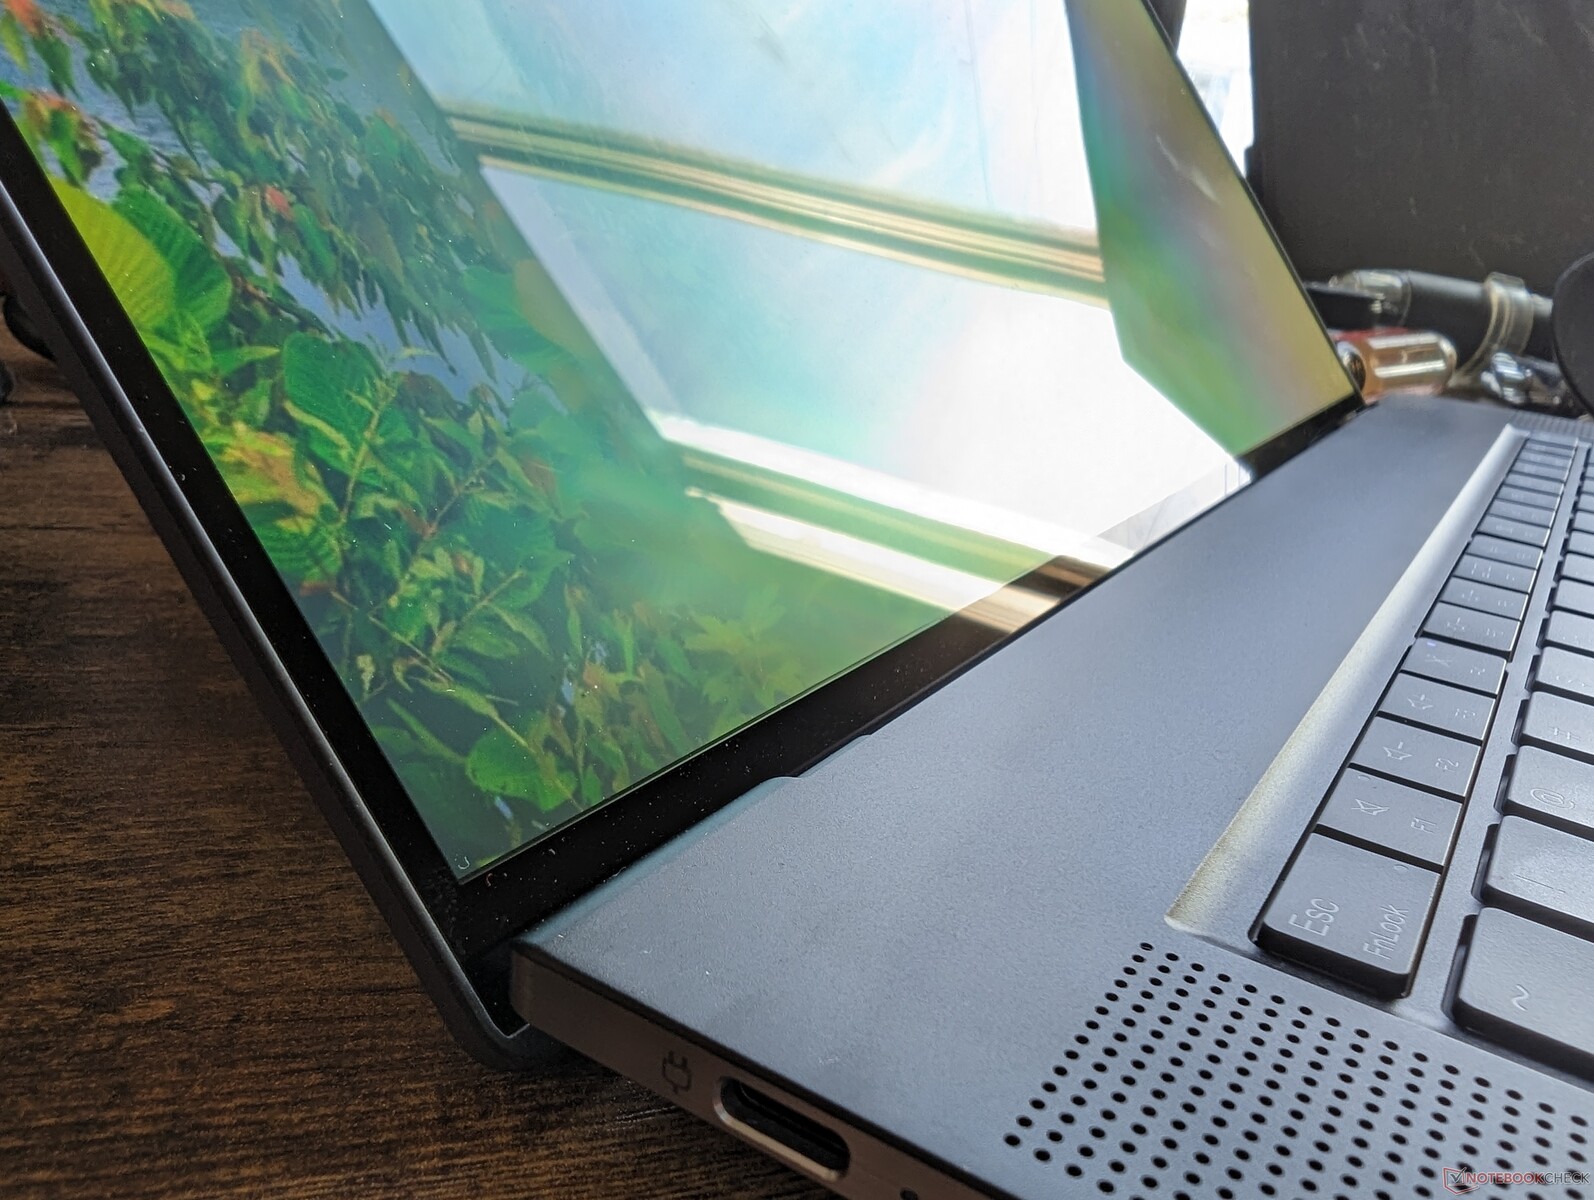
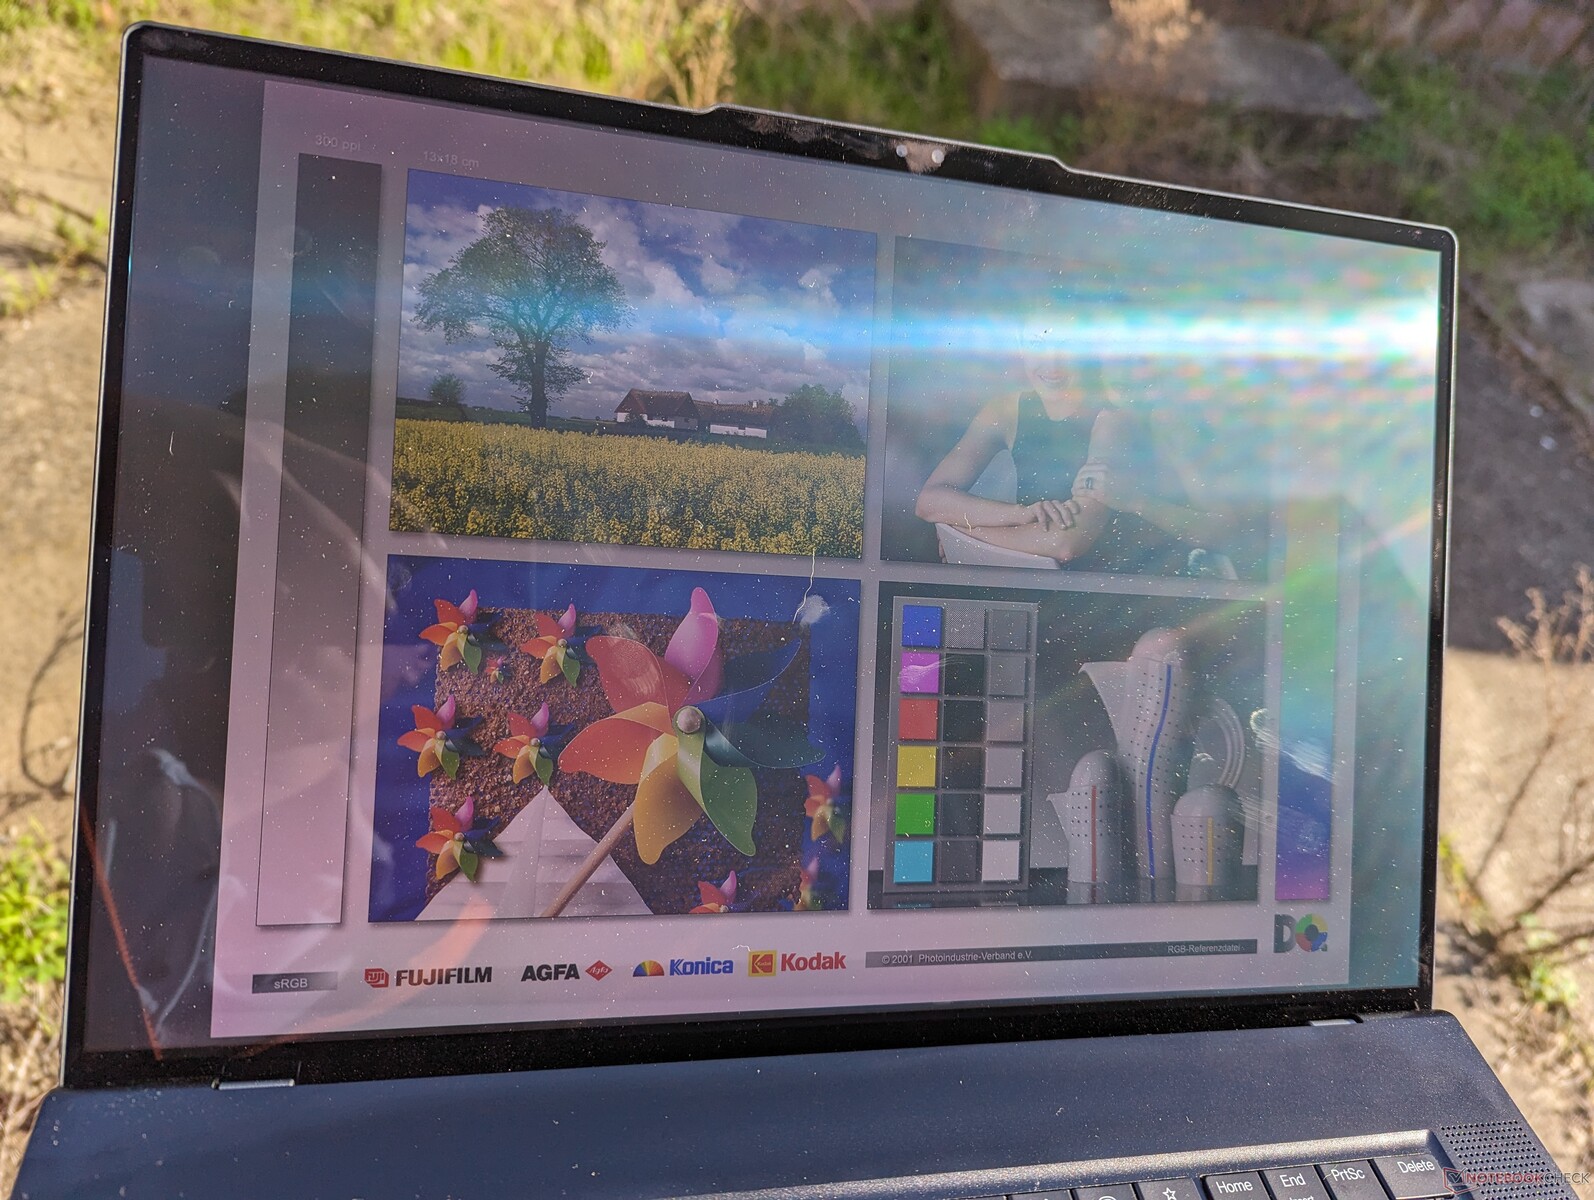
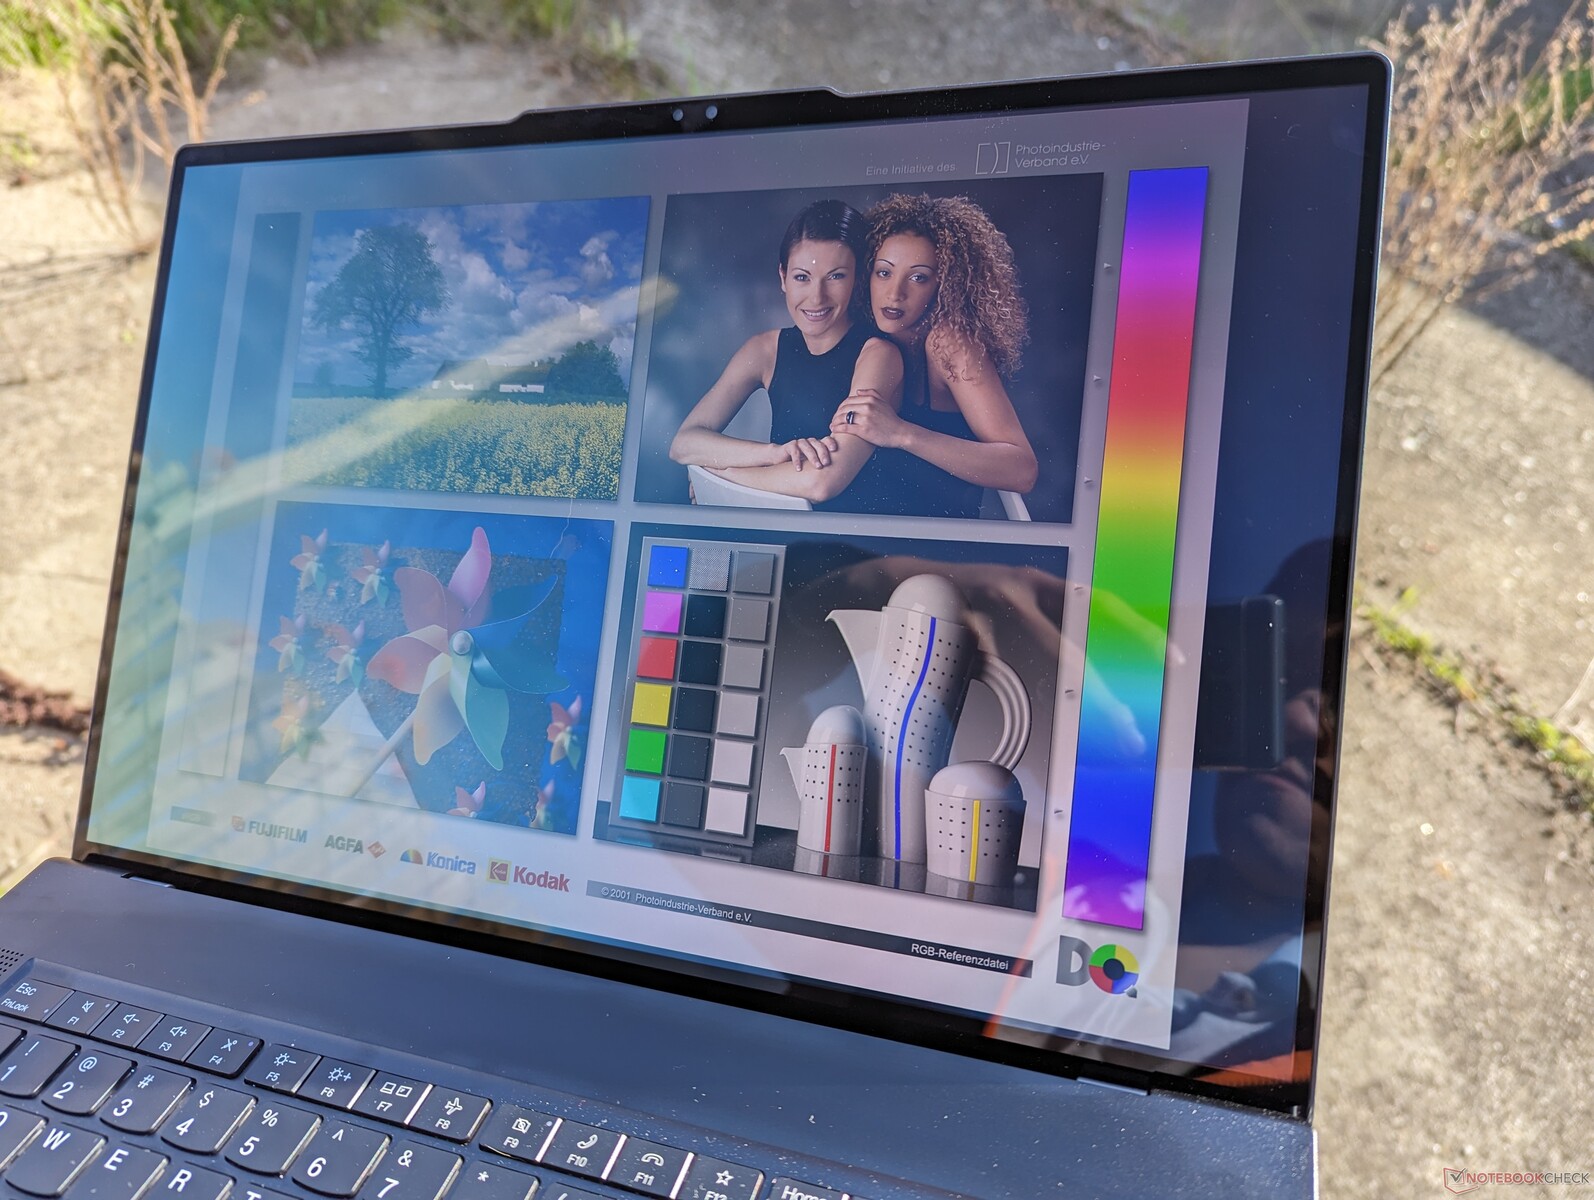
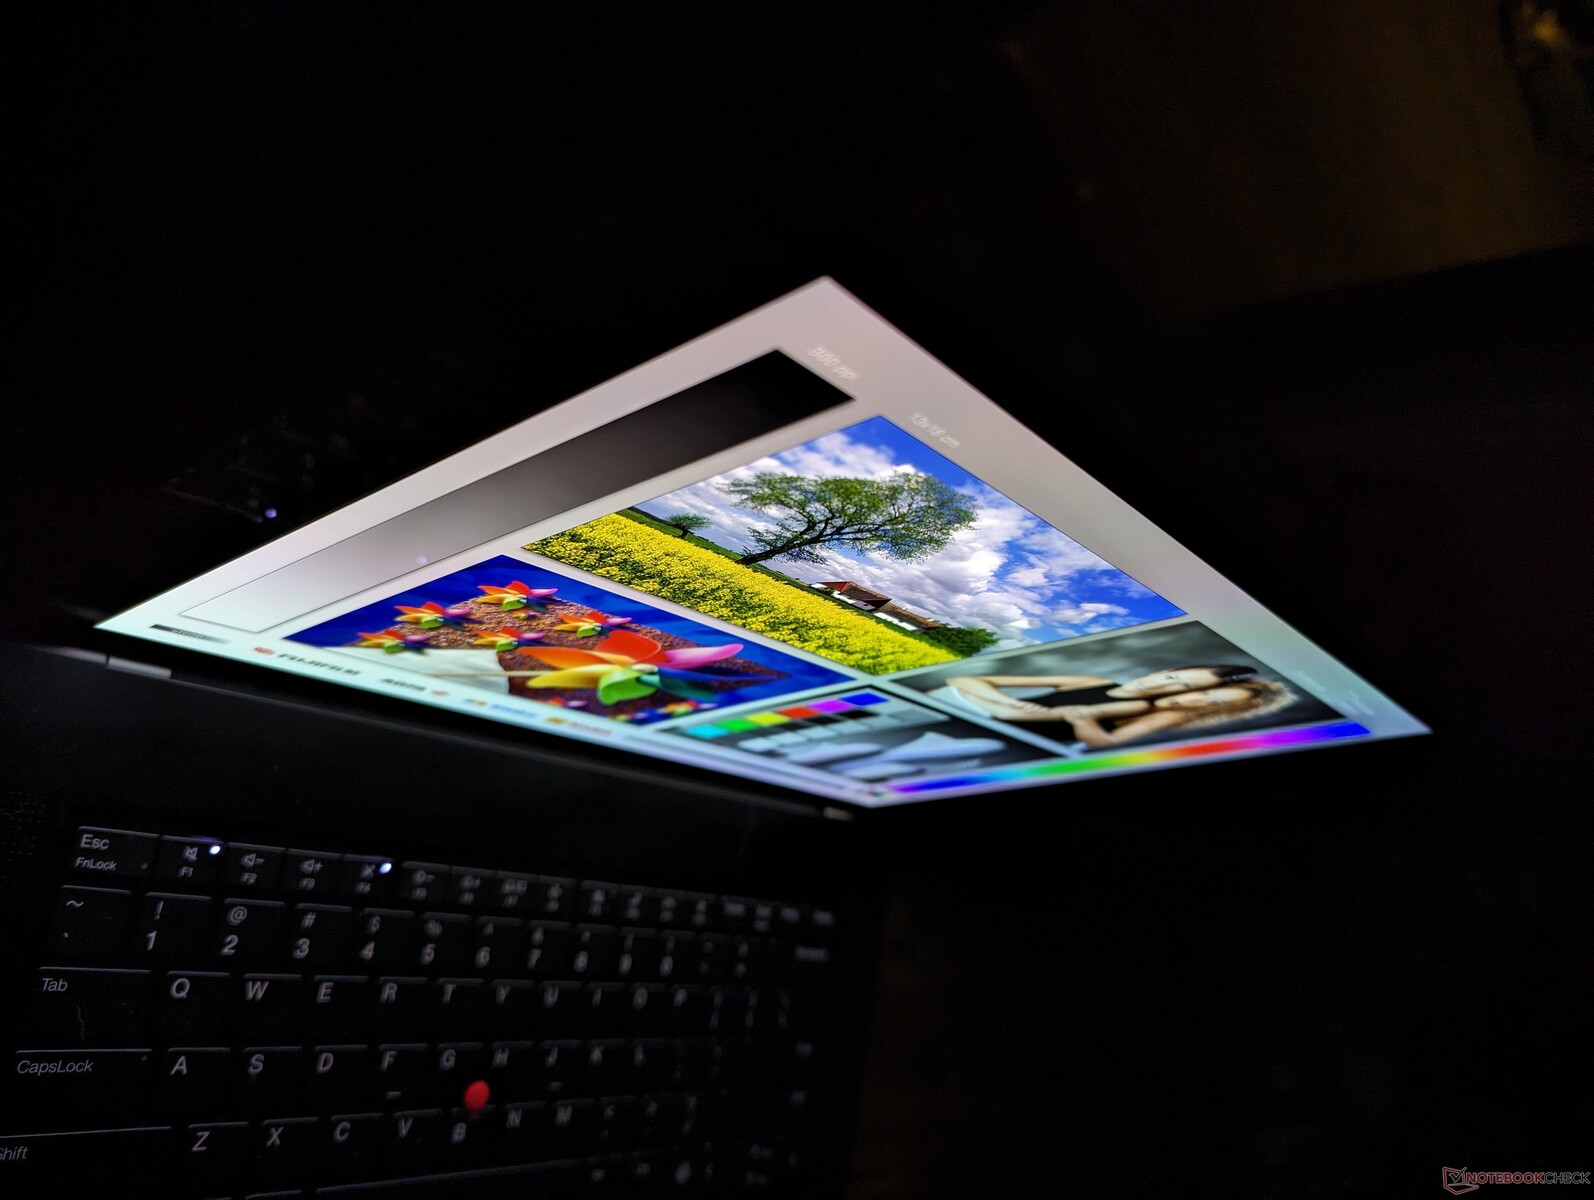
Os ângulos de visão são mais amplos do que os do IPS, enquanto os níveis de preto mais profundos ajudam a manter as cores sob iluminação ambiente intensa. Mesmo assim, o brilho da sobreposição brilhante é inevitável e o brilho máximo não é mais brilhante do que a configuração IPS de 1200p básica. Em comparação, a tela do MacBook Pro 16 é 50% mais brilhante para melhor visibilidade em ambientes externos.
Desempenho
Condições de teste
Definimos o Windows para o modo Desempenho antes de executar os benchmarks abaixo. O software Lenovo Commercial Vantage pré-instalado não inclui nenhuma configuração adicional de perfil de energia além da seleção usual do Windows. No entanto, ele é vital para atualizações do BIOS e para ajustar o comportamento de carregamento da bateria.
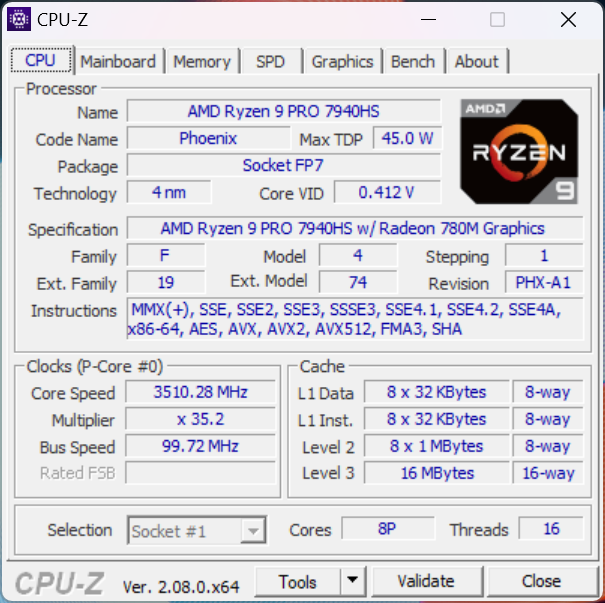
Processador
O Ryzen 9 Pro 7940HS tem desempenho idêntico ao do Ryzen 9 7940HS encontrado no Asus TUF Gaming A16. Portanto, os usuários não precisarão sacrificar o desempenho para aproveitar os recursos Pro. O desempenho geral é comparável ao da 12ª geração do ano passado Core i9-12900H da 12ª geração do ano passado, tanto em cargas de trabalho com um único thread quanto com vários threads.
As diferenças de desempenho entre nosso Zen 4 Ryzen 9 Pro 7940HS e o Zen 3+ Ryzen 7 Pro 6850H no ThinkPad Z16 Gen 1 do ano passado podem ser bastante significativas, de 35 a 45%, para cargas de trabalho multithread devido ao maior número de núcleos. Portanto, o aumento de desempenho com o Zen 4 é um dos principais motivos para escolher a versão Gen 2 do ThinkPad Z16 em vez da Gen 1.
As configurações de baixo custo oferecem o Ryzen 7 Pro 7840HS ou Ryzen 5 Pro 7640HS em vez disso. A opção Ryzen 7 tem desempenho quase idêntico ao da opção Ryzen 9, com base em nosso tempo com o Lenovo Legion Slim 5 16 e, portanto, é recomendável escolher uma configuração do Ryzen 7 para economizar nos custos. Na verdade, o Ryzen 7 Pro 7840HS compartilha exatamente o mesmo número de núcleos e recursos que o Ryzen 9 Pro 7940HS, com apenas pequenas diferenças de 100 a 200 MHz nas taxas de clock alvo.
Espera-se que o downgrade para a configuração do Ryzen 5 Pro 7640HS afete o desempenho do processador de forma mais significativa, em cerca de 30 a 35 por cento, com base em nosso tempo com o HP ZBook Firefly 14 G10. Os deltas de desempenho entre as opções Ryzen 5, Ryzen 7 e Ryzen 9 estão, portanto, muito distorcidos entre as SKUs Ryzen 5 e Ryzen 7.
Cinebench R15 Multi Loop
Cinebench R23: Multi Core | Single Core
Cinebench R20: CPU (Multi Core) | CPU (Single Core)
Cinebench R15: CPU Multi 64Bit | CPU Single 64Bit
Blender: v2.79 BMW27 CPU
7-Zip 18.03: 7z b 4 | 7z b 4 -mmt1
Geekbench 5.5: Multi-Core | Single-Core
HWBOT x265 Benchmark v2.2: 4k Preset
LibreOffice : 20 Documents To PDF
R Benchmark 2.5: Overall mean
* ... menor é melhor
AIDA64: FP32 Ray-Trace | FPU Julia | CPU SHA3 | CPU Queen | FPU SinJulia | FPU Mandel | CPU AES | CPU ZLib | FP64 Ray-Trace | CPU PhotoWorxx
| Performance rating | |
| Lenovo ThinkPad Z16 Gen 2 | |
| Asus Vivobook Pro 16X K6604JV-MX016W | |
| Média AMD Ryzen 9 PRO 7940HS | |
| Lenovo ThinkPad Z16 G1 21D5S00T00 | |
| MSI Creator Z16P B12UHST | |
| Lenovo ThinkBook 16 G6 ABP | |
| AIDA64 / FP32 Ray-Trace | |
| Lenovo ThinkPad Z16 Gen 2 | |
| Média AMD Ryzen 9 PRO 7940HS (24034 - 27411, n=3) | |
| Asus Vivobook Pro 16X K6604JV-MX016W | |
| Lenovo ThinkPad Z16 G1 21D5S00T00 | |
| Lenovo ThinkBook 16 G6 ABP | |
| MSI Creator Z16P B12UHST | |
| AIDA64 / FPU Julia | |
| Lenovo ThinkPad Z16 Gen 2 | |
| Asus Vivobook Pro 16X K6604JV-MX016W | |
| Média AMD Ryzen 9 PRO 7940HS (101262 - 116960, n=3) | |
| Lenovo ThinkPad Z16 G1 21D5S00T00 | |
| Lenovo ThinkBook 16 G6 ABP | |
| MSI Creator Z16P B12UHST | |
| AIDA64 / CPU SHA3 | |
| Asus Vivobook Pro 16X K6604JV-MX016W | |
| Lenovo ThinkPad Z16 Gen 2 | |
| Média AMD Ryzen 9 PRO 7940HS (4418 - 4944, n=3) | |
| Lenovo ThinkPad Z16 G1 21D5S00T00 | |
| MSI Creator Z16P B12UHST | |
| Lenovo ThinkBook 16 G6 ABP | |
| AIDA64 / CPU Queen | |
| Asus Vivobook Pro 16X K6604JV-MX016W | |
| Lenovo ThinkPad Z16 Gen 2 | |
| Média AMD Ryzen 9 PRO 7940HS (112873 - 124565, n=3) | |
| MSI Creator Z16P B12UHST | |
| Lenovo ThinkPad Z16 G1 21D5S00T00 | |
| Lenovo ThinkBook 16 G6 ABP | |
| AIDA64 / FPU SinJulia | |
| Lenovo ThinkPad Z16 Gen 2 | |
| Média AMD Ryzen 9 PRO 7940HS (14147 - 15304, n=3) | |
| Asus Vivobook Pro 16X K6604JV-MX016W | |
| Lenovo ThinkPad Z16 G1 21D5S00T00 | |
| MSI Creator Z16P B12UHST | |
| Lenovo ThinkBook 16 G6 ABP | |
| AIDA64 / FPU Mandel | |
| Lenovo ThinkPad Z16 Gen 2 | |
| Média AMD Ryzen 9 PRO 7940HS (54003 - 62357, n=3) | |
| Asus Vivobook Pro 16X K6604JV-MX016W | |
| Lenovo ThinkPad Z16 G1 21D5S00T00 | |
| Lenovo ThinkBook 16 G6 ABP | |
| MSI Creator Z16P B12UHST | |
| AIDA64 / CPU AES | |
| Asus Vivobook Pro 16X K6604JV-MX016W | |
| MSI Creator Z16P B12UHST | |
| Lenovo ThinkPad Z16 Gen 2 | |
| Média AMD Ryzen 9 PRO 7940HS (76133 - 88705, n=3) | |
| Lenovo ThinkPad Z16 G1 21D5S00T00 | |
| Lenovo ThinkBook 16 G6 ABP | |
| AIDA64 / CPU ZLib | |
| Asus Vivobook Pro 16X K6604JV-MX016W | |
| MSI Creator Z16P B12UHST | |
| Lenovo ThinkPad Z16 Gen 2 | |
| Média AMD Ryzen 9 PRO 7940HS (976 - 1079, n=3) | |
| Lenovo ThinkPad Z16 G1 21D5S00T00 | |
| Lenovo ThinkBook 16 G6 ABP | |
| AIDA64 / FP64 Ray-Trace | |
| Lenovo ThinkPad Z16 Gen 2 | |
| Média AMD Ryzen 9 PRO 7940HS (12715 - 14590, n=3) | |
| Asus Vivobook Pro 16X K6604JV-MX016W | |
| Lenovo ThinkPad Z16 G1 21D5S00T00 | |
| Lenovo ThinkBook 16 G6 ABP | |
| MSI Creator Z16P B12UHST | |
| AIDA64 / CPU PhotoWorxx | |
| Asus Vivobook Pro 16X K6604JV-MX016W | |
| MSI Creator Z16P B12UHST | |
| Lenovo ThinkPad Z16 Gen 2 | |
| Média AMD Ryzen 9 PRO 7940HS (24030 - 37800, n=3) | |
| Lenovo ThinkPad Z16 G1 21D5S00T00 | |
| Lenovo ThinkBook 16 G6 ABP | |
Desempenho do sistema
CrossMark: Overall | Productivity | Creativity | Responsiveness
WebXPRT 3: Overall
WebXPRT 4: Overall
Mozilla Kraken 1.1: Total
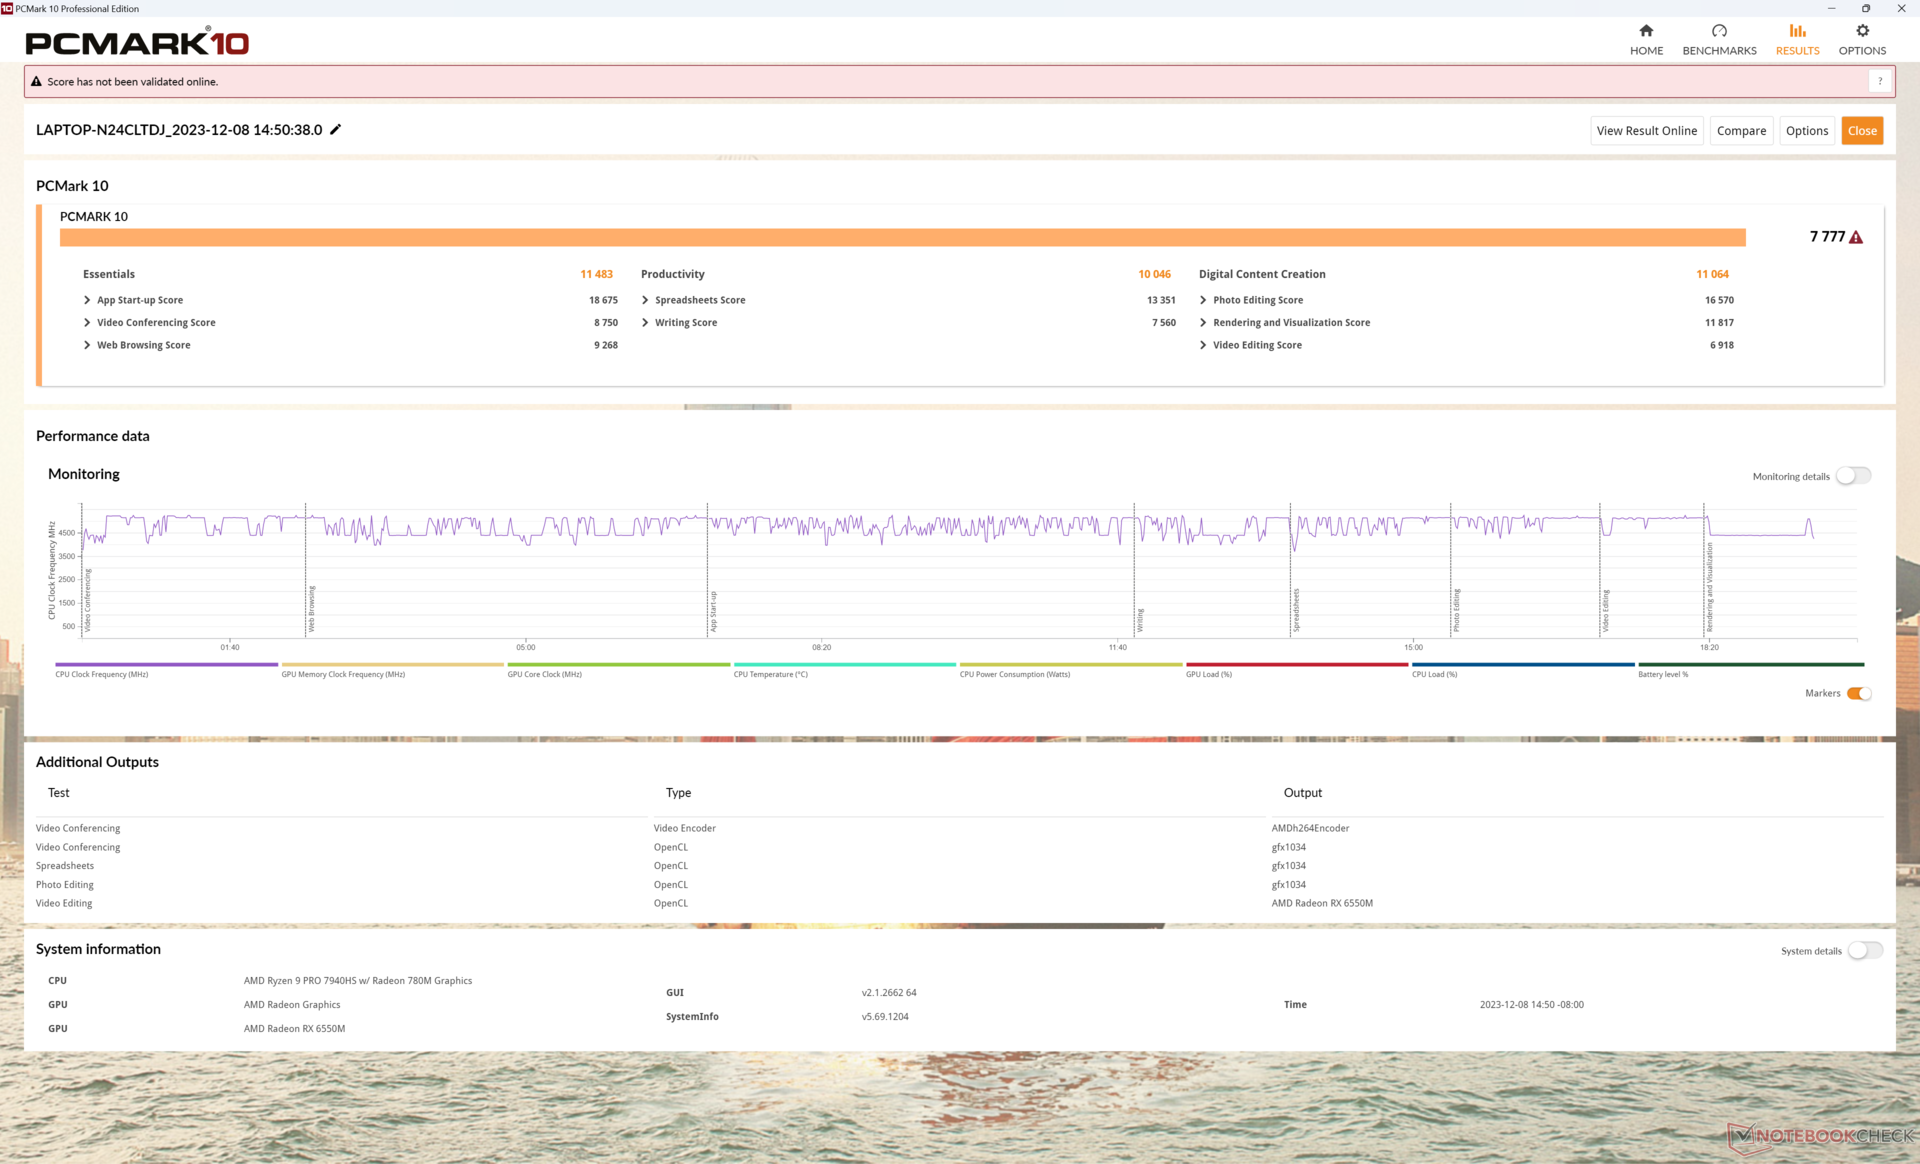
| PCMark 10 / Score | |
| MSI Creator Z16P B12UHST | |
| Lenovo ThinkPad Z16 Gen 2 | |
| Média AMD Ryzen 9 PRO 7940HS, AMD Radeon RX 6550M (n=1) | |
| Asus Vivobook Pro 16X K6604JV-MX016W | |
| Lenovo ThinkPad Z16 G1 21D5S00T00 | |
| Lenovo ThinkBook 16 G6 ABP | |
| PCMark 10 / Essentials | |
| Lenovo ThinkPad Z16 Gen 2 | |
| Média AMD Ryzen 9 PRO 7940HS, AMD Radeon RX 6550M (n=1) | |
| MSI Creator Z16P B12UHST | |
| Lenovo ThinkBook 16 G6 ABP | |
| Asus Vivobook Pro 16X K6604JV-MX016W | |
| Lenovo ThinkPad Z16 G1 21D5S00T00 | |
| PCMark 10 / Productivity | |
| MSI Creator Z16P B12UHST | |
| Lenovo ThinkPad Z16 Gen 2 | |
| Média AMD Ryzen 9 PRO 7940HS, AMD Radeon RX 6550M (n=1) | |
| Lenovo ThinkBook 16 G6 ABP | |
| Asus Vivobook Pro 16X K6604JV-MX016W | |
| Lenovo ThinkPad Z16 G1 21D5S00T00 | |
| PCMark 10 / Digital Content Creation | |
| MSI Creator Z16P B12UHST | |
| Lenovo ThinkPad Z16 Gen 2 | |
| Média AMD Ryzen 9 PRO 7940HS, AMD Radeon RX 6550M (n=1) | |
| Asus Vivobook Pro 16X K6604JV-MX016W | |
| Lenovo ThinkPad Z16 G1 21D5S00T00 | |
| Lenovo ThinkBook 16 G6 ABP | |
| CrossMark / Overall | |
| Asus Vivobook Pro 16X K6604JV-MX016W | |
| Apple MacBook Pro 16 2023 M3 Pro | |
| Lenovo ThinkPad Z16 Gen 2 | |
| Média AMD Ryzen 9 PRO 7940HS, AMD Radeon RX 6550M (n=1) | |
| Lenovo ThinkPad Z16 G1 21D5S00T00 | |
| Lenovo ThinkBook 16 G6 ABP | |
| CrossMark / Productivity | |
| Asus Vivobook Pro 16X K6604JV-MX016W | |
| Apple MacBook Pro 16 2023 M3 Pro | |
| Lenovo ThinkPad Z16 Gen 2 | |
| Média AMD Ryzen 9 PRO 7940HS, AMD Radeon RX 6550M (n=1) | |
| Lenovo ThinkPad Z16 G1 21D5S00T00 | |
| Lenovo ThinkBook 16 G6 ABP | |
| CrossMark / Creativity | |
| Apple MacBook Pro 16 2023 M3 Pro | |
| Asus Vivobook Pro 16X K6604JV-MX016W | |
| Lenovo ThinkPad Z16 Gen 2 | |
| Média AMD Ryzen 9 PRO 7940HS, AMD Radeon RX 6550M (n=1) | |
| Lenovo ThinkPad Z16 G1 21D5S00T00 | |
| Lenovo ThinkBook 16 G6 ABP | |
| CrossMark / Responsiveness | |
| Asus Vivobook Pro 16X K6604JV-MX016W | |
| Apple MacBook Pro 16 2023 M3 Pro | |
| Lenovo ThinkPad Z16 Gen 2 | |
| Média AMD Ryzen 9 PRO 7940HS, AMD Radeon RX 6550M (n=1) | |
| Lenovo ThinkPad Z16 G1 21D5S00T00 | |
| Lenovo ThinkBook 16 G6 ABP | |
| WebXPRT 3 / Overall | |
| Apple MacBook Pro 16 2023 M3 Pro | |
| MSI Creator Z16P B12UHST | |
| Lenovo ThinkPad Z16 Gen 2 | |
| Média AMD Ryzen 9 PRO 7940HS, AMD Radeon RX 6550M (n=1) | |
| Asus Vivobook Pro 16X K6604JV-MX016W | |
| Lenovo ThinkBook 16 G6 ABP | |
| Lenovo ThinkPad Z16 G1 21D5S00T00 | |
| WebXPRT 4 / Overall | |
| Lenovo ThinkPad Z16 Gen 2 | |
| Média AMD Ryzen 9 PRO 7940HS, AMD Radeon RX 6550M (n=1) | |
| Asus Vivobook Pro 16X K6604JV-MX016W | |
| Lenovo ThinkBook 16 G6 ABP | |
| Lenovo ThinkPad Z16 G1 21D5S00T00 | |
| Mozilla Kraken 1.1 / Total | |
| Lenovo ThinkBook 16 G6 ABP | |
| Lenovo ThinkPad Z16 G1 21D5S00T00 | |
| Lenovo ThinkPad Z16 Gen 2 | |
| Média AMD Ryzen 9 PRO 7940HS, AMD Radeon RX 6550M (n=1) | |
| Asus Vivobook Pro 16X K6604JV-MX016W | |
| MSI Creator Z16P B12UHST | |
| Apple MacBook Pro 16 2023 M3 Pro | |
* ... menor é melhor
| PCMark 10 Score | 7777 pontos | |
Ajuda | ||
| AIDA64 / Memory Copy | |
| Asus Vivobook Pro 16X K6604JV-MX016W | |
| Lenovo ThinkPad Z16 Gen 2 | |
| MSI Creator Z16P B12UHST | |
| Lenovo ThinkPad Z16 G1 21D5S00T00 | |
| Média AMD Ryzen 9 PRO 7940HS (34339 - 66740, n=3) | |
| Lenovo ThinkBook 16 G6 ABP | |
| AIDA64 / Memory Read | |
| Asus Vivobook Pro 16X K6604JV-MX016W | |
| MSI Creator Z16P B12UHST | |
| Lenovo ThinkPad Z16 Gen 2 | |
| Lenovo ThinkPad Z16 G1 21D5S00T00 | |
| Lenovo ThinkBook 16 G6 ABP | |
| Média AMD Ryzen 9 PRO 7940HS (30289 - 50398, n=3) | |
| AIDA64 / Memory Write | |
| Lenovo ThinkPad Z16 Gen 2 | |
| Asus Vivobook Pro 16X K6604JV-MX016W | |
| MSI Creator Z16P B12UHST | |
| Média AMD Ryzen 9 PRO 7940HS (39877 - 91516, n=3) | |
| Lenovo ThinkPad Z16 G1 21D5S00T00 | |
| Lenovo ThinkBook 16 G6 ABP | |
| AIDA64 / Memory Latency | |
| Lenovo ThinkPad Z16 G1 21D5S00T00 | |
| Lenovo ThinkPad Z16 Gen 2 | |
| Média AMD Ryzen 9 PRO 7940HS (102.2 - 121.3, n=3) | |
| Lenovo ThinkBook 16 G6 ABP | |
| MSI Creator Z16P B12UHST | |
| Asus Vivobook Pro 16X K6604JV-MX016W | |
* ... menor é melhor
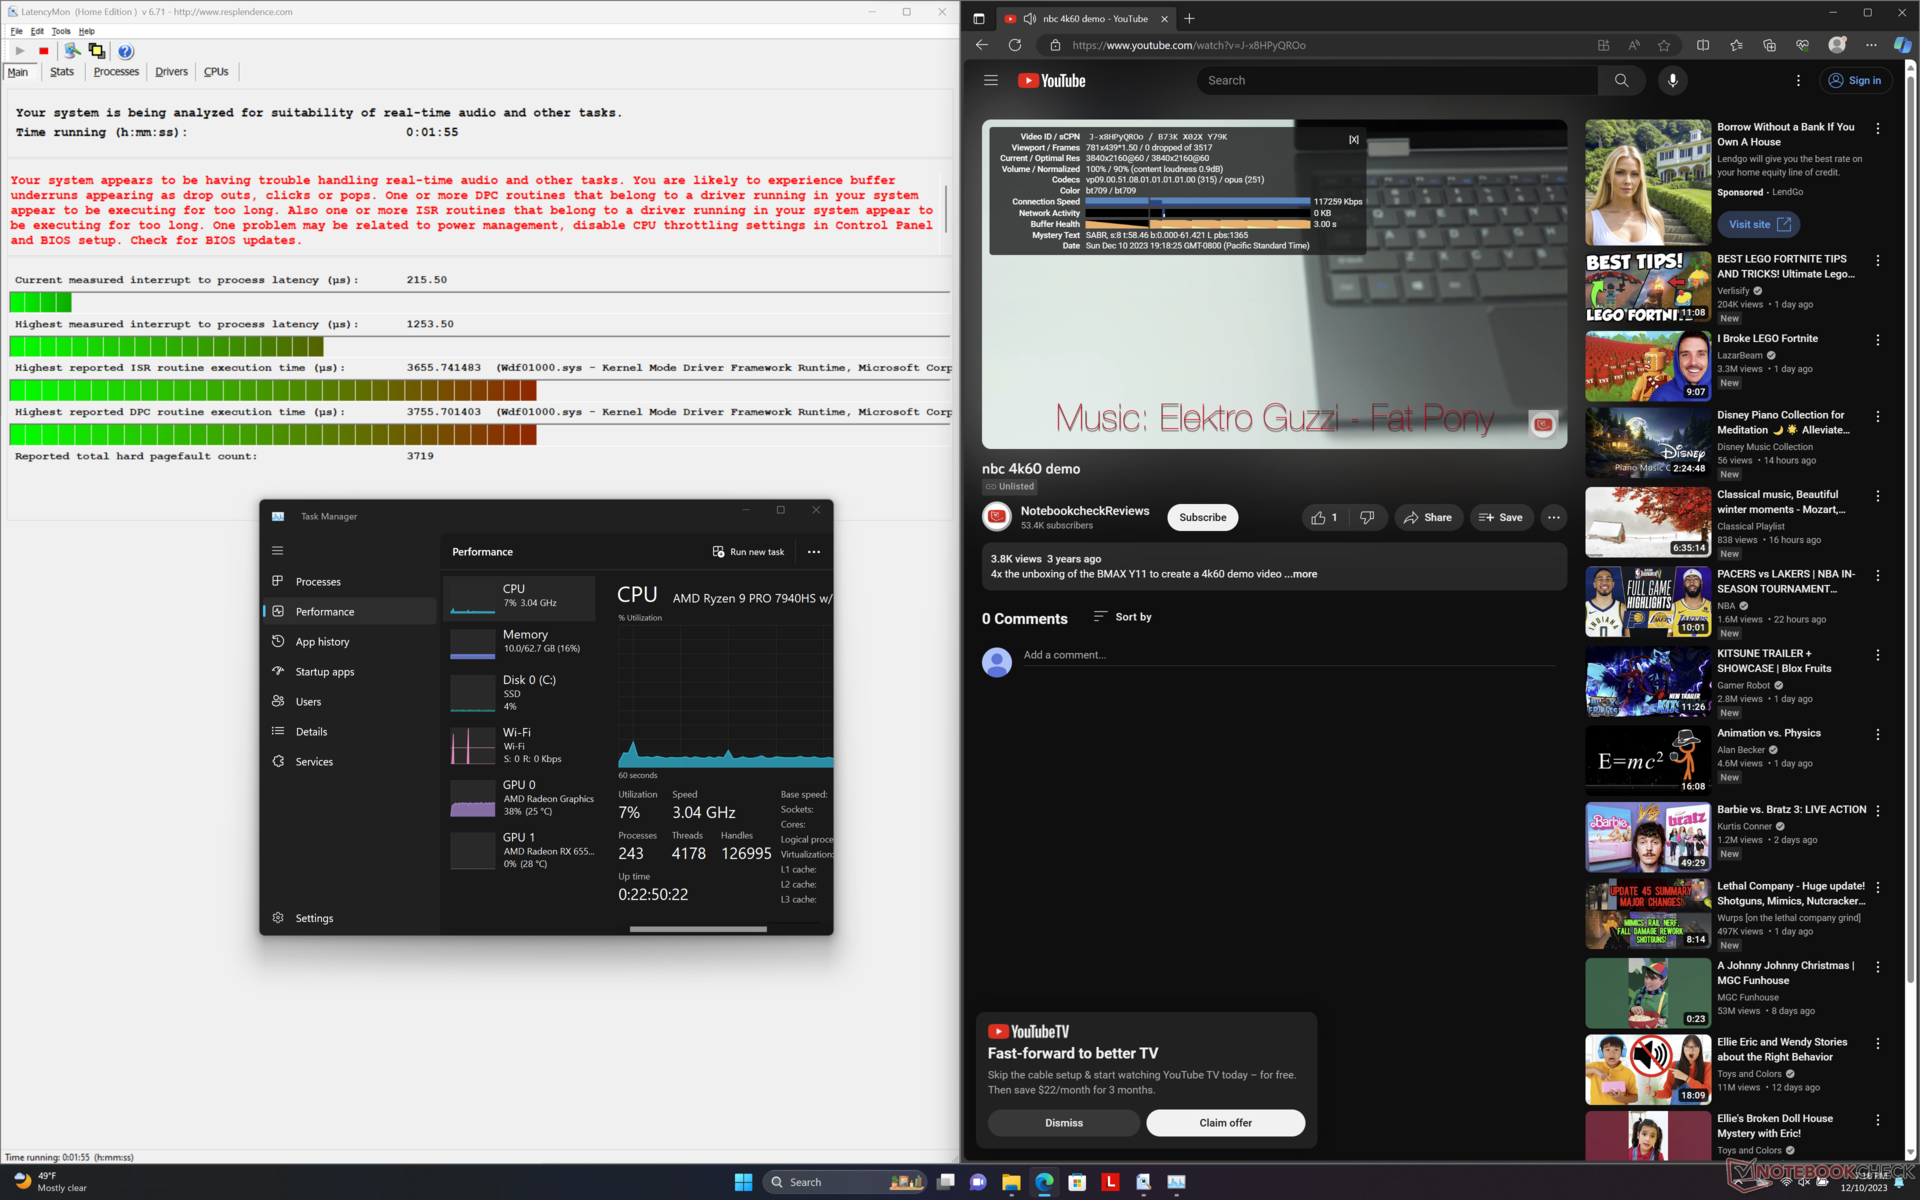
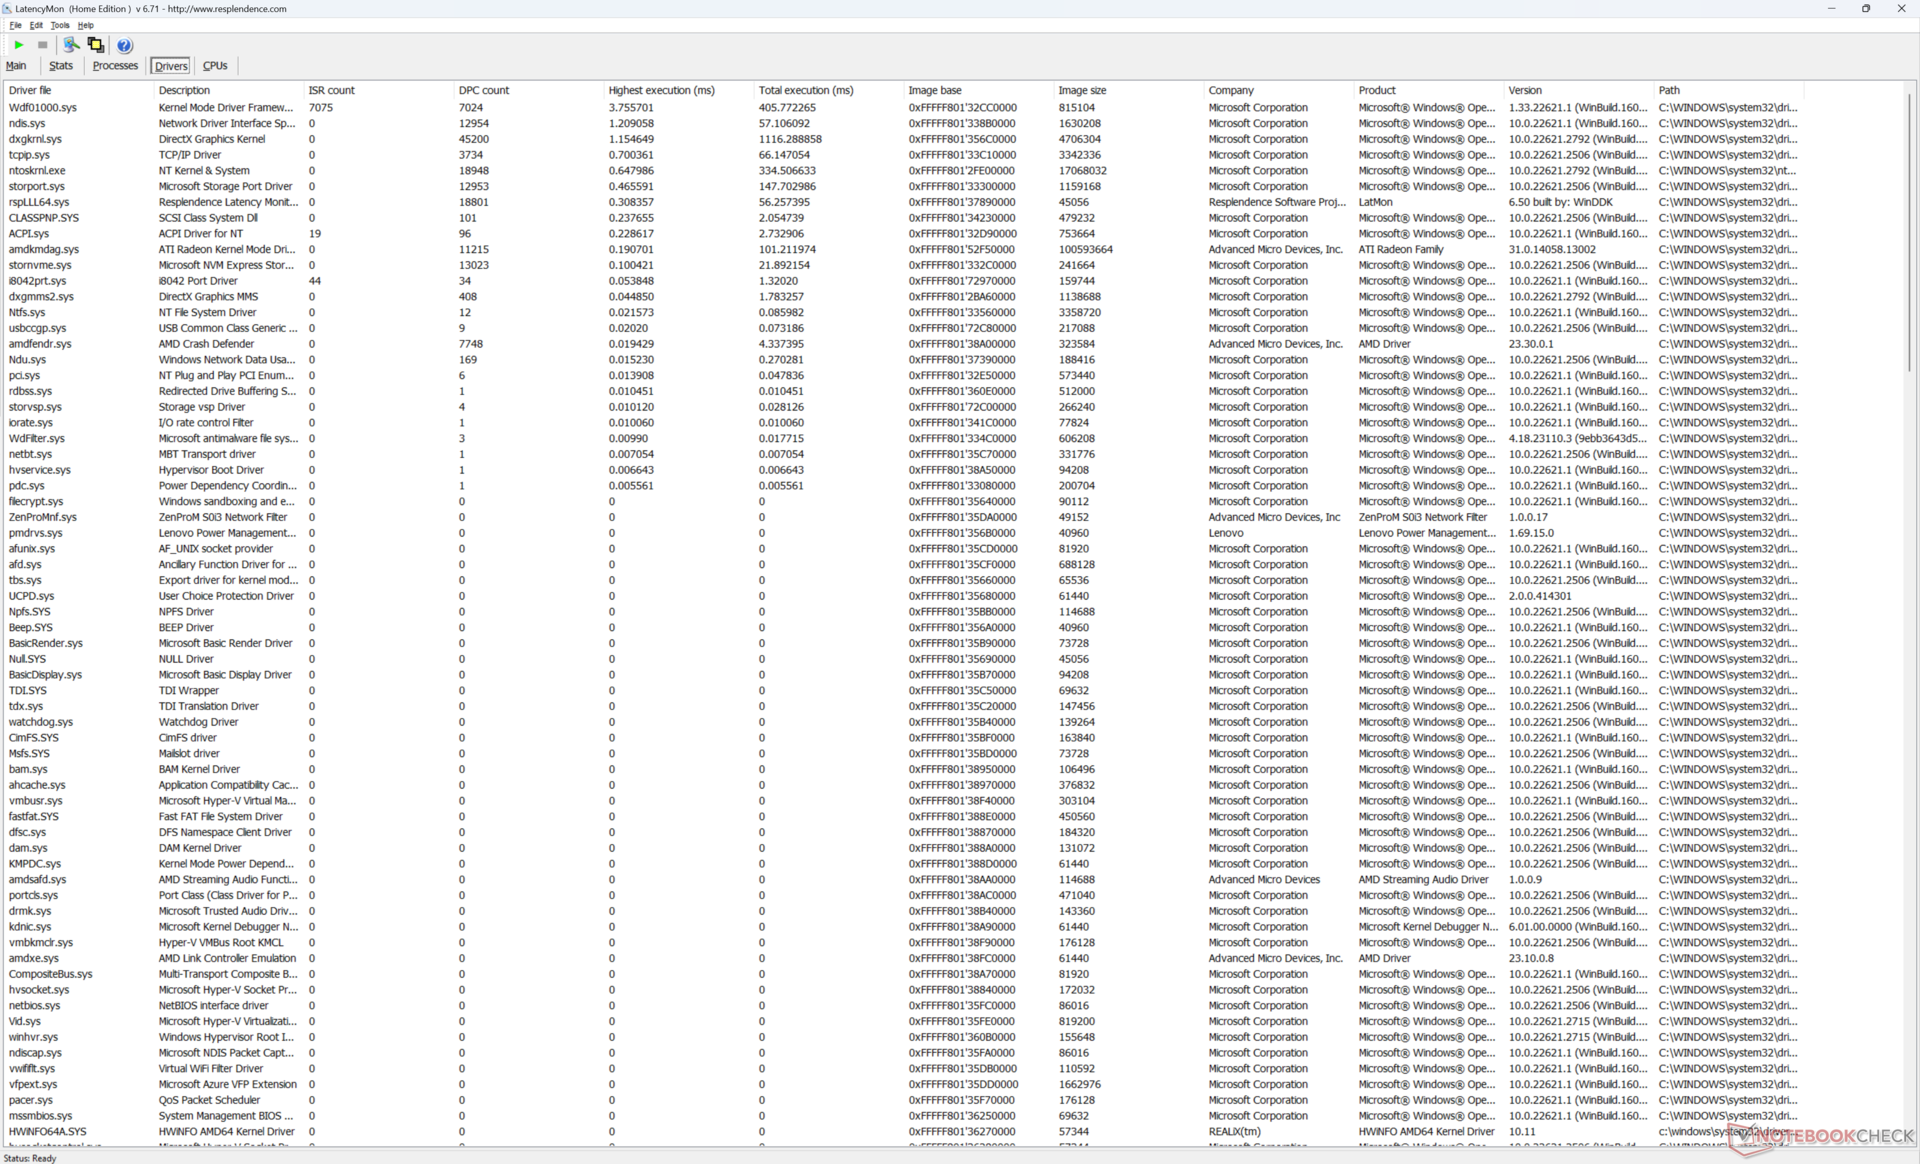
Latência DPC
O LatencyMon mostra pequenos problemas de DPC ao abrir várias guias do navegador em nossa página inicial. a reprodução de vídeo em 4K a 60 FPS é perfeita, sem queda de quadros, ao contrário do que experimentamos no recente ThinkPad P1 G6.
| DPC Latencies / LatencyMon - interrupt to process latency (max), Web, Youtube, Prime95 | |
| Asus Vivobook Pro 16X K6604JV-MX016W | |
| Lenovo ThinkPad Z16 Gen 2 | |
| Lenovo ThinkBook 16 G6 ABP | |
| MSI Creator Z16P B12UHST | |
| Lenovo ThinkPad Z16 G1 21D5S00T00 | |
* ... menor é melhor
Dispositivos de armazenamento
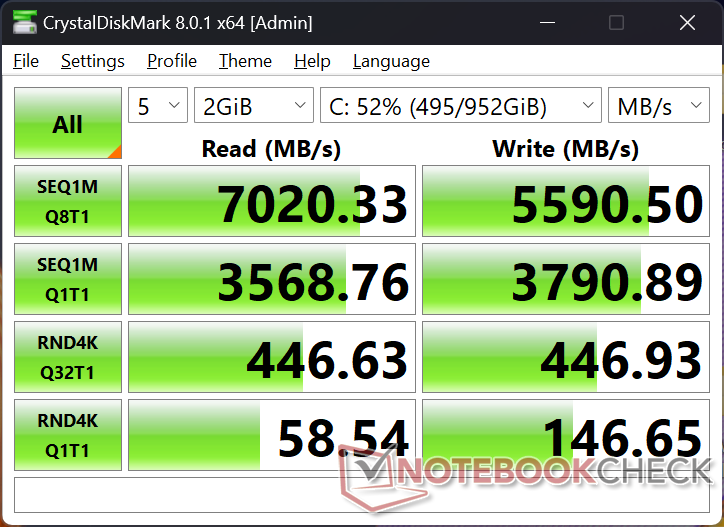
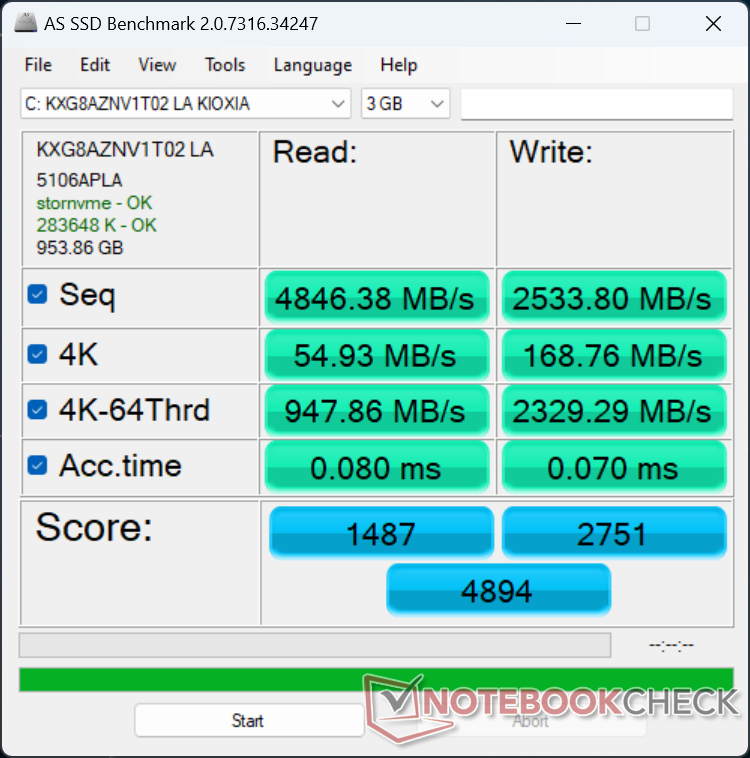
Nossa unidade de teste vem com o Kioxia XG8 enquanto nosso antigo ThinkPad Z16 Gen 1 seria fornecido com o Samsung PM9A1. No entanto, os dois SSDs são unidades NVMe PCIe4 x4 de ponta com taxas de leitura máximas semelhantes de aproximadamente 7.000 MB/s cada.
Infelizmente, a unidade Kioxia também apresentava problemas de limitação de desempenho após alguns minutos de estresse, assim como a unidade Samsung em nosso ThinkPad Z16 Gen 1, conforme mostrado no gráfico de comparação abaixo. As taxas de leitura caíam de ~7000 MB/s para ~5800 MB/s ao longo do tempo, provavelmente devido à dissipação insuficiente de calor. A inclusão de uma almofada térmica grande entre o SSD e a tampa inferior de metal pode ajudar no desempenho.
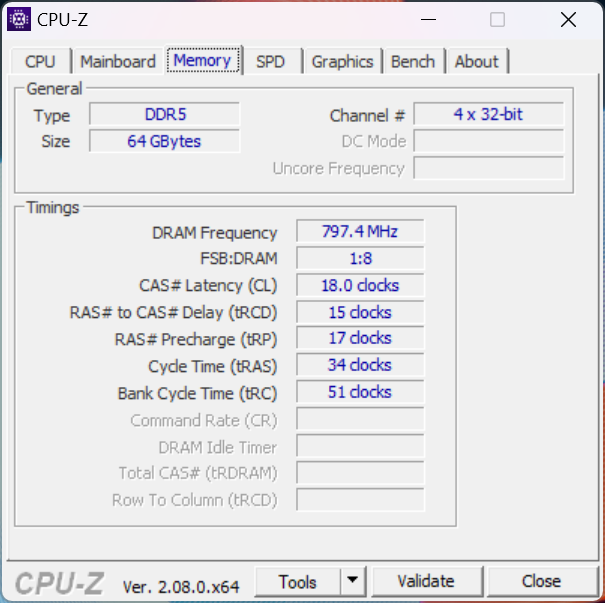
A RAM é soldada e não há suporte para um segundo SSD, ao contrário do MSI Creator Z16P que integra dois slots de RAM e dois slots de SSD M.2.

| Drive Performance rating - Percent | |
| MSI Creator Z16P B12UHST | |
| Lenovo ThinkPad Z16 G1 21D5S00T00 | |
| Lenovo ThinkPad Z16 Gen 2 | |
| Lenovo ThinkBook 16 G6 ABP | |
| Asus Vivobook Pro 16X K6604JV-MX016W | |
* ... menor é melhor
Disk Throttling: DiskSpd Read Loop, Queue Depth 8
Desempenho da GPU
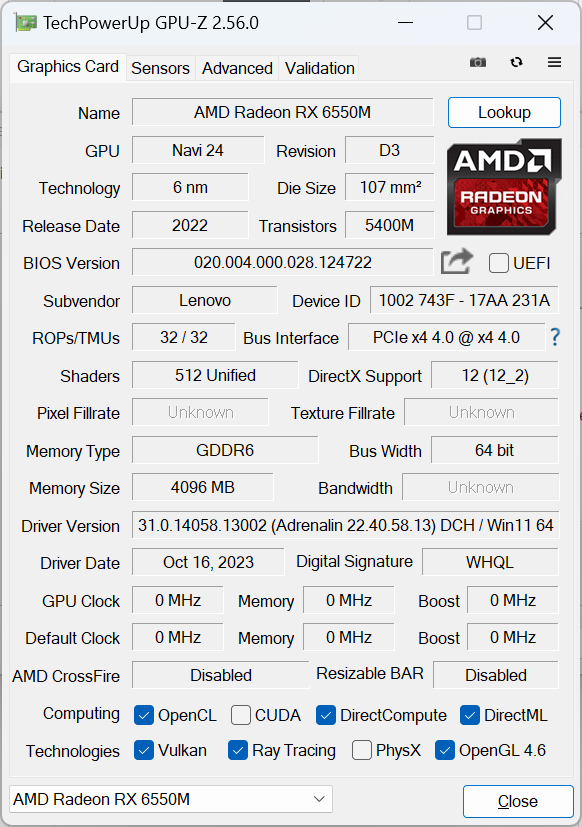
A relação entre a Radeon RX 6550M e a RX 6500M é semelhante à da GeForce RTX 3050 Ti e da RTX 3050; suas diferenças são pequenas e estão dentro de 10 pontos percentuais, em média. Na verdade, as duas GPUs Radeon compartilham a mesma largura de barramento de memória de 64 bits, arquitetura RDNA2, 1024 processadores de fluxo, 4 GB GDDR6 VRAM e muito mais. A Radeon RX 6550M atinge taxas de clock alvo ligeiramente mais altas (2560 MHz vs. 2191 MHz) e TGP máxima (60 W vs. 55 W) do que a 6500M, mas é só isso.
O pequeno aumento nas taxas de clock leva a apenas pequenos aumentos nas pontuações de benchmark, conforme mostrado no gráfico de comparação abaixo.
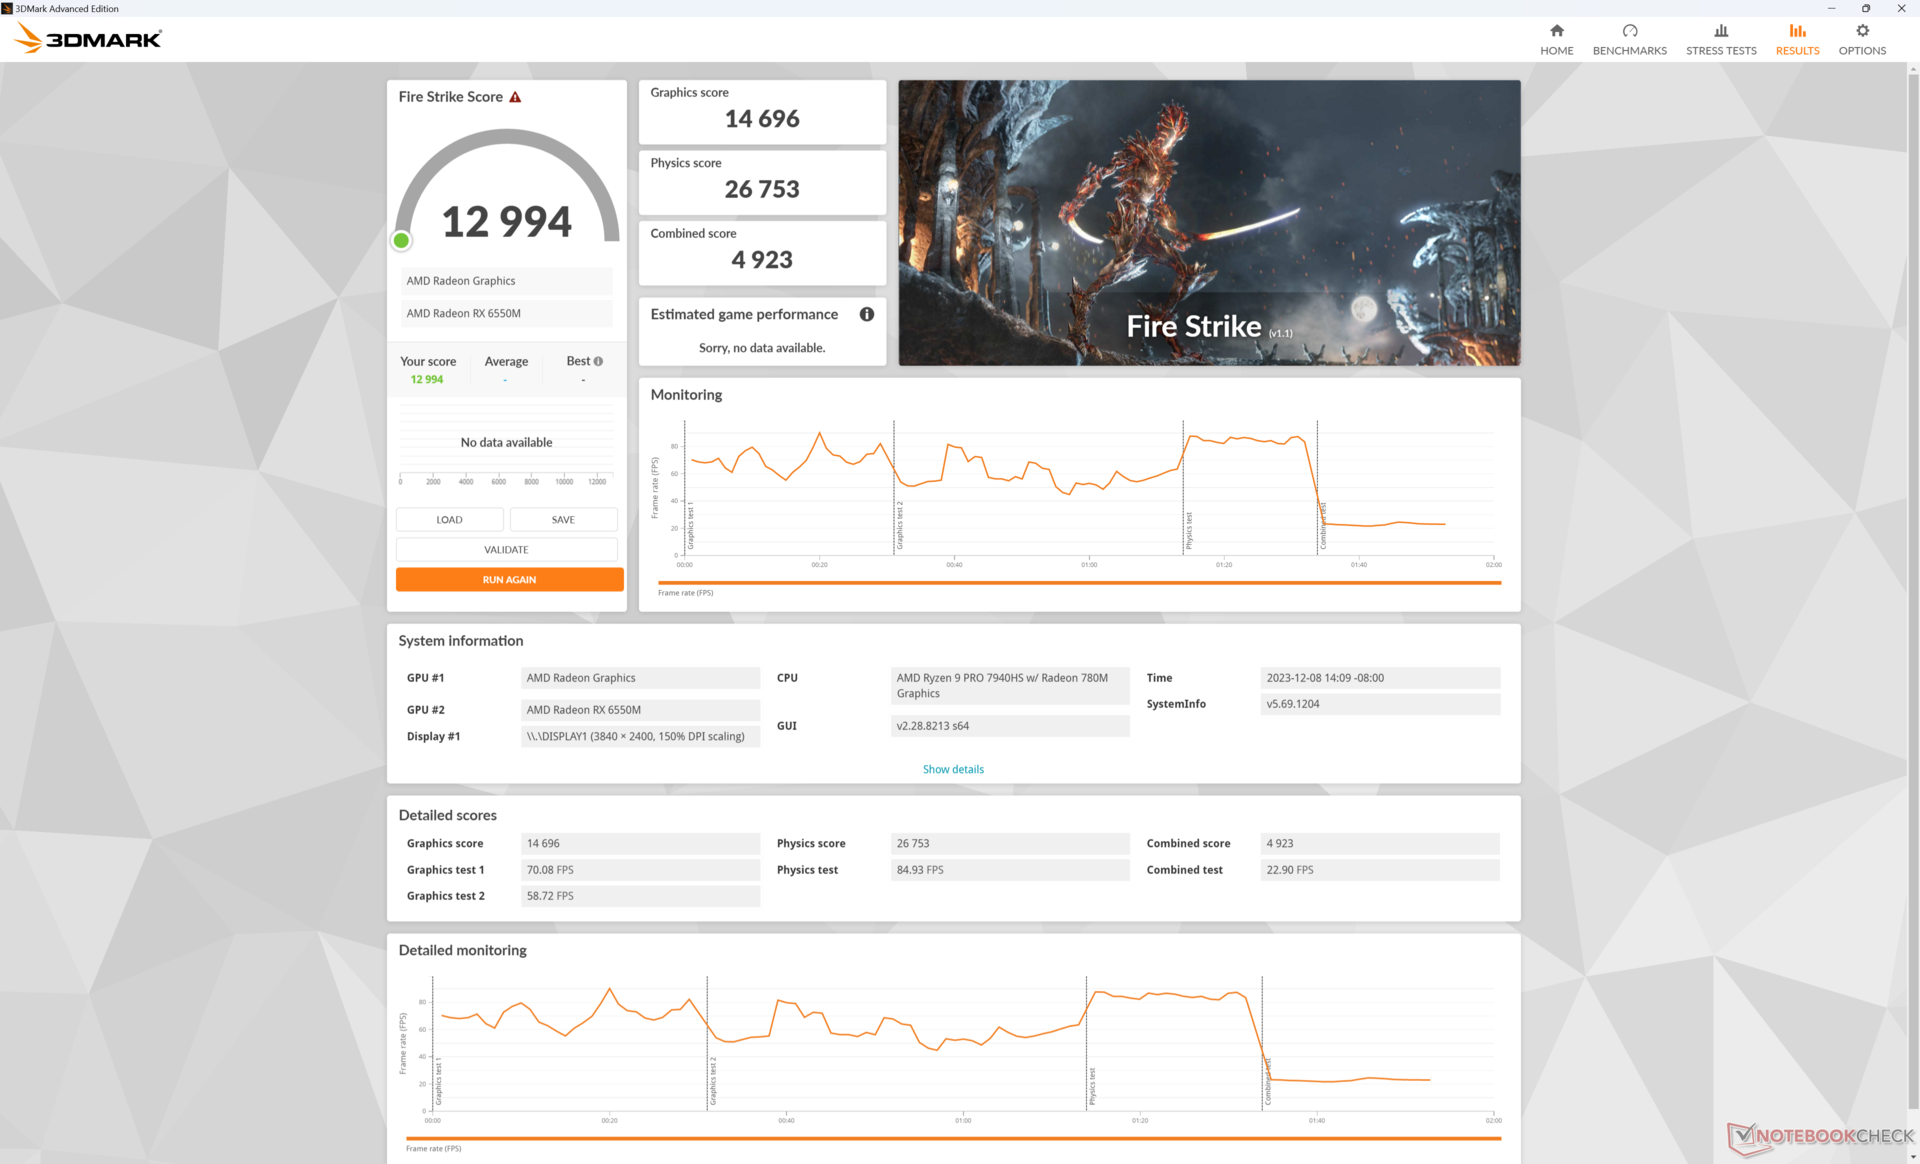
A execução no modo Balanced em vez do modo Performance afeta o desempenho apenas ligeiramente, como mostram os resultados do site Fire Strike na tabela abaixo. A execução com a energia da bateria reduziria o desempenho gráfico de forma muito mais significativa do que o desempenho do processador.
| Perfil de energia | Pontuação de física | Pontuação de gráficos | Pontuação combinada |
| Modo de desempenho | 26753 | 14696 | 4923 |
| Modo equilibrado | 26333 (-2%) | 13975 (-5%) | 4776 (-3%) |
| Energia da bateria | 25622 (-4%) | 9649 (-34%) | 3114 (-37%) |
Lembre-se de que a Radeon RX 6550M baseada em RDNA2 está chegando logo após o lançamento da Radeon RX 7900M de alta qualidade baseada em RDNA3, o que significa que mais GPUs RDNA3 de médio porte serão lançadas em breve. A RDNA3 é uma melhoria significativa em relação à RDNA2 em termos de desempenho, consumo de energia, suporte a upscaling de IA e, principalmente, recursos de ray-tracing.
| 3DMark Performance rating - Percent | |
| Asus Zephyrus Duo 16 GX650PY-NM006W | |
| Alienware m16 R1 AMD | |
| Lenovo ThinkPad P1 G6 21FV001KUS | |
| MSI Raider GE68 HX 13VG, i7-13700HX | |
| MSI Raider GE68HX 13VF | |
| HP Victus 16-r0076TX -1! | |
| MSI Creator Z16P B12UHST -1! | |
| Lenovo ThinkPad Z16 G1 21D5S00T00 -1! | |
| Asus VivoBook Pro 16 -1! | |
| Lenovo ThinkPad Z16 Gen 2 | |
| Média AMD Radeon RX 6550M | |
| HP Victus 15 fa0020nr | |
| Asus VivoBook Pro 16X OLED N7600PC-L2026X -1! | |
| LG Gram 2in1 16 16T90R - G.AA78G -1! | |
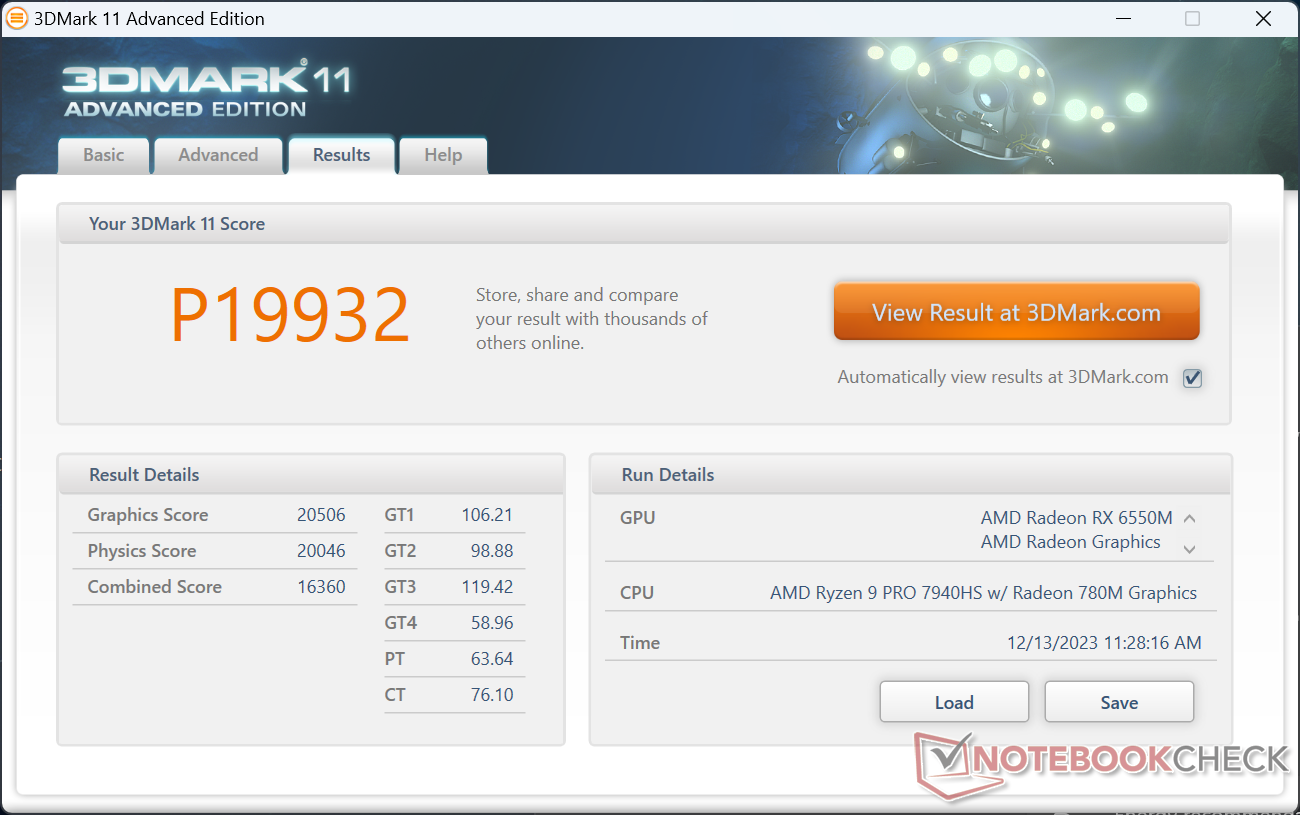
| 3DMark 11 Performance | 19932 pontos | |
| 3DMark Fire Strike Score | 12994 pontos | |
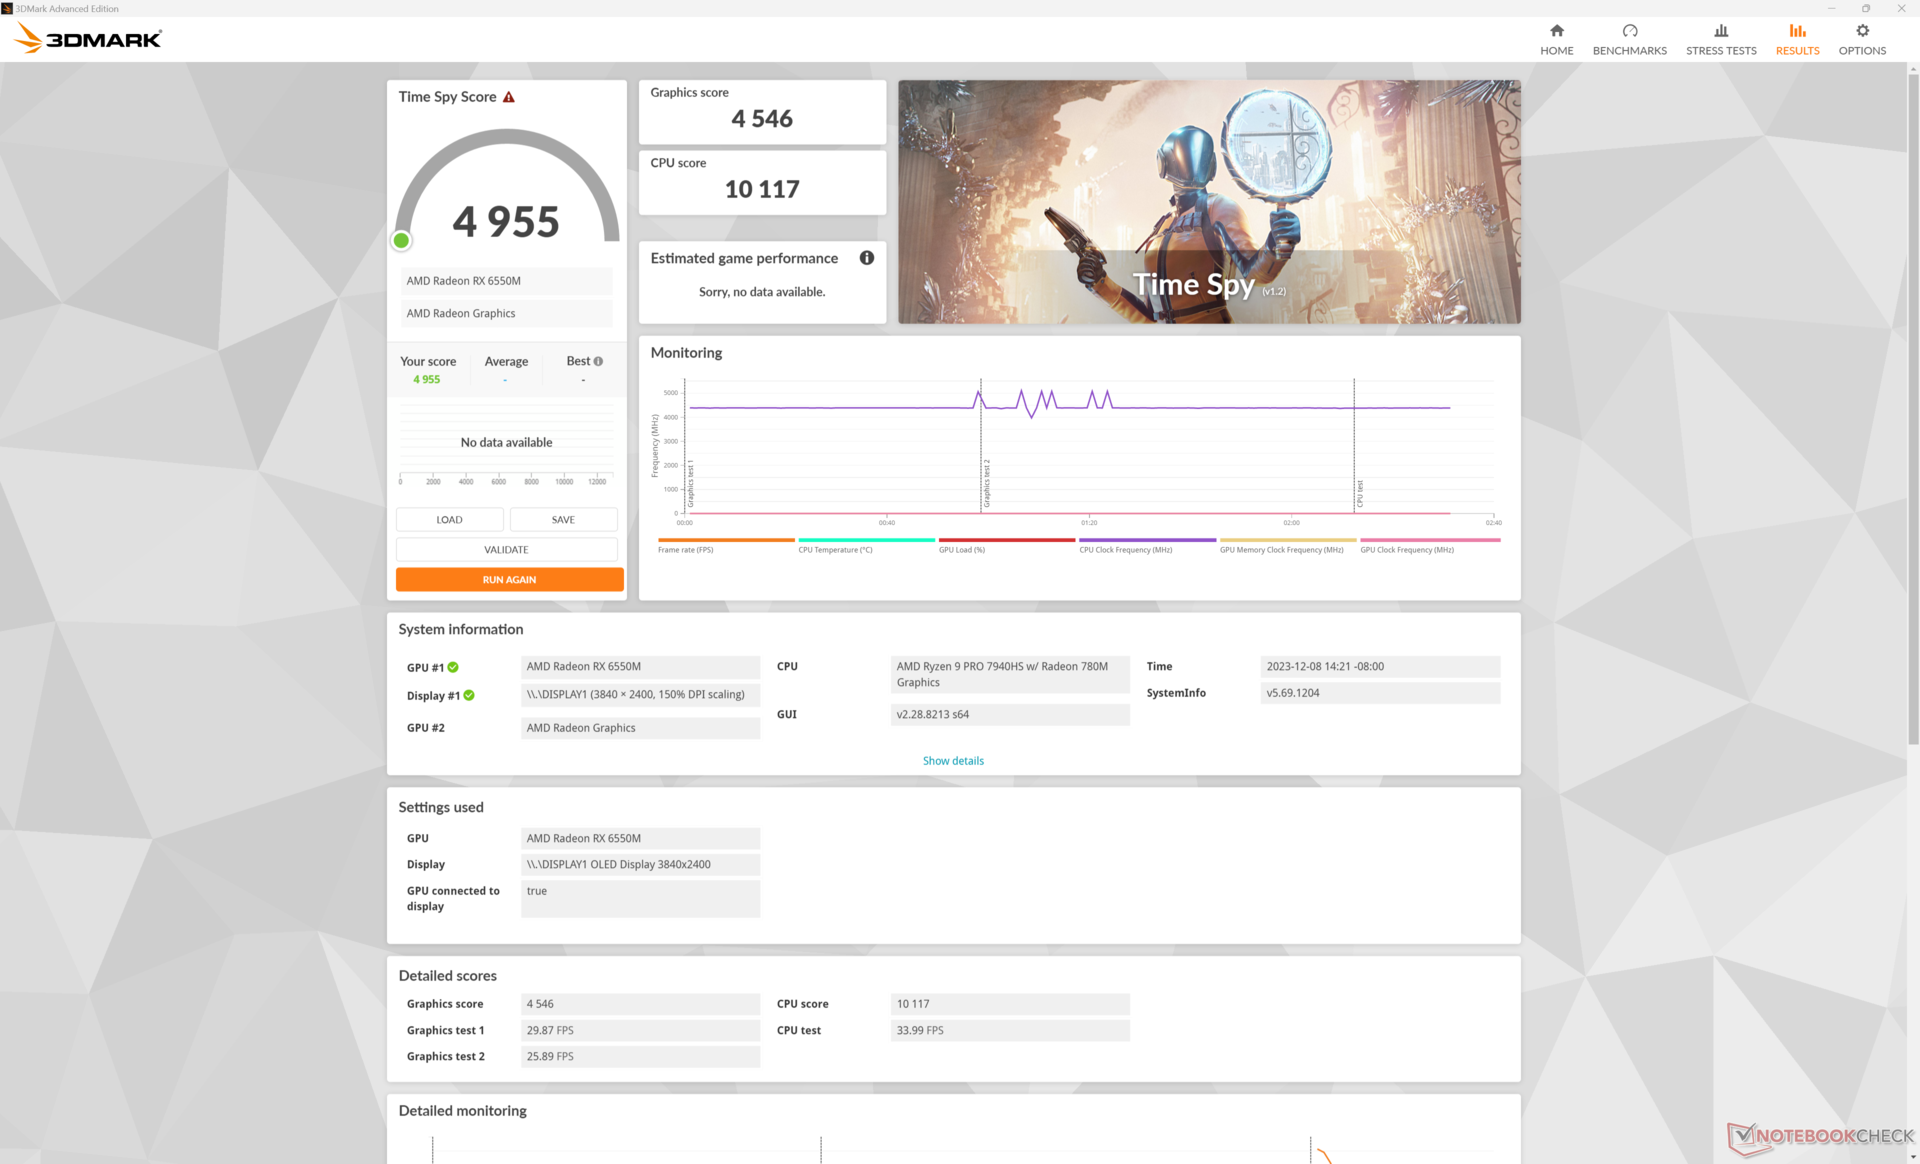
| 3DMark Time Spy Score | 4955 pontos | |
Ajuda | ||
| Blender | |
| v3.3 Classroom METAL | |
| Apple MacBook Pro 16 2023 M3 Pro | |
| v3.3 Classroom HIP/AMD | |
| Lenovo ThinkPad Z16 G1 21D5S00T00 | |
| v3.3 Classroom OPTIX/RTX | |
| Asus VivoBook Pro 16 | |
| HP Victus 16-r0076TX | |
| MSI Raider GE68HX 13VF | |
| MSI Raider GE68 HX 13VG, i7-13700HX | |
| Alienware m16 R1 AMD | |
| Lenovo ThinkPad P1 G6 21FV001KUS | |
| Asus Zephyrus Duo 16 GX650PY-NM006W | |
| v3.3 Classroom CUDA | |
| Asus VivoBook Pro 16 | |
| HP Victus 16-r0076TX | |
| MSI Raider GE68HX 13VF | |
| MSI Raider GE68 HX 13VG, i7-13700HX | |
| Lenovo ThinkPad P1 G6 21FV001KUS | |
| Alienware m16 R1 AMD | |
| Asus Zephyrus Duo 16 GX650PY-NM006W | |
| v3.3 Classroom CPU | |
| LG Gram 2in1 16 16T90R - G.AA78G | |
| Lenovo ThinkPad Z16 G1 21D5S00T00 | |
| Asus VivoBook Pro 16 | |
| HP Victus 16-r0076TX | |
| Lenovo ThinkPad P1 G6 21FV001KUS | |
| Apple MacBook Pro 16 2023 M3 Pro | |
| Lenovo ThinkPad Z16 Gen 2 | |
| Média AMD Radeon RX 6550M (n=1) | |
| MSI Raider GE68 HX 13VG, i7-13700HX | |
| MSI Raider GE68HX 13VF | |
| Alienware m16 R1 AMD | |
| Asus Zephyrus Duo 16 GX650PY-NM006W | |
* ... menor é melhor
Desempenho em jogos
O desempenho em jogos pode variar de ser quase idêntico ao da Radeon RX 6500M a ser até 30% mais rápido, dependendo do título e das configurações. Por exemplo, o Final Fantasy XV teria praticamente o mesmo desempenho entre nossos modelos Radeon RX 6550M e 6500M, enquanto outros títulos, como Far Cry 5 ou F1 22, podem ser executados de 15% a 30% mais rápido. Enquanto isso, Tiny Tina's Wonderlands pode ser executado até 30% mais rápido somente se estiver em configurações gráficas mais altas. Portanto, os resultados dependem muito do aplicativo, mas as vantagens de desempenho são geralmente mais altas do que as pontuações do 3DMark poderiam sugerir, o que é uma ótima notícia para os jogadores.
É interessante notar que o desempenho geral está no mesmo nível do MacBook Pro 16 M3 Pro ao testar jogos mais recentes, como Cyberpunk 2077 e Baldur's Gate 3. Considerando que a nossa Radeon é uma GPU discreta maior, isso diz muito sobre a eficiência da solução integrada do SoC Apple.
| Performance rating - Percent | |
| Asus Zephyrus Duo 16 GX650PY-NM006W | |
| Alienware m16 R1 AMD -1! | |
| Lenovo ThinkPad P1 G6 21FV001KUS -1! | |
| MSI Raider GE68 HX 13VG, i7-13700HX | |
| MSI Raider GE68HX 13VF -1! | |
| MSI Creator Z16P B12UHST | |
| HP Victus 16-r0076TX -1! | |
| Lenovo ThinkPad Z16 Gen 2 -1! | |
| Apple MacBook Pro 16 2023 M3 Pro -4! | |
| Lenovo ThinkPad Z16 G1 21D5S00T00 | |
| LG Gram 2in1 16 16T90R - G.AA78G | |
| The Witcher 3 - 1920x1080 Ultra Graphics & Postprocessing (HBAO+) | |
| Asus Zephyrus Duo 16 GX650PY-NM006W | |
| Alienware m16 R1 AMD | |
| Lenovo ThinkPad P1 G6 21FV001KUS | |
| MSI Raider GE68 HX 13VG, i7-13700HX | |
| MSI Raider GE68HX 13VF | |
| HP Victus 16-r0076TX | |
| MSI Creator Z16P B12UHST | |
| Lenovo ThinkPad Z16 Gen 2 | |
| Apple MacBook Pro 16 2023 M3 Pro | |
| Lenovo ThinkPad Z16 G1 21D5S00T00 | |
| LG Gram 2in1 16 16T90R - G.AA78G | |
| GTA V - 1920x1080 Highest AA:4xMSAA + FX AF:16x | |
| Asus Zephyrus Duo 16 GX650PY-NM006W | |
| Lenovo ThinkPad P1 G6 21FV001KUS | |
| MSI Raider GE68 HX 13VG, i7-13700HX | |
| MSI Creator Z16P B12UHST | |
| Apple MacBook Pro 16 2023 M3 Pro | |
| Lenovo ThinkPad Z16 G1 21D5S00T00 | |
| LG Gram 2in1 16 16T90R - G.AA78G | |
| Final Fantasy XV Benchmark - 1920x1080 High Quality | |
| Asus Zephyrus Duo 16 GX650PY-NM006W | |
| Alienware m16 R1 AMD | |
| Lenovo ThinkPad P1 G6 21FV001KUS | |
| MSI Raider GE68 HX 13VG, i7-13700HX | |
| MSI Raider GE68HX 13VF | |
| MSI Creator Z16P B12UHST | |
| HP Victus 16-r0076TX | |
| Lenovo ThinkPad Z16 Gen 2 | |
| Lenovo ThinkPad Z16 G1 21D5S00T00 | |
| LG Gram 2in1 16 16T90R - G.AA78G | |
| Strange Brigade - 1920x1080 ultra AA:ultra AF:16 | |
| Alienware m16 R1 AMD | |
| Asus Zephyrus Duo 16 GX650PY-NM006W | |
| MSI Raider GE68 HX 13VG, i7-13700HX | |
| MSI Raider GE68HX 13VF | |
| MSI Creator Z16P B12UHST | |
| HP Victus 16-r0076TX | |
| Lenovo ThinkPad Z16 Gen 2 | |
| Lenovo ThinkPad Z16 G1 21D5S00T00 | |
| LG Gram 2in1 16 16T90R - G.AA78G | |
| Dota 2 Reborn - 1920x1080 ultra (3/3) best looking | |
| MSI Raider GE68HX 13VF | |
| Asus Zephyrus Duo 16 GX650PY-NM006W | |
| MSI Raider GE68 HX 13VG, i7-13700HX | |
| Alienware m16 R1 AMD | |
| MSI Creator Z16P B12UHST | |
| Lenovo ThinkPad P1 G6 21FV001KUS | |
| HP Victus 16-r0076TX | |
| Lenovo ThinkPad Z16 Gen 2 | |
| Lenovo ThinkPad Z16 G1 21D5S00T00 | |
| LG Gram 2in1 16 16T90R - G.AA78G | |
| X-Plane 11.11 - 1920x1080 high (fps_test=3) | |
| MSI Raider GE68HX 13VF | |
| MSI Raider GE68 HX 13VG, i7-13700HX | |
| Lenovo ThinkPad P1 G6 21FV001KUS | |
| Asus Zephyrus Duo 16 GX650PY-NM006W | |
| Alienware m16 R1 AMD | |
| HP Victus 16-r0076TX | |
| MSI Creator Z16P B12UHST | |
| LG Gram 2in1 16 16T90R - G.AA78G | |
| Lenovo ThinkPad Z16 G1 21D5S00T00 | |
| Lenovo ThinkPad Z16 Gen 2 | |
| Cyberpunk 2077 | |
| 1280x720 Low Preset (FSR off) | |
| Lenovo ThinkPad Z16 Gen 2 | |
| Média AMD Radeon RX 6550M (n=1) | |
| LG Gram 2in1 16 16T90R - G.AA78G | |
| 1920x1080 Low Preset (FSR off) | |
| Lenovo ThinkPad Z16 Gen 2 | |
| Média AMD Radeon RX 6550M (n=1) | |
| Apple MacBook Pro 16 2023 M3 Pro | |
| LG Gram 2in1 16 16T90R - G.AA78G | |
| 1920x1080 Medium Preset (FSR off) | |
| Lenovo ThinkPad Z16 Gen 2 | |
| Média AMD Radeon RX 6550M (n=1) | |
| Apple MacBook Pro 16 2023 M3 Pro | |
| LG Gram 2in1 16 16T90R - G.AA78G | |
| 1920x1080 High Preset (FSR off) | |
| Lenovo ThinkPad P1 G6 21FV001KUS | |
| Apple MacBook Pro 16 2023 M3 Pro | |
| Lenovo ThinkPad Z16 Gen 2 | |
| Média AMD Radeon RX 6550M (n=1) | |
| LG Gram 2in1 16 16T90R - G.AA78G | |
| 1920x1080 Ultra Preset (FSR off) | |
| Lenovo ThinkPad P1 G6 21FV001KUS | |
| Apple MacBook Pro 16 2023 M3 Pro | |
| Lenovo ThinkPad Z16 Gen 2 | |
| Média AMD Radeon RX 6550M (n=1) | |
| LG Gram 2in1 16 16T90R - G.AA78G | |
| 2560x1440 Ultra Preset (FSR off) | |
| Lenovo ThinkPad P1 G6 21FV001KUS | |
| Lenovo ThinkPad Z16 Gen 2 | |
| Média AMD Radeon RX 6550M (n=1) | |
| Baldur's Gate 3 | |
| 1920x1080 Low Preset AA:SM | |
| Lenovo ThinkPad Z16 Gen 2 | |
| Média AMD Radeon RX 6550M (n=1) | |
| 1920x1080 Medium Preset AA:T | |
| Lenovo ThinkPad Z16 Gen 2 | |
| Média AMD Radeon RX 6550M (n=1) | |
| 1920x1080 High Preset AA:T | |
| Apple MacBook Pro 16 2023 M3 Pro | |
| Lenovo ThinkPad Z16 Gen 2 | |
| Média AMD Radeon RX 6550M (n=1) | |
| 1920x1080 Ultra Preset AA:T | |
| Lenovo ThinkPad P1 G6 21FV001KUS | |
| Apple MacBook Pro 16 2023 M3 Pro | |
| Lenovo ThinkPad Z16 Gen 2 | |
| Média AMD Radeon RX 6550M (n=1) | |
| 2560x1440 Ultra Preset AA:T | |
| Lenovo ThinkPad P1 G6 21FV001KUS | |
| Lenovo ThinkPad Z16 Gen 2 | |
| Média AMD Radeon RX 6550M (n=1) | |
Witcher 3 FPS Chart
| baixo | média | alto | ultra | QHD | |
|---|---|---|---|---|---|
| The Witcher 3 (2015) | 277.2 | 171.5 | 83.2 | 49.4 | |
| Dota 2 Reborn (2015) | 137.1 | 127.3 | 112.3 | 103 | |
| Final Fantasy XV Benchmark (2018) | 129.3 | 67.4 | 47.8 | 31.2 | |
| X-Plane 11.11 (2018) | 53.7 | 41.2 | 33 | ||
| Far Cry 5 (2018) | 115 | 91 | 84 | 79 | |
| Strange Brigade (2018) | 319 | 122.5 | 101.1 | 88.4 | |
| Tiny Tina's Wonderlands (2022) | 124.1 | 95.5 | 59.7 | 30.3 | 27.2 |
| F1 22 (2022) | 132.5 | 120.8 | 87.5 | 19.3 | 11.3 |
| Baldur's Gate 3 (2023) | 61.6 | 52.9 | 44.7 | 43 | 29 |
| Cyberpunk 2077 (2023) | 62.8 | 45.9 | 34.7 | 28.6 | 17.3 |
Emissões
Ruído do sistema
O comportamento do ruído da ventoinha é altamente dependente do perfil de energia selecionado. Por exemplo, as ventoinhas só são realmente silenciosas quando estão no perfil de economia de energia, pois, caso contrário, estão sempre ativas a quase 30 dB(A), independentemente da carga na tela. Da mesma forma, o ruído da ventoinha em jogos no modo Balanced seria de cerca de 41 a 45 dB(A) em comparação com 52 dB(A) no modo Performance, o que é uma diferença significativa, apesar das pequenas diferenças de desempenho entre os dois perfis, conforme mencionado acima. O modo Desempenho, em particular, é visivelmente mais alto do que muitos outros notebooks de 16 polegadas, como o MSI Creator Z16P ou o MacBook Pro 16.
Por outro lado, a pulsação da ventoinha é mantida em um nível mínimo. Ao executar o 3DMark 06, por exemplo, o ruído da ventoinha se manteve estável em 29,5 dB(A) durante toda a primeira cena do benchmark, sem picos repentinos.
Barulho
| Ocioso |
| 22.9 / 29.4 / 29.4 dB |
| Carga |
| 29.5 / 52 dB |
 | ||
30 dB silencioso 40 dB(A) audível 50 dB(A) ruidosamente alto |
||
min: | ||
| Lenovo ThinkPad Z16 Gen 2 Radeon RX 6550M, R9 PRO 7940HS, Kioxia XG8 KXG8AZNV1T02 | Lenovo ThinkPad Z16 G1 21D5S00T00 Radeon RX 6500M, R7 PRO 6850H, Samsung PM9A1 MZVL21T0HCLR | Lenovo ThinkBook 16 G6 ABP Vega 7, R5 7530U, SK hynix HFS512GEJ9X125N | MSI Creator Z16P B12UHST GeForce RTX 3080 Ti Laptop GPU, i9-12900H, Samsung PM9A1 MZVL22T0HBLB | Apple MacBook Pro 16 2023 M3 Pro M3 Pro 18-Core GPU, Apple M3 Pro 12-Core, Apple SSD AP0512Z | Asus Vivobook Pro 16X K6604JV-MX016W GeForce RTX 4060 Laptop GPU, i9-13980HX, Solidigm P41 Plus SSDPFKNU010TZ | |
|---|---|---|---|---|---|---|
| Noise | 9% | 11% | -8% | 12% | -18% | |
| desligado / ambiente * (dB) | 22.6 | 23.7 -5% | 24.3 -8% | 26 -15% | 24.4 -8% | 25.2 -12% |
| Idle Minimum * (dB) | 22.9 | 23.7 -3% | 24.3 -6% | 27 -18% | 24.4 -7% | 26.6 -16% |
| Idle Average * (dB) | 29.4 | 23.7 19% | 24.3 17% | 29 1% | 24.4 17% | 26.6 10% |
| Idle Maximum * (dB) | 29.4 | 23.7 19% | 24.3 17% | 31 -5% | 24.4 17% | 29.2 1% |
| Load Average * (dB) | 29.5 | 25.9 12% | 29.7 -1% | 43 -46% | 26.9 9% | 53.4 -81% |
| Witcher 3 ultra * (dB) | 52 | 46.9 10% | 32.1 38% | 43 17% | 25.1 52% | |
| Load Maximum * (dB) | 52 | 46.9 10% | 41.4 20% | 46 12% | 50.4 3% | 56.9 -9% |
* ... menor é melhor
Temperatura
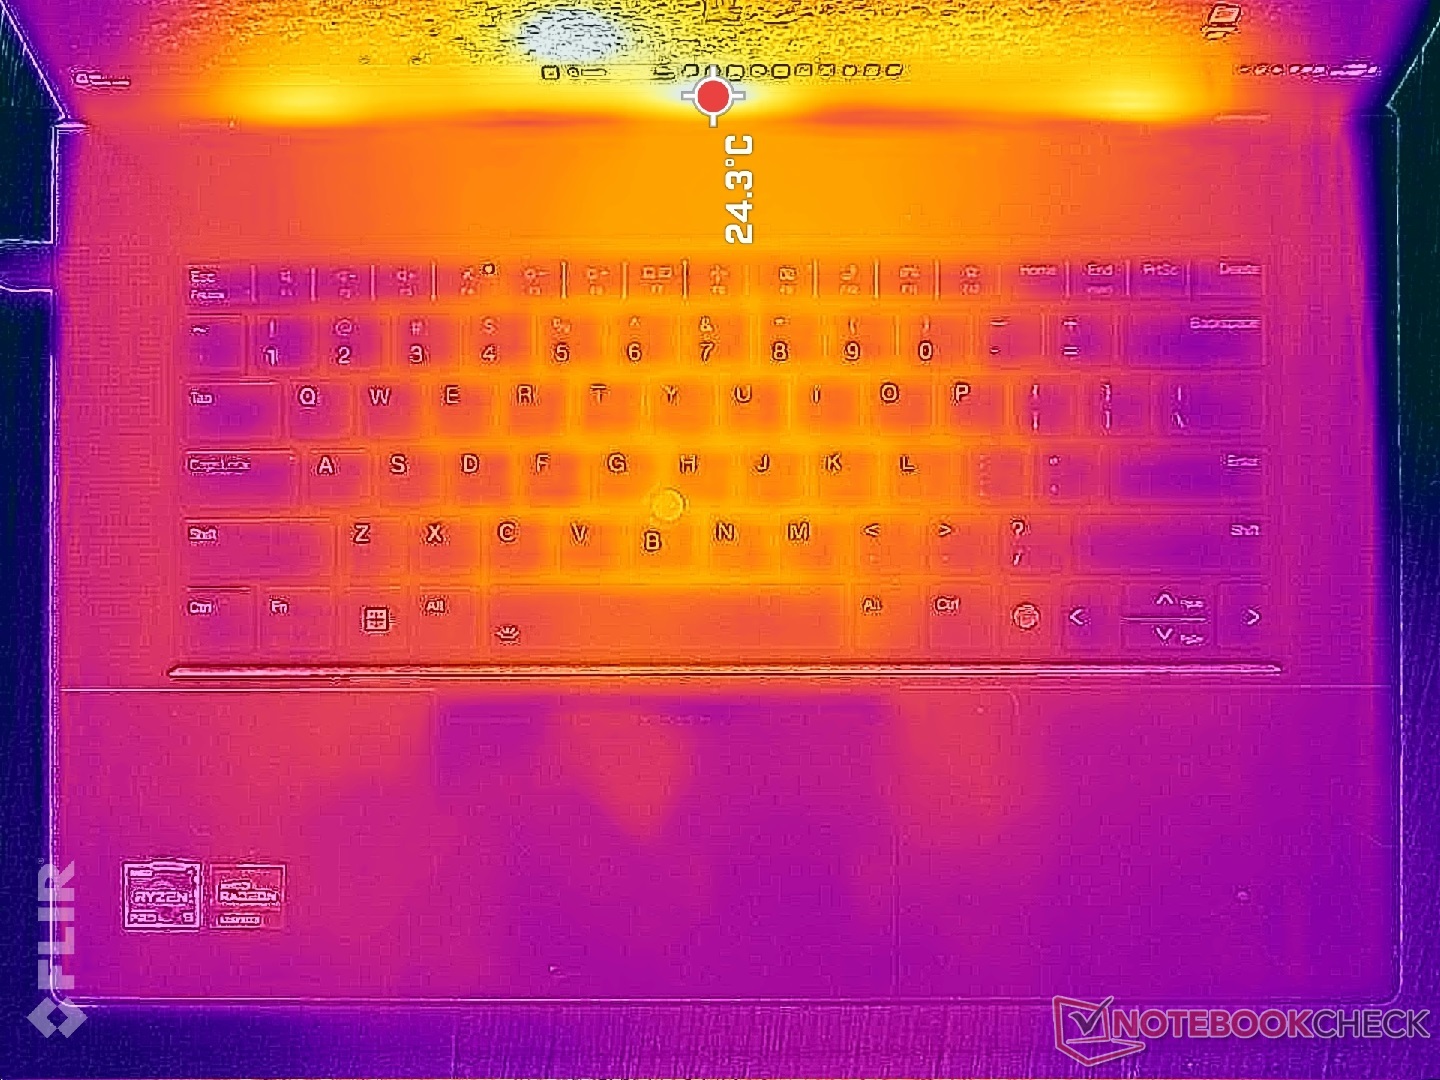
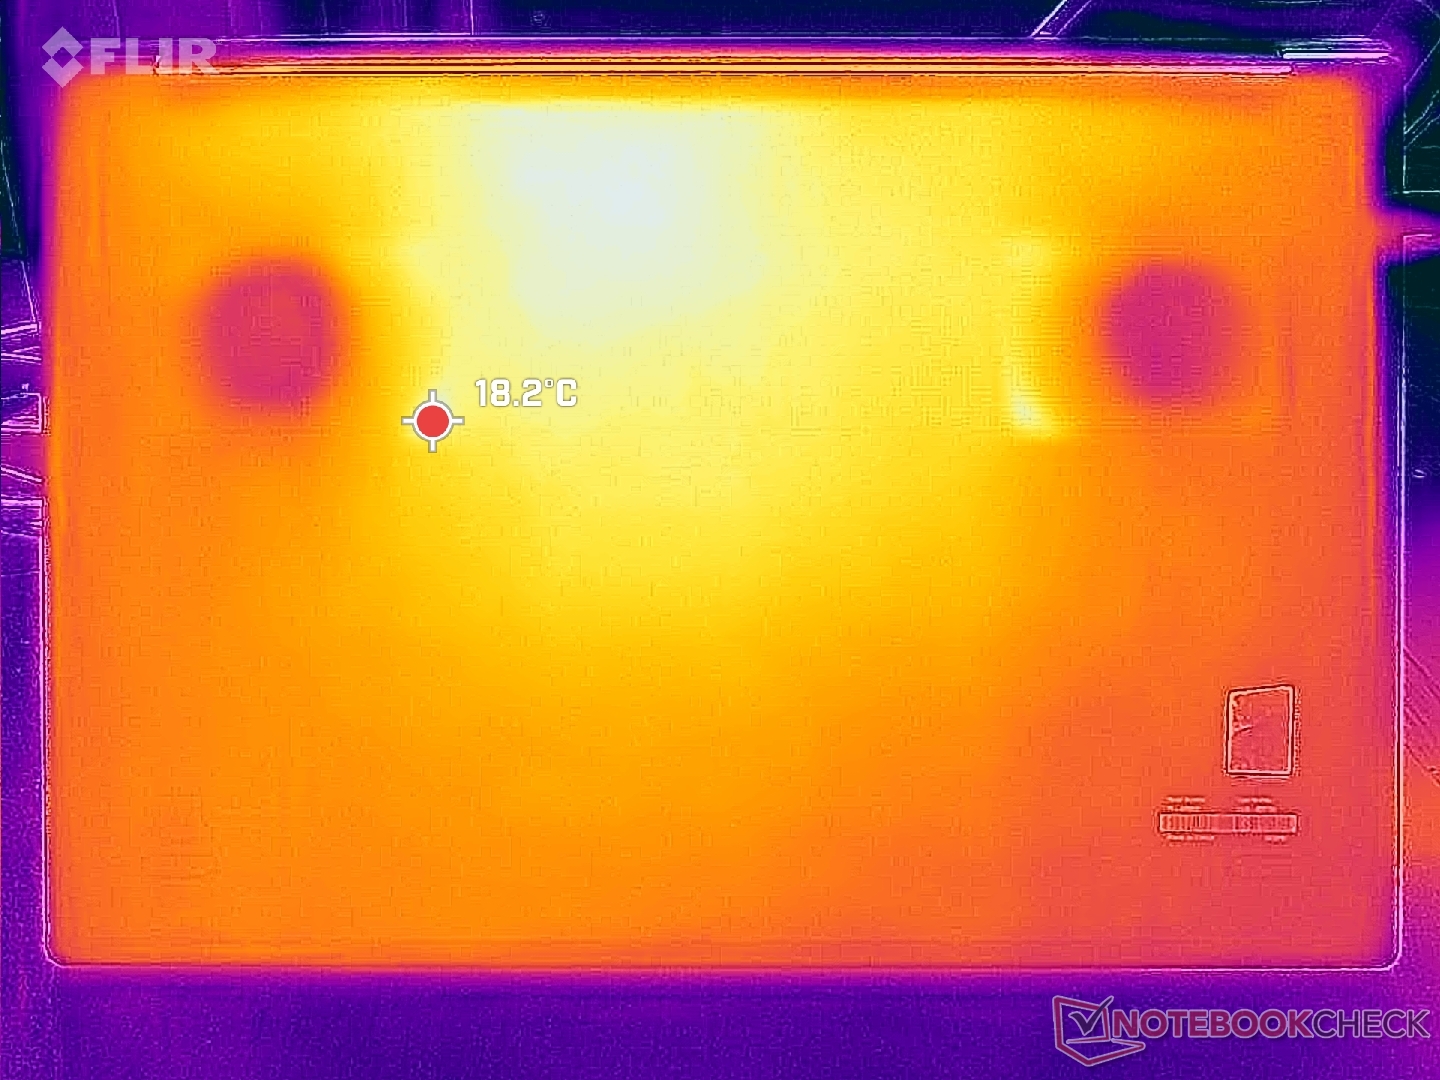
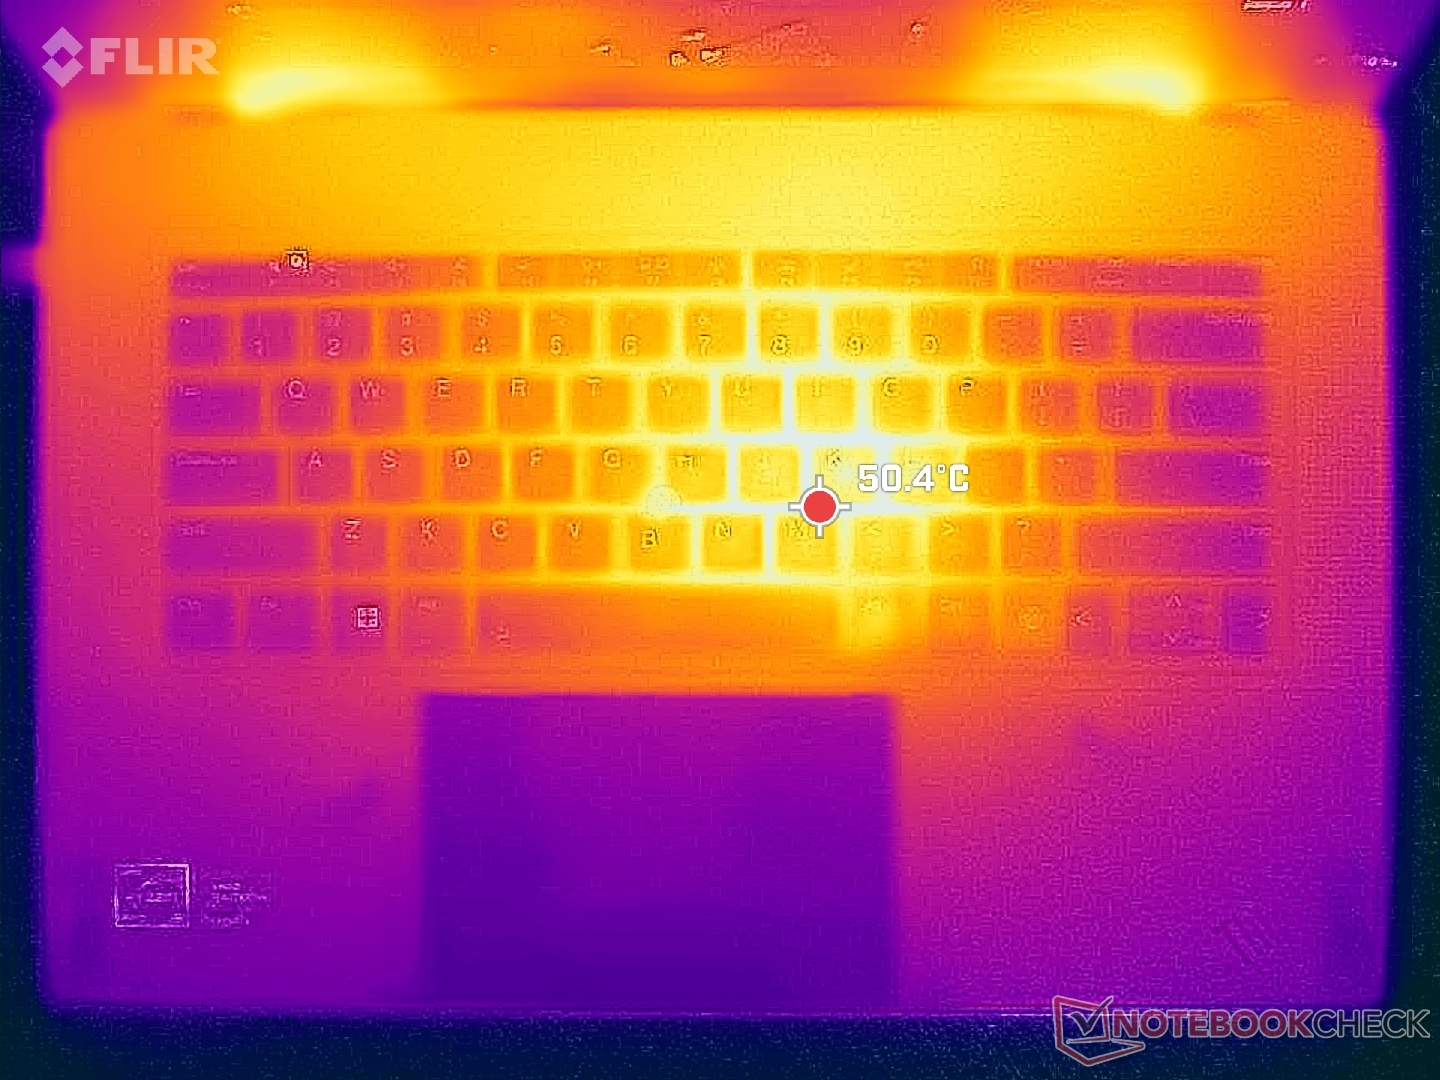
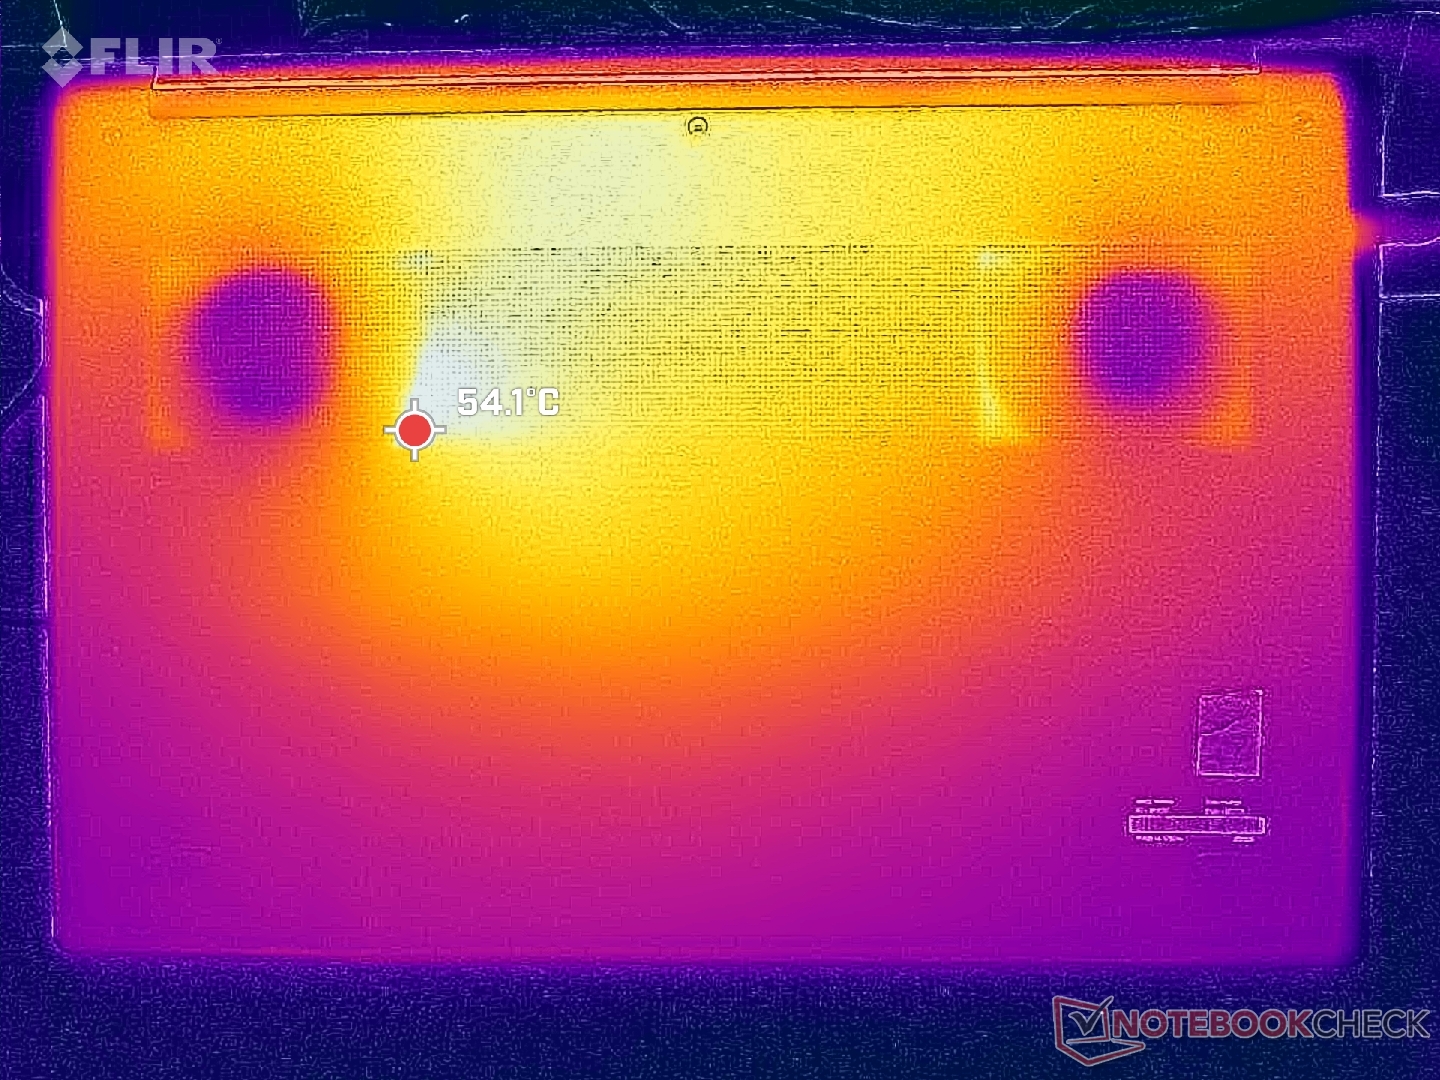
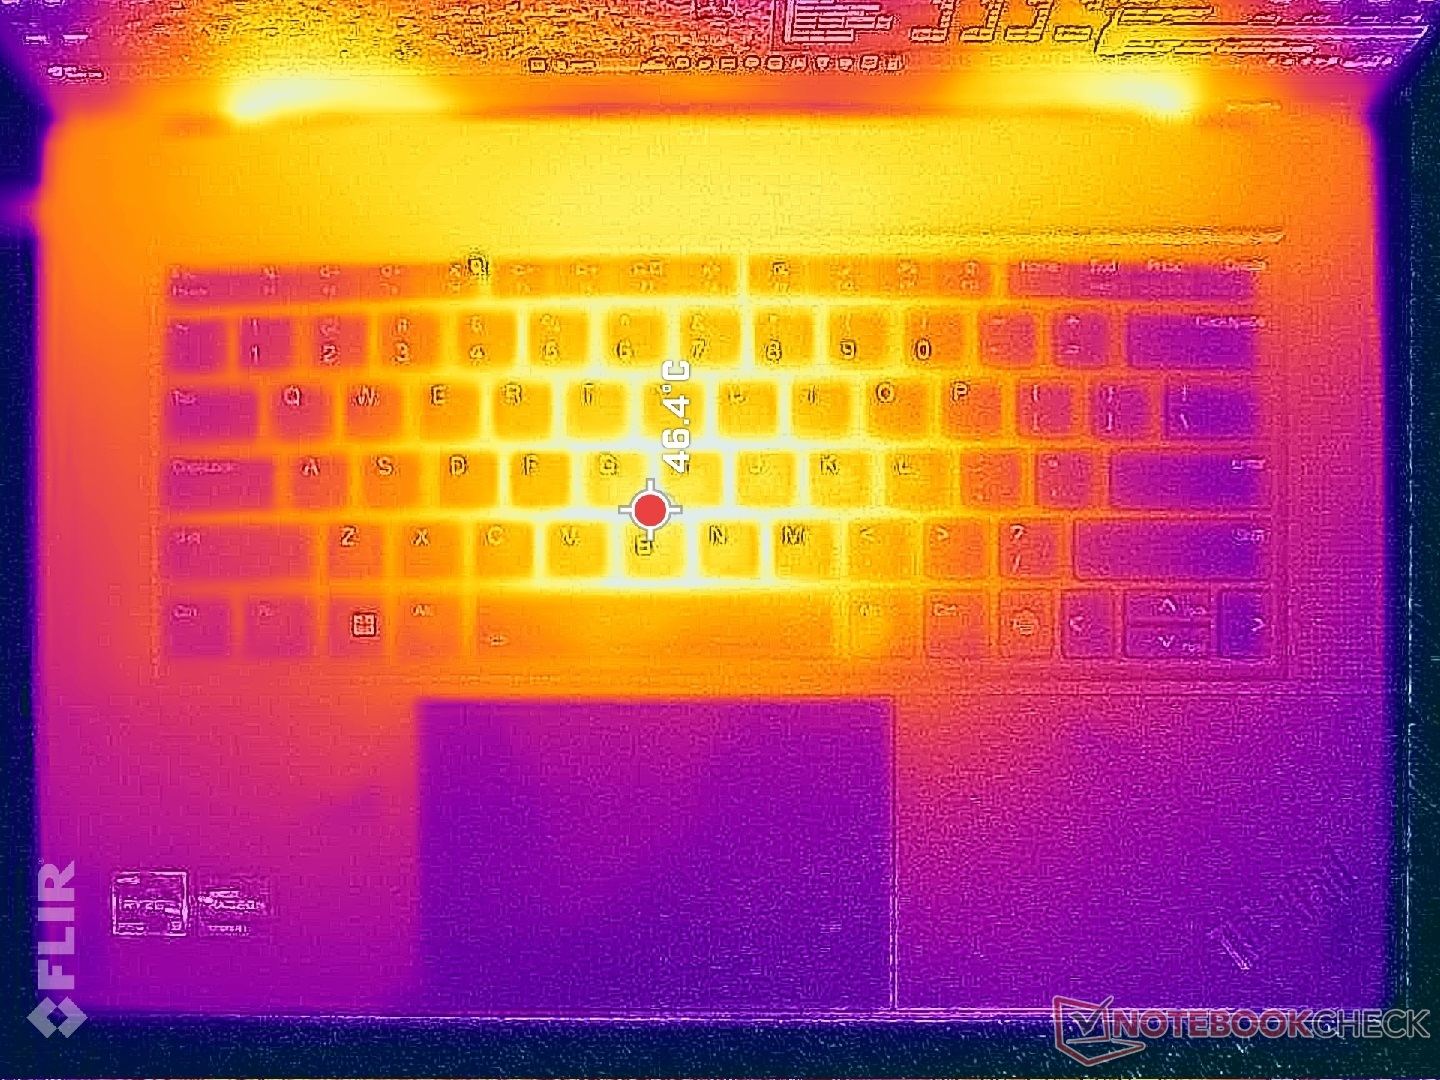
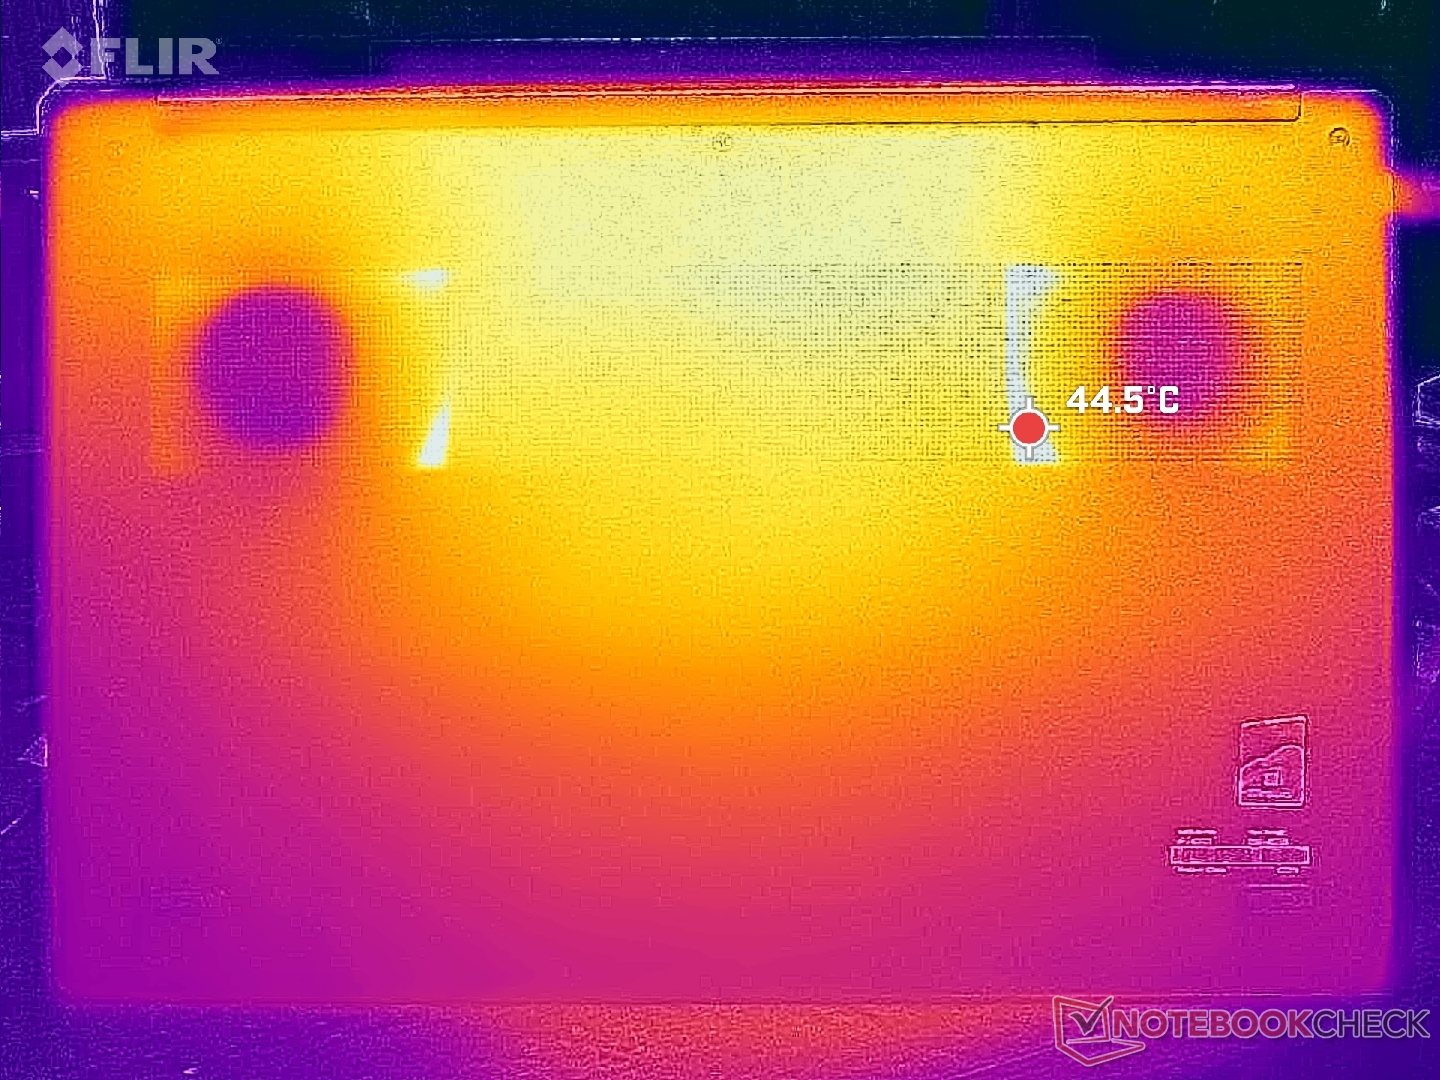
As temperaturas da superfície sobem e descem com bastante rapidez e em extremos mais amplos, já que a maior parte do chassi é de metal. Ao executar cargas exigentes, como jogos, os pontos quentes podem chegar a 47 °C e 43 °C no centro do teclado e na placa inferior, respectivamente, mas isso pode ser ainda mais quente, acima de 50 °C, dependendo da temperatura ambiente, como o que observamos no ThinkPad Z16 Gen 1. Os resultados são, no entanto, muito mais frios do que os registrados no MSI Creator Z16P que ficava quente demais para o seu próprio bem.
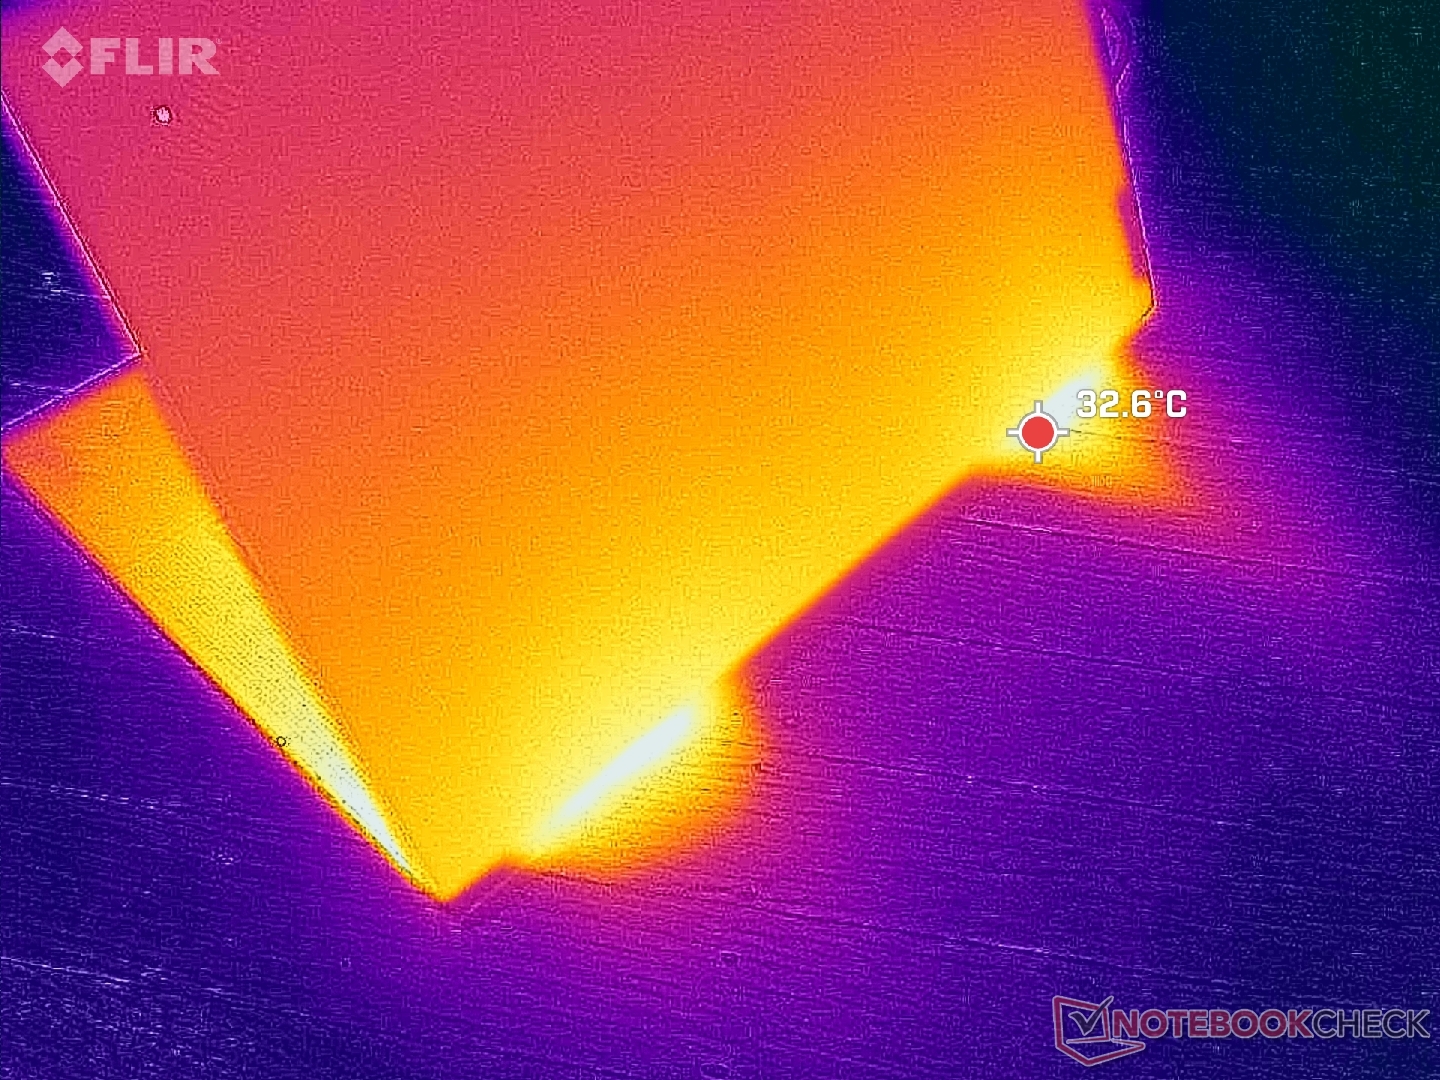
(±) A temperatura máxima no lado superior é 43 °C / 109 F, em comparação com a média de 36.8 °C / 98 F , variando de 21 a 71 °C para a classe Multimedia.
(±) A parte inferior aquece até um máximo de 41.6 °C / 107 F, em comparação com a média de 39.1 °C / 102 F
(+) Em uso inativo, a temperatura média para o lado superior é 20.3 °C / 69 F, em comparação com a média do dispositivo de 31.3 °C / ### class_avg_f### F.
(-) Jogando The Witcher 3, a temperatura média para o lado superior é 38.1 °C / 101 F, em comparação com a média do dispositivo de 31.3 °C / ## #class_avg_f### F.
(+) Os apoios para as mãos e o touchpad são mais frios que a temperatura da pele, com um máximo de 30 °C / 86 F e, portanto, são frios ao toque.
(±) A temperatura média da área do apoio para as mãos de dispositivos semelhantes foi 28.7 °C / 83.7 F (-1.3 °C / -2.3 F).
| Lenovo ThinkPad Z16 Gen 2 AMD Ryzen 9 PRO 7940HS, AMD Radeon RX 6550M | Lenovo ThinkPad Z16 G1 21D5S00T00 AMD Ryzen 7 PRO 6850H, AMD Radeon RX 6500M | Lenovo ThinkBook 16 G6 ABP AMD Ryzen 5 7530U, AMD Radeon RX Vega 7 | MSI Creator Z16P B12UHST Intel Core i9-12900H, NVIDIA GeForce RTX 3080 Ti Laptop GPU | Apple MacBook Pro 16 2023 M3 Pro Apple M3 Pro 12-Core, Apple M3 Pro 18-Core GPU | Asus Vivobook Pro 16X K6604JV-MX016W Intel Core i9-13980HX, NVIDIA GeForce RTX 4060 Laptop GPU | |
|---|---|---|---|---|---|---|
| Heat | -33% | -30% | -49% | -2% | -36% | |
| Maximum Upper Side * (°C) | 43 | 56.8 -32% | 40.8 5% | 67 -56% | 38.1 11% | 39.7 8% |
| Maximum Bottom * (°C) | 41.6 | 53.3 -28% | 50.5 -21% | 69 -66% | 37 11% | 60 -44% |
| Idle Upper Side * (°C) | 21.2 | 28.2 -33% | 29.3 -38% | 29 -37% | 24.2 -14% | 30.9 -46% |
| Idle Bottom * (°C) | 21.4 | 29.4 -37% | 35.2 -64% | 29 -36% | 24.6 -15% | 34.7 -62% |
* ... menor é melhor
Teste de estresse
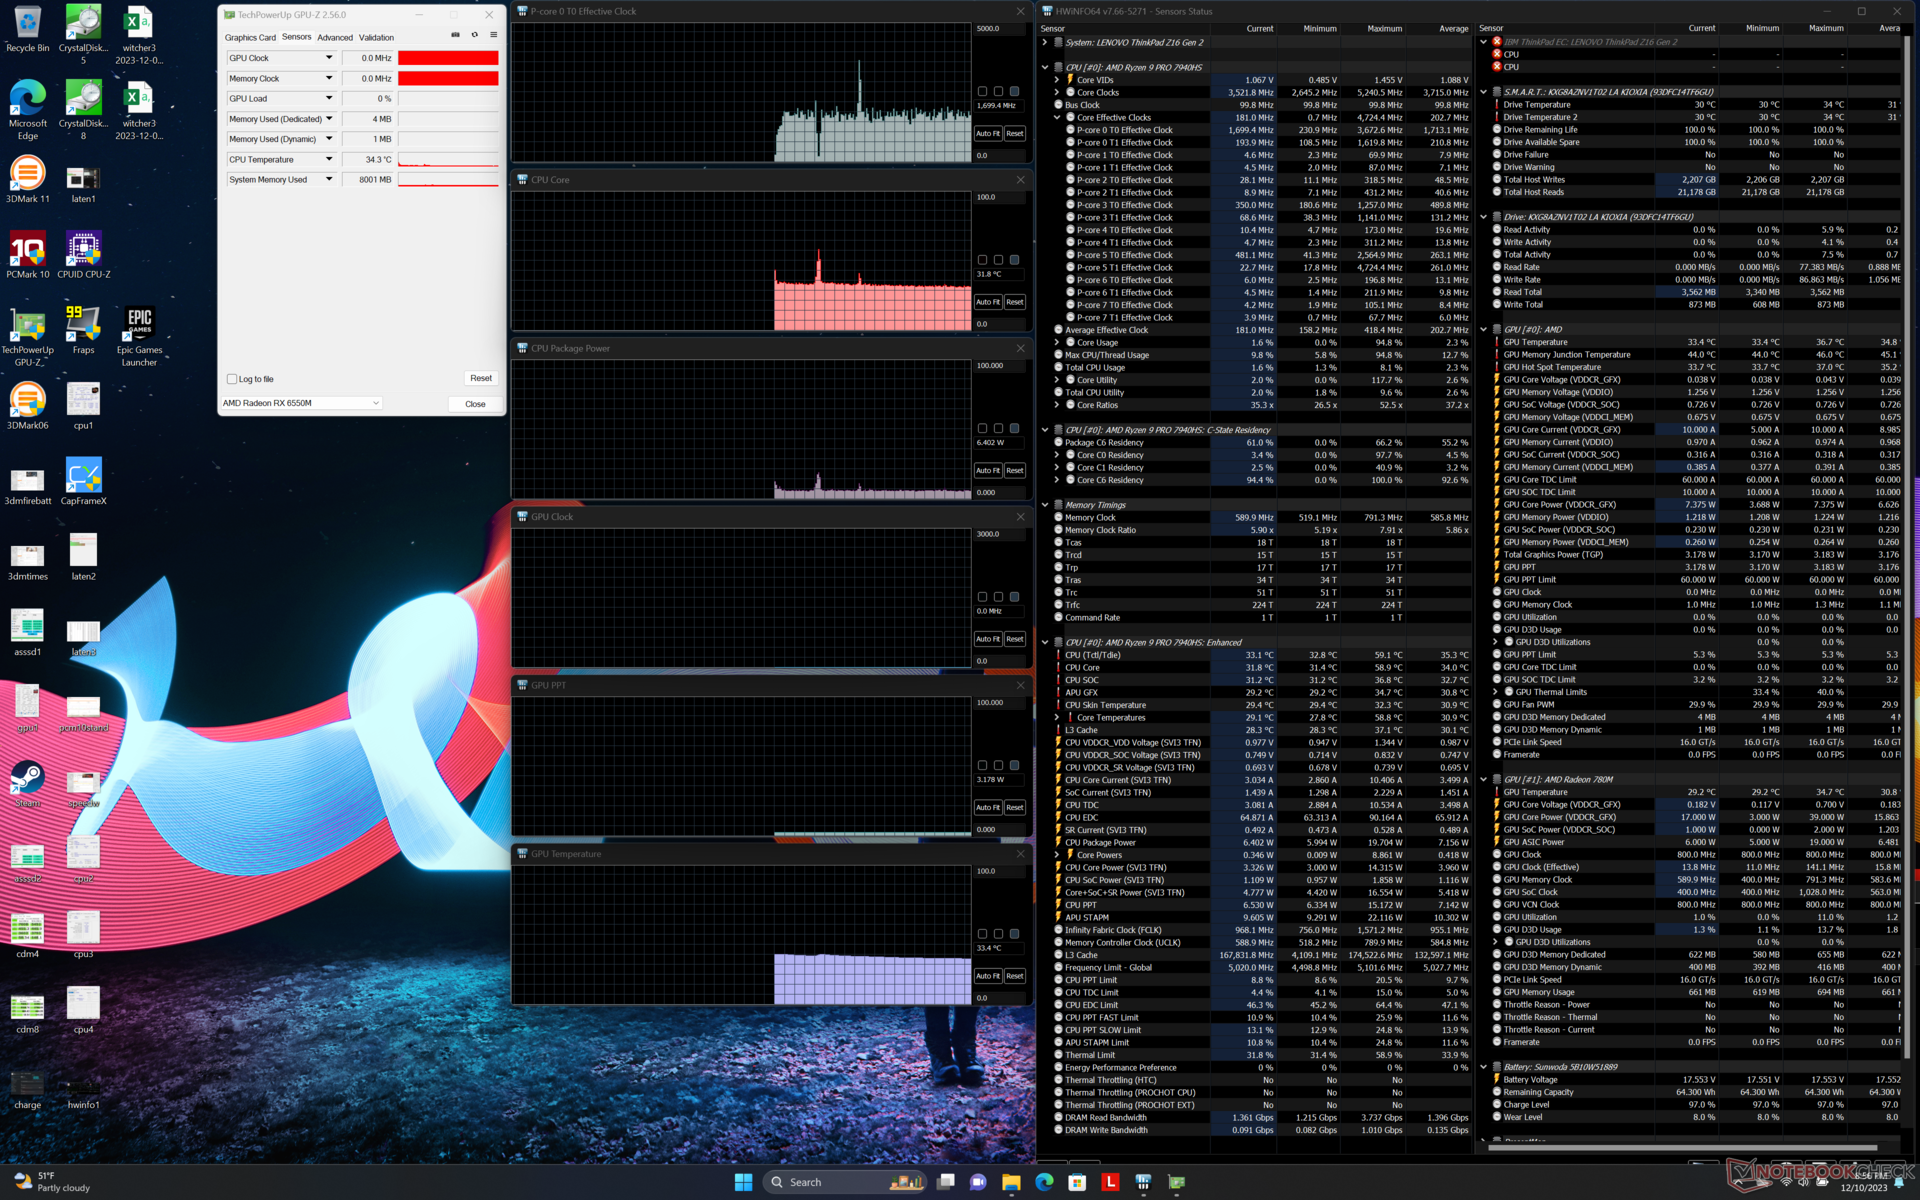
Ao executar o estresse do Prime95, a CPU aumentaria para 4,6 GHz e 82 W por apenas alguns segundos antes de cair e se estabilizar em 4,4 GHz, 69 W e 100 C. É evidente que a CPU está funcionando o mais rápido possível dentro dos limites da solução de resfriamento sobreposta.
As taxas de clock da GPU e o consumo de energia da placa durante a execução no modo Performance se estabilizariam em 2630 MHz e 59 W, respectivamente, em comparação com 2133 MHz e 39 W durante a execução no modo Balanced. Mais notavelmente, o déficit de desempenho entre os dois modos durante a execução do Witcher 3 é mínimo em apenas alguns quadros, embora as diferenças de ruído da ventoinha sejam significativas. Portanto, os usuários talvez queiram considerar a possibilidade de jogar no modo Balanced por causa das ventoinhas muito mais silenciosas e das temperaturas do núcleo ligeiramente mais baixas.
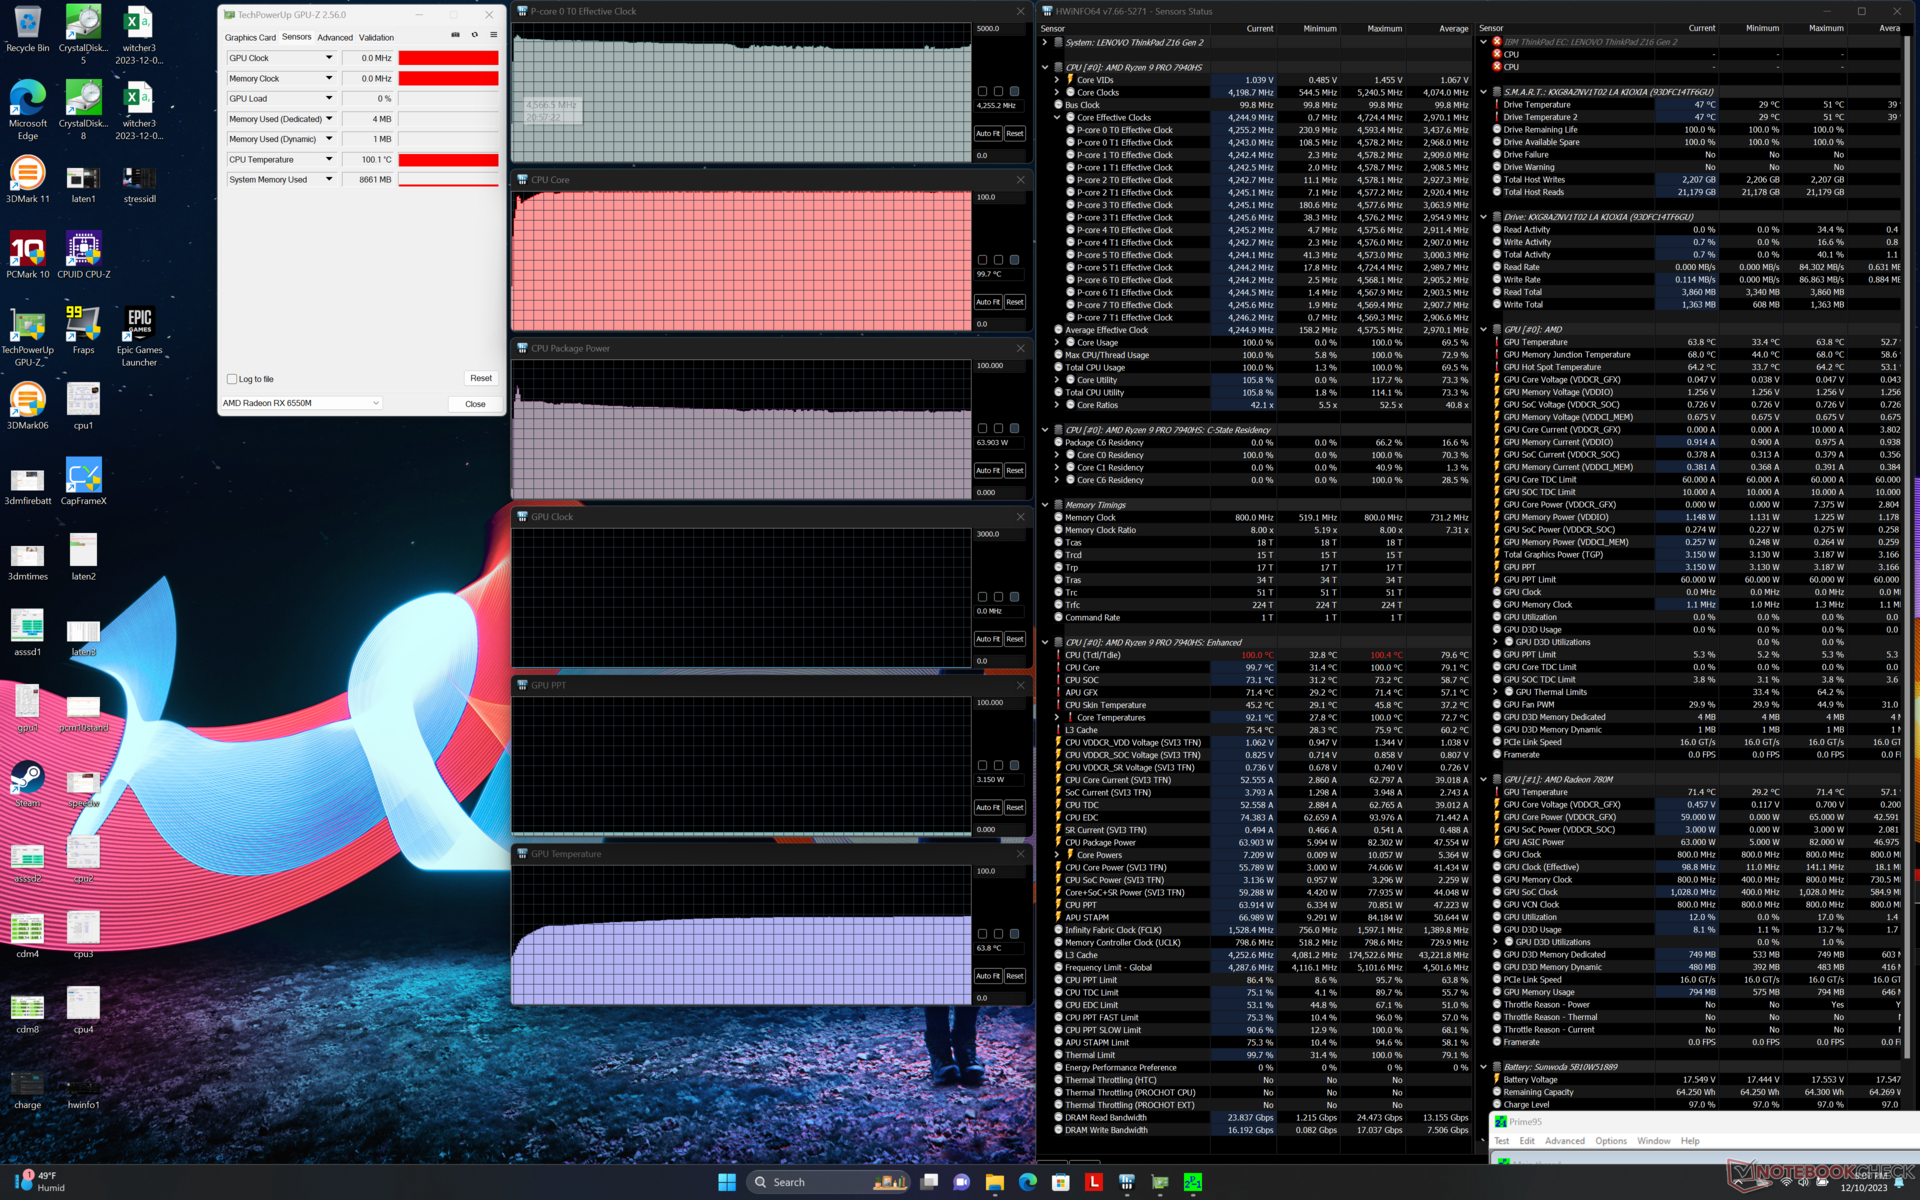
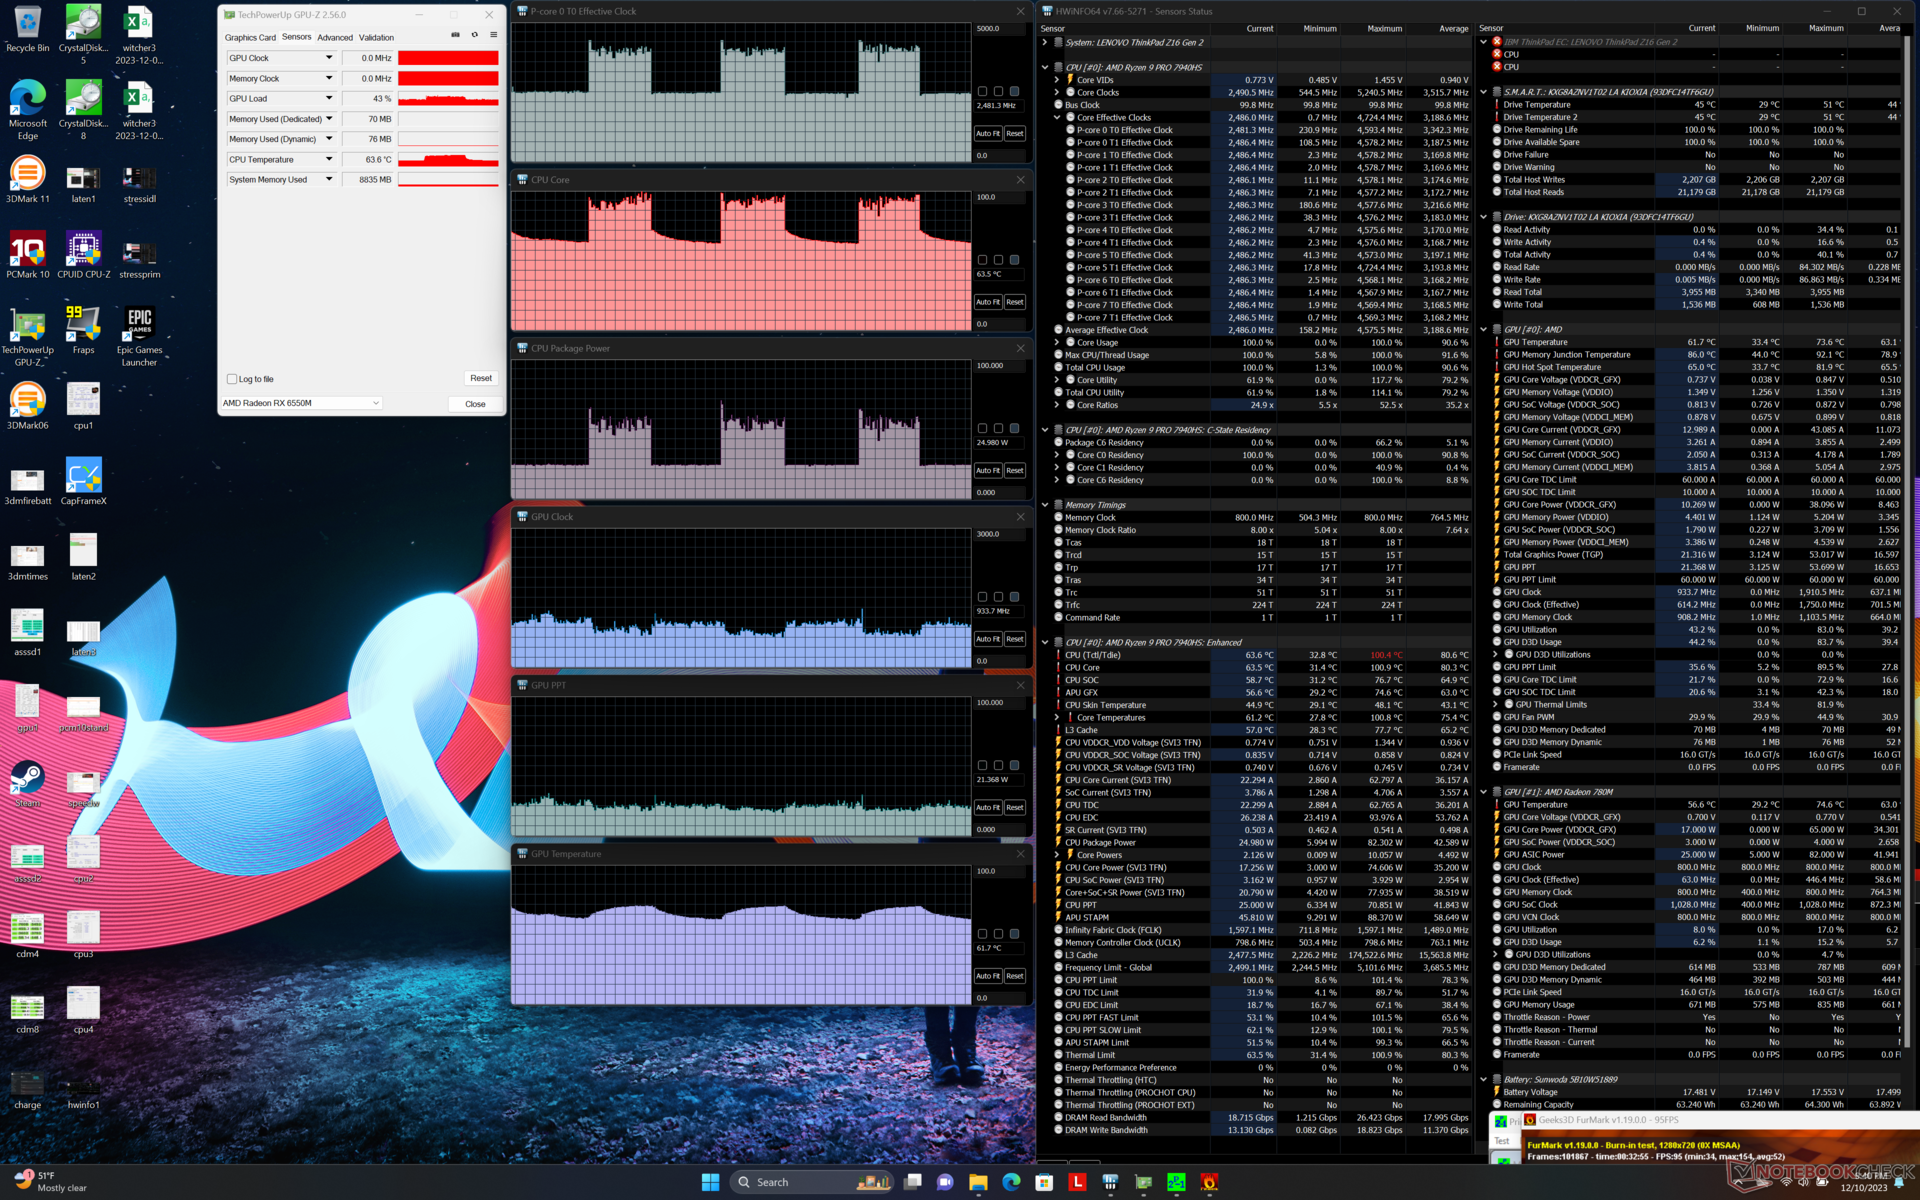
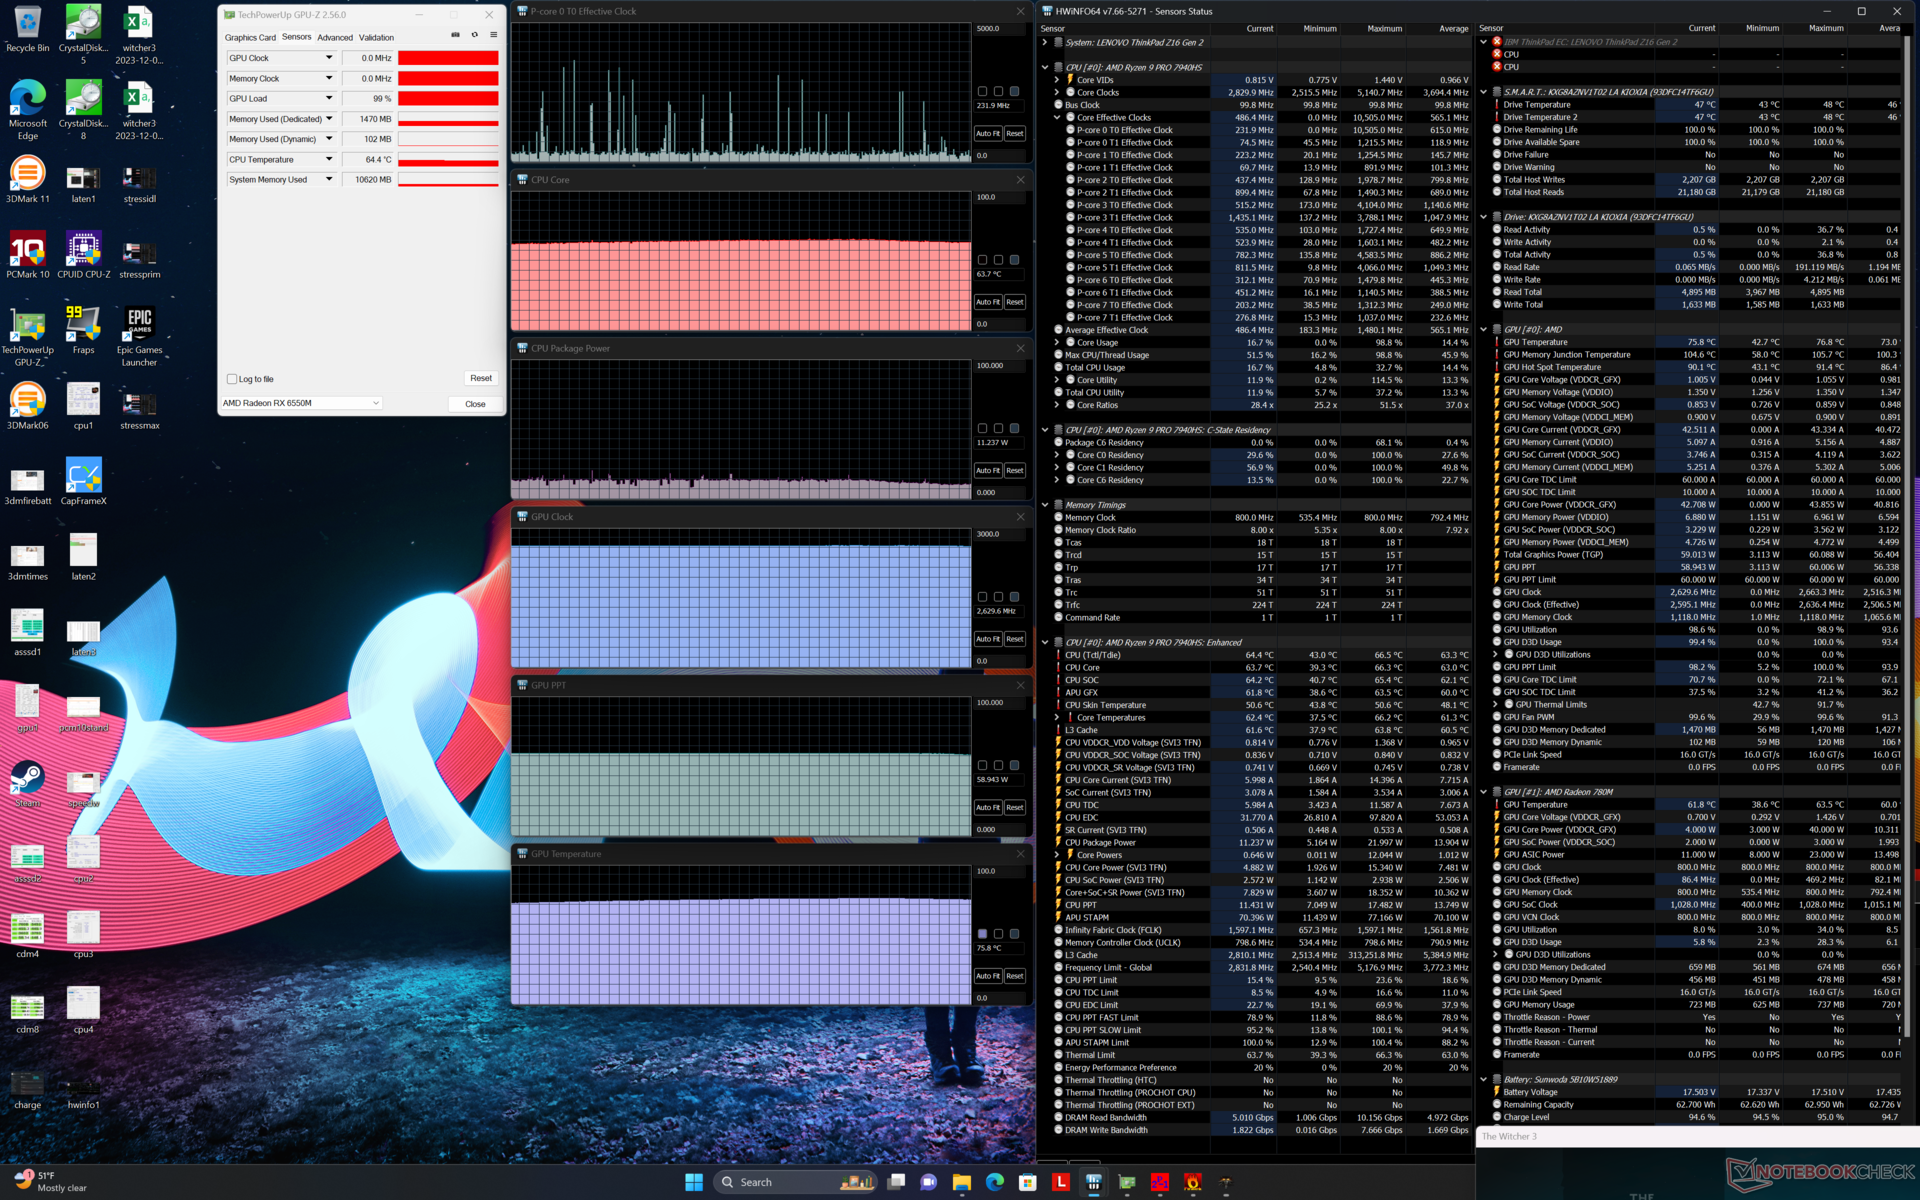
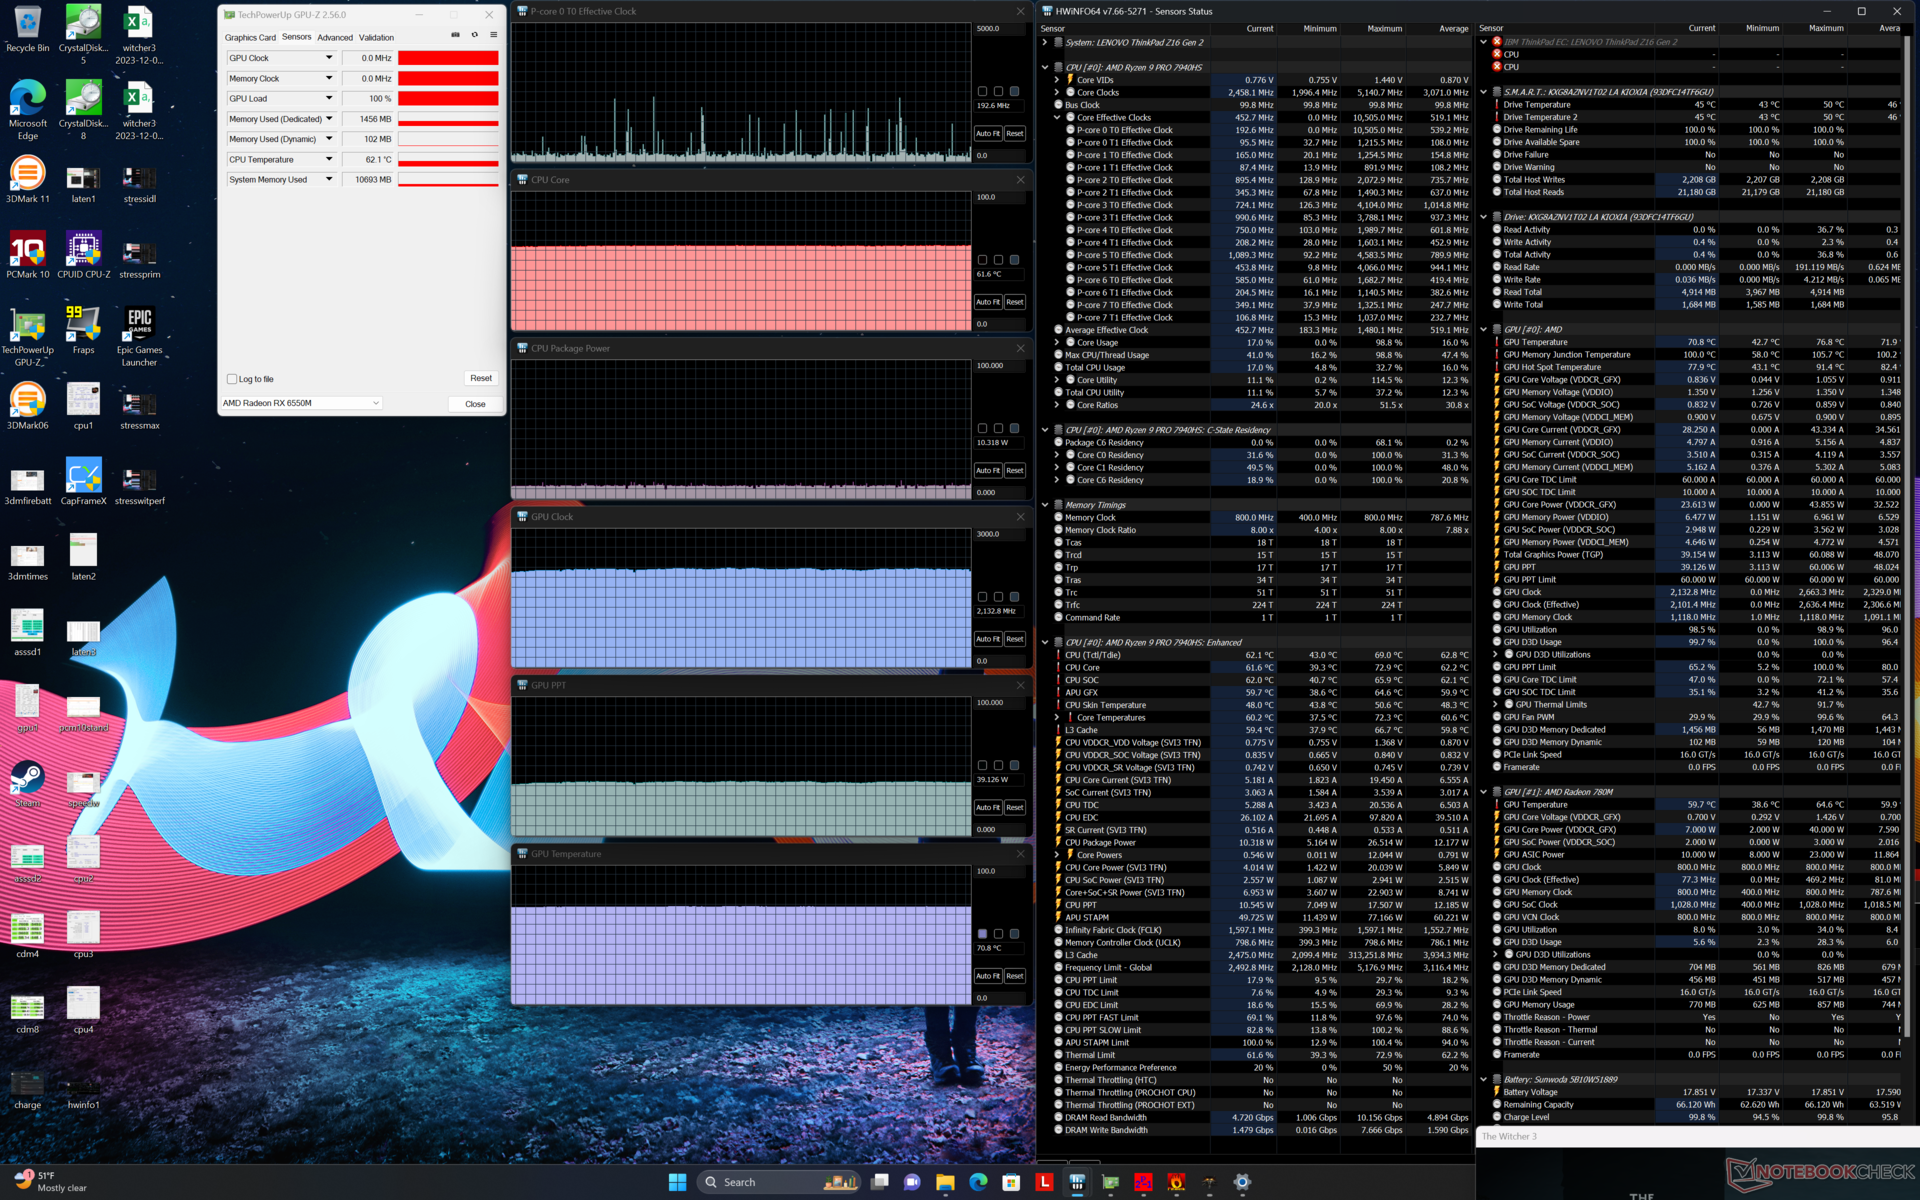
| CPU Clock (GHz) | GPU Clock (MHz) | Temperatura média da CPU (°C) | Temperatura média da GPU (°C) | |
| Sistema ocioso | -- | -- | 32 | 33 |
| Estressedo Prime95 | 4.2 | -- | 100 | 64 |
| EstressePrime95 + FurMark | 2.5 - 4.0 | 750 - 1000 | 64 - 100 | 62 - 72 |
| Witcher 3 Estresse(modo balanceado) | ~0,2 | 2133 | 62 | 71 |
| Witcher 3 Estresse(modo de desempenho) | ~0,2 | 2630 | 64 | 76 |
Alto-falantes
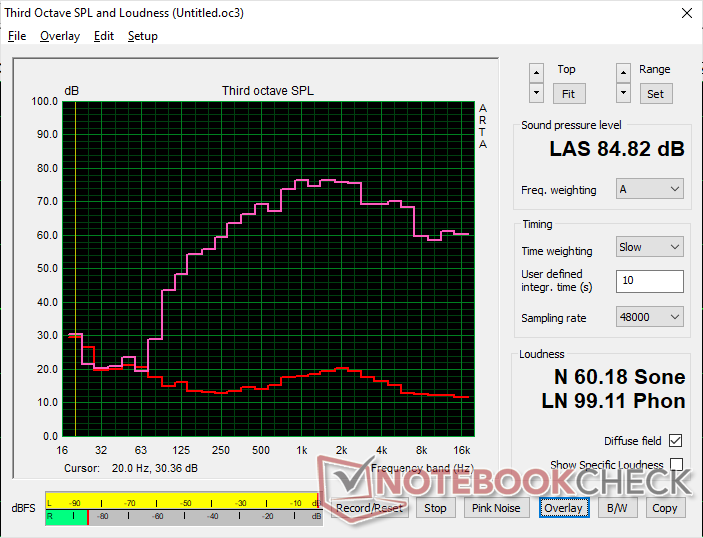
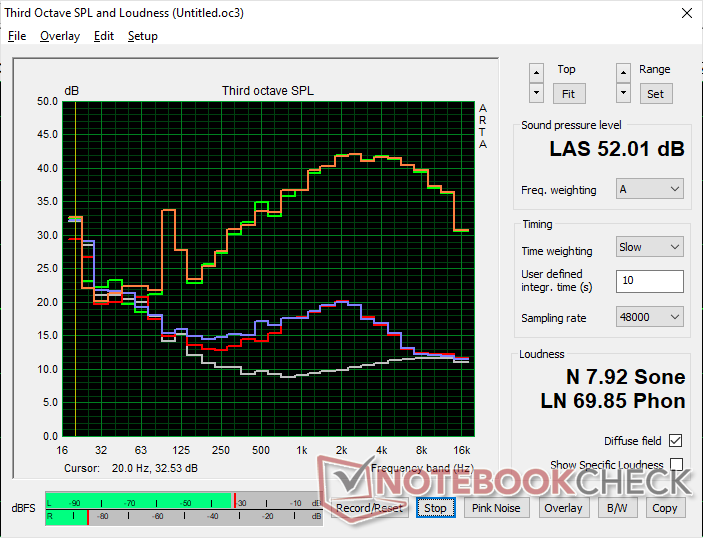
Lenovo ThinkPad Z16 Gen 2 análise de áudio
(+) | os alto-falantes podem tocar relativamente alto (###valor### dB)
Graves 100 - 315Hz
(±) | graves reduzidos - em média 13% menor que a mediana
(±) | a linearidade dos graves é média (11.1% delta para a frequência anterior)
Médios 400 - 2.000 Hz
(±) | médios mais altos - em média 5.5% maior que a mediana
(+) | médios são lineares (4.9% delta para frequência anterior)
Altos 2 - 16 kHz
(+) | agudos equilibrados - apenas 4.7% longe da mediana
(+) | os máximos são lineares (5.2% delta da frequência anterior)
Geral 100 - 16.000 Hz
(+) | o som geral é linear (14.8% diferença em relação à mediana)
Comparado com a mesma classe
» 35% de todos os dispositivos testados nesta classe foram melhores, 4% semelhantes, 61% piores
» O melhor teve um delta de 5%, a média foi 17%, o pior foi 45%
Comparado com todos os dispositivos testados
» 20% de todos os dispositivos testados foram melhores, 4% semelhantes, 76% piores
» O melhor teve um delta de 4%, a média foi 23%, o pior foi 134%
Apple MacBook Pro 16 2021 M1 Pro análise de áudio
(+) | os alto-falantes podem tocar relativamente alto (###valor### dB)
Graves 100 - 315Hz
(+) | bons graves - apenas 3.8% longe da mediana
(+) | o baixo é linear (5.2% delta para a frequência anterior)
Médios 400 - 2.000 Hz
(+) | médios equilibrados - apenas 1.3% longe da mediana
(+) | médios são lineares (2.1% delta para frequência anterior)
Altos 2 - 16 kHz
(+) | agudos equilibrados - apenas 1.9% longe da mediana
(+) | os máximos são lineares (2.7% delta da frequência anterior)
Geral 100 - 16.000 Hz
(+) | o som geral é linear (4.6% diferença em relação à mediana)
Comparado com a mesma classe
» 0% de todos os dispositivos testados nesta classe foram melhores, 0% semelhantes, 100% piores
» O melhor teve um delta de 5%, a média foi 17%, o pior foi 45%
Comparado com todos os dispositivos testados
» 0% de todos os dispositivos testados foram melhores, 0% semelhantes, 100% piores
» O melhor teve um delta de 4%, a média foi 23%, o pior foi 134%
Gerenciamento de energia
Consumo de energia
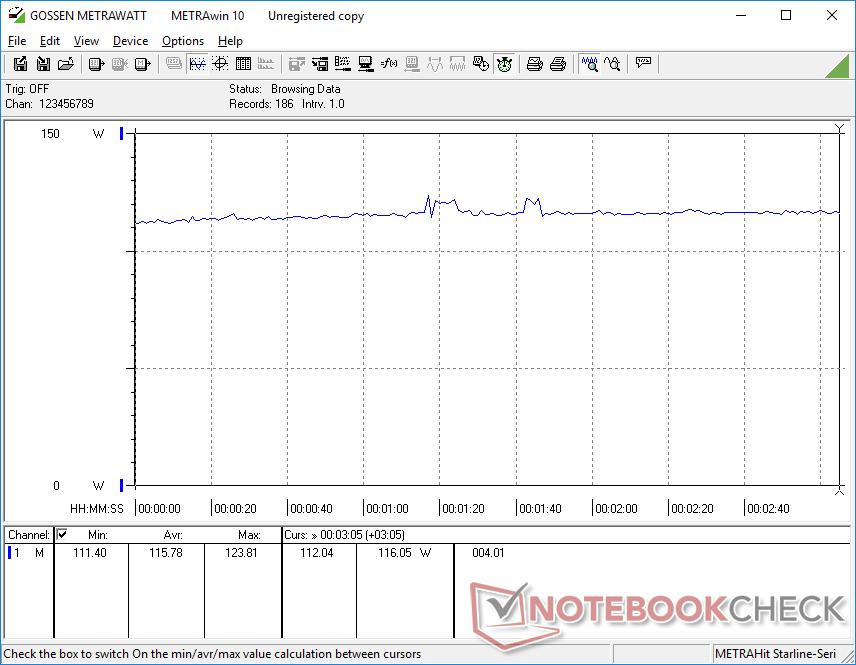
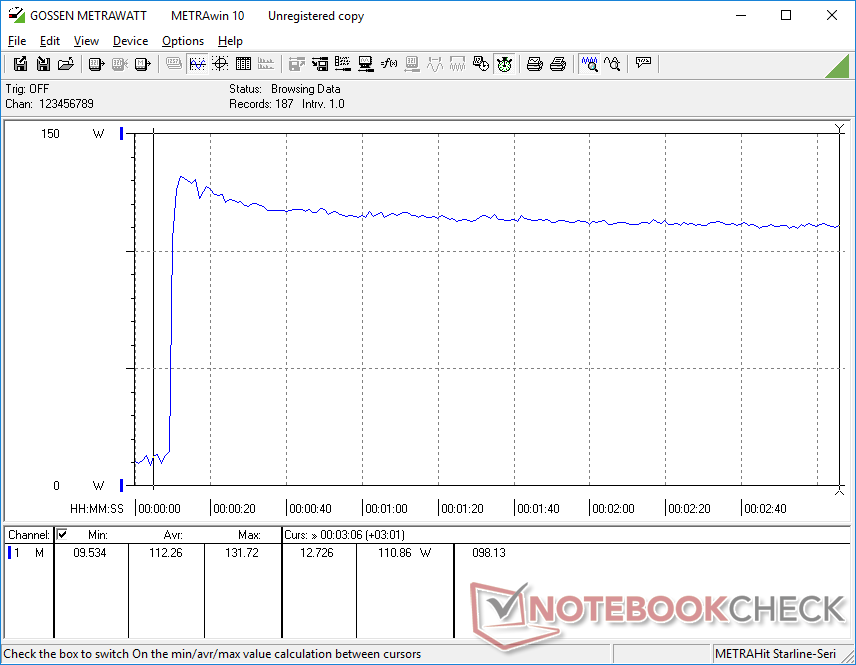
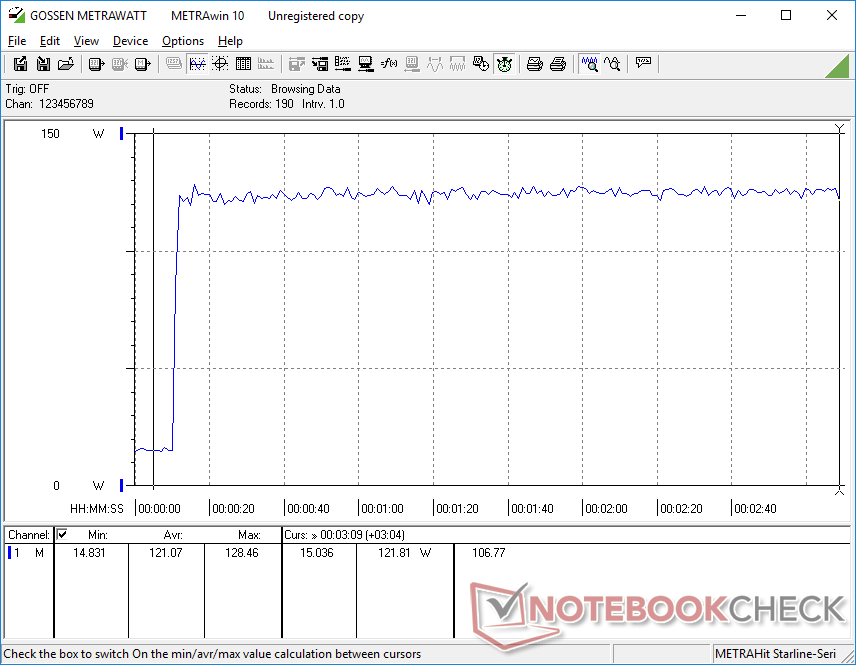
O painel OLED 4K afeta o consumo de energia em uma quantidade notável. Por exemplo, o consumo de energia seria de apenas 7 W em marcha lenta em uma tela totalmente preta, enquanto uma tela totalmente branca com brilho máximo pode exigir quase 19 W, em comparação com apenas 10 W na configuração IPS. As diferenças de consumo de energia entre IPS e OLED são exploradas em mais detalhes aqui.
O consumo ao executar tarefas intensivas de CPU ou GPU é ligeiramente maior do que no ThinkPad Z16 Gen 1, mesmo depois de considerar o painel OLED mais exigente. No entanto, as diferenças são pequenas em relação aos grandes aumentos de desempenho que a CPU Zen 4 Ryzen 9 oferece.
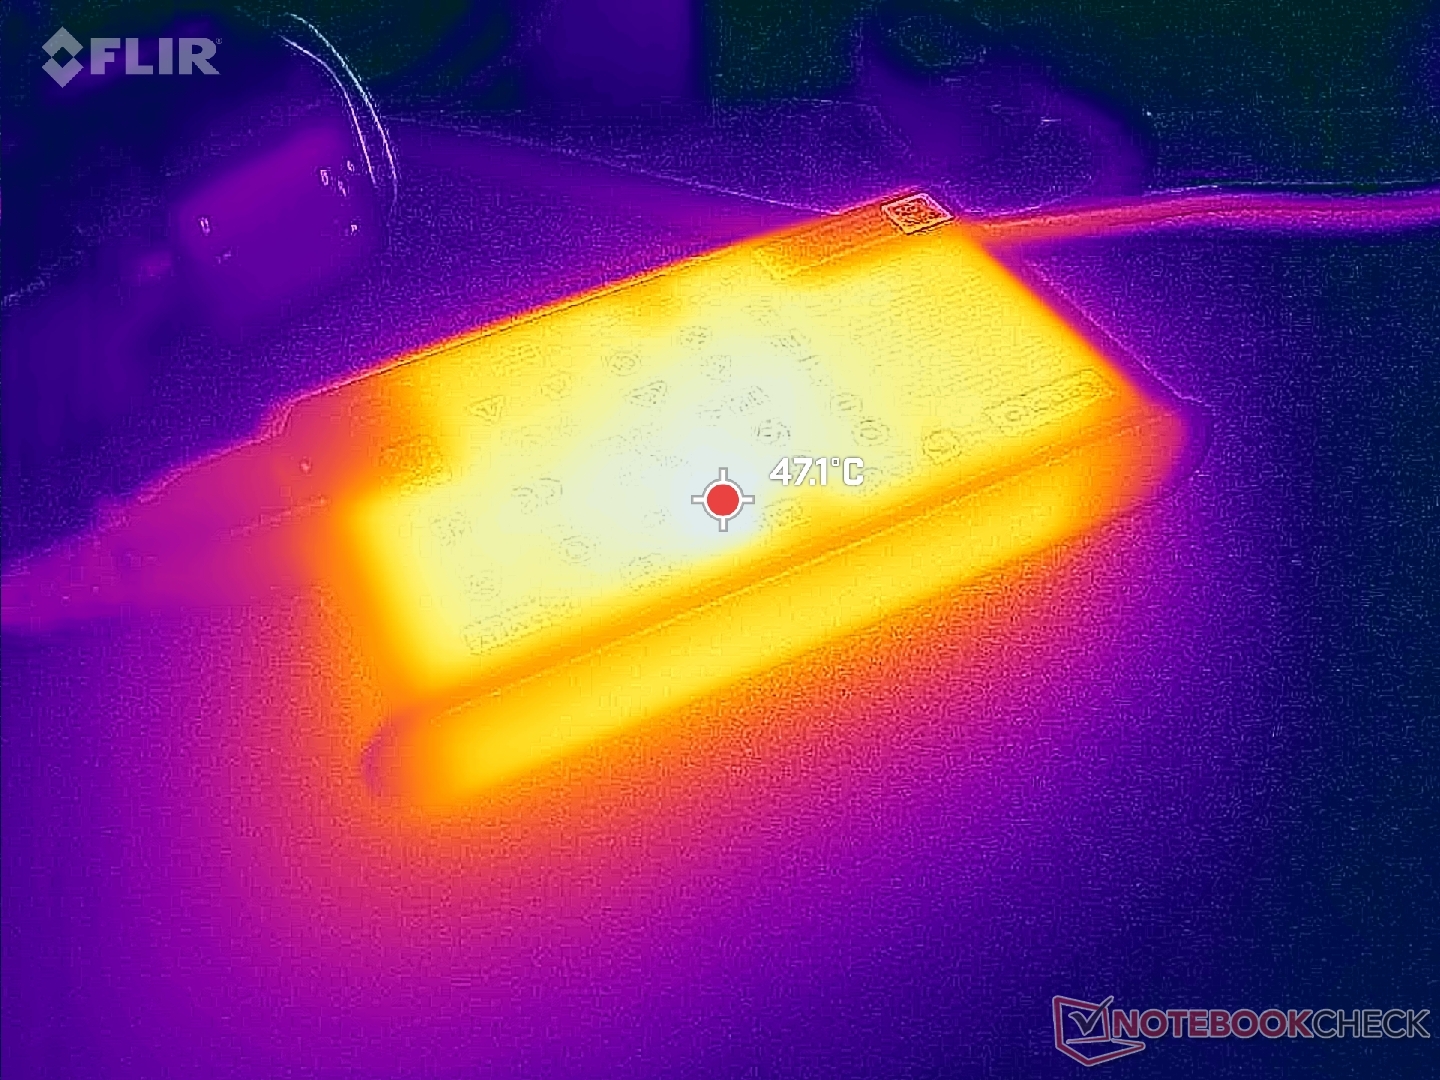
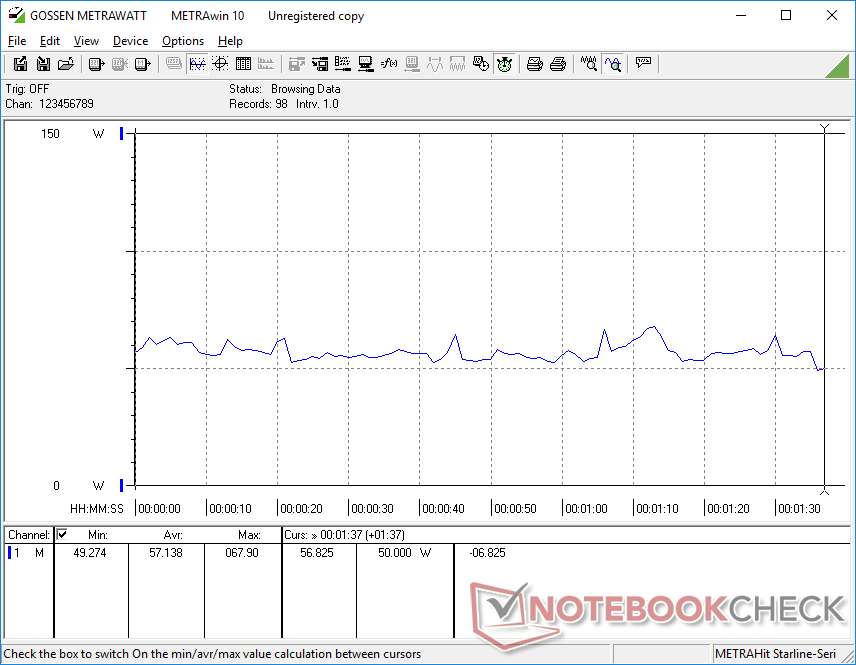
Conseguimos medir um consumo máximo de 132 W com o adaptador CA USB-C de 135 W de tamanho médio (~14,6 x 7,7 x 2,3 cm). Os jogos já exigem quase 120 W, o que significa que a taxa de carregamento ficará lenta se o senhor estiver executando cargas exigentes simultaneamente.
| desligado | |
| Ocioso | |
| Carga |
|
Key:
min: | |
| Lenovo ThinkPad Z16 Gen 2 R9 PRO 7940HS, Radeon RX 6550M, Kioxia XG8 KXG8AZNV1T02, OLED, 3840x2400, 16" | Lenovo ThinkPad Z16 G1 21D5S00T00 R7 PRO 6850H, Radeon RX 6500M, Samsung PM9A1 MZVL21T0HCLR, IPS LED, 1920x1200, 16" | Lenovo ThinkBook 16 G6 ABP R5 7530U, Vega 7, SK hynix HFS512GEJ9X125N, IPS, 1920x1200, 16" | MSI Creator Z16P B12UHST i9-12900H, GeForce RTX 3080 Ti Laptop GPU, Samsung PM9A1 MZVL22T0HBLB, IPS True Pixel (~100% DCI-P3), 2560x1600, 16" | Asus Vivobook Pro 16X K6604JV-MX016W i9-13980HX, GeForce RTX 4060 Laptop GPU, Solidigm P41 Plus SSDPFKNU010TZ, OLED, 3200x2000, 16" | Apple MacBook Pro 16 2023 M3 Max Apple M3 Max 16-Core, M3 Max 40-Core GPU, Apple SSD AP8192Z, Mini-LED, 3456x2234, 16" | |
|---|---|---|---|---|---|---|
| Power Consumption | 15% | 45% | -60% | -71% | -17% | |
| Idle Minimum * (Watt) | 7.5 | 5.3 29% | 3.7 51% | 11 -47% | 13.8 -84% | 5.2 31% |
| Idle Average * (Watt) | 9.6 | 8.6 10% | 7.1 26% | 17 -77% | 16 -67% | 16.9 -76% |
| Idle Maximum * (Watt) | 18.5 | 9.5 49% | 7.7 58% | 26 -41% | 19 -3% | 17.2 7% |
| Load Average * (Watt) | 57.1 | 65.2 -14% | 43.9 23% | 124 -117% | 147 -157% | 90.5 -58% |
| Witcher 3 ultra * (Watt) | 115.8 | 93.6 19% | 40.8 65% | 133.5 -15% | 147.8 -28% | 109 6% |
| Load Maximum * (Watt) | 131.7 | 133.81 -2% | 66.6 49% | 212 -61% | 244 -85% | 145.2 -10% |
* ... menor é melhor
Power Consumption Witcher 3 / Stresstest
Power Consumption external Monitor
Duração da bateria
Os tempos de execução são geralmente mais curtos do que no modelo do ano passado, em grande parte devido ao nosso painel OLED mais exigente. Como a maioria das páginas da Web é predominantemente de cor branca, o consumo de energia pode ser 10 W maior, mesmo que os aplicativos ativos sejam pouco exigentes, conforme mencionado na seção Consumo de energia acima. Só conseguimos registrar um tempo de execução de WLAN de 6 horas, em comparação com 10 horas na configuração do ThinkPad Z16 IPS ou mais de 16 horas no MacBook Pro 16.
O carregamento da capacidade vazia até a capacidade total é mais lento do que o normal, cerca de 2,5 horas, em comparação com 1,5 a 2 horas na maioria dos Ultrabooks. Este é um dos poucos notebooks com Ryzen 9 e gráficos discretos a serem alimentados por USB-C.
| Lenovo ThinkPad Z16 Gen 2 R9 PRO 7940HS, Radeon RX 6550M, 72 Wh | Lenovo ThinkPad Z16 G1 21D5S00T00 R7 PRO 6850H, Radeon RX 6500M, 72 Wh | Lenovo ThinkBook 16 G6 ABP R5 7530U, Vega 7, 45 Wh | MSI Creator Z16P B12UHST i9-12900H, GeForce RTX 3080 Ti Laptop GPU, 90 Wh | Asus Vivobook Pro 16X K6604JV-MX016W i9-13980HX, GeForce RTX 4060 Laptop GPU, 90 Wh | Apple MacBook Pro 16 2023 M3 Max Apple M3 Max 16-Core, M3 Max 40-Core GPU, 99.6 Wh | |
|---|---|---|---|---|---|---|
| Duração da bateria | 45% | 68% | -27% | -2% | 75% | |
| Reader / Idle (h) | 10.2 | |||||
| WiFi v1.3 (h) | 6 | 9.9 65% | 10.1 68% | 5.2 -13% | 6.5 8% | 16.7 178% |
| Load (h) | 1.7 | 2.1 24% | 1 -41% | 1.5 -12% | 1.2 -29% | |
| H.264 (h) | 11.9 | 11.6 | 5.8 | 5.3 | 20.4 |
Pro
Contra
Veredicto - Excelente design prejudicado por uma GPU medíocre
Em nossa análise do modelo original de 1ª geração, elogiamos o ThinkPad Z16 por sua construção robusta e atraente e pelo teclado e trackpad confortáveis. O modelo de 2ª geração mantém todas essas vantagens e acrescenta uma CPU Ryzen Pro muito mais rápida e uma tela sensível ao toque OLED de alta qualidade para um desempenho e cores visivelmente melhores, respectivamente. Essas duas adições são as principais razões para escolher a versão Gen 2 em vez da Gen 1.
O ThinkPad Z16 Gen 2 é definitivamente elegante e sexy, e a nova CPU Zen 4 Pro não é nada desleixada. A Radeon RX 6550M, no entanto, é muito pouco e muito tarde, especialmente nessa faixa de preço.
A nova Radeon RX 6550M também ajuda a distinguir entre as duas versões do modelo, mas seu desempenho não impressiona, especialmente quando o senhor leva em conta o alto preço pedido de mais de US$ 1.600. Além de a GPU ser de uma arquitetura AMD mais antiga, os notebooks com a GeForce RTX 3050 Ti podem ser encontrados por menos de mil dólares, oferecendo um nível de desempenho semelhante. A GPU Radeon é definitivamente um dos aspectos mais fracos da série ThinkPad Z16 até o momento.
Se o senhor não se importa com o Ryzen Pro, então o
Asus Vivobook Pro 16X ou até mesmo o HP Spectre x360 série 16 podem servir como excelentes alternativas para o ThinkPad Z16 Gen 2, pois cada um oferece opções semelhantes de OLED e gráficos discretos em designs de chassi fino. Esperamos que as futuras revisões da Lenovo incluam o GeForce RTX ou as opções mais recentes do RDNA3.Preço e disponibilidade
A Lenovo agora está enviando o ThinkPad Z16 Gen 2 a partir de $1600 USD para o Ryzen 5, GPU integrada e configuração IPS de 1200p até mais de $2600, conforme analisado.
Lenovo ThinkPad Z16 Gen 2
- 12/16/2023 v7 (old)
Allen Ngo
Transparência
A seleção dos dispositivos a serem analisados é feita pela nossa equipe editorial. A amostra de teste foi fornecida ao autor como empréstimo pelo fabricante ou varejista para fins desta revisão. O credor não teve influência nesta revisão, nem o fabricante recebeu uma cópia desta revisão antes da publicação. Não houve obrigação de publicar esta revisão. Como empresa de mídia independente, a Notebookcheck não está sujeita à autoridade de fabricantes, varejistas ou editores.
É assim que o Notebookcheck está testando
Todos os anos, o Notebookcheck analisa de forma independente centenas de laptops e smartphones usando procedimentos padronizados para garantir que todos os resultados sejam comparáveis. Desenvolvemos continuamente nossos métodos de teste há cerca de 20 anos e definimos padrões da indústria no processo. Em nossos laboratórios de teste, equipamentos de medição de alta qualidade são utilizados por técnicos e editores experientes. Esses testes envolvem um processo de validação em vários estágios. Nosso complexo sistema de classificação é baseado em centenas de medições e benchmarks bem fundamentados, o que mantém a objetividade.Price comparison

