Estreia do desempenho da Radeon RX 7700S: Análise do Framework Laptop 16

Revelado na GDC 2023o Framework Laptop 16 expande os aspectos de reparabilidade e sustentabilidade do Framework 13.5, mas em um formato maior, de 16 polegadas. No entanto, é muito mais do que apenas uma versão maior, pois o tamanho maior da tela permitiu ainda mais personalização e peças opcionais do que o design original de 13,5 polegadas, incluindo gráficos discretos removíveis, espaçadores de touchpad, LEDs e teclado numérico.
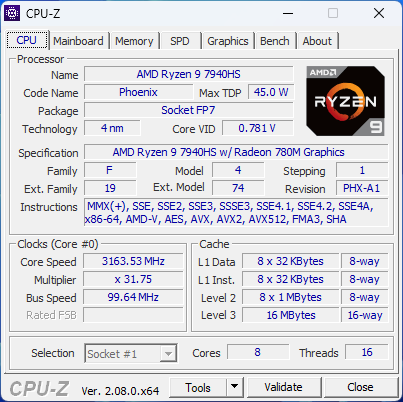
Nossa unidade de análise é a configuração mais avançada com o Ryzen 9 7940HS e a Radeon RX 7700S de 100 W por cerca de US$ 2.400 no varejo. As SKUs mais simples são fornecidas com o Ryzen 7 7840HS e nenhuma GPU discreta, mas todas as opções vêm com a mesma tela IPS VRR de 165 Hz e 1600p. Kits barebone e DIY também estão disponíveis, assim como para o Laptop 13.5. A Framework diz que a empresa trabalhou em estreita colaboração com a AMD no design do Laptop 16, o que significa que não devemos esperar por opções Intel-Nvidia tão cedo.
Embora o Laptop 16 seja totalmente capaz de jogar devido às suas especificações, a Framework está tomando o cuidado de evitar chamá-lo de laptop para jogos por medo de classificar o modelo. Em vez disso, o Laptop 16 tem como alvo um público mais amplo, composto por usuários de multimídia, criadores de conteúdo e jogadores. Os concorrentes do Laptop 16 incluem laptops de 16 polegadas de fabricantes mais tradicionais, como o HP Spectre x360 16e o Dell XPS 16, que será lançado em breve, Lenovo ThinkPad Z16ou o Apple MacBook Pro 16.
Mais análises da estrutura:
Possíveis concorrentes em comparação
Avaliação | Data | Modelo | Peso | Altura | Size | Resolução | Preço |
|---|---|---|---|---|---|---|---|
| 89.6 % v7 (old) | 01/2024 | Framework Laptop 16 R9 7940HS, Radeon RX 7700S | 2.4 kg | 20.95 mm | 16.00" | 2560x1600 | |
| 88.1 % v7 (old) | 12/2023 | MSI Prestige 16 B1MG-001US Ultra 7 155H, Arc 8-Core | 1.6 kg | 19.1 mm | 16.00" | 2560x1600 | |
| 88.6 % v7 (old) | 12/2023 | Lenovo ThinkPad Z16 Gen 2 R9 PRO 7940HS, Radeon RX 6550M | 1.8 kg | 15.8 mm | 16.00" | 3840x2400 | |
| 93.2 % v7 (old) | 11/2023 | Apple MacBook Pro 16 2023 M3 Max Apple M3 Max 16-Core, M3 Max 40-Core GPU | 2.1 kg | 16.9 mm | 16.00" | 3456x2234 | |
| 87.1 % v7 (old) | 08/2023 | Dell Inspiron 16 Plus 7630 i7-13700H, GeForce RTX 4060 Laptop GPU | 2.2 kg | 19.95 mm | 16.00" | 2560x1600 | |
| 87.3 % v7 (old) | 01/2023 | HP Spectre x360 2-in-1 16-f1075ng i7-12700H, Iris Xe G7 96EUs | 2 kg | 19.9 mm | 16.00" | 3072x1920 |
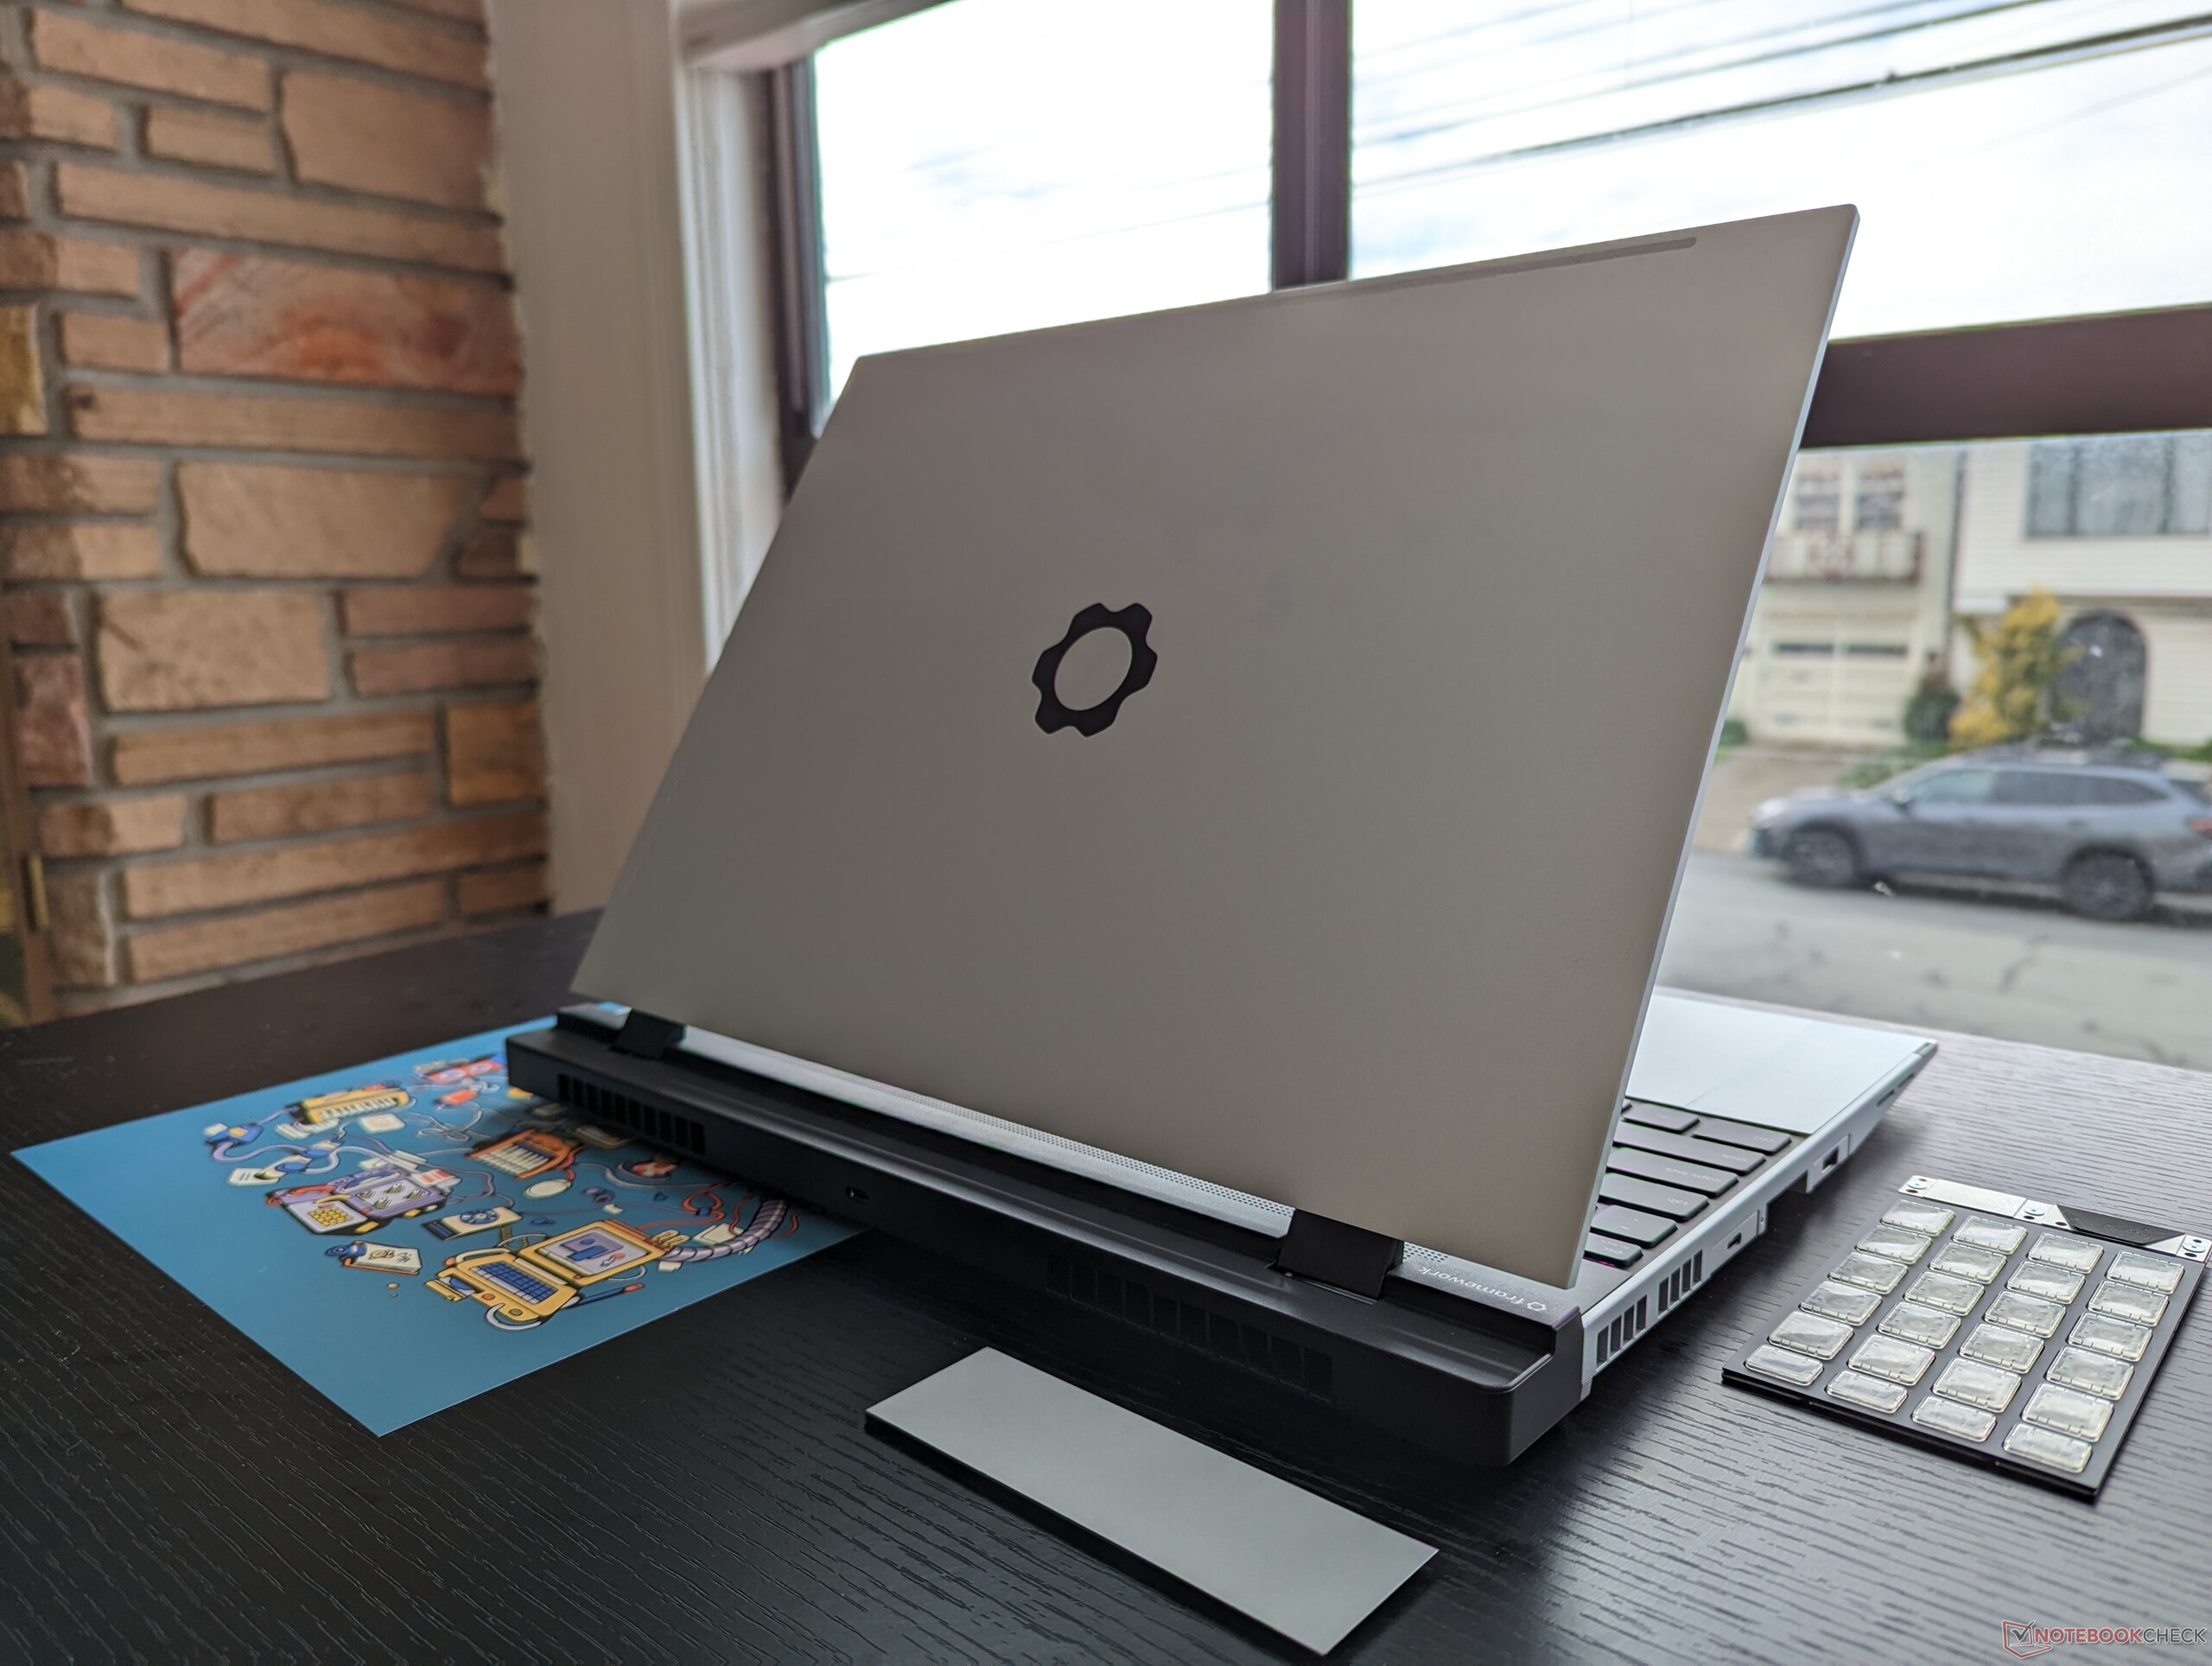
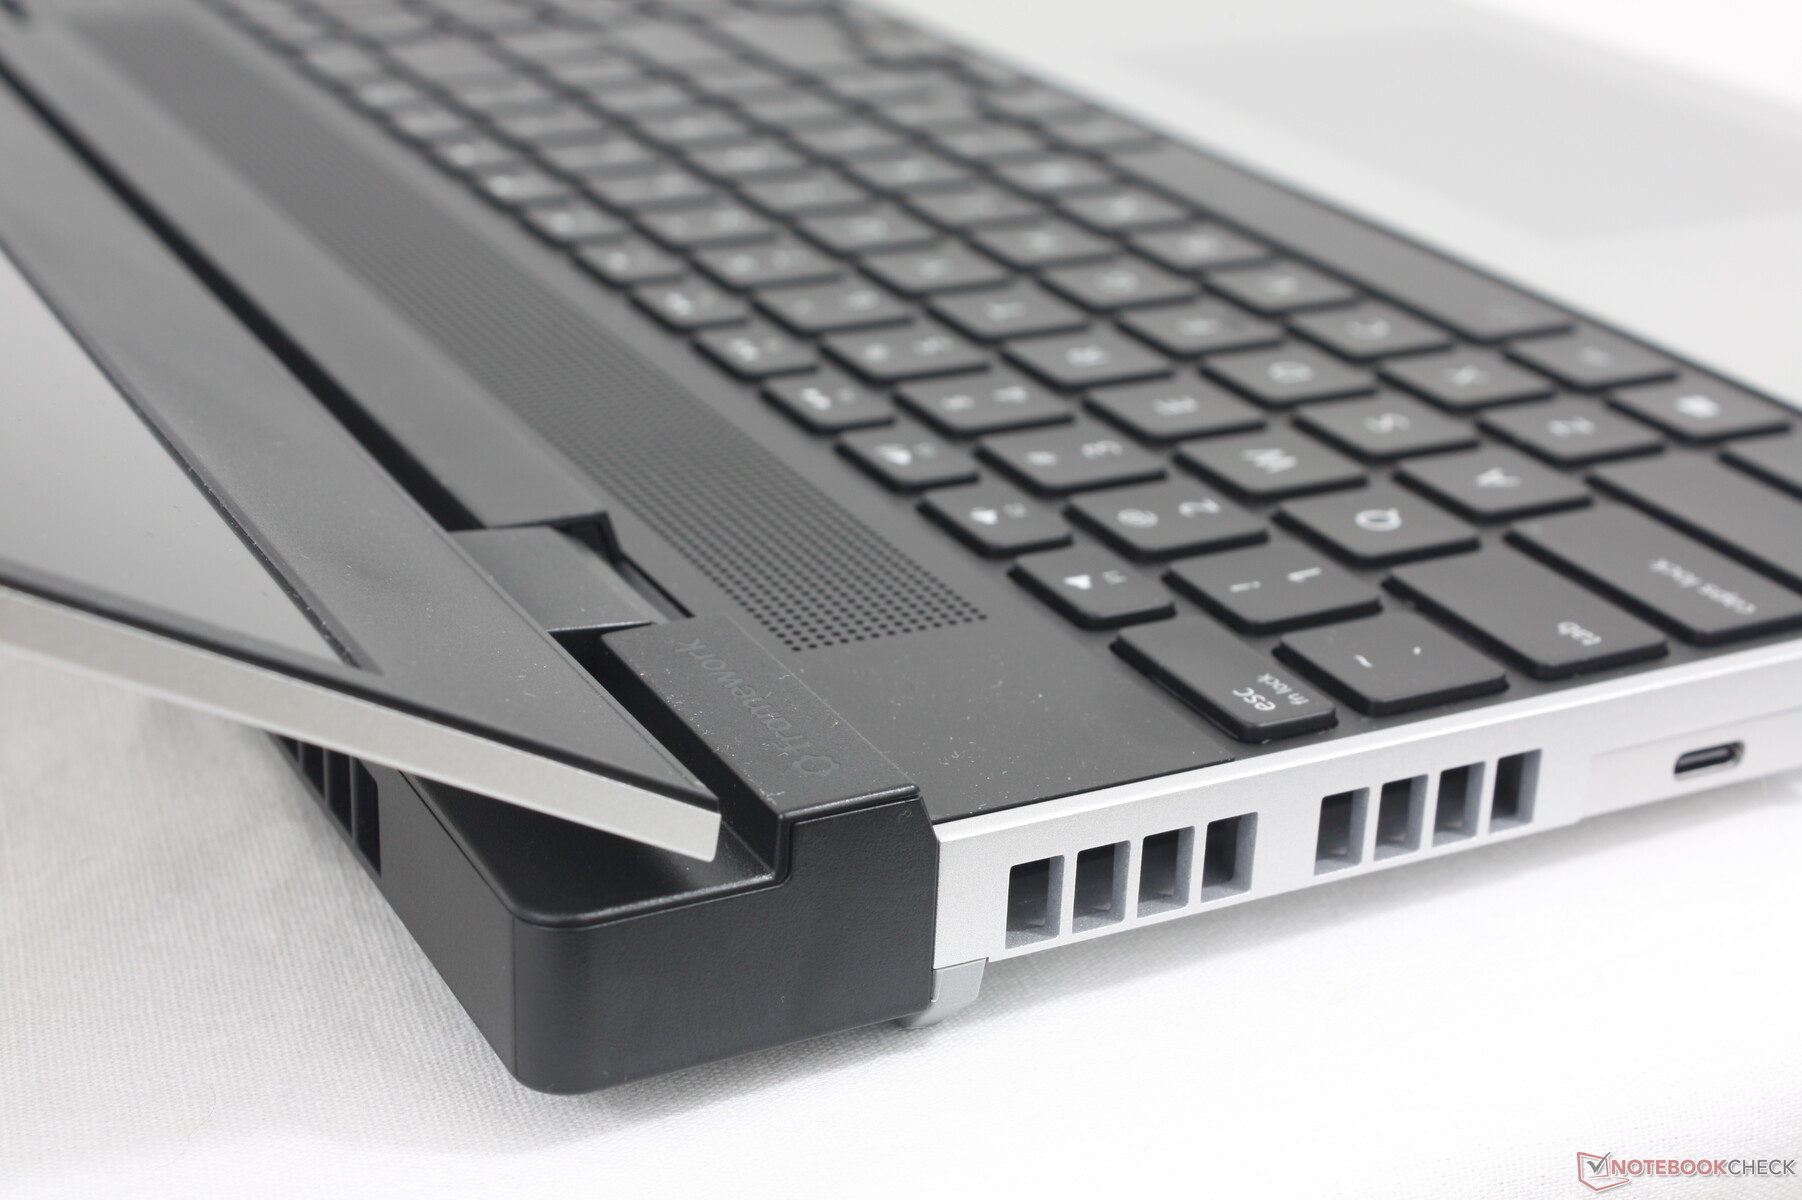
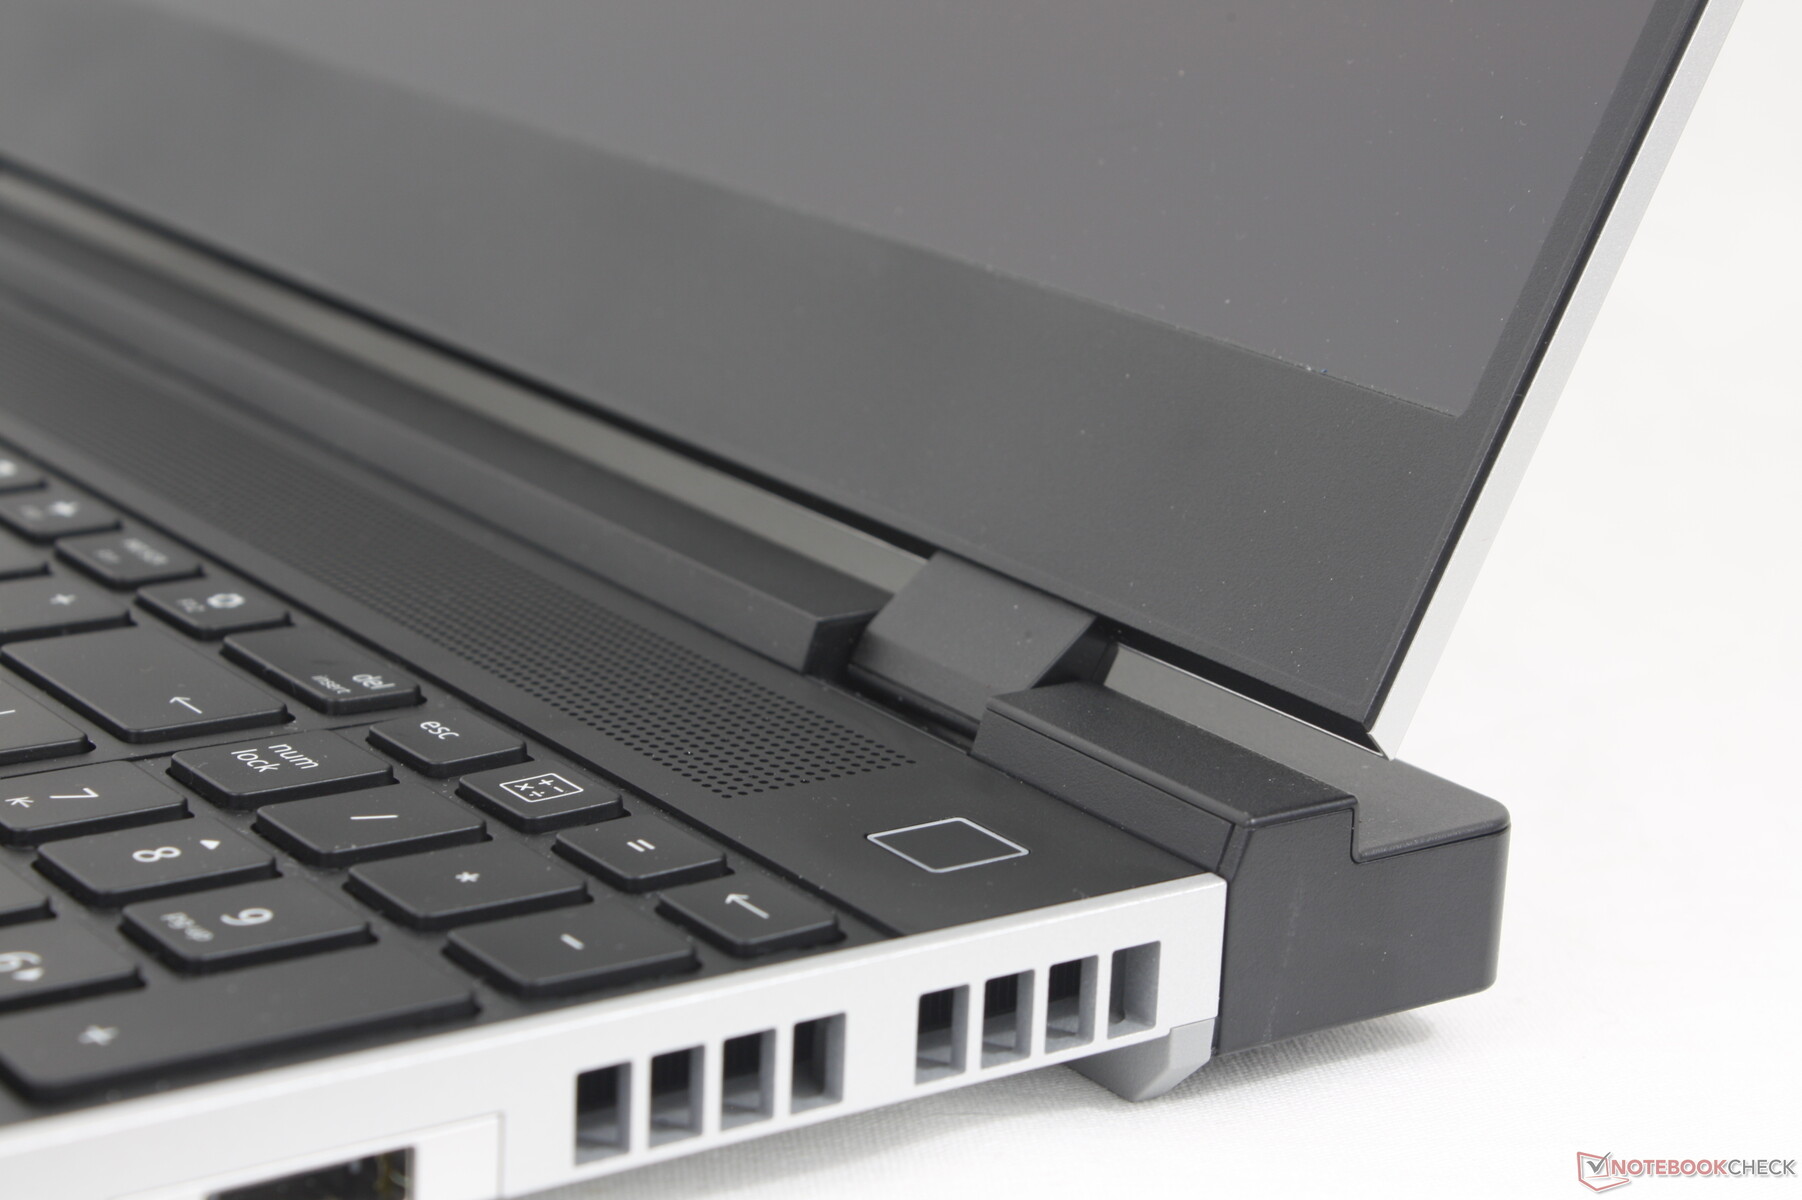
Case - Quando a forma encontra a função
O chassi é uma evolução do menor Laptop 13.5. Embora os materiais sejam praticamente os mesmos entre eles, o Laptop 16 parece mais espesso e mais rígido em torno da base para uma melhor primeira impressão, mesmo depois de considerar todas as novas peças removíveis. Tentar torcer a base ou deformar o teclado resultaria em quase nenhum rangido e apenas distorções mínimas, o que já é uma grande melhoria em relação ao Laptop 13.5 mais frágil.
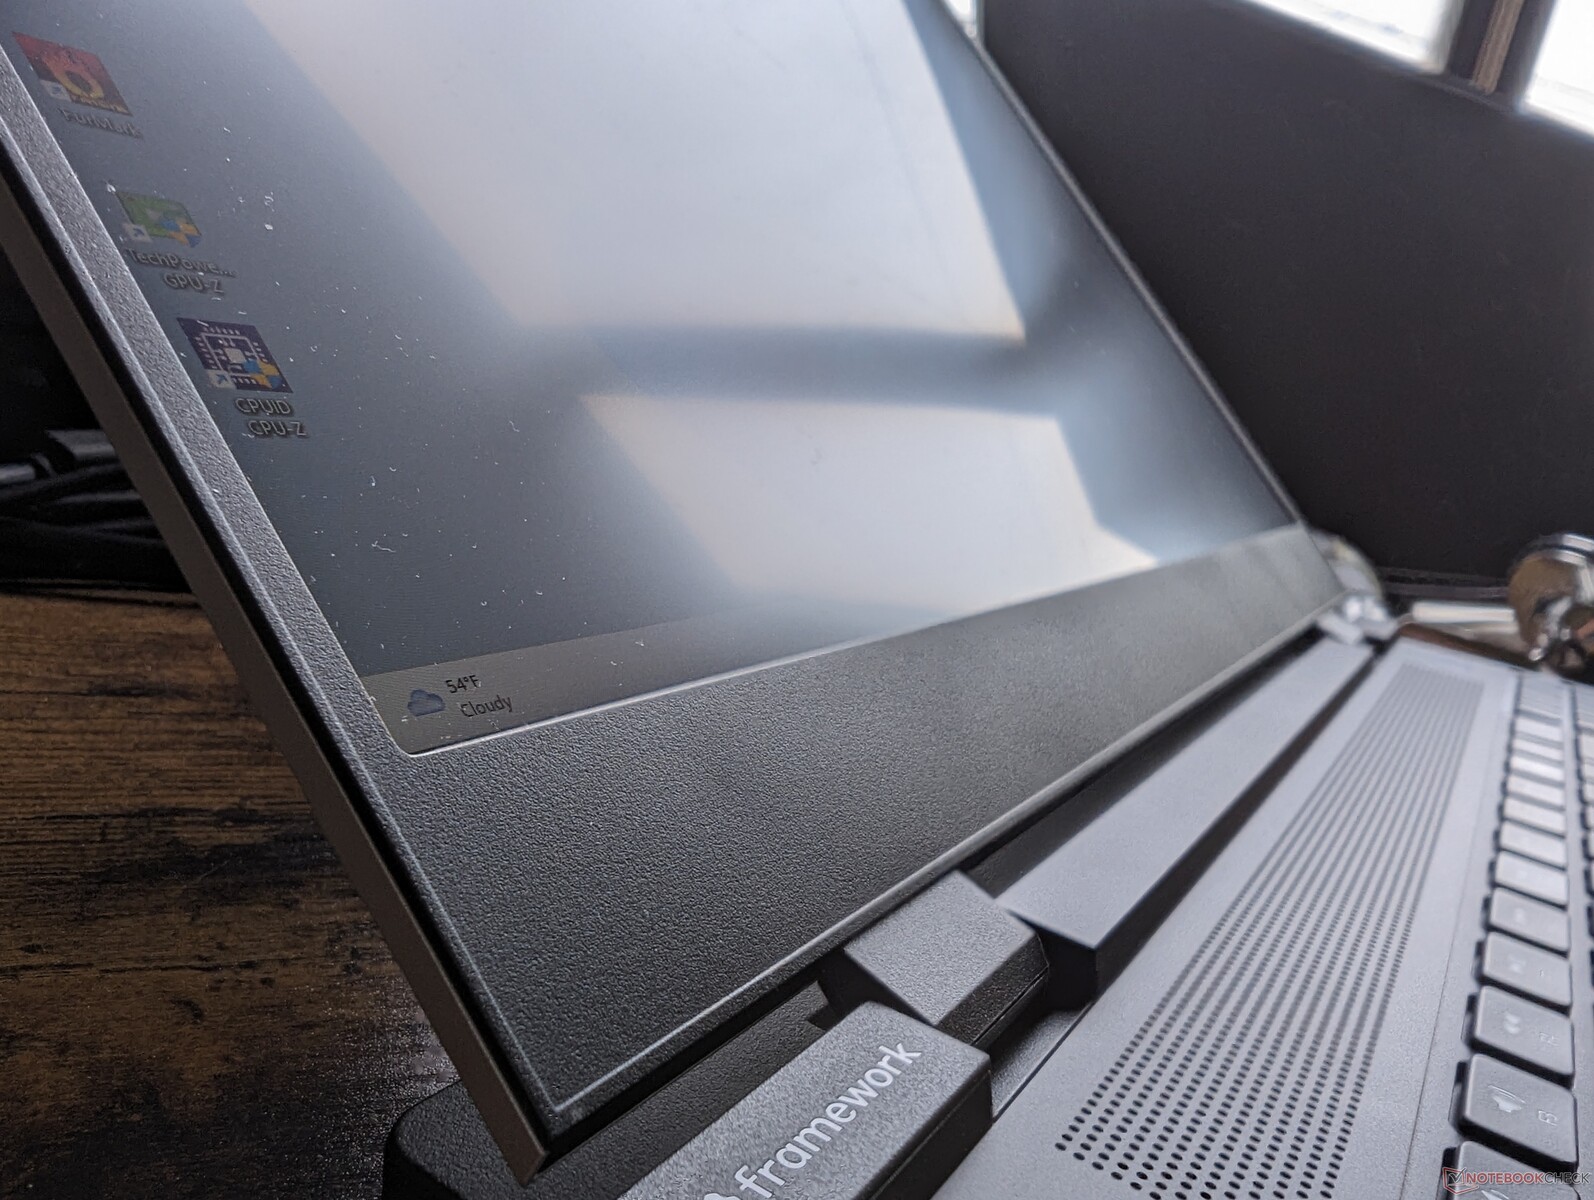
Infelizmente, um atributo não melhorou: a tampa. Assim como no Laptop 13.5, a tampa do Laptop 16 é mais suscetível a torções e deformações quando comparada a outras alternativas de 16 polegadas, como o HP Spectre x360 16 ou o Blade 16. As dobradiças podem ser decentes, mas a tampa parece ser o aspecto mais fraco do chassi mais uma vez.

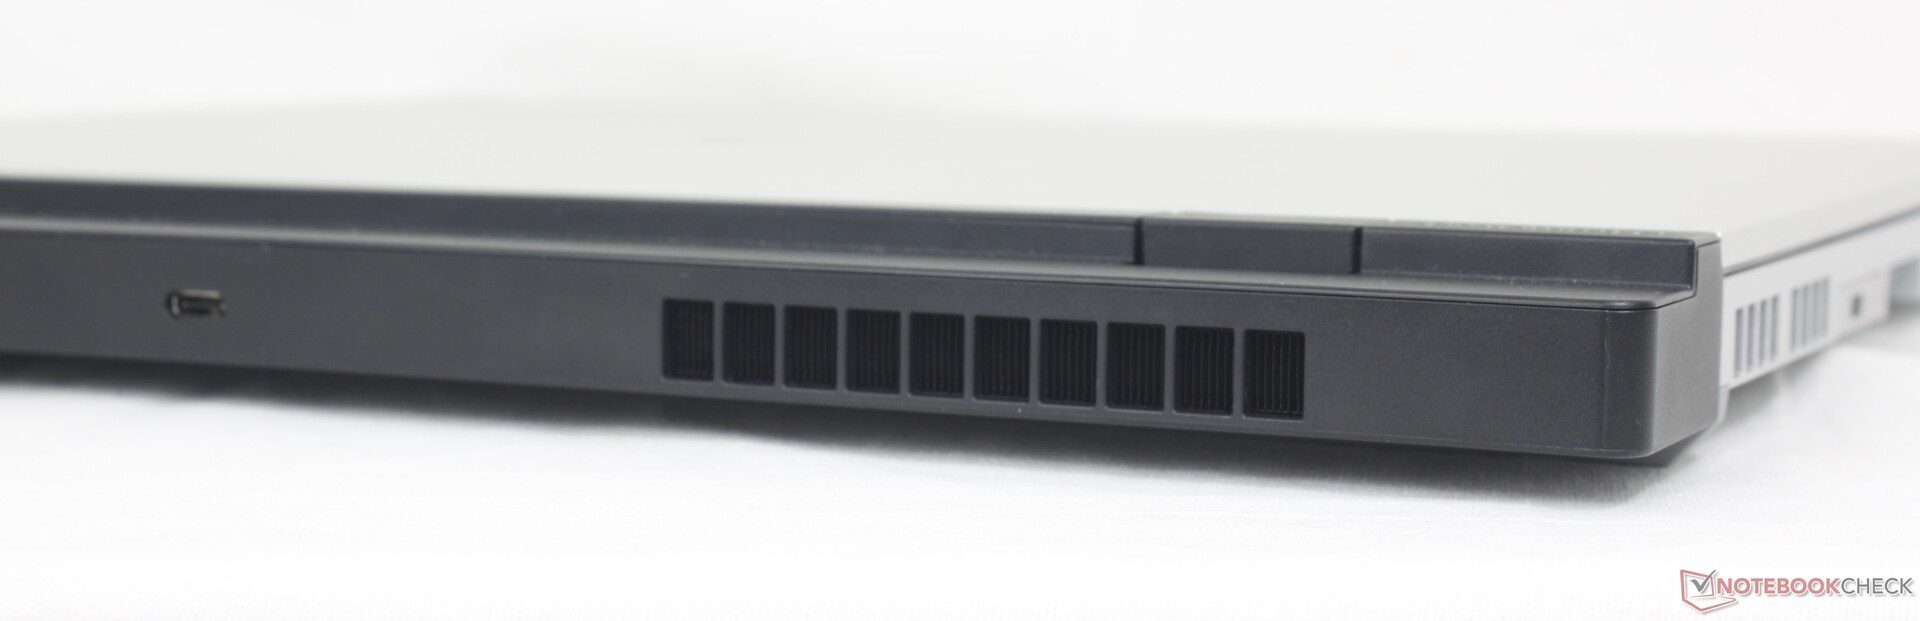
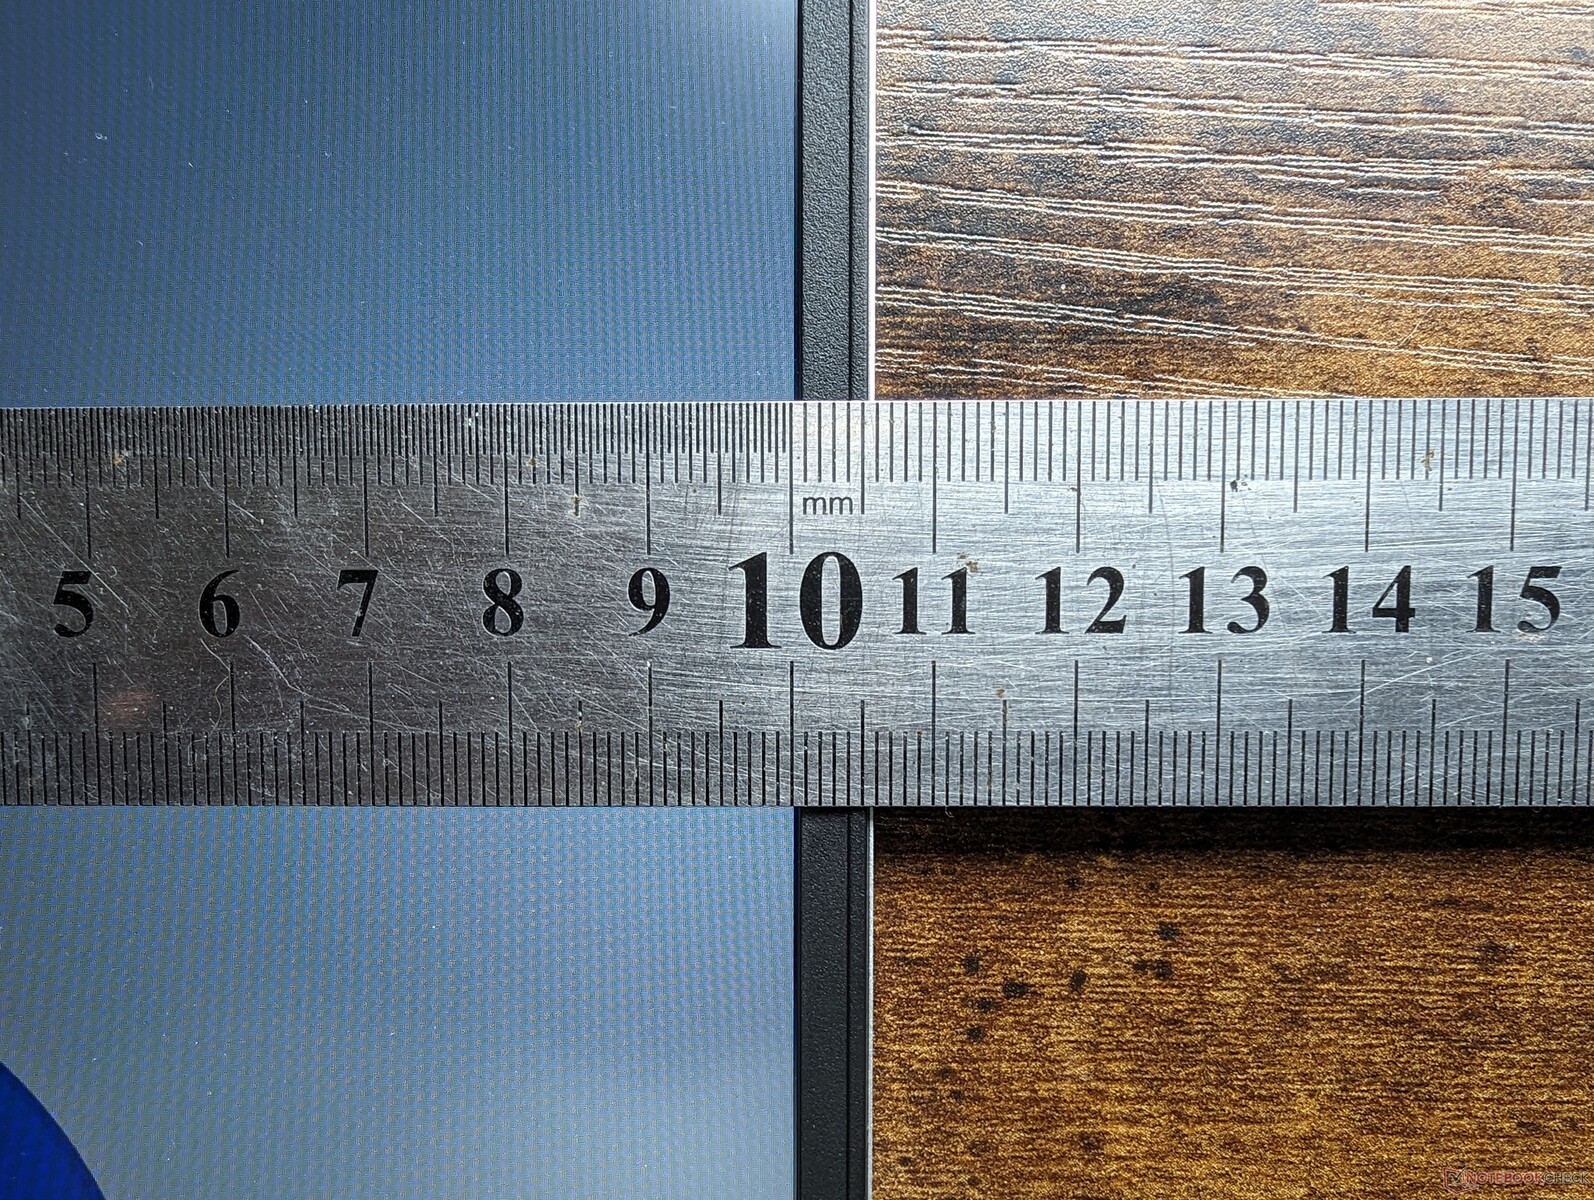
As dimensões e o peso são diferentes dependendo se o módulo dGPU estiver conectado ou se o módulo de cobertura padrão menor estiver conectado. De fato, o Laptop 16 torna-se visivelmente mais pesado e mais longo do que outros laptops multimídia de 16 polegadas quando o módulo dGPU está acoplado. Seu design já é bastante longo, com 270 mm, apenas com o módulo de cobertura padrão. Se a portabilidade for uma preocupação, o senhor certamente pode se sair melhor com laptops mais tradicionais da Apple ou com a Série LG Gram.
| Com módulo de cobertura da baia de expansão padrão | 356.58 x 270,0 x 17,95 mm | 2.1 kg |
| Com módulo de compartimento de gráficos discretos | 356.58 x 290,2 x 20,95 mm | 2.4 kg |
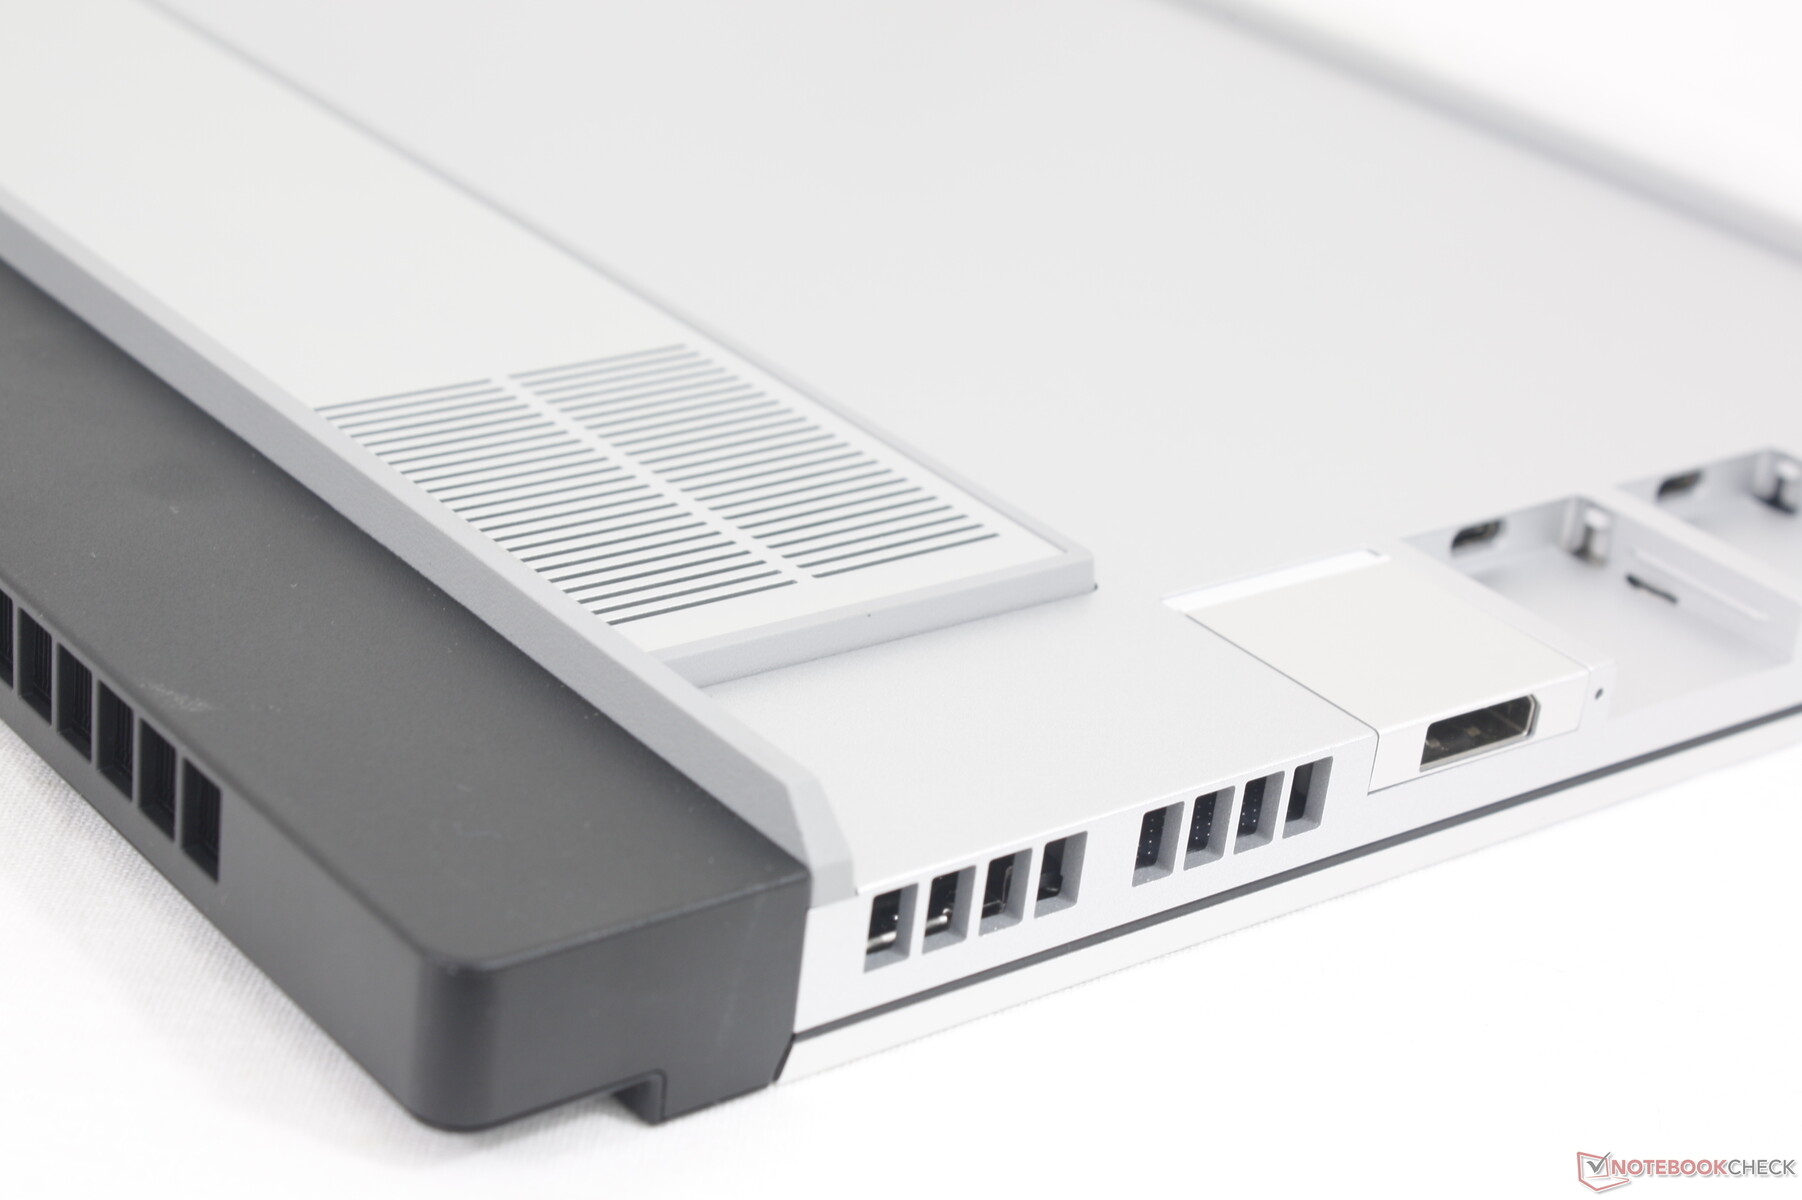
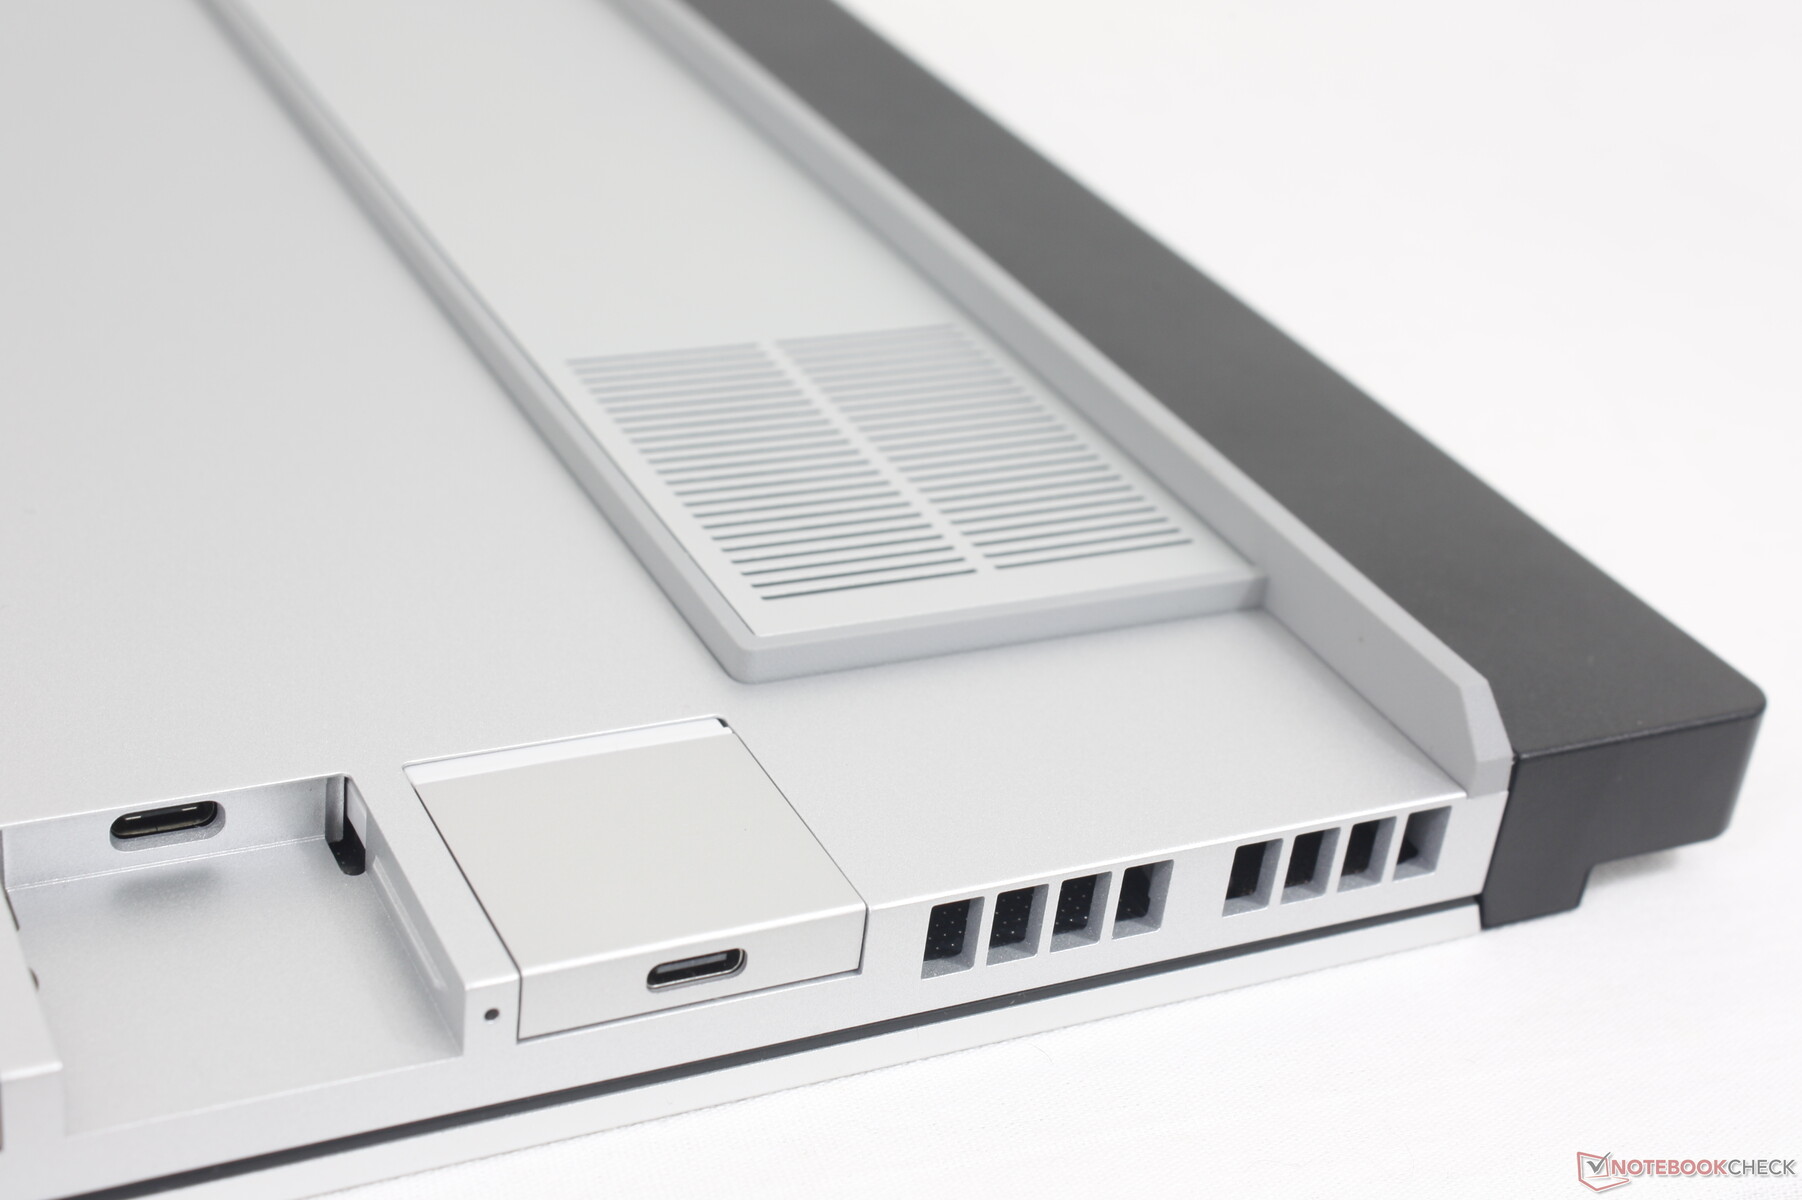
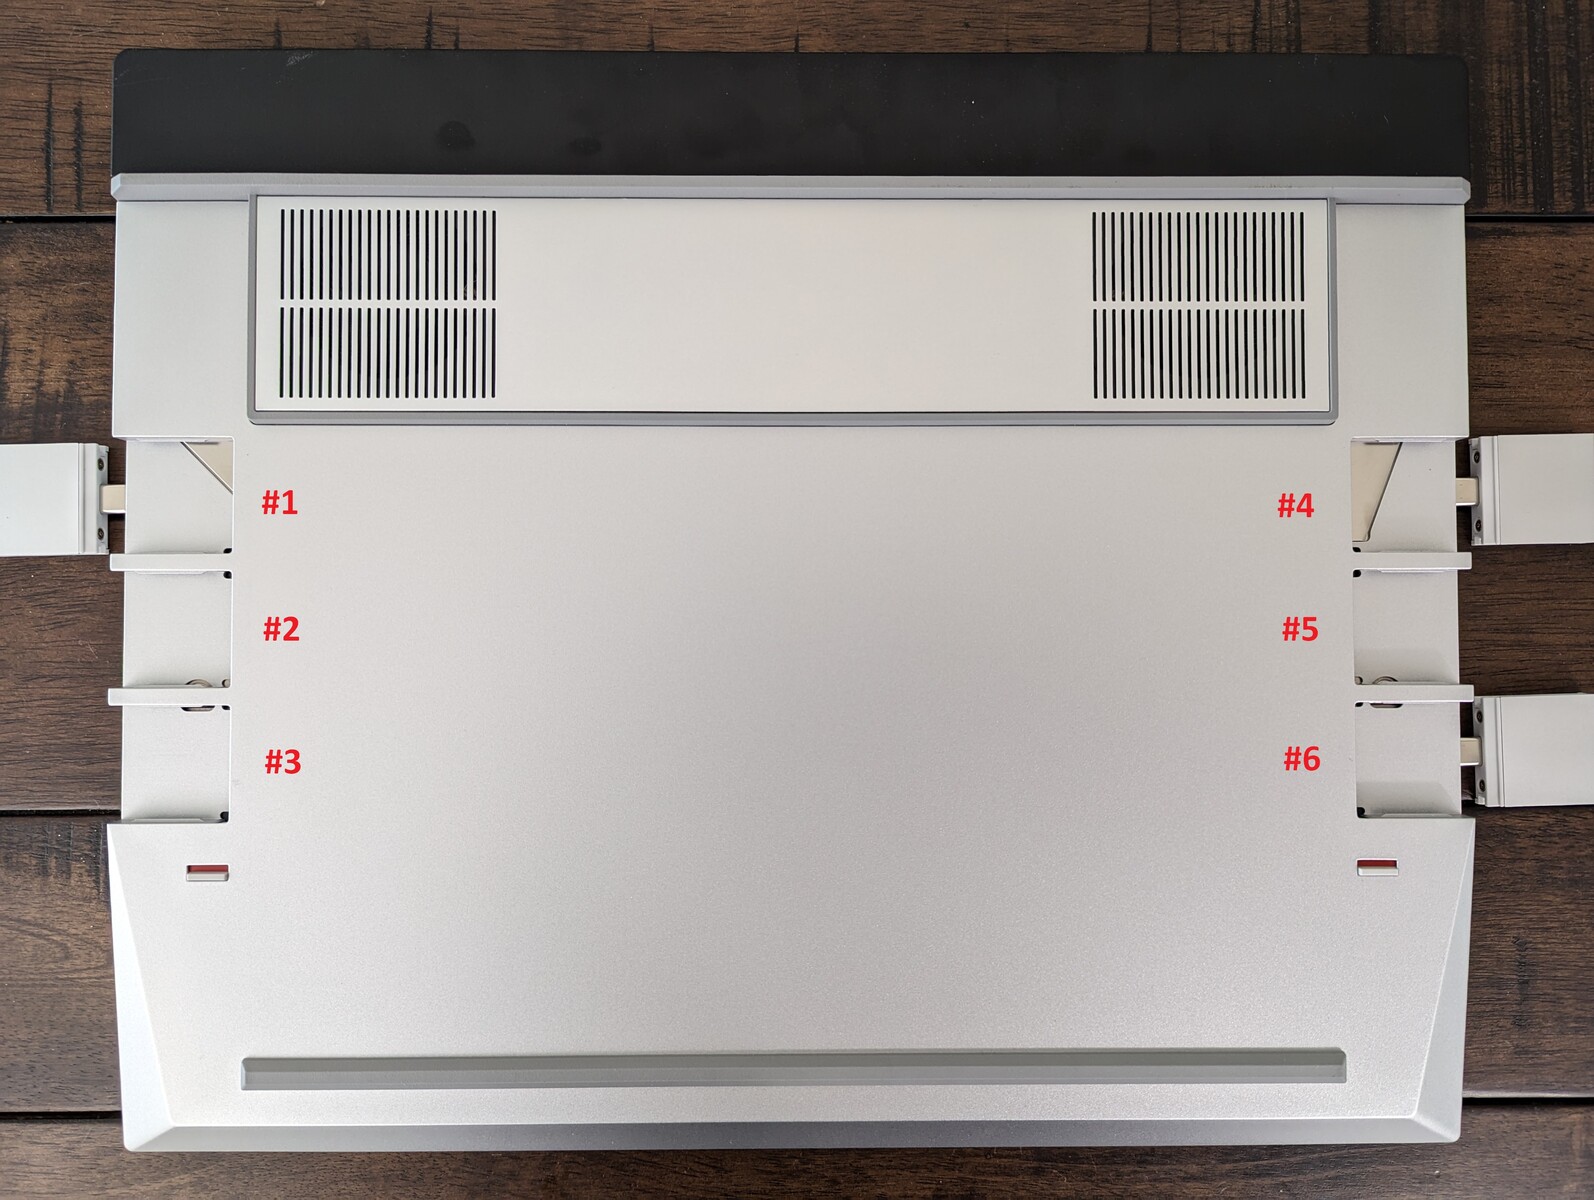
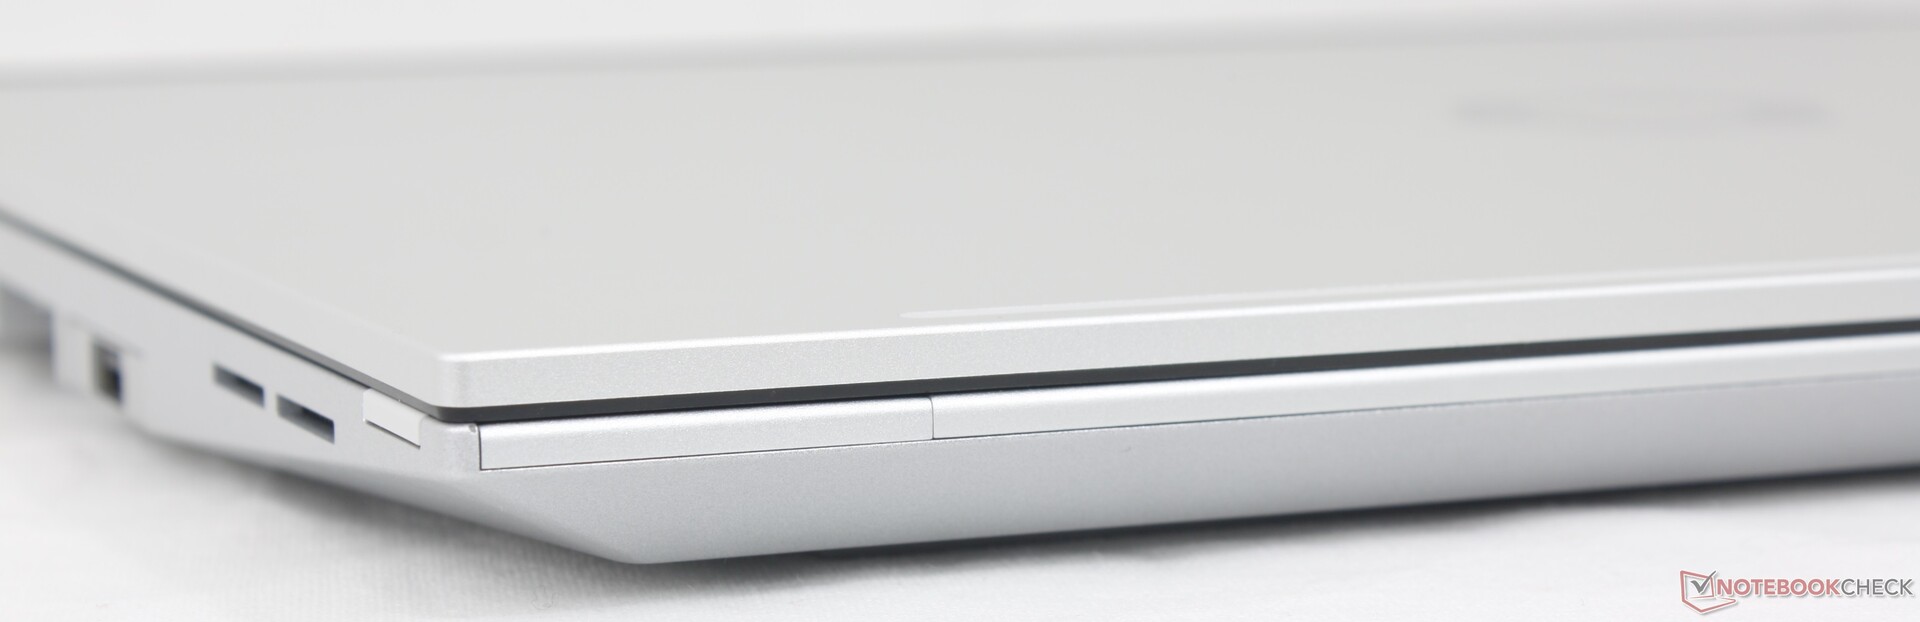
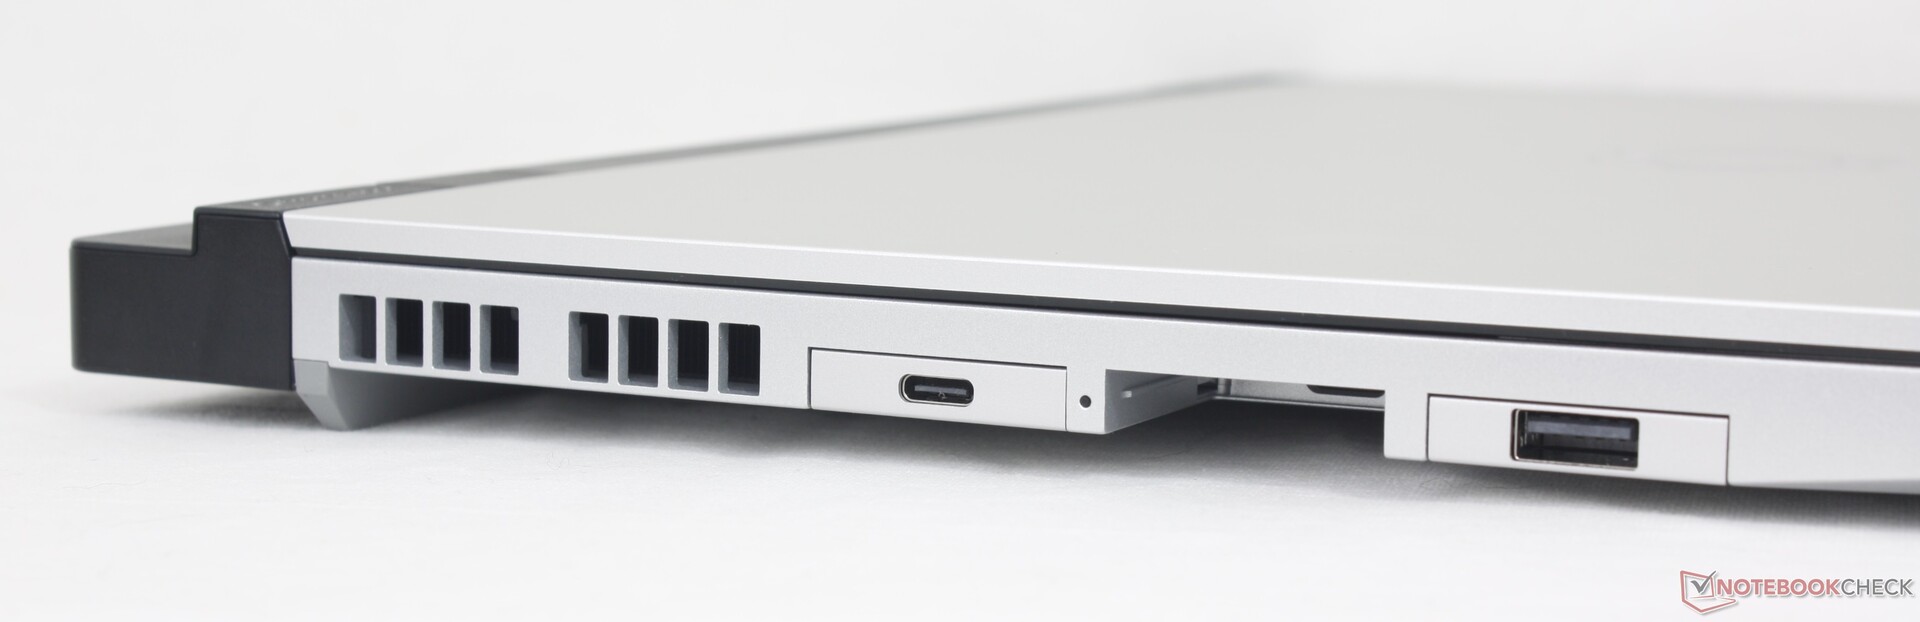
Conectividade - Seis portas personalizáveis
Esse é o único laptop na memória recente a integrar um total de seis portas USB-C e nada mais - nem mesmo um conector de áudio ou trava Kensington. Todas as seis portas são compatíveis com a linha existente de placas de expansão da Framework e, portanto, funcionam da mesma forma que no Laptop 13.5.
É importante observar que as seis portas USB-C não são criadas da mesma forma, conforme mostra a tabela abaixo. Apenas duas são USB4, três são compatíveis com DP e quatro são compatíveis com o adaptador CA USB-C. Não há indicadores visuais para diferenciar as portas.
| Slot # do cartão de expansão | Interface | Compatível com DisplayPort? | 240 W Compatível com carregamento USB-C? | USB-A Alto consumo de energia? |
| 1 | USB4 | Y | Y | Y |
| 2 | USB 3.2 | N | Y | N |
| 3 | USB 3.2 | N | N | N |
| 4 | USB4 | Y | Y | Y |
| 5 | USB 3.2 | Y | Y | N |
| 6 | USB 3.2 | N | N | N |
Além disso, ainda não há placas de expansão para leitores SD de tamanho normal, WAN ou RJ-45. Se essas portas forem importantes para o senhor, terá que procurar adaptadores USB ou estações de acoplamento.
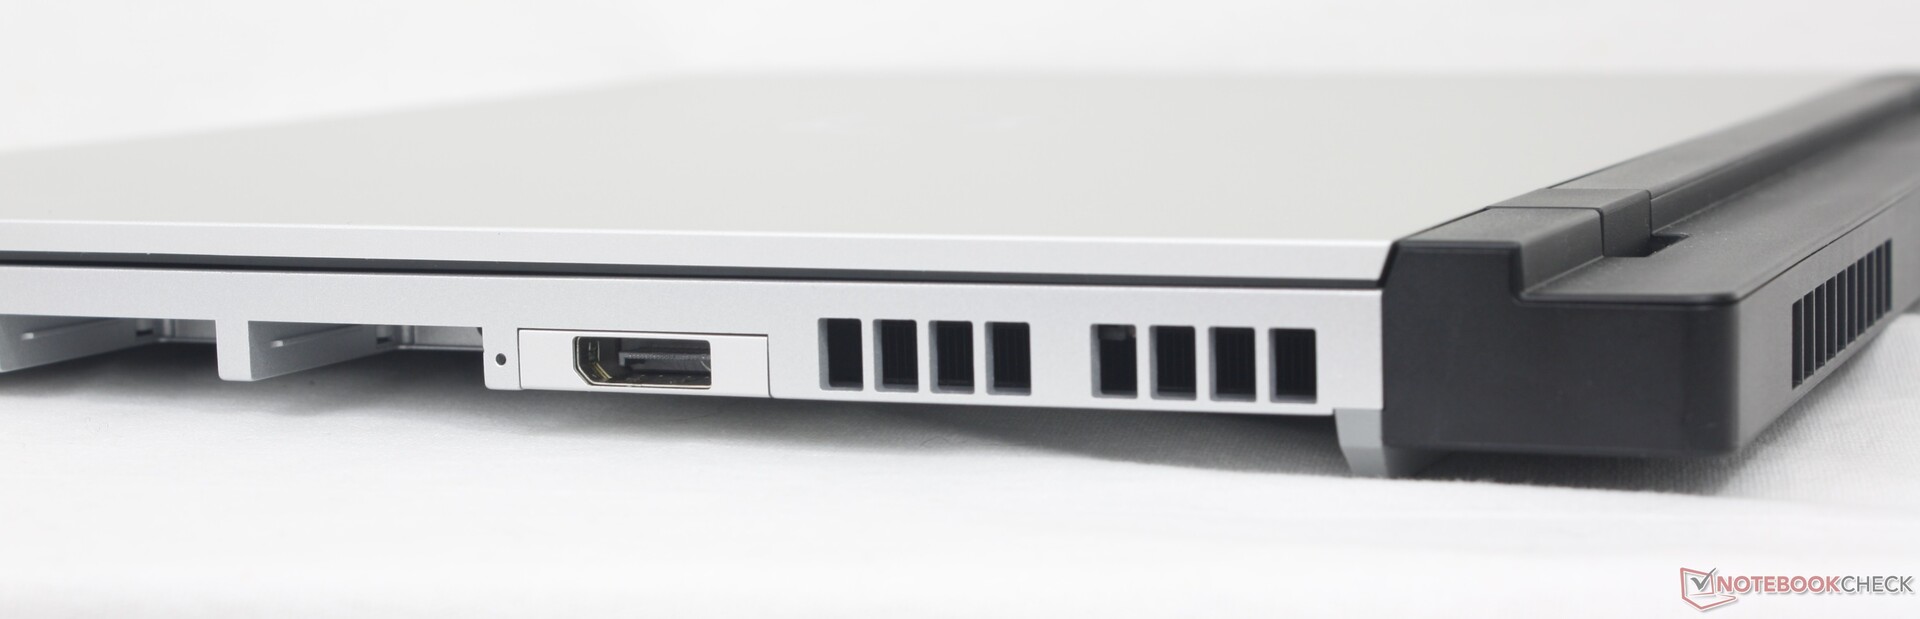
Uma sétima porta USB-C ao longo da borda traseira fica disponível se o módulo discreto da GPU estiver instalado. Essa porta é compatível com o DP, mas não com o adaptador CA.
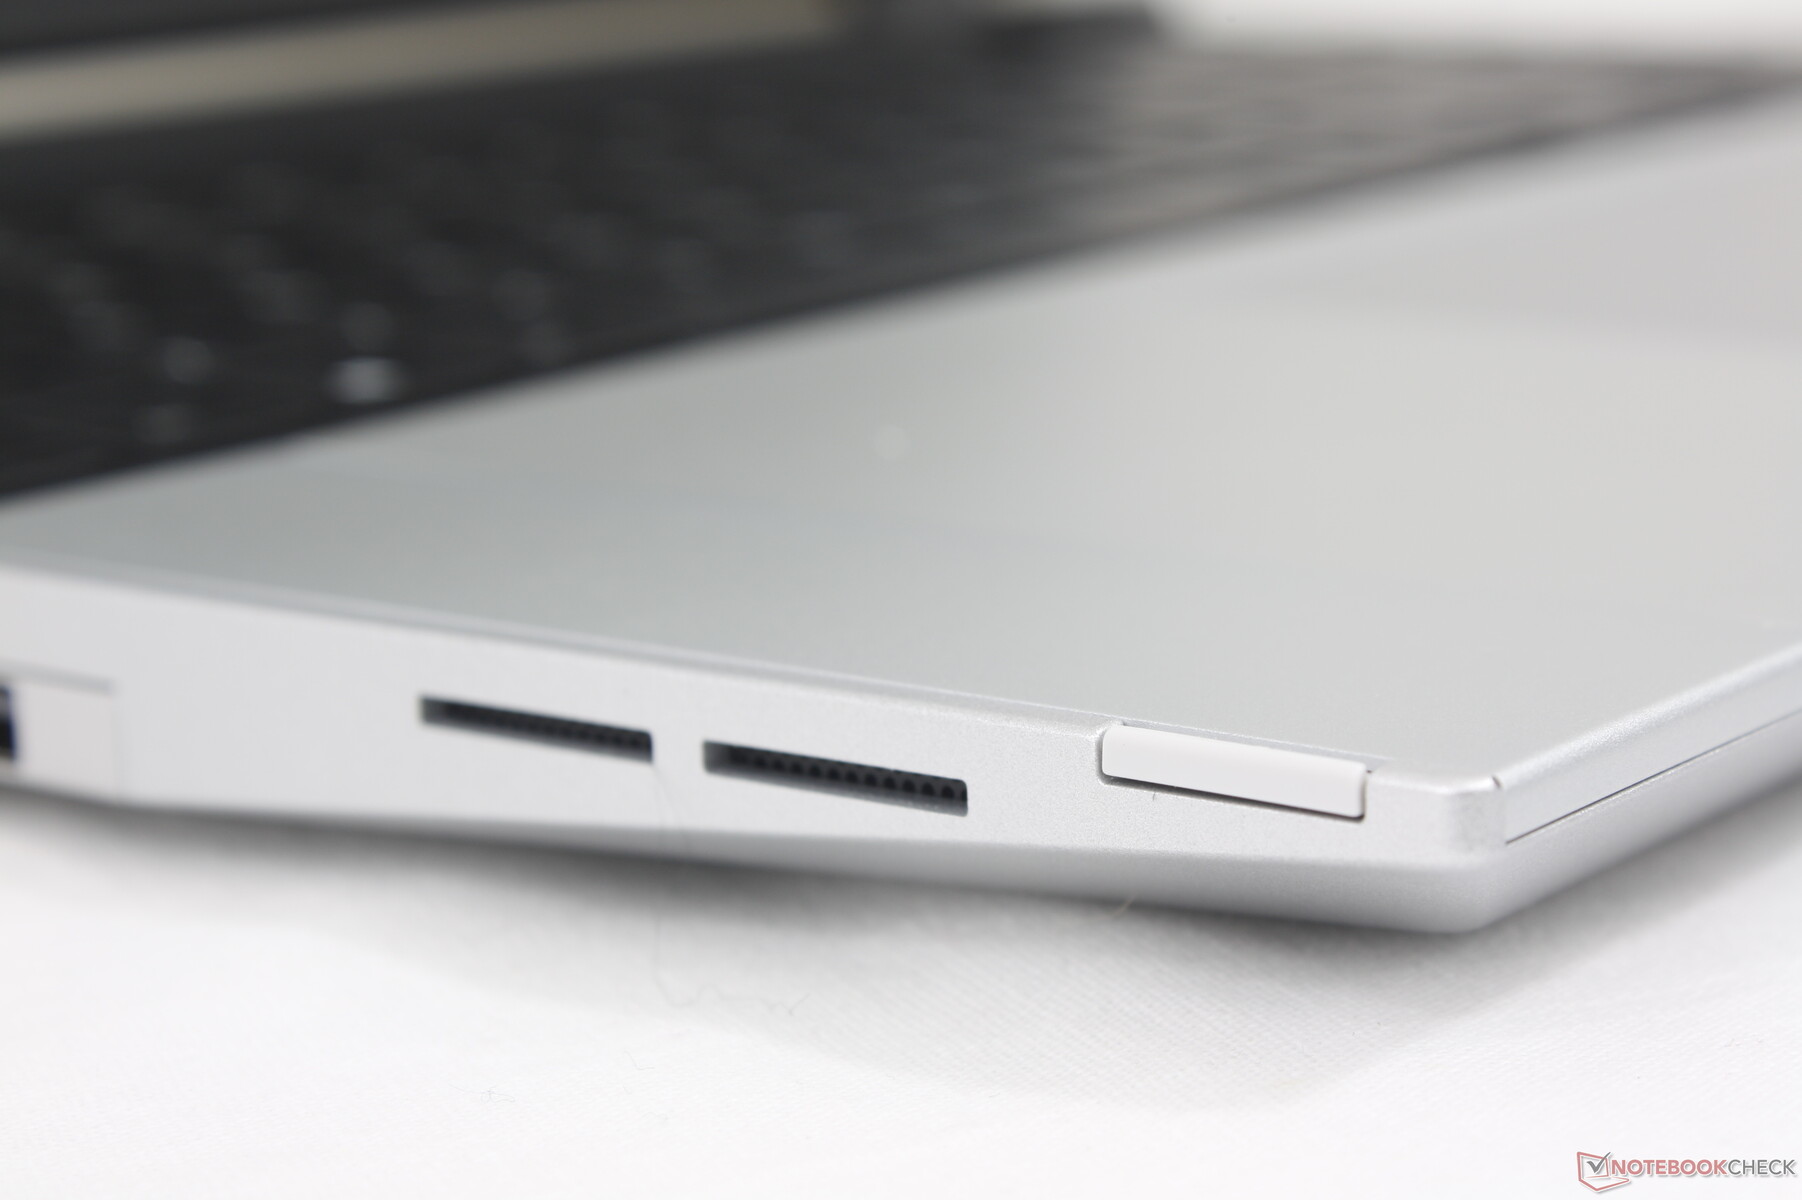
Leitor de cartão SD
O Laptop 16 utiliza o mesmo leitor de cartão de expansão MicroSD encontrado no Laptop 13.5 para taxas de leitura e gravação semelhantes. Com apenas cerca de 80 MB/s, o desempenho é muito mais lento do que o dos leitores de cartão dos modelos concorrentes, como o ThinkPad Z16 Gen 2 ou o MacBook Pro 16.
Não temos acesso ao cartão de expansão do leitor de cartão SD do Laptop 16 e, portanto, nossos dados para o Laptop 13.5 são fornecidos abaixo em seu lugar.
| SD Card Reader | |
| average JPG Copy Test (av. of 3 runs) | |
| MSI Prestige 16 B1MG-001US (Toshiba Exceria Pro SDXC 64 GB UHS-II) | |
| Apple MacBook Pro 16 2023 M3 Max (Angelbird AV Pro V60) | |
| Lenovo ThinkPad Z16 Gen 2 (Toshiba Exceria Pro SDXC 64 GB UHS-II) | |
| HP Spectre x360 2-in-1 16-f1075ng | |
| Framework Laptop 13.5 (AV Pro UHS-II V60) | |
| Dell Inspiron 16 Plus 7630 (AV Pro SD microSD 128 GB V60) | |
| maximum AS SSD Seq Read Test (1GB) | |
| Lenovo ThinkPad Z16 Gen 2 (Toshiba Exceria Pro SDXC 64 GB UHS-II) | |
| Apple MacBook Pro 16 2023 M3 Max (Angelbird AV Pro V60) | |
| MSI Prestige 16 B1MG-001US (Toshiba Exceria Pro SDXC 64 GB UHS-II) | |
| HP Spectre x360 2-in-1 16-f1075ng | |
| Framework Laptop 13.5 (AV Pro UHS-II V60) | |
| Dell Inspiron 16 Plus 7630 (AV Pro SD microSD 128 GB V60) | |
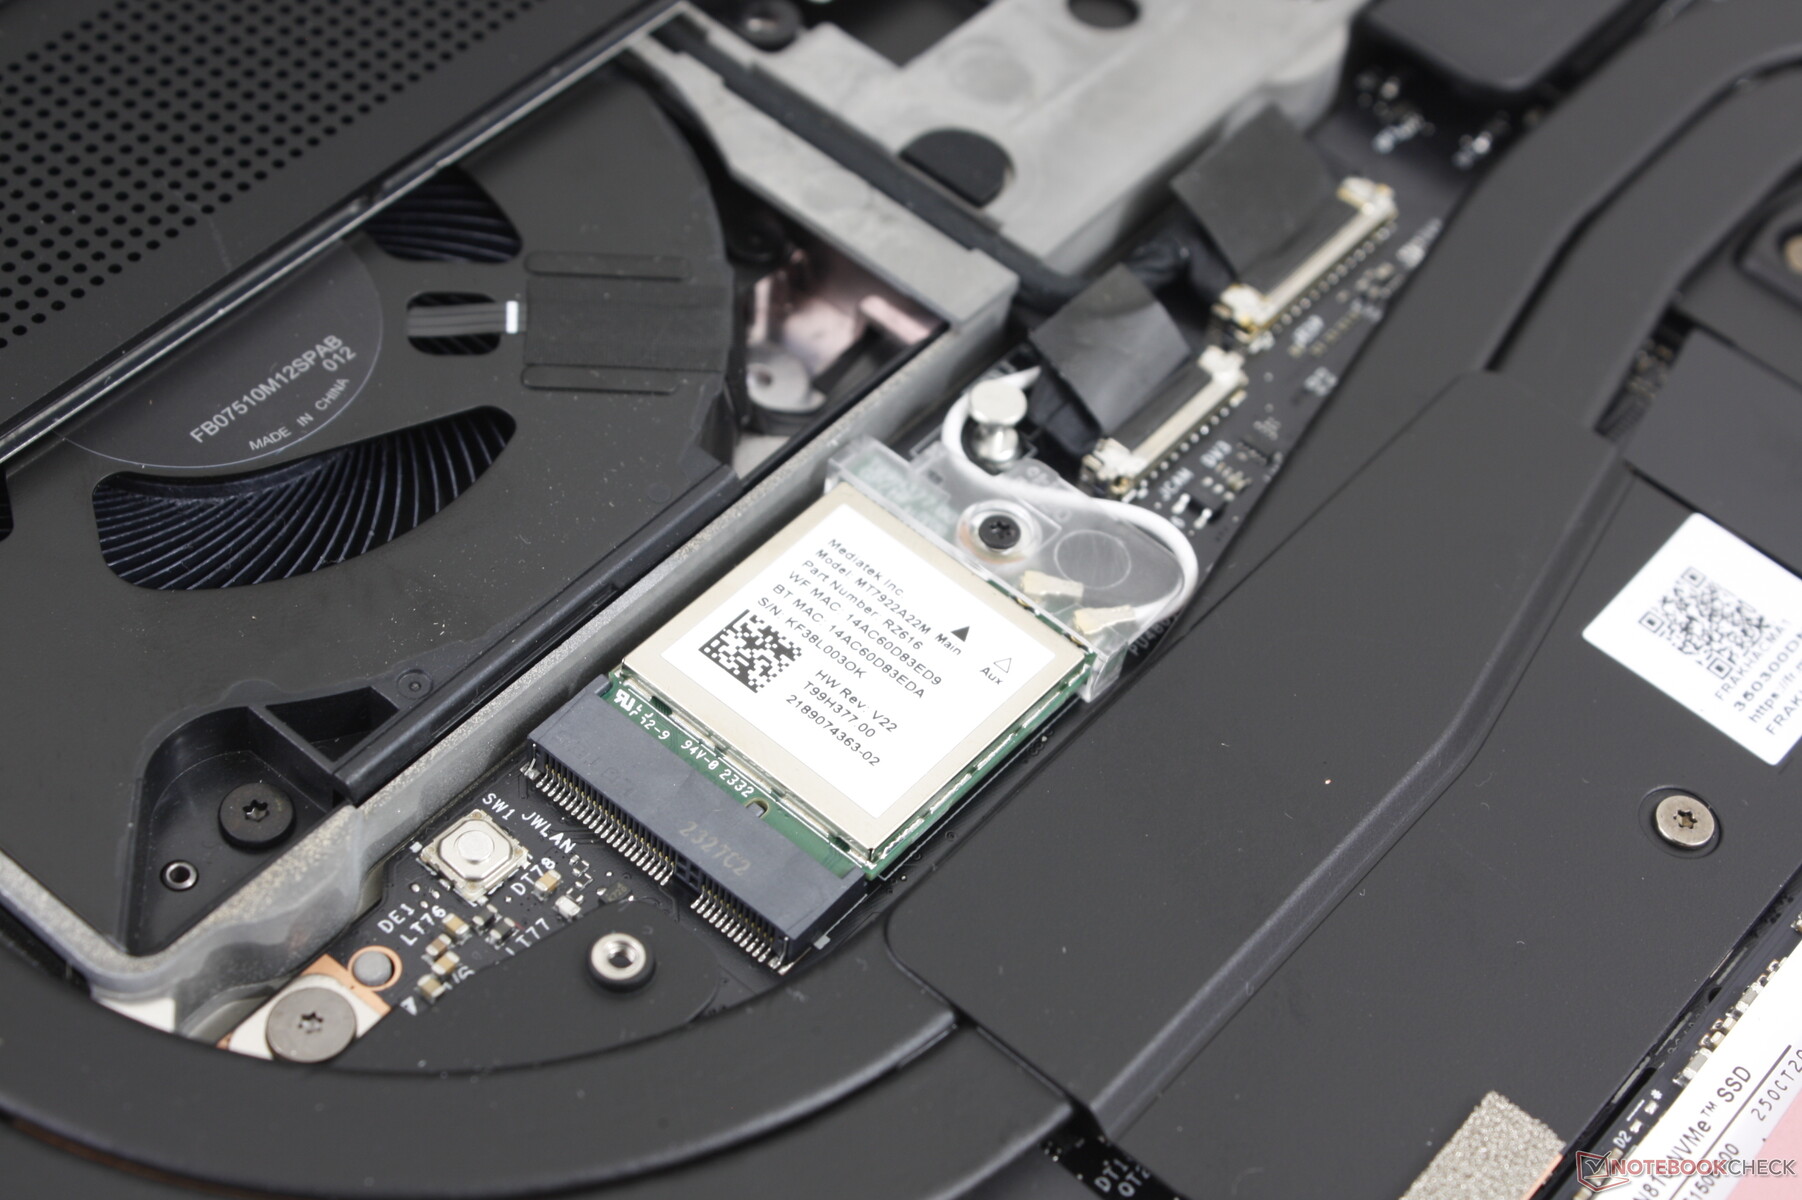
Comunicação
O Wi-Fi 6 e 6E são fornecidos por um MediaTek MT7922 em vez do habitual AX211, mantendo o design sem Intel do modelo. Tivemos conexões estáveis e confiáveis quando emparelhado com nosso roteador de teste Asus AXE11000.
Infelizmente, não há suporte para WAN.
Webcam
Uma webcam de 2 MP com infravermelho e obturador manual é padrão, enquanto concorrentes como o HP Spectre ou a série Elite já vêm com webcams de 5 MP ou mais há mais de um ano. Esperamos que a Framework possa oferecer opções de webcam melhores no futuro.


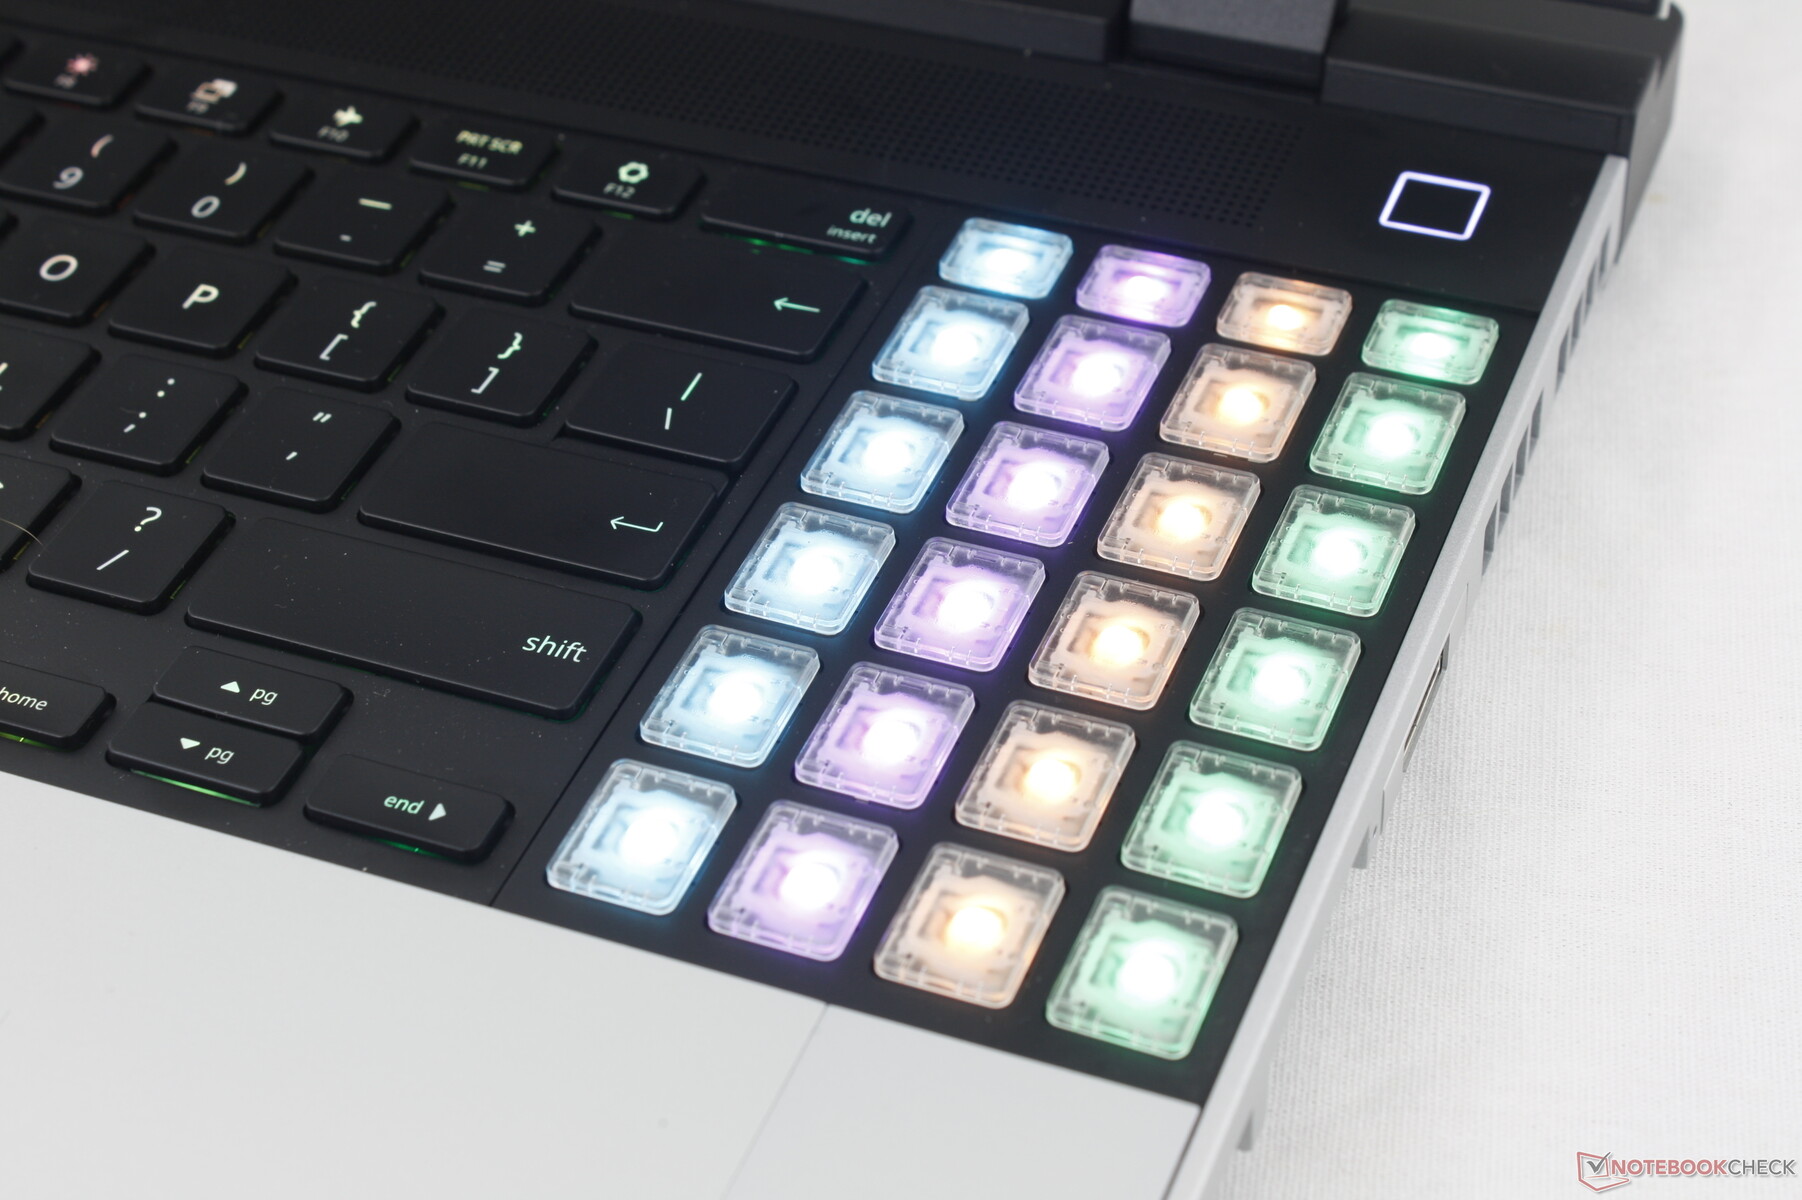
Acessórios - Mais opções do que o cinto de utilidades do Batman
Ao contrário de um laptop comum, o Laptop 16 é, sem dúvida, definido por seus acessórios. Os mais notáveis incluem o módulo gráfico discreto traseiro removível, os módulos LED Matrix e o módulo RGB Macropad. No momento, há apenas uma dGPU para escolher, mas é provável que mais opções sejam disponibilizadas no futuro.
O RGB Macropad é uma opção secundária ao teclado numérico padrão. Suas entradas são exatamente as mesmas de um teclado numérico comum, mas as teclas são visualmente diferentes, pois são transparentes e têm luz de fundo RGB, enquanto o teclado numérico padrão é impresso e tem apenas uma luz de fundo branca. As teclas claras e coloridas do Macropad podem agradar aos usuários mais exigentes ou aos jogadores que gostam de personalizar as entradas das teclas.
Quanto aos módulos LED Matrix, eles substituem os espaçadores regulares e consistem em vários LEDs em uma grade semelhante a pixels que pode ser programada para mostrar os níveis de duração da bateria, textos de rolagem, notificações ou um relógio. Os módulos LED Matrix não nos foram enviados para análise e, portanto, não os testamos pessoalmente.
Os usuários que não desejarem os módulos dGPU ou LED Matrix podem instalar tampas de placa padrão em seus respectivos lugares. Essas tampas são fornecidas com todas as configurações do Laptop 16.
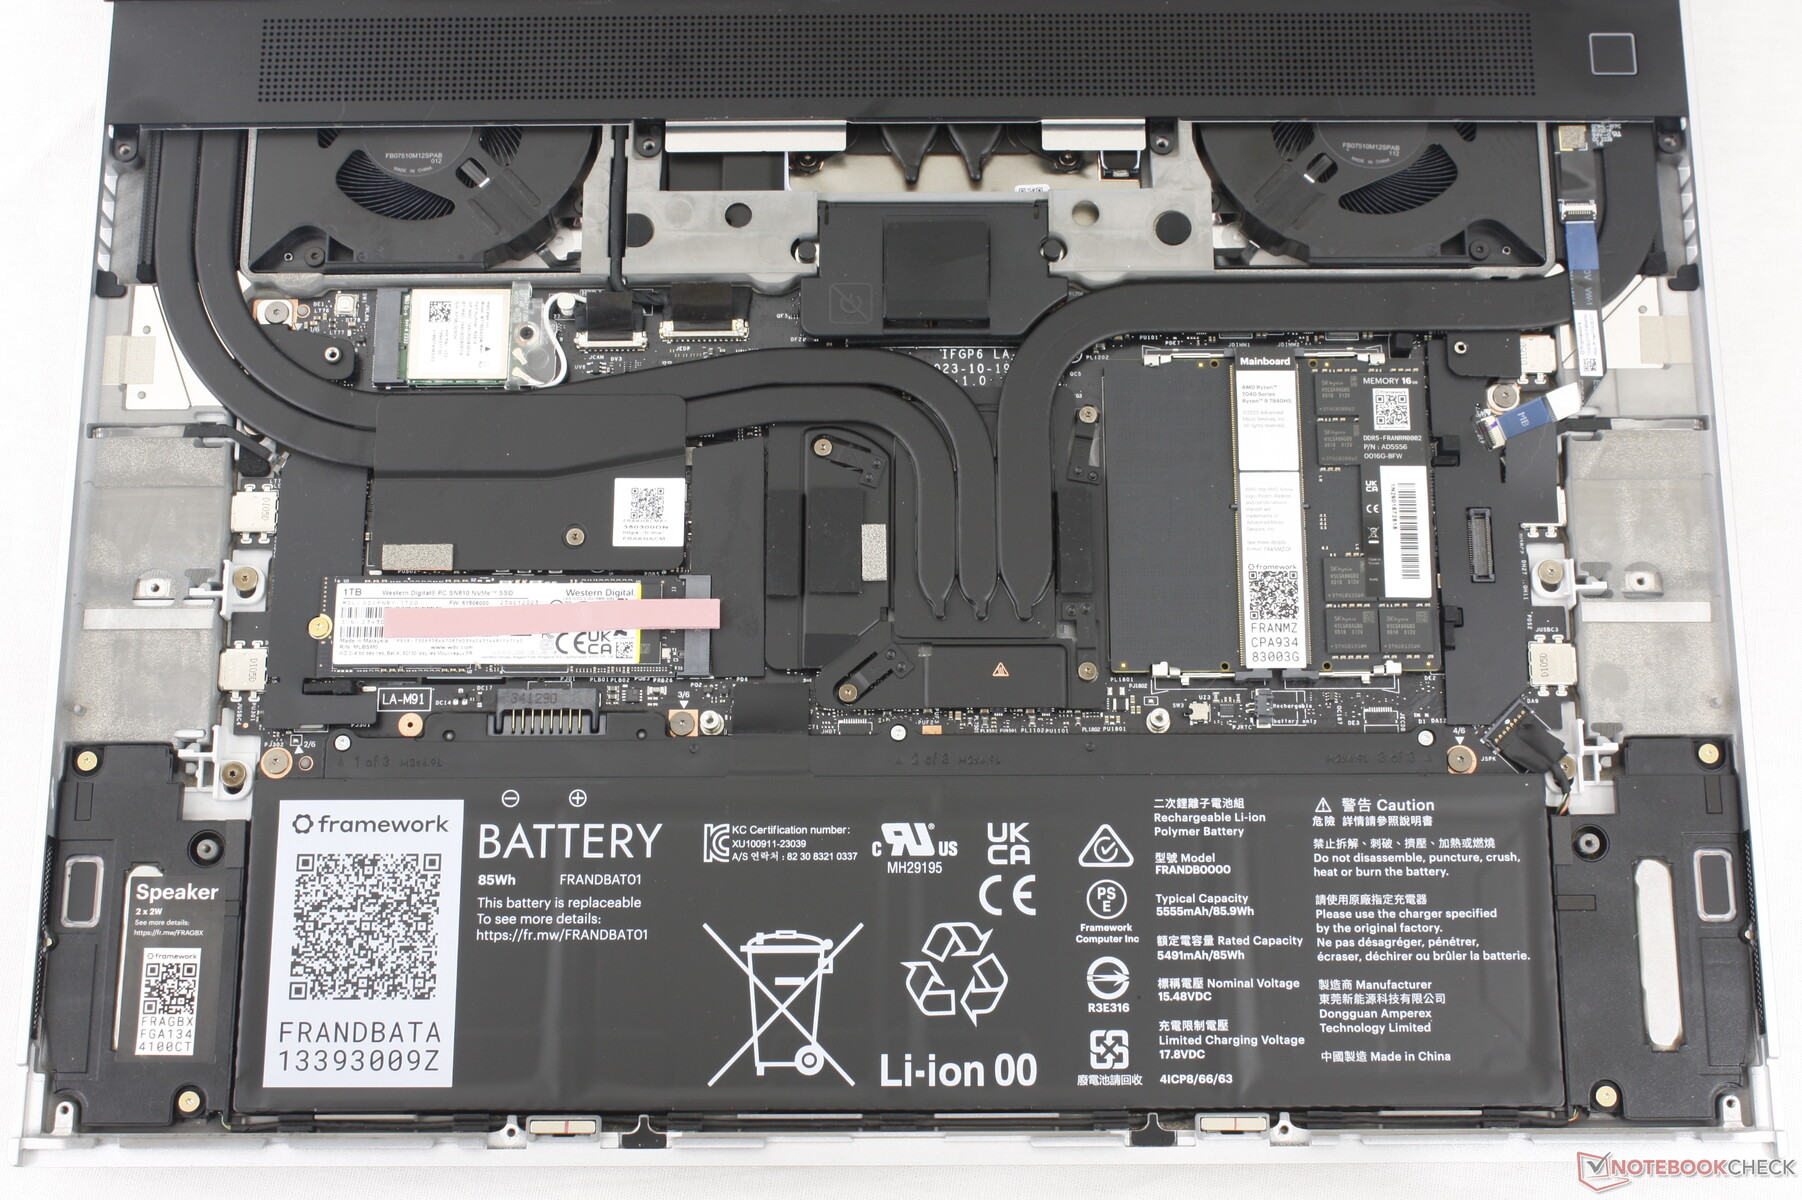
Além dos acessórios, a maioria das peças internas é substituível e pode ser adquirida individualmente do fabricante, inclusive a placa-mãe, como no Framework 13.5.
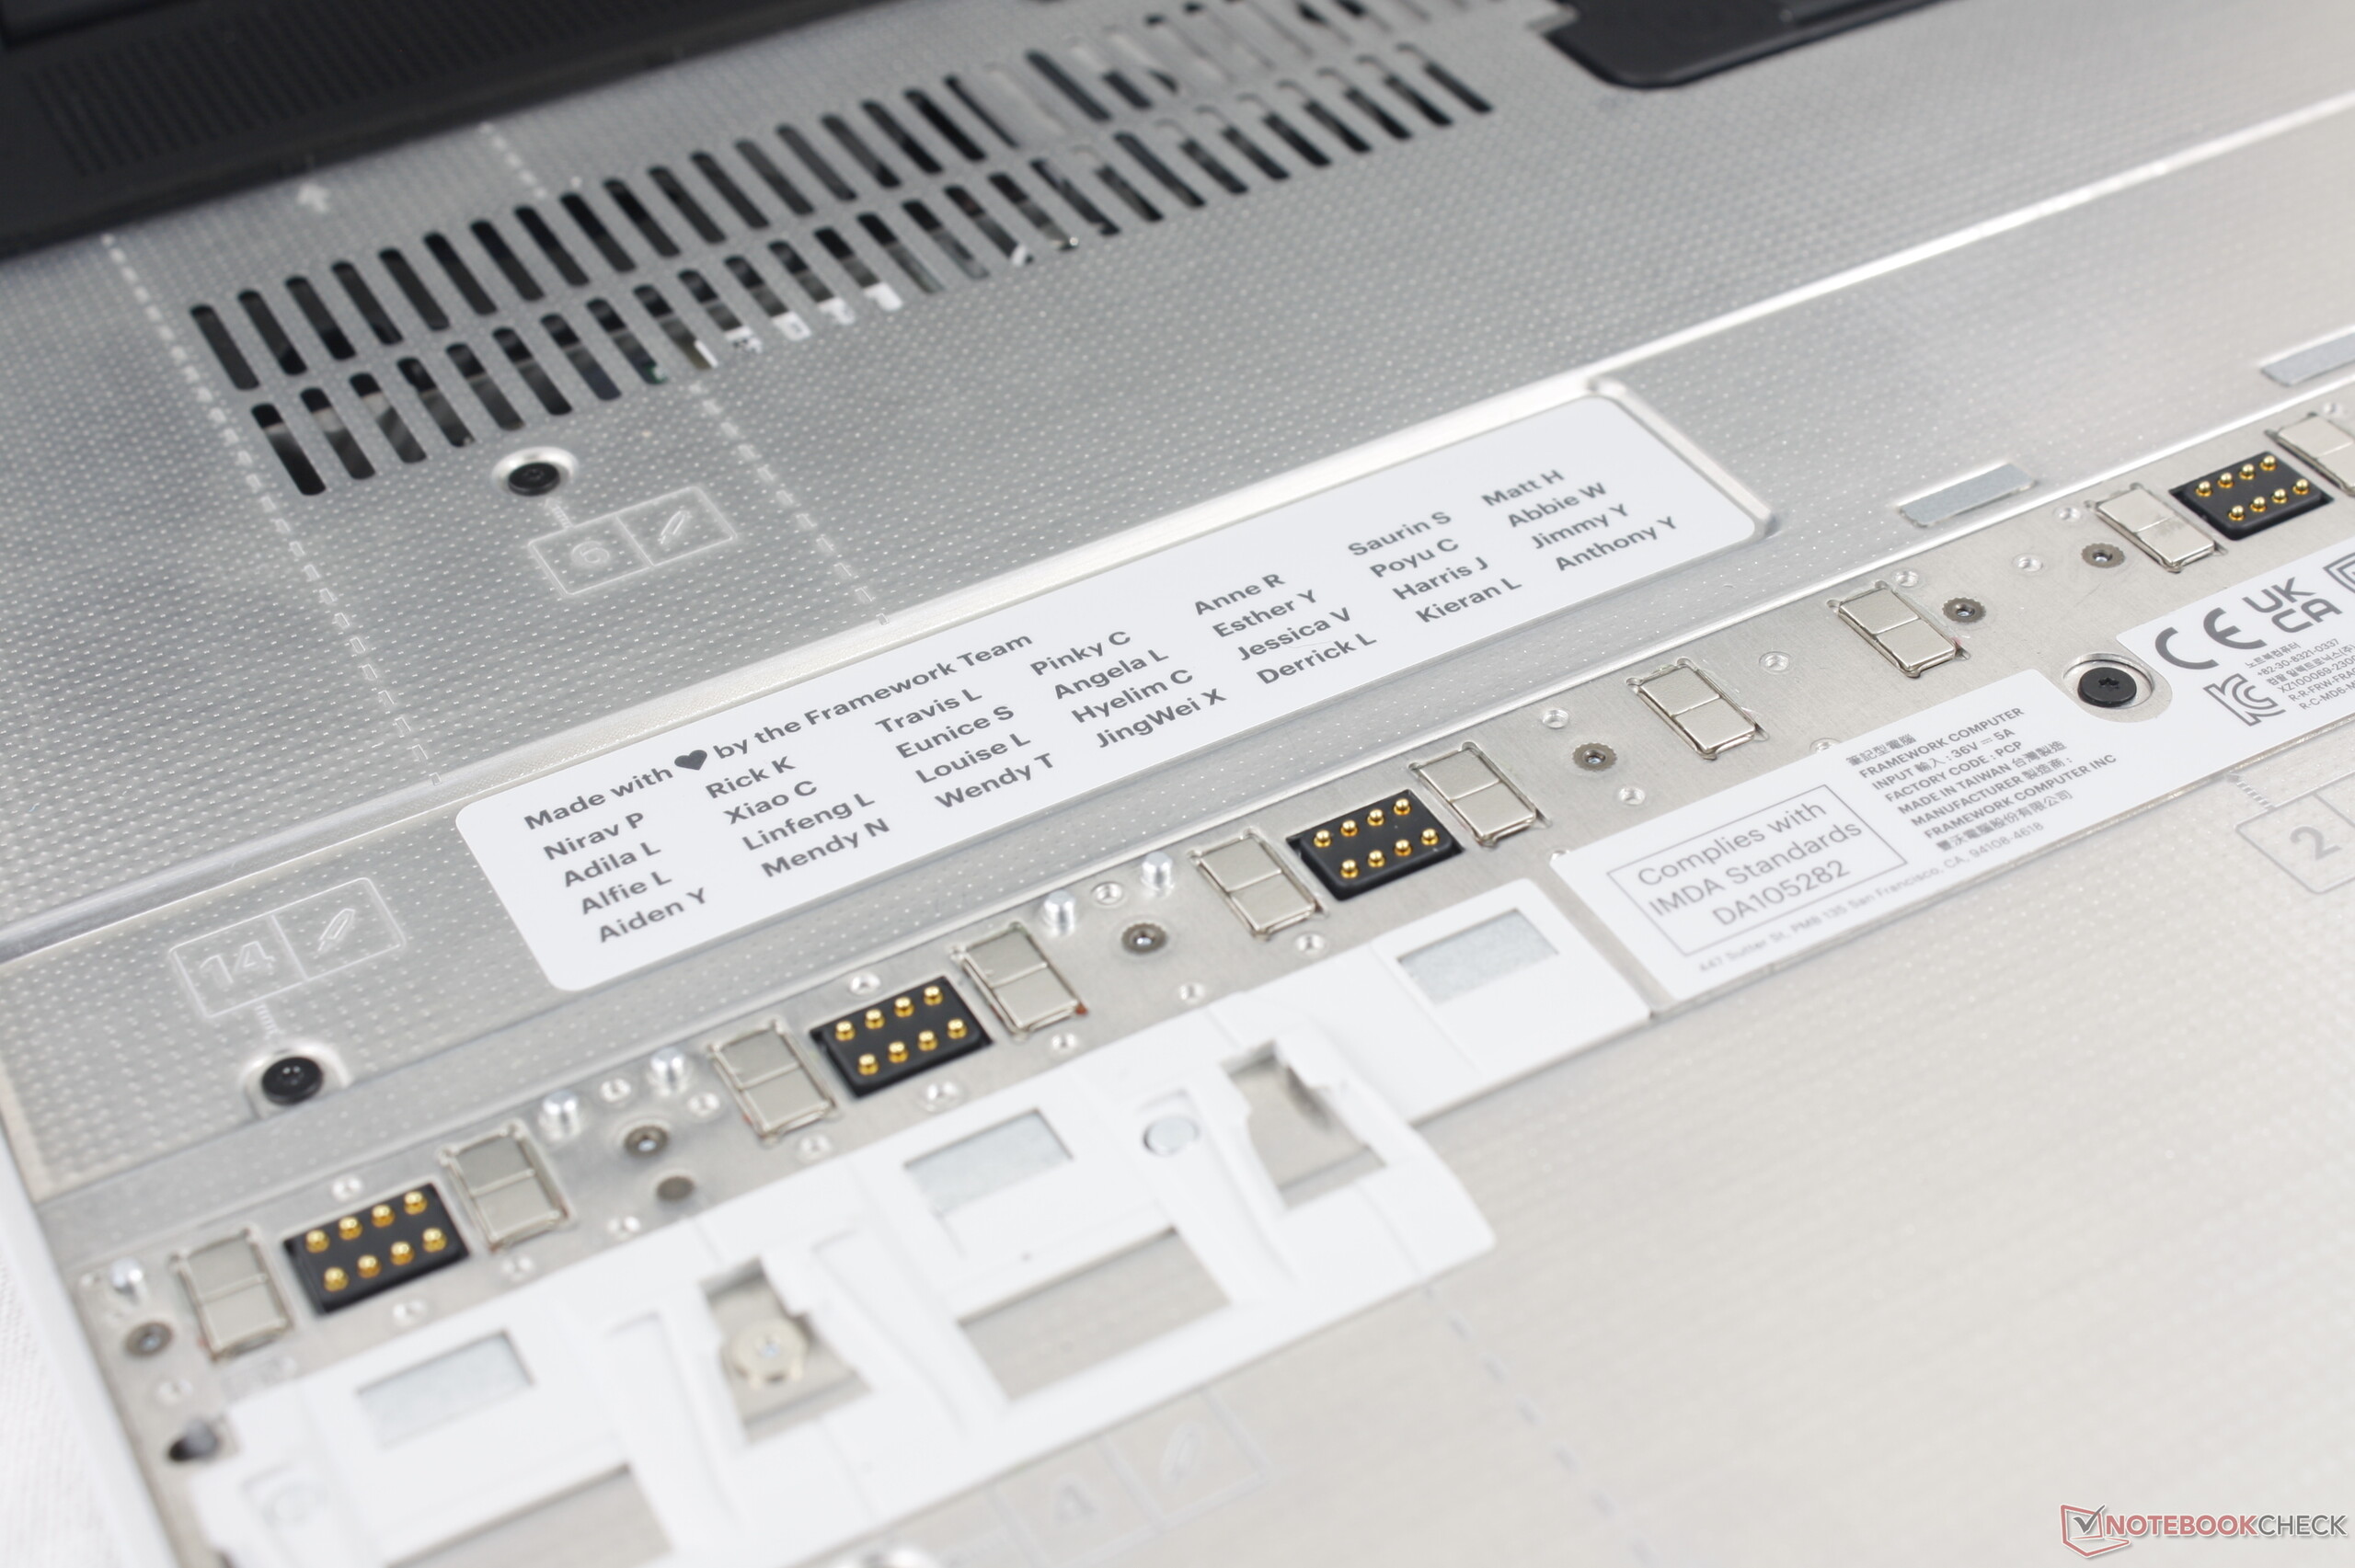
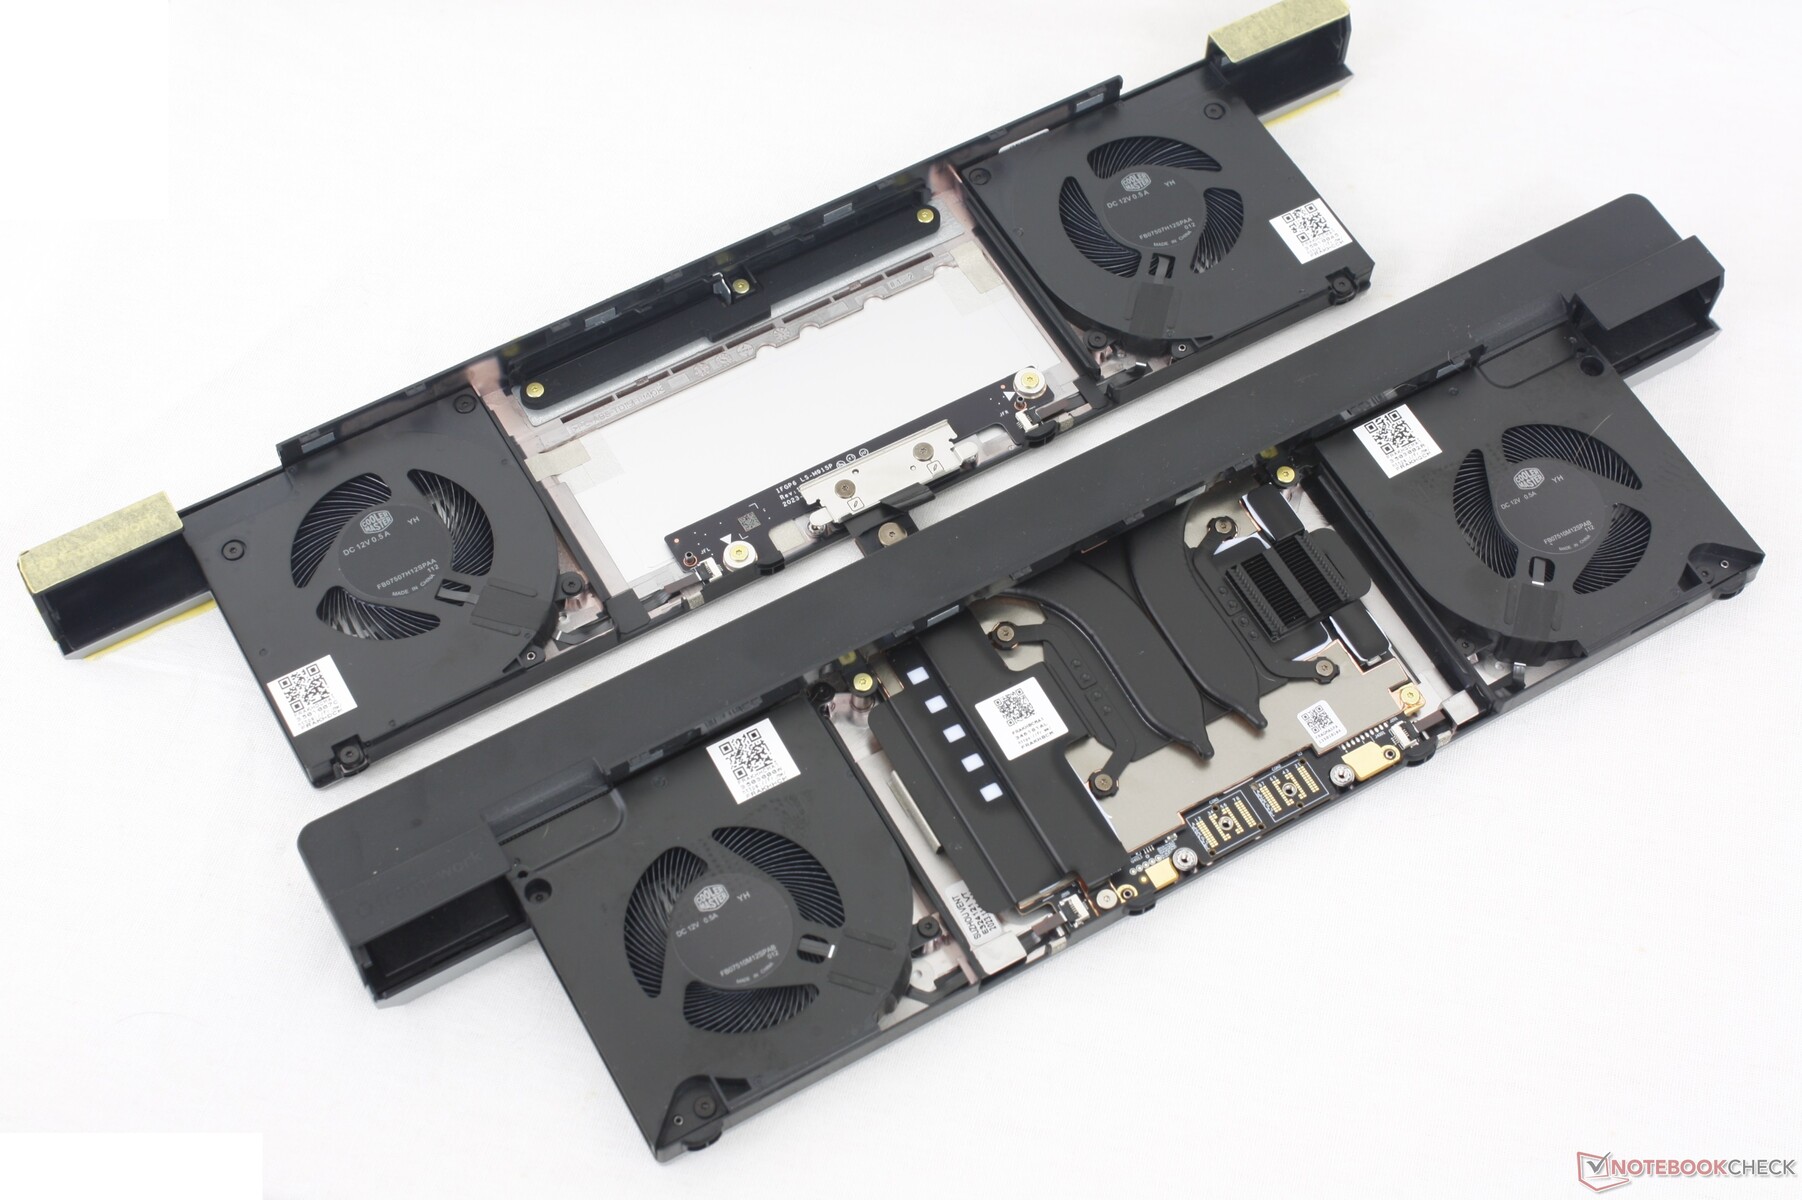
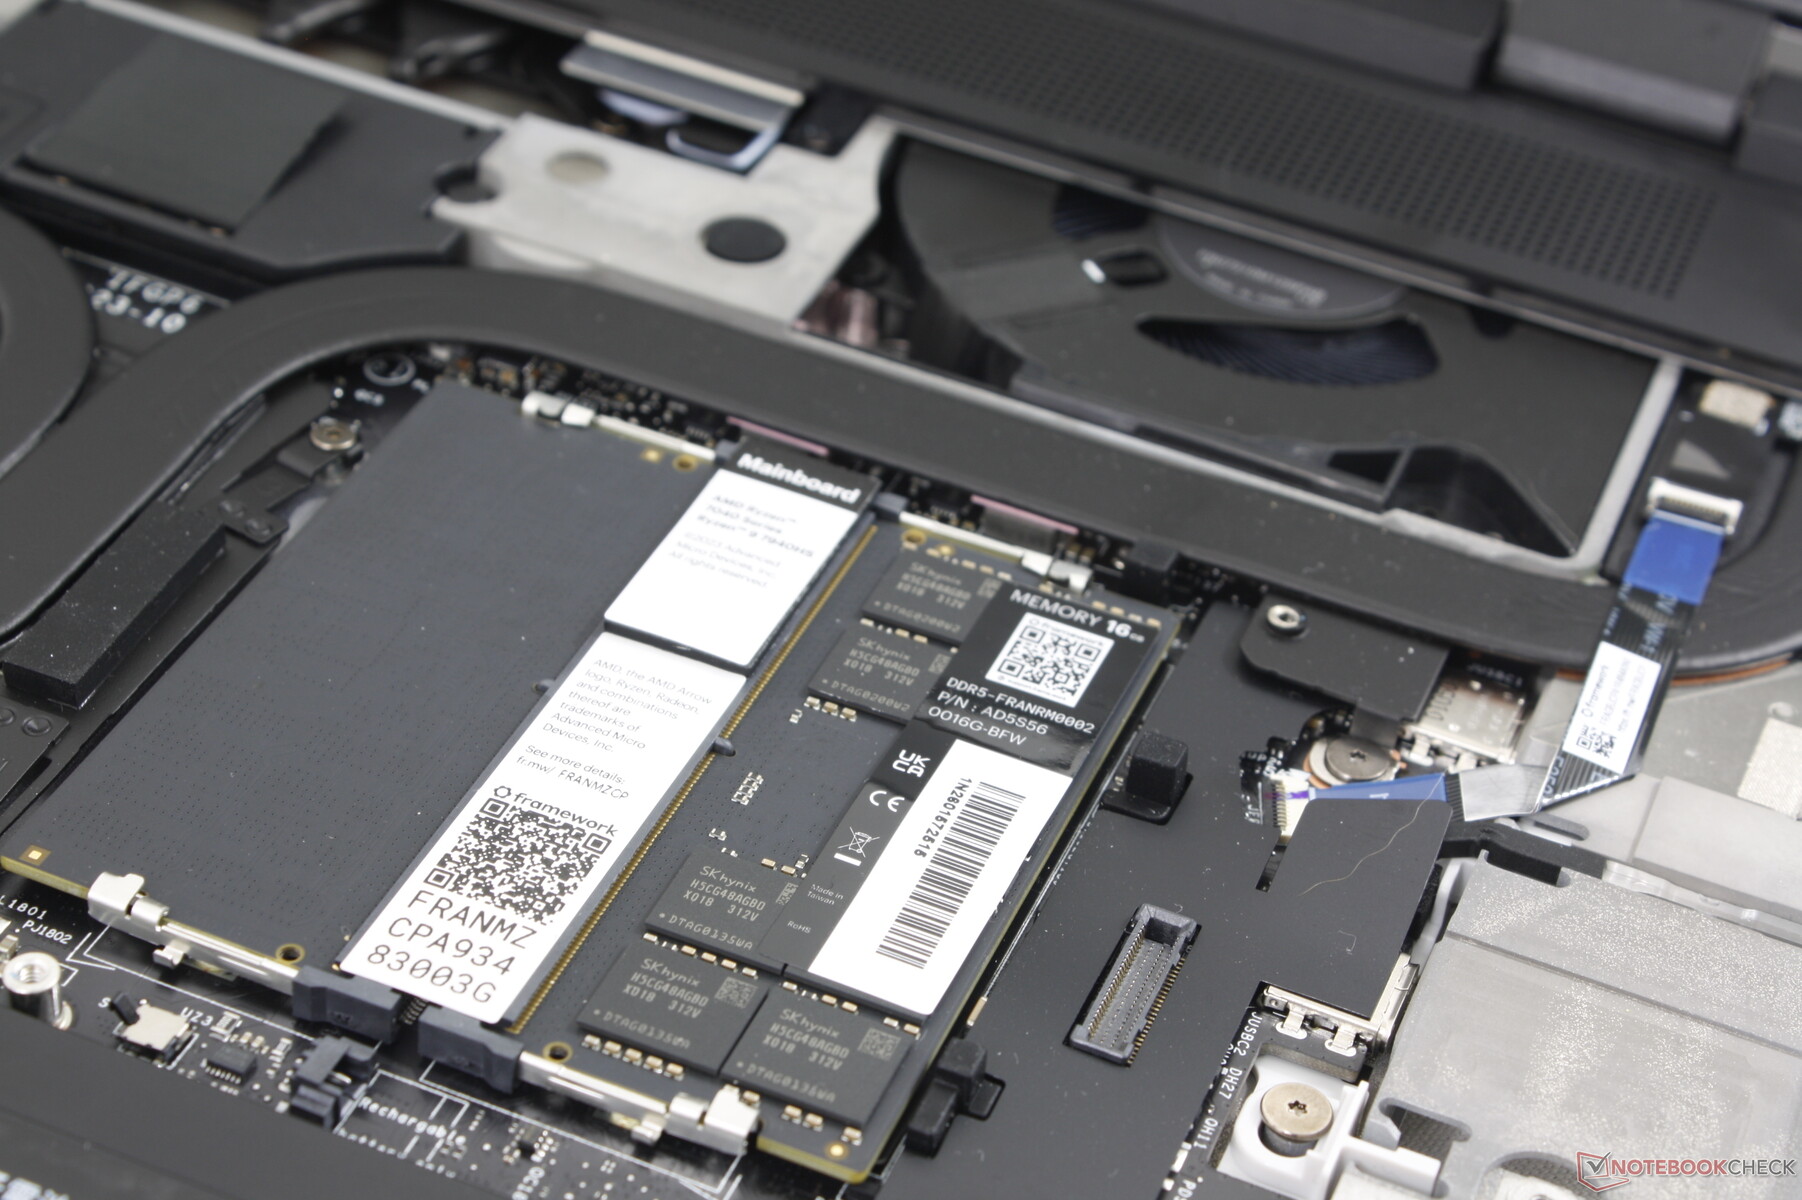
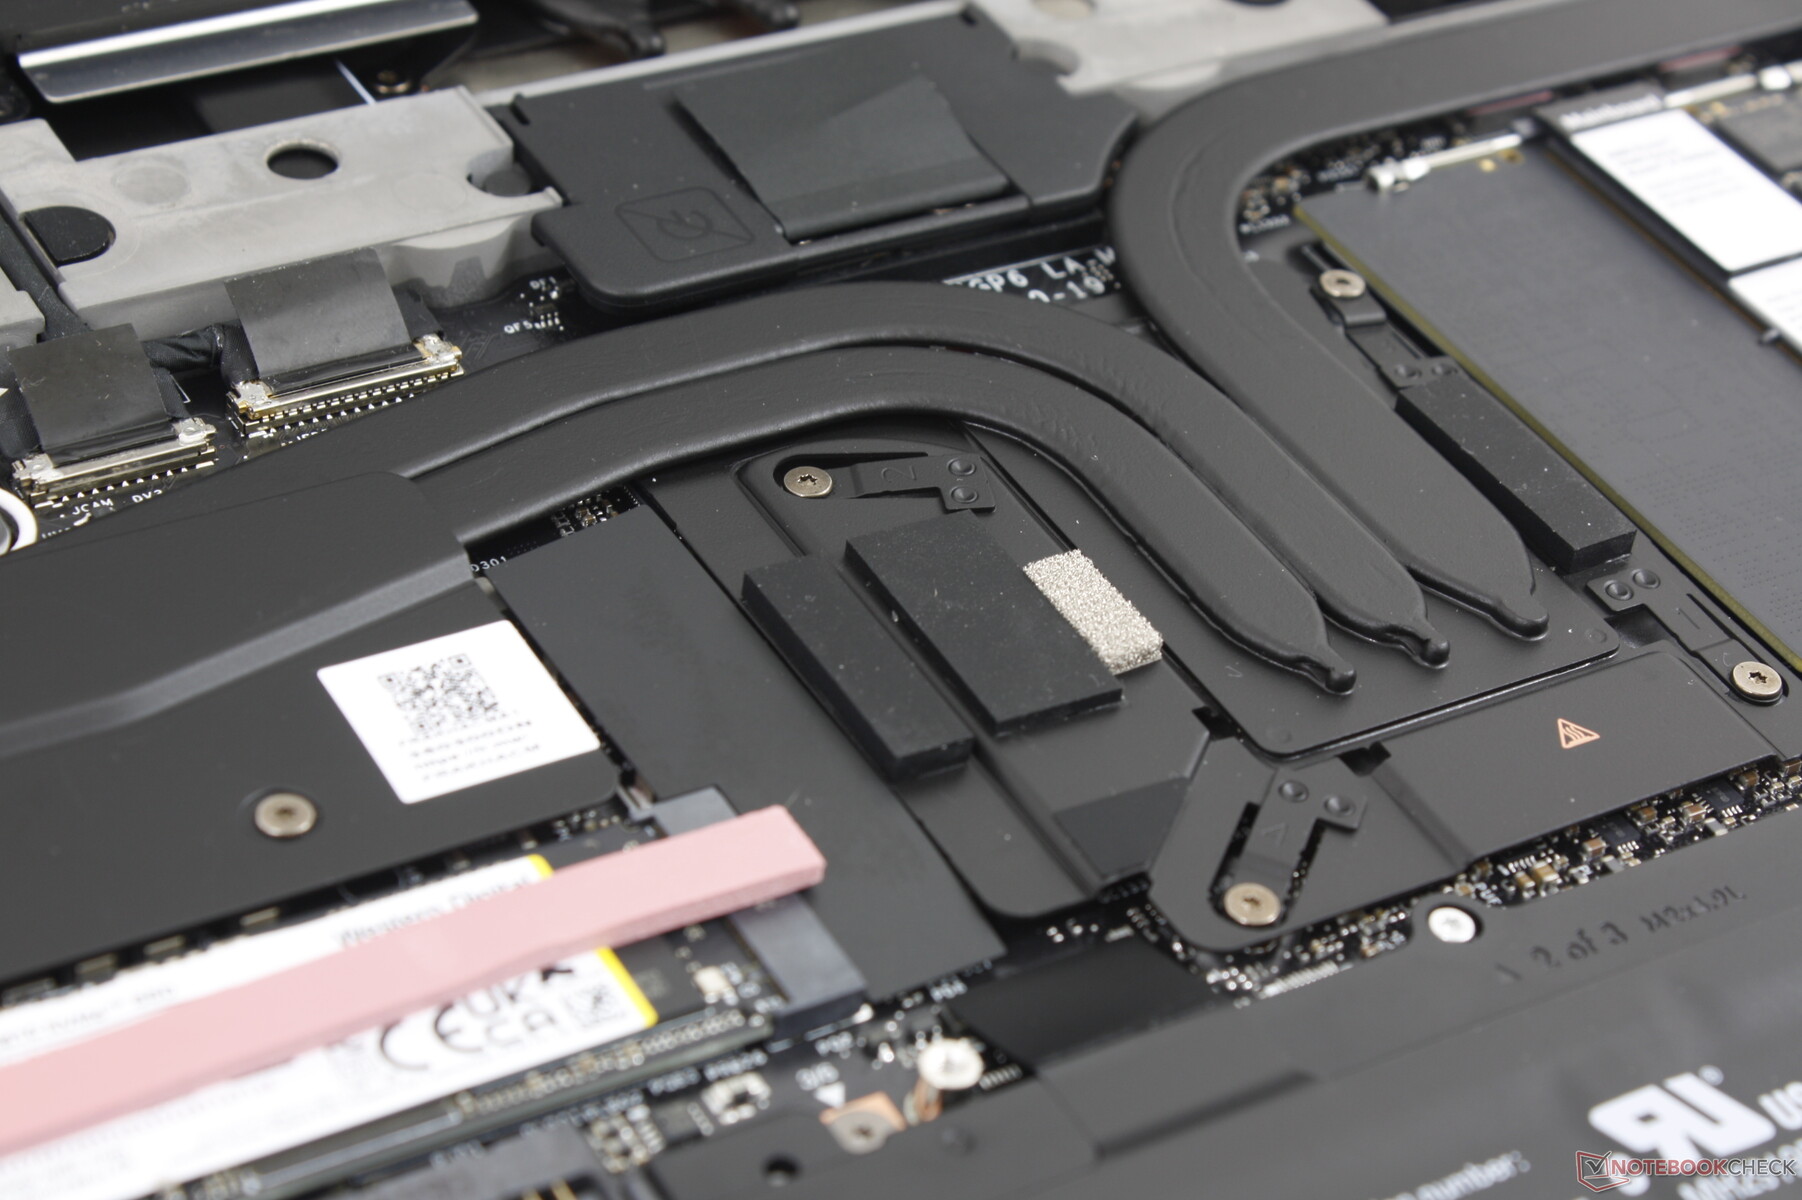
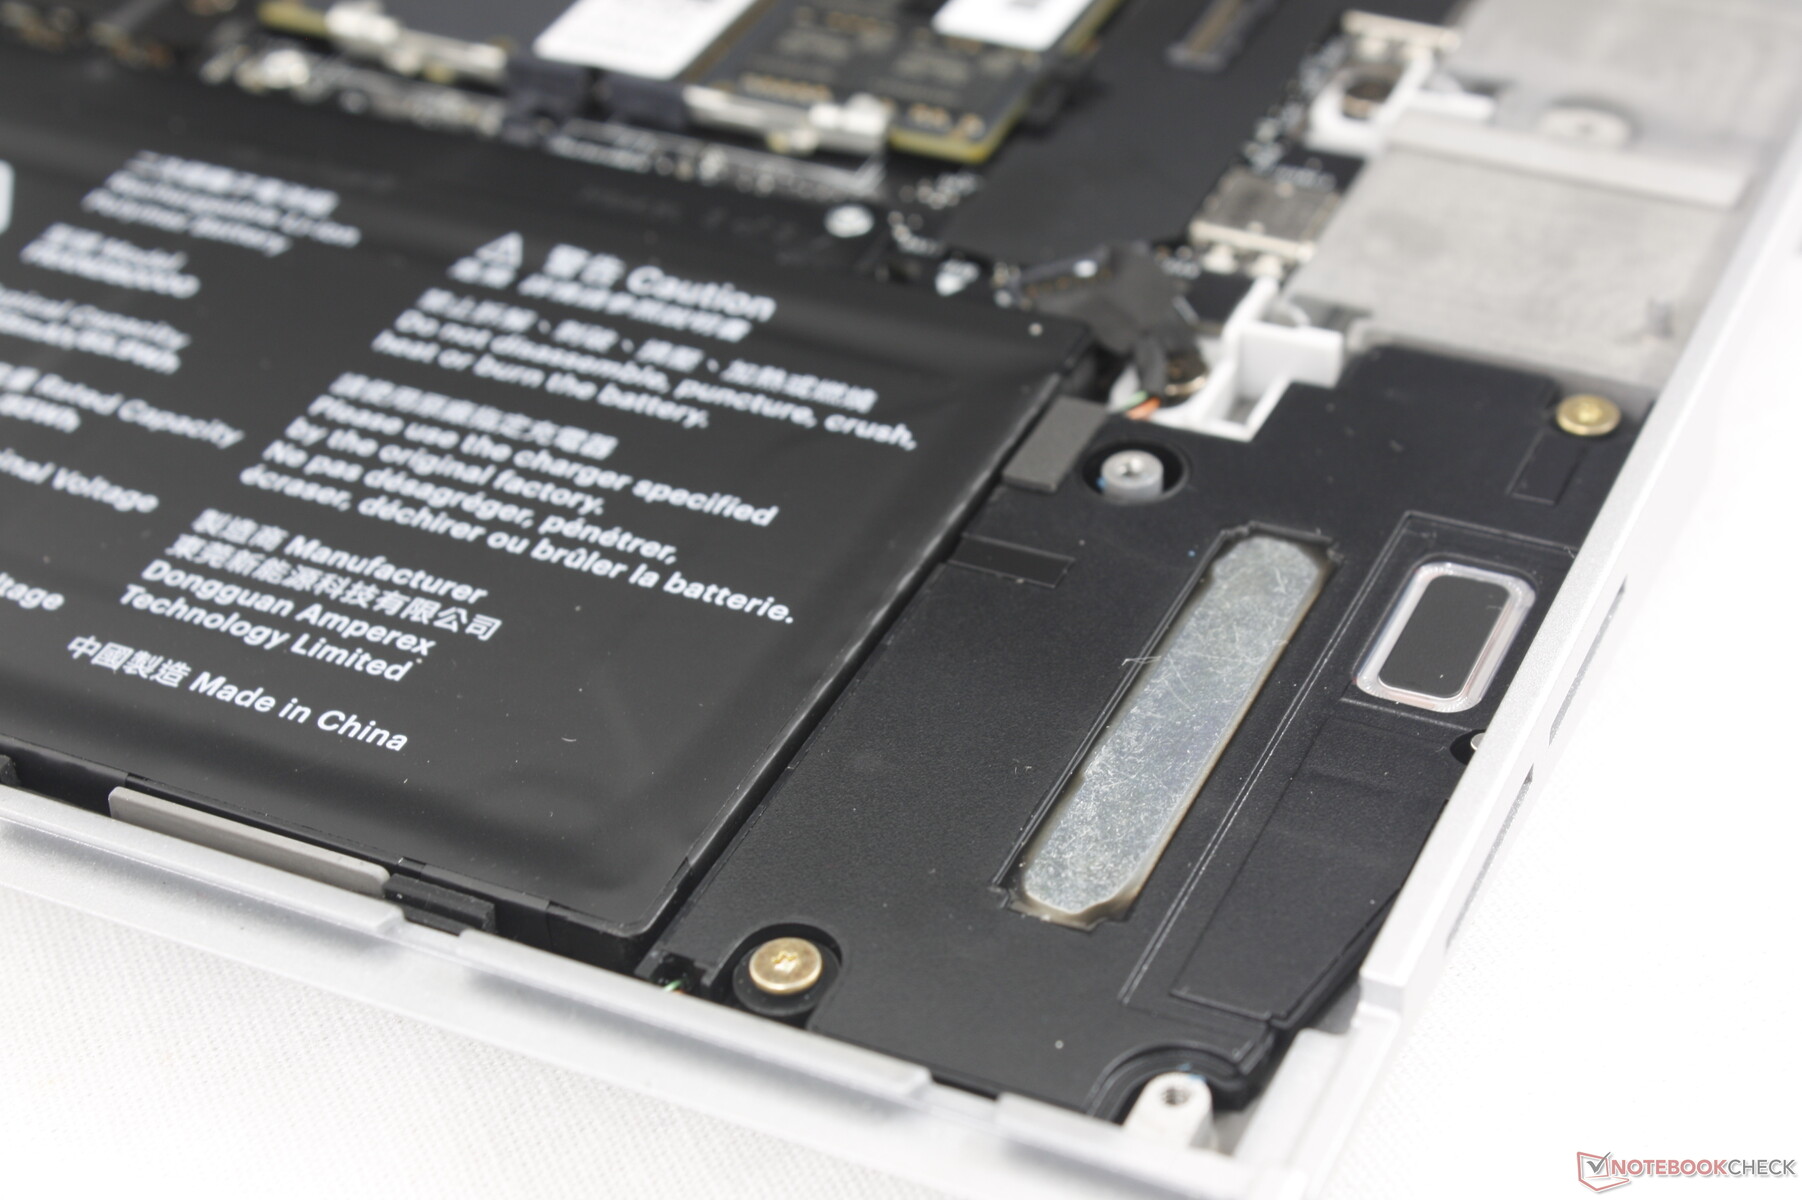
Manutenção
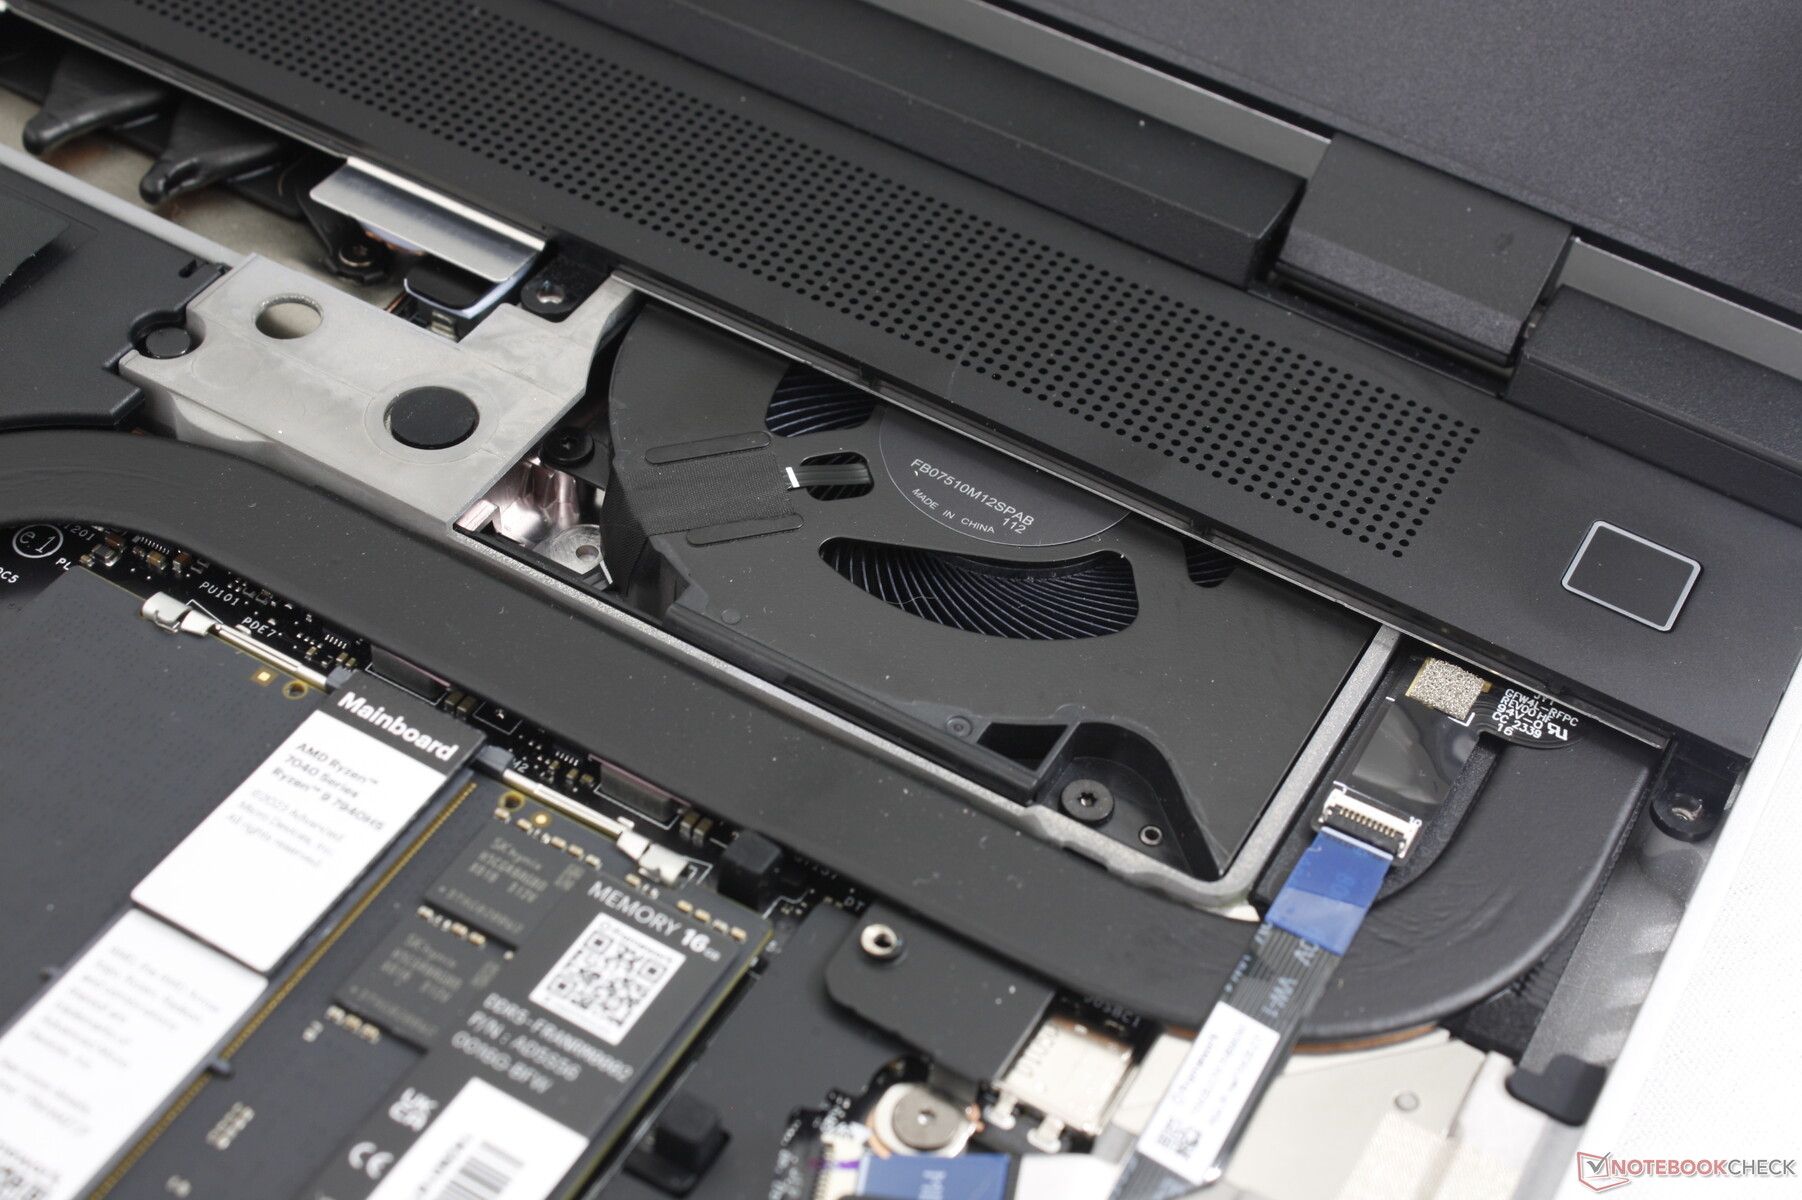
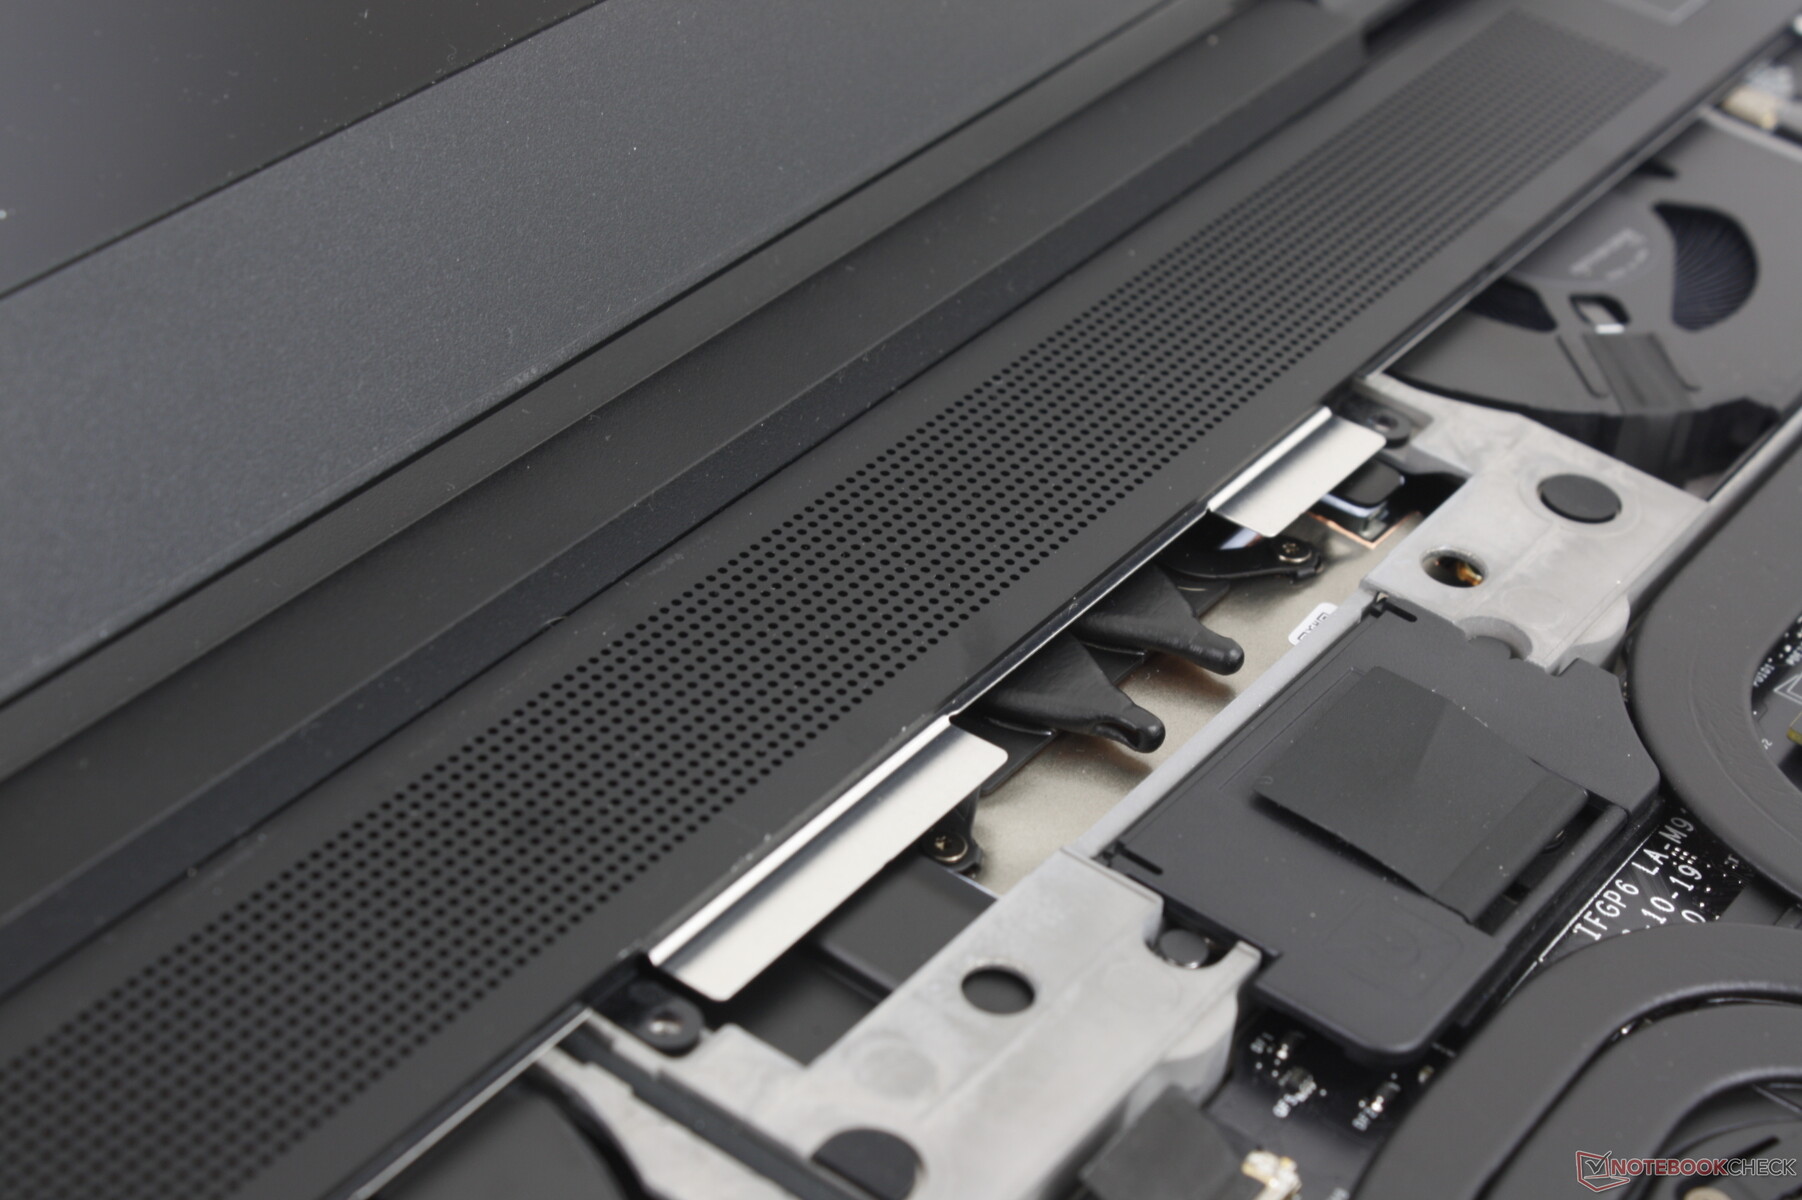
O acesso à placa-mãe é mais complicado do que o normal. Enquanto a maioria dos outros laptops exige que o usuário remova apenas o painel inferior, o Laptop 16 exige que o usuário remova o teclado, o clickpad, um cabo de fita, 15 parafusos Torx e uma placa intermediária de metal para revelar as entranhas. Não é difícil de forma alguma, mas o processo é um pouco mais longo quando comparado a algo como um ThinkPad ou EliteBook tradicional.
Felizmente, a Framework oferece alguns dos guias de reparo mais detalhados e fáceis de seguir que já vimos de qualquer fabricante de laptop para facilitar a manutenção. É altamente recomendável consultar a extensa página de suporte oficial do https://frame.work/laptop-16-support#customize-your-laptopque cobre tudo desde simples upgrades de RAM e SSD até a substituição da placa-mãe e a instalação do módulo dGPU. Não é necessário reimprimir todo o processo de manutenção, mas os procedimentos têm uma curva de aprendizado um pouco maior do que a do laptop 13.5 devido às complexidades da nova dGPU removível e dos módulos de entrada maiores.
Embora muitos dos módulos sejam magnéticos, ainda é necessário usar uma chave de fenda para instalar a dGPU traseira e alguns módulos devem ser instalados em uma determinada ordem. O módulo traseiro, em particular, não é plug-and-play, pois o sistema deve ser desligado e o teclado e o clickpad devem ser removidos primeiro. A boa notícia é que o senhor só precisa desmontar e remontar o sistema uma vez para que os procedimentos de manutenção se tornem uma segunda natureza. A Framework até incentiva isso enviando o teclado e o clickpad separados, o que efetivamente força o usuário a aprender como alguns dos módulos funcionam antes de ligar o laptop pela primeira vez.
O uso de ímãs e travas para os módulos do touchpad é uma abordagem intuitiva para a manutenção. Esperamos que isso seja ampliado até o ponto em que todos os módulos e upgrades possam ser feitos sem ferramentas.
Garantia
A garantia padrão limitada de um ano do fabricante se aplica se o produto for adquirido nos EUA. A proteção cobre o laptop, além de suas peças e módulos.
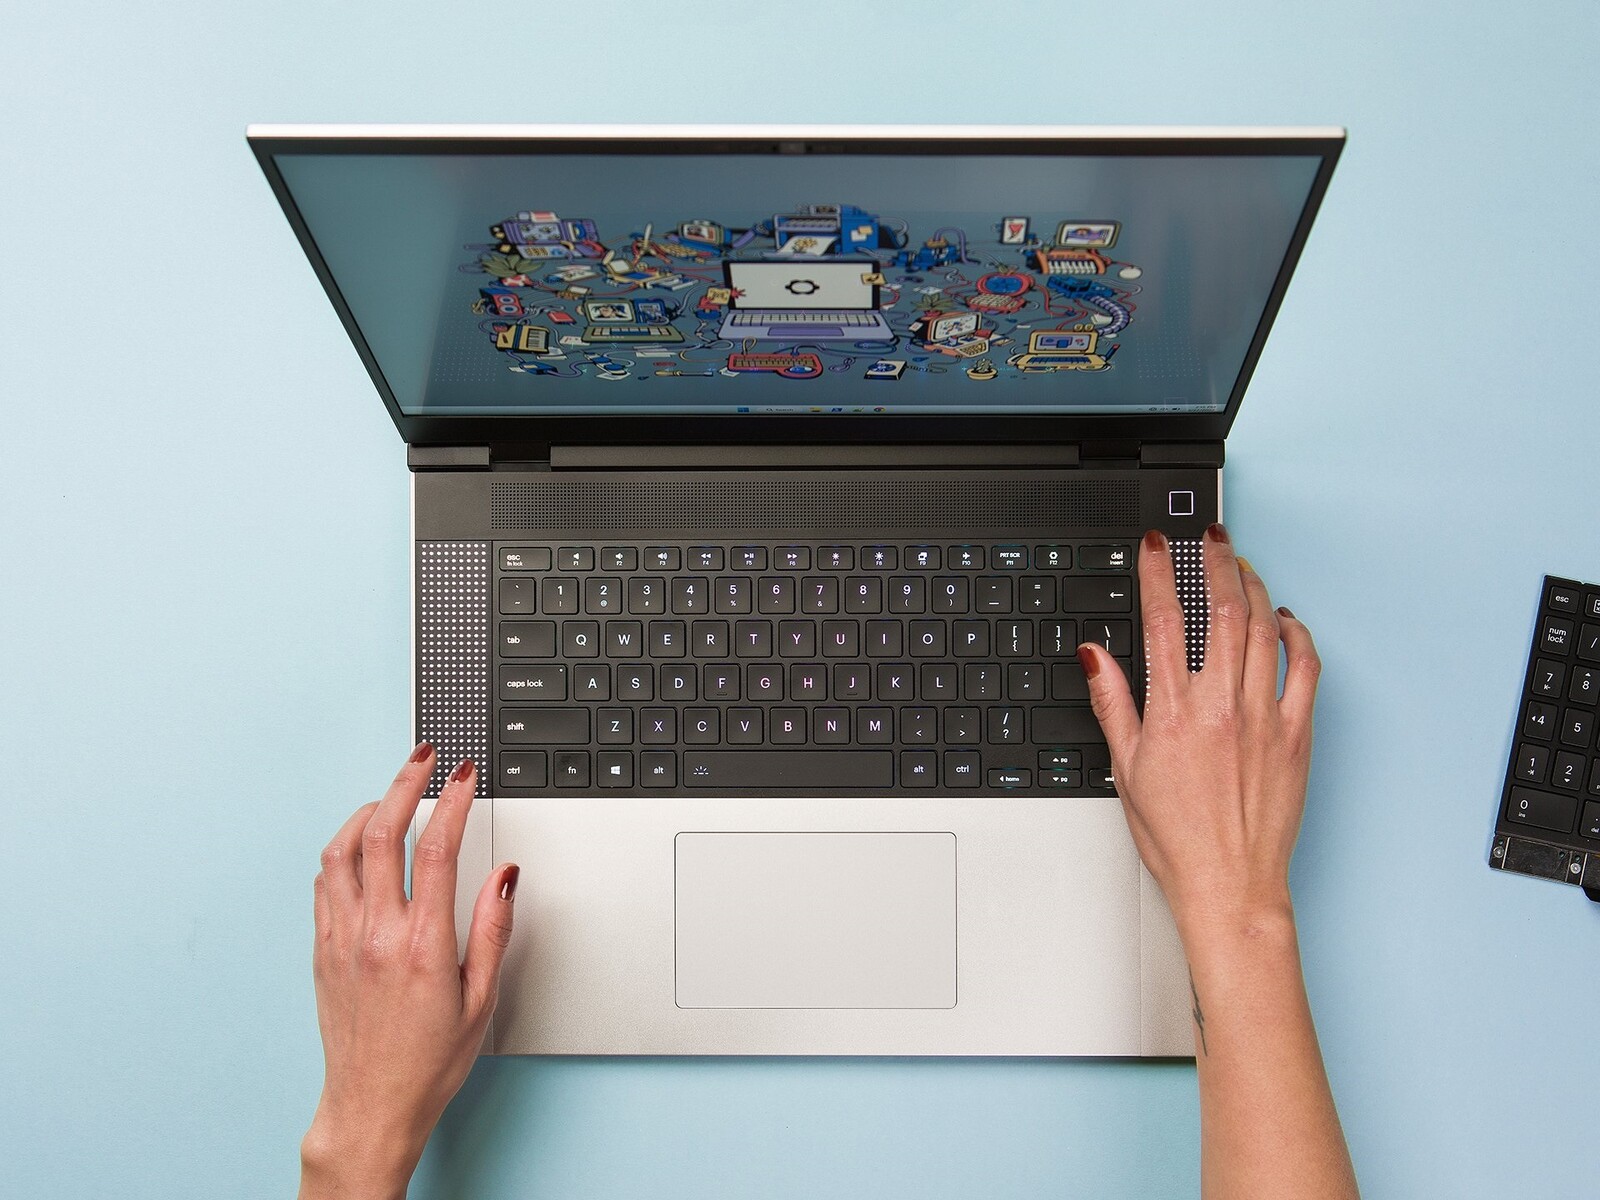
Dispositivos de entrada - removíveis, substituíveis e reorganizáveis
Teclado
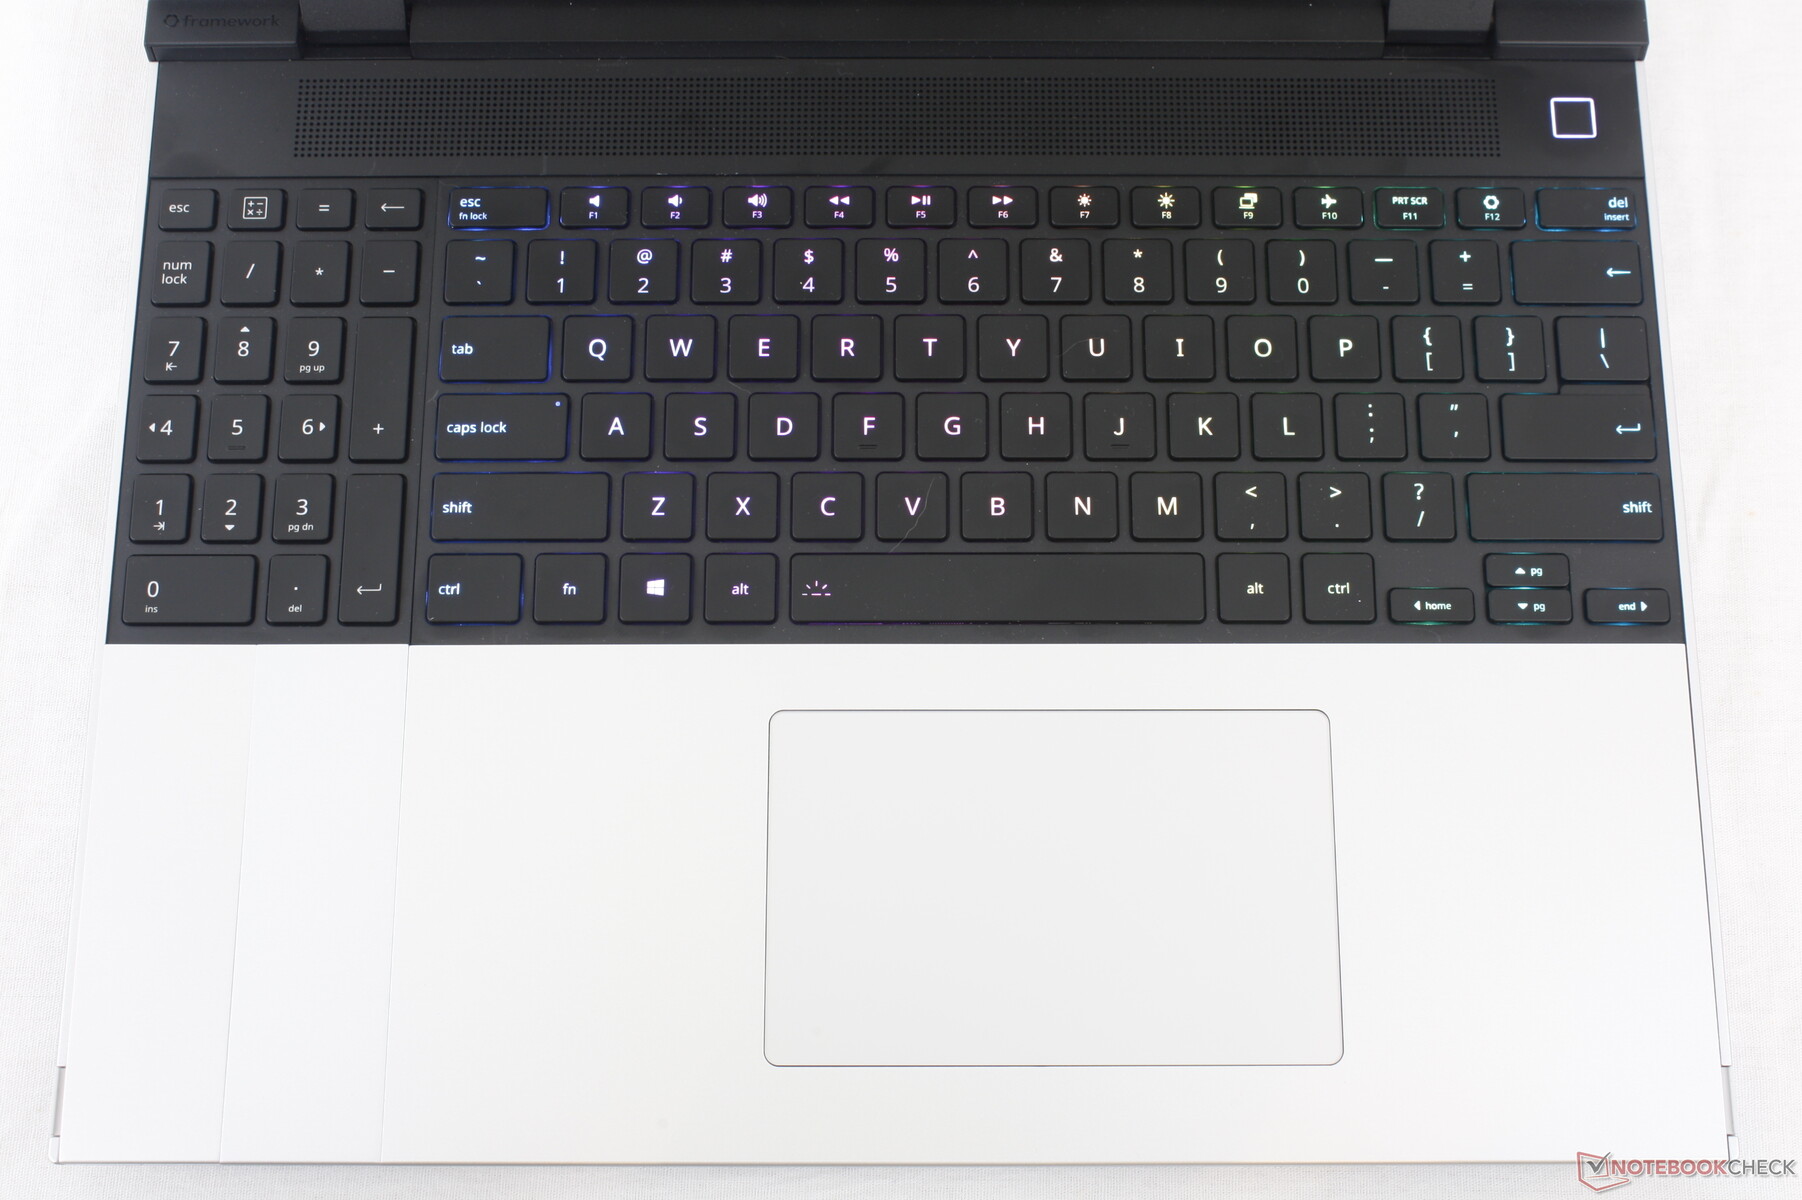
As teclas RGB por tecla têm 1,5 mm de curso, o que é comum na maioria dos Ultrabooks. A experiência de digitação não é prejudicada pelo aspecto removível do teclado, que é exatamente o que gostamos de ver. Os usuários que preferem laptops com teclas mais profundas e firmes devem experimentar o HP Spectre.
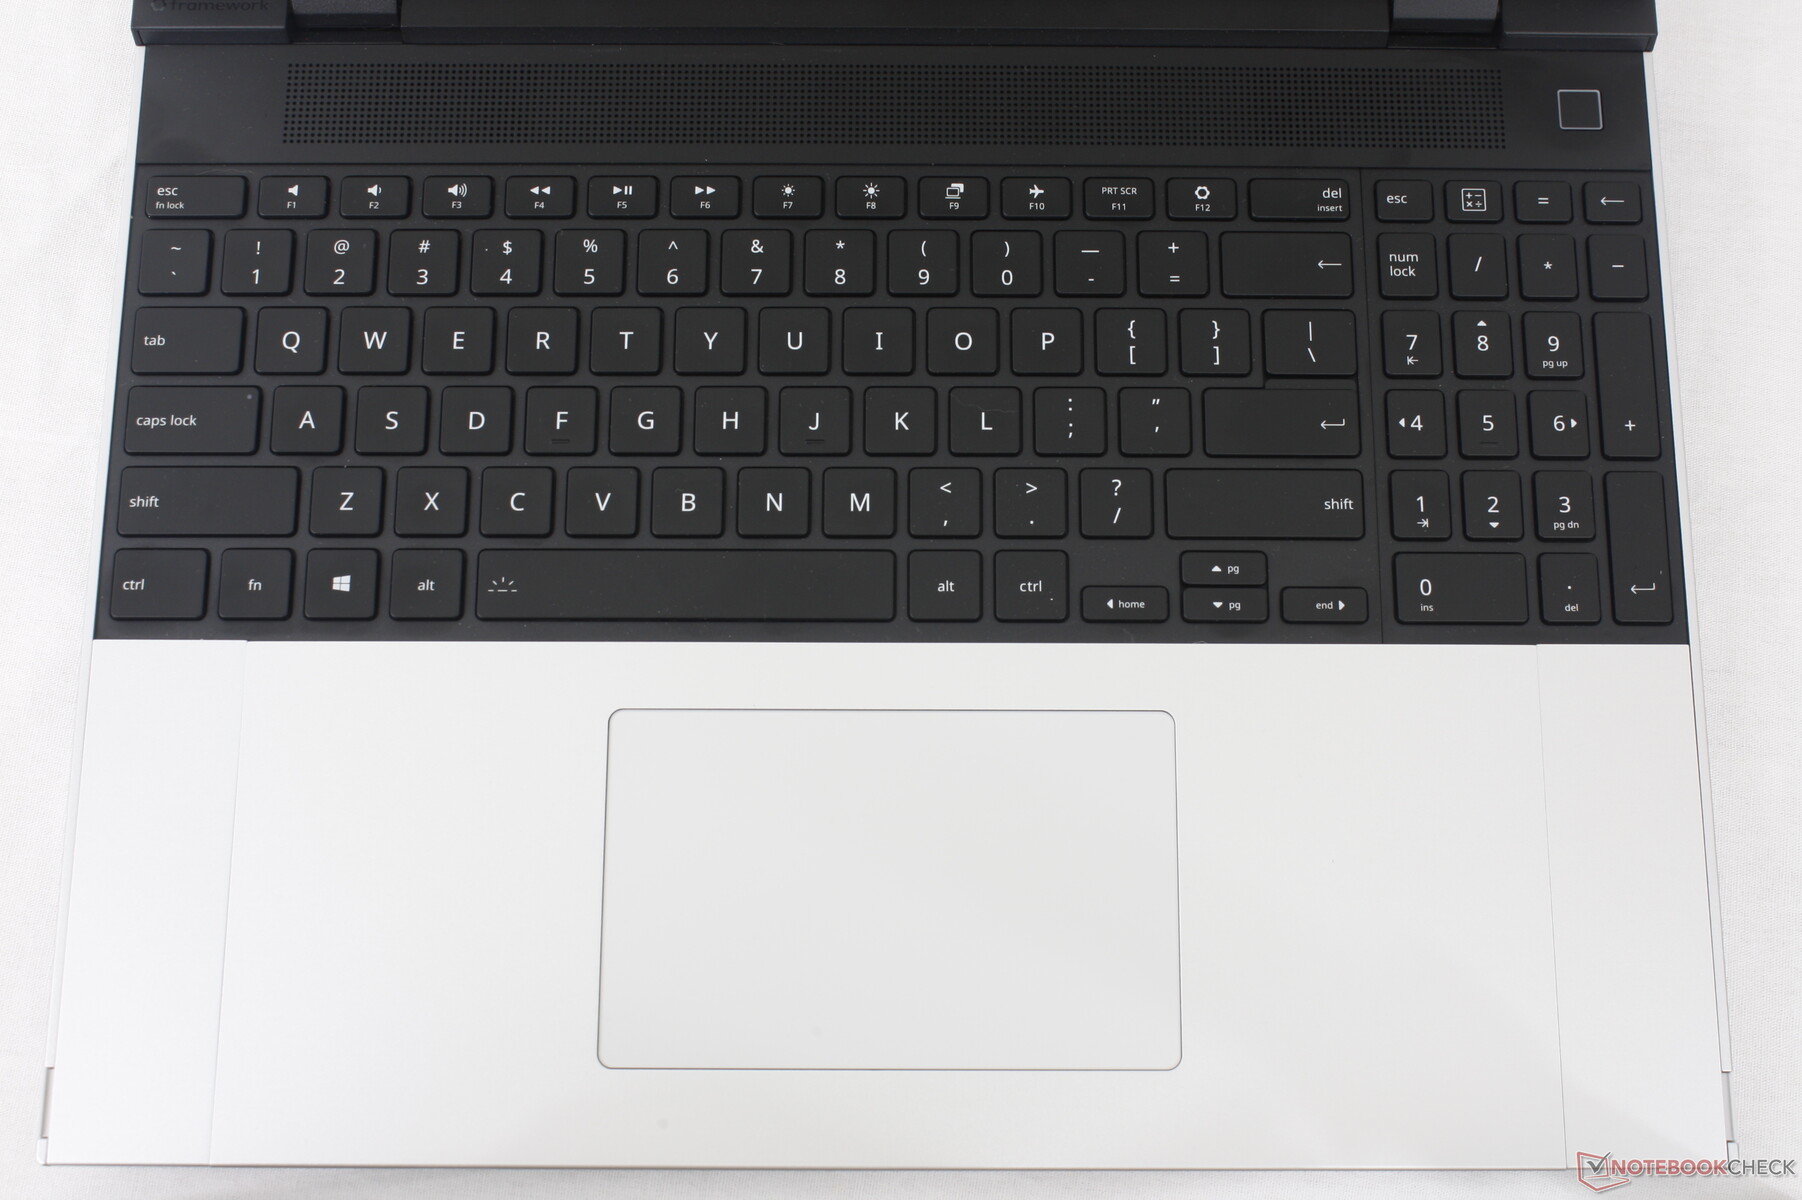
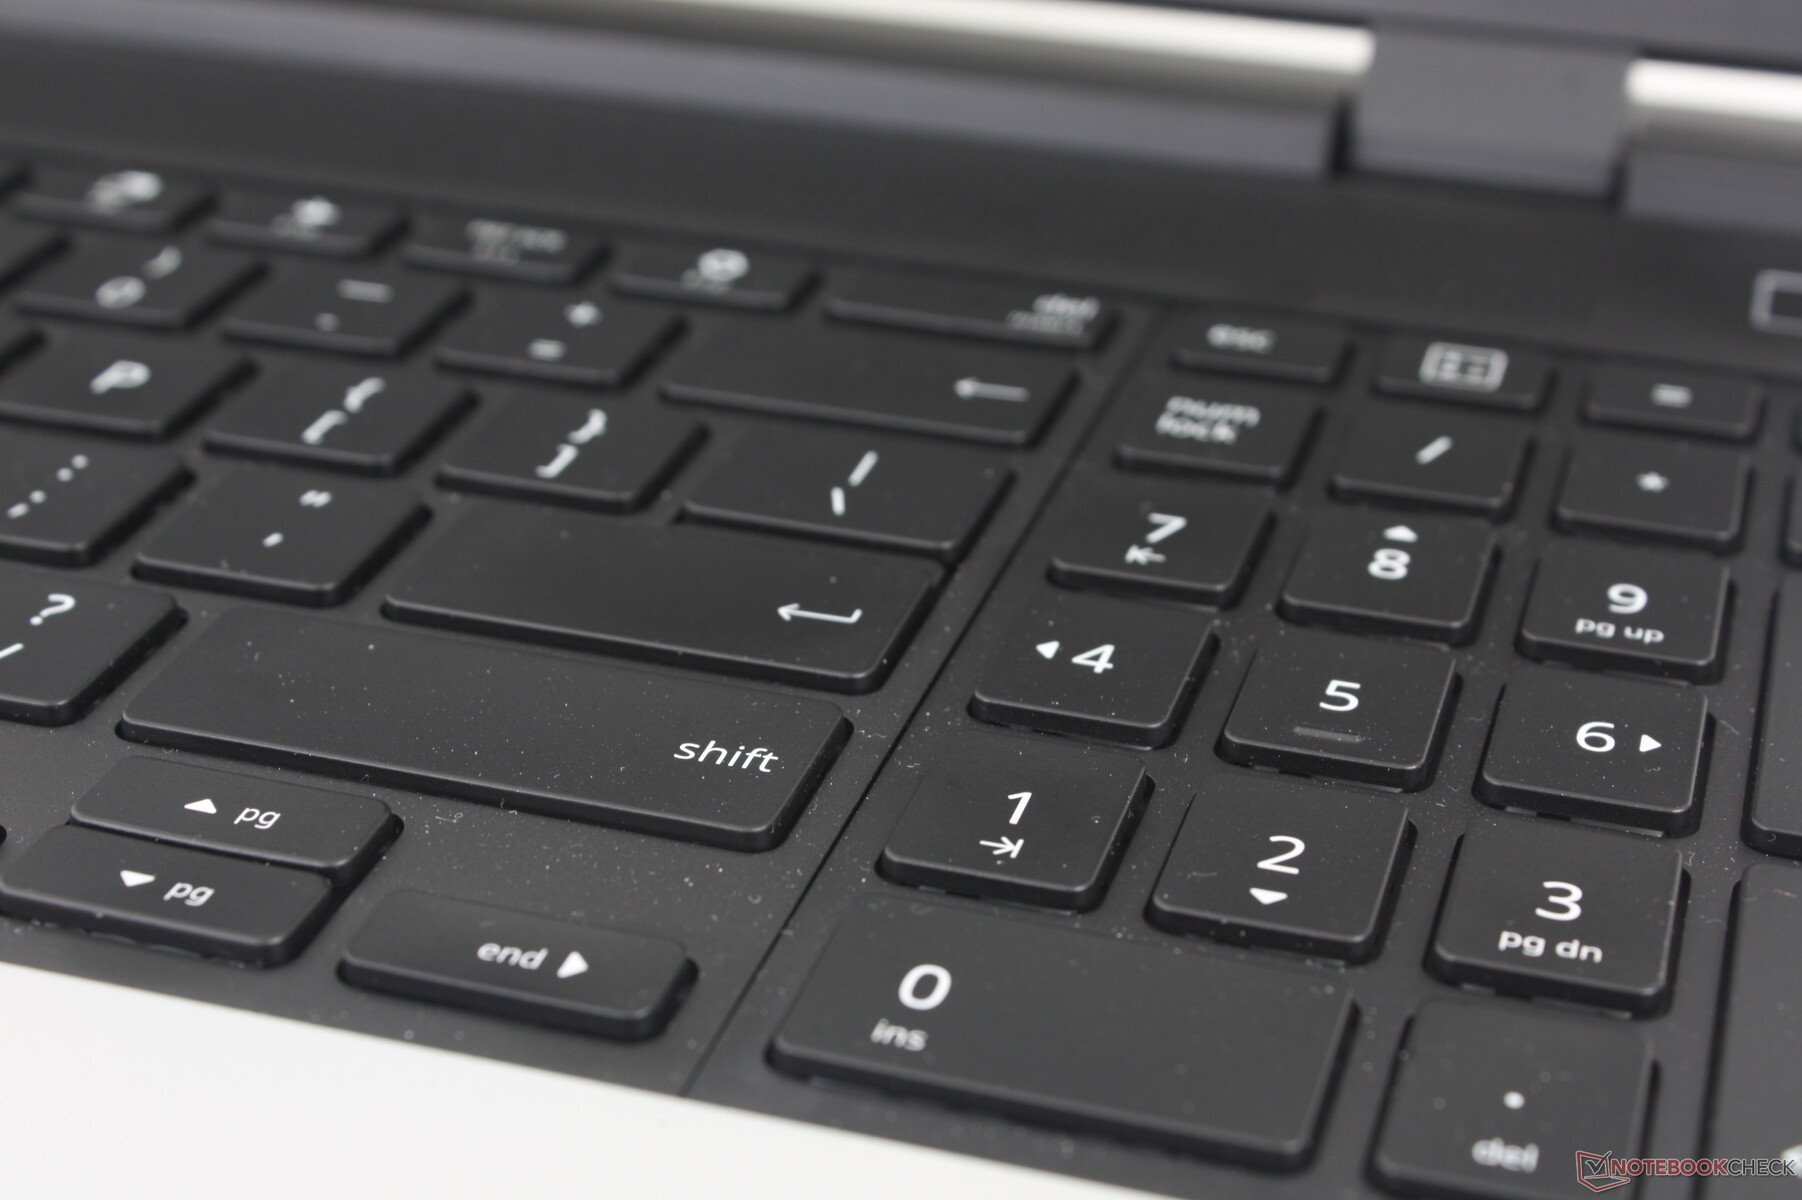
Curiosamente, as teclas do teclado numérico têm apenas uma luz de fundo branca, enquanto as teclas QWERTY principais têm iluminação RGB. Os usuários que preferem não ter nenhum teclado numérico podem instalar espaçadores para centralizar o teclado QWERTY ou instalar um macropad RGB com teclas personalizáveis. A capacidade de reposicionar ou centralizar o teclado a seu gosto não é algo que tenhamos visto em nenhum outro laptop. O teclado numérico, por exemplo, pode ser instalado à esquerda ou à direita do teclado QWERTY para algumas configurações realmente interessantes.
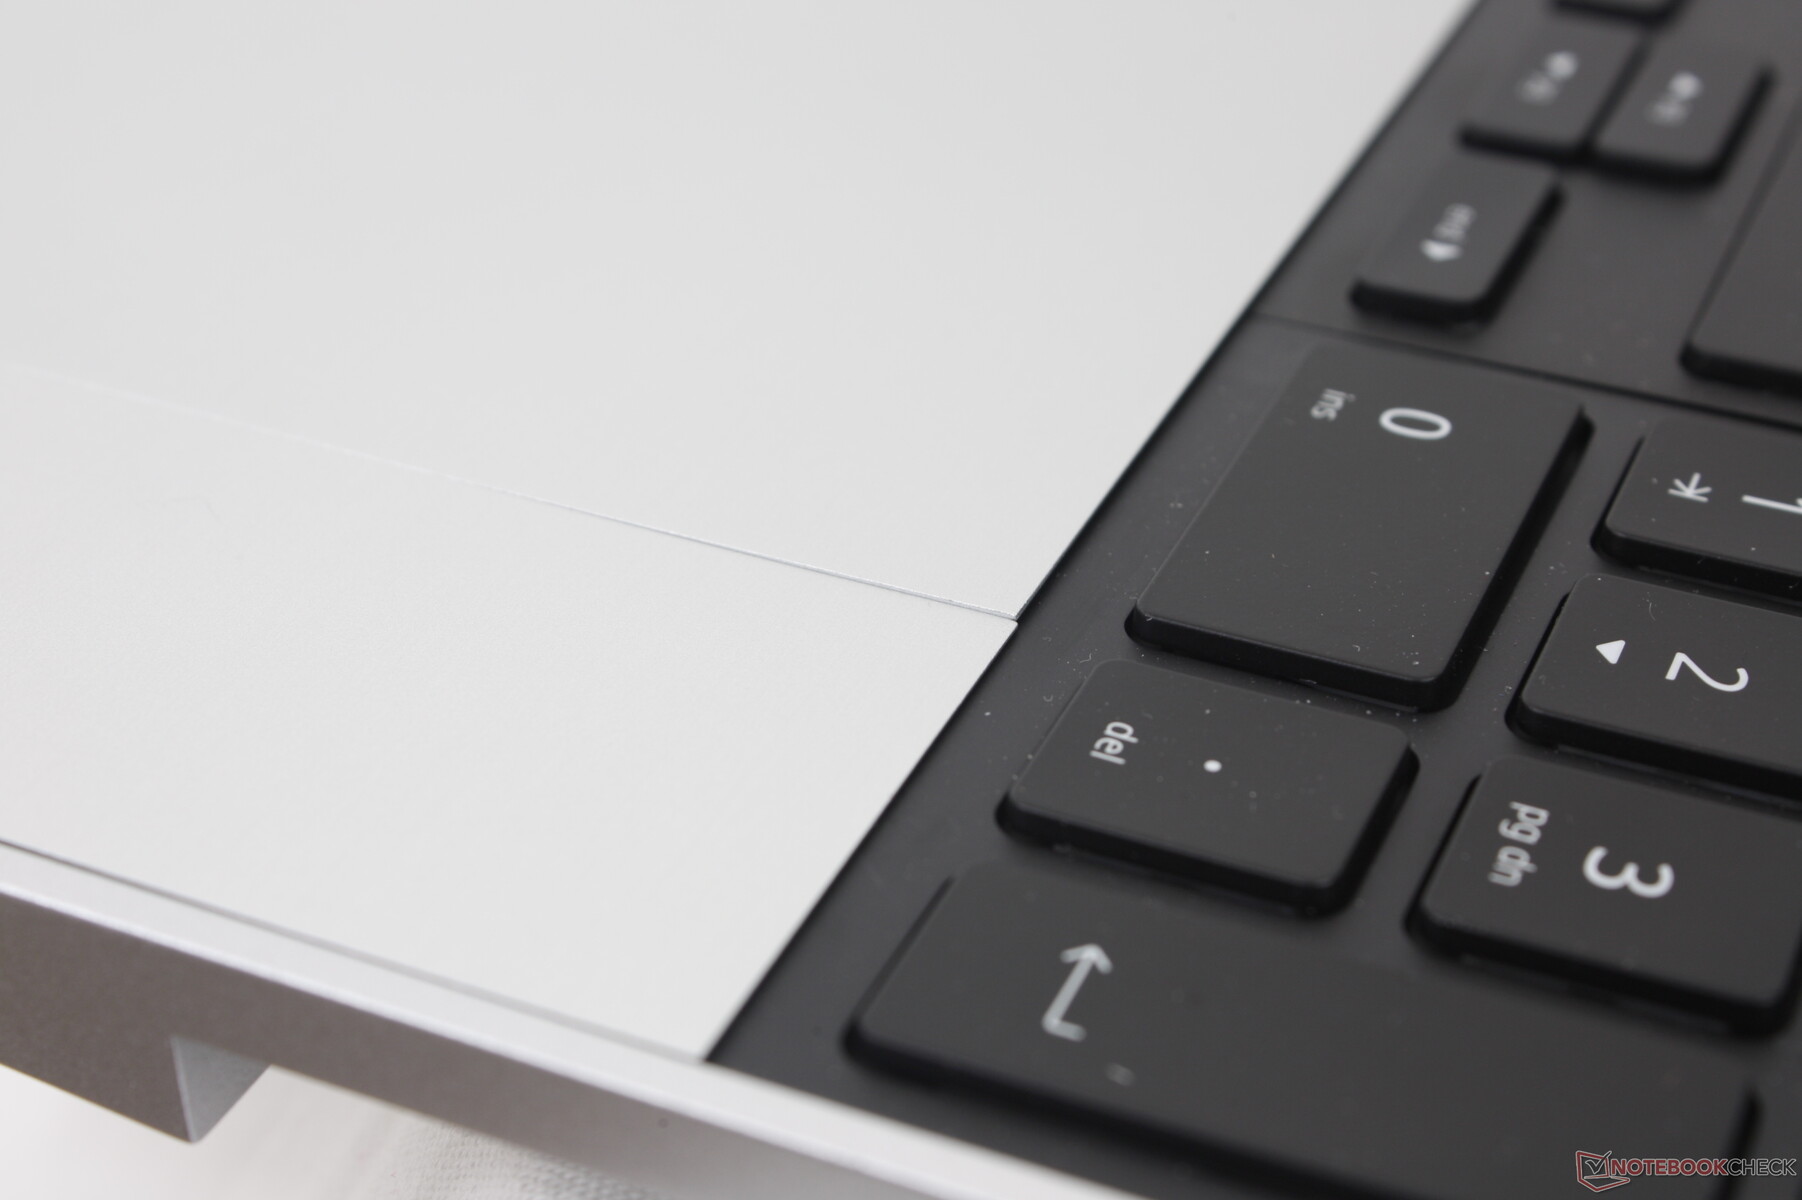
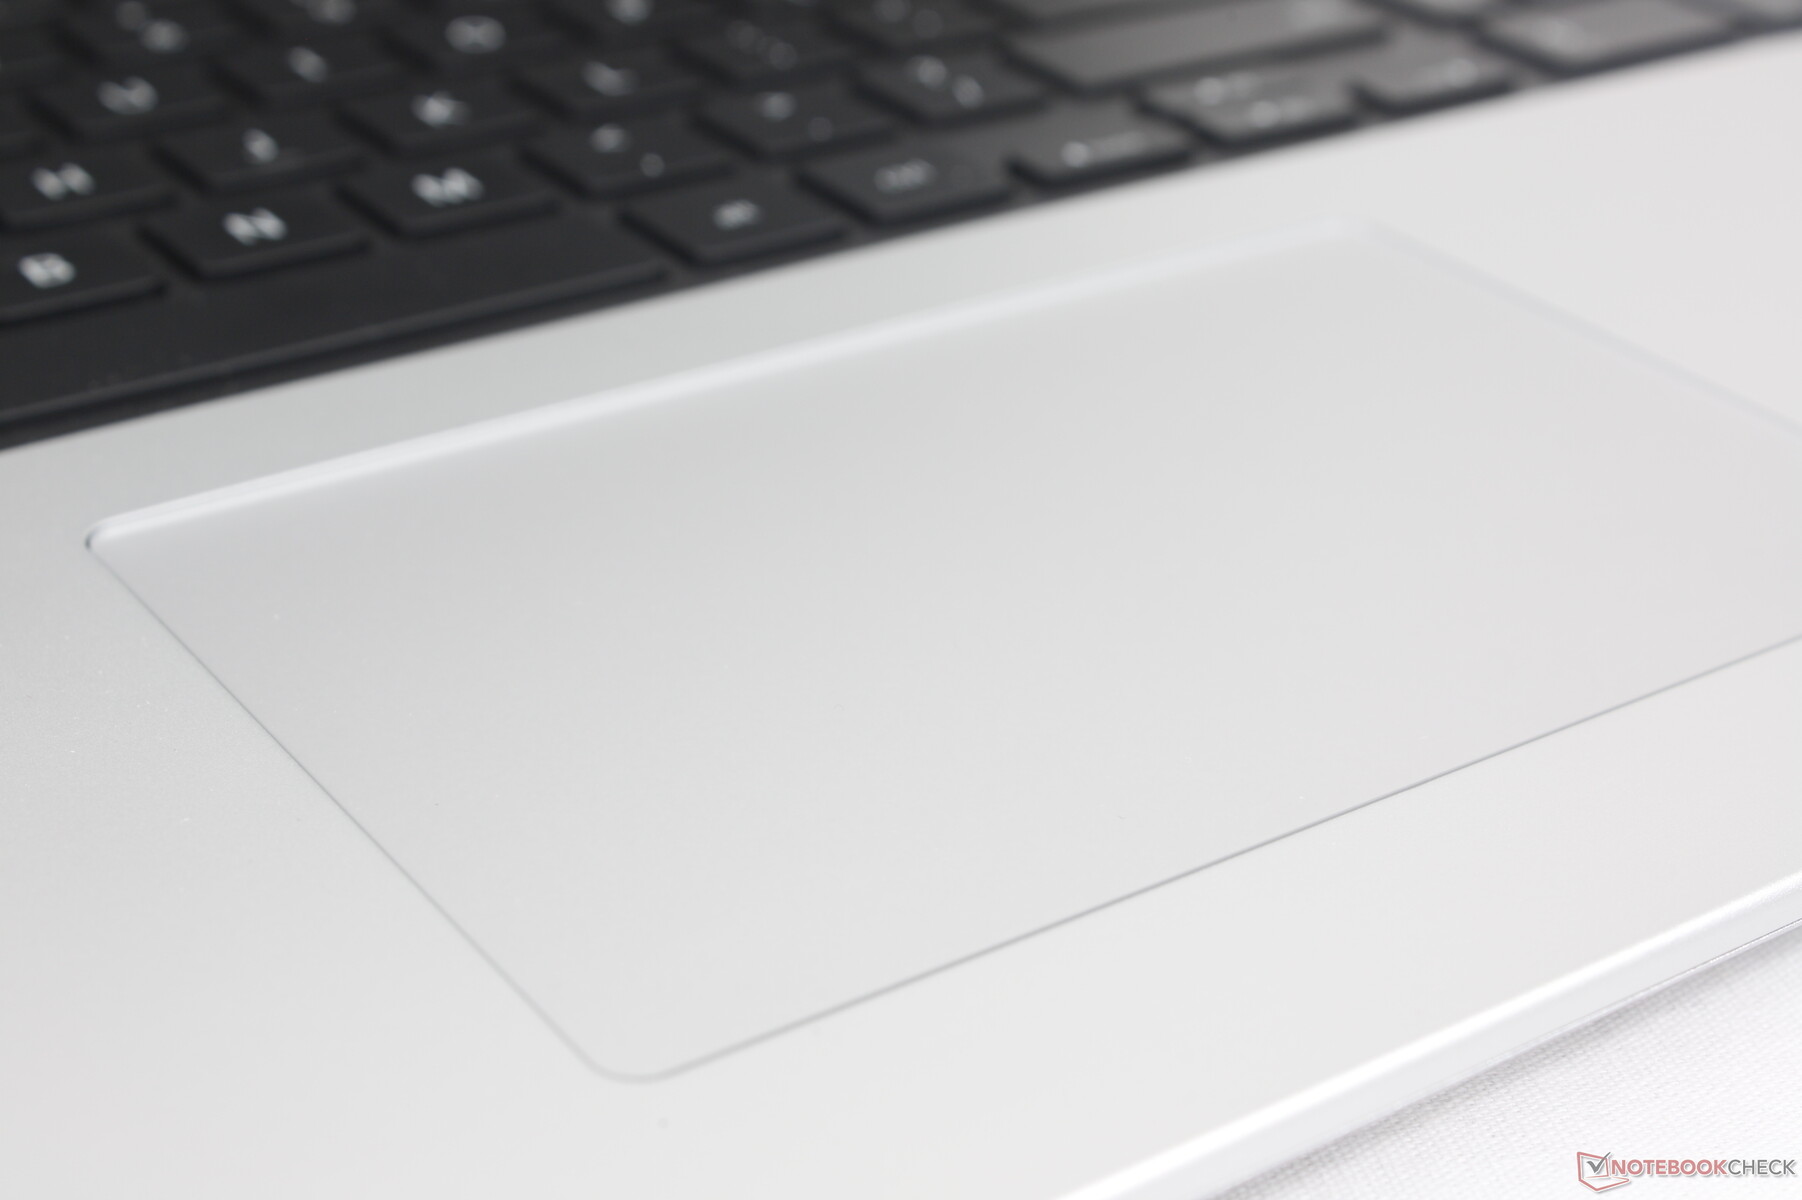
Touchpad
Com 12,3 x 7,7 cm, o clickpad do Precision é menor do que o do MSI Prestige 16 (15 x 9 cm) e quase do mesmo tamanho que o do Inspiron 16 Plus (11,5 x 8 cm). A tração é suave na superfície de vidro fosco, com apenas um pouco de aderência ao deslizar em velocidades mais lentas para maior precisão. A sensação de clicar também é boa, pois o feedback não é tão esponjoso quanto no Prestige 16, mas o ruído é um pouco mais alto.
Um aspecto exclusivo do clickpad é que ele pode ser deslocado para a esquerda ou para a direita nos apoios para as mãos, dependendo de como está instalado, conforme mostrado nas imagens abaixo. Esse é um recurso interessante para os usuários que preferem o clickpad descentralizado.

Tela - Desculpe, pessoal, mas não há OLED
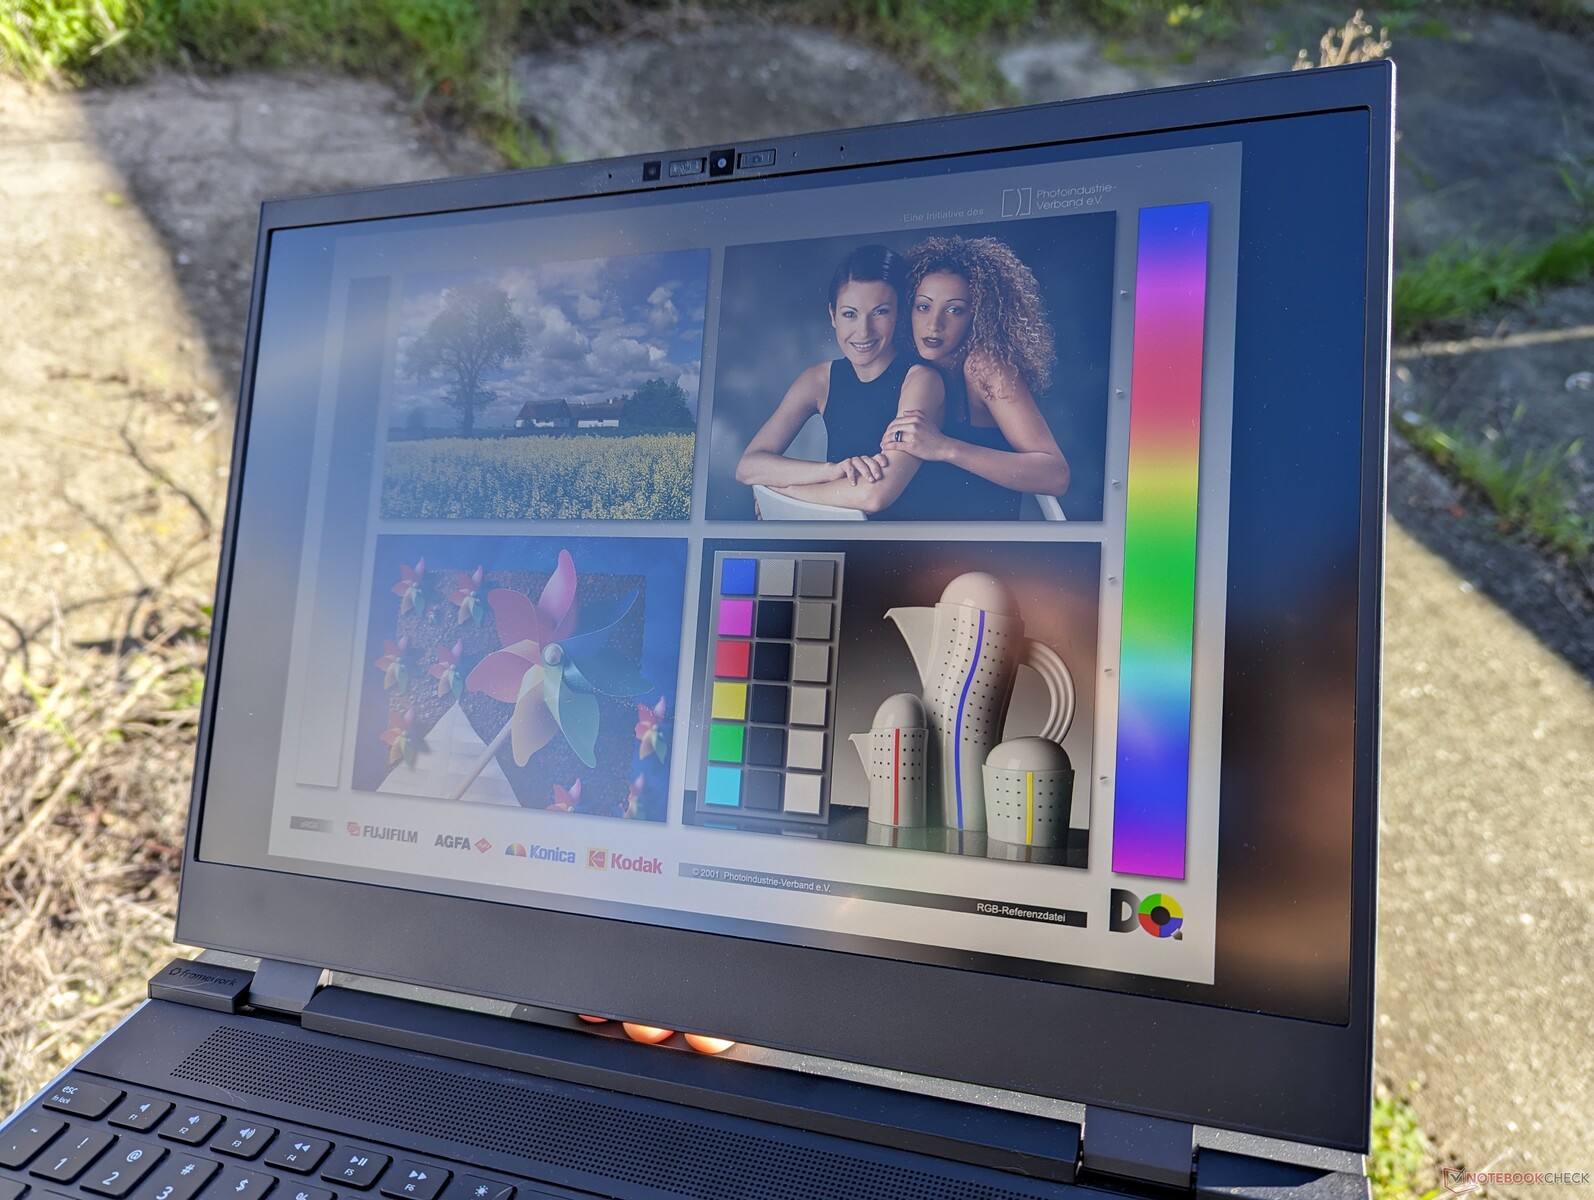
Sem absolutamente nenhuma outra opção de tela para escolher no momento em que escrevemos este artigo, temos grandes expectativas em relação ao único painel IPS que vem com todas as configurações do Laptop 16. Felizmente, podemos dizer com segurança que a Framework não economizou na tela. O painel de 2560 x 1600 oferece tempos de resposta rápidos, cores DCI-P3, luz de fundo brilhante, taxa de contraste relativamente alta e até mesmo uma taxa de atualização variável de 165 Hz com suporte para FreeSync. Consequentemente, o Laptop 16 é um dos primeiros laptops a ser fornecido com o painel BOE NE160QDM-NZ6 VRR.
No entanto, por ser um painel IPS, ele não atinge as mesmas taxas de contraste de preto intenso ou os mesmos tempos de resposta que uma alternativa OLED típica, como as do Asus VivoBook 16 da Asus. Ele também não tem suporte adequado a HDR, que está se tornando um recurso cada vez mais comum em laptops multimídia. Para um laptop que se orgulha da capacidade de atualização para o usuário final, é estranho não ver uma segunda opção de tela aqui. Mesmo assim, essa ainda é uma das melhores telas IPS de 16 polegadas que já vimos para fins de edição e jogos.

| |||||||||||||||||||||||||
iluminação: 84 %
iluminação com acumulador: 504.8 cd/m²
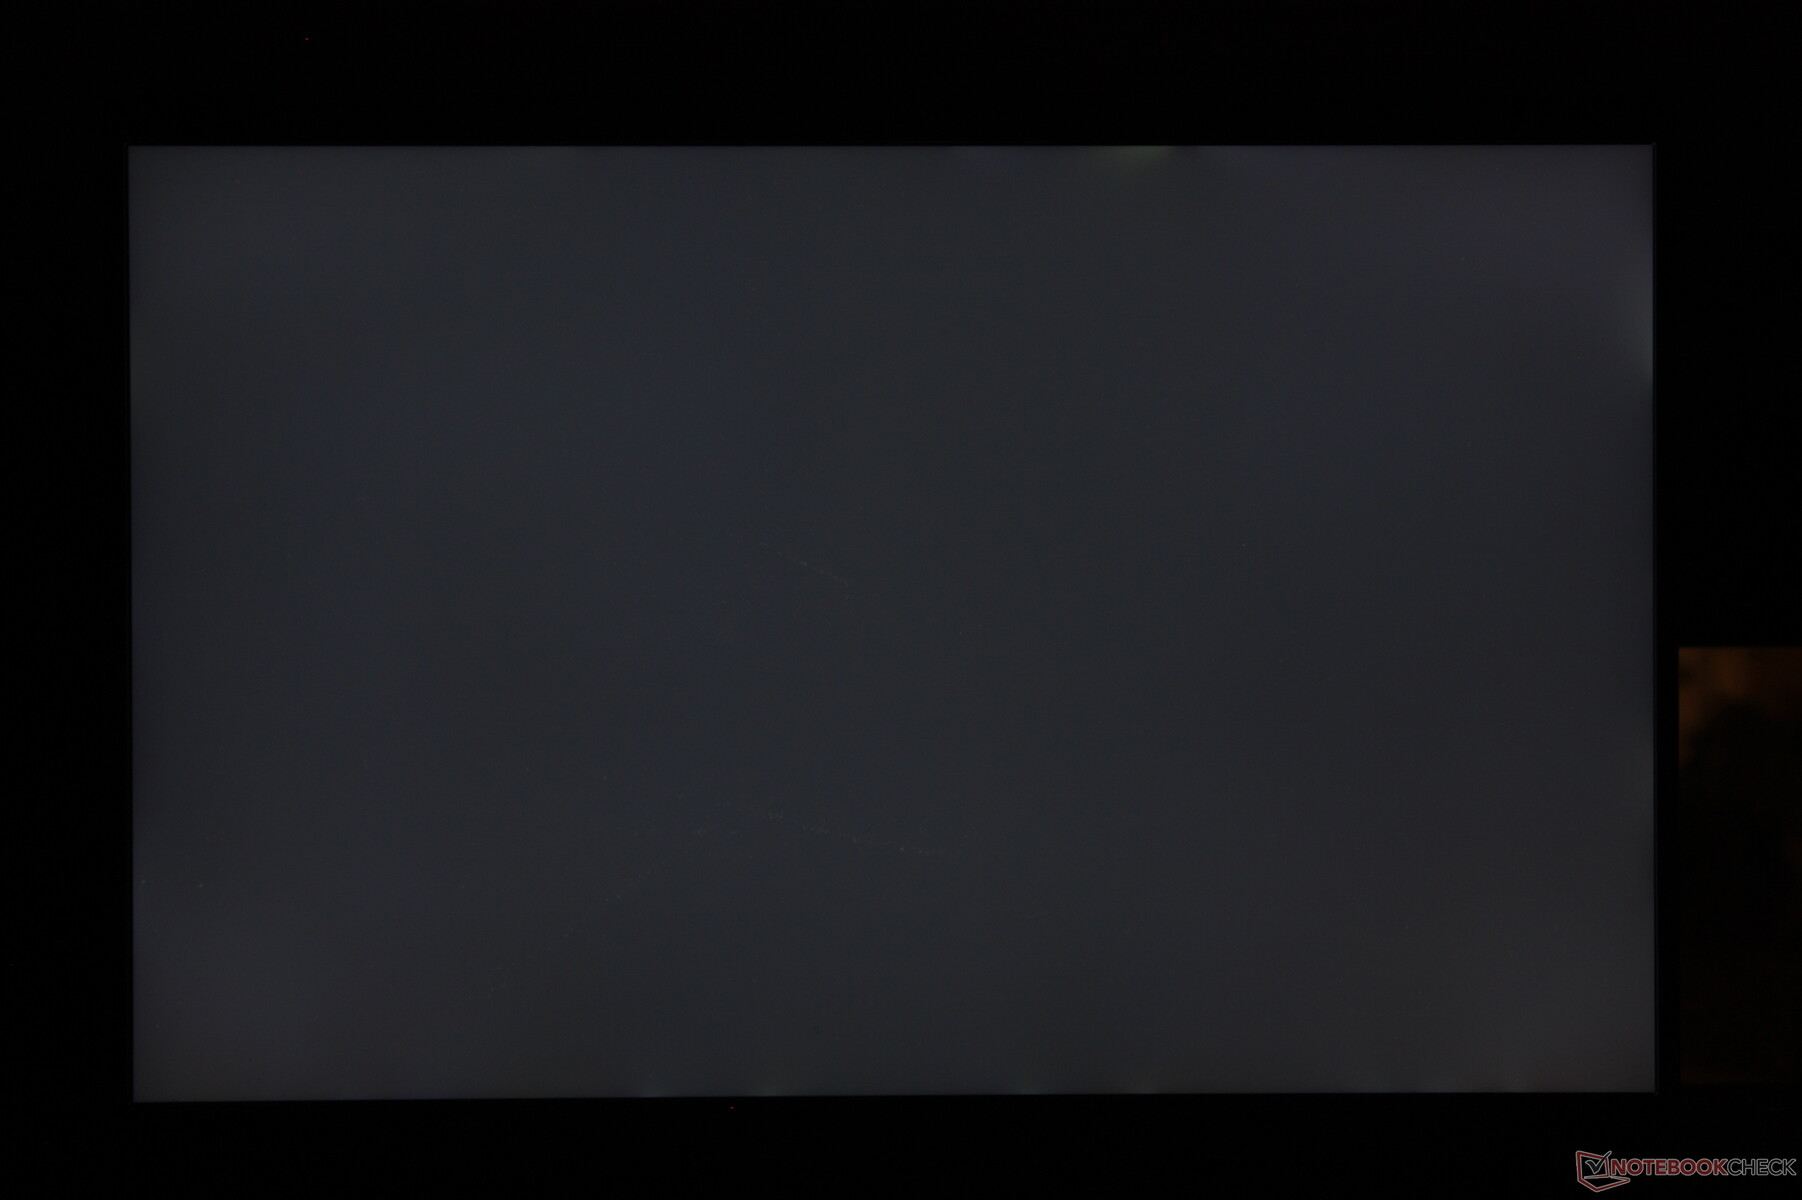
Contraste: 1231:1 (Preto: 0.41 cd/m²)
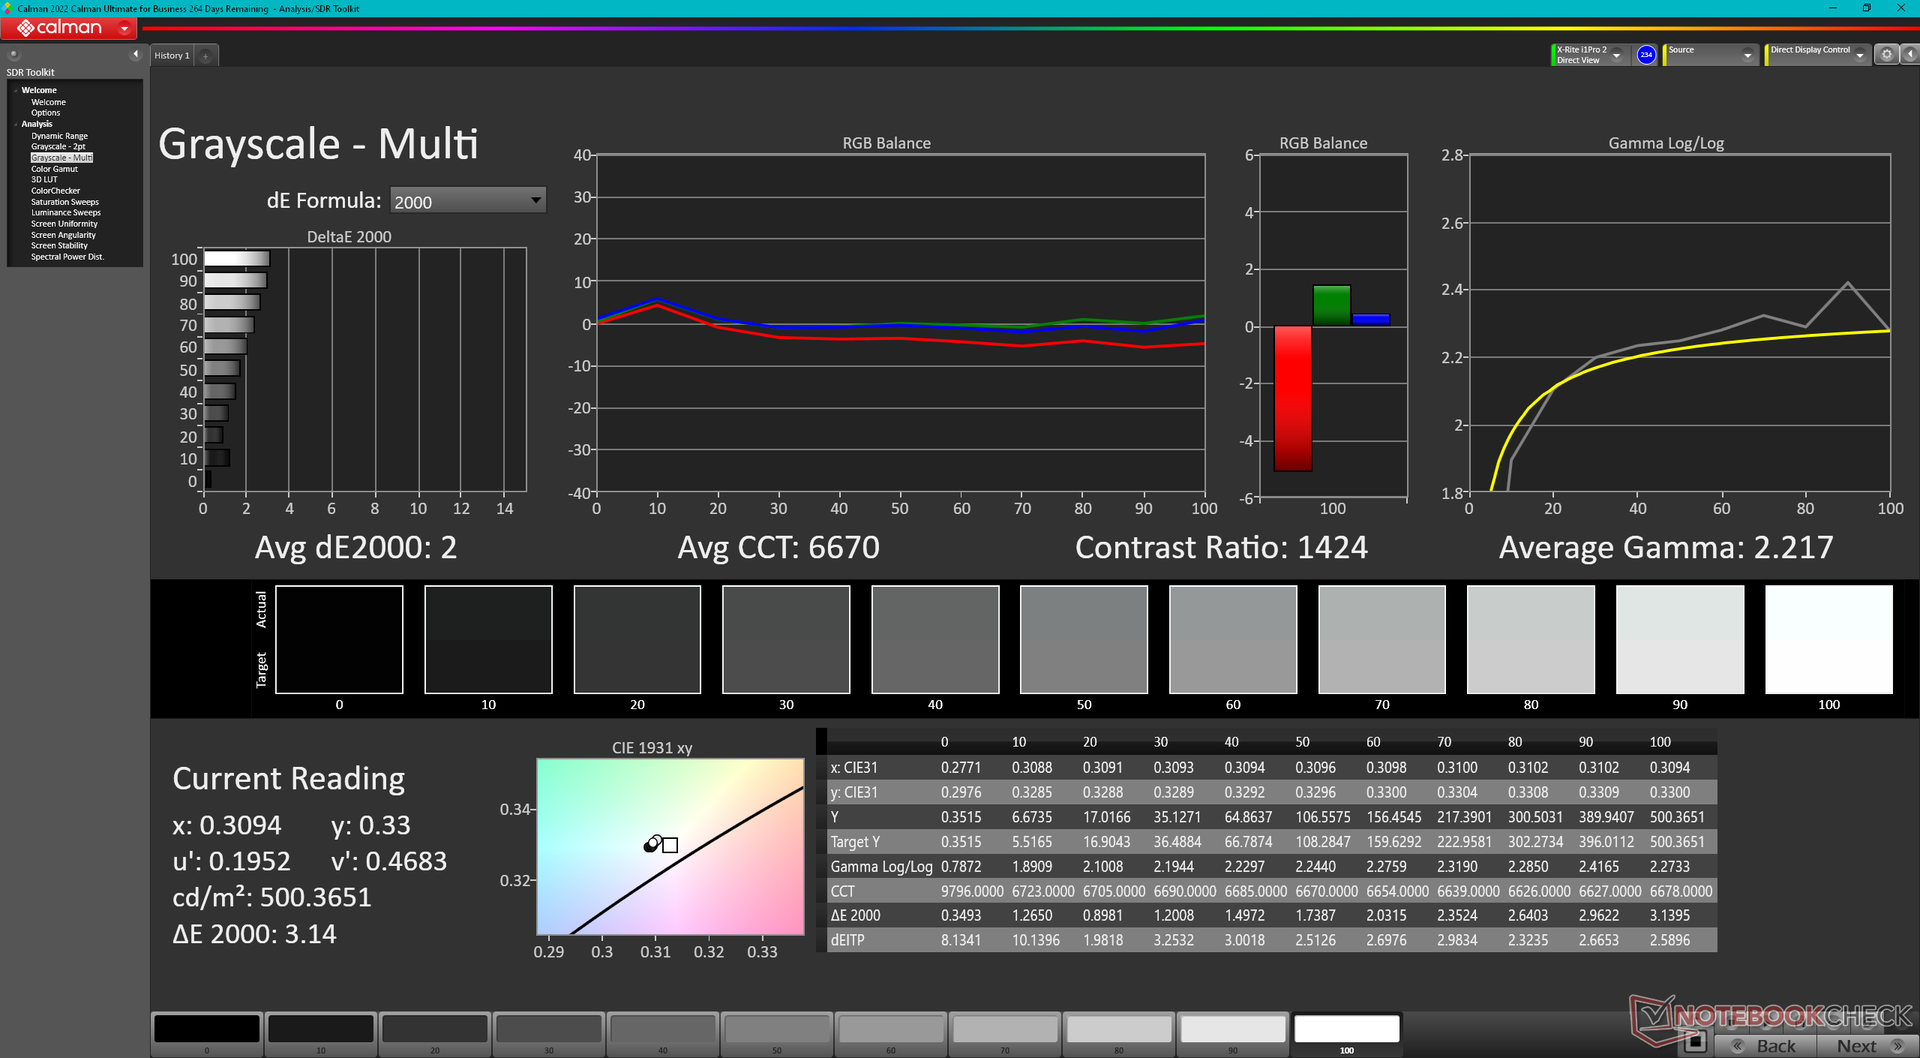
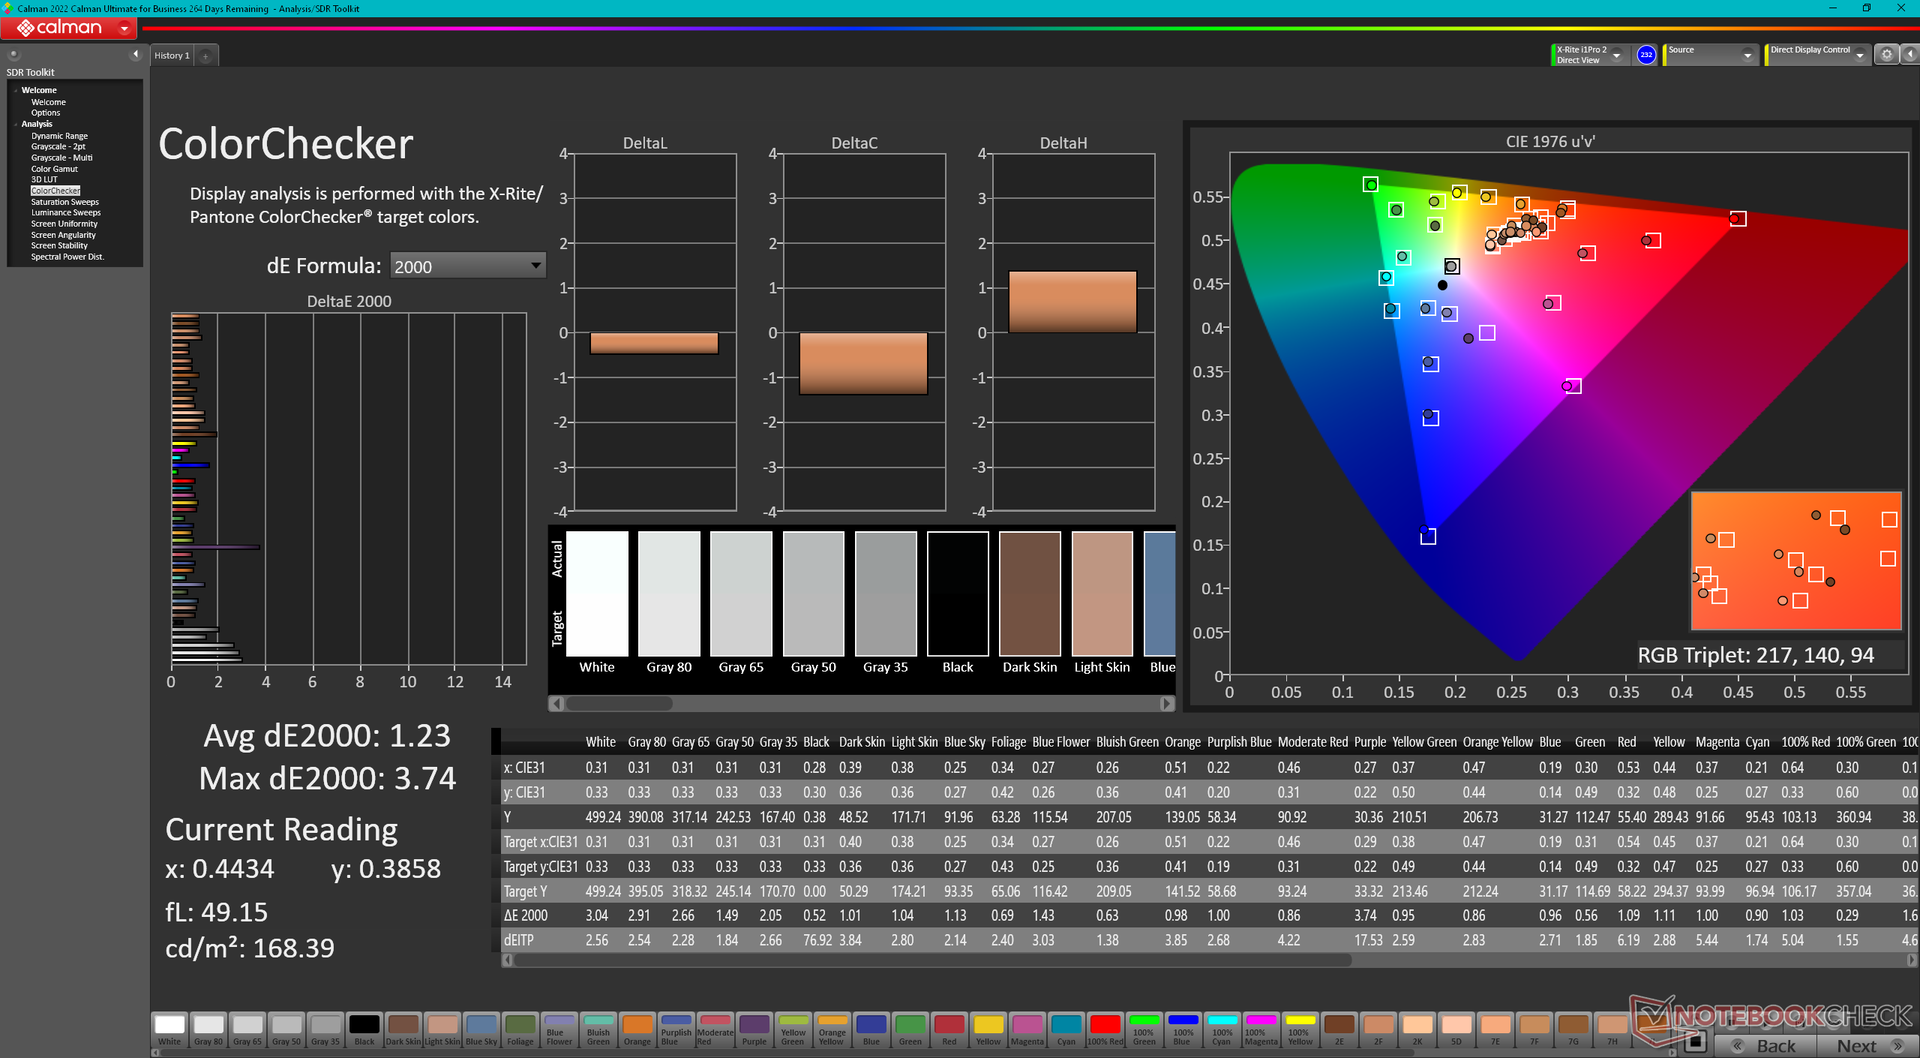
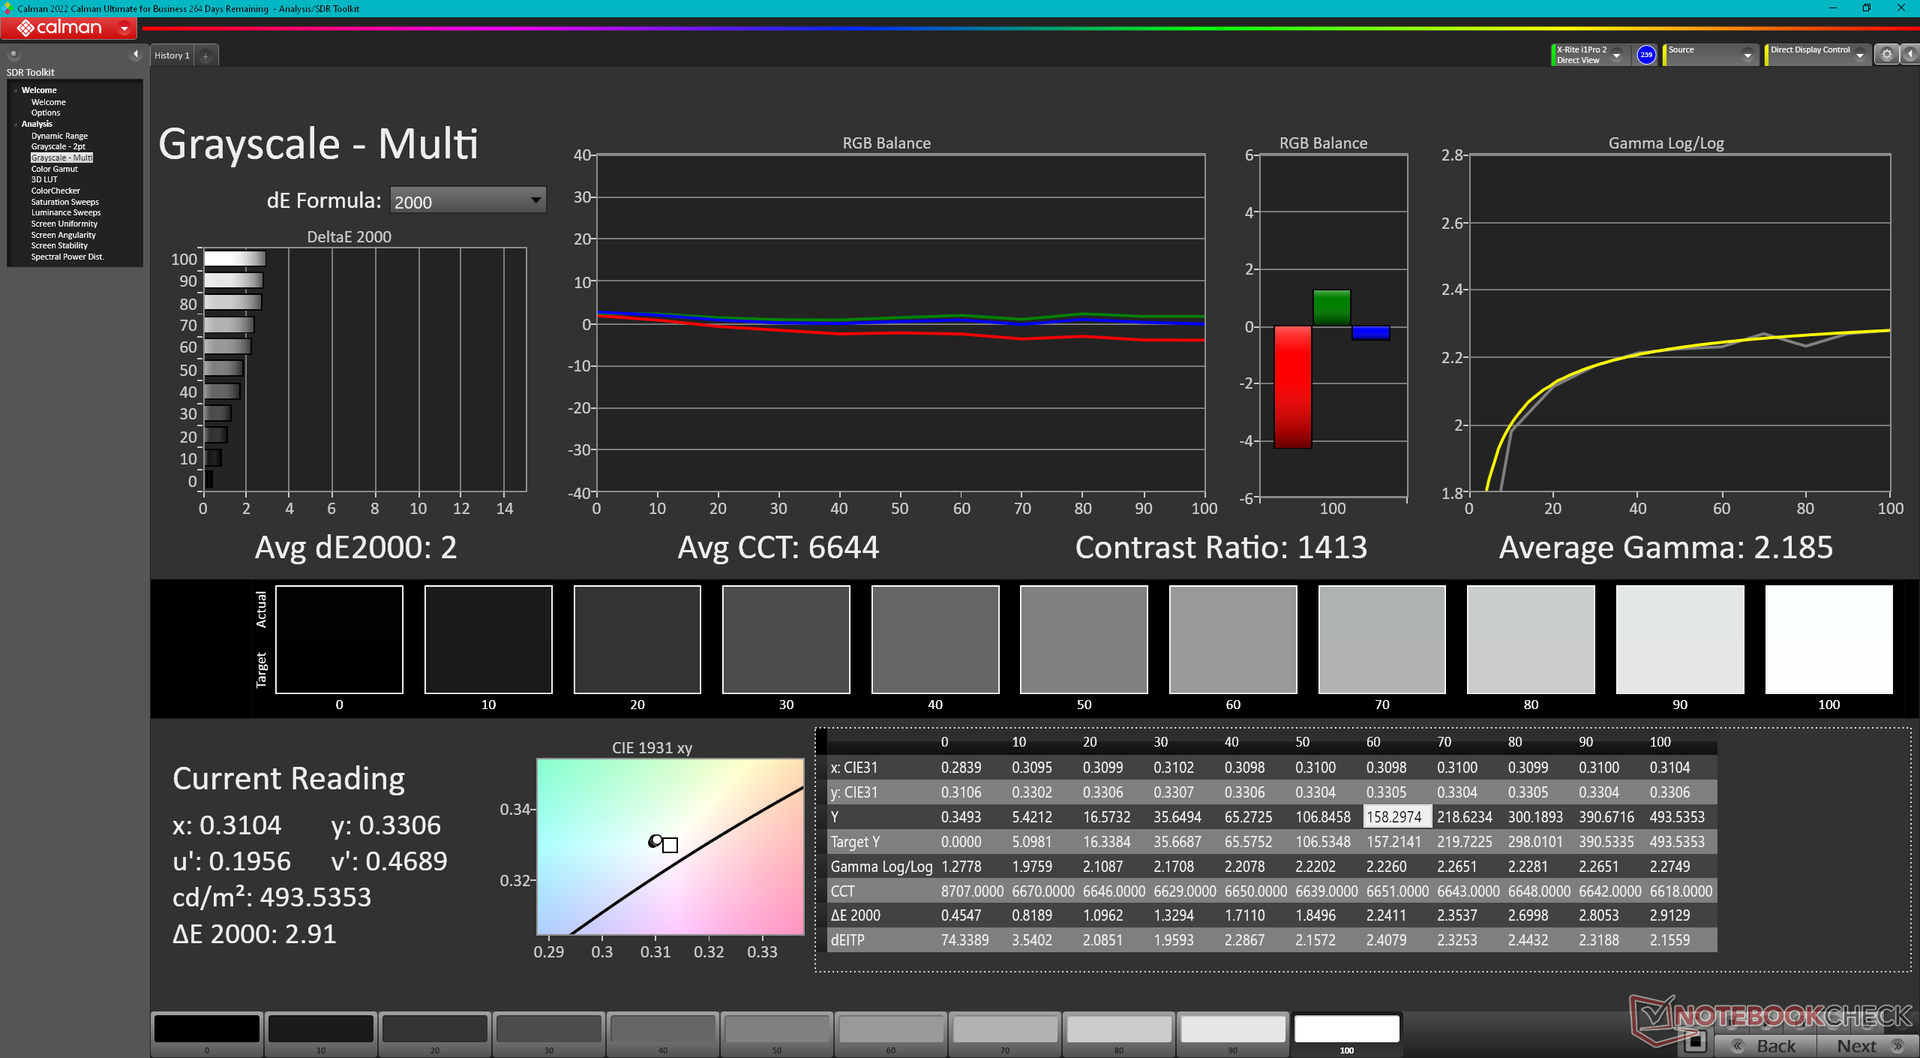
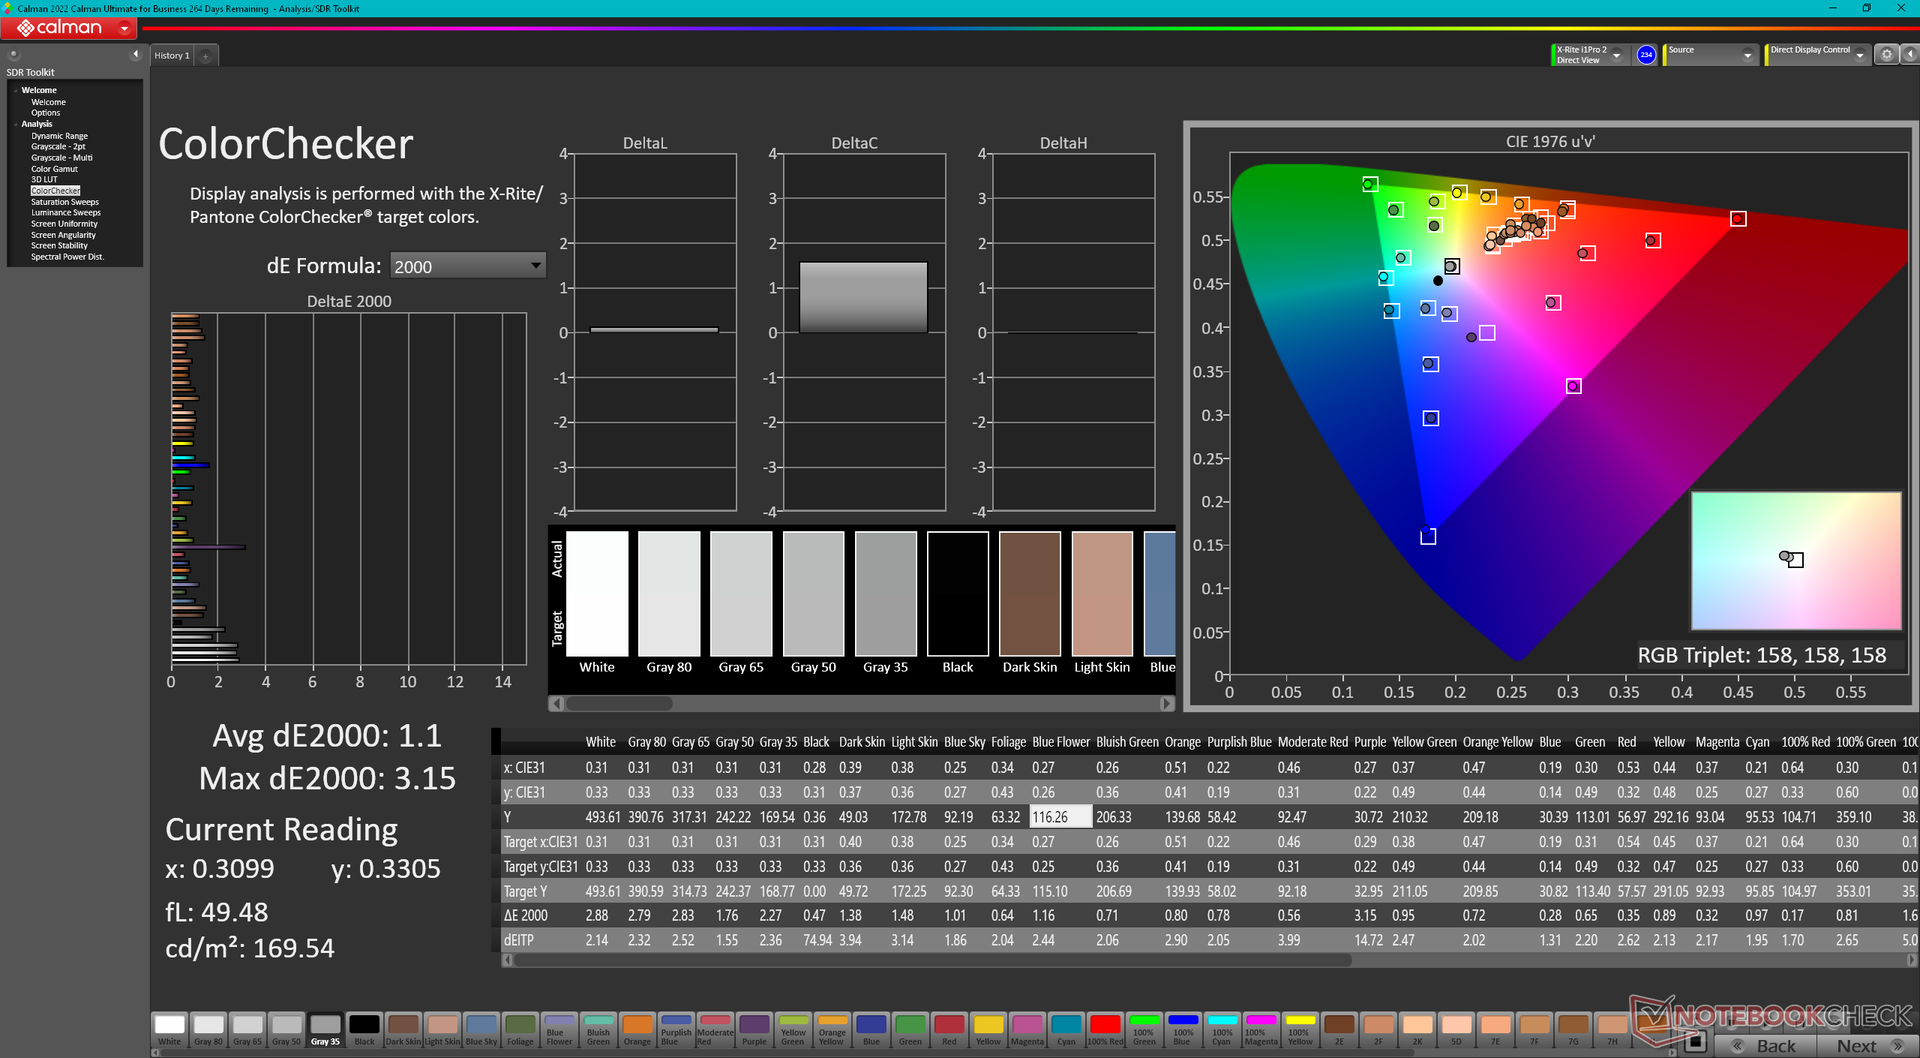
ΔE ColorChecker Calman: 1.23 | ∀{0.5-29.43 Ø4.71}
calibrated: 1.1
ΔE Greyscale Calman: 2 | ∀{0.09-98 Ø4.96}
87% AdobeRGB 1998 (Argyll 3D)
99.7% sRGB (Argyll 3D)
97.7% Display P3 (Argyll 3D)
Gamma: 2.22
CCT: 6670 K
| Framework Laptop 16 2560x1600, 16" | MSI Prestige 16 B1MG-001US AU Optronics B160QAN03.R, IPS, 2560x1600, 16" | Lenovo ThinkPad Z16 Gen 2 Samsung ATNA60YV04-0, OLED, 3840x2400, 16" | Apple MacBook Pro 16 2023 M3 Max Mini-LED, 3456x2234, 16" | Dell Inspiron 16 Plus 7630 LG Philips 160WQ2, IPS, 2560x1600, 16" | HP Spectre x360 2-in-1 16-f1075ng AU Optronics AUO50A3, IPS, 3072x1920, 16" | |
|---|---|---|---|---|---|---|
| Display | -1% | 4% | 2% | -15% | -11% | |
| Display P3 Coverage (%) | 97.7 | 96.7 -1% | 99.7 2% | 99.2 2% | 70.1 -28% | 75.6 -23% |
| sRGB Coverage (%) | 99.7 | 99.8 0% | 100 0% | 99.6 0% | 100.2 1% | |
| AdobeRGB 1998 Coverage (%) | 87 | 84.6 -3% | 96.7 11% | 72.3 -17% | 77.2 -11% | |
| Response Times | -219% | 85% | -322% | -127% | -202% | |
| Response Time Grey 50% / Grey 80% * (ms) | 14.6 ? | 49.4 ? -238% | 1.86 ? 87% | 66.9 ? -358% | 35 ? -140% | 52 ? -256% |
| Response Time Black / White * (ms) | 11.3 ? | 33.9 ? -200% | 1.89 ? 83% | 43.6 ? -286% | 24.2 ? -114% | 28 ? -148% |
| PWM Frequency (Hz) | 60 ? | 14877 | ||||
| Screen | -70% | -6% | 15% | -50% | -120% | |
| Brightness middle (cd/m²) | 504.8 | 473.6 -6% | 390.1 -23% | 630 25% | 299.4 -41% | 425 -16% |
| Brightness (cd/m²) | 490 | 456 -7% | 393 -20% | 604 23% | 290 -41% | 406 -17% |
| Brightness Distribution (%) | 84 | 87 4% | 97 15% | 94 12% | 92 10% | 78 -7% |
| Black Level * (cd/m²) | 0.41 | 0.19 54% | 0.21 49% | 0.24 41% | ||
| Contrast (:1) | 1231 | 2493 103% | 1426 16% | 1771 44% | ||
| Colorchecker dE 2000 * | 1.23 | 5.9 -380% | 1.41 -15% | 1.2 2% | 4.25 -246% | 5.8 -372% |
| Colorchecker dE 2000 max. * | 3.74 | 9.37 -151% | 3.43 8% | 2.8 25% | 6.71 -79% | 11.03 -195% |
| Colorchecker dE 2000 calibrated * | 1.1 | 0.89 19% | 0.52 53% | 4.16 -278% | ||
| Greyscale dE 2000 * | 2 | 7.3 -265% | 2 -0% | 1.9 5% | 5.5 -175% | 7.57 -279% |
| Gamma | 2.22 99% | 1.9 116% | 2.22 99% | 2.29 96% | 2.35 94% | 6600 0% |
| CCT | 6670 97% | 7260 90% | 6324 103% | 6812 95% | 6368 102% | |
| Média Total (Programa/Configurações) | -97% /
-77% | 28% /
13% | -102% /
-61% | -64% /
-54% | -111% /
-108% |
* ... menor é melhor
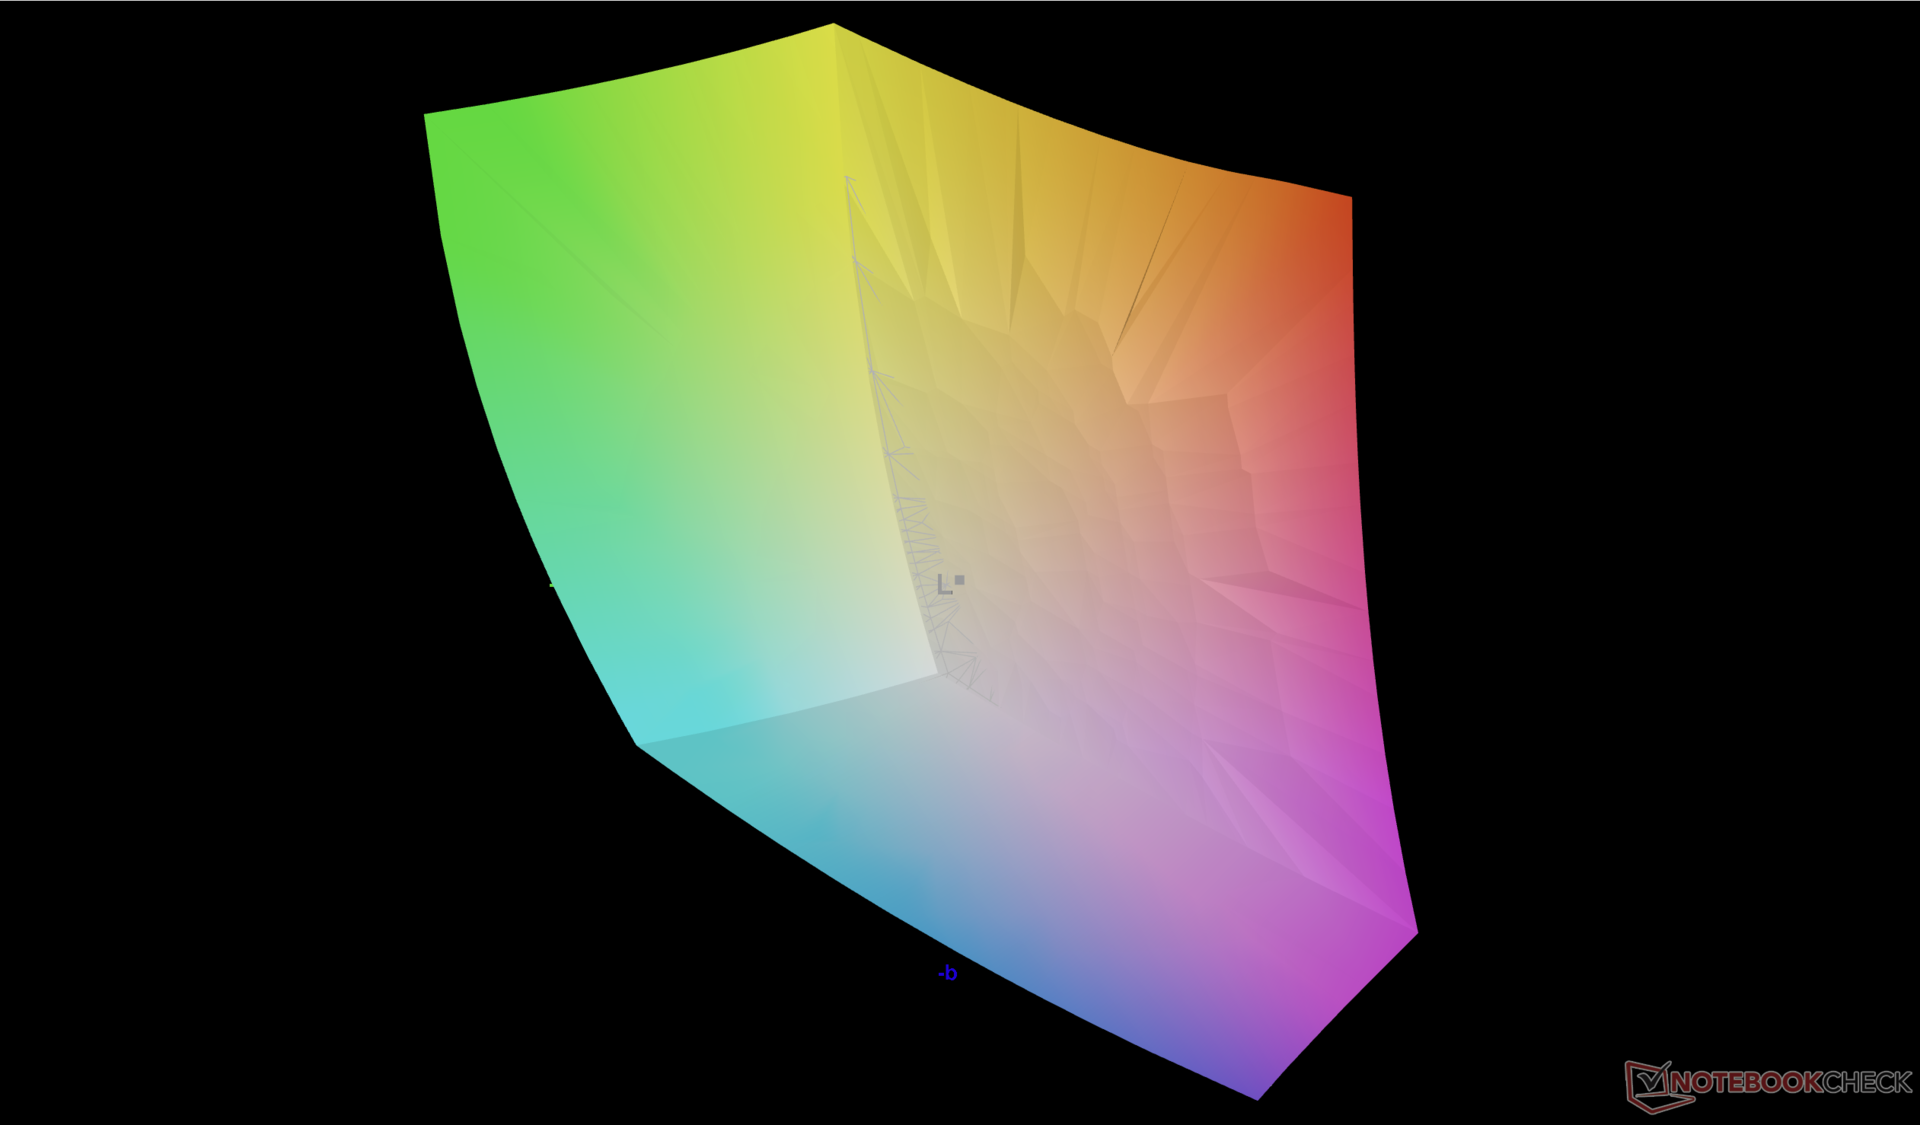
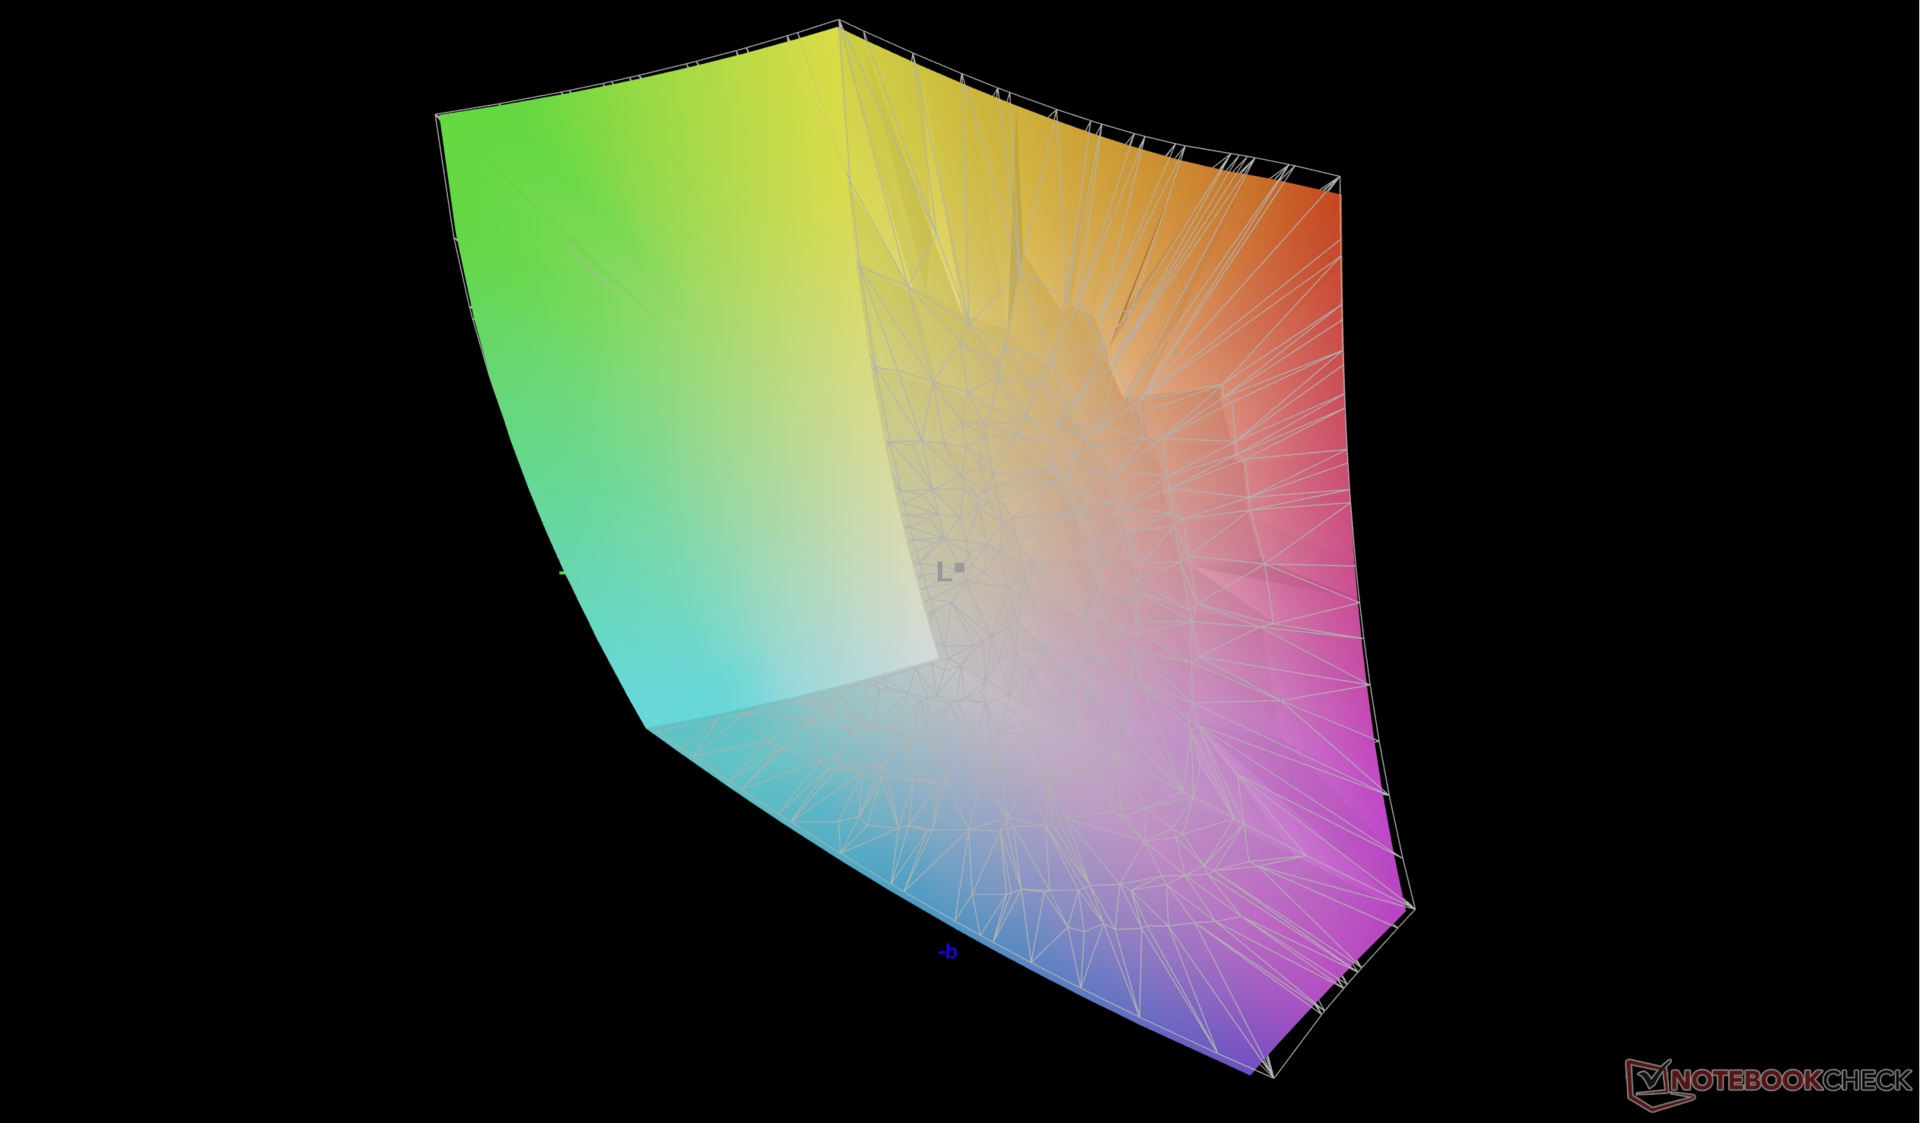
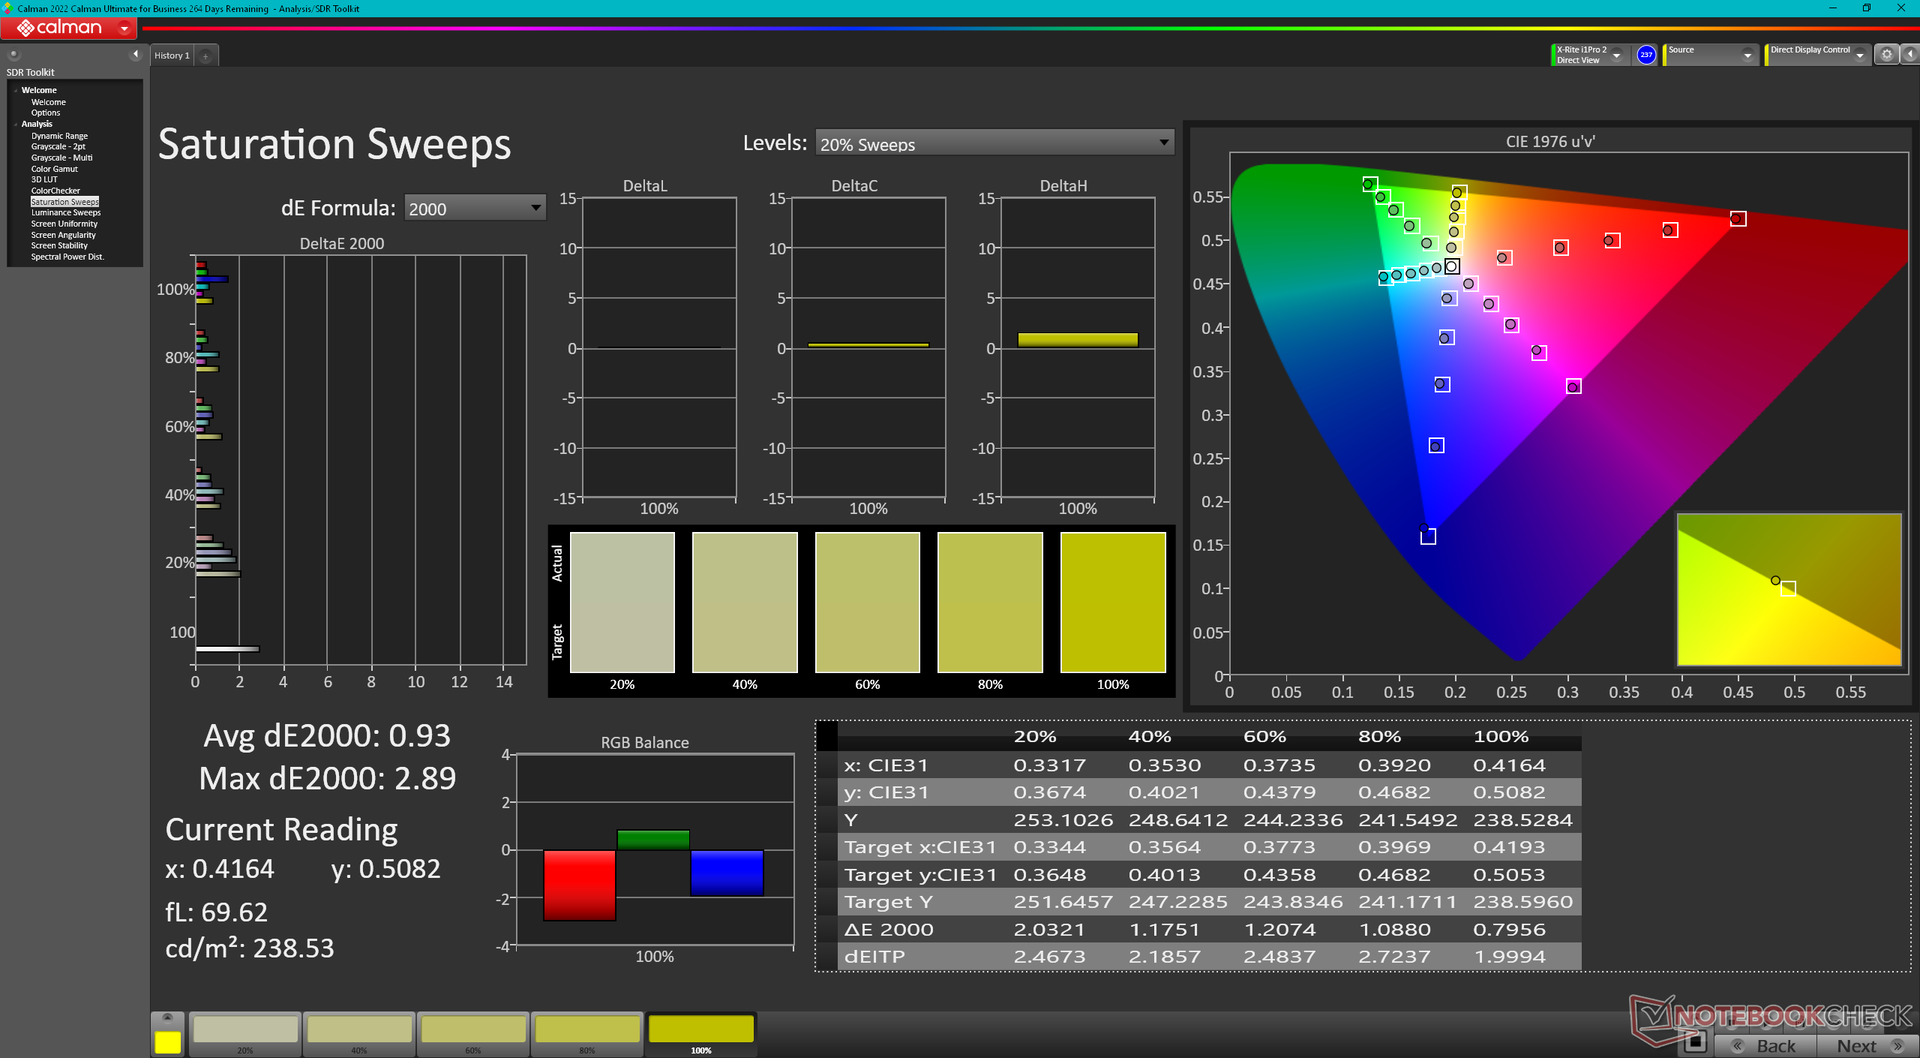
O monitor vem bem calibrado em relação ao padrão sRGB, embora o painel cubra 100% do DCI-P3. Calibrar o monitor por conta própria não melhoraria seus valores médios de deltaE em margens perceptíveis e, portanto, uma calibração para o usuário final não será necessária para a maioria das pessoas.

Exibir tempos de resposta
| ↔ Tempo de resposta preto para branco | ||
|---|---|---|
| 11.3 ms ... ascensão ↗ e queda ↘ combinadas | ↗ 6.1 ms ascensão | 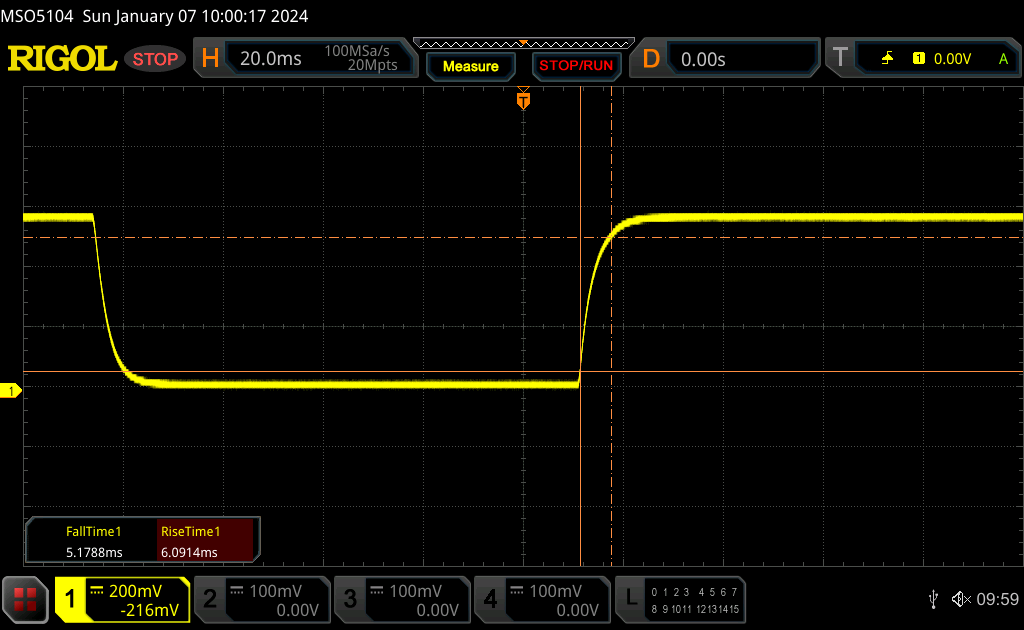 |
| ↘ 5.2 ms queda | ||
| A tela mostra boas taxas de resposta em nossos testes, mas pode ser muito lenta para jogadores competitivos. Em comparação, todos os dispositivos testados variam de 0.1 (mínimo) a 240 (máximo) ms. » 31 % de todos os dispositivos são melhores. Isso significa que o tempo de resposta medido é melhor que a média de todos os dispositivos testados (19.8 ms). | ||
| ↔ Tempo de resposta 50% cinza a 80% cinza | ||
| 14.6 ms ... ascensão ↗ e queda ↘ combinadas | ↗ 7.1 ms ascensão | 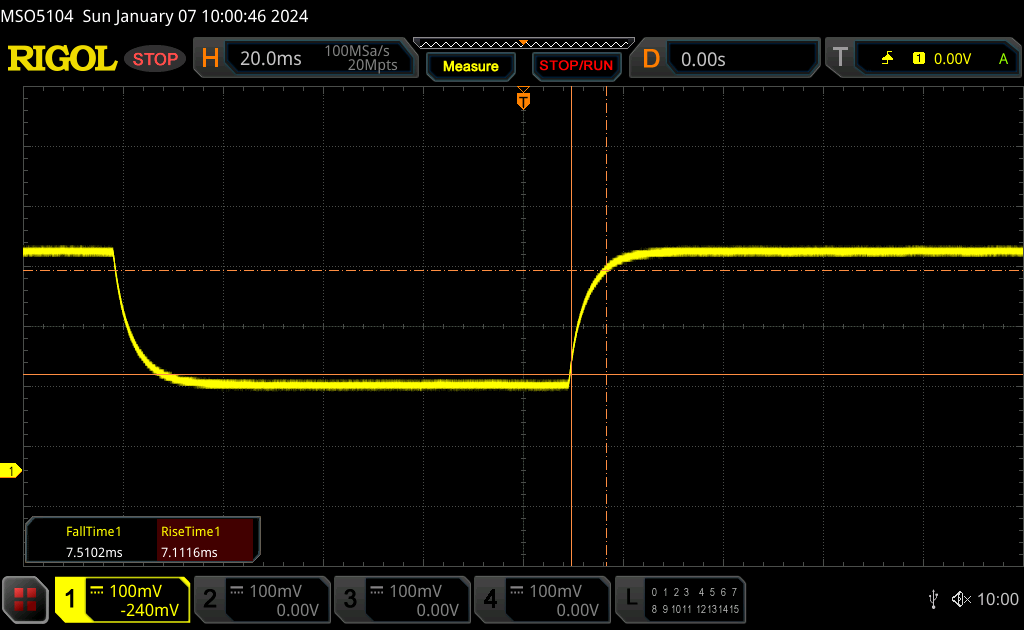 |
| ↘ 7.5 ms queda | ||
| A tela mostra boas taxas de resposta em nossos testes, mas pode ser muito lenta para jogadores competitivos. Em comparação, todos os dispositivos testados variam de 0.165 (mínimo) a 636 (máximo) ms. » 29 % de todos os dispositivos são melhores. Isso significa que o tempo de resposta medido é melhor que a média de todos os dispositivos testados (31 ms). | ||
Cintilação da tela / PWM (modulação por largura de pulso)
| Tela tremeluzindo / PWM não detectado | 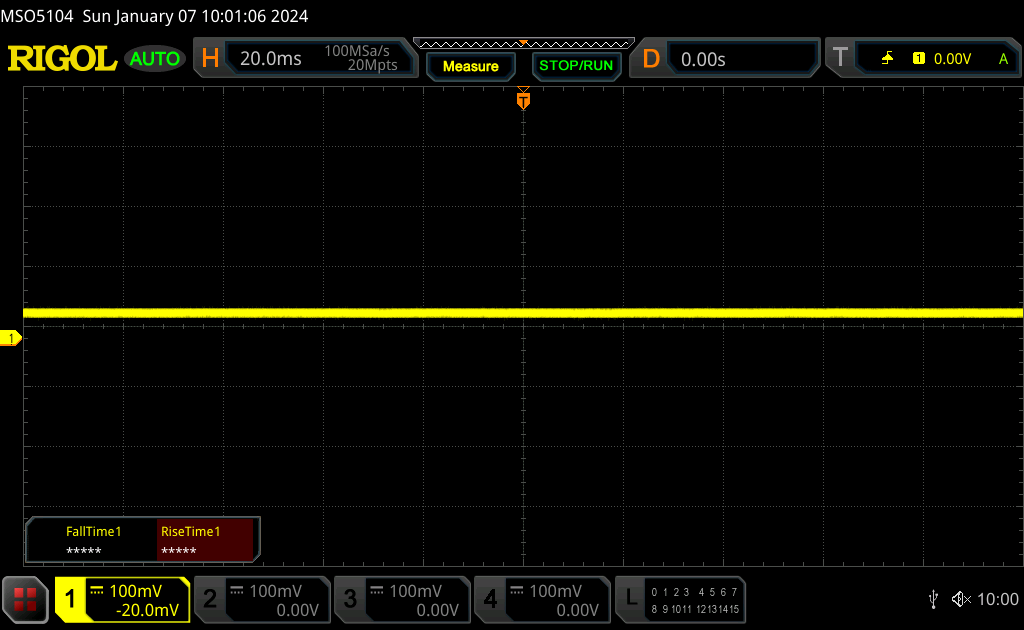 | ||
[pwm_comparison] Em comparação: 52 % de todos os dispositivos testados não usam PWM para escurecer a tela. Se PWM foi detectado, uma média de 7757 (mínimo: 5 - máximo: 343500) Hz foi medida. | |||
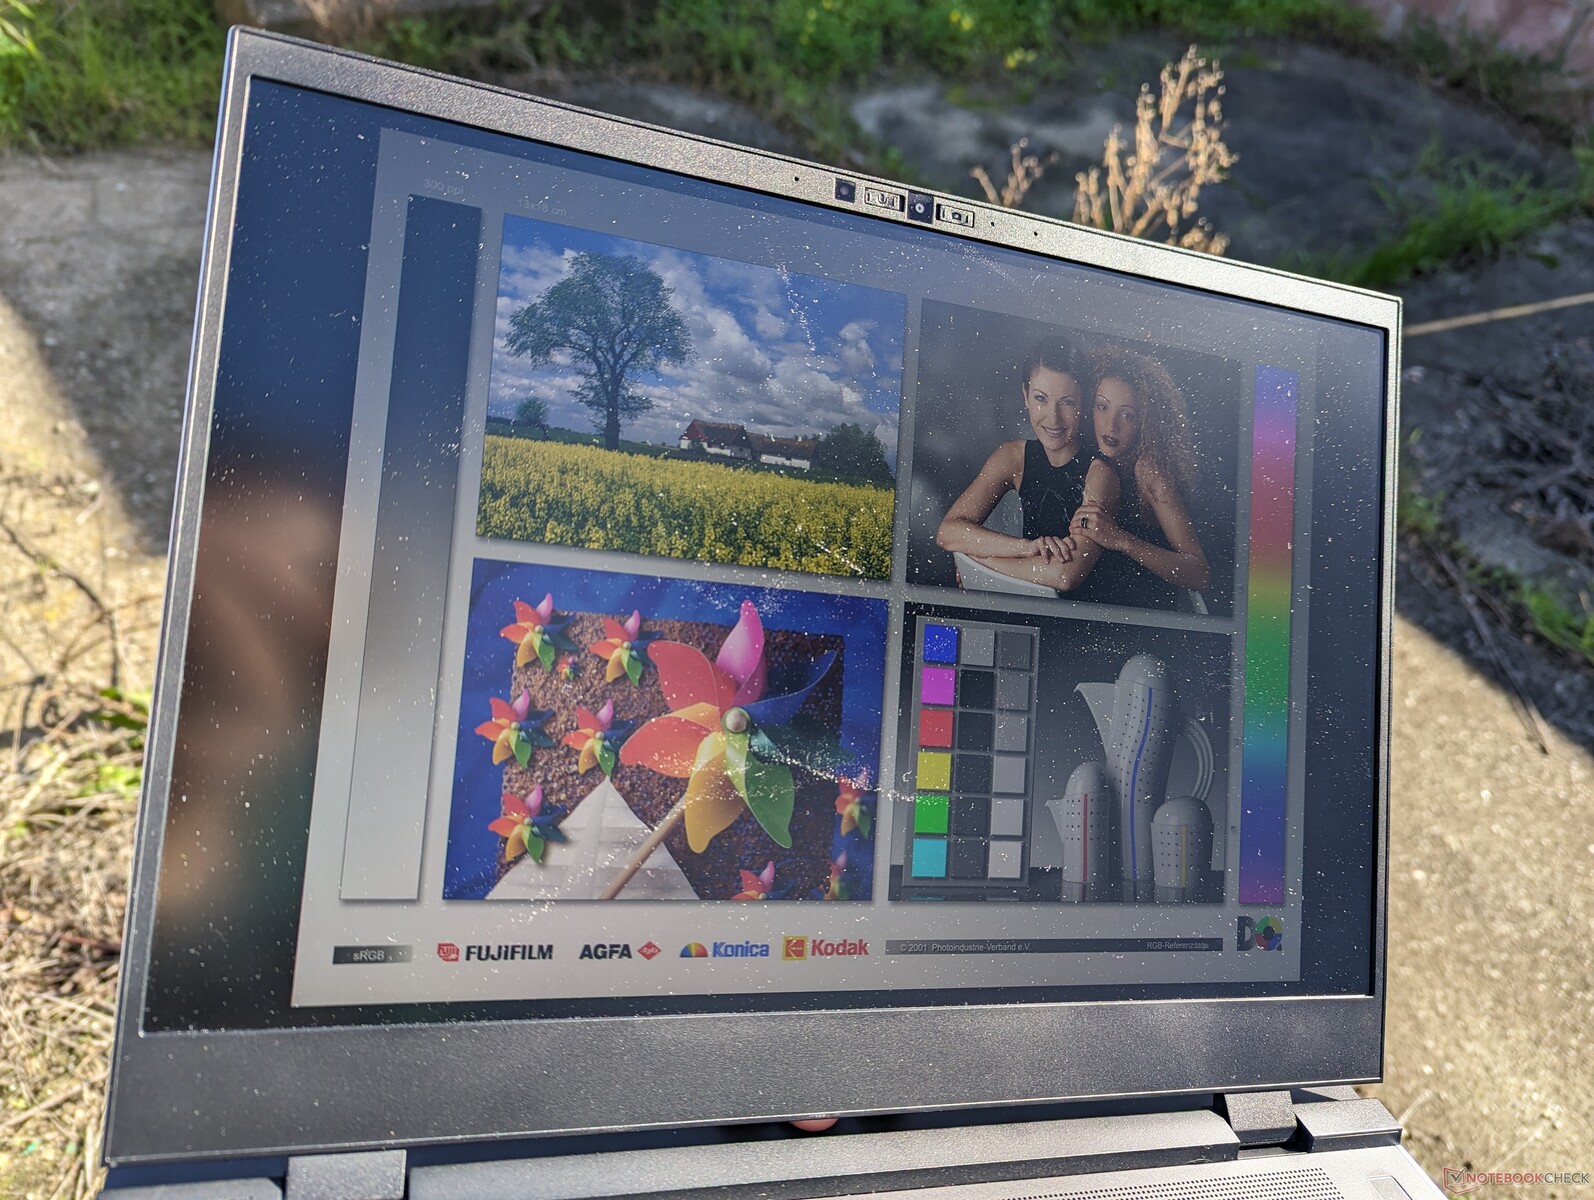
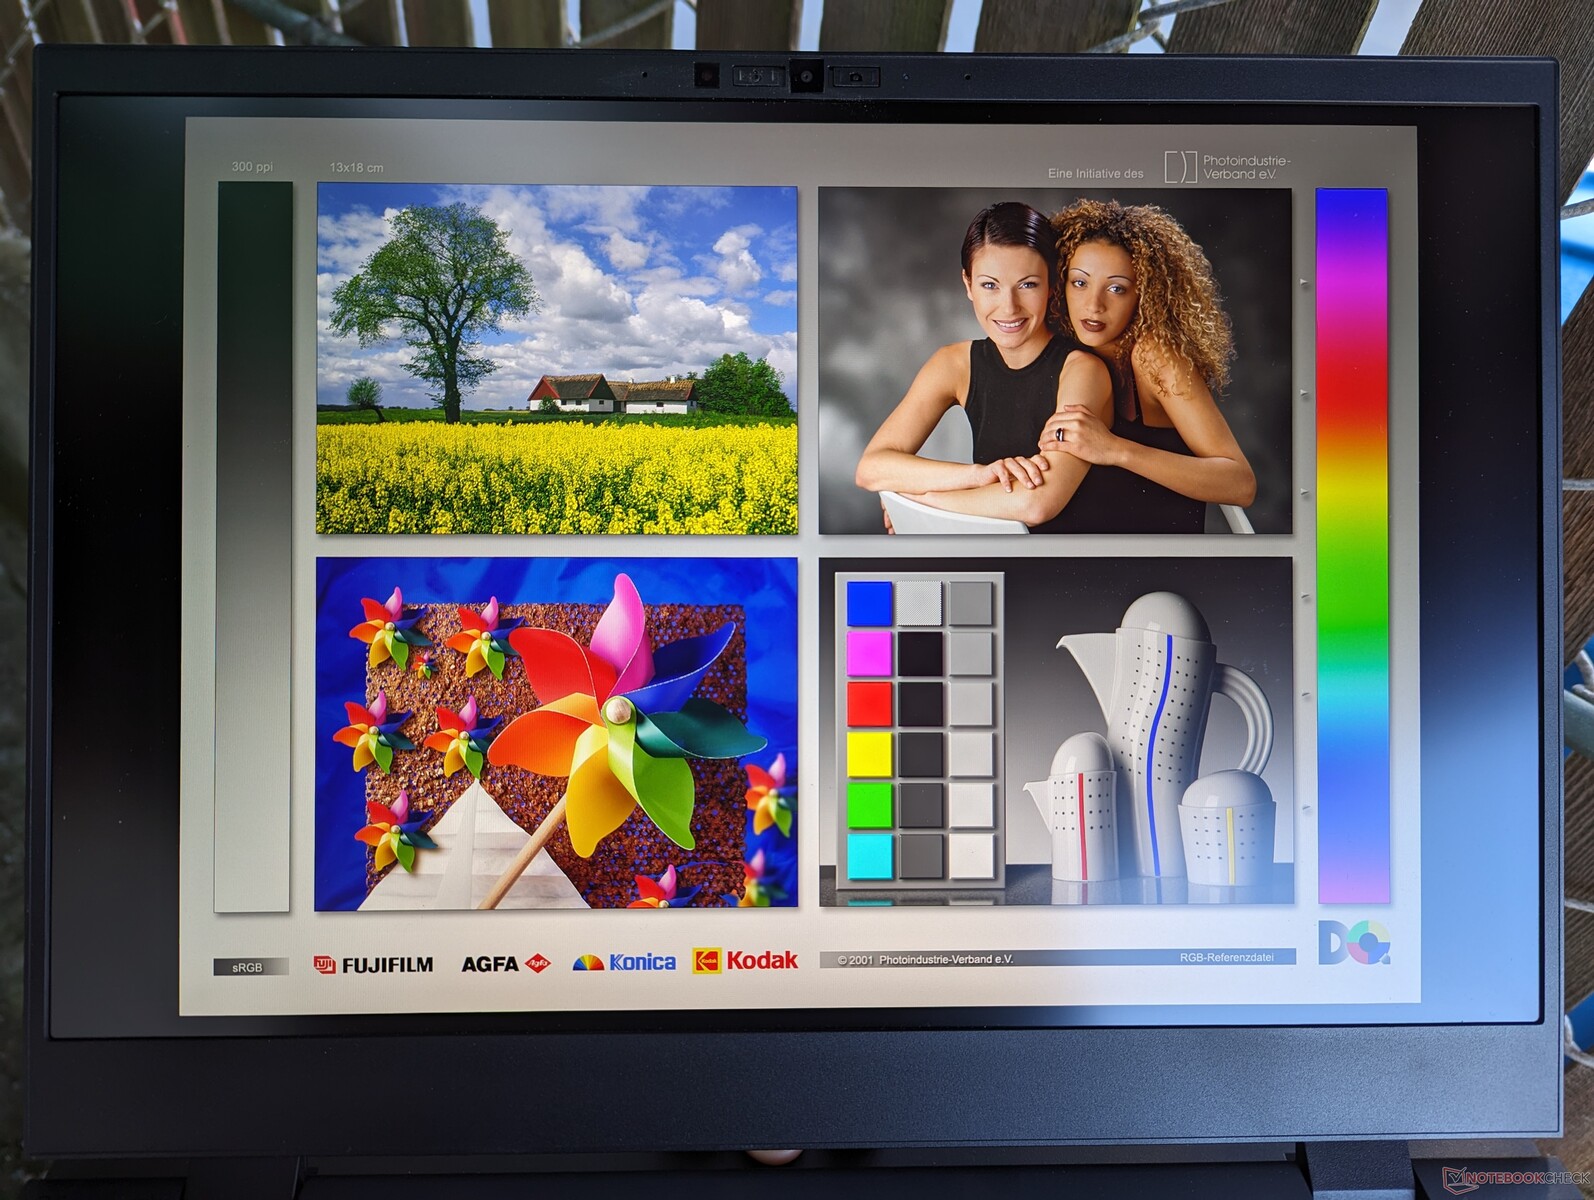
Com 500 nits, a tela é mais brilhante do que a de muitos outros laptops multimídia, incluindo até mesmo os painéis OLED do ThinkPad Z16 Gen 2 ou MSI Stealth 16. O alto brilho e o painel fosco facilitam a visualização da tela em condições externas.
Desempenho - Não é necessário Intel ou Nvidia
Condições de teste
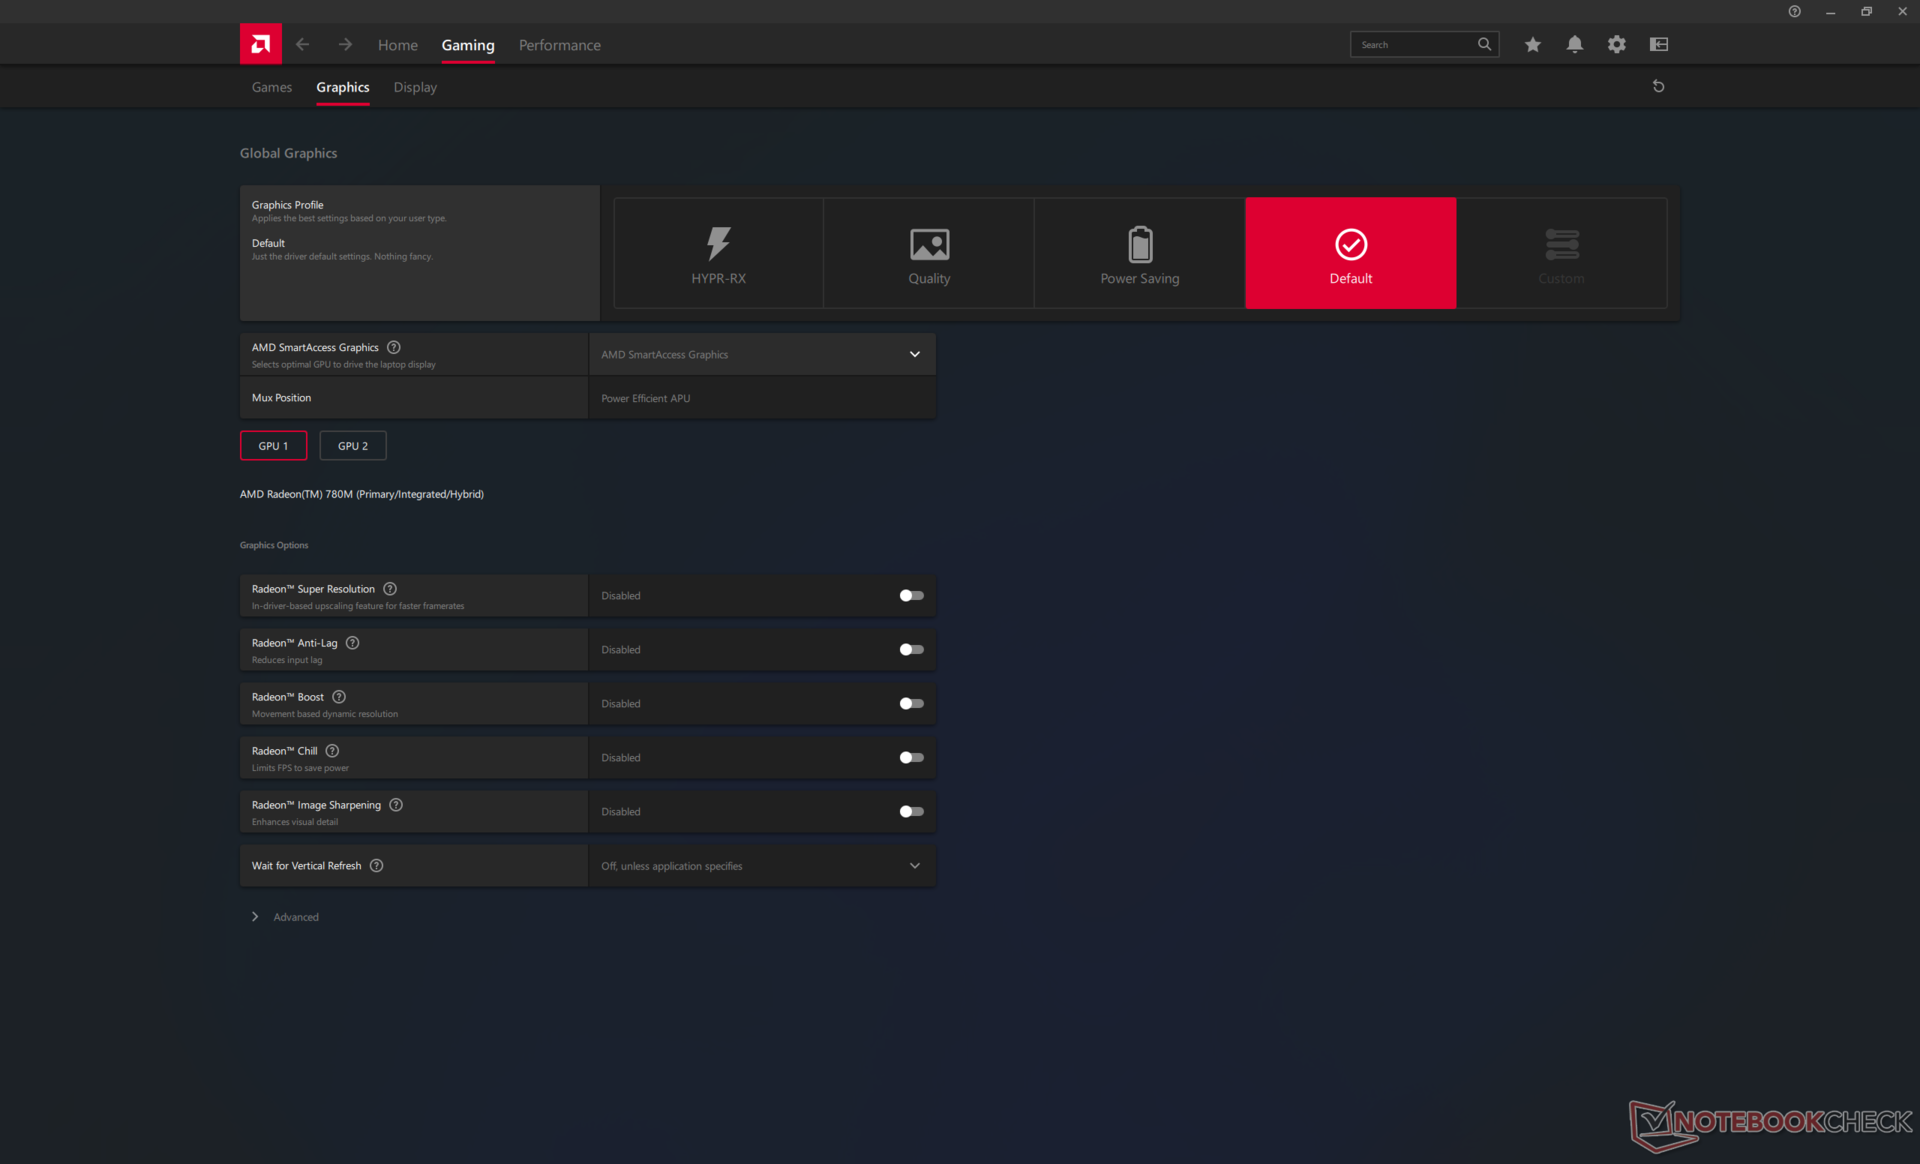
Colocamos o Windows no modo Desempenho e o AMD Adrenalin no modo Padrão antes de executar os benchmarks abaixo. O SmartAccess Graphics é a solução MUX da AMD para alternar automaticamente entre a iGPU e a dGPU, dependendo do aplicativo. O problema é que, ao contrário dos notebooks com tecnologia GeForce, o SmartAccess Graphics não oferece um modo "somente dGPU" ou "somente iGPU" e, portanto, sua experiência gráfica depende totalmente da alternância automática. O sistema precisa congelar por alguns segundos sempre que detectar um aplicativo com muita GPU, o que pode ser incômodo ao realizar várias tarefas entre diferentes janelas. A implementação de um modo "somente dGPU" teria resolvido esse problema.
Processador
O Ryzen 9 7940HS é comumente encontrado em laptops rápidos para multimídia ou jogos, como o Asus ROG Zephyrus G14 ou TUF Gaming A17. Ele concorre diretamente com o processador de 13ª geração Core i7-13700H e, portanto, os dois processadores são praticamente comparáveis.
A Framework oferece o Ryzen 7 7840HS em configurações menores do Laptop 16. Com base em nossa experiência com o Lenovo Legion Slim 7 16APH8no entanto, o Ryzen 7 7840HS está essencialmente no mesmo nível do Ryzen 9 7940HS, apesar do que as diferenças de preço e a convenção de nomes possam sugerir. Se o senhor não precisar do desempenho extra de 5% do Ryzen 9, poderá economizar centenas de dólares optando pelo Ryzen 7.
É uma pena que a Framework não ofereça o Ryzen 9 Pro 7940HS, o que teria tornado o Laptop 16 mais atraente para os profissionais.
Cinebench R15 Multi Loop
Cinebench R23: Multi Core | Single Core
Cinebench R20: CPU (Multi Core) | CPU (Single Core)
Cinebench R15: CPU Multi 64Bit | CPU Single 64Bit
Blender: v2.79 BMW27 CPU
7-Zip 18.03: 7z b 4 | 7z b 4 -mmt1
Geekbench 5.5: Multi-Core | Single-Core
HWBOT x265 Benchmark v2.2: 4k Preset
LibreOffice : 20 Documents To PDF
R Benchmark 2.5: Overall mean
* ... menor é melhor
AIDA64: FP32 Ray-Trace | FPU Julia | CPU SHA3 | CPU Queen | FPU SinJulia | FPU Mandel | CPU AES | CPU ZLib | FP64 Ray-Trace | CPU PhotoWorxx
| Performance rating | |
| Framework Laptop 16 | |
| Média AMD Ryzen 9 7940HS | |
| Lenovo ThinkPad Z16 Gen 2 | |
| MSI Prestige 16 B1MG-001US | |
| Dell Inspiron 16 Plus 7630 | |
| HP Spectre x360 2-in-1 16-f1075ng | |
| AIDA64 / FP32 Ray-Trace | |
| Lenovo ThinkPad Z16 Gen 2 | |
| Framework Laptop 16 | |
| Média AMD Ryzen 9 7940HS (25226 - 29109, n=10) | |
| MSI Prestige 16 B1MG-001US | |
| Dell Inspiron 16 Plus 7630 | |
| HP Spectre x360 2-in-1 16-f1075ng | |
| AIDA64 / FPU Julia | |
| Lenovo ThinkPad Z16 Gen 2 | |
| Média AMD Ryzen 9 7940HS (106512 - 123214, n=10) | |
| Framework Laptop 16 | |
| MSI Prestige 16 B1MG-001US | |
| Dell Inspiron 16 Plus 7630 | |
| HP Spectre x360 2-in-1 16-f1075ng | |
| AIDA64 / CPU SHA3 | |
| Lenovo ThinkPad Z16 Gen 2 | |
| Framework Laptop 16 | |
| Média AMD Ryzen 9 7940HS (4566 - 5119, n=10) | |
| MSI Prestige 16 B1MG-001US | |
| Dell Inspiron 16 Plus 7630 | |
| HP Spectre x360 2-in-1 16-f1075ng | |
| AIDA64 / CPU Queen | |
| Lenovo ThinkPad Z16 Gen 2 | |
| Framework Laptop 16 | |
| Média AMD Ryzen 9 7940HS (118174 - 124783, n=10) | |
| Dell Inspiron 16 Plus 7630 | |
| MSI Prestige 16 B1MG-001US | |
| HP Spectre x360 2-in-1 16-f1075ng | |
| AIDA64 / FPU SinJulia | |
| Lenovo ThinkPad Z16 Gen 2 | |
| Média AMD Ryzen 9 7940HS (14663 - 15551, n=10) | |
| Framework Laptop 16 | |
| MSI Prestige 16 B1MG-001US | |
| Dell Inspiron 16 Plus 7630 | |
| HP Spectre x360 2-in-1 16-f1075ng | |
| AIDA64 / FPU Mandel | |
| Lenovo ThinkPad Z16 Gen 2 | |
| Média AMD Ryzen 9 7940HS (56839 - 66238, n=10) | |
| Framework Laptop 16 | |
| MSI Prestige 16 B1MG-001US | |
| Dell Inspiron 16 Plus 7630 | |
| HP Spectre x360 2-in-1 16-f1075ng | |
| AIDA64 / CPU AES | |
| Framework Laptop 16 | |
| Média AMD Ryzen 9 7940HS (86309 - 171350, n=10) | |
| HP Spectre x360 2-in-1 16-f1075ng | |
| Lenovo ThinkPad Z16 Gen 2 | |
| MSI Prestige 16 B1MG-001US | |
| Dell Inspiron 16 Plus 7630 | |
| AIDA64 / CPU ZLib | |
| Lenovo ThinkPad Z16 Gen 2 | |
| Média AMD Ryzen 9 7940HS (866 - 1152, n=10) | |
| MSI Prestige 16 B1MG-001US | |
| Framework Laptop 16 | |
| Dell Inspiron 16 Plus 7630 | |
| HP Spectre x360 2-in-1 16-f1075ng | |
| AIDA64 / FP64 Ray-Trace | |
| Lenovo ThinkPad Z16 Gen 2 | |
| Média AMD Ryzen 9 7940HS (13175 - 15675, n=10) | |
| Framework Laptop 16 | |
| MSI Prestige 16 B1MG-001US | |
| Dell Inspiron 16 Plus 7630 | |
| HP Spectre x360 2-in-1 16-f1075ng | |
| AIDA64 / CPU PhotoWorxx | |
| MSI Prestige 16 B1MG-001US | |
| Framework Laptop 16 | |
| Dell Inspiron 16 Plus 7630 | |
| Lenovo ThinkPad Z16 Gen 2 | |
| Média AMD Ryzen 9 7940HS (22477 - 41567, n=10) | |
| HP Spectre x360 2-in-1 16-f1075ng | |
Desempenho do sistema
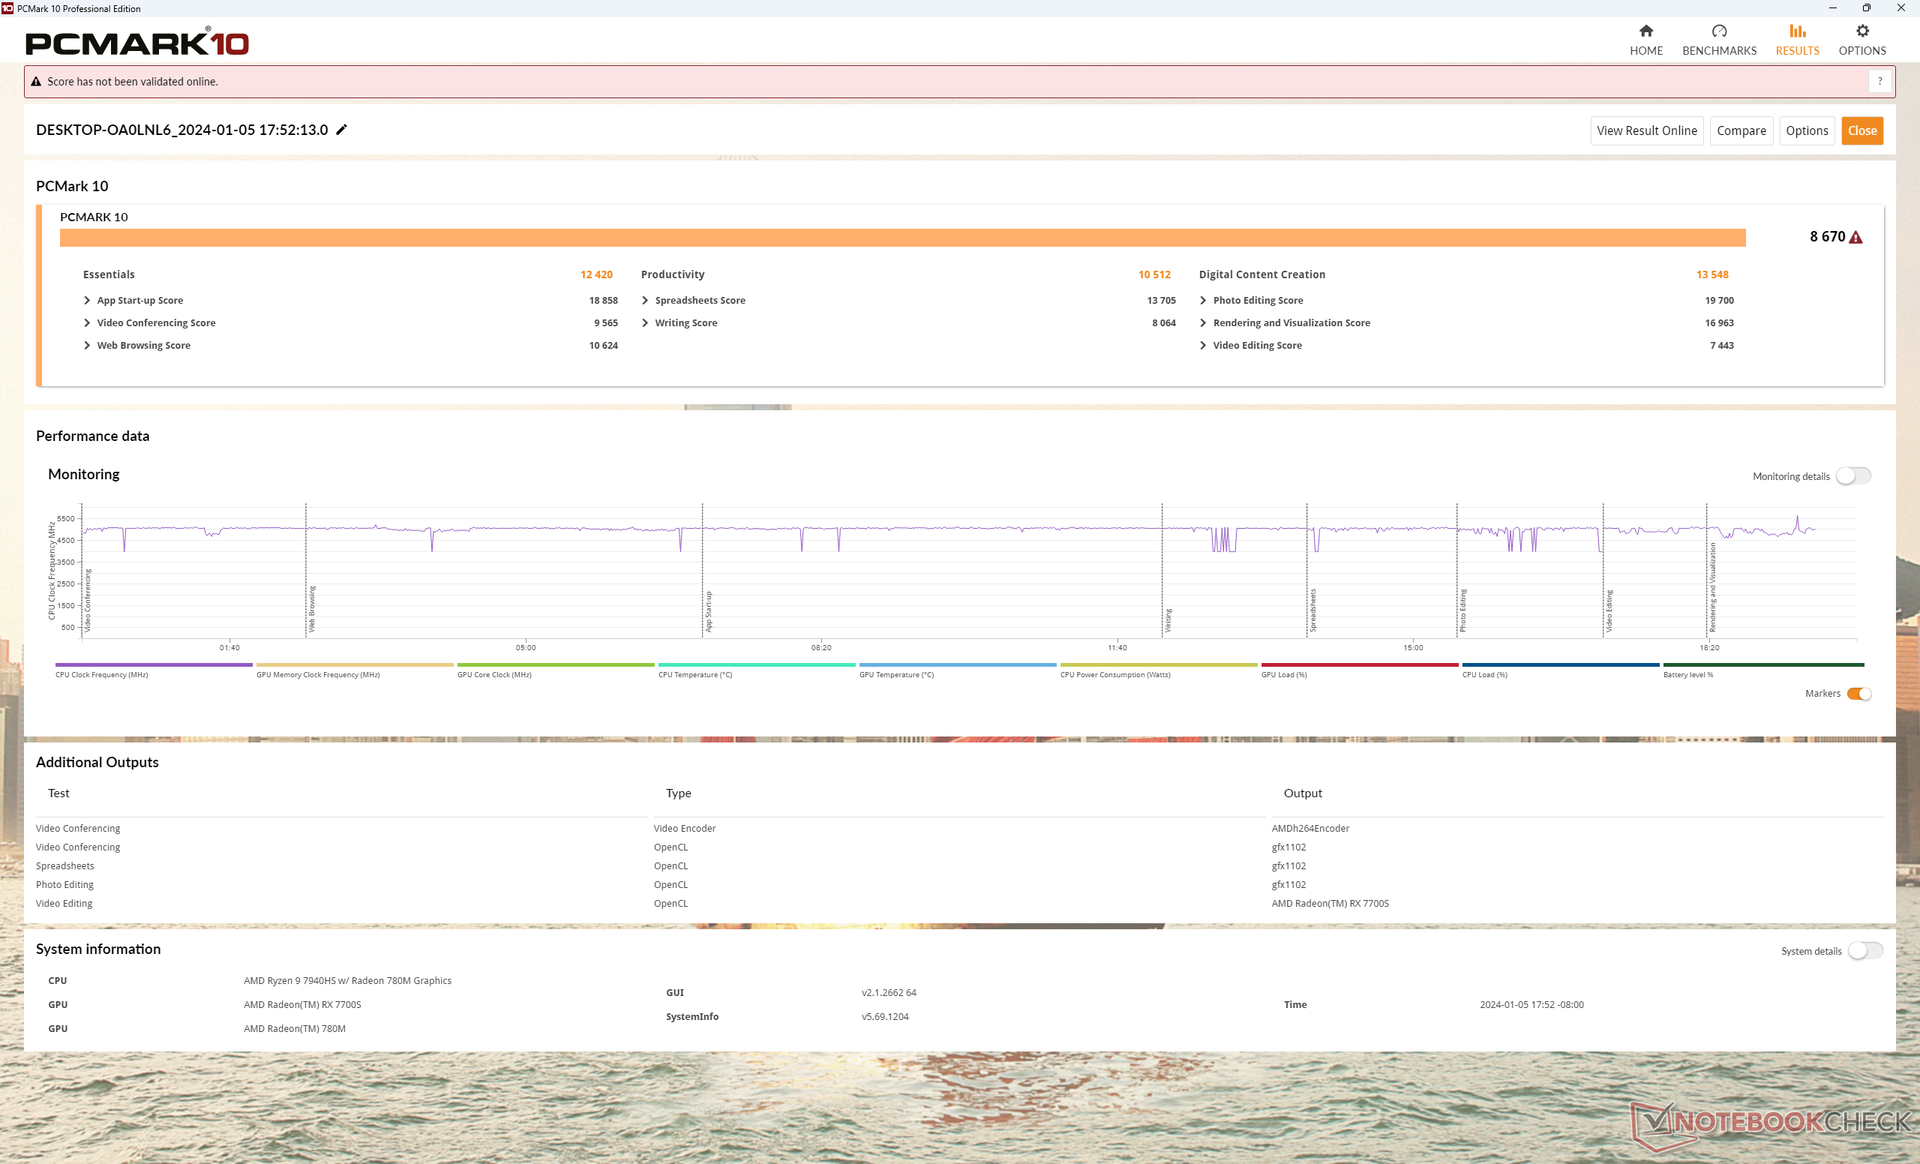
As pontuações do PCMark 10 são algumas das mais altas de qualquer notebook multimídia de 16 polegadas, devido à rápida CPU Ryzen 9 Zen 4 e aos gráficos Radeon associados. As altas pontuações do PCMark mostram que o Framework 16 pode ser tão veloz quanto outros laptops de alto desempenho ao executar tarefas diárias que variam de navegadores a editores gráficos.
CrossMark: Overall | Productivity | Creativity | Responsiveness
WebXPRT 3: Overall
WebXPRT 4: Overall
Mozilla Kraken 1.1: Total
| PCMark 10 / Score | |
| Framework Laptop 16 | |
| Média AMD Ryzen 9 7940HS, AMD Radeon RX 7700S (n=1) | |
| Lenovo ThinkPad Z16 Gen 2 | |
| Dell Inspiron 16 Plus 7630 | |
| MSI Prestige 16 B1MG-001US | |
| HP Spectre x360 2-in-1 16-f1075ng | |
| PCMark 10 / Essentials | |
| Framework Laptop 16 | |
| Média AMD Ryzen 9 7940HS, AMD Radeon RX 7700S (n=1) | |
| Lenovo ThinkPad Z16 Gen 2 | |
| Dell Inspiron 16 Plus 7630 | |
| MSI Prestige 16 B1MG-001US | |
| HP Spectre x360 2-in-1 16-f1075ng | |
| PCMark 10 / Productivity | |
| Framework Laptop 16 | |
| Média AMD Ryzen 9 7940HS, AMD Radeon RX 7700S (n=1) | |
| Lenovo ThinkPad Z16 Gen 2 | |
| Dell Inspiron 16 Plus 7630 | |
| MSI Prestige 16 B1MG-001US | |
| HP Spectre x360 2-in-1 16-f1075ng | |
| PCMark 10 / Digital Content Creation | |
| Framework Laptop 16 | |
| Média AMD Ryzen 9 7940HS, AMD Radeon RX 7700S (n=1) | |
| Dell Inspiron 16 Plus 7630 | |
| Lenovo ThinkPad Z16 Gen 2 | |
| MSI Prestige 16 B1MG-001US | |
| HP Spectre x360 2-in-1 16-f1075ng | |
| CrossMark / Overall | |
| Apple MacBook Pro 16 2023 M3 Max | |
| Dell Inspiron 16 Plus 7630 | |
| MSI Prestige 16 B1MG-001US | |
| HP Spectre x360 2-in-1 16-f1075ng | |
| Framework Laptop 16 | |
| Média AMD Ryzen 9 7940HS, AMD Radeon RX 7700S (n=1) | |
| Lenovo ThinkPad Z16 Gen 2 | |
| CrossMark / Productivity | |
| Apple MacBook Pro 16 2023 M3 Max | |
| Dell Inspiron 16 Plus 7630 | |
| HP Spectre x360 2-in-1 16-f1075ng | |
| MSI Prestige 16 B1MG-001US | |
| Framework Laptop 16 | |
| Média AMD Ryzen 9 7940HS, AMD Radeon RX 7700S (n=1) | |
| Lenovo ThinkPad Z16 Gen 2 | |
| CrossMark / Creativity | |
| Apple MacBook Pro 16 2023 M3 Max | |
| Dell Inspiron 16 Plus 7630 | |
| MSI Prestige 16 B1MG-001US | |
| Framework Laptop 16 | |
| Média AMD Ryzen 9 7940HS, AMD Radeon RX 7700S (n=1) | |
| Lenovo ThinkPad Z16 Gen 2 | |
| HP Spectre x360 2-in-1 16-f1075ng | |
| CrossMark / Responsiveness | |
| HP Spectre x360 2-in-1 16-f1075ng | |
| Dell Inspiron 16 Plus 7630 | |
| MSI Prestige 16 B1MG-001US | |
| Apple MacBook Pro 16 2023 M3 Max | |
| Framework Laptop 16 | |
| Média AMD Ryzen 9 7940HS, AMD Radeon RX 7700S (n=1) | |
| Lenovo ThinkPad Z16 Gen 2 | |
| WebXPRT 3 / Overall | |
| Apple MacBook Pro 16 2023 M3 Max | |
| Framework Laptop 16 | |
| Média AMD Ryzen 9 7940HS, AMD Radeon RX 7700S (n=1) | |
| Lenovo ThinkPad Z16 Gen 2 | |
| Dell Inspiron 16 Plus 7630 | |
| MSI Prestige 16 B1MG-001US | |
| HP Spectre x360 2-in-1 16-f1075ng | |
| WebXPRT 4 / Overall | |
| Dell Inspiron 16 Plus 7630 | |
| Framework Laptop 16 | |
| Média AMD Ryzen 9 7940HS, AMD Radeon RX 7700S (n=1) | |
| MSI Prestige 16 B1MG-001US | |
| Lenovo ThinkPad Z16 Gen 2 | |
| HP Spectre x360 2-in-1 16-f1075ng | |
| Mozilla Kraken 1.1 / Total | |
| Lenovo ThinkPad Z16 Gen 2 | |
| MSI Prestige 16 B1MG-001US | |
| HP Spectre x360 2-in-1 16-f1075ng | |
| Dell Inspiron 16 Plus 7630 | |
| Framework Laptop 16 | |
| Média AMD Ryzen 9 7940HS, AMD Radeon RX 7700S (n=1) | |
| Apple MacBook Pro 16 2023 M3 Max | |
* ... menor é melhor
| PCMark 10 Score | 8670 pontos | |
Ajuda | ||
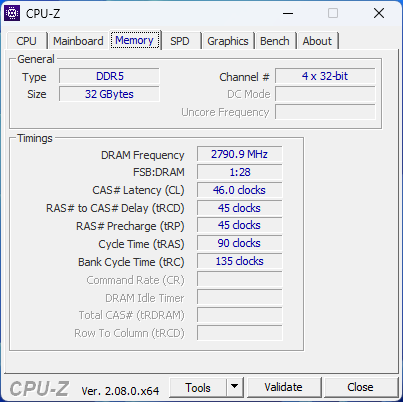
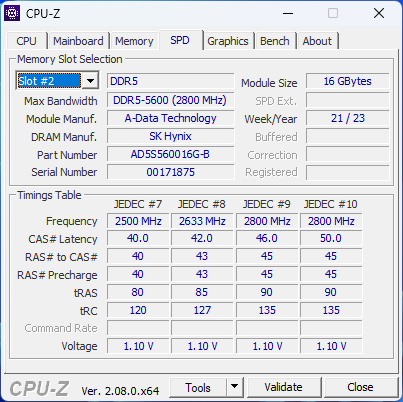
| AIDA64 / Memory Copy | |
| MSI Prestige 16 B1MG-001US | |
| Framework Laptop 16 | |
| Lenovo ThinkPad Z16 Gen 2 | |
| Média AMD Ryzen 9 7940HS (35327 - 78739, n=10) | |
| Dell Inspiron 16 Plus 7630 | |
| HP Spectre x360 2-in-1 16-f1075ng | |
| AIDA64 / Memory Read | |
| MSI Prestige 16 B1MG-001US | |
| Dell Inspiron 16 Plus 7630 | |
| Framework Laptop 16 | |
| Média AMD Ryzen 9 7940HS (30769 - 61836, n=10) | |
| Lenovo ThinkPad Z16 Gen 2 | |
| HP Spectre x360 2-in-1 16-f1075ng | |
| AIDA64 / Memory Write | |
| Lenovo ThinkPad Z16 Gen 2 | |
| Framework Laptop 16 | |
| Média AMD Ryzen 9 7940HS (42217 - 91567, n=10) | |
| MSI Prestige 16 B1MG-001US | |
| Dell Inspiron 16 Plus 7630 | |
| HP Spectre x360 2-in-1 16-f1075ng | |
| AIDA64 / Memory Latency | |
| MSI Prestige 16 B1MG-001US | |
| Lenovo ThinkPad Z16 Gen 2 | |
| Dell Inspiron 16 Plus 7630 | |
| Média AMD Ryzen 9 7940HS (87.6 - 111.1, n=10) | |
| Framework Laptop 16 | |
| HP Spectre x360 2-in-1 16-f1075ng | |
* ... menor é melhor
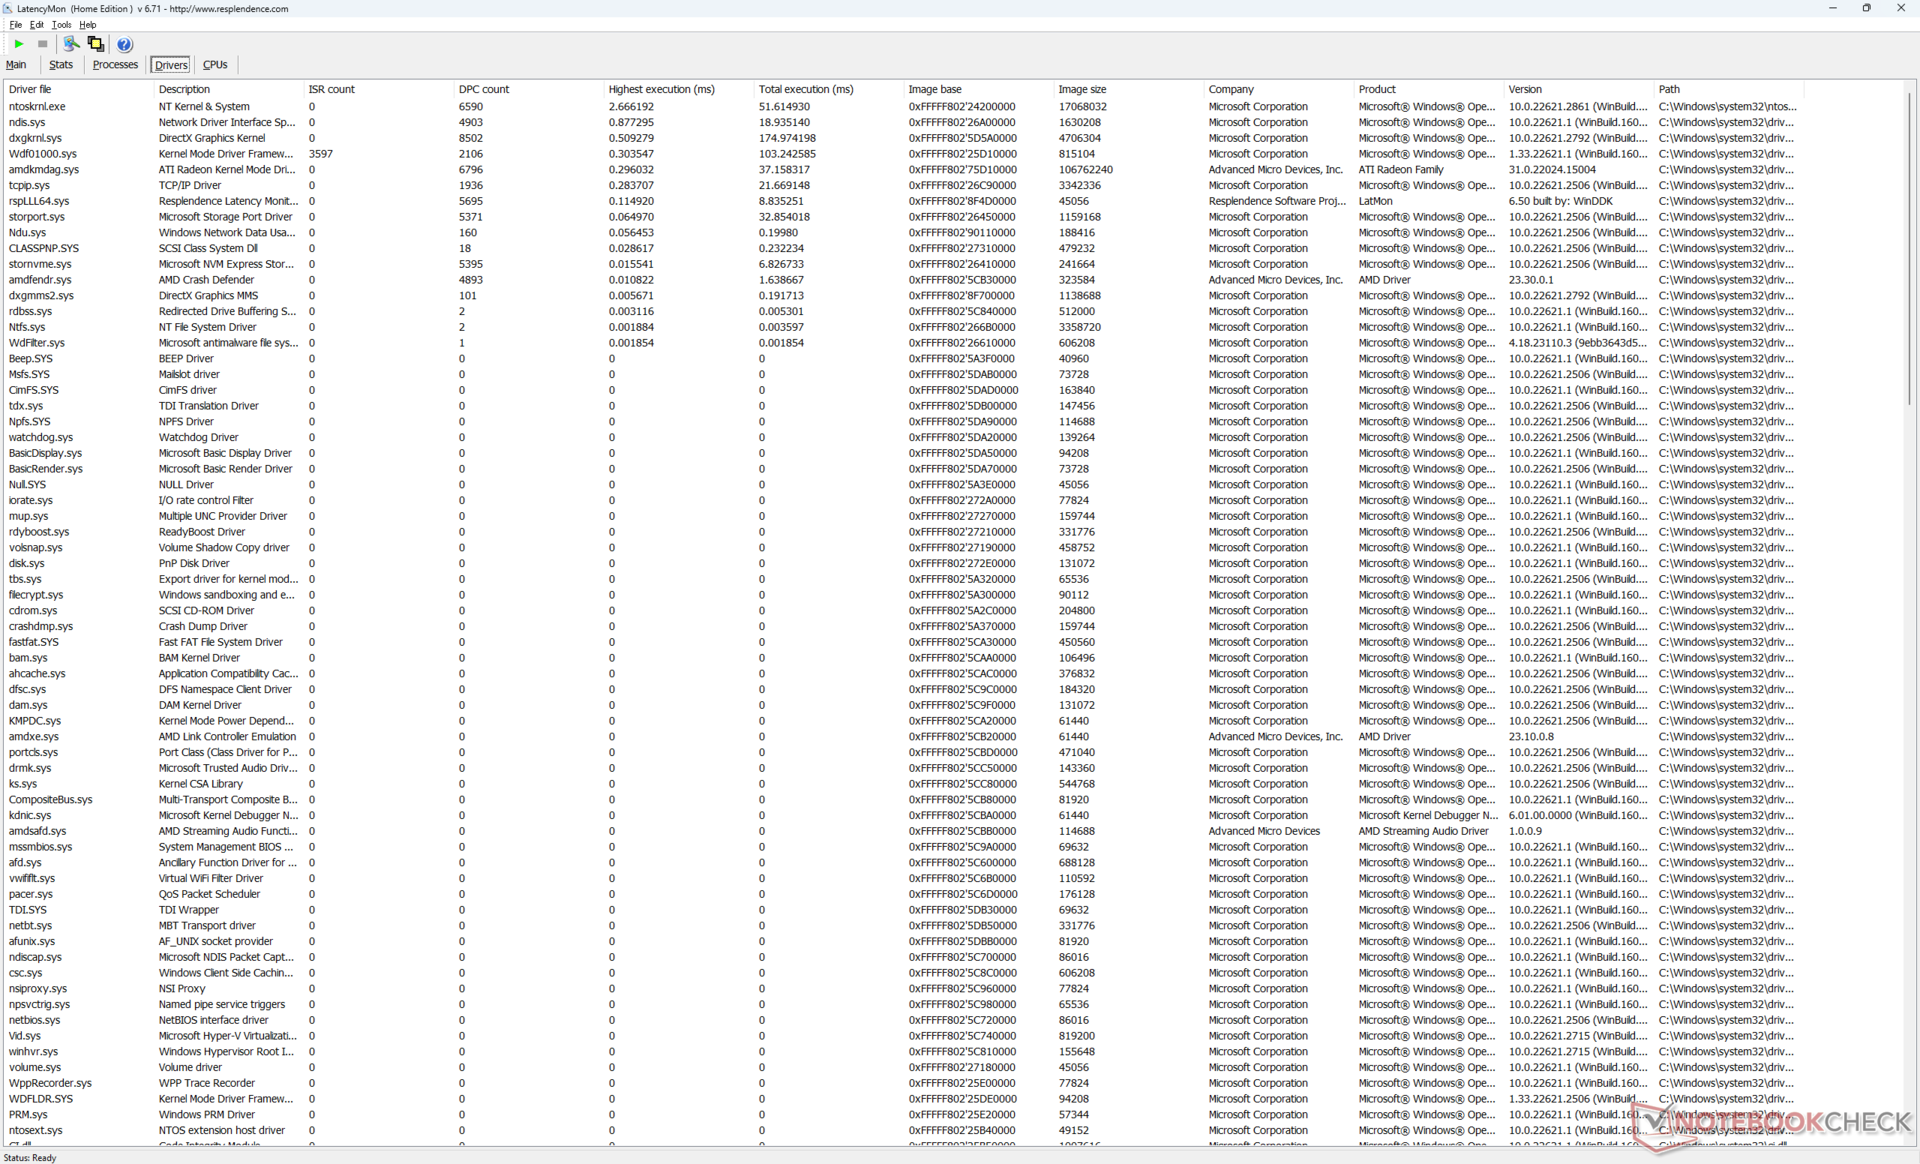
Latência DPC
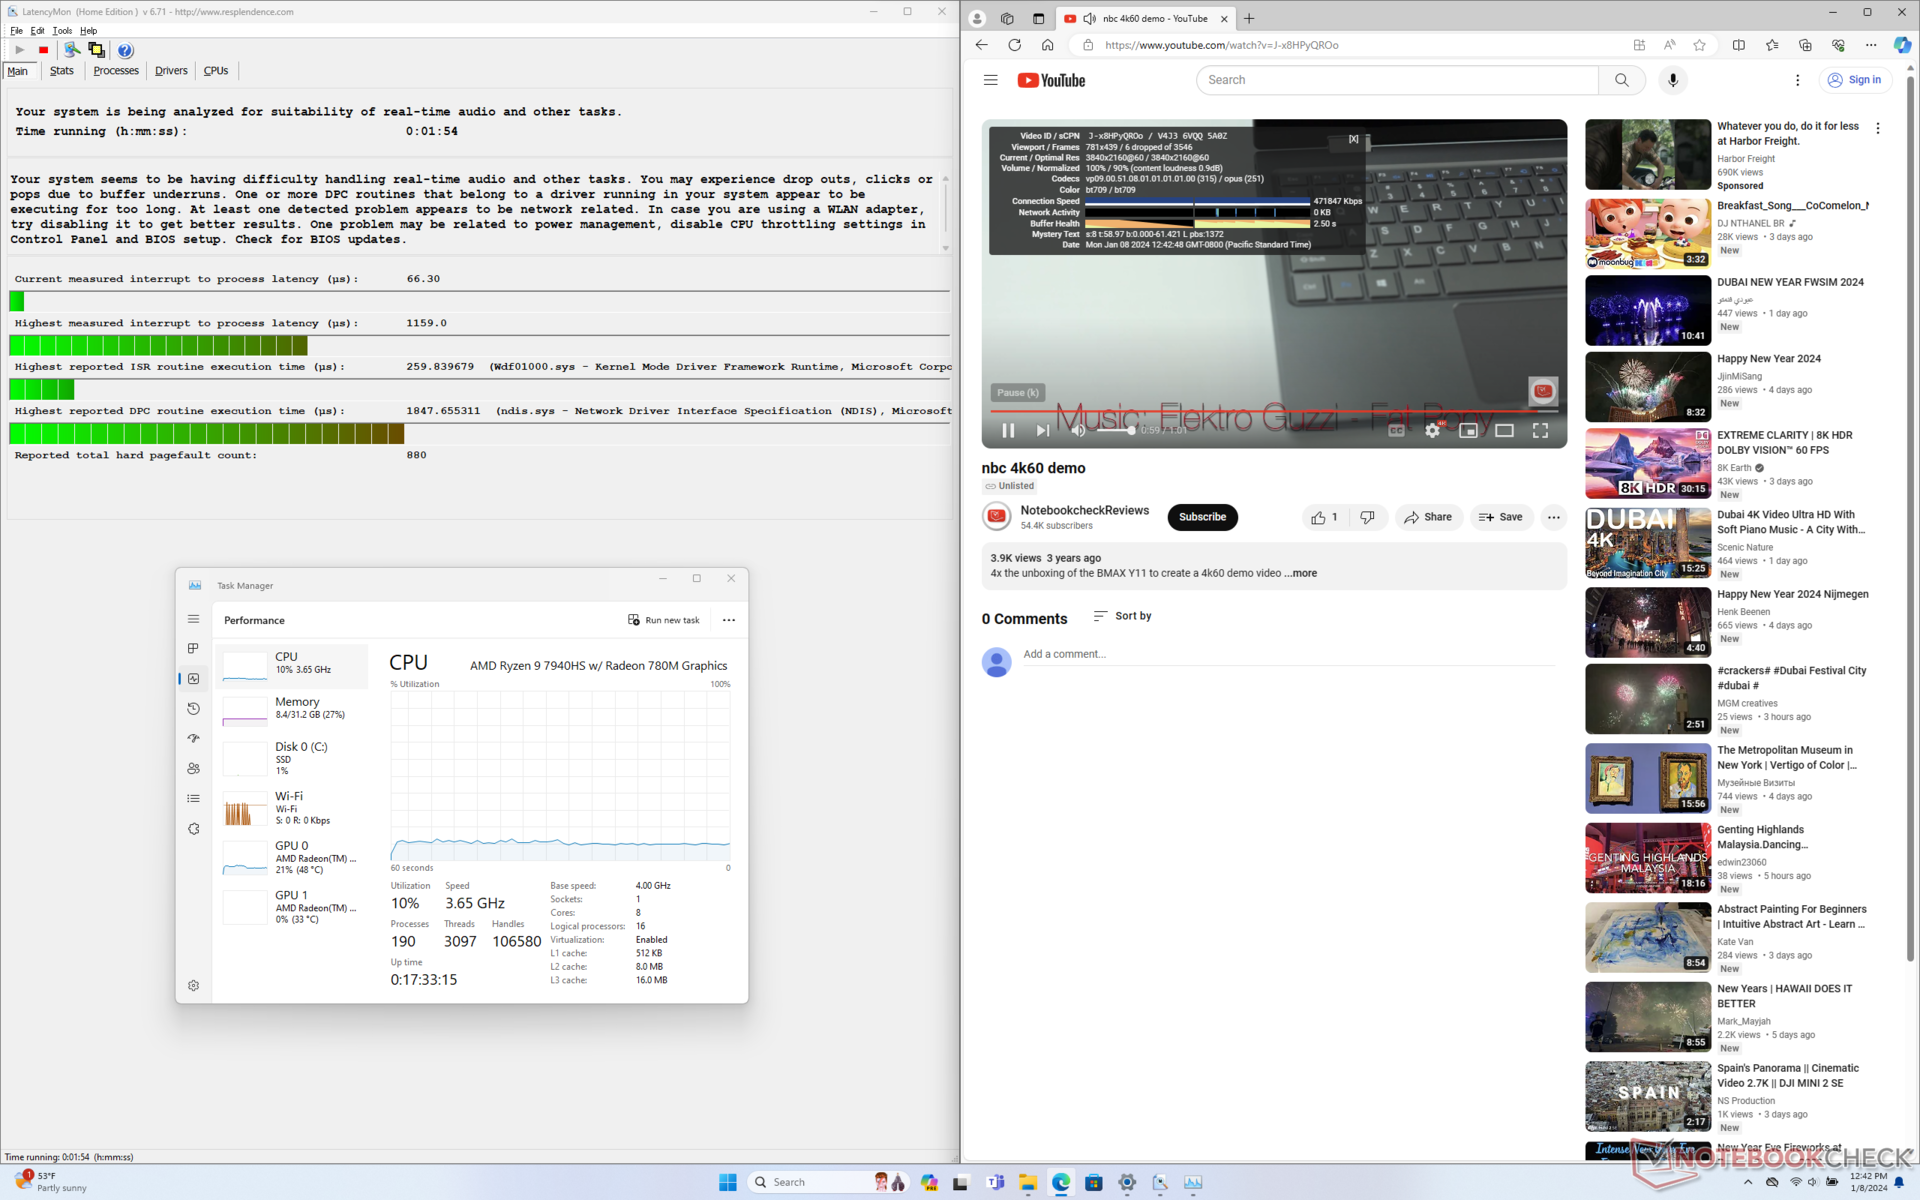
O LatencyMon revela problemas de DPC ao abrir várias guias do navegador em nossa página inicial. Além disso, conseguimos registrar 6 quadros perdidos durante um período de um minuto ao reproduzir vídeo 4K60. Cada quadro perdido ocorre em intervalos quase regulares, o que sugere um problema de driver subjacente potencialmente relacionado às GPUs da AMD. Em nossa experiência, a maioria dos notebooks baseados em Intel não sofre de problemas semelhantes e é mais provável que não haja queda de quadros ao executar o mesmo teste.
| DPC Latencies / LatencyMon - interrupt to process latency (max), Web, Youtube, Prime95 | |
| Lenovo ThinkPad Z16 Gen 2 | |
| Framework Laptop 16 | |
| HP Spectre x360 2-in-1 16-f1075ng | |
| Dell Inspiron 16 Plus 7630 | |
| MSI Prestige 16 B1MG-001US | |
* ... menor é melhor
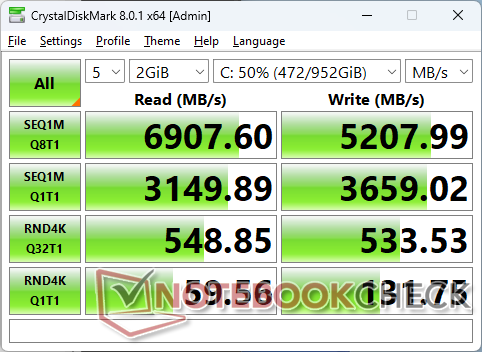
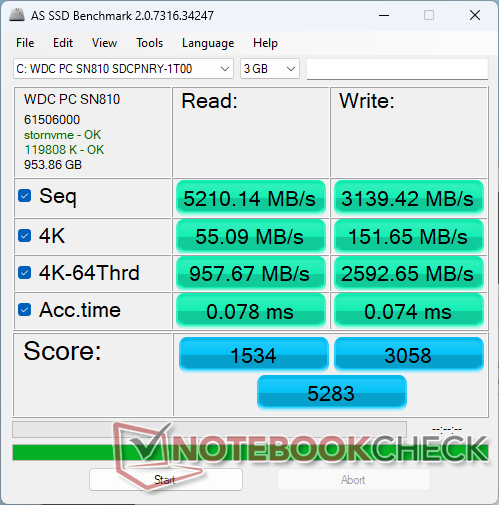
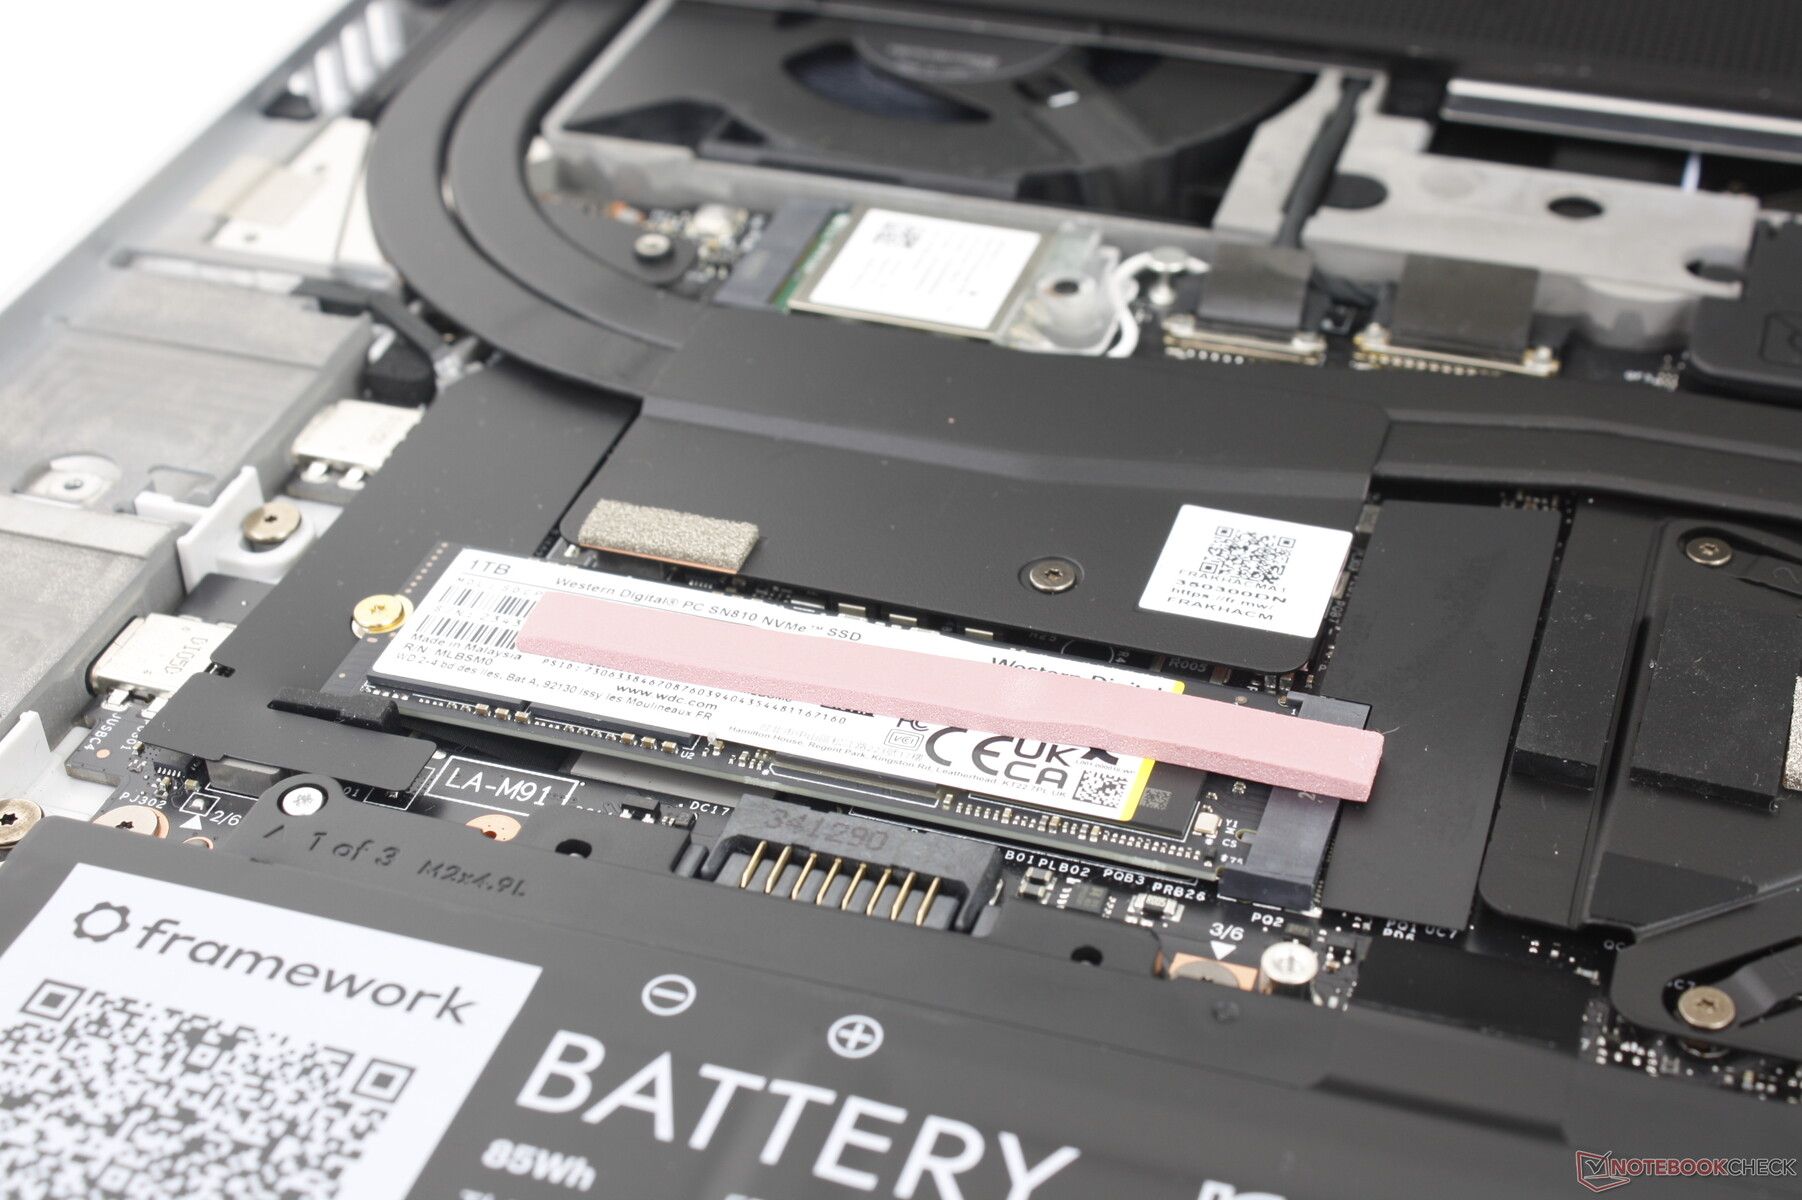
Dispositivos de armazenamento
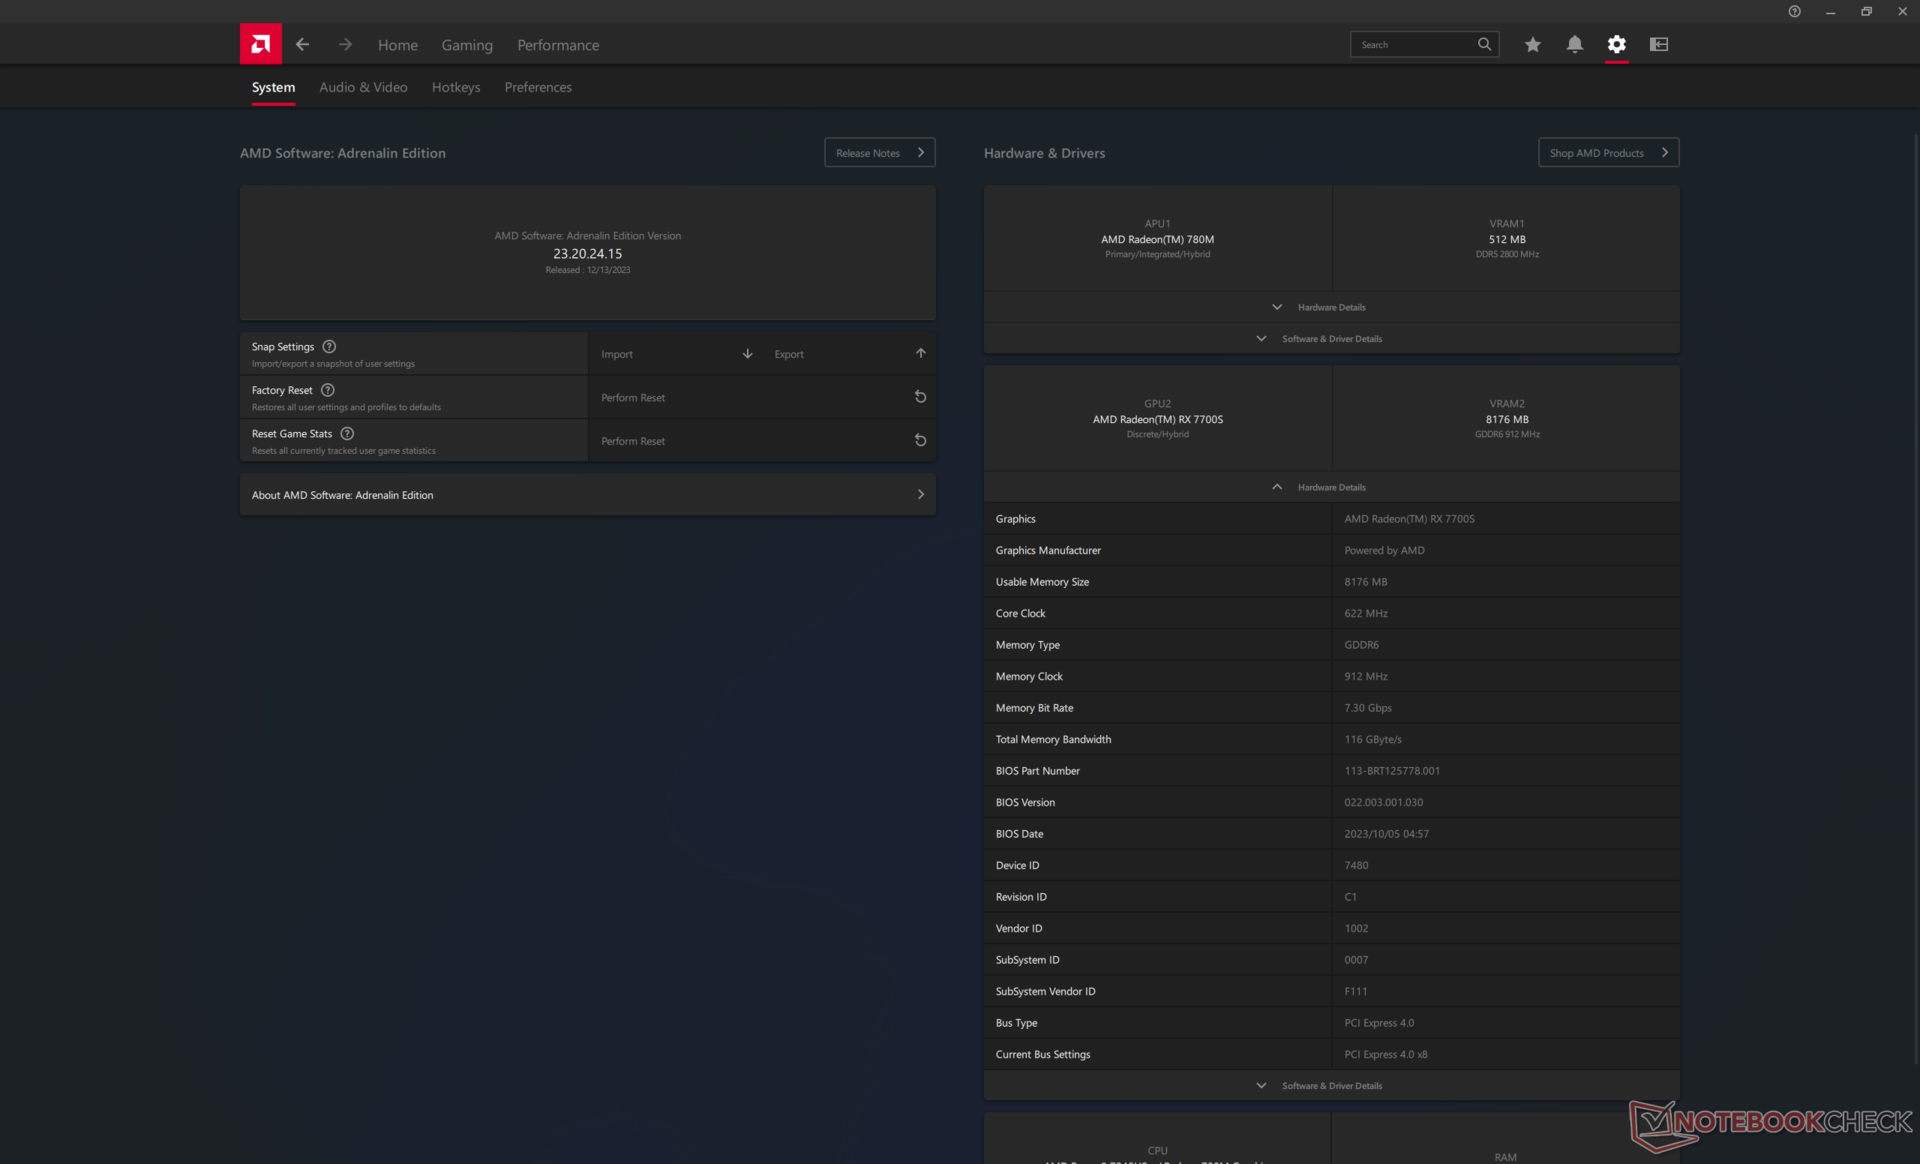
Nossa unidade de teste vem com o Western Digital SN810 PCIe4 x4 NVMe SSD, que é uma atualização do SN740 que está atualmente disponível no Framework 13.5. A unidade não apresentou problemas para manter uma taxa de transferência de ~7000 MB/s por longos períodos, ao contrário do que observamos no HP Pavilion Plus 14 equipado com a mesma SSD da WD. Isso sugere que o Framework 16 foi projetado com um melhor resfriamento da SSD em mente para evitar a redução do desempenho.

| Drive Performance rating - Percent | |
| MSI Prestige 16 B1MG-001US | |
| Média WDC PC SN810 1TB | |
| Framework Laptop 16 | |
| HP Spectre x360 2-in-1 16-f1075ng | |
| Lenovo ThinkPad Z16 Gen 2 | |
| Dell Inspiron 16 Plus 7630 | |
* ... menor é melhor
Disk Throttling: DiskSpd Read Loop, Queue Depth 8
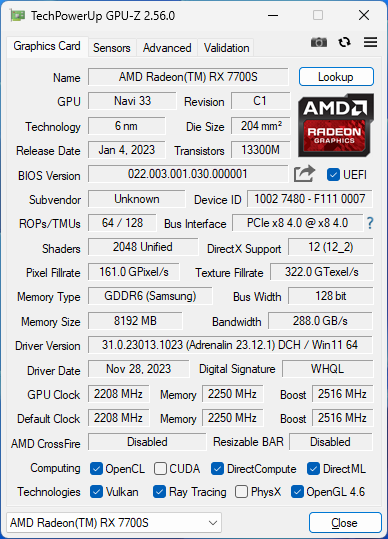
Desempenho da GPU - RDNA 3 para o resgate
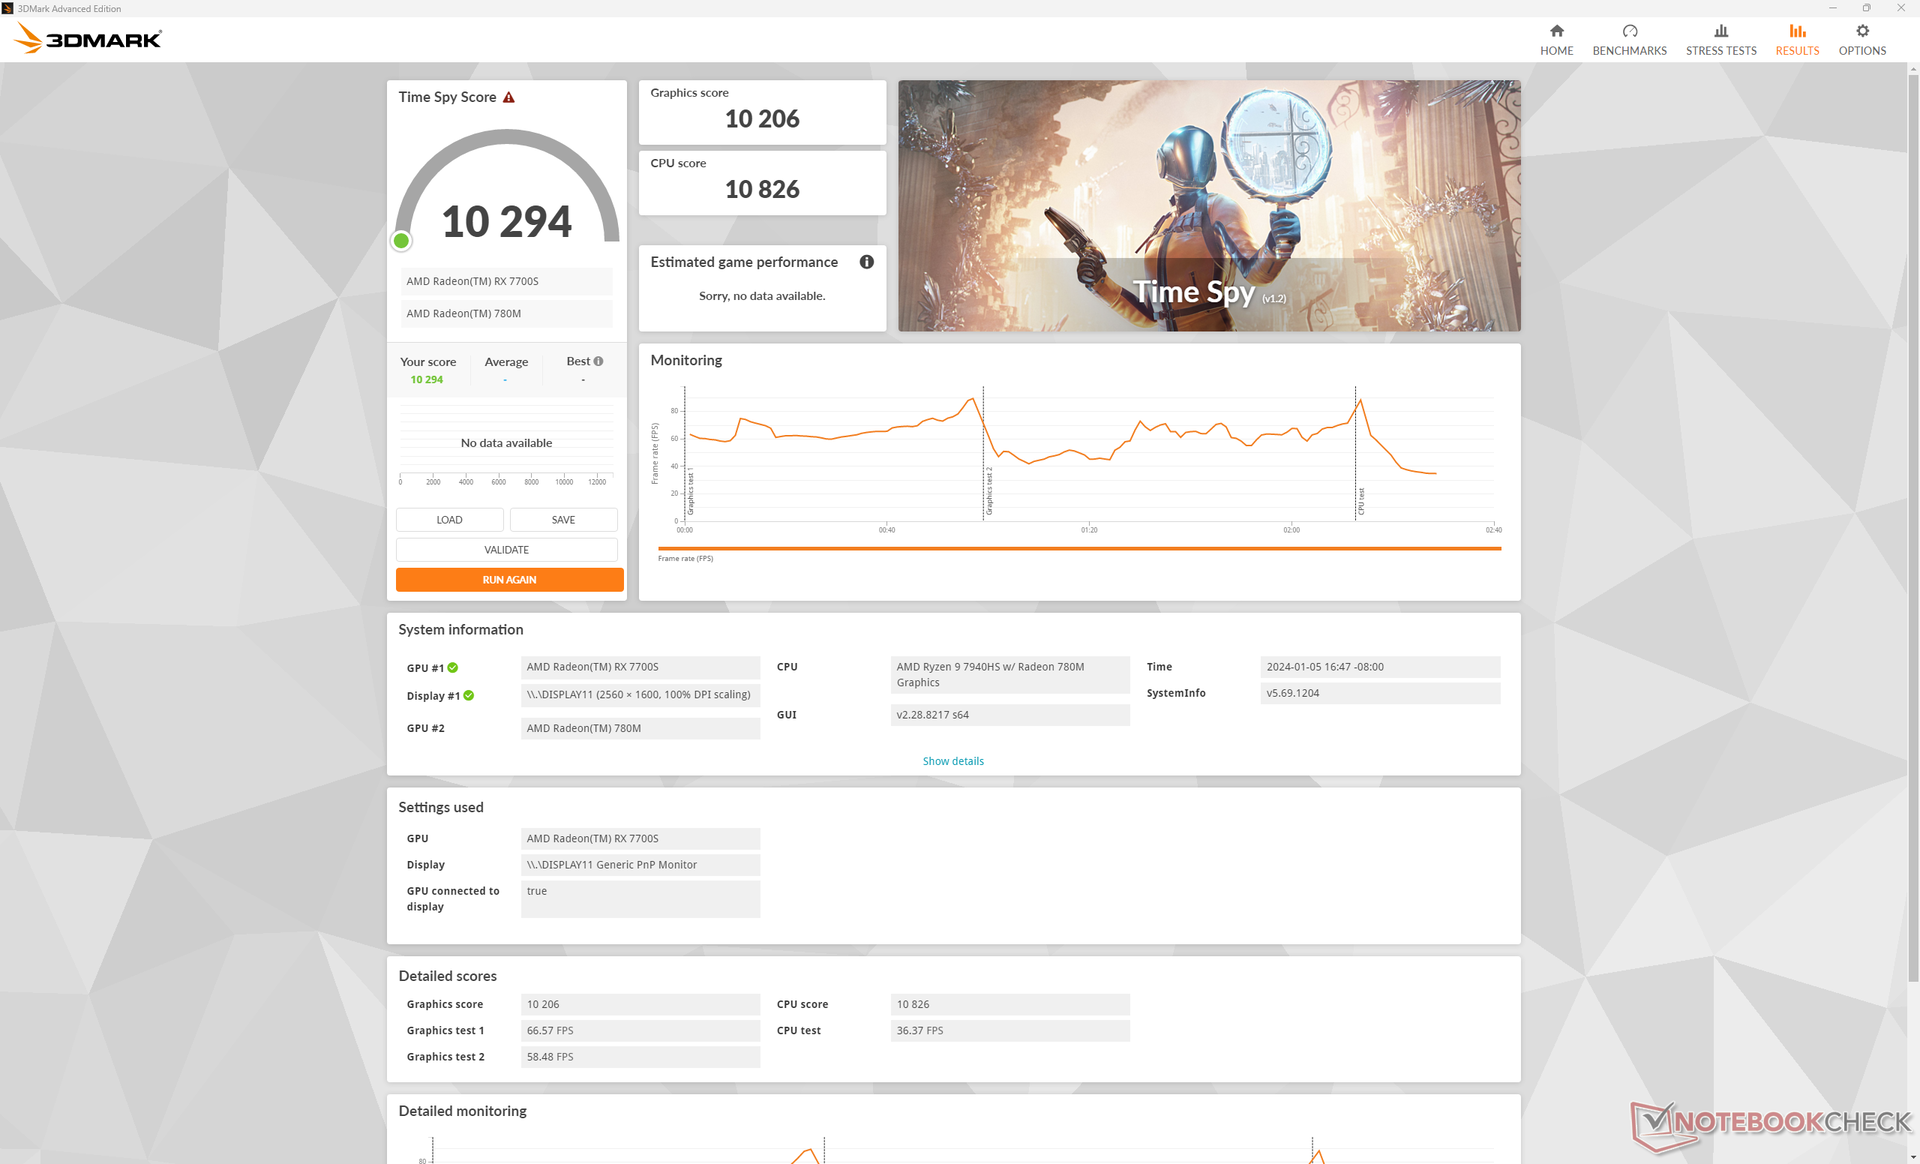
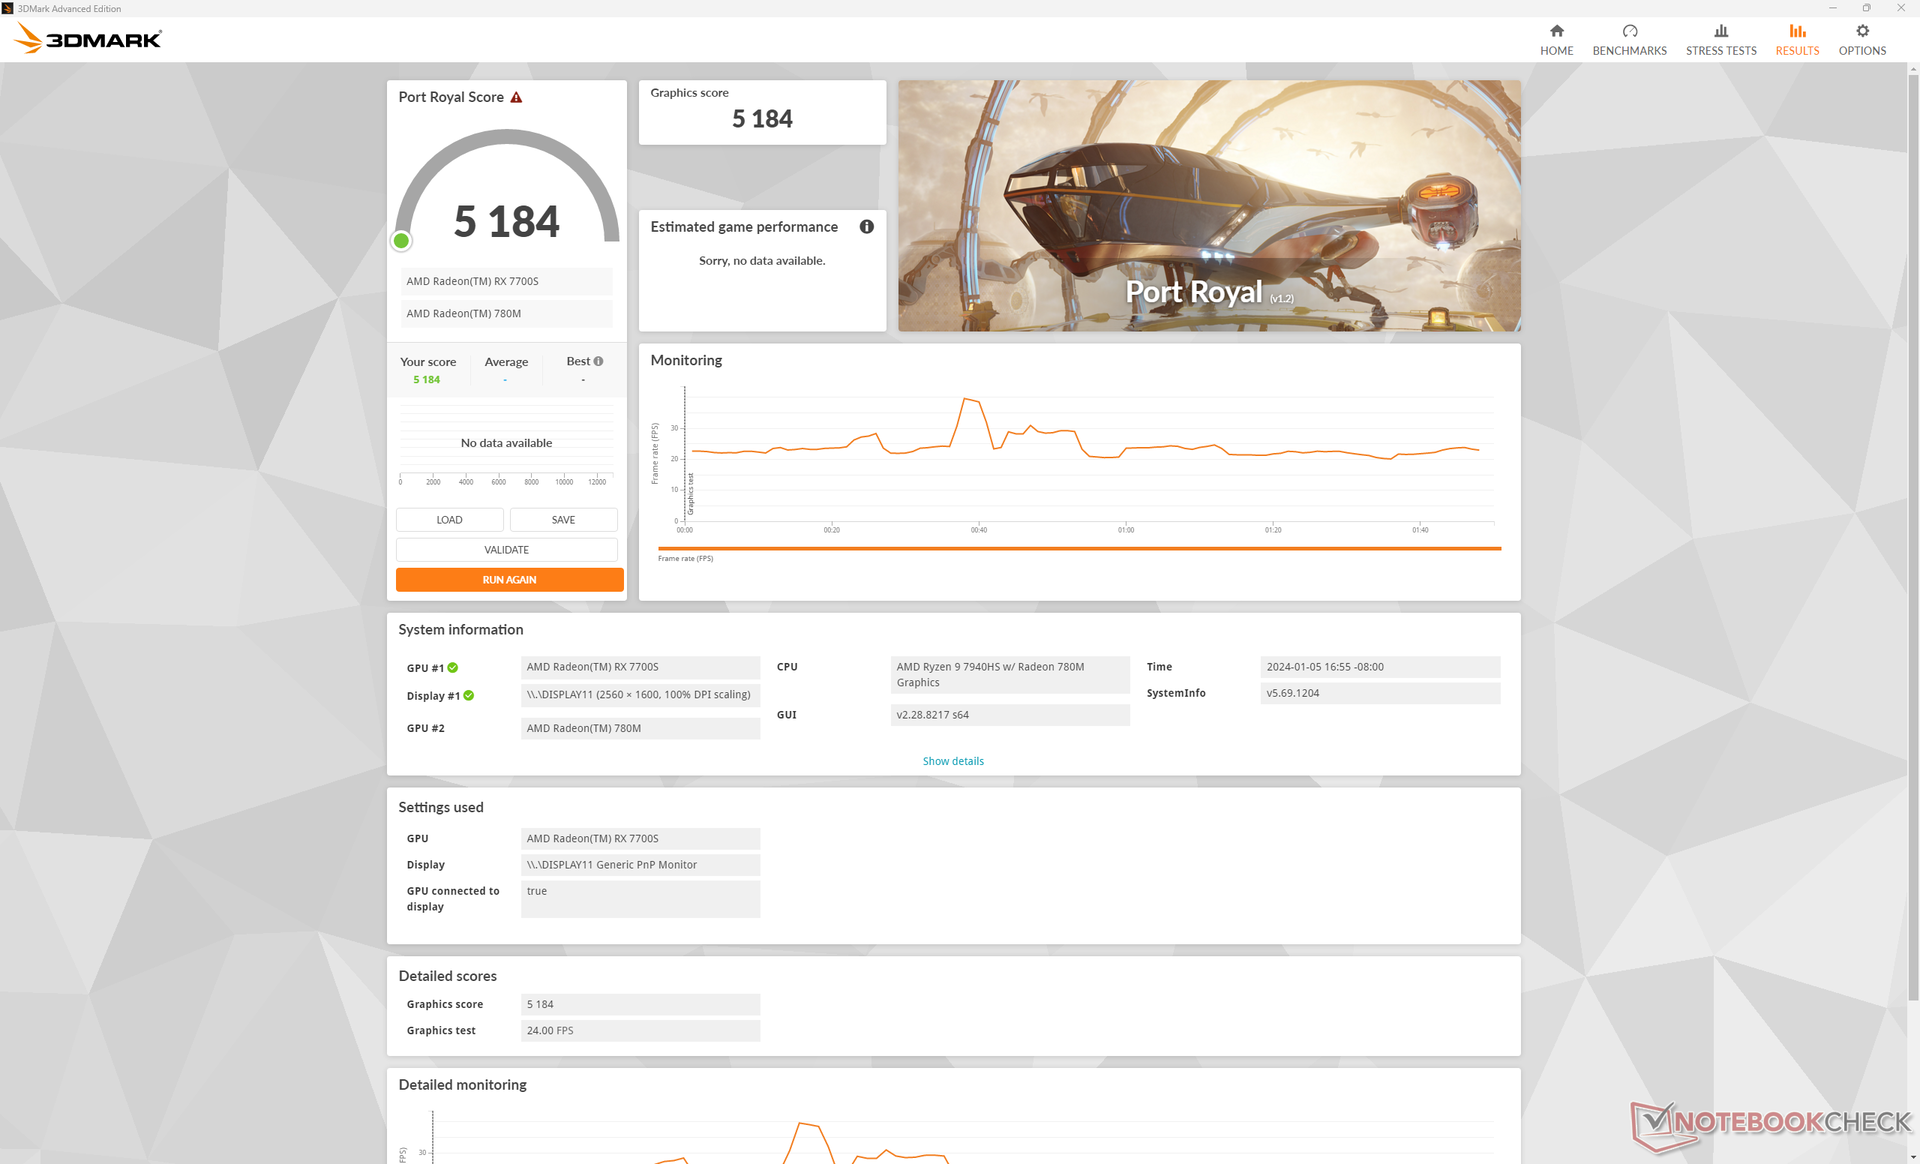
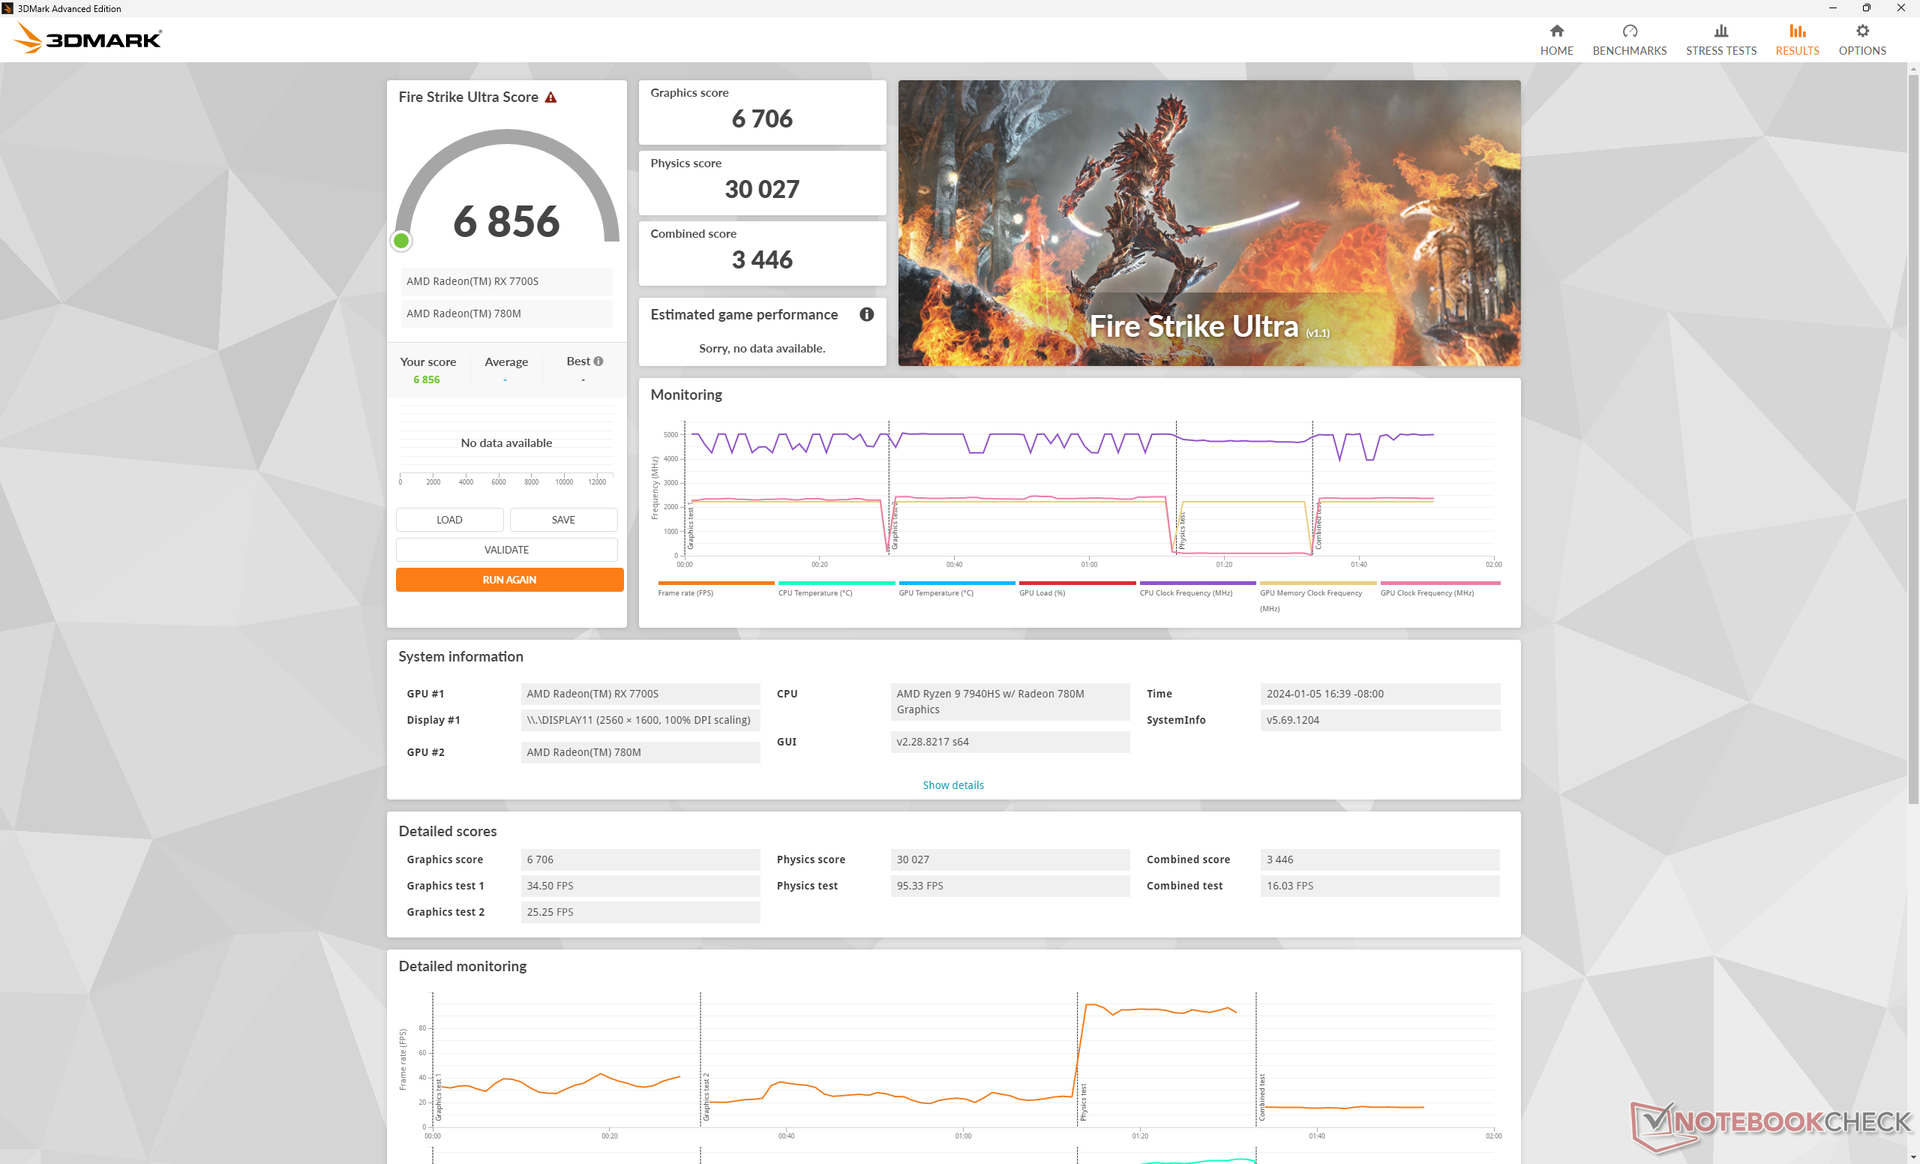
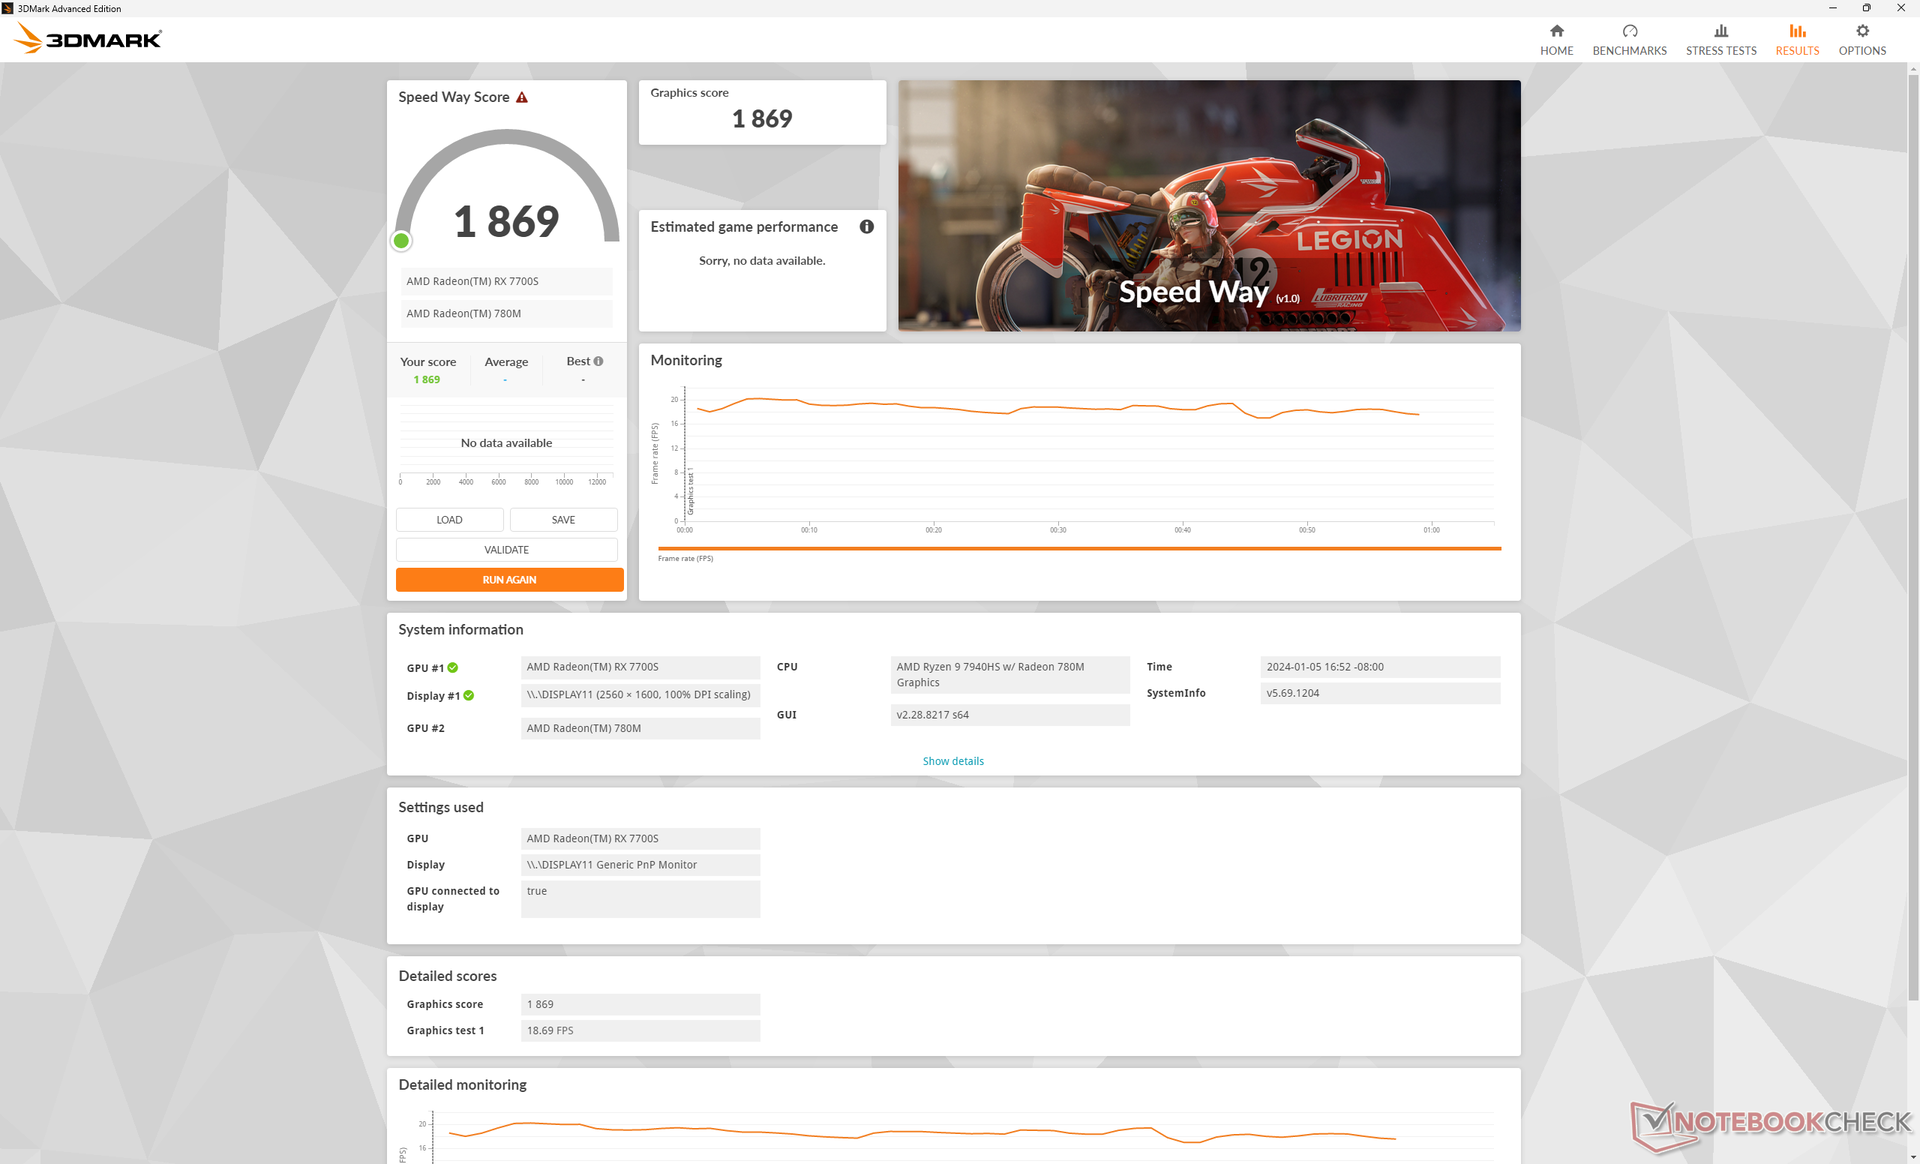
O RDNA 3 Radeon RX 7700S sucede diretamente a RDNA 2 do ano passado Radeon RX 6700S. A arquitetura mais recente, no entanto, não melhorou muito o desempenho, a menos que o jogo suporte DX12; os resultados do 3DMark Fire Strike são quase idênticos entre as duas GPUs, enquanto os resultados do Time Spy são 20 a 25% mais rápidos do que antes. Ganhos maiores podem ser observados no desempenho de RT, pois esse era um ponto fraco da arquitetura RDNA 2 mais antiga. O desempenho geral é mais comparável ao de um laptop com a GeForce RTX 4060 como o Lenovo Legion Slim 7 16.
Mesmo com a dGPU removida, a Radeon RX 780M ainda é mais do que capaz de realizar tarefas multimídia. A GPU da AMD continua sendo uma das soluções de iGPU mais rápidas disponíveis, embora tenha sido recentemente superada pela Série Intel Arc.
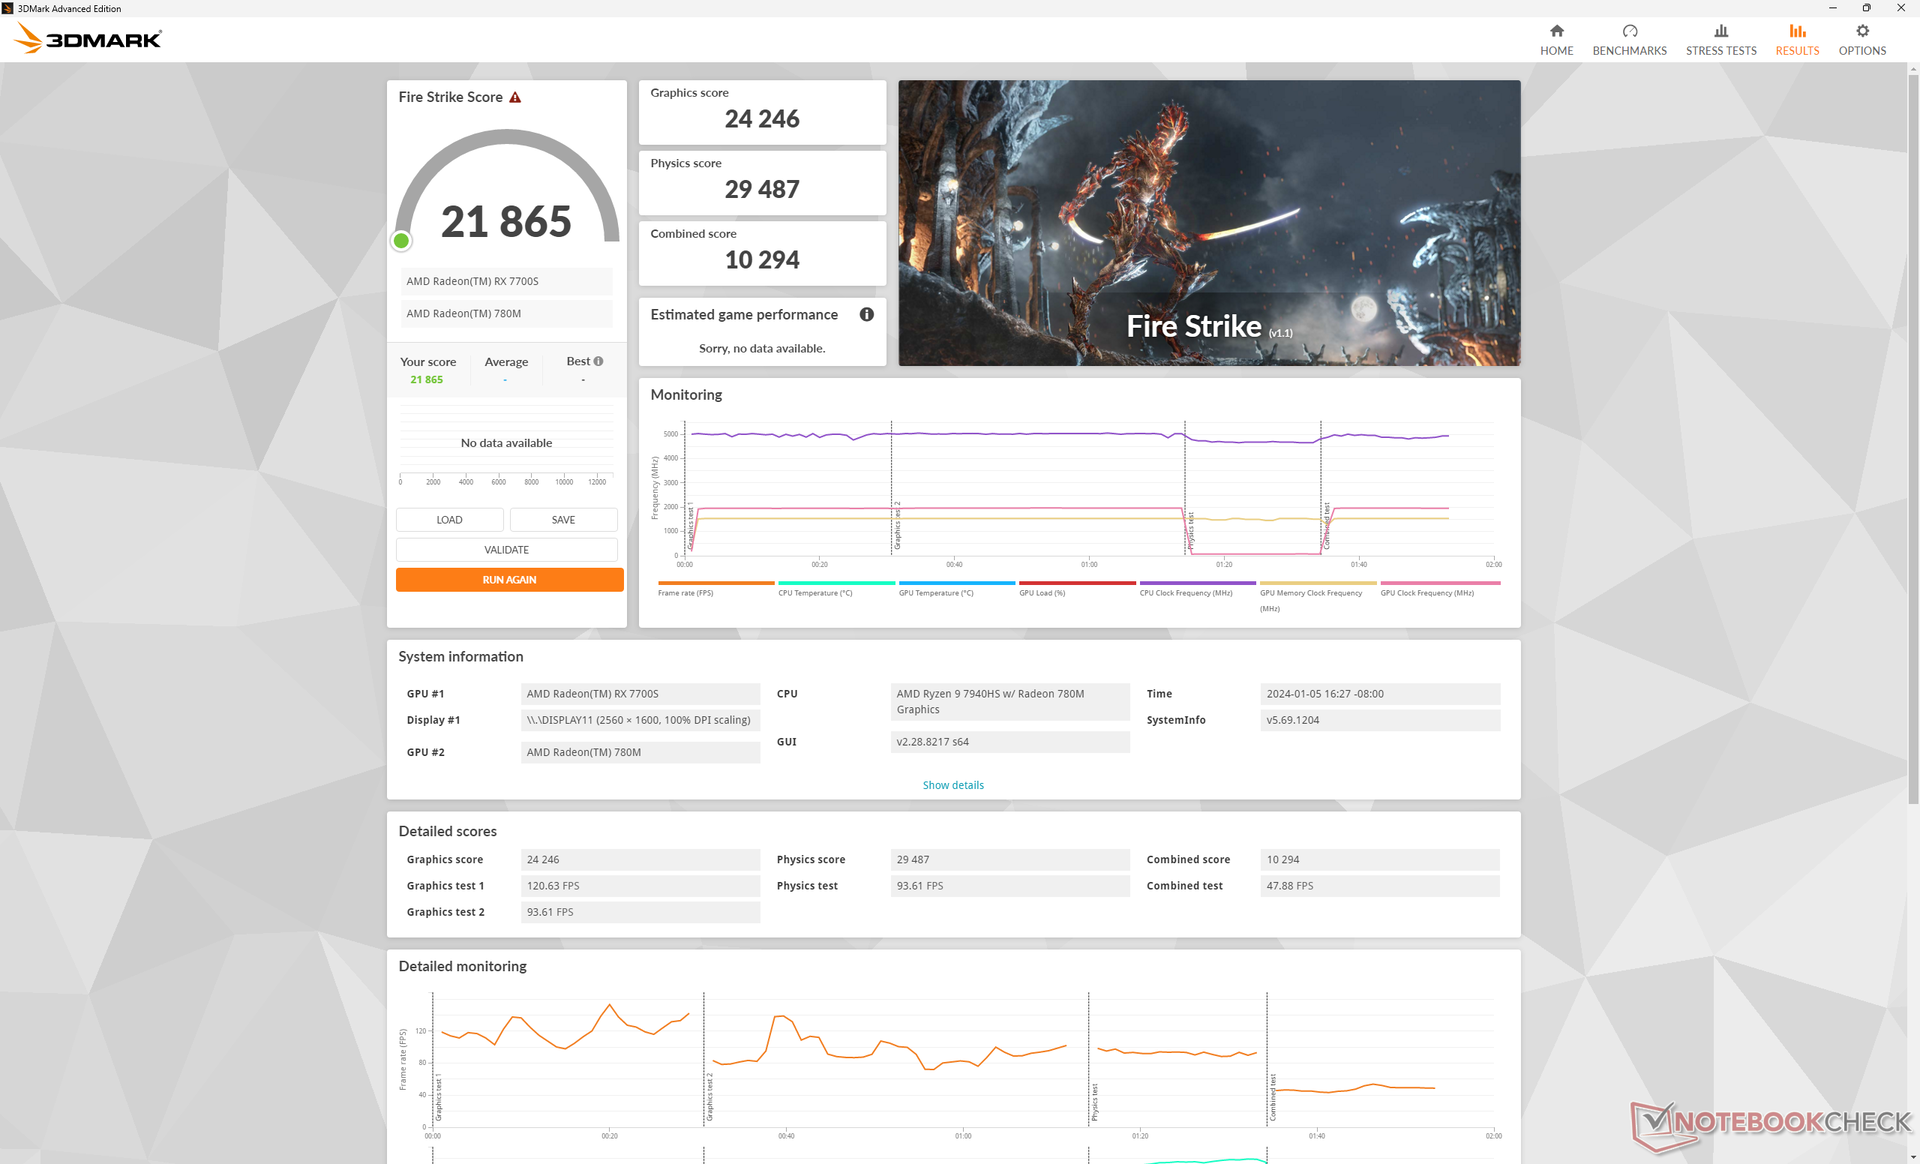
A execução no modo Windows Balanced em vez do modo Performance não parece afetar o desempenho, como mostra a tabela de resultados do site Fire Strike abaixo. A execução com a energia da bateria reduziria o desempenho em cerca de 15%.
| Perfil de energia | Pontuação de gráficos | Pontuação de física | Pontuação combinada |
| Desempenho | 24246 | 29487 | 10294 |
| Equilibrado | 24125 (-0%) | 29101 (-0%) | 10389 (-0%) |
| Modo de bateria | 20380 (-16%) | 25009 (-15%) | 6769 (-34%) |
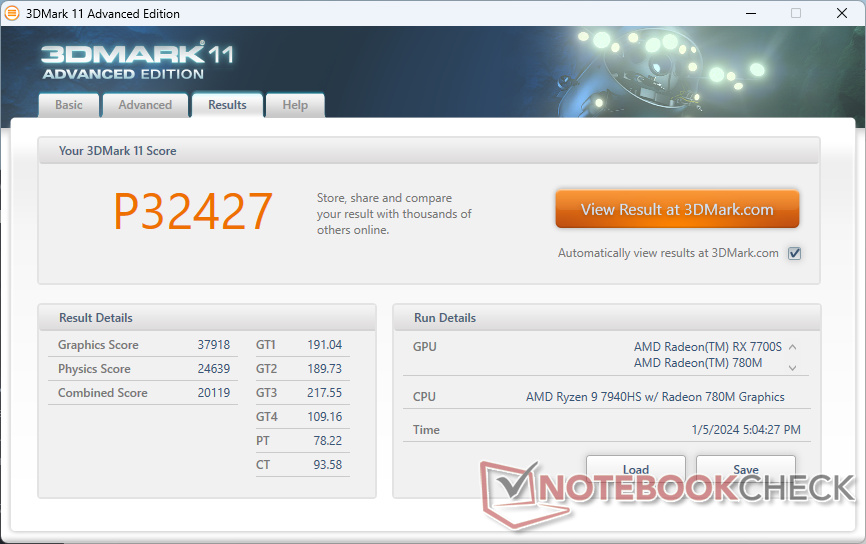
| 3DMark 11 Performance | 32427 pontos | |
| 3DMark Fire Strike Score | 21865 pontos | |
| 3DMark Time Spy Score | 10294 pontos | |
Ajuda | ||
* ... menor é melhor
Desempenho em jogos
O desempenho em jogos da Radeon RX 7700S de 100 W está cerca de 10 a 30 por cento atrás da GeForce RTX 4060 móvel, dependendo do TDP. Por exemplo, o desempenho está muito mais próximo do RTX 4060 de 60 W no Dell Inspiron 16 Plus 7630 enquanto a RTX 4060 de 140 W superaria a nossa Radeon por margens maiores. Portanto, espera-se que o desempenho em jogos esteja entre o rTX 4050 móvel e o RTX 4060 móvel.
O desempenho também seria apenas um pouco mais rápido do que o da Radeon RX 6700S do ano passado na maioria dos títulos testados. Os maiores ganhos podem ser vistos quando a RT é ativada, conforme previsto pelo 3DMark. O F1 22, por exemplo, seria executado de 30 a 40% mais rápido do que antes quando as configurações de RT estão ativas, em comparação com os ganhos menores de 5 a 15% quando as configurações de RT estão desativadas.
| Baldur's Gate 3 | |
| 1920x1080 High Preset AA:T | |
| Alienware m18 R1 AMD | |
| Lenovo Legion Slim 7 16APH8 | |
| Framework Laptop 16 | |
| Média AMD Radeon RX 7700S (n=1) | |
| Lenovo ThinkPad Z16 Gen 2 | |
| MSI Prestige 16 B1MG-001US | |
| 1920x1080 Ultra Preset AA:T | |
| Alienware m18 R1 AMD | |
| Lenovo Legion Slim 7 16APH8 | |
| Framework Laptop 16 | |
| Média AMD Radeon RX 7700S (n=1) | |
| Lenovo ThinkPad Z16 Gen 2 | |
| MSI Prestige 16 B1MG-001US | |
| 2560x1440 Ultra Preset AA:T | |
| Alienware m18 R1 AMD | |
| Lenovo Legion Slim 7 16APH8 | |
| Framework Laptop 16 | |
| Média AMD Radeon RX 7700S (n=1) | |
| Lenovo ThinkPad Z16 Gen 2 | |
| 3840x2160 Ultra Preset AA:T | |
| Alienware m18 R1 AMD | |
| Framework Laptop 16 | |
| Média AMD Radeon RX 7700S (n=1) | |
Witcher 3 FPS Chart
| baixo | média | alto | ultra | QHD | 4K | |
|---|---|---|---|---|---|---|
| GTA V (2015) | 184 | 178.6 | 170.6 | 95.8 | 67.1 | 68.4 |
| The Witcher 3 (2015) | 392.2 | 277.5 | 147.1 | 84 | 43 | |
| Dota 2 Reborn (2015) | 174 | 159.8 | 156.5 | 136.8 | 85.3 | |
| Final Fantasy XV Benchmark (2018) | 206 | 106 | 74.8 | 54.5 | 29 | |
| X-Plane 11.11 (2018) | 97.6 | 79.3 | 65 | 46.8 | ||
| Far Cry 5 (2018) | 148 | 130 | 123 | 117 | 81 | 39 |
| Strange Brigade (2018) | 449 | 202 | 167.4 | 143.9 | 91.9 | 47.9 |
| Tiny Tina's Wonderlands (2022) | 183.5 | 140.4 | 92 | 71.2 | 47.3 | 23.1 |
| F1 22 (2022) | 251 | 221 | 168 | 47.7 | 29.9 | 11.3 |
| Baldur's Gate 3 (2023) | 106.8 | 88 | 76.4 | 73.6 | 51.1 | 24.7 |
| Cyberpunk 2077 (2023) | 100.7 | 80.5 | 68.1 | 60.7 | 37.3 | 15.8 |
O desempenho por watt ao executar Witcher 3 em configurações Ultra é comparável a um desktop GeForce RTX 4070 Ti ou RTX 4080. Portanto, a GPU RDNA 3 é pelo menos eficiente, mesmo que não seja nem de longe tão potente quanto a mais rápida da Nvidia. Enquanto isso, a RTX 4060 móvel mais competitiva ainda é cerca de 30% mais eficiente e essa margem só aumenta em favor da Nvidia ao executar jogos habilitados para RT.
Emissões
Ruído do sistema - alto sob carga
O ruído da ventoinha abrange muito bem os dois extremos, no sentido de que pode ser muito silencioso ao executar cargas pouco exigentes e muito alto ao executar cargas mais exigentes, como jogos. Em uma simples navegação ou streaming de vídeo, por exemplo, o ruído da ventoinha tende a ficar em torno de 28,5 dB(A) contra um fundo silencioso de 23,8 dB(A), sendo praticamente inaudível. Ao executar o Witcher 3, no entanto, o ruído da ventoinha pode chegar a quase 52 dB(A), sendo tão alto quanto o Inspiron 16 Plus da concorrência ou alguns notebooks para jogos, como o Razer Blade 16.
Barulho
| Ocioso |
| 23.9 / 23.9 / 23.9 dB |
| Carga |
| 28.5 / 53.7 dB |
 | ||
30 dB silencioso 40 dB(A) audível 50 dB(A) ruidosamente alto |
||
min: | ||
| Framework Laptop 16 Radeon RX 7700S, R9 7940HS, WDC PC SN810 1TB | MSI Prestige 16 B1MG-001US Arc 8-Core, Ultra 7 155H, Samsung PM9A1 MZVL22T0HBLB | Lenovo ThinkPad Z16 Gen 2 Radeon RX 6550M, R9 PRO 7940HS, Kioxia XG8 KXG8AZNV1T02 | Apple MacBook Pro 16 2023 M3 Max M3 Max 40-Core GPU, Apple M3 Max 16-Core, Apple SSD AP8192Z | Dell Inspiron 16 Plus 7630 GeForce RTX 4060 Laptop GPU, i7-13700H, WD PC SN740 SDDPTQD-1T00 | HP Spectre x360 2-in-1 16-f1075ng Iris Xe G7 96EUs, i7-12700H, SK Hynix PC711 1TB HFS001TDE9X073N | |
|---|---|---|---|---|---|---|
| Noise | -6% | -5% | -0% | -1% | -6% | |
| desligado / ambiente * (dB) | 23.8 | 24.5 -3% | 22.6 5% | 23.7 -0% | 23.2 3% | 26 -9% |
| Idle Minimum * (dB) | 23.9 | 24.5 -3% | 22.9 4% | 23.7 1% | 23.2 3% | 26 -9% |
| Idle Average * (dB) | 23.9 | 26.3 -10% | 29.4 -23% | 23.7 1% | 23.2 3% | 26 -9% |
| Idle Maximum * (dB) | 23.9 | 26.3 -10% | 29.4 -23% | 23.7 1% | 23.2 3% | 26 -9% |
| Load Average * (dB) | 28.5 | 36.5 -28% | 29.5 -4% | 40.8 -43% | 35.1 -23% | 42.9 -51% |
| Witcher 3 ultra * (dB) | 51.9 | 46.3 11% | 52 -0% | 42.8 18% | 52.5 -1% | 42.9 17% |
| Load Maximum * (dB) | 53.7 | 52.9 1% | 52 3% | 42.8 20% | 52.5 2% | 39.1 27% |
* ... menor é melhor
Temperatura
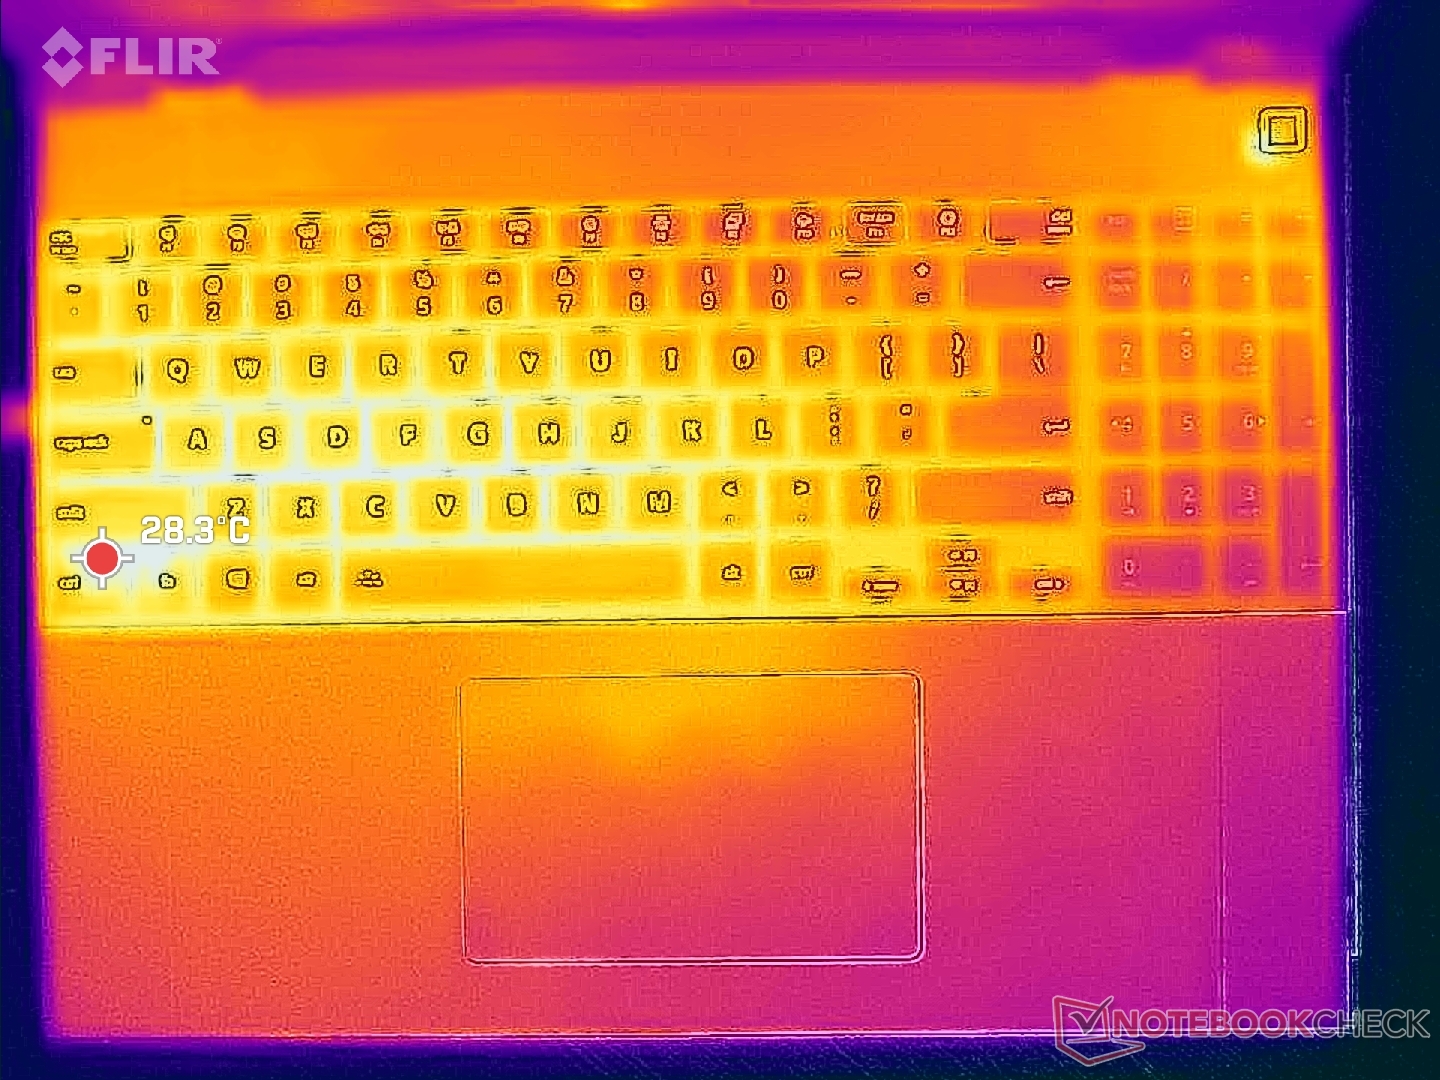
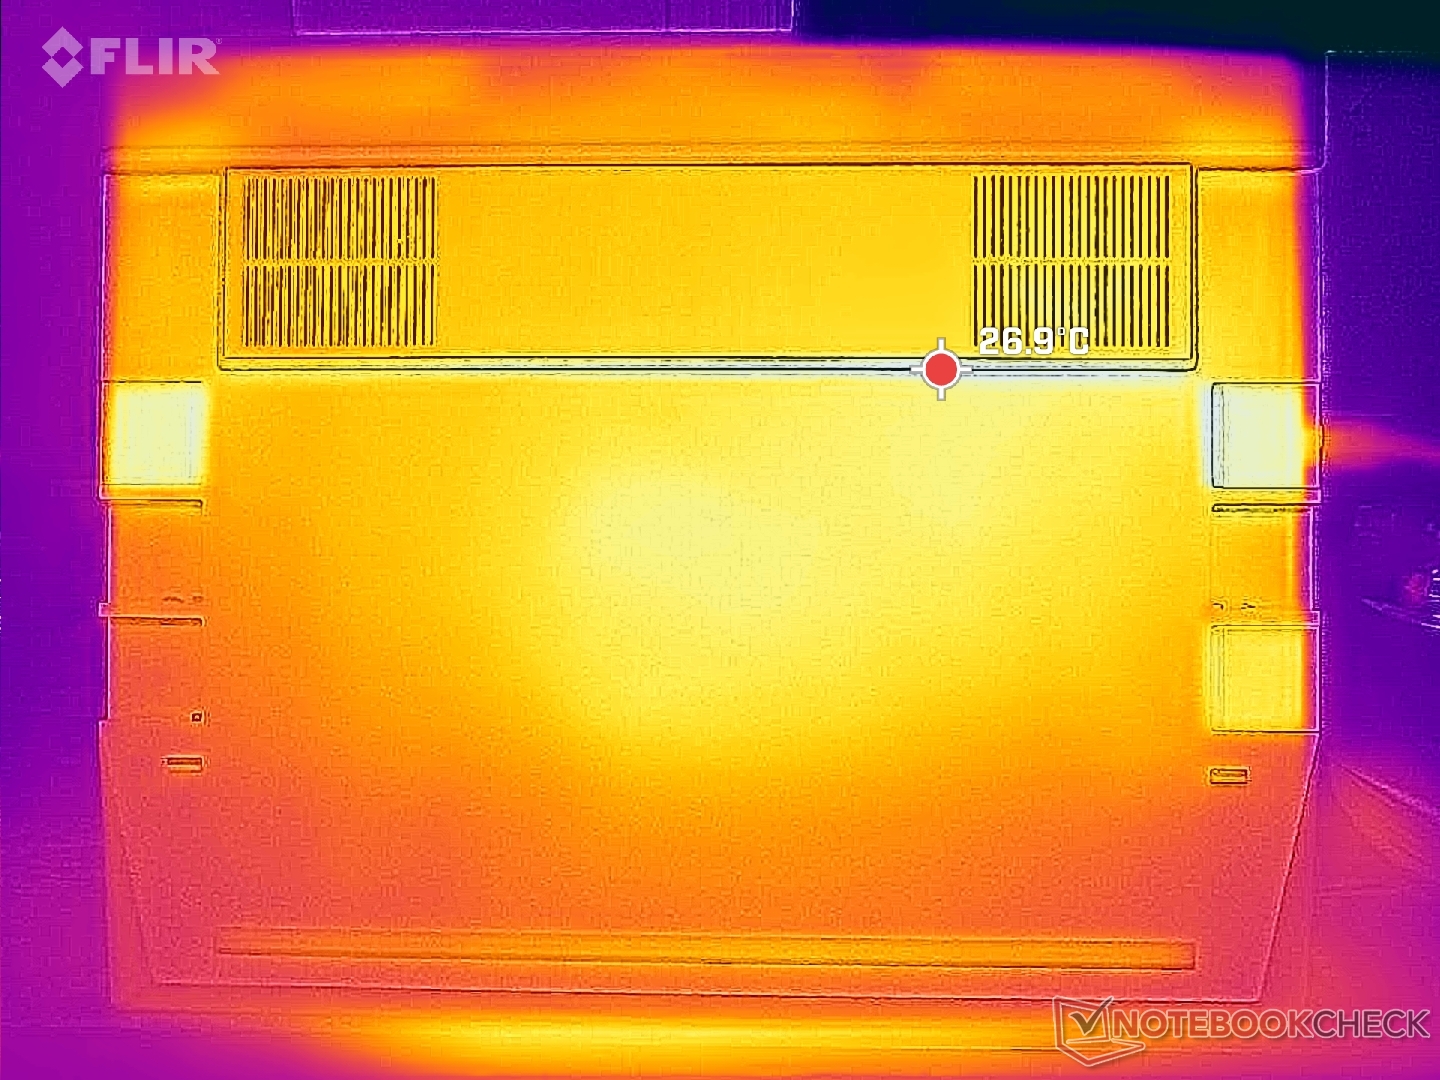
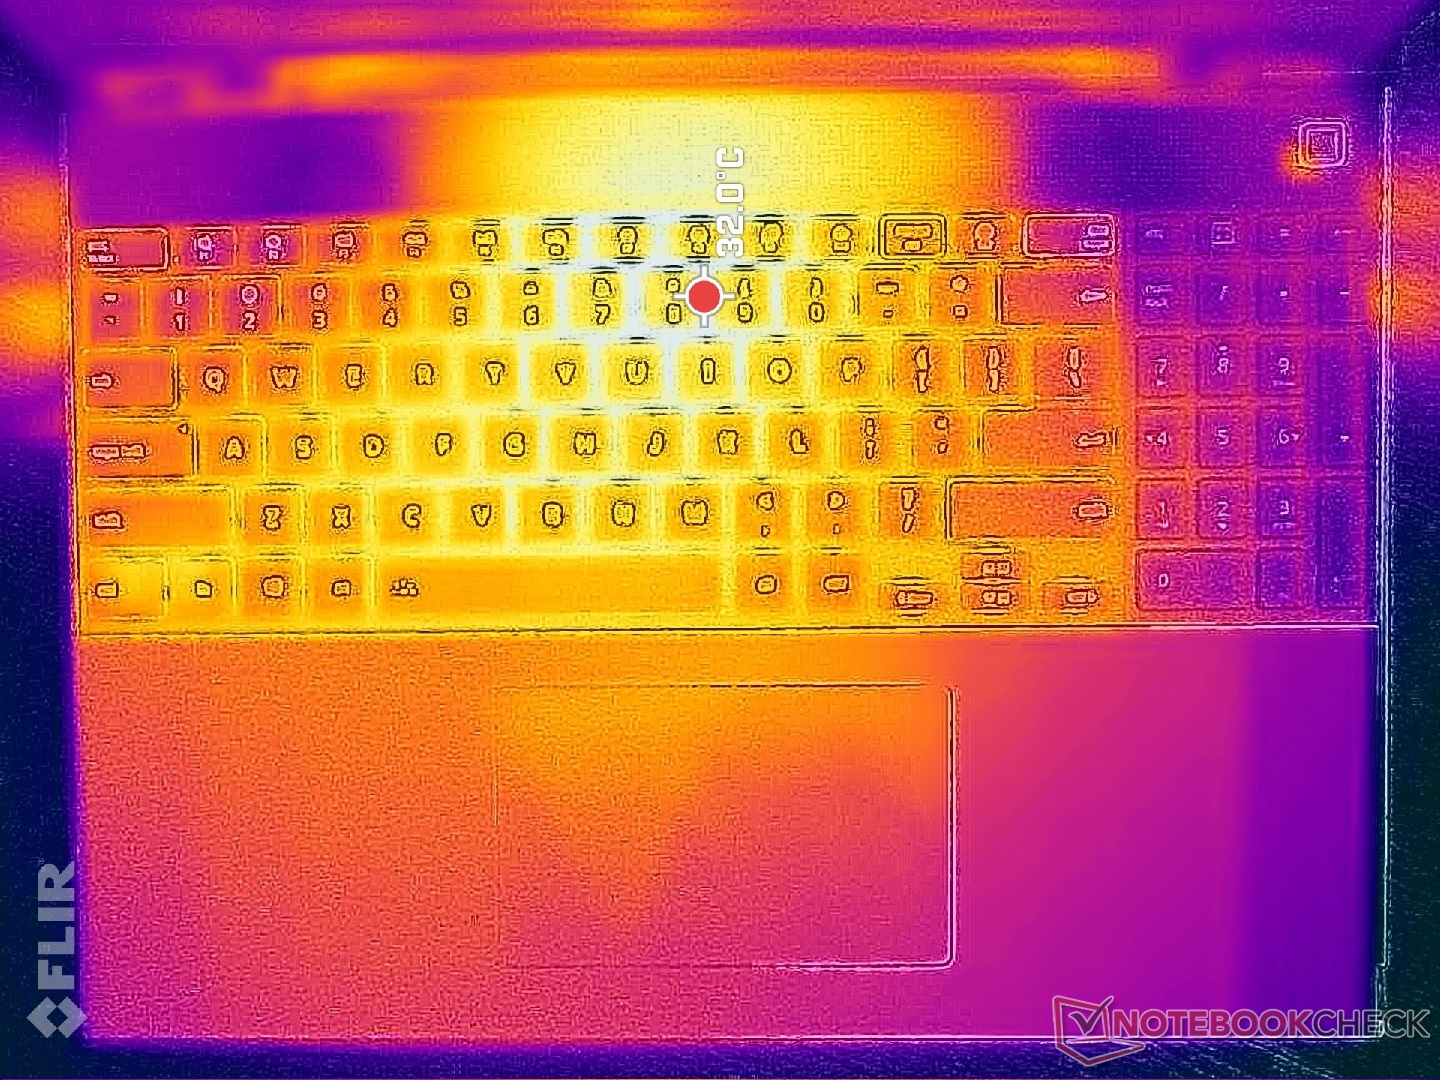
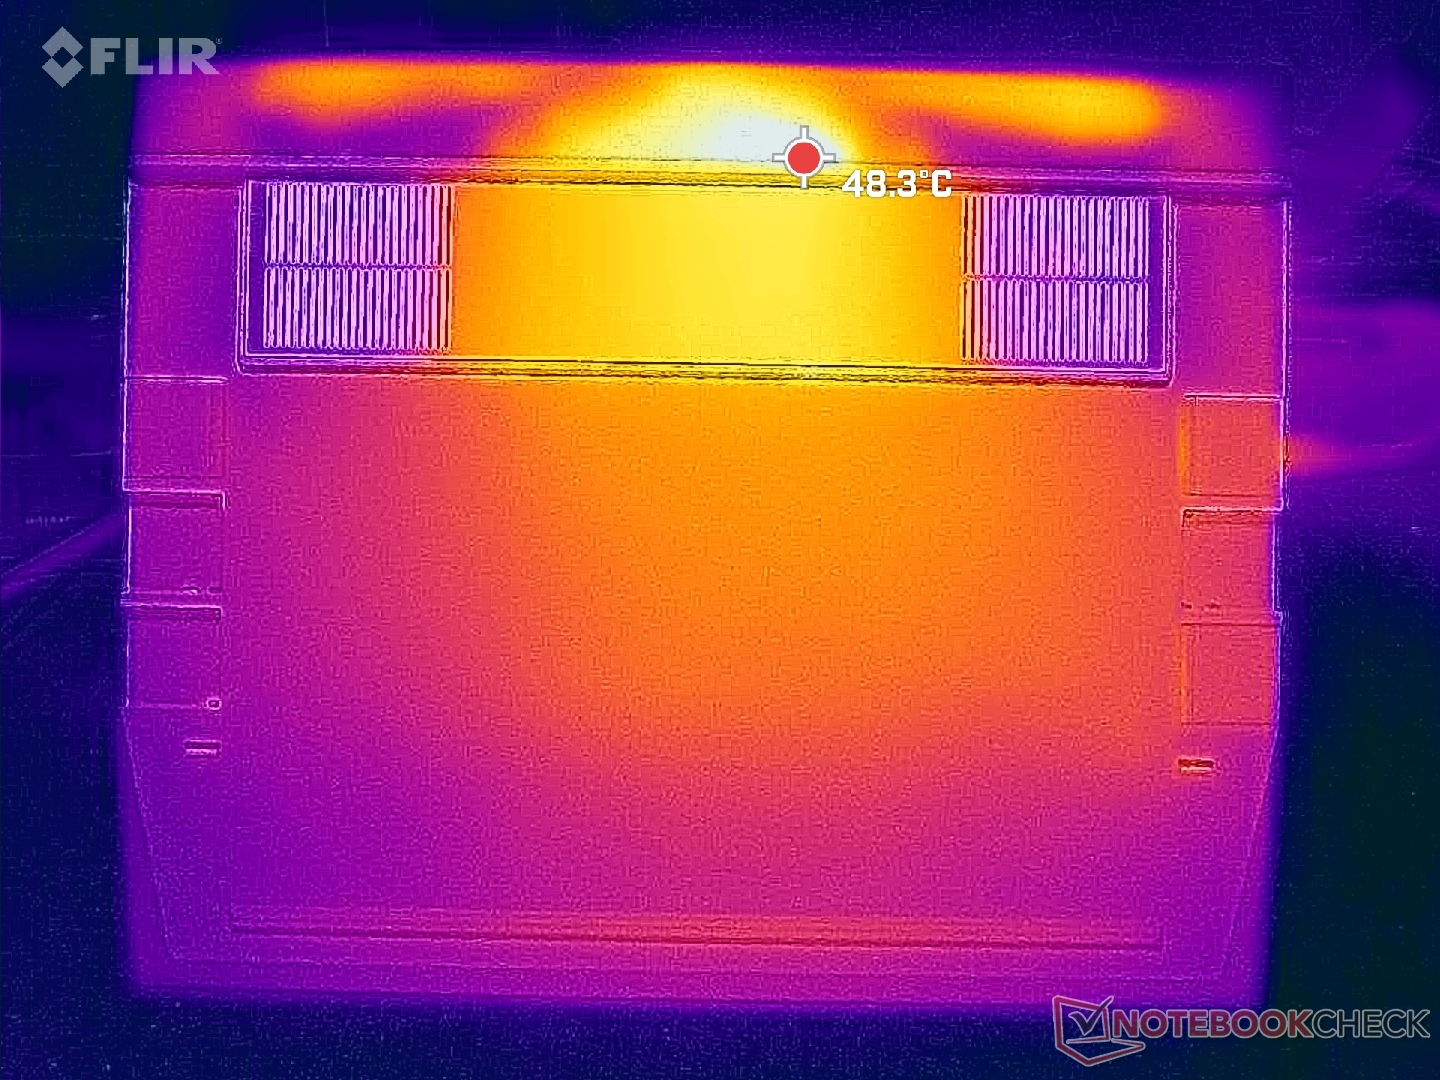
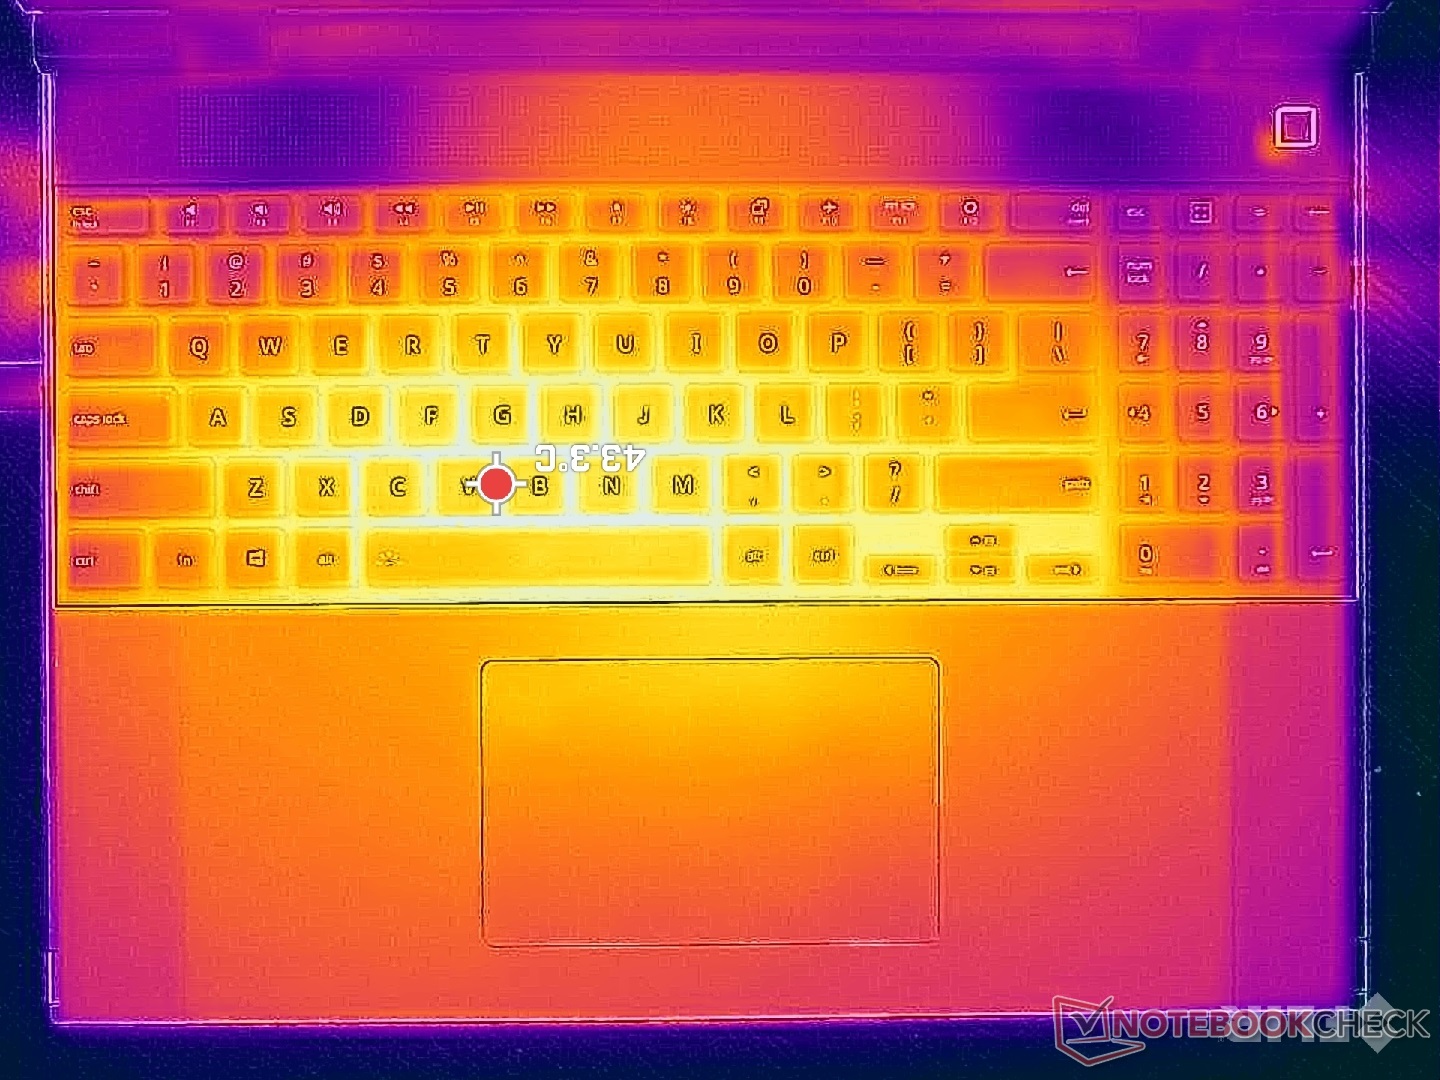
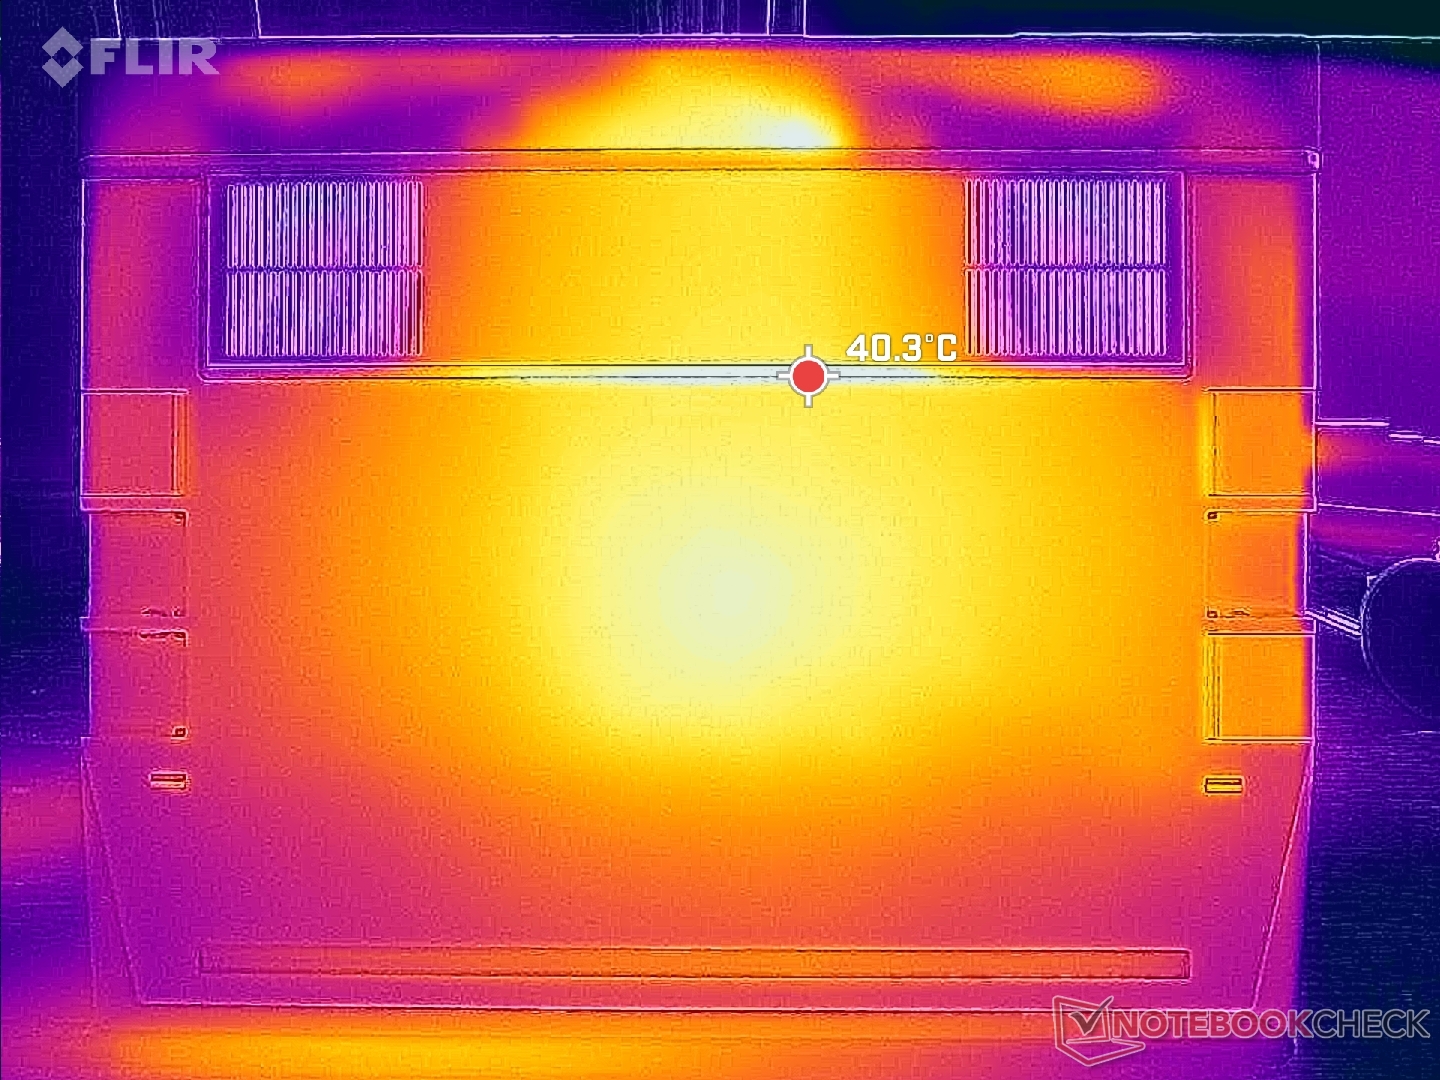
As temperaturas da superfície são sempre quentes devido ao chassi de metal e às ventoinhas letárgicas. Ao executar cargas mais exigentes, como jogos, os pontos quentes podem chegar a mais de 40 °C nas laterais superior e inferior da base do laptop. Os pontos quentes estão mais próximos do centro do Laptop 16, ao passo que, na maioria dos outros laptops, geralmente ficam na parte traseira. Isso significa que é mais provável que o usuário perceba o aquecimento do sistema Framework durante o uso, em comparação com algo como o HP Spectre x360 16 onde os apoios para as mãos e as áreas frontais tendem a ser mais frias. Mesmo assim, nunca achamos que o Laptop 16 fosse desconfortavelmente quente para a pele.
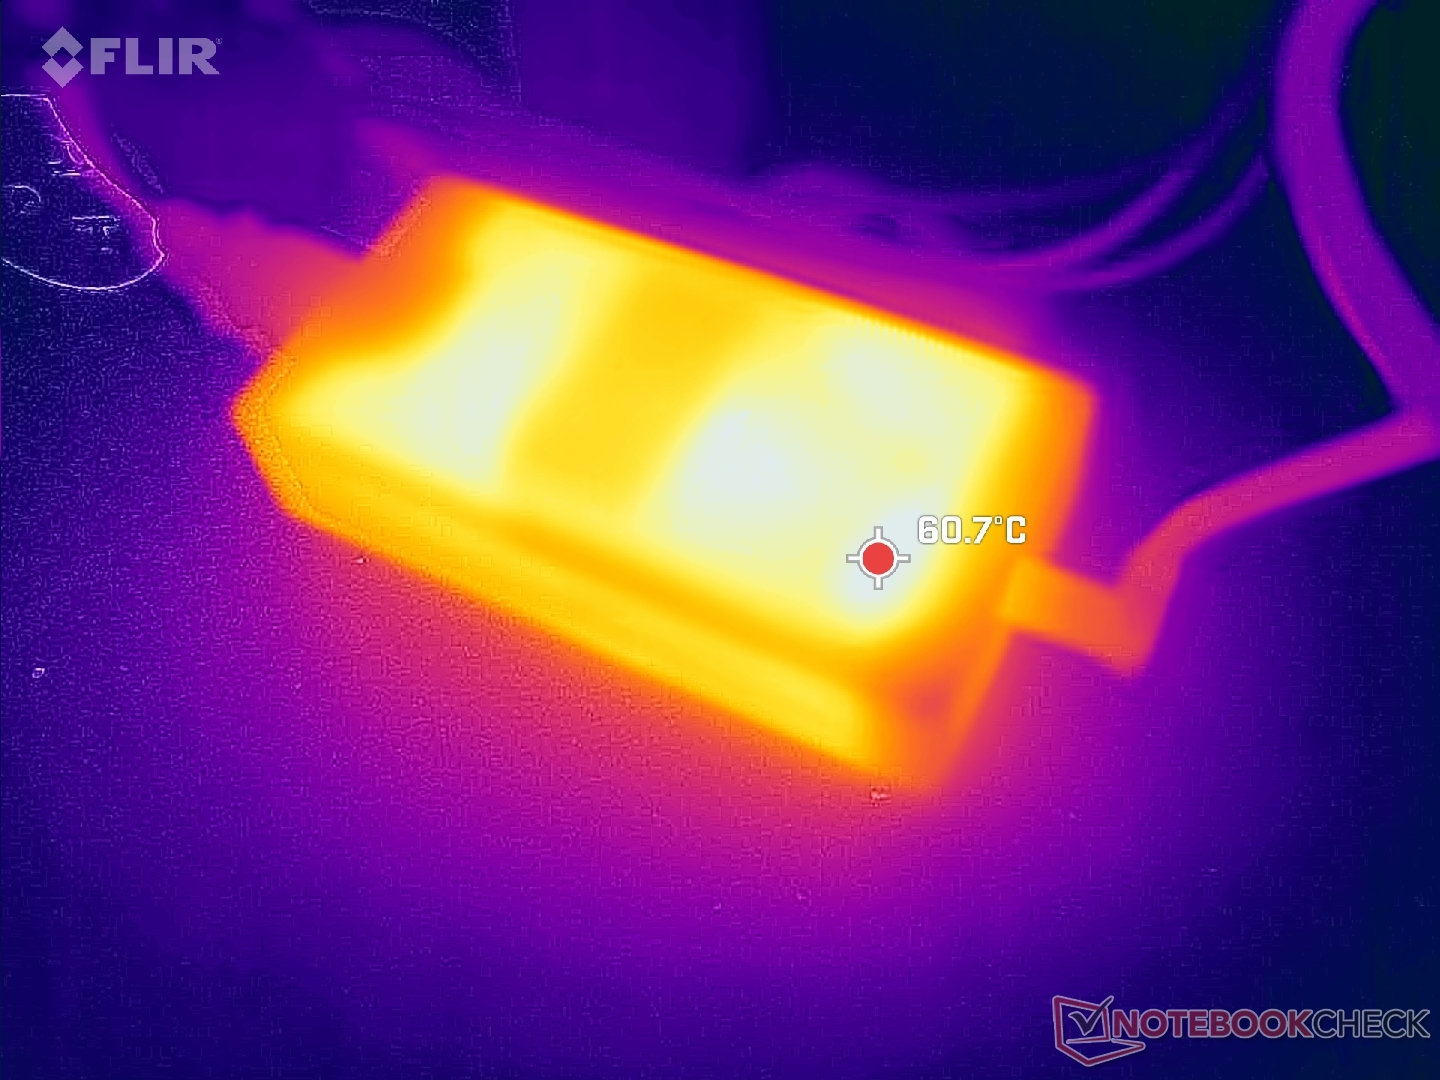
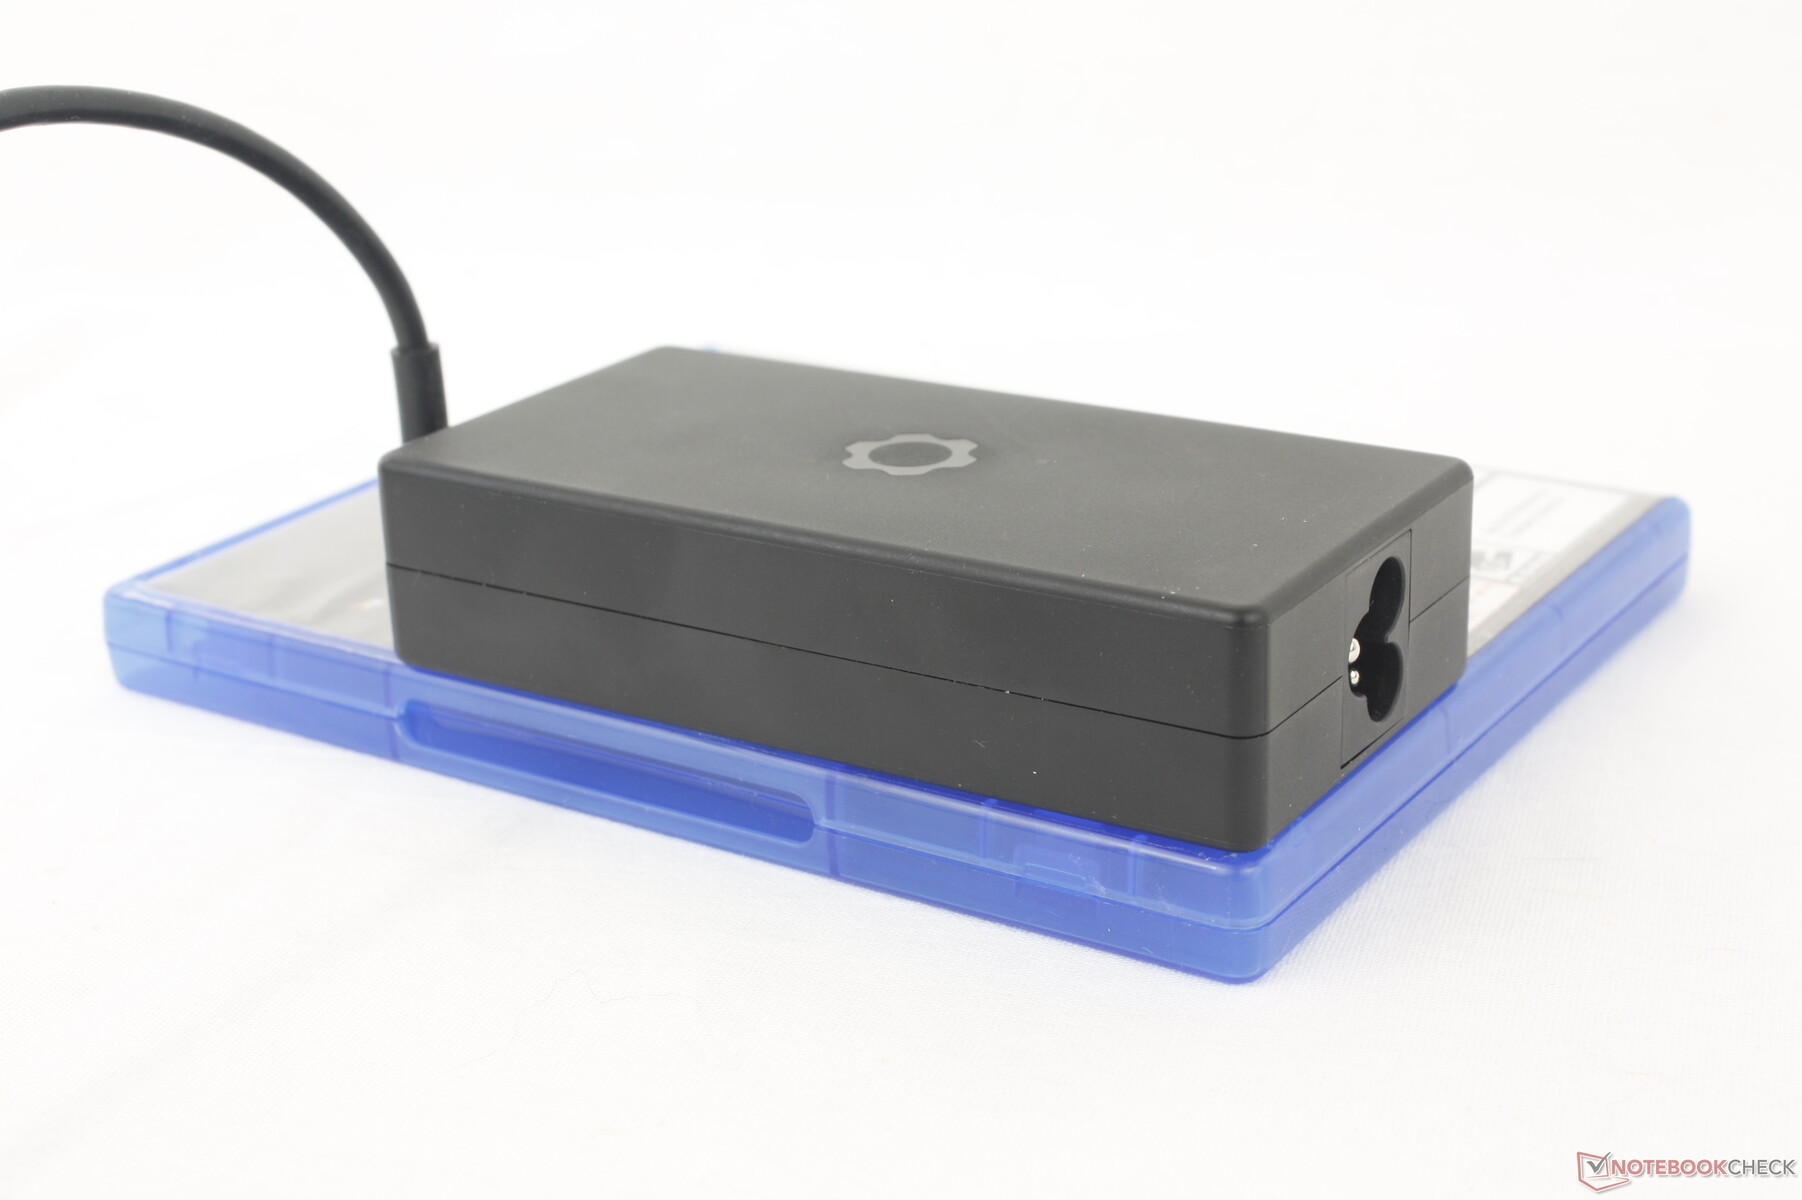
Lembre-se de que o adaptador CA USB-C de 180 W é um dos menores que já vimos (~11,6 x 5,7 x 2,6 cm) para sua saída de energia. Seu tamanho compacto é possível graças aos transistores GaN, uma tecnologia que a Razer também utiliza em seus próprios adaptadores CA. A desvantagem do GaN é que os próprios adaptadores podem esquentar muito, acima de 60 °C, de acordo com nossa experiência. Em comparação, os carregadores maiores sem GaN normalmente variam entre 40 C e 50 C sob carga.
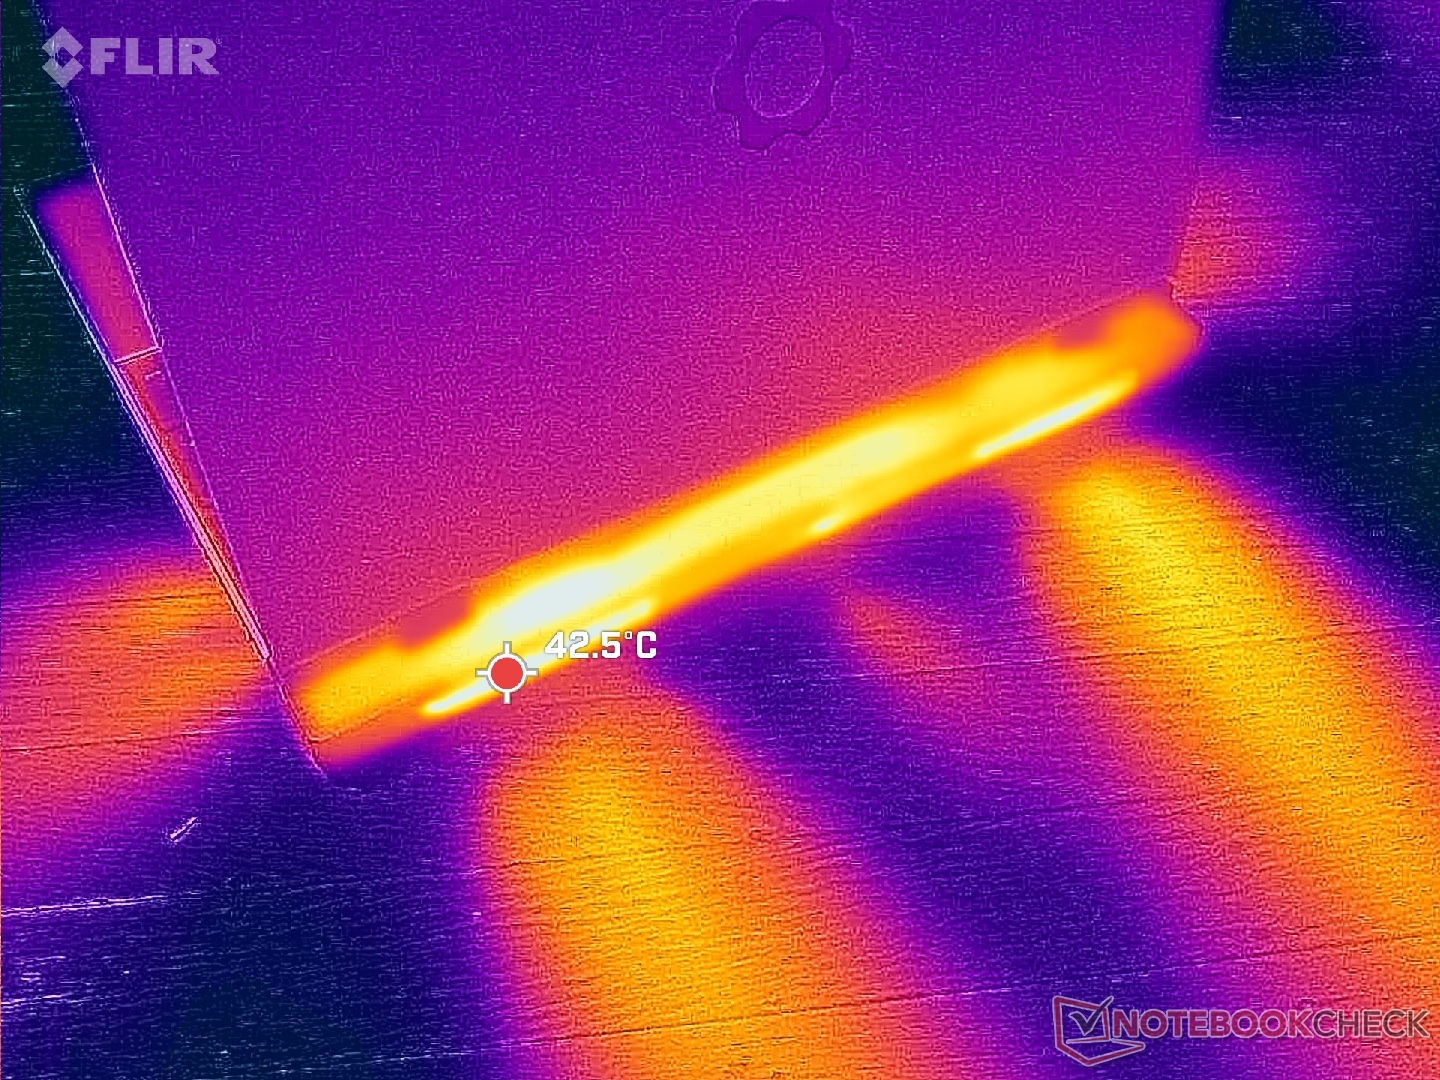
(±) A temperatura máxima no lado superior é 42.4 °C / 108 F, em comparação com a média de 36.8 °C / 98 F , variando de 21 a 71 °C para a classe Multimedia.
(±) A parte inferior aquece até um máximo de 40.8 °C / 105 F, em comparação com a média de 39.1 °C / 102 F
(+) Em uso inativo, a temperatura média para o lado superior é 28.7 °C / 84 F, em comparação com a média do dispositivo de 31.3 °C / ### class_avg_f### F.
(+) Jogando The Witcher 3, a temperatura média para o lado superior é 30.2 °C / 86 F, em comparação com a média do dispositivo de 31.3 °C / ## #class_avg_f### F.
(+) Os apoios para as mãos e o touchpad estão atingindo a temperatura máxima da pele (33.2 °C / 91.8 F) e, portanto, não estão quentes.
(-) A temperatura média da área do apoio para as mãos de dispositivos semelhantes foi 28.7 °C / 83.7 F (-4.5 °C / -8.1 F).
| Framework Laptop 16 AMD Ryzen 9 7940HS, AMD Radeon RX 7700S | MSI Prestige 16 B1MG-001US Intel Core Ultra 7 155H, Intel Arc 8-Core iGPU | Lenovo ThinkPad Z16 Gen 2 AMD Ryzen 9 PRO 7940HS, AMD Radeon RX 6550M | Apple MacBook Pro 16 2023 M3 Max Apple M3 Max 16-Core, Apple M3 Max 40-Core GPU | Dell Inspiron 16 Plus 7630 Intel Core i7-13700H, NVIDIA GeForce RTX 4060 Laptop GPU | HP Spectre x360 2-in-1 16-f1075ng Intel Core i7-12700H, Intel Iris Xe Graphics G7 96EUs | |
|---|---|---|---|---|---|---|
| Heat | 2% | 13% | 11% | -14% | 9% | |
| Maximum Upper Side * (°C) | 42.4 | 48.8 -15% | 43 -1% | 42.3 -0% | 47.8 -13% | 37.4 12% |
| Maximum Bottom * (°C) | 40.8 | 47.6 -17% | 41.6 -2% | 42 -3% | 42.2 -3% | 39.1 4% |
| Idle Upper Side * (°C) | 31.4 | 24.2 23% | 21.2 32% | 22.5 28% | 35.2 -12% | 27.1 14% |
| Idle Bottom * (°C) | 27.8 | 23.6 15% | 21.4 23% | 22.9 18% | 35 -26% | 26.3 5% |
* ... menor é melhor
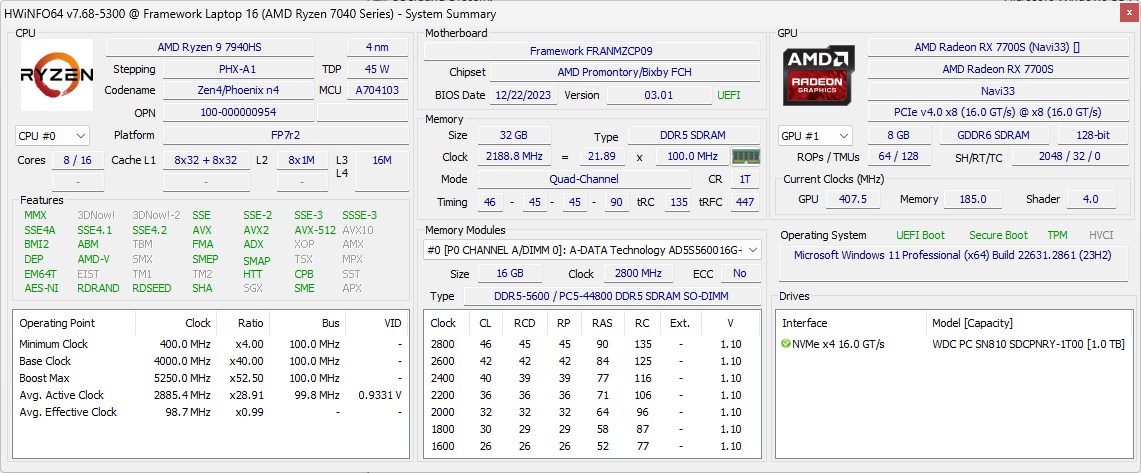
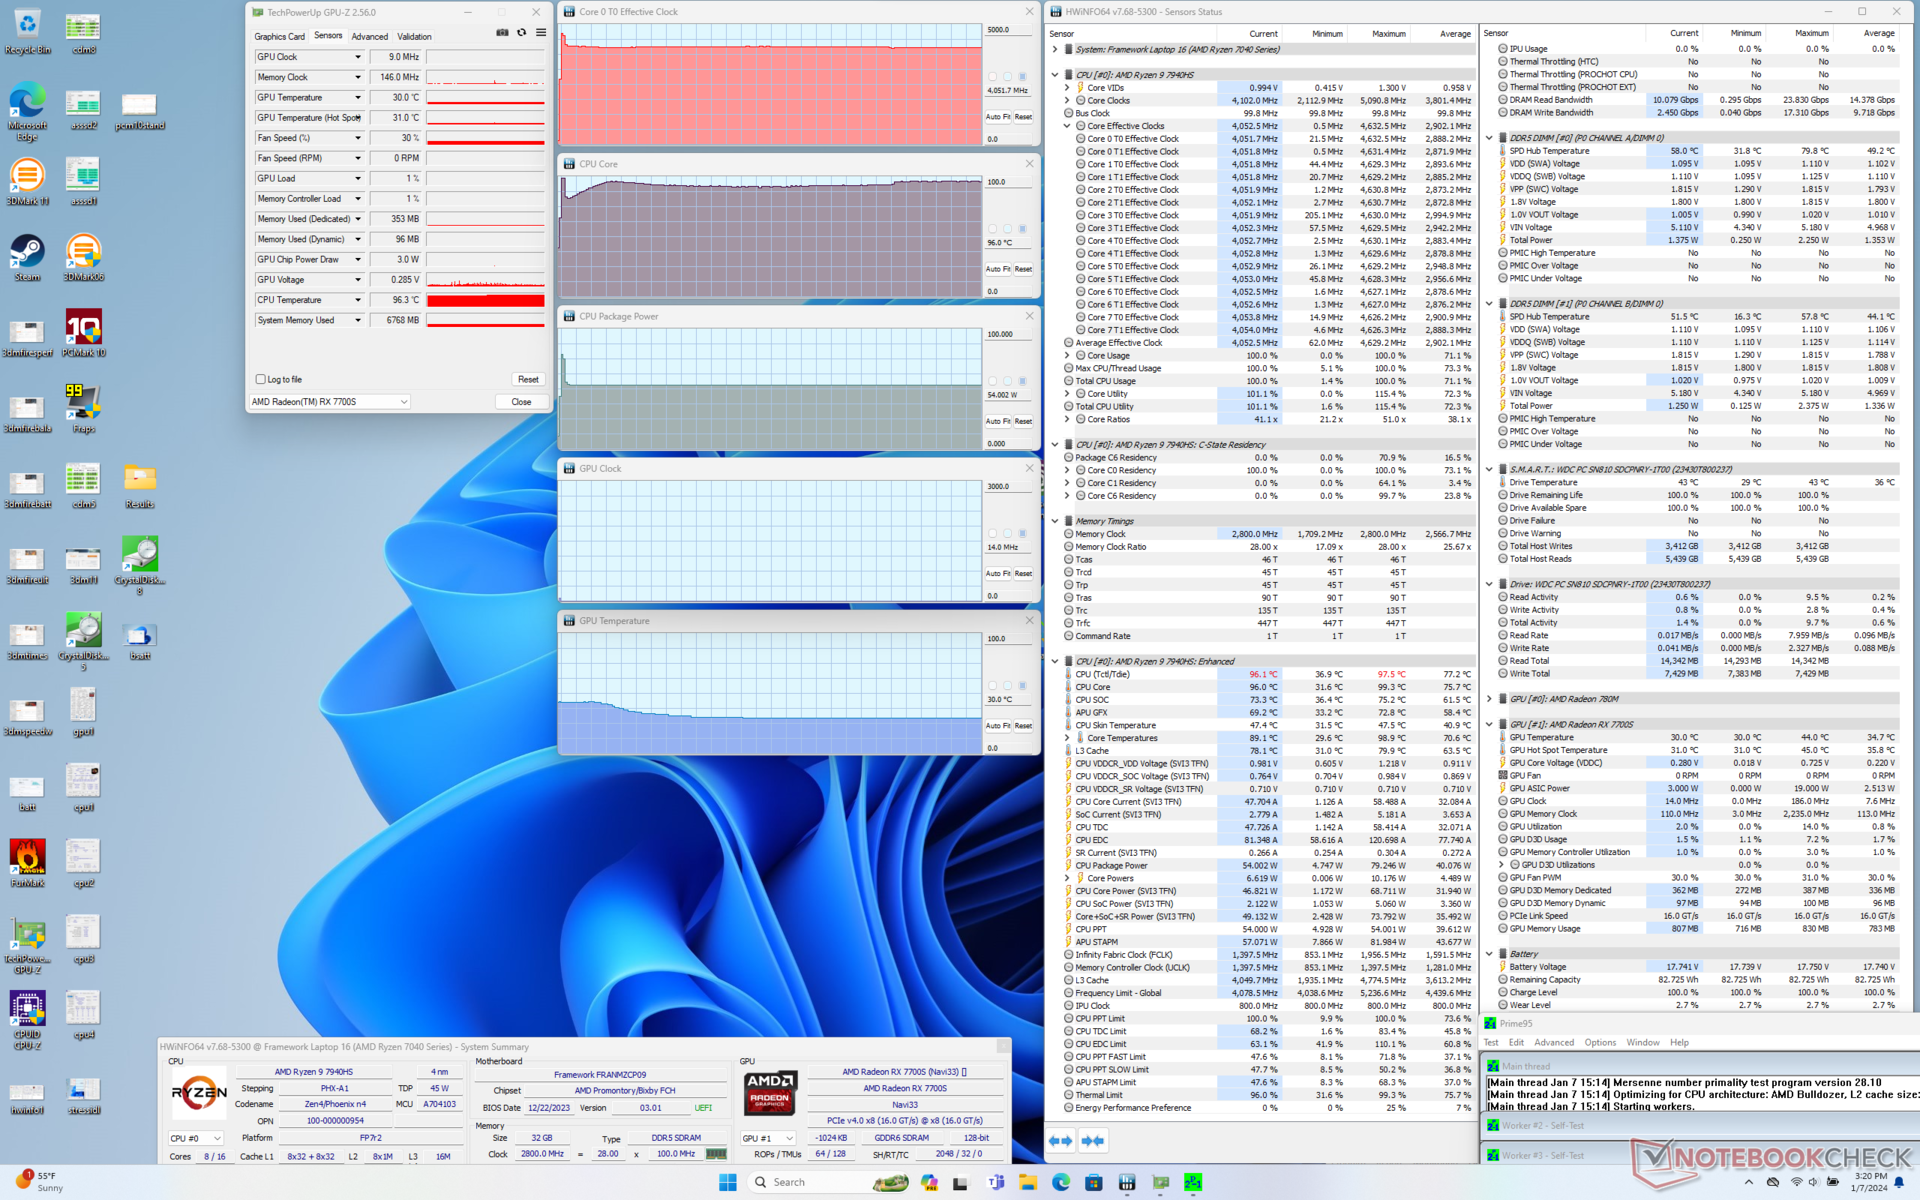
Teste de estresse
A CPU aumentava para 4,6 GHz e 80 W nos primeiros segundos ao iniciar o estresse do Prime95, antes de cair rapidamente e se estabilizar em 4,0 GHz, 54 W e 96 C. Repetindo esse mesmo teste no Lenovo Slim Pro 9i 16 com o Core i9-13905H resultaria em uma temperatura de núcleo mais fria, de 82 C. Isso sugere que a estrutura prefere aumentar o desempenho do processador e limitar o estrangulamento, mesmo que isso signifique temperaturas médias de núcleo mais altas, o que os entusiastas podem apreciar.
A GPU se estabilizaria em 2363 MHz e 99 W durante a execução Witcher 3 o que significa que ela pode utilizar todo o seu orçamento de 100 W em jogos. A temperatura do núcleo permaneceria decentemente baixa, em 66 °C, em comparação com 62 °C no Lenovo com tecnologia GeForce mencionado anteriormente.
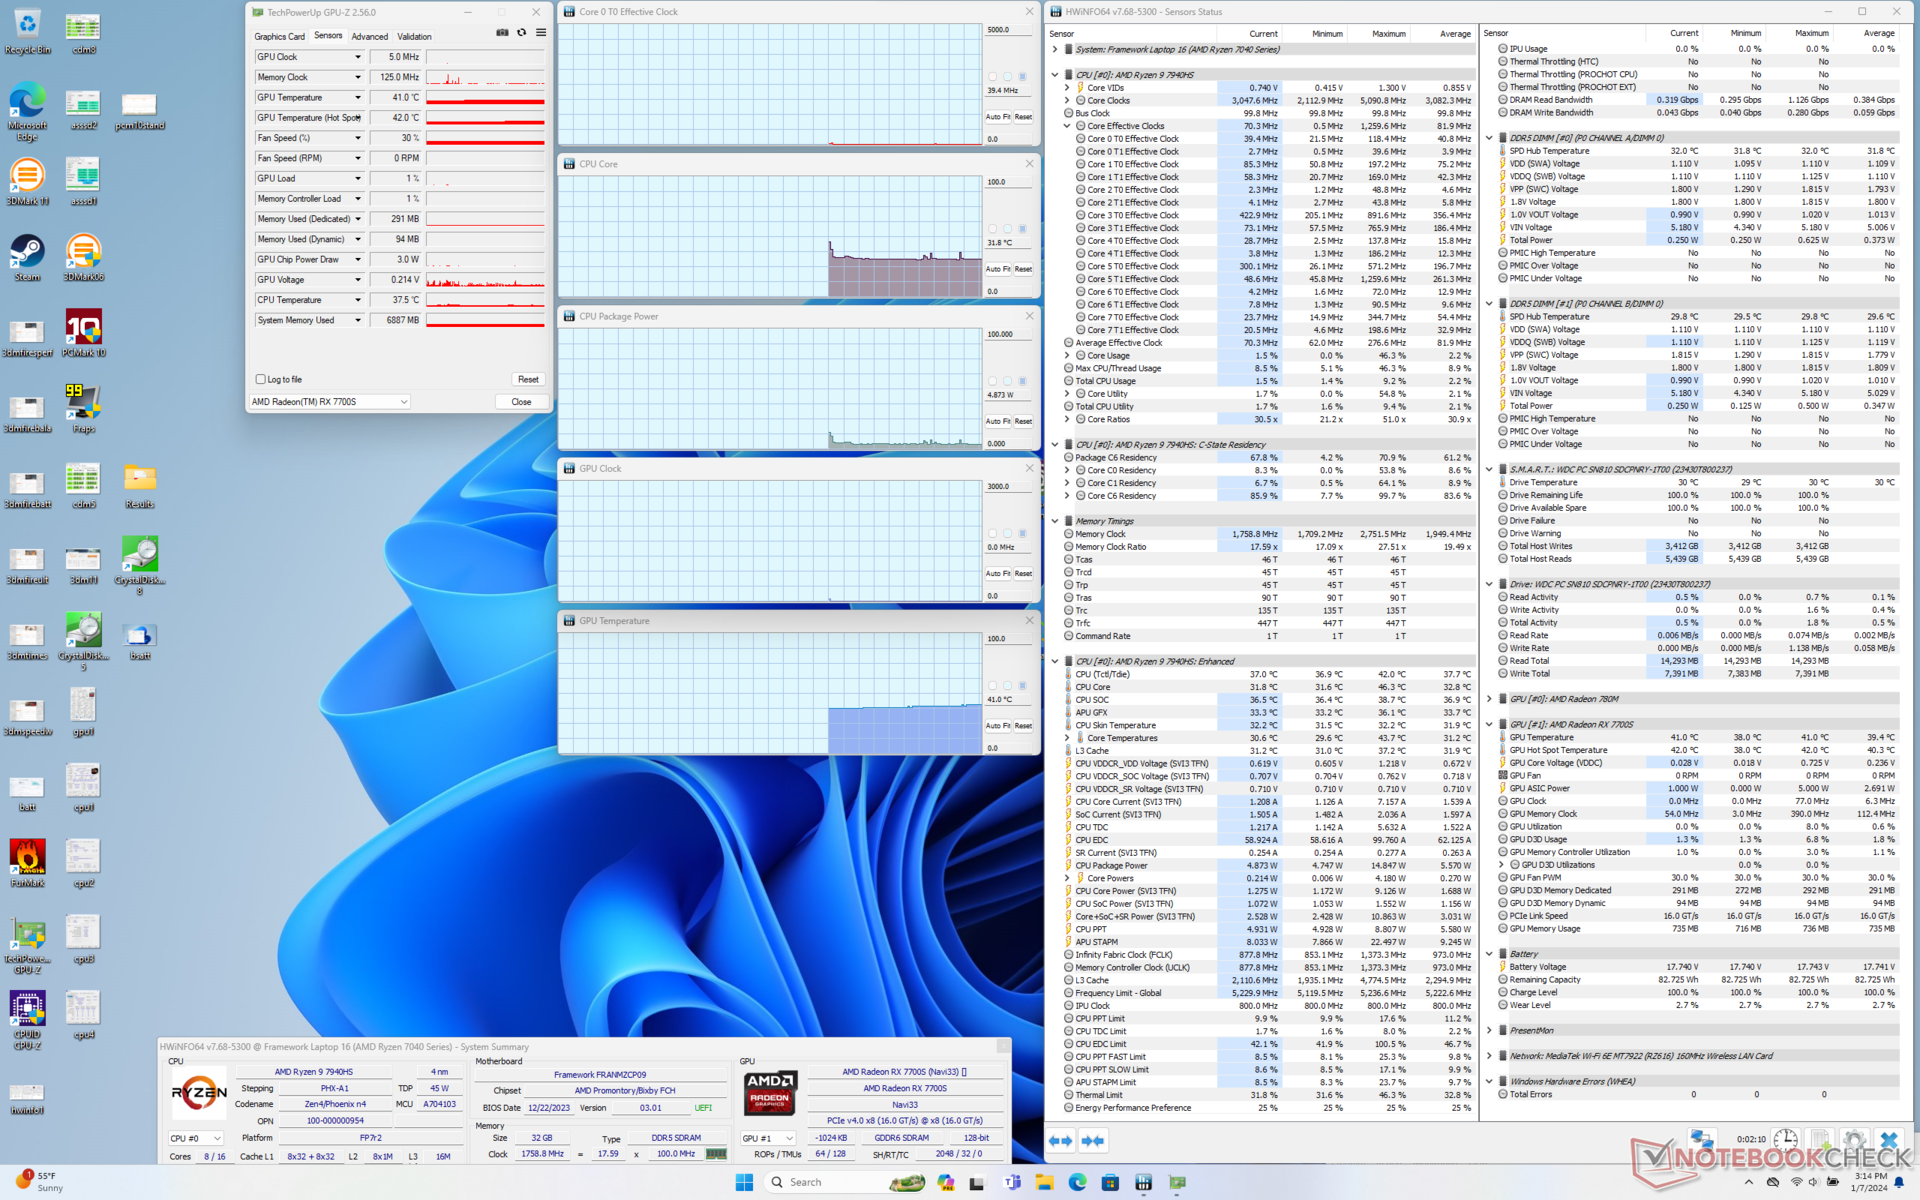
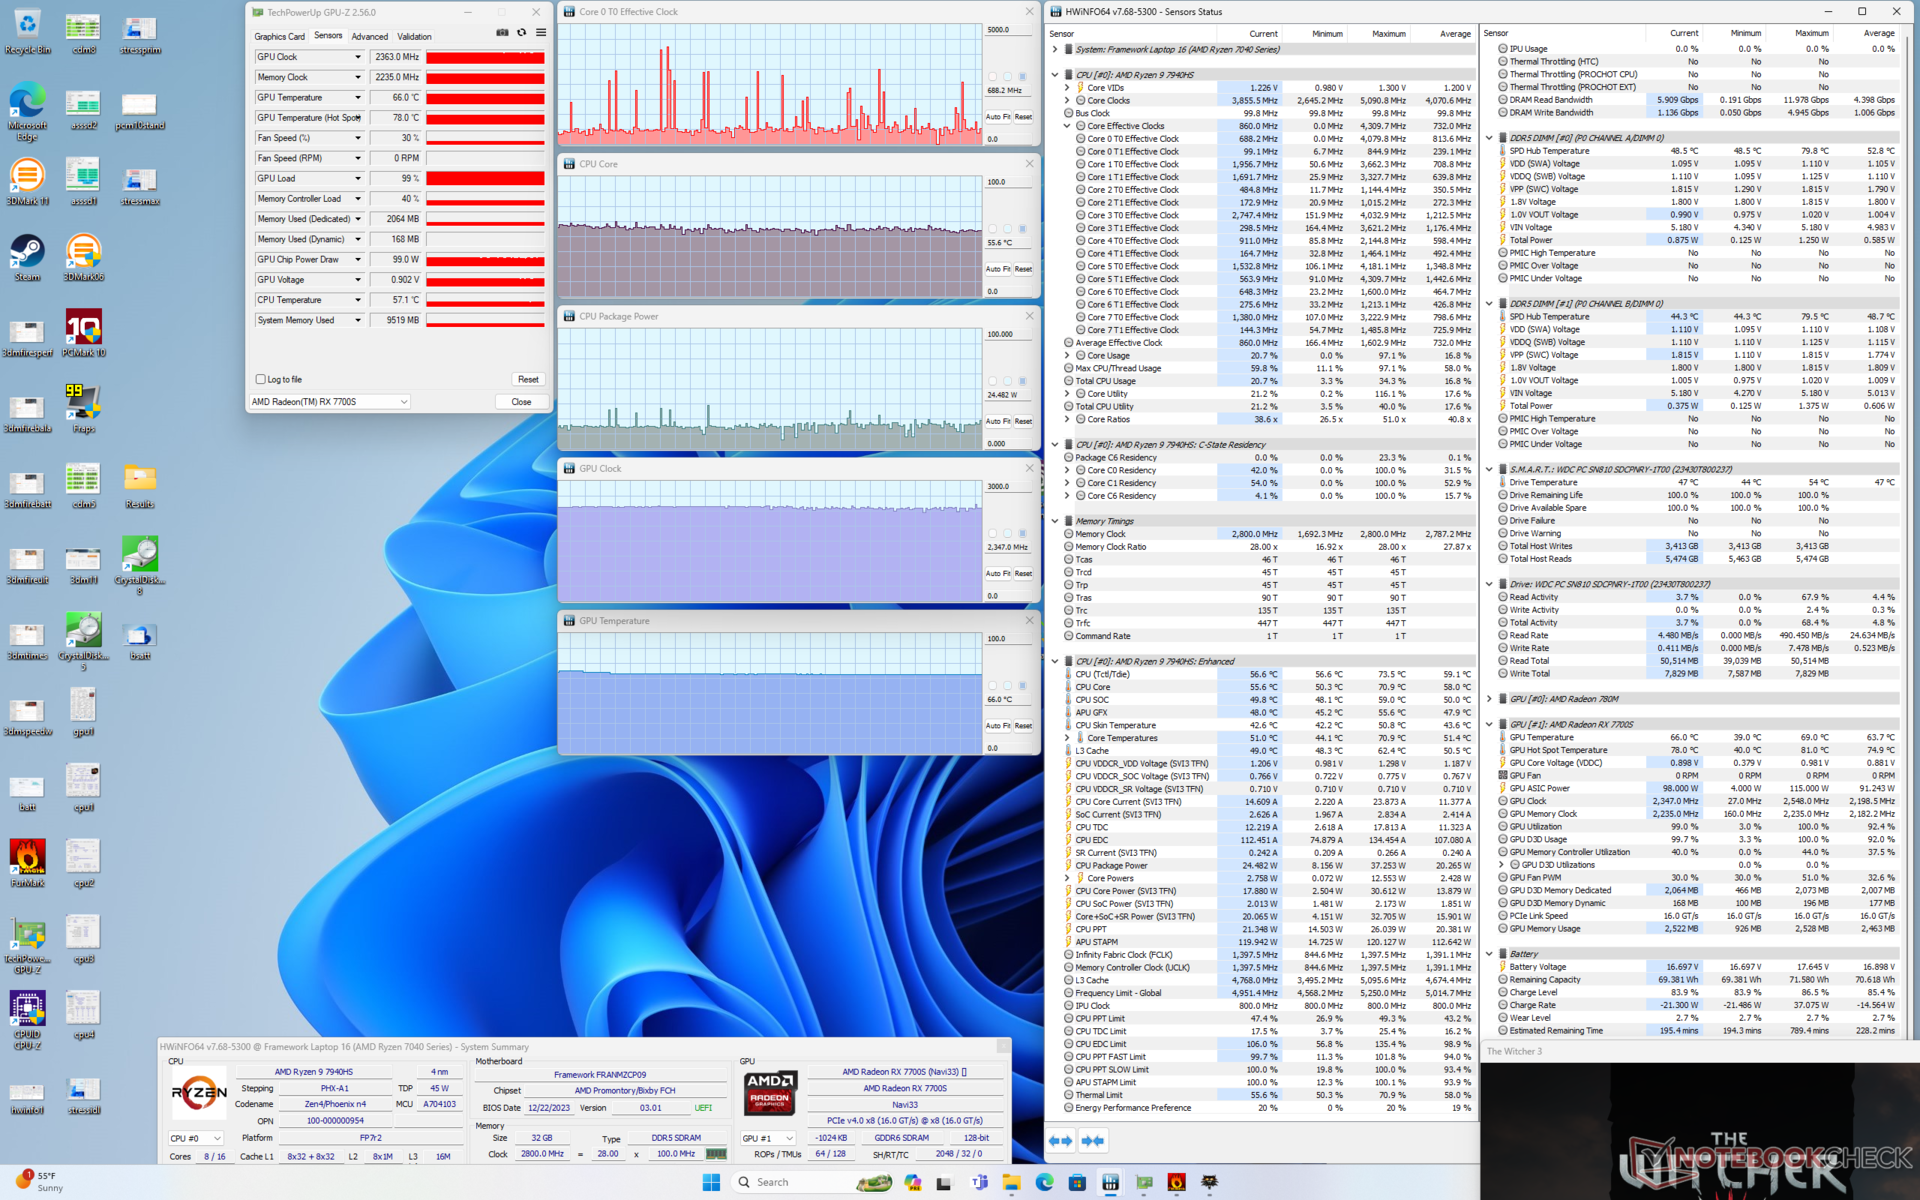
| CPU Clock (GHz) | GPU Clock (MHz) | Temperatura média da CPU (°C) | Temperatura média da GPU (°C) | |
| Sistema ocioso | -- | -- | 32 | 41 |
| Estressedo Prime95 | 4.0 | -- | 96 | 30 |
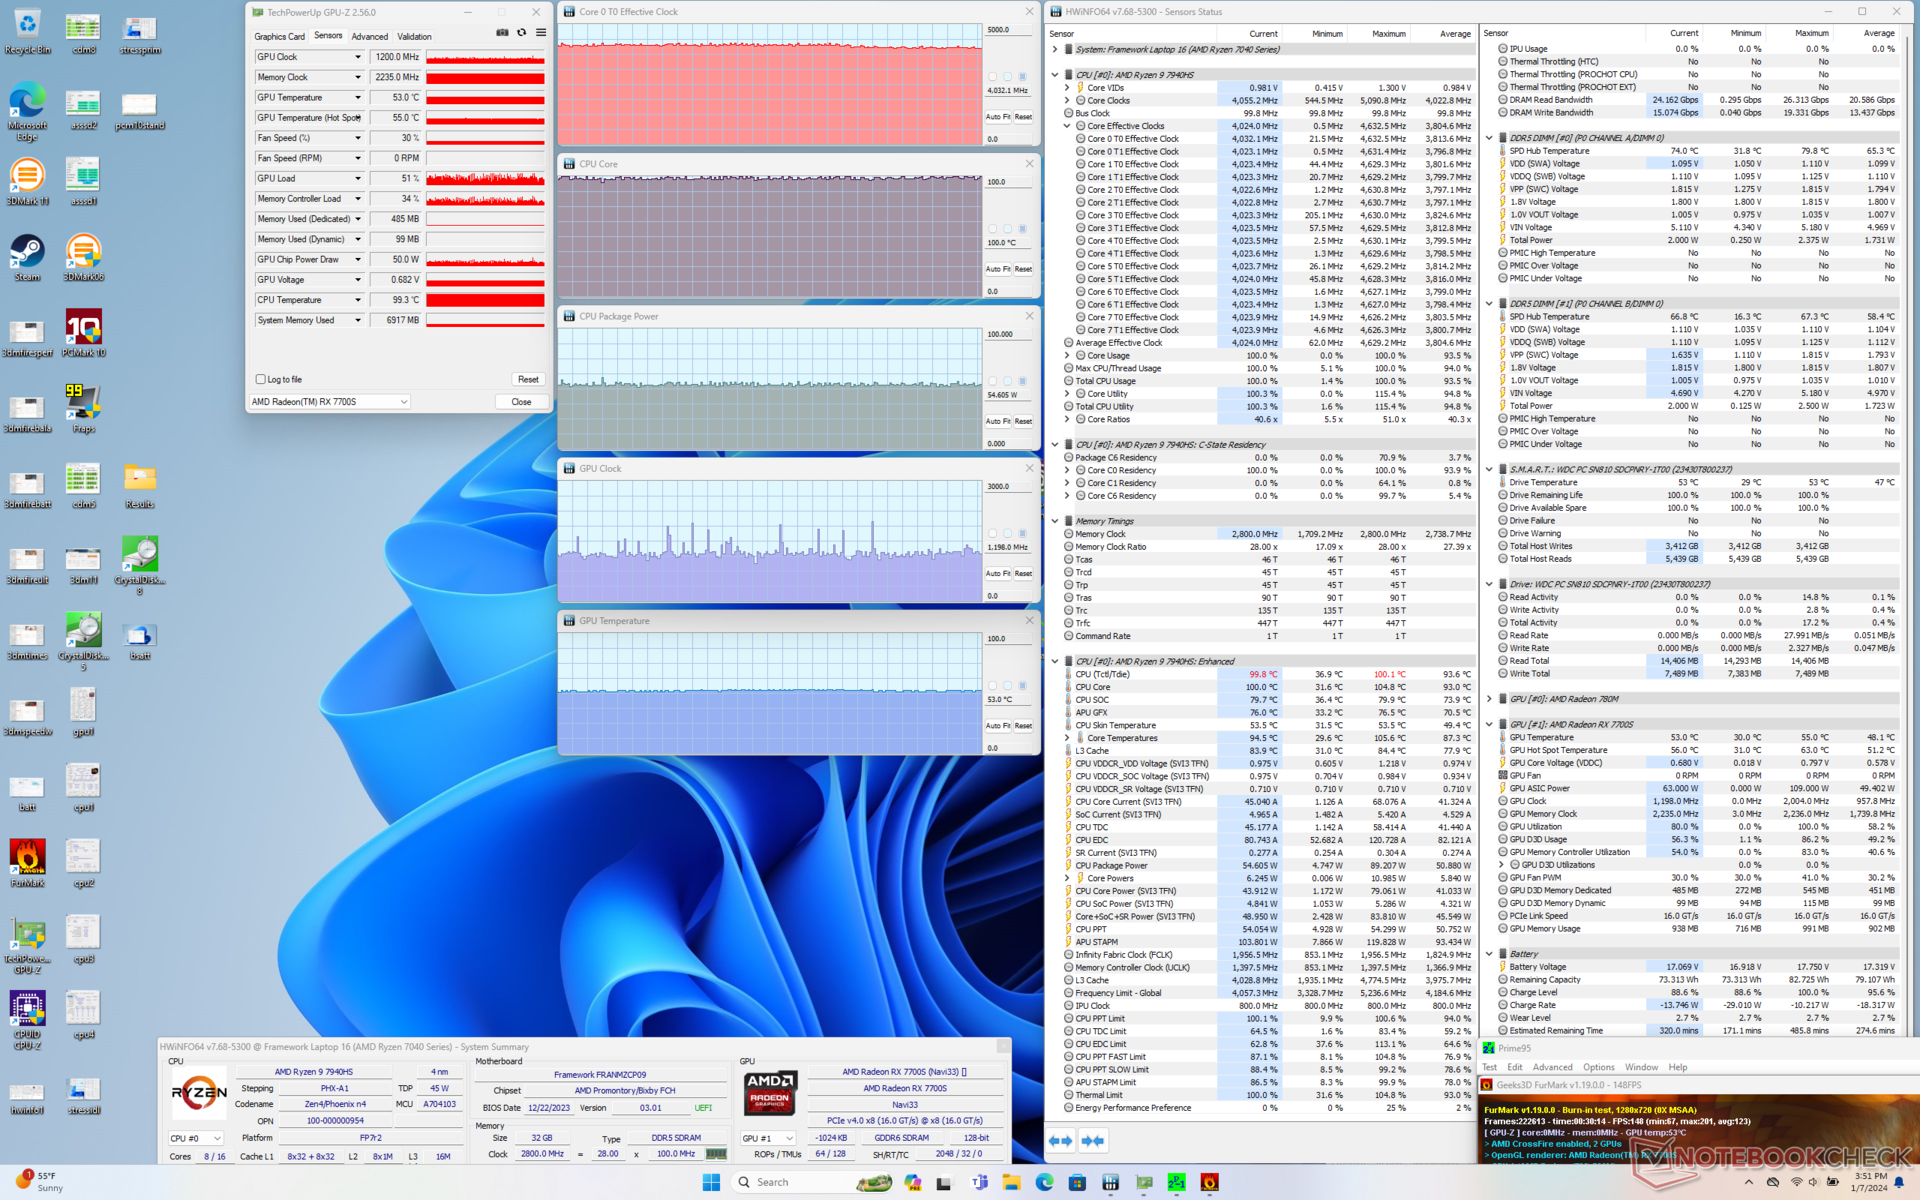
| Prime95 + FurMark Stress | 4.0 | 1200 | 100 | 53 |
| Witcher 3 Estresse | ~0,7 | 2363 | 56 | 66 |
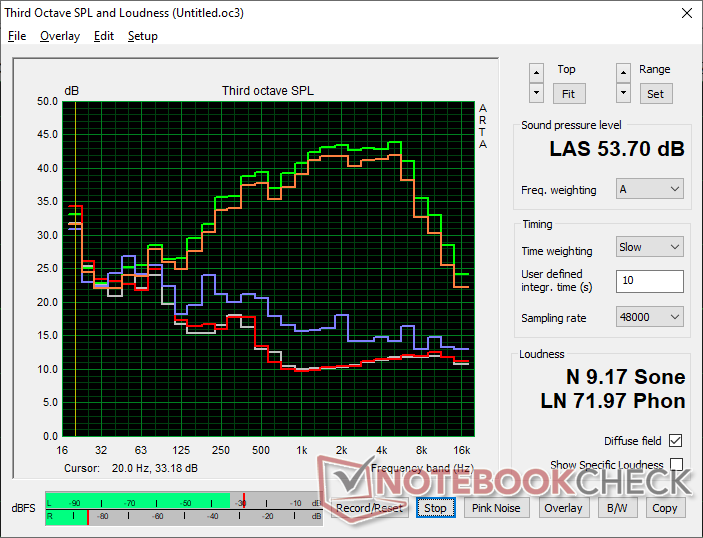
Alto-falantes
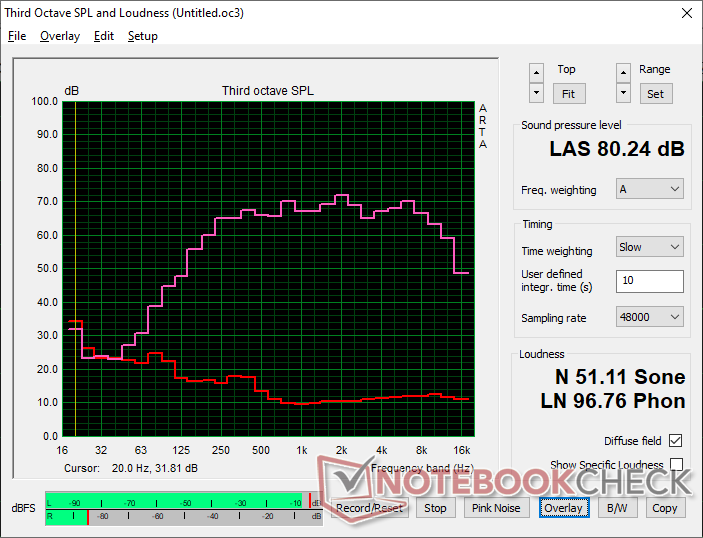
Framework Laptop 16 análise de áudio
(±) | o volume do alto-falante é médio, mas bom (###valor### dB)
Graves 100 - 315Hz
(±) | graves reduzidos - em média 9.6% menor que a mediana
(±) | a linearidade dos graves é média (8.1% delta para a frequência anterior)
Médios 400 - 2.000 Hz
(+) | médios equilibrados - apenas 2.2% longe da mediana
(+) | médios são lineares (3.8% delta para frequência anterior)
Altos 2 - 16 kHz
(+) | agudos equilibrados - apenas 2% longe da mediana
(+) | os máximos são lineares (4.9% delta da frequência anterior)
Geral 100 - 16.000 Hz
(+) | o som geral é linear (10.5% diferença em relação à mediana)
Comparado com a mesma classe
» 16% de todos os dispositivos testados nesta classe foram melhores, 1% semelhantes, 83% piores
» O melhor teve um delta de 5%, a média foi 17%, o pior foi 45%
Comparado com todos os dispositivos testados
» 5% de todos os dispositivos testados foram melhores, 1% semelhantes, 93% piores
» O melhor teve um delta de 4%, a média foi 23%, o pior foi 134%
Apple MacBook Pro 16 2021 M1 Pro análise de áudio
(+) | os alto-falantes podem tocar relativamente alto (###valor### dB)
Graves 100 - 315Hz
(+) | bons graves - apenas 3.8% longe da mediana
(+) | o baixo é linear (5.2% delta para a frequência anterior)
Médios 400 - 2.000 Hz
(+) | médios equilibrados - apenas 1.3% longe da mediana
(+) | médios são lineares (2.1% delta para frequência anterior)
Altos 2 - 16 kHz
(+) | agudos equilibrados - apenas 1.9% longe da mediana
(+) | os máximos são lineares (2.7% delta da frequência anterior)
Geral 100 - 16.000 Hz
(+) | o som geral é linear (4.6% diferença em relação à mediana)
Comparado com a mesma classe
» 0% de todos os dispositivos testados nesta classe foram melhores, 0% semelhantes, 100% piores
» O melhor teve um delta de 5%, a média foi 17%, o pior foi 45%
Comparado com todos os dispositivos testados
» 0% de todos os dispositivos testados foram melhores, 0% semelhantes, 100% piores
» O melhor teve um delta de 4%, a média foi 23%, o pior foi 134%
Gerenciamento de energia
Consumo de energia
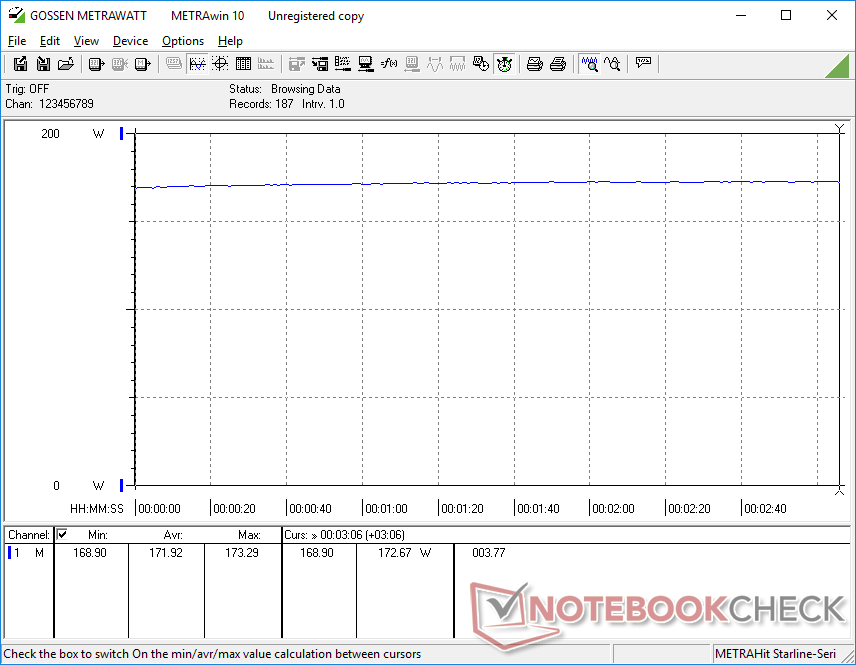
O consumo de energia é comparável ao do Dell Inspiron 16 Plus ou do MacBook Pro 16 2023 quando em marcha lenta ou ao executar cargas pouco exigentes. No entanto, ao executar cargas maiores, como jogos, o consumo seria maior do que o esperado. A execução de Witcher 3 exigiria 172 W em comparação com apenas 122 W no Inspiron 16 Plus com RTX 4060. Considerando que a RTX 4060 pode frequentemente superar a Radeon RX 7700S em muitos jogos, o desempenho da GPU por watt do Laptop 16 simplesmente não é tão bom quanto a alternativa da Nvidia, o que confirma nossas afirmações feitas acima.
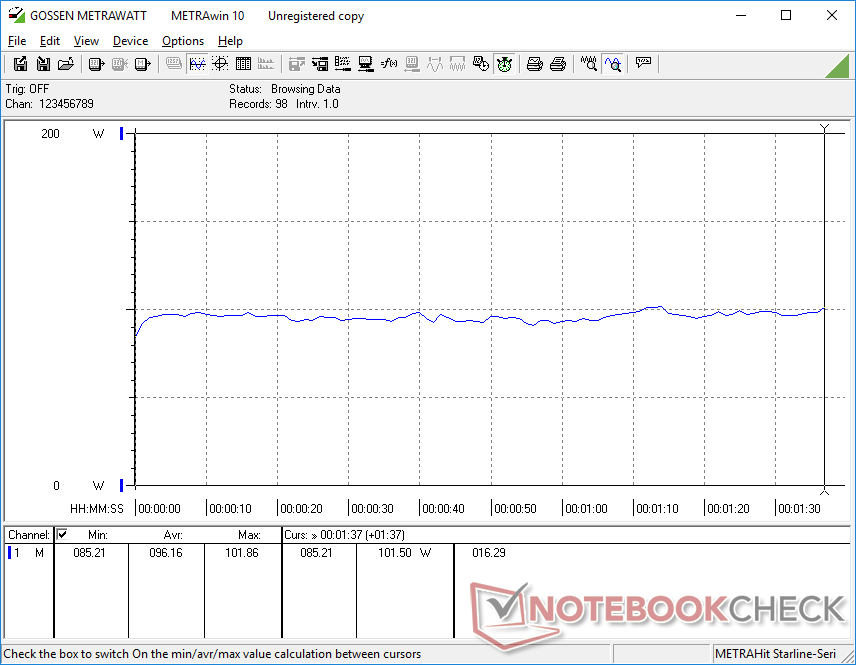
A CPU também pode ser bastante exigente, com um consumo de 110 W em todo o sistema ao executar o Prime95, em comparação com apenas 75 W no MSI Stealth 16 alimentado pelo Core i9-13900H.
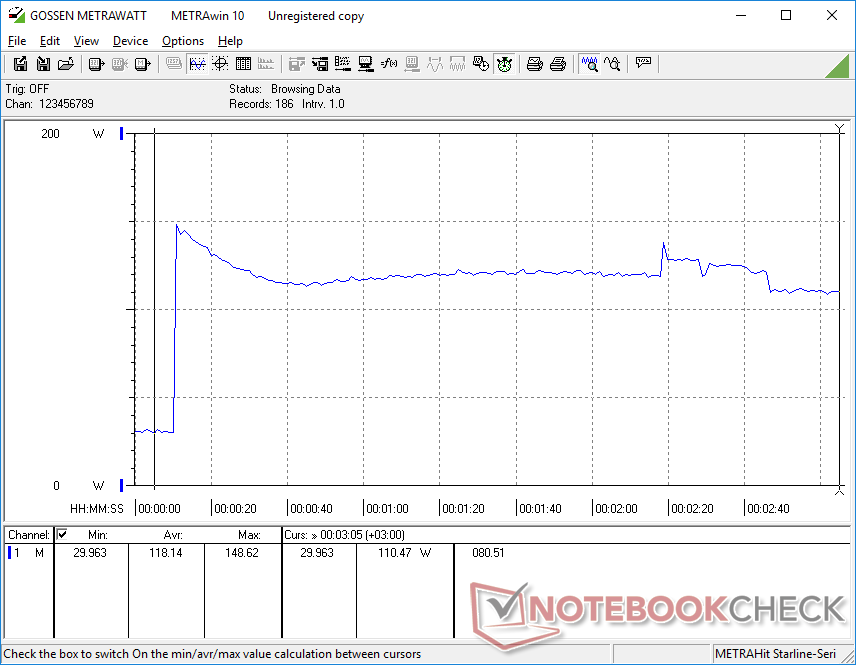
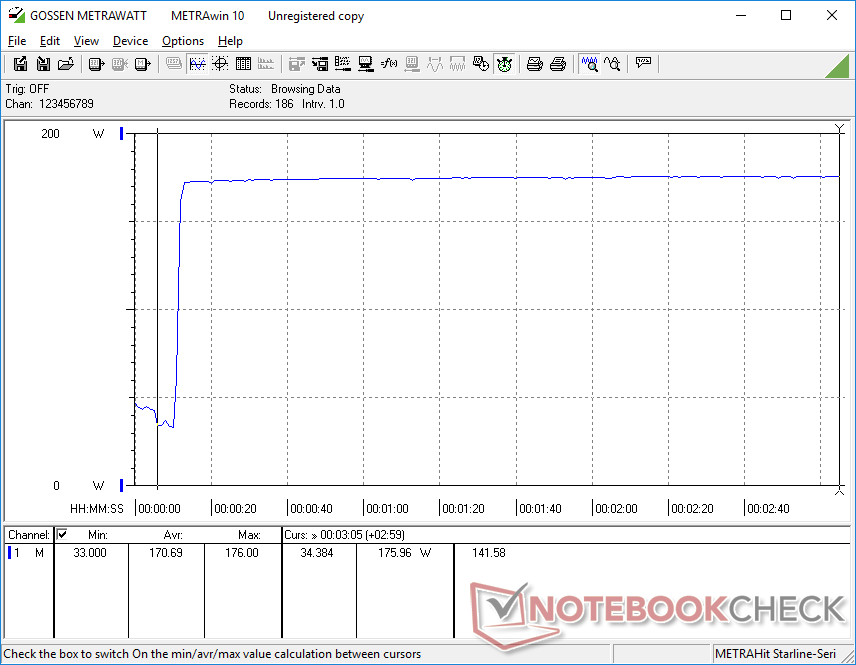
Conseguimos registrar um consumo máximo de 176 W do pequeno adaptador CA USB-C de 180 W ao executar jogos ou outras cargas extremas, como Prime95 e FurMark. É importante observar isso, pois a sobrecarga limitada do adaptador CA pode prejudicar o desempenho ou os recursos de carregamento do notebook. Nesse caso, a taxa de carga é afetada durante a execução de cargas exigentes. Por exemplo, podemos observar o esgotamento da bateria de 100% para 85% quando conectado a uma tomada e em execução Witcher 3 o que significa que não é possível carregar a bateria em uma taxa decente durante a execução simultânea de cargas exigentes. Esse cenário nunca ocorreria na maioria dos outros notebooks.
| desligado | |
| Ocioso | |
| Carga |
|
Key:
min: | |
| Framework Laptop 16 R9 7940HS, Radeon RX 7700S, WDC PC SN810 1TB, , 2560x1600, 16" | MSI Prestige 16 B1MG-001US Ultra 7 155H, Arc 8-Core, Samsung PM9A1 MZVL22T0HBLB, IPS, 2560x1600, 16" | Lenovo ThinkPad Z16 Gen 2 R9 PRO 7940HS, Radeon RX 6550M, Kioxia XG8 KXG8AZNV1T02, OLED, 3840x2400, 16" | Apple MacBook Pro 16 2023 M3 Max Apple M3 Max 16-Core, M3 Max 40-Core GPU, Apple SSD AP8192Z, Mini-LED, 3456x2234, 16" | Dell Inspiron 16 Plus 7630 i7-13700H, GeForce RTX 4060 Laptop GPU, WD PC SN740 SDDPTQD-1T00, IPS, 2560x1600, 16" | HP Spectre x360 2-in-1 16-f1075ng i7-12700H, Iris Xe G7 96EUs, SK Hynix PC711 1TB HFS001TDE9X073N, IPS, 3072x1920, 16" | |
|---|---|---|---|---|---|---|
| Power Consumption | 46% | 26% | 18% | -5% | 40% | |
| Idle Minimum * (Watt) | 9.5 | 3 68% | 7.5 21% | 5.2 45% | 15.6 -64% | 9 5% |
| Idle Average * (Watt) | 17 | 9.5 44% | 9.6 44% | 16.9 1% | 17.7 -4% | 11.1 35% |
| Idle Maximum * (Watt) | 17.2 | 12 30% | 18.5 -8% | 17.2 -0% | 20.6 -20% | 16.4 5% |
| Load Average * (Watt) | 96.2 | 68.3 29% | 57.1 41% | 90.5 6% | 87.4 9% | 38.3 60% |
| Witcher 3 ultra * (Watt) | 171.9 | 59.8 65% | 115.8 33% | 109 37% | 121.7 29% | 34.4 80% |
| Load Maximum * (Watt) | 175.7 | 104.8 40% | 131.7 25% | 145.2 17% | 138 21% | 82.5 53% |
* ... menor é melhor
Power Consumption Witcher 3 / Stresstest
Power Consumption external Monitor
Duração da bateria
A duração da bateria de 85 Wh é respeitável, com pouco mais de 9 horas de navegação WLAN no mundo real, semelhante à do Dell Inspiron 16 Plus 7630 ou o HP Spectre x360 2 em 1. Recomendamos configurar a tela para uma taxa de atualização variável em vez da taxa fixa e padrão de 165 Hz para aproveitar melhor a bateria. Com a configuração dinâmica de 83 Hz a 165 Hz, por exemplo, conseguimos durar 20 minutos a mais no mesmo teste de WLAN. A maioria dos smartphones emprega essa mesma técnica para economizar a vida útil da bateria.
O carregamento de uma bateria vazia até a capacidade total com o adaptador CA incluído leva cerca de 2 horas se o usuário estiver em repouso no desktop ou executando cargas pouco exigentes. No entanto, se estiver executando cargas mais extremas, a bateria será carregada muito mais lentamente, conforme mencionado acima. Um adaptador CA USB-C de 240 W maior poderia ter resolvido esse problema.
| Framework Laptop 16 R9 7940HS, Radeon RX 7700S, 85 Wh | MSI Prestige 16 B1MG-001US Ultra 7 155H, Arc 8-Core, 99.9 Wh | Lenovo ThinkPad Z16 Gen 2 R9 PRO 7940HS, Radeon RX 6550M, 72 Wh | Apple MacBook Pro 16 2023 M3 Max Apple M3 Max 16-Core, M3 Max 40-Core GPU, 99.6 Wh | Dell Inspiron 16 Plus 7630 i7-13700H, GeForce RTX 4060 Laptop GPU, 86 Wh | HP Spectre x360 2-in-1 16-f1075ng i7-12700H, Iris Xe G7 96EUs, 83 Wh | |
|---|---|---|---|---|---|---|
| Duração da bateria | 86% | -17% | 32% | 5% | 20% | |
| Reader / Idle (h) | 14.8 | 25.1 70% | 10.2 -31% | 17.6 19% | 20.6 39% | |
| WiFi v1.3 (h) | 9.1 | 18.3 101% | 6 -34% | 16.7 84% | 9.4 3% | 10.5 15% |
| Load (h) | 1.5 | 2.8 87% | 1.7 13% | 1.2 -20% | 1.4 -7% | 1.6 7% |
| H.264 (h) | 20.4 | 11.2 |
Pro
Contra
Veredicto - Maior capacidade de reparo significa maior tamanho e peso
A tendência de laptops mais finos e leves é possível graças à fusão de cada vez mais componentes na placa-mãe. A principal desvantagem dessa abordagem é que ela limita a possibilidade de reparo, pois mesmo uma pequena falha pode exigir a substituição de placas inteiras. A Framework é um dos únicos fabricantes que está olhando para o outro lado na tentativa de melhorar a personalização e a manutenção do usuário final. Não há dúvida de que a manutenção do Laptop 16 é mais fácil para o usuário do que qualquer outra alternativa, mas esse recurso lucrativo tem o custo do tamanho e do peso, pois os componentes individuais devem ser facilmente substituíveis. Se o senhor pretende atualizar a RAM ou o SSD apenas uma ou duas vezes durante a vida útil do laptop, então alternativas de 16 polegadas mais compactas e fáceis de transportar, como o Inspiron 16 Plus ou Asus VivoBook Pro 16 podem ser mais úteis para o senhor nesse sentido.
A dGPU removível também é um empreendimento arriscado, pois historicamente não tem sido bem-sucedida em OEMs maiores, como Dell e Lenovo. O fato de existirem opções universais de eGPU baseadas em USB4 ou Thunderbolt torna a dGPU especializada do Laptop 16 muito menos atraente. Se o senhor realmente deseja gráficos discretos em trânsito, a GeForce RTX 4060 pode oferecer melhor desempenho e desempenho por watt do que a Radeon 7700S. Portanto, a Framework terá que oferecer suporte ao design do Laptop 16 dGPU nos próximos anos com futuras opções de RDNA para que o investimento valha a pena. Ao comprar hoje, o senhor estará confiando que a empresa fará exatamente isso.
O Framework Laptop 16 é maior e mais pesado do que outros laptops de 16 polegadas em nome da possibilidade de reparo e da sustentabilidade. Se o senhor faz atualizações com frequência ou prevê reparos, o Laptop 16 pode valer a pena. Caso contrário, as alternativas de OEMs maiores tendem a ser mais rápidas e mais leves.
Devido aos motivos acima, os compradores interessados devem valorizar as placas de expansão, o ângulo de sustentabilidade e a alta capacidade de reparo do girthy Laptop 16, pois as alternativas tendem a ser mais finas, mais leves e, às vezes, mais rápidas, especialmente na faixa de US$ 2.000. Se a Framework conseguir, de alguma forma, igualar o tamanho do Razer Blade 16 ou do MacBook Pro mantendo a possibilidade de reparo, então as futuras revisões poderão se tornar algo muito especial. Por enquanto, o senhor terá que sacrificar um pouco da portabilidade para aproveitar todos os recursos exclusivos do Framework.
Preço e disponibilidade
A Framework já está aceitando pré-encomendas para o Laptop 16 a partir de US$ 1400 para a edição básica Ryzen 7 DIY até mais de US$ 2400 quando configurado com Ryzen 9, gráficos discretos Radeon 7700S e várias placas e módulos de expansão.
Framework Laptop 16
- 01/23/2024 v7 (old)
Allen Ngo
Transparência
A seleção dos dispositivos a serem analisados é feita pela nossa equipe editorial. A amostra de teste foi fornecida ao autor como empréstimo pelo fabricante ou varejista para fins desta revisão. O credor não teve influência nesta revisão, nem o fabricante recebeu uma cópia desta revisão antes da publicação. Não houve obrigação de publicar esta revisão. Como empresa de mídia independente, a Notebookcheck não está sujeita à autoridade de fabricantes, varejistas ou editores.
É assim que o Notebookcheck está testando
Todos os anos, o Notebookcheck analisa de forma independente centenas de laptops e smartphones usando procedimentos padronizados para garantir que todos os resultados sejam comparáveis. Desenvolvemos continuamente nossos métodos de teste há cerca de 20 anos e definimos padrões da indústria no processo. Em nossos laboratórios de teste, equipamentos de medição de alta qualidade são utilizados por técnicos e editores experientes. Esses testes envolvem um processo de validação em vários estágios. Nosso complexo sistema de classificação é baseado em centenas de medições e benchmarks bem fundamentados, o que mantém a objetividade.Price comparison

