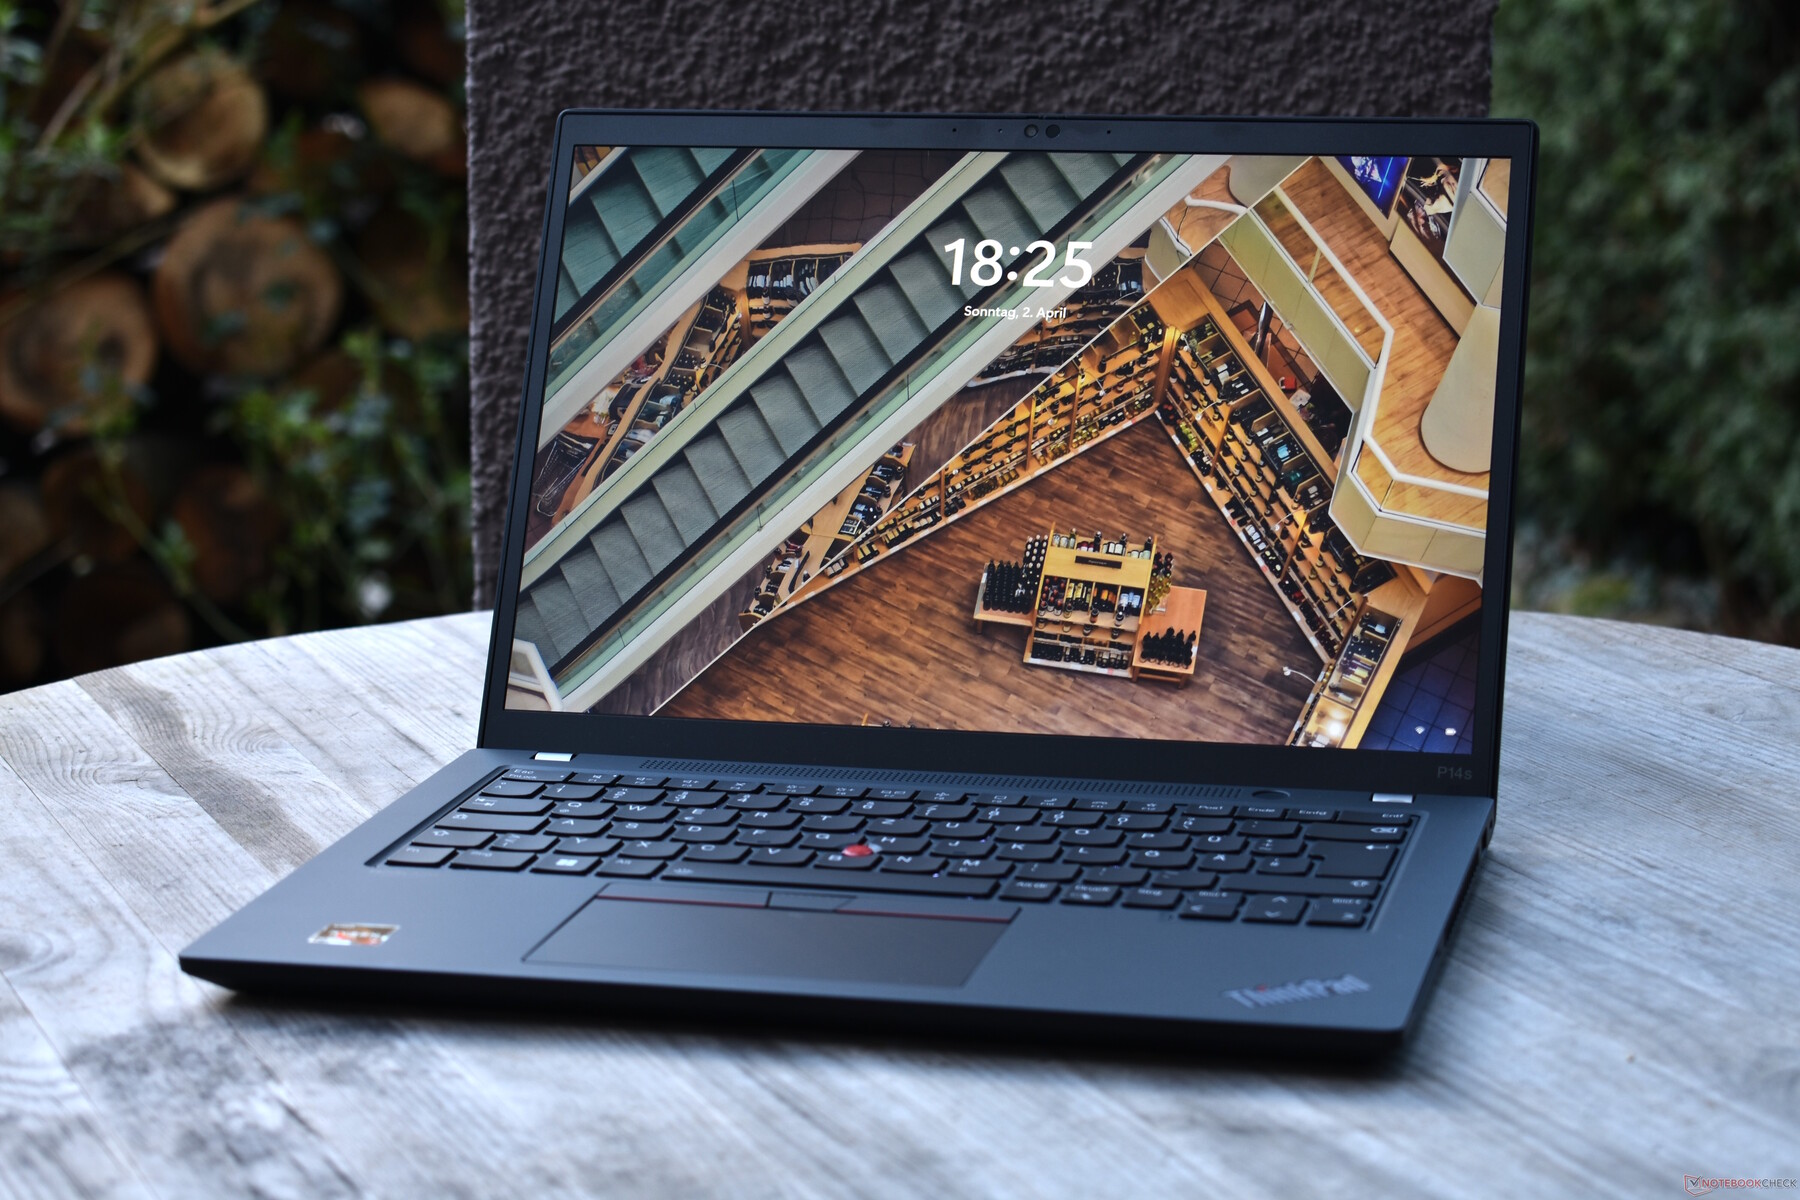
Lenovo ThinkPad P14s G3 AMD revisão laptop: Estação de trabalho leve sem dGPU
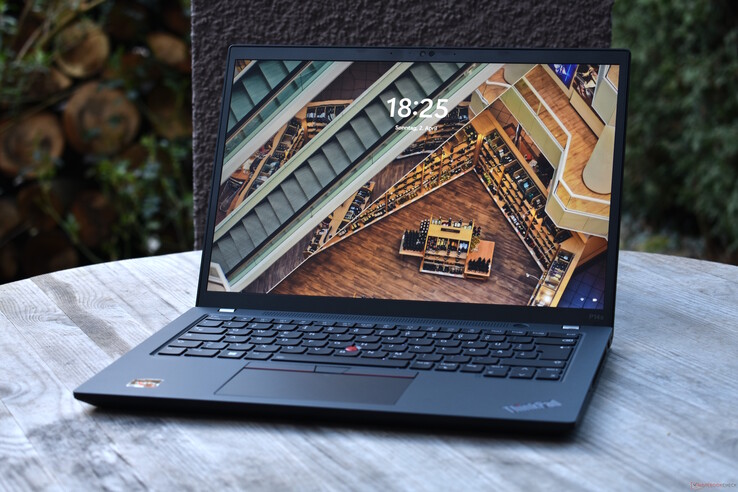
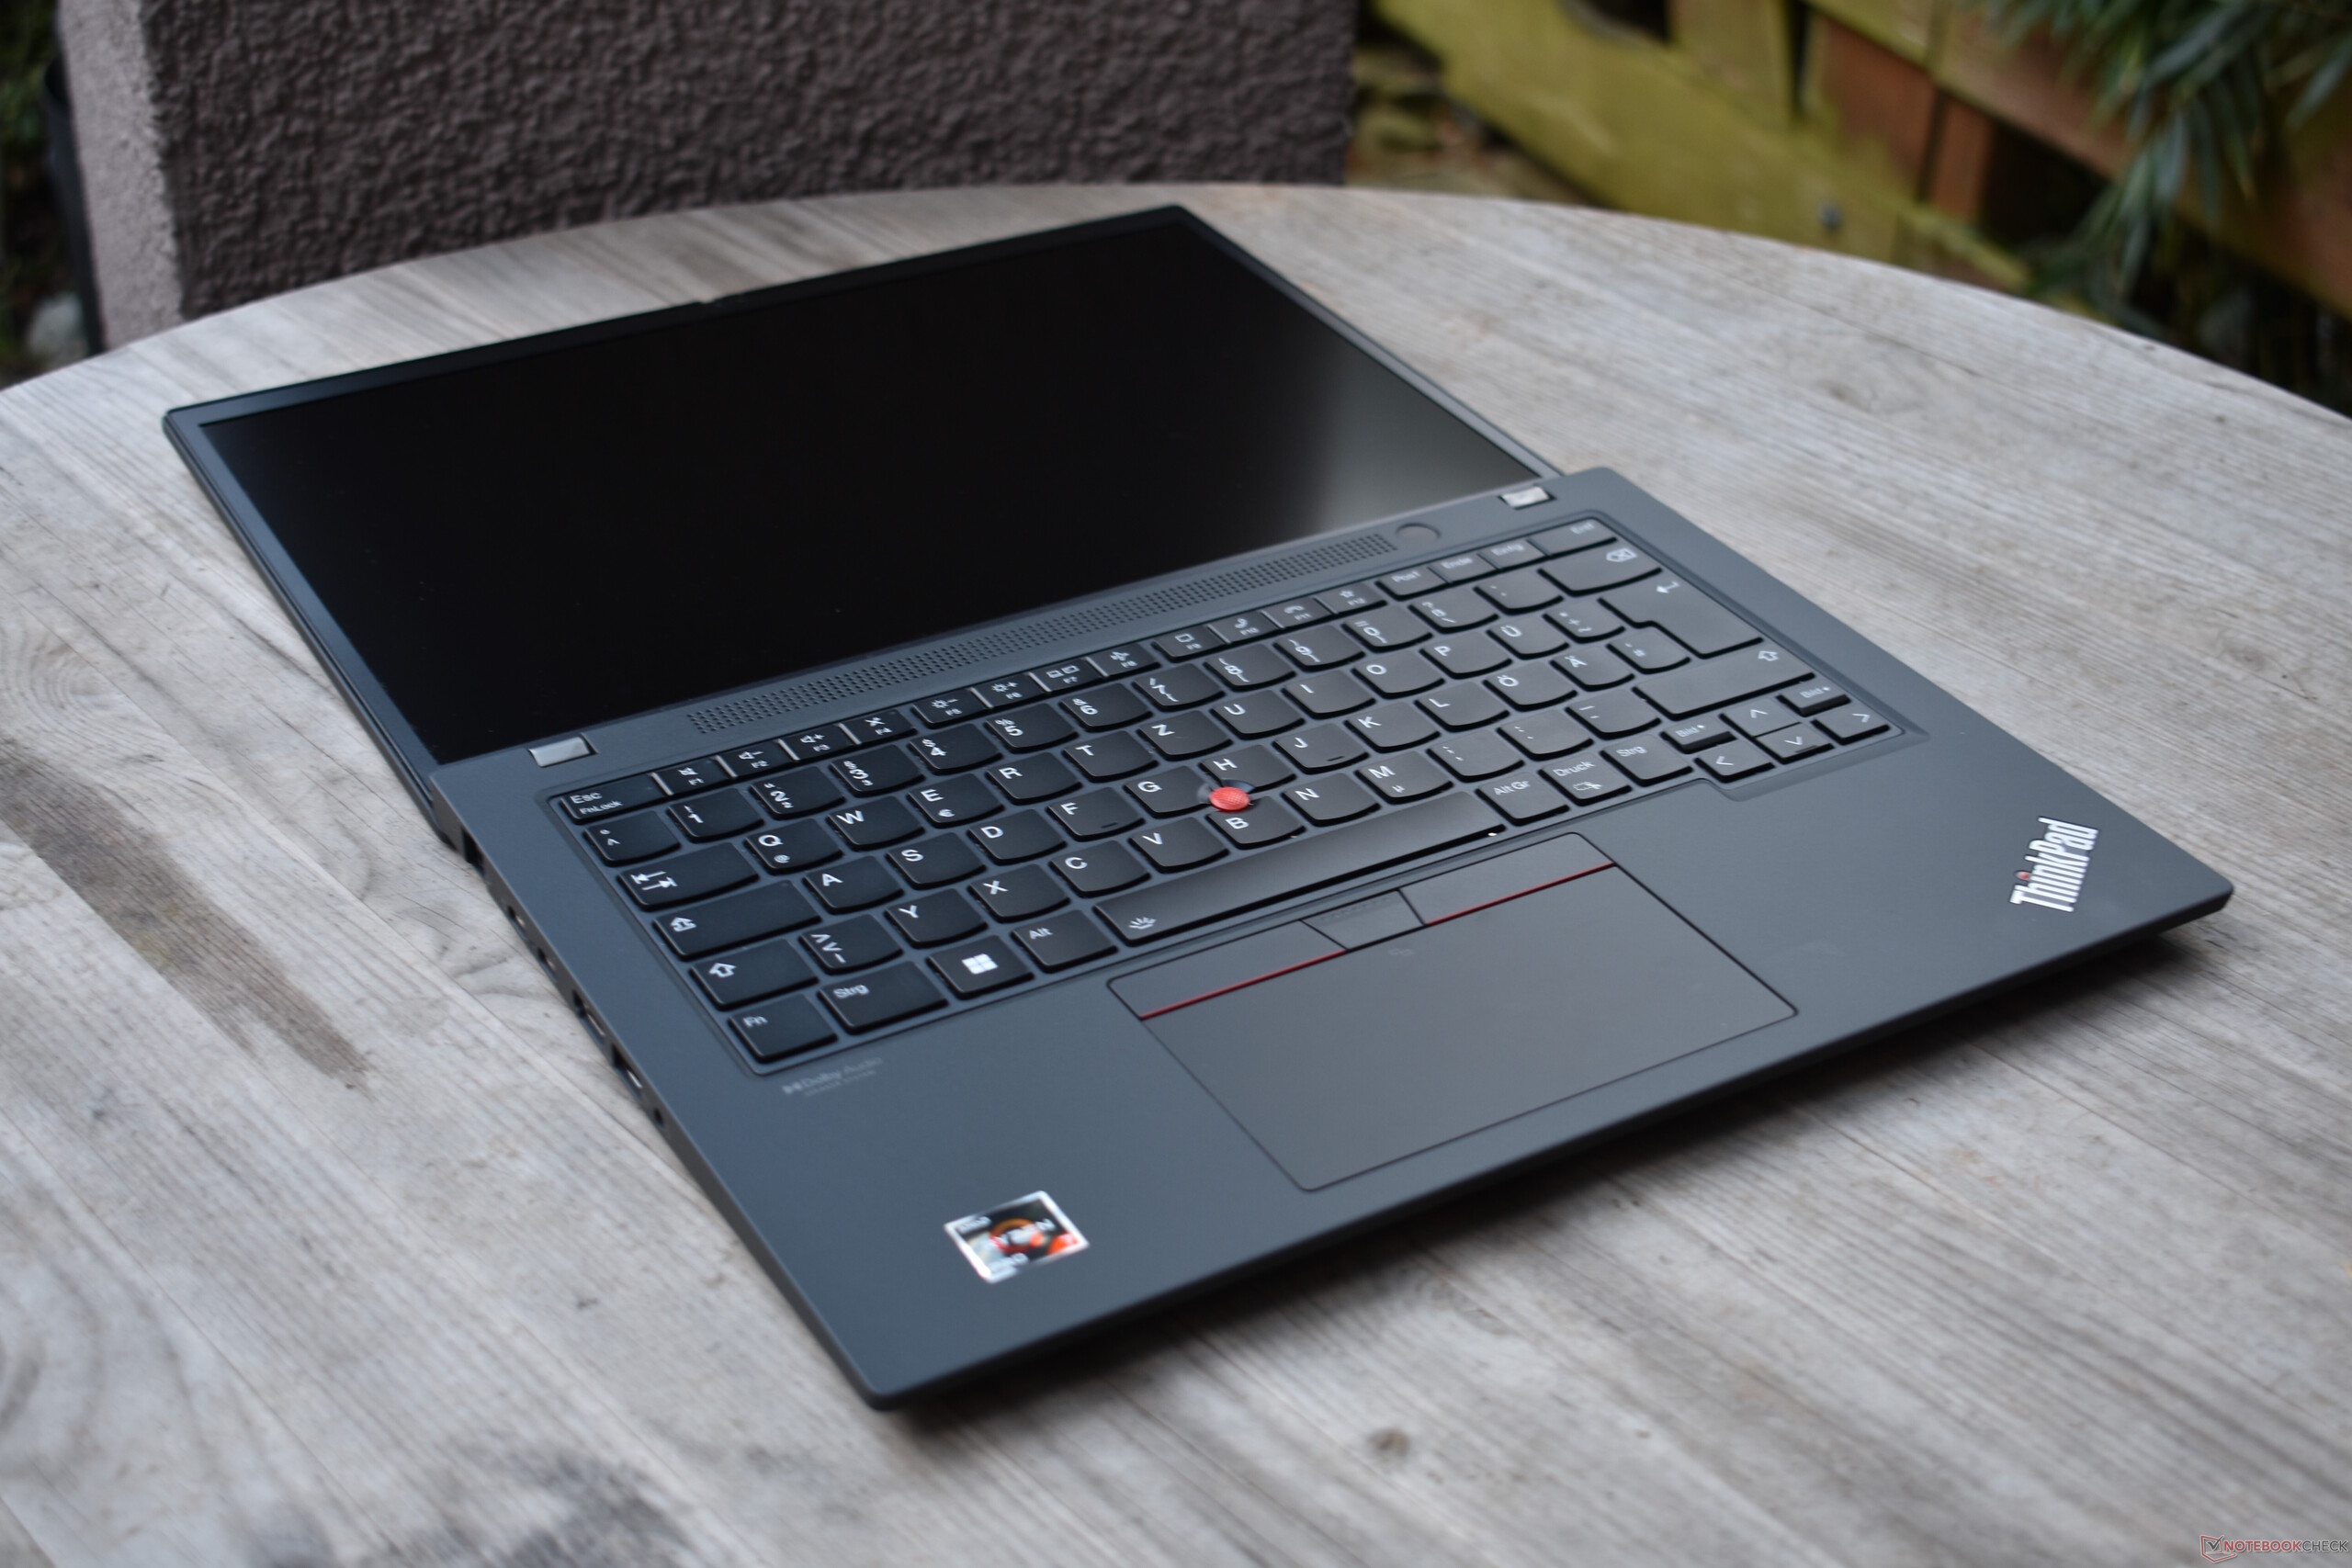
As estações de trabalho móveis tradicionalmente têm telas relativamente grandes - o que significa 15 polegadas e maiores - enquanto as estações de trabalho de 14 polegadas são bastante raras. O Lenovo ThinkPad P14s G3 é um dos últimos modelos. Esta série de produtos pode não ser nova, mas as variantes AMD dos P14s são bastante novas em comparação. Estaremos testando um hoje.
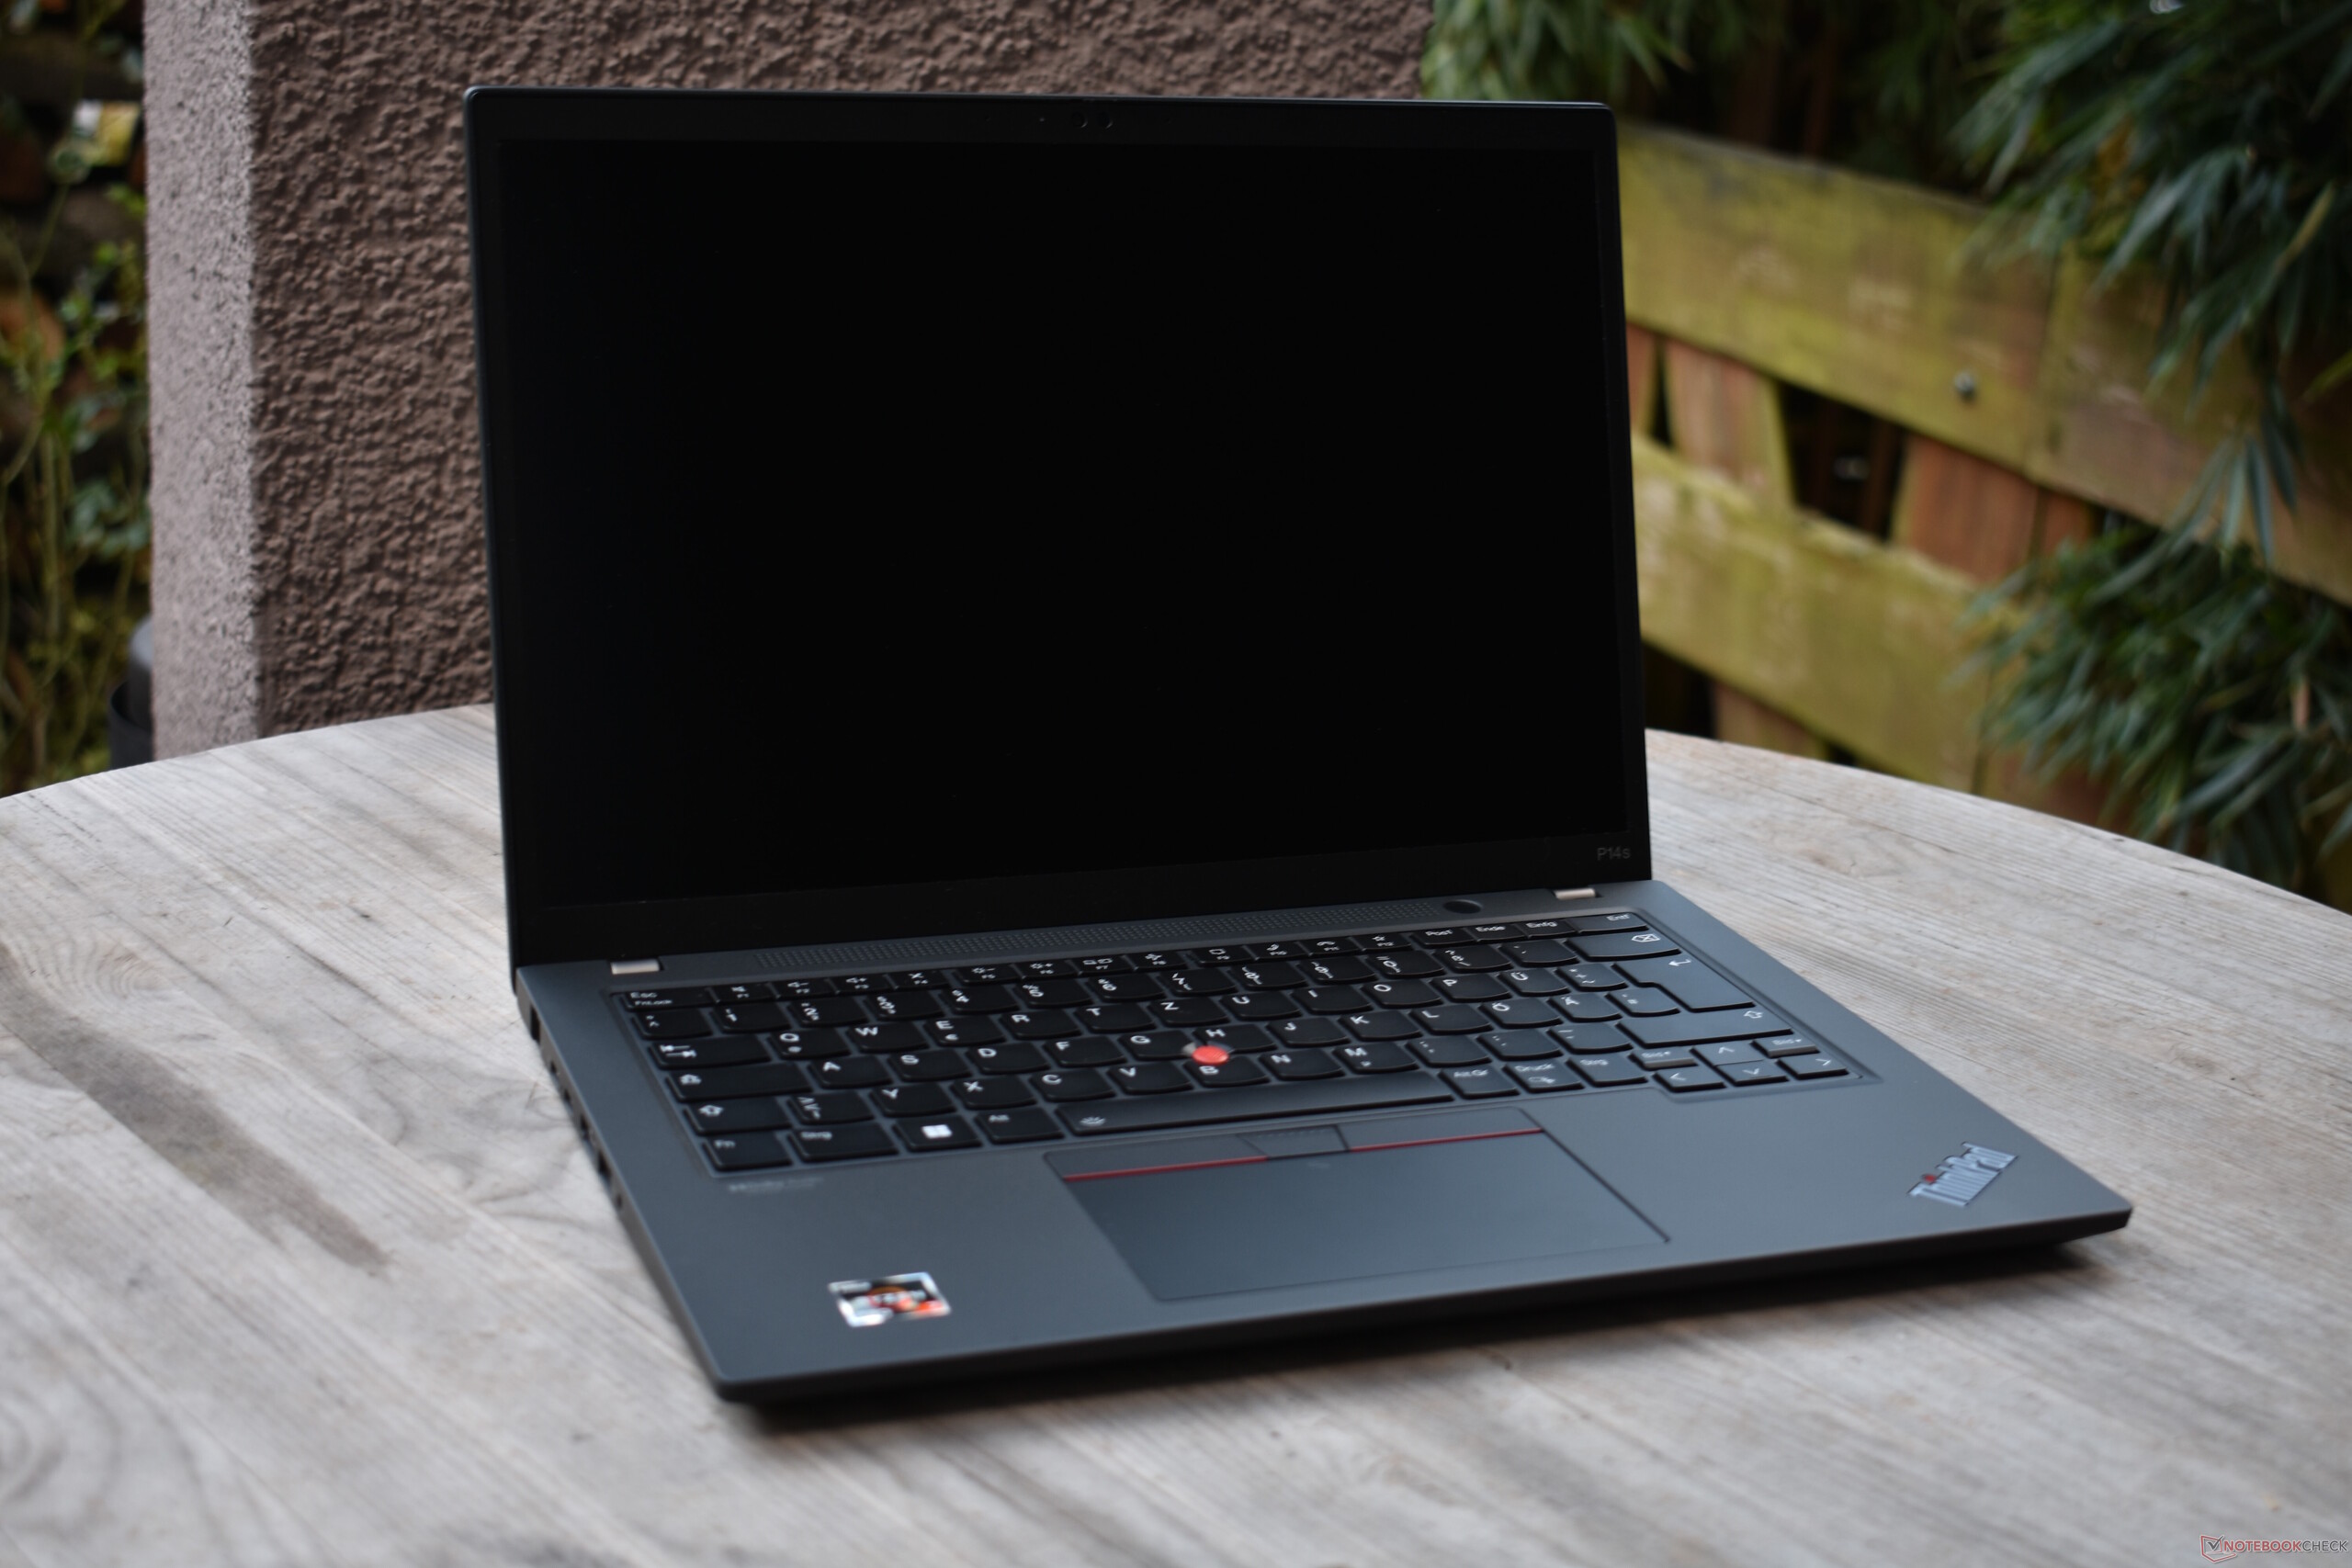
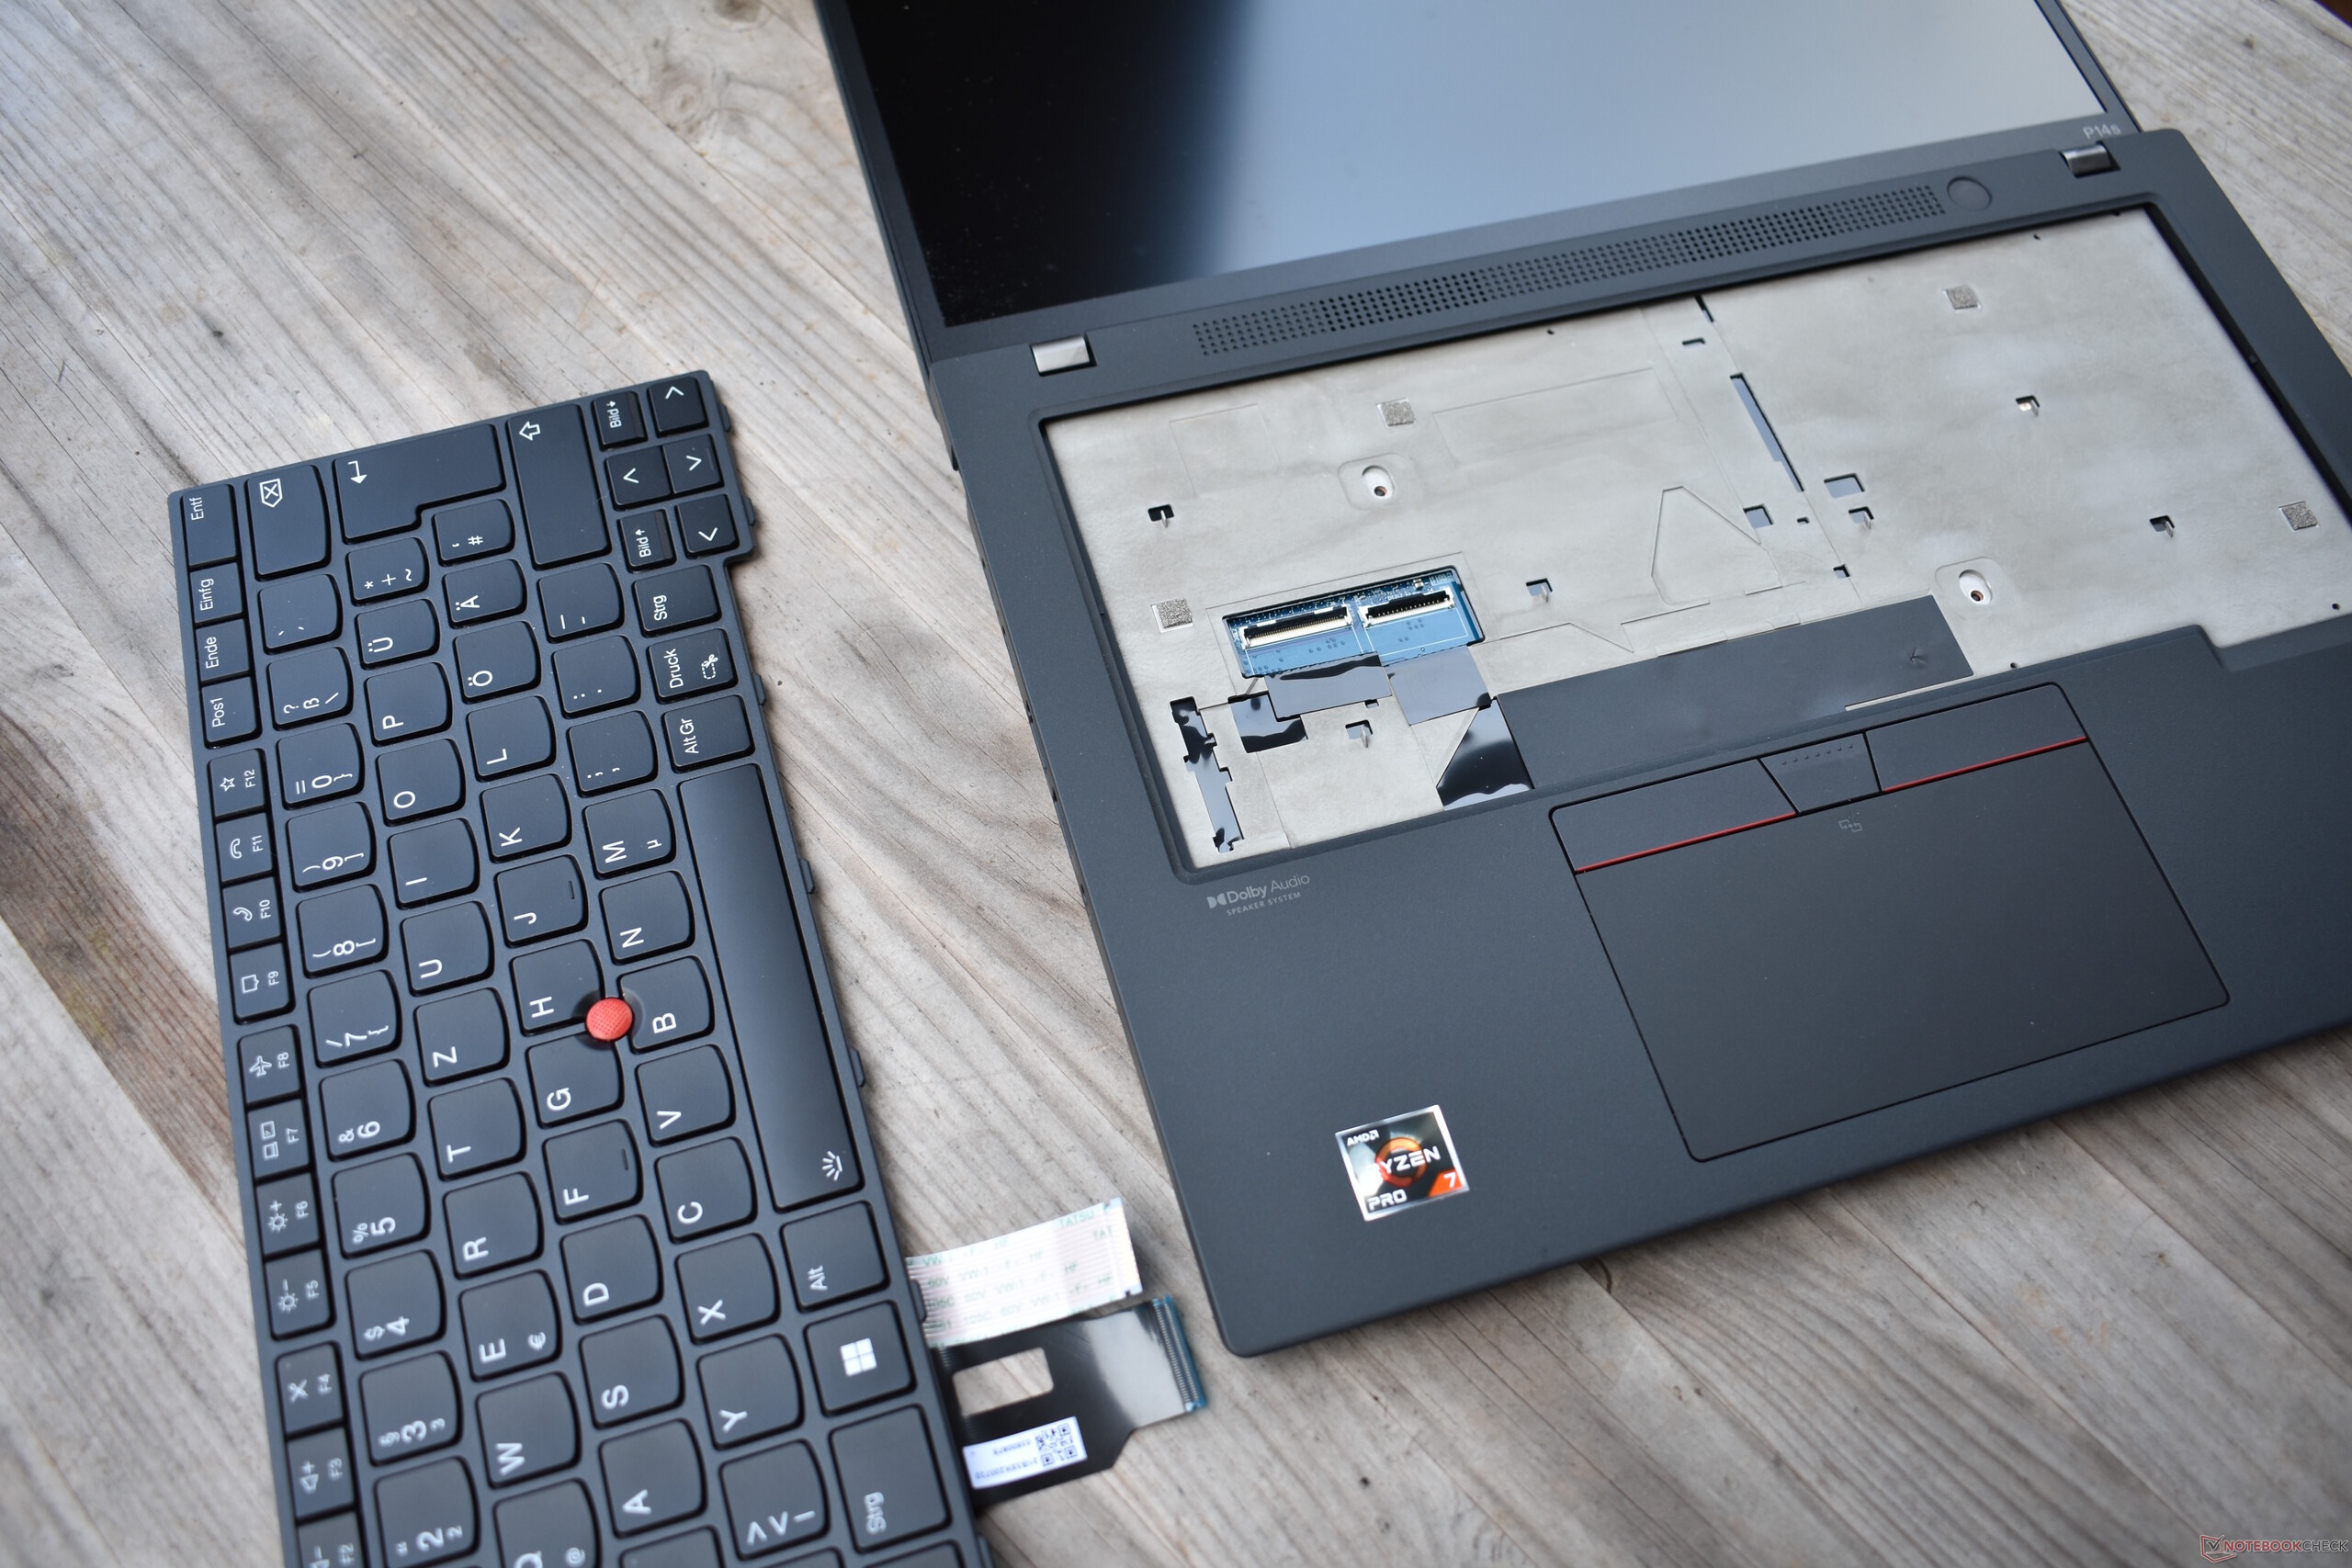
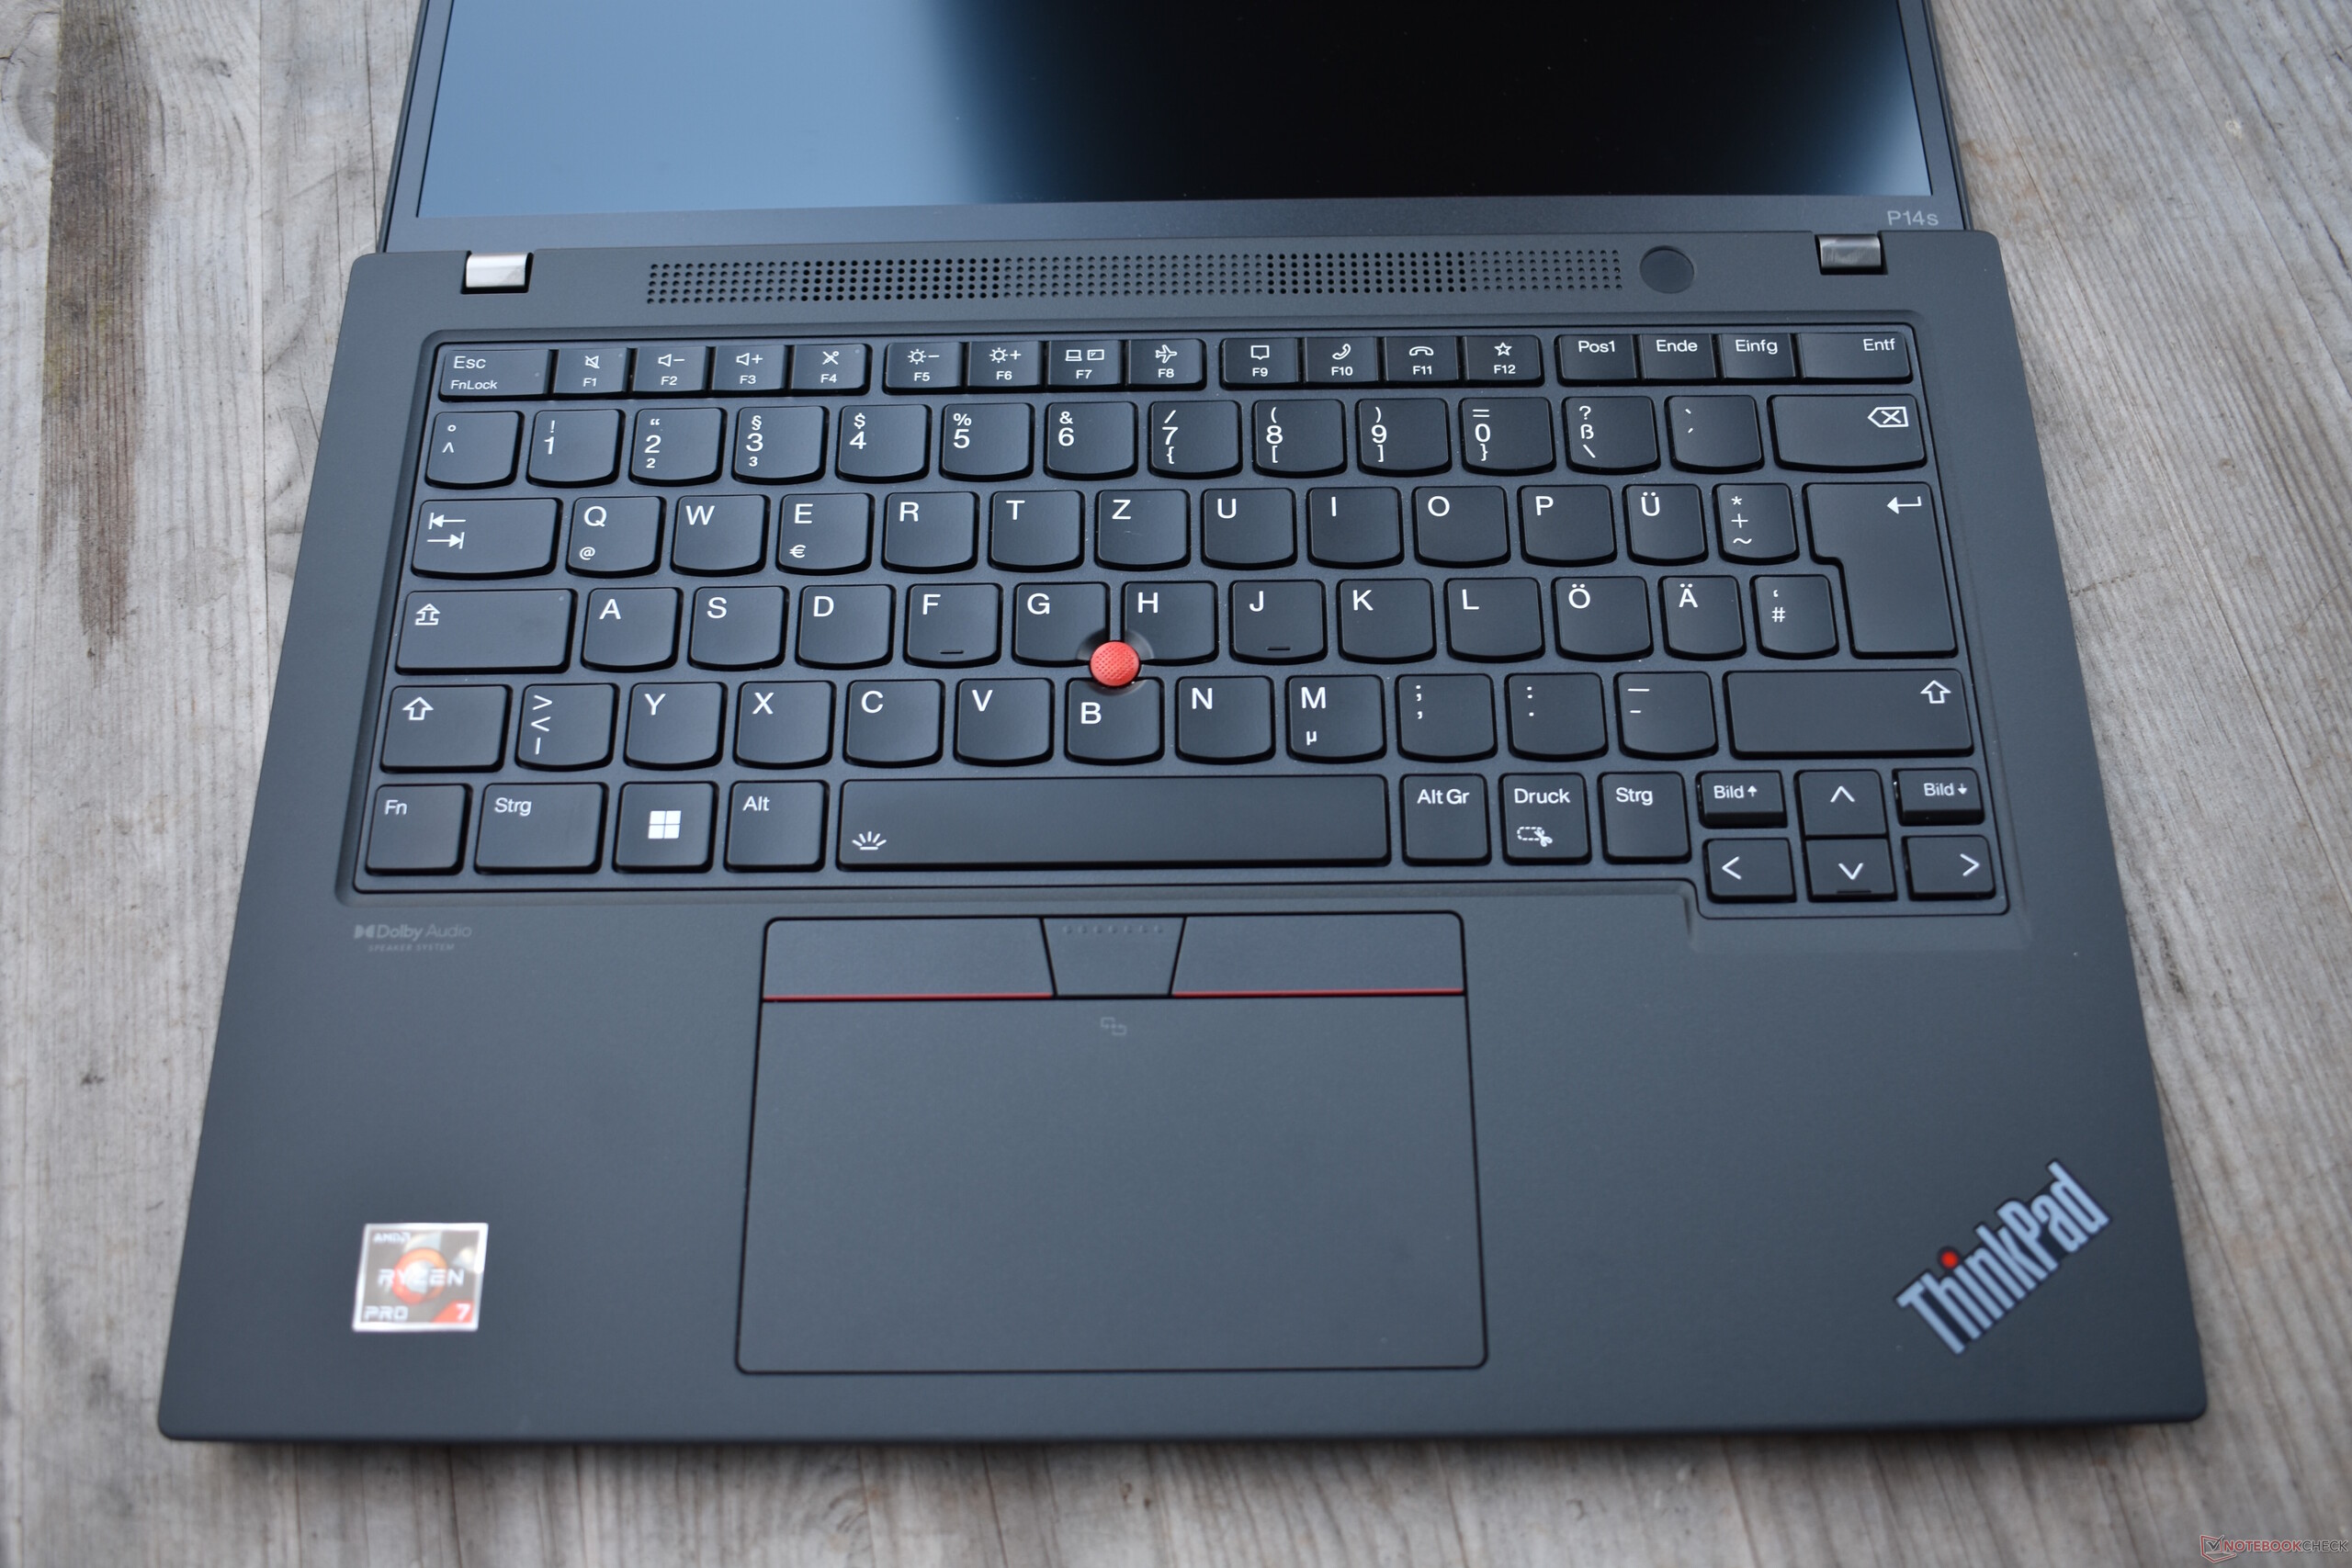
O ThinkPad P14s é um modelo irmão do ThinkPad T14 da Lenovo. Externamente, ambos parecem exatamente iguais, o que significa que você pode conferir nossa revisão deLenovo's ThinkPad T14 Gen 3 se você estiver interessado em ler sobre seu projeto, características e dispositivos de entrada.
Possíveis concorrentes em comparação
Avaliação | Data | Modelo | Peso | Altura | Size | Resolução | Preço |
|---|---|---|---|---|---|---|---|
| 86.9 % v7 (old) | 04/2023 | Lenovo ThinkPad P14s G3 AMD 21J6S05000 R7 PRO 6850U, Radeon 680M | 1.5 kg | 17.9 mm | 14.00" | 1920x1200 | |
| 85.1 % v7 (old) | 06/2021 | Lenovo ThinkPad P14s Gen2-20VX000GGE i7-1185G7, T500 Laptop GPU | 1.5 kg | 18 mm | 14.00" | 1920x1080 | |
| 88.8 % v7 (old) | 09/2022 | Lenovo ThinkPad T14 G3-21CF004NGE R7 PRO 6850U, Radeon 680M | 1.4 kg | 17.9 mm | 14.00" | 1920x1200 | |
| 87.6 % v7 (old) | 09/2022 | Dell Precision 5000 5470 i9-12900H, RTX A1000 Laptop GPU | 1.6 kg | 18.95 mm | 14.00" | 2560x1600 | |
| 83.6 % v7 (old) | 10/2022 | HP ZBook Firefly 14 G9-6B8A2EA i7-1265U, T550 Laptop GPU | 1.5 kg | 19.9 mm | 14.00" | 1920x1200 |
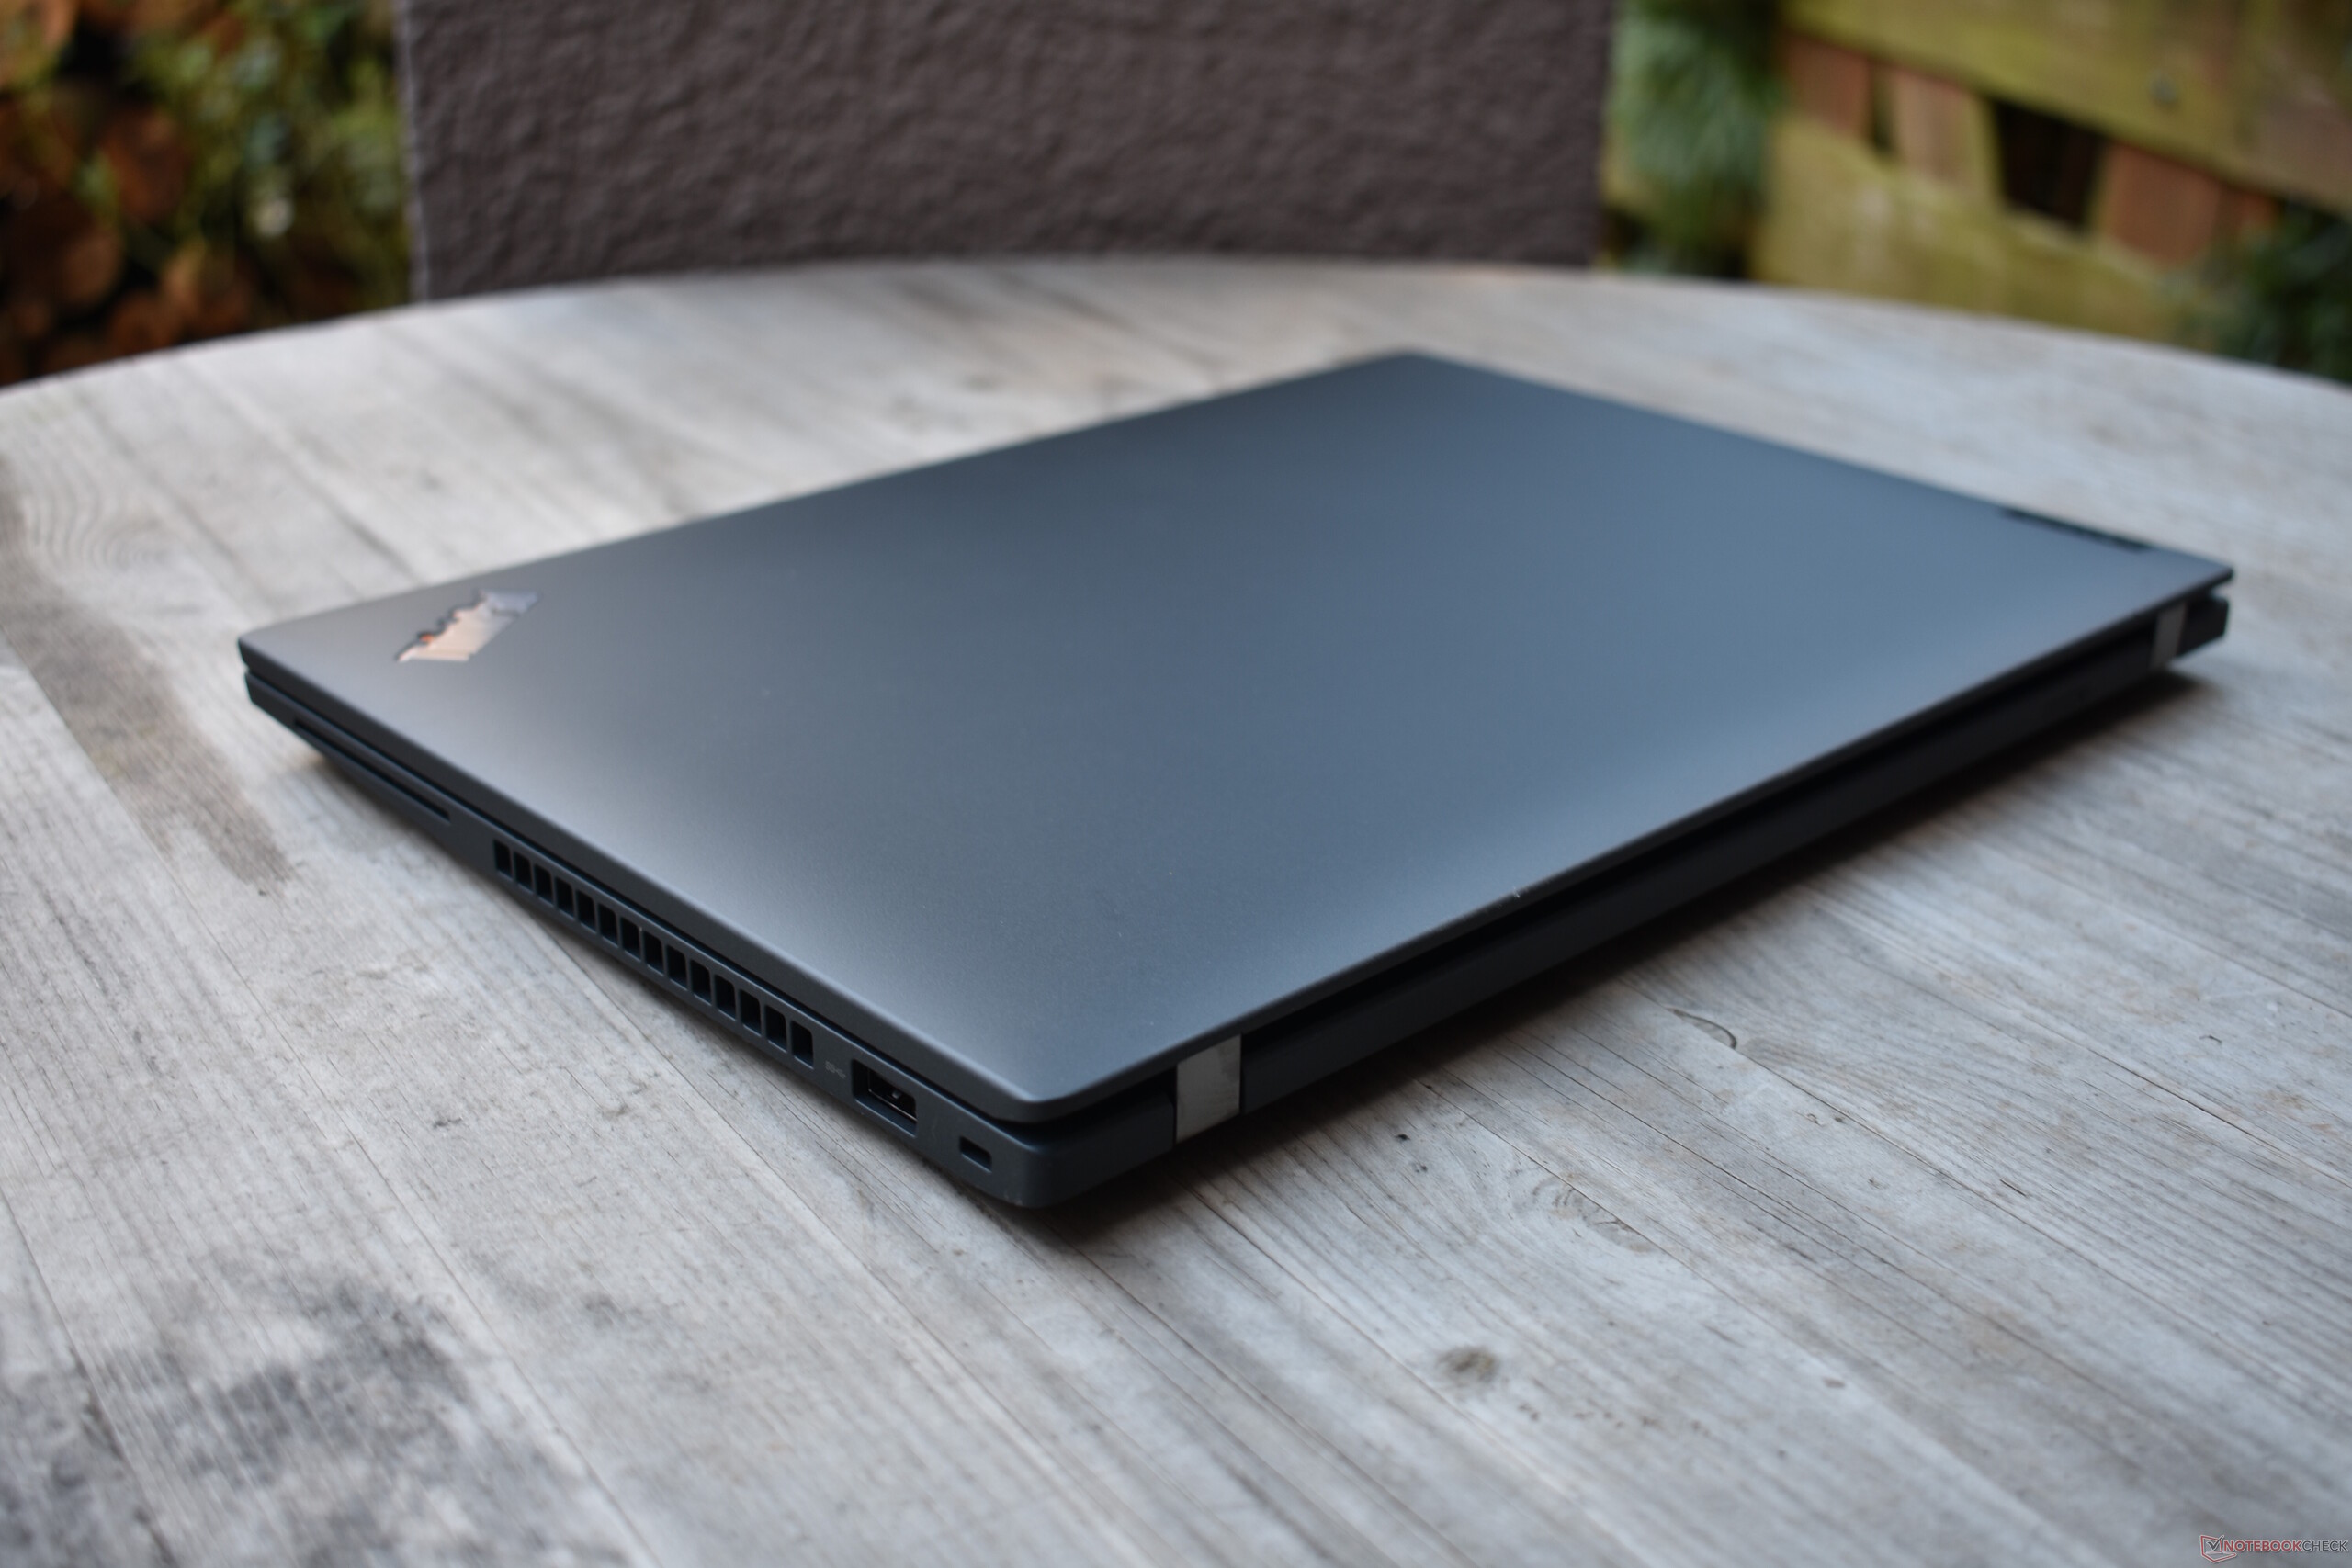
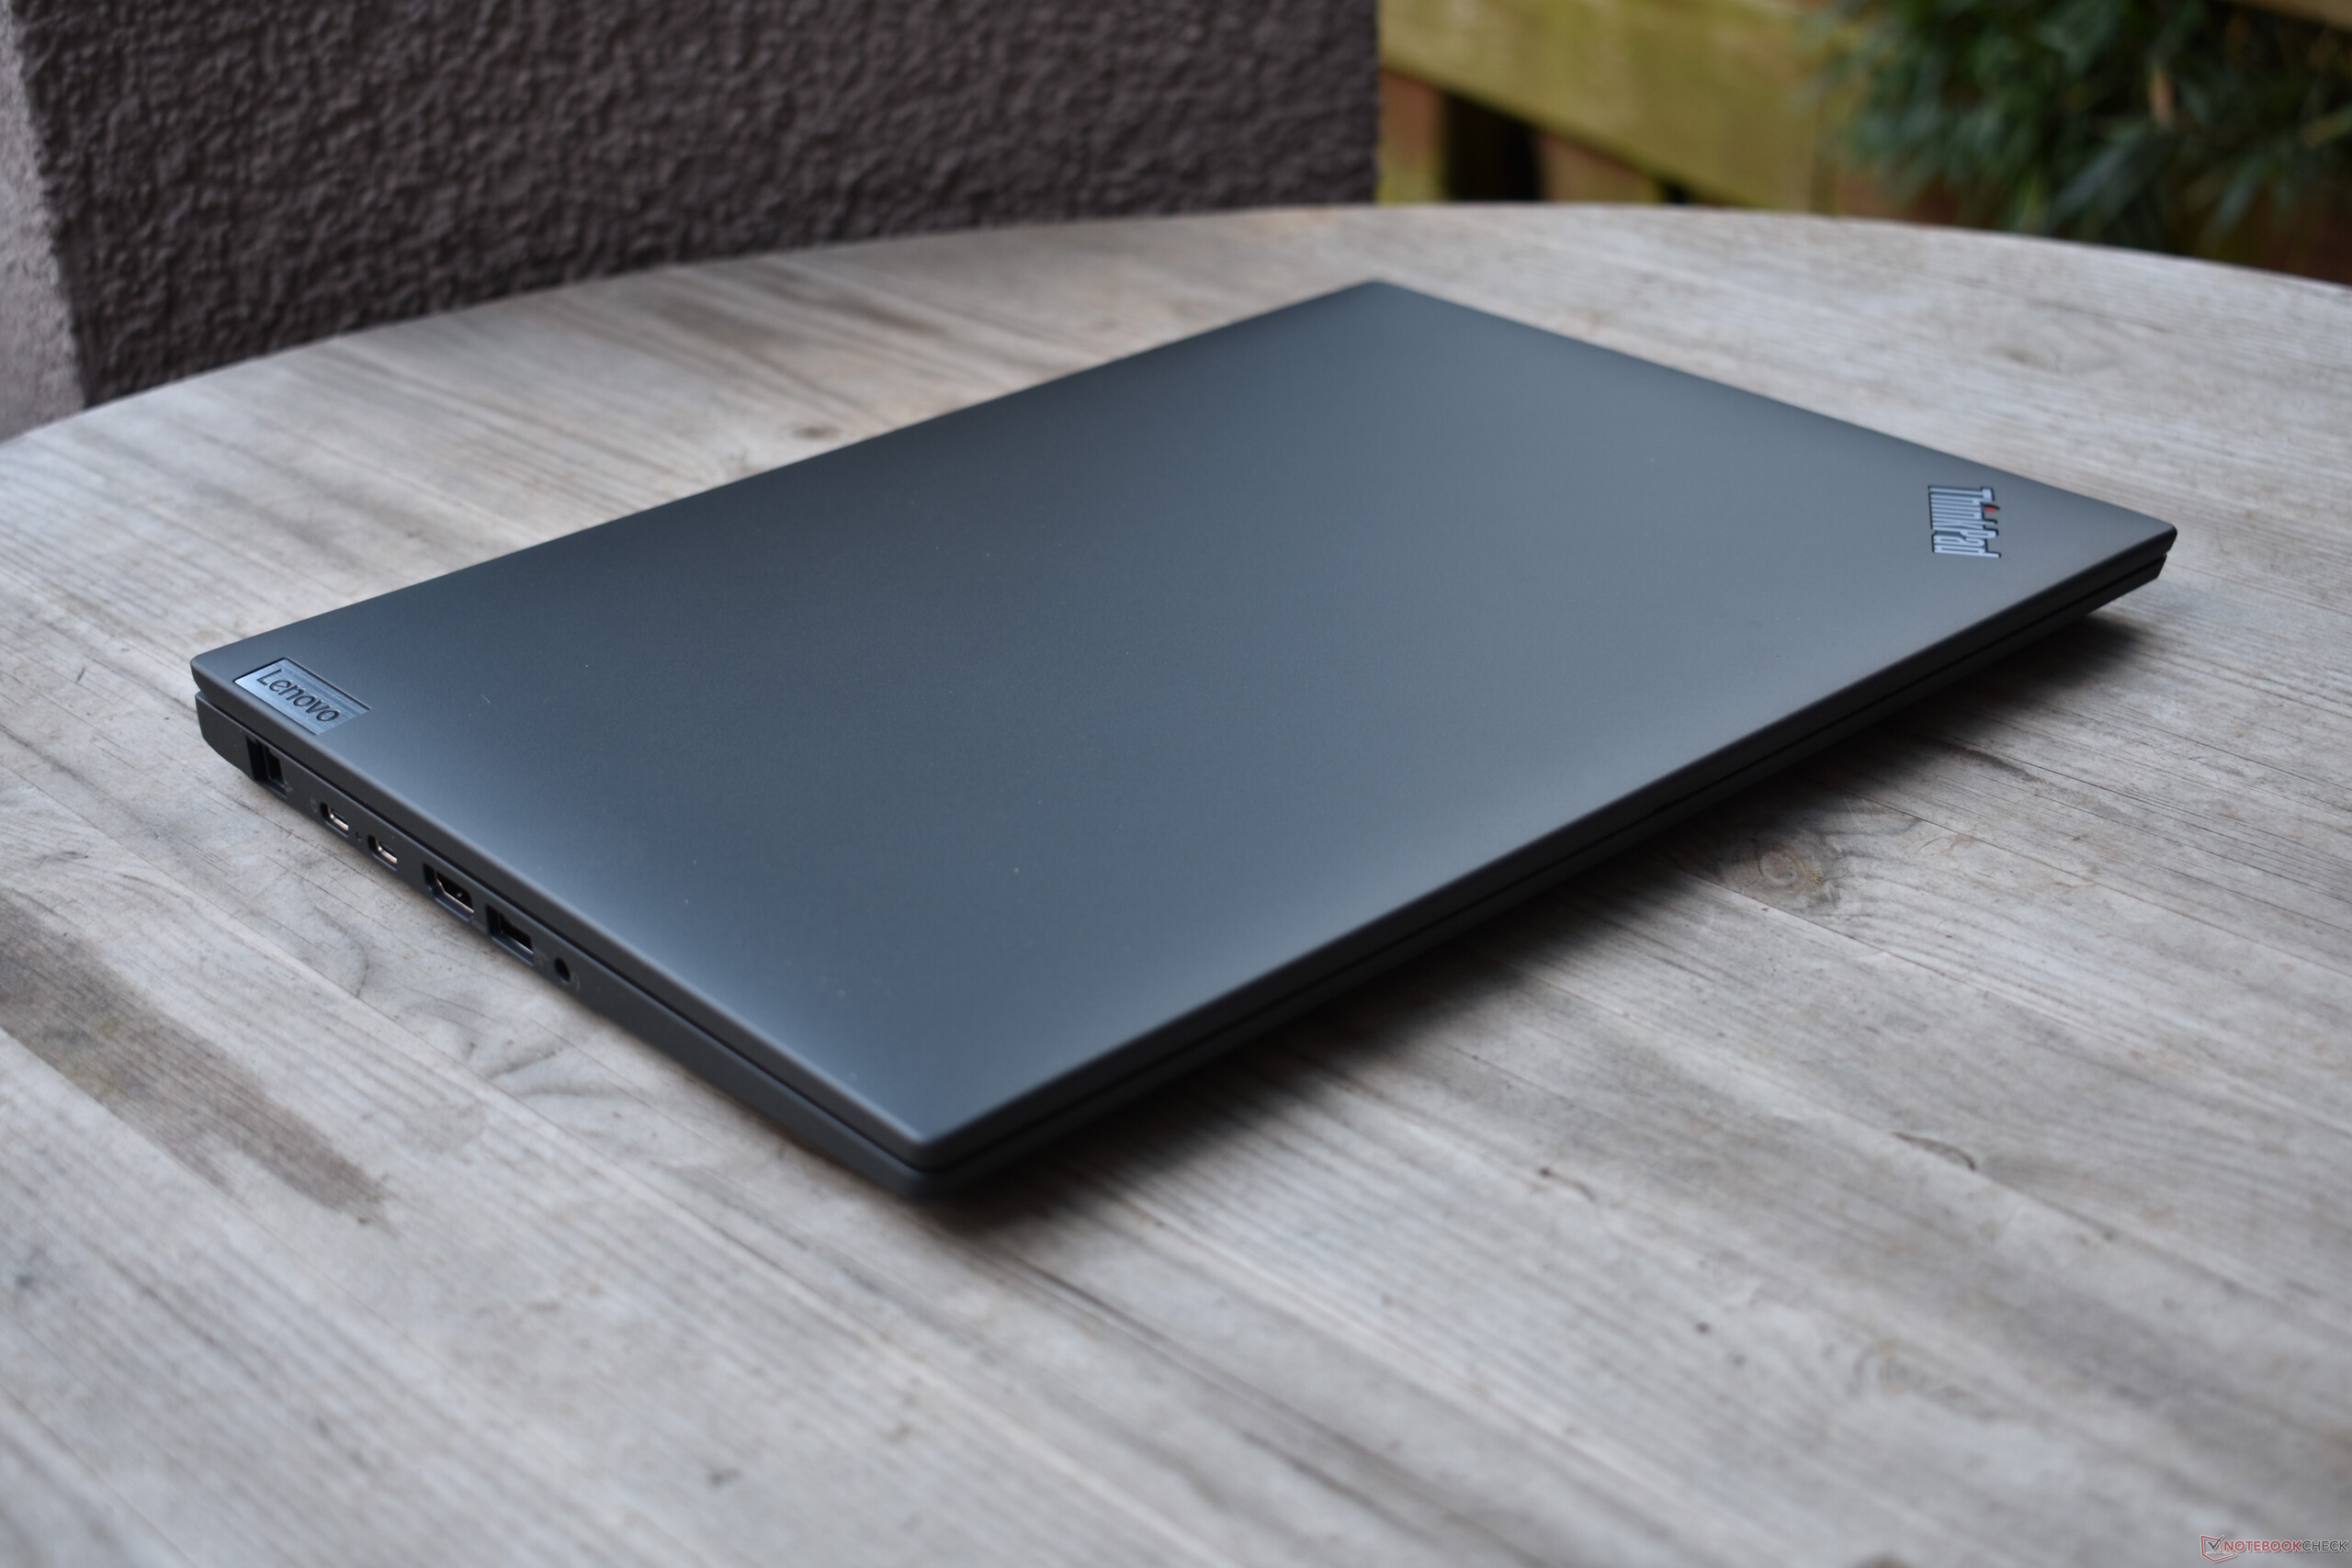
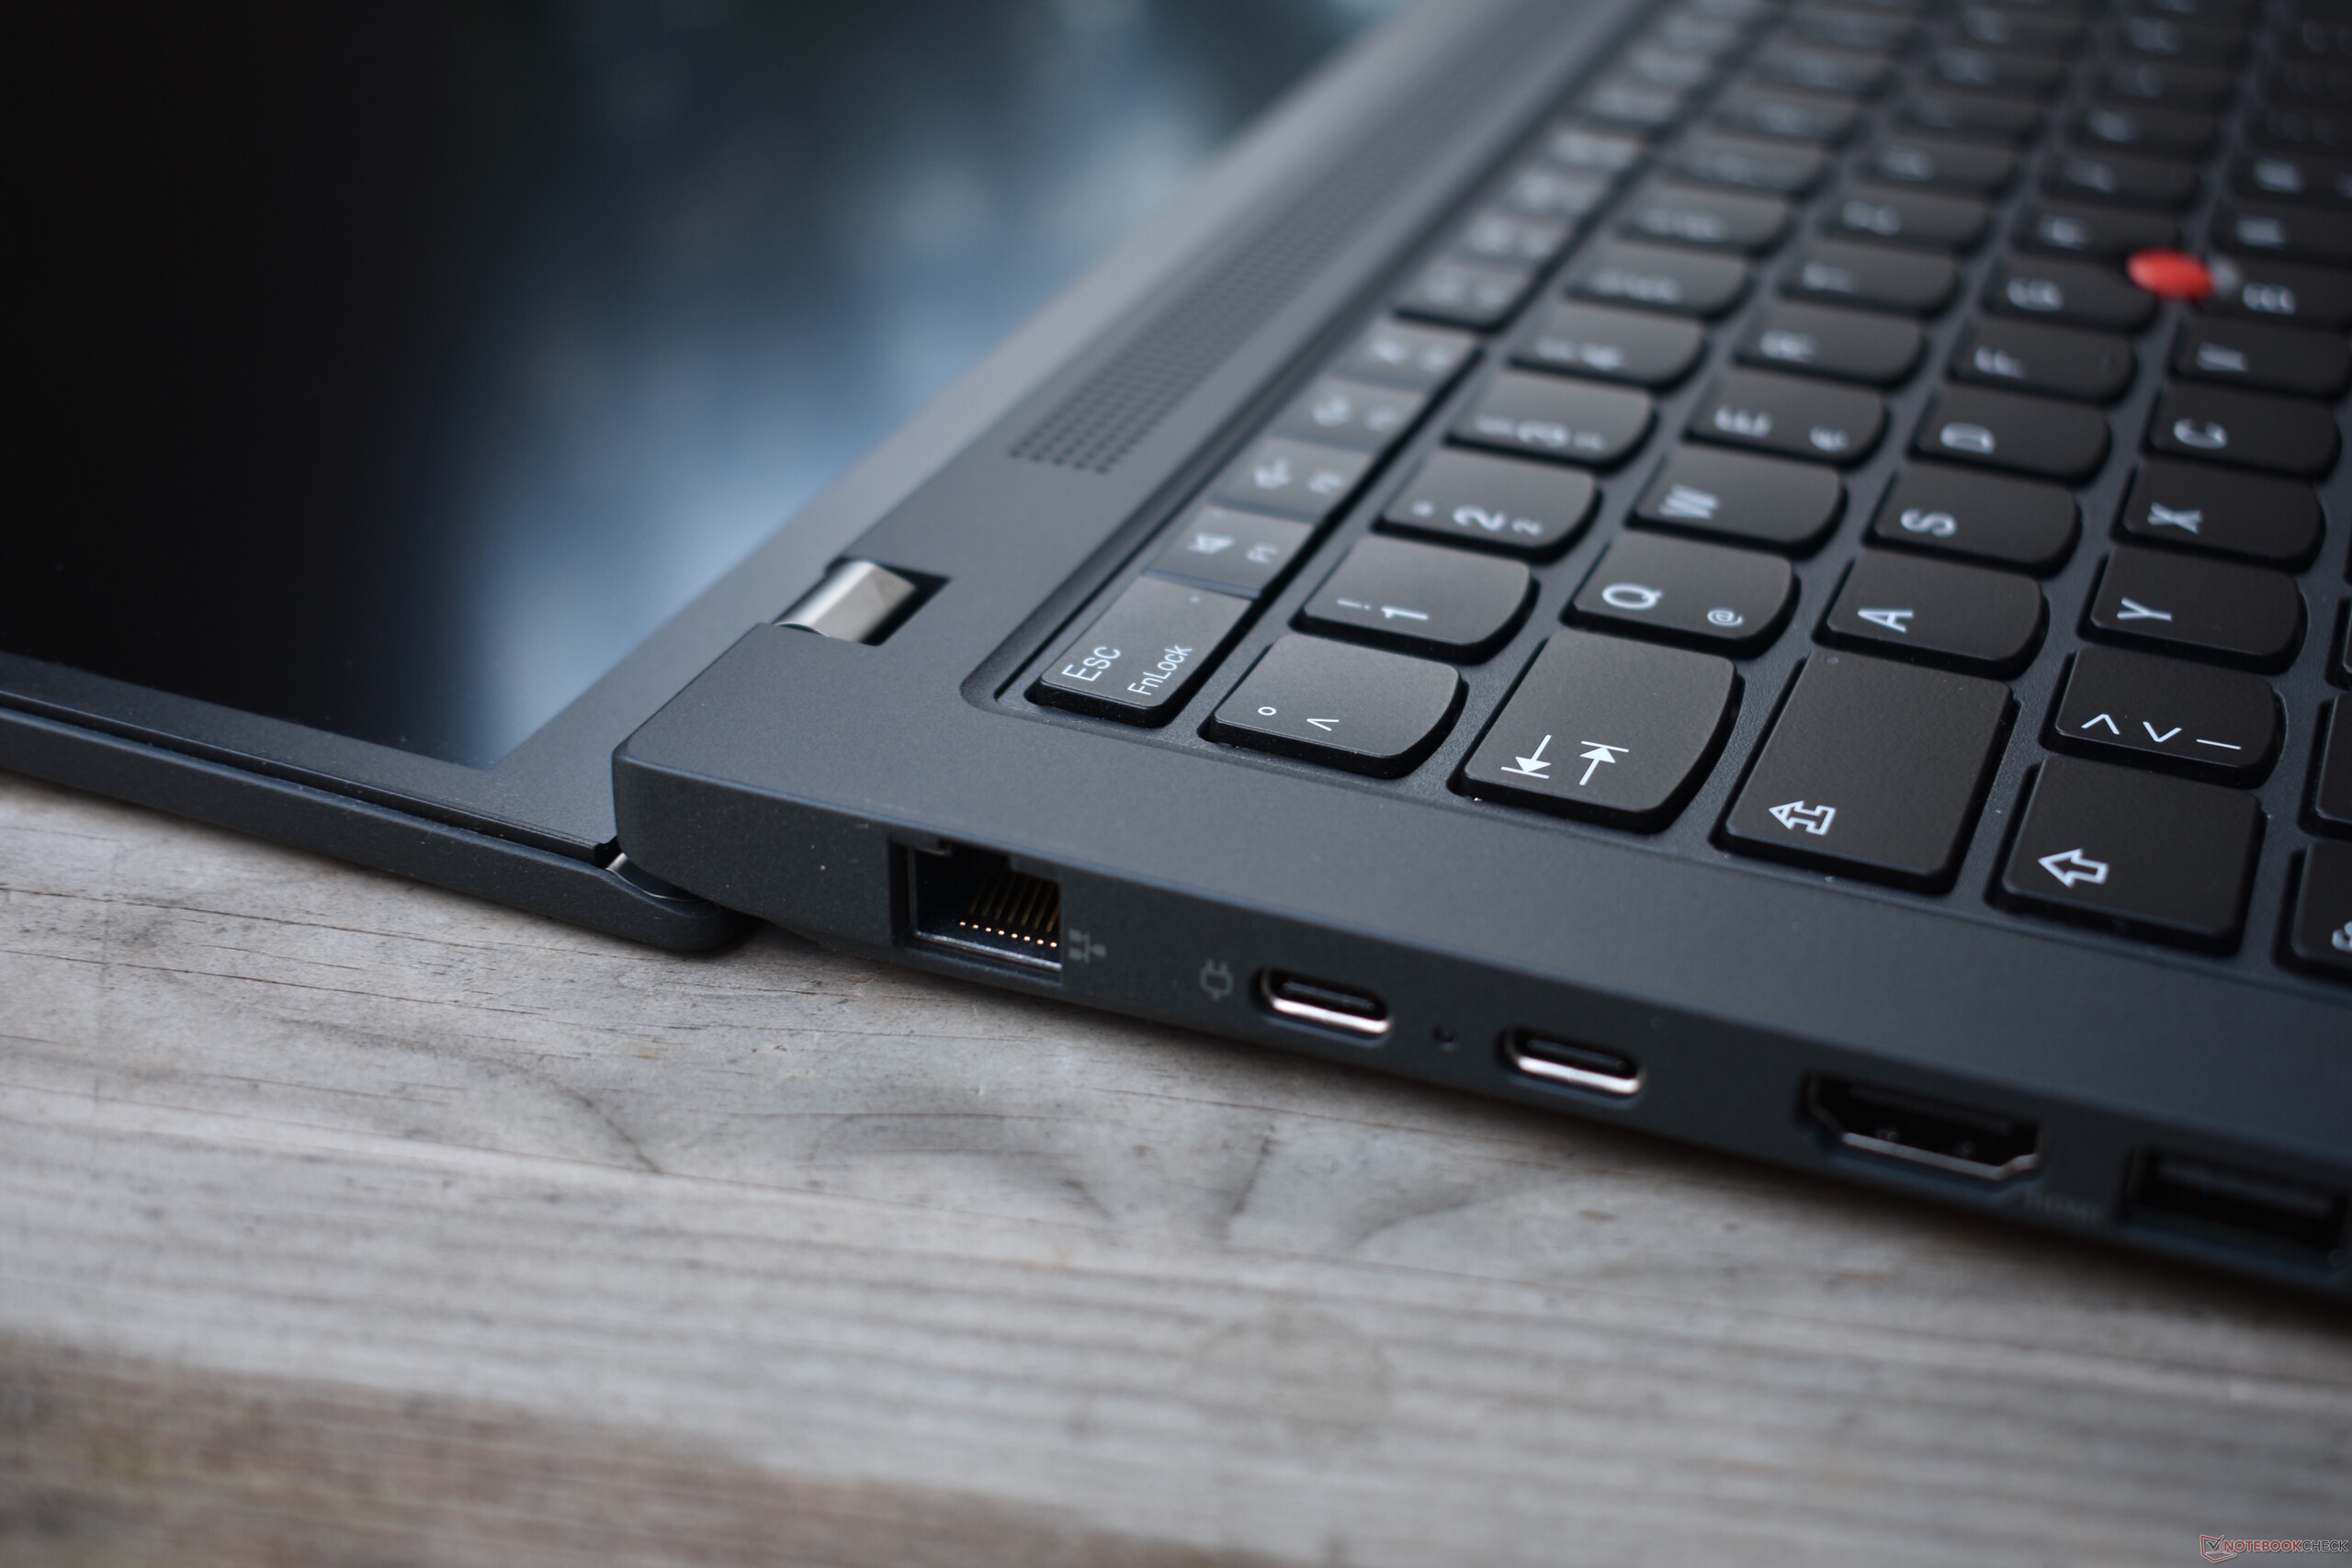
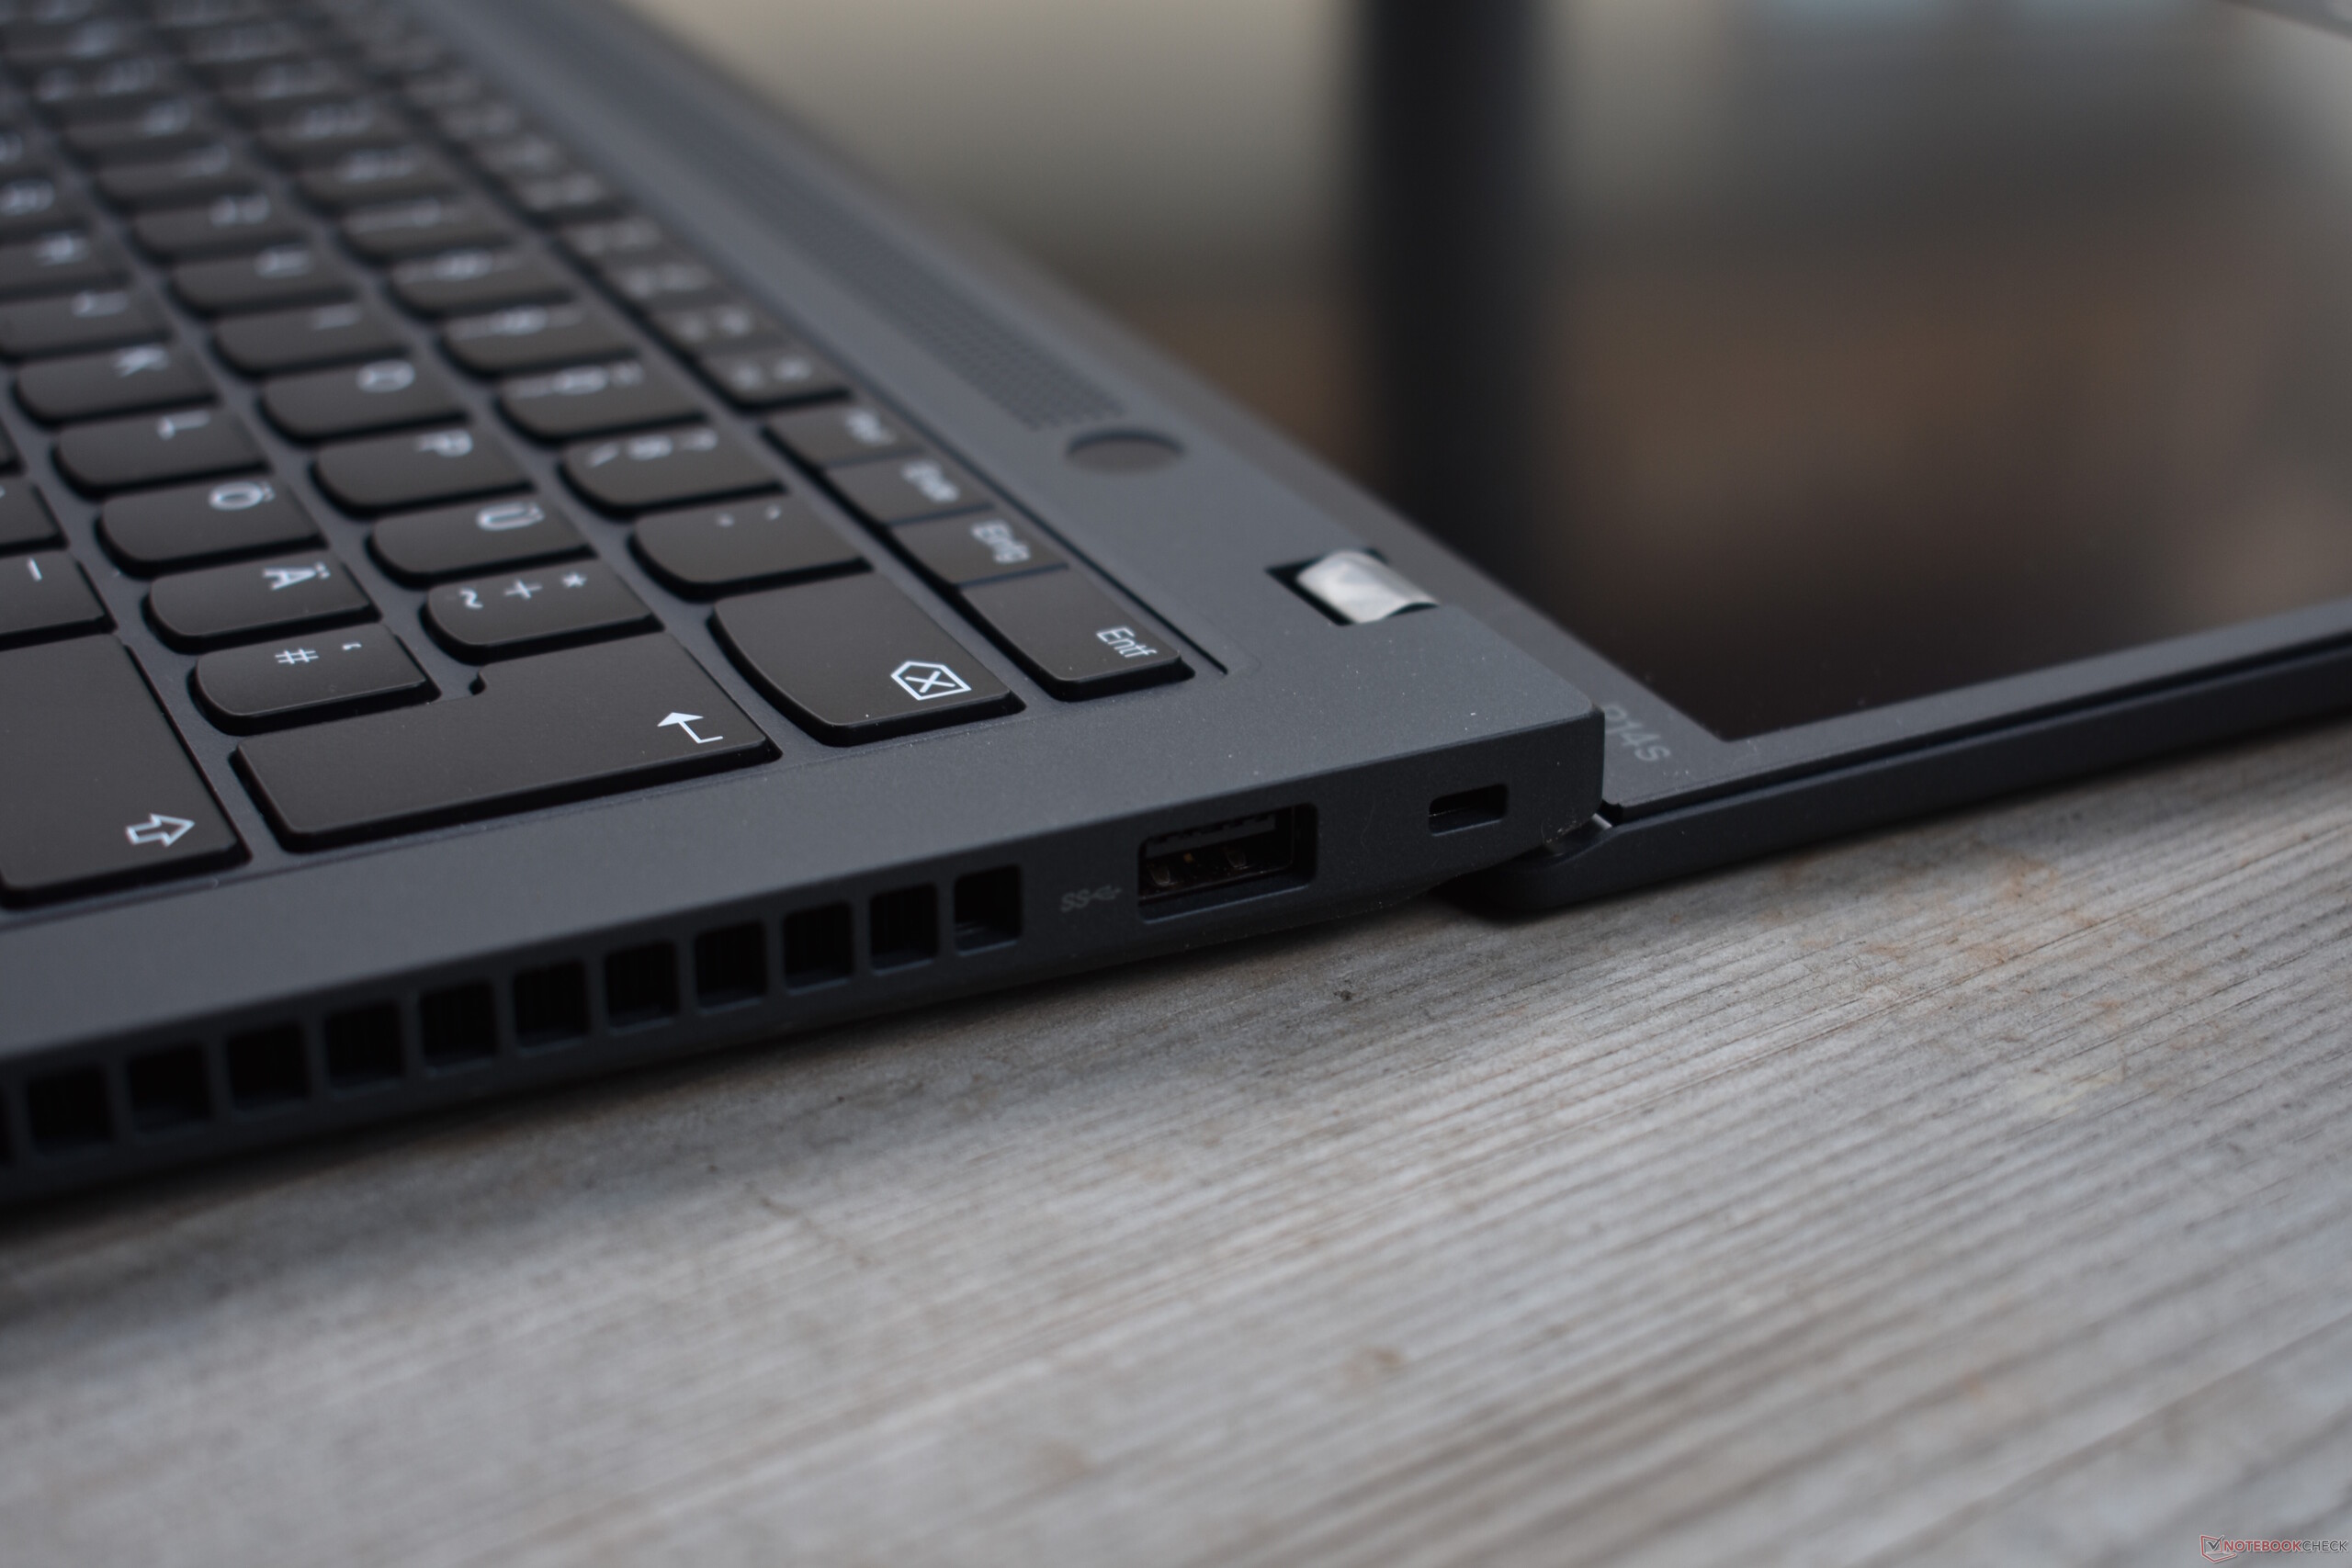
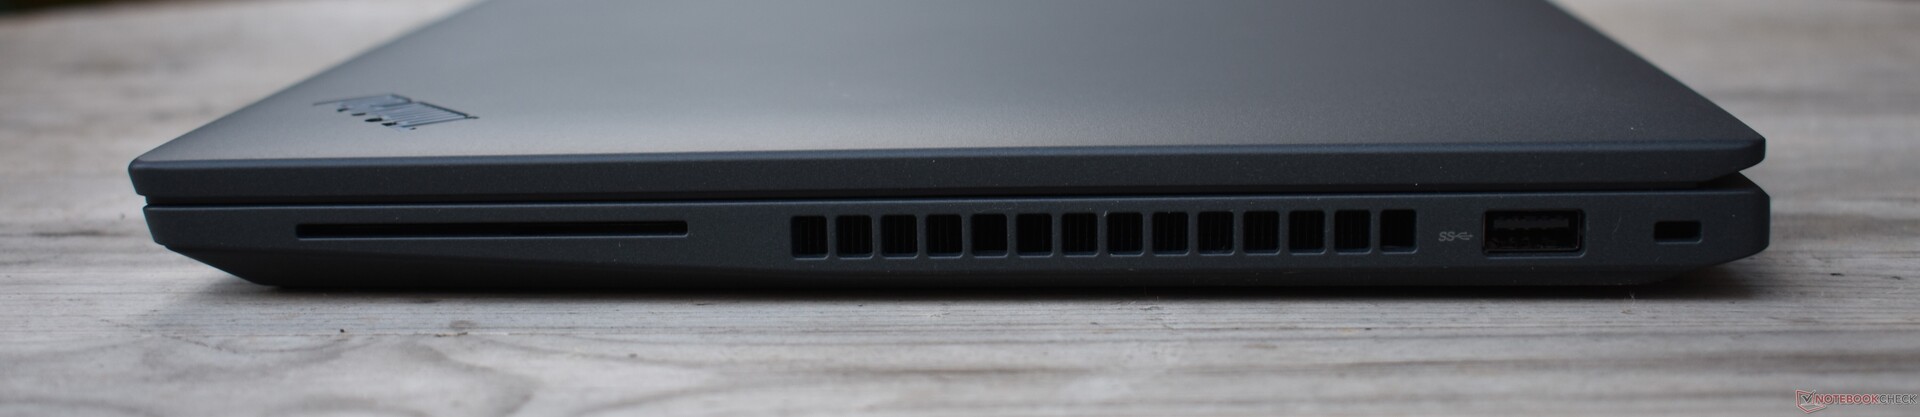
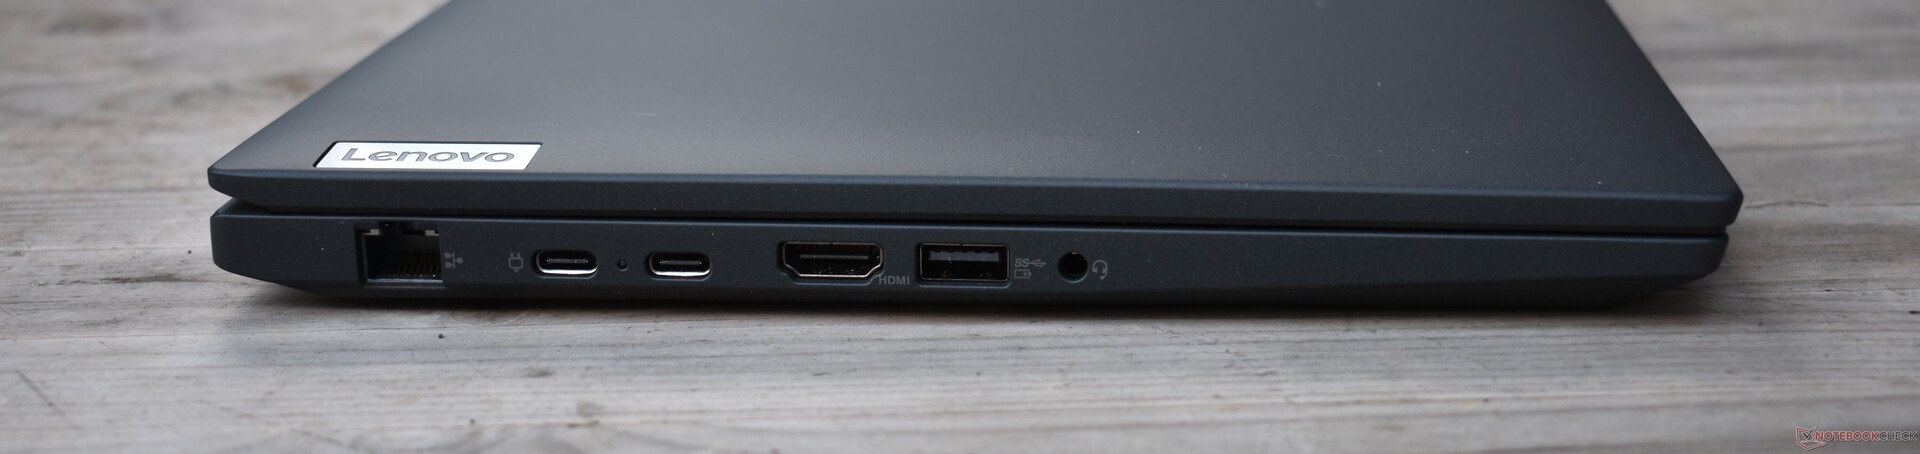
Portos
Suas amplas opções de conectividade são idênticas às do ThinkPad T14 Gen 3. Sua falta de USB4 e, como resultado, Thunderbolt, é decepcionante. Em troca, o Lenovo ThinkPad P14s G3 apresenta RJ45 Ethernet - as estações de trabalho de 14 polegadas da Dell e HP não possuem esta porta. No entanto, um slot de cartão SD ou pelo menos microSD seria idealmente incluído neste tipo de laptop.
Conectividade
Como todos os outros ThinkPads AMD atuais, o Lenovo ThinkPad P14s Gen 3 depende de uma solução Wi-Fi da Qualcomm. Isto pode alcançar altas taxas de transferência, mas a conexão não foi muito estável ao enviar dados.


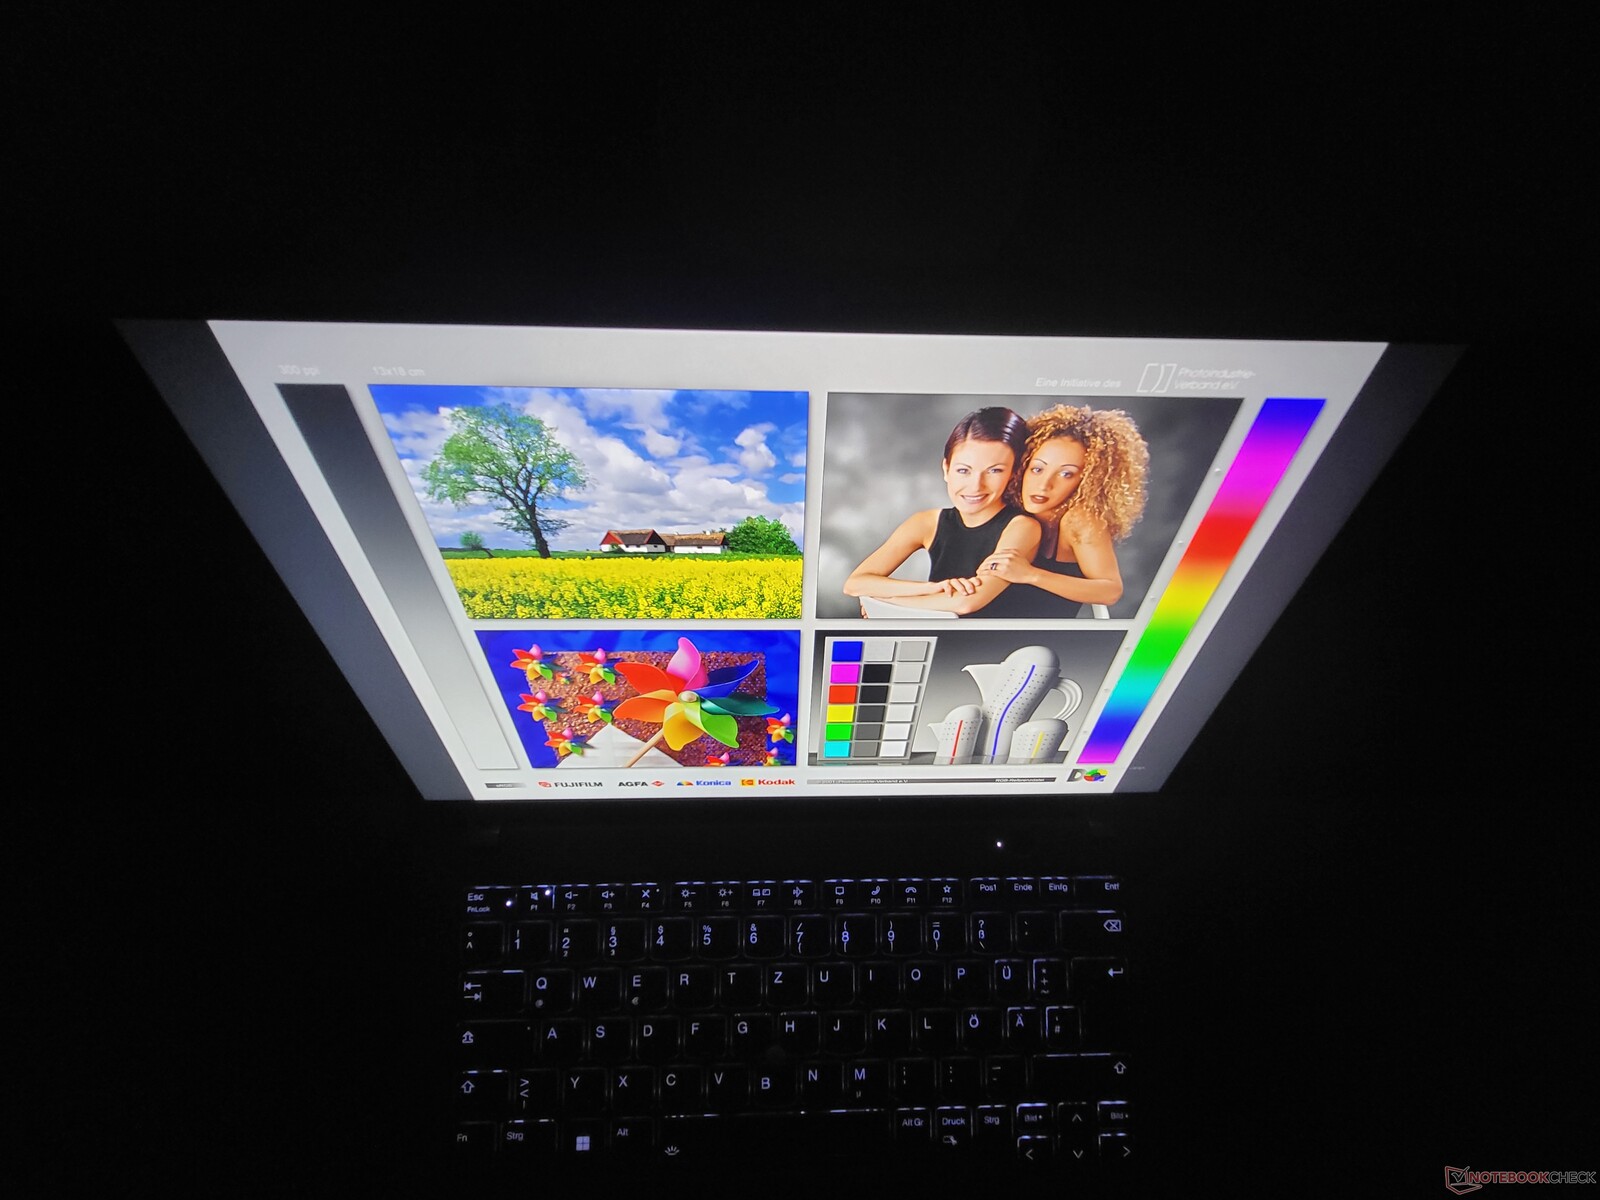
Mostrar: O painel de baixa potência mate do ThinkPad
Como é freqüentemente o caso dos laptops ThinkPad da Lenovo e laptops comerciais em geral, o ThinkPad P14s Gen 3 também tem várias opções de exibição. As características destas telas têm todas em comum: sua diagonal de 14 polegadas, seu formato 16:10, assim como sua tecnologia IPS-LCD:
- WUXGA (1.920 x 1.200), 300 cd/m², 45 % NTSC, Anti-Glare
- WUXGA (1.920 x 1.200), 400 cd/m², 100 % sRGB, Anti-cruzeiro, Baixa potência
- WUXGA (1.920 x 1.200), 300 cd/m², 45 % NTSC, Anti-cruzeiro, On-Cell-Multitouch
- WQUXGA (3.840 x 2.400), 500 cd/m², 100 % DCI-P3, Anti-reflexo, Add-On-Film-Multitouch
Já testamos a tela de baixa potência da LG no ThinkPad T14 Gen 3. Ela excedeu o valor de brilho declarado de 400 cd/m² - seu brilho médio foi de 422 cd/m². Este não é o único painel que a Lenovo comercializa como uma "tela de baixa potência" - no ThinkPad T14s Gen 3, por exemplo, testamos um painel CSOT que proporcionou um pouco menos de brilho. Este "display lottery" também é o caso do ThinkPad P14s G3.
| |||||||||||||||||||||||||
iluminação: 85 %
iluminação com acumulador: 448 cd/m²
Contraste: 1948:1 (Preto: 0.23 cd/m²)
ΔE ColorChecker Calman: 2.5 | ∀{0.5-29.43 Ø4.71}
calibrated: 1.3
ΔE Greyscale Calman: 2.9 | ∀{0.09-98 Ø4.96}
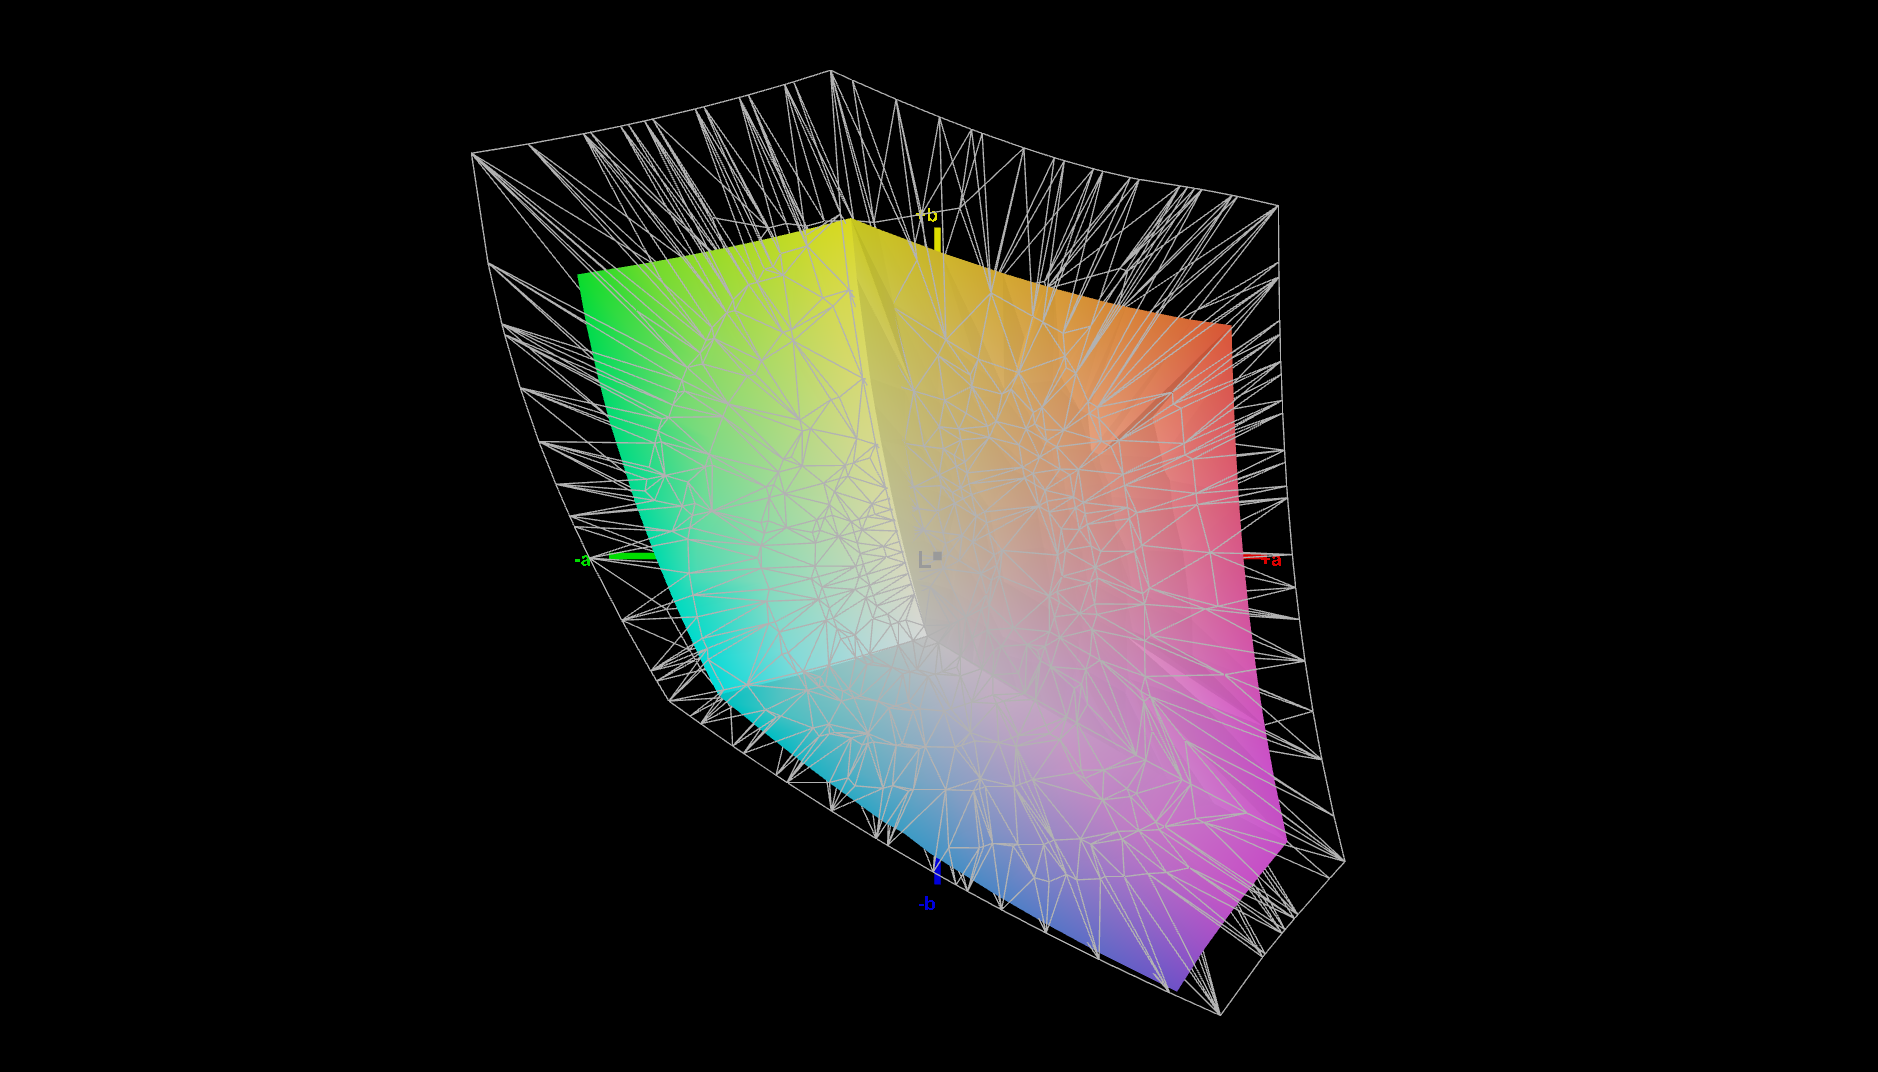
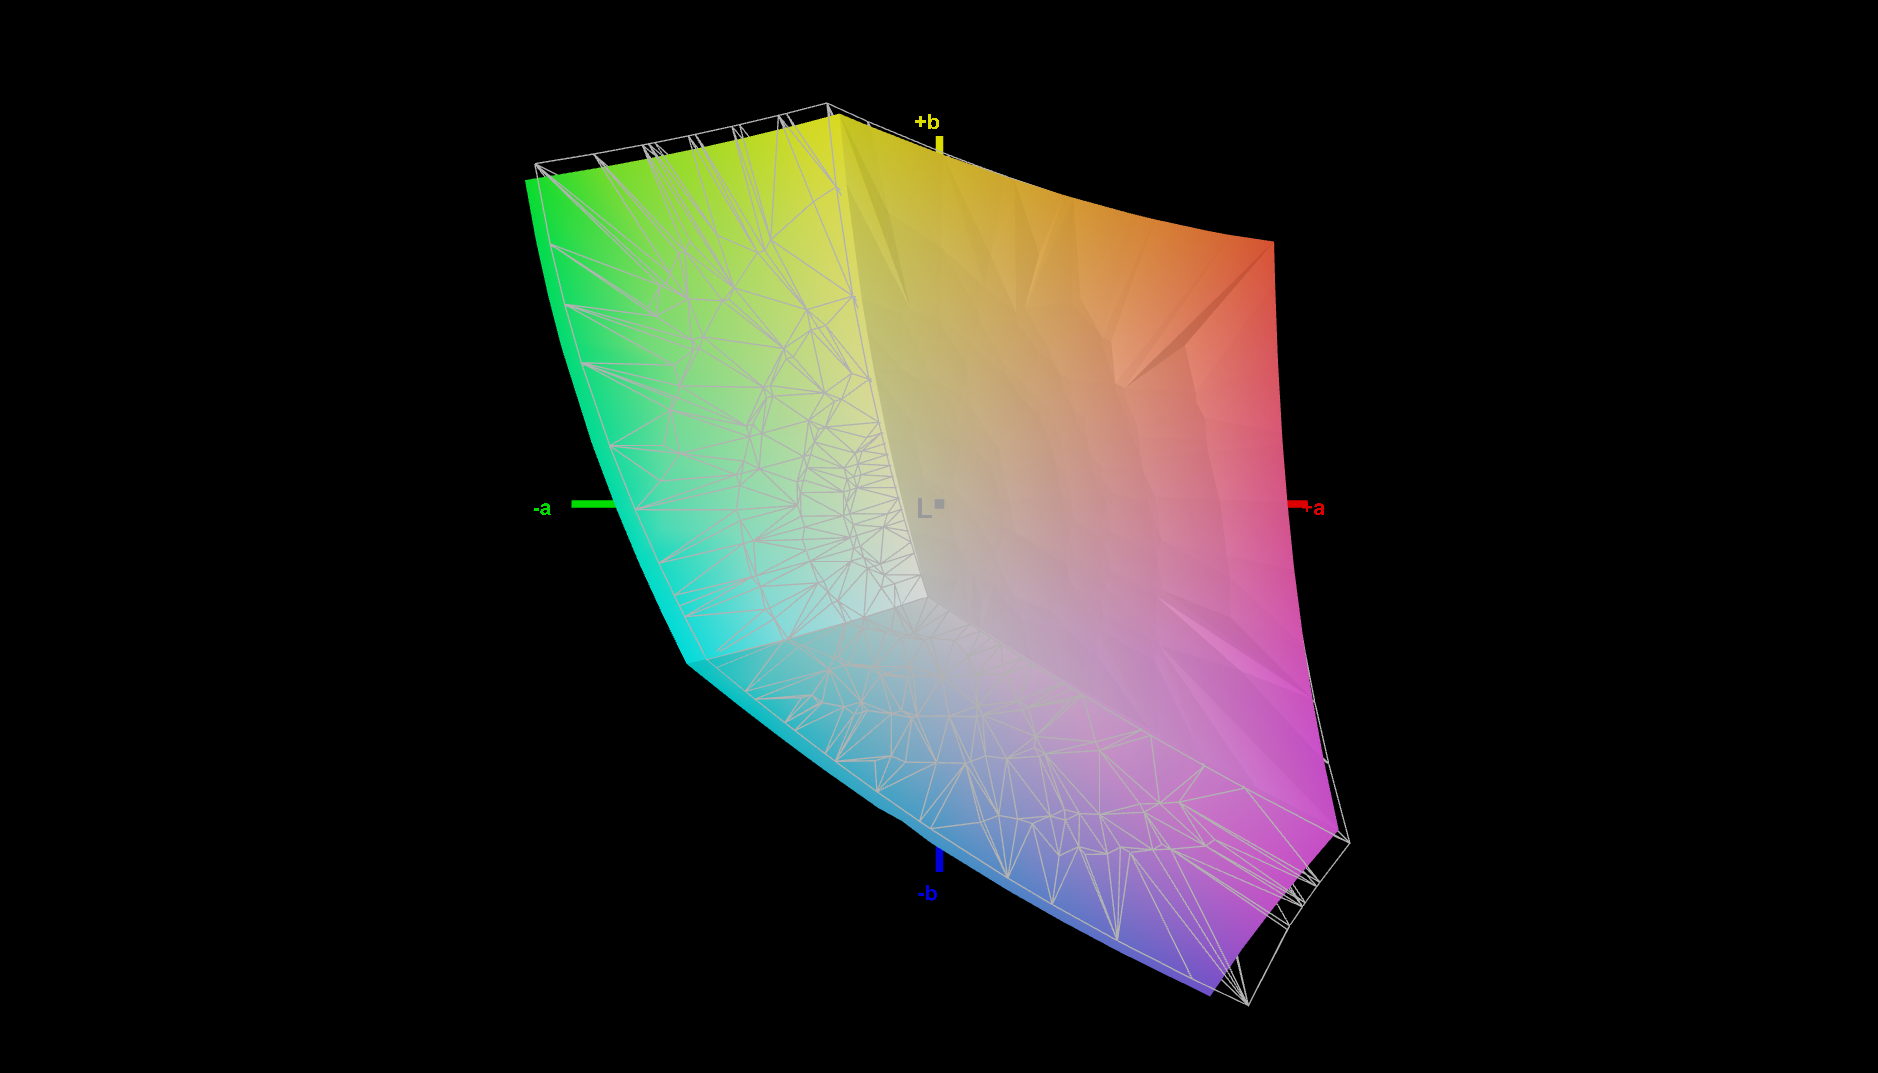
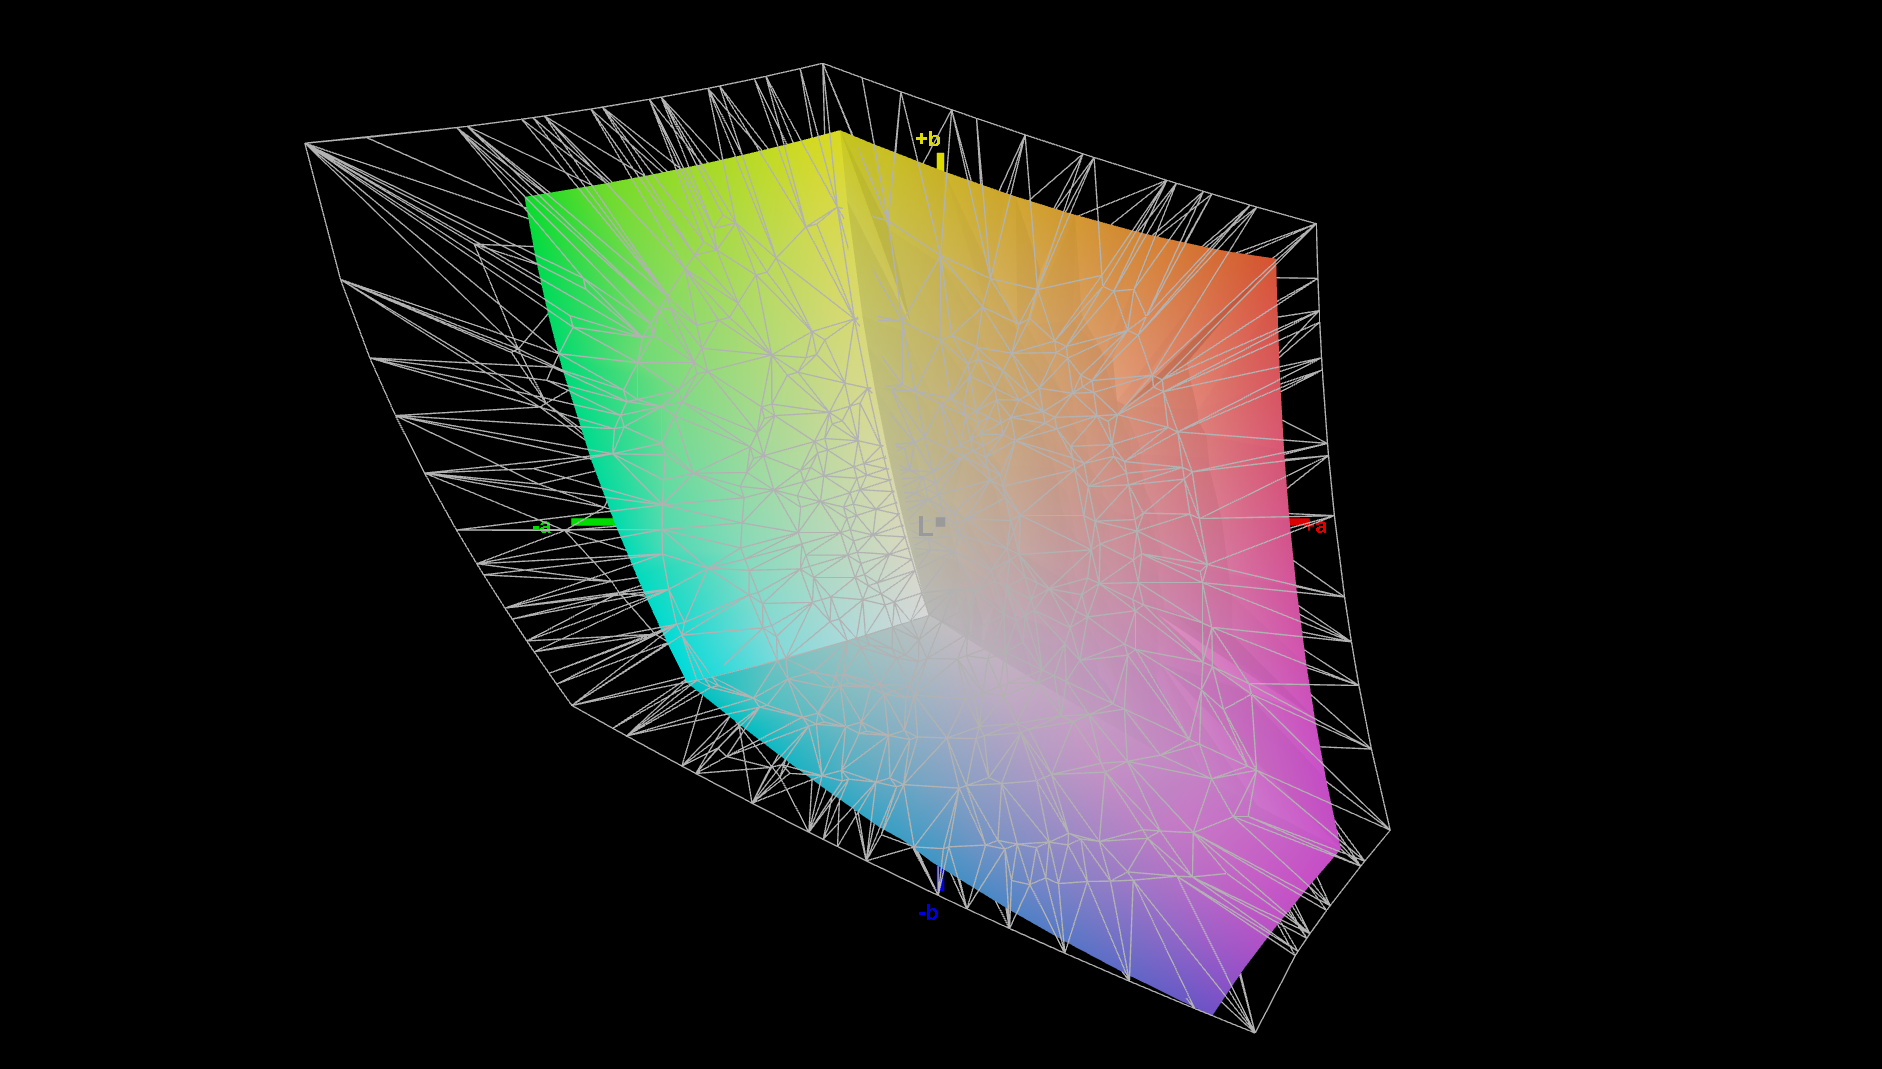
68.2% AdobeRGB 1998 (Argyll 3D)
94.3% sRGB (Argyll 3D)
65.9% Display P3 (Argyll 3D)
Gamma: 2.03
CCT: 6840 K
| Lenovo ThinkPad P14s G3 AMD 21J6S05000 LP140WU1-SPB2, IPS LED, 1920x1200, 14" | Lenovo ThinkPad P14s Gen2-20VX000GGE B140HAN05.7, IPS, 1920x1080, 14" | Lenovo ThinkPad T14 G3-21CF004NGE LP140WU1-SPB2, IPS, 1920x1200, 14" | Dell Precision 5000 5470 AU Optronics B140QAN, IPS, 2560x1600, 14" | HP ZBook Firefly 14 G9-6B8A2EA CMN1435, IPS, 1920x1200, 14" | Lenovo ThinkPad T14s G3 21CQ002LGE MNE007JA1-1, LTPS IPS LED, 1920x1200, 14" | |
|---|---|---|---|---|---|---|
| Display | -0% | 4% | 14% | 5% | 5% | |
| Display P3 Coverage (%) | 65.9 | 65.4 -1% | 69.2 5% | 79.3 20% | 69.6 6% | 69.4 5% |
| sRGB Coverage (%) | 94.3 | 96.6 2% | 97.4 3% | 100 6% | 99.9 6% | 99.8 6% |
| AdobeRGB 1998 Coverage (%) | 68.2 | 66.5 -2% | 71.5 5% | 78.7 15% | 71.1 4% | 71.4 5% |
| Response Times | -54% | -1% | -43% | -37% | -1% | |
| Response Time Grey 50% / Grey 80% * (ms) | 33.5 ? | 58.8 ? -76% | 41.4 ? -24% | 52.4 ? -56% | 56.3 ? -68% | 36.3 ? -8% |
| Response Time Black / White * (ms) | 24.9 ? | 32.8 ? -32% | 19.2 ? 23% | 32.4 ? -30% | 26.2 ? -5% | 23.1 ? 7% |
| PWM Frequency (Hz) | ||||||
| Screen | -24% | 1% | -2% | -15% | 13% | |
| Brightness middle (cd/m²) | 448 | 350 -22% | 451 1% | 537 20% | 432 -4% | 396 -12% |
| Brightness (cd/m²) | 422 | 348 -18% | 435 3% | 518 23% | 407 -4% | 379 -10% |
| Brightness Distribution (%) | 85 | 94 11% | 94 11% | 94 11% | 91 7% | 92 8% |
| Black Level * (cd/m²) | 0.23 | 0.14 39% | 0.21 9% | 0.33 -43% | 0.28 -22% | 0.26 -13% |
| Contrast (:1) | 1948 | 2500 28% | 2148 10% | 1627 -16% | 1543 -21% | 1523 -22% |
| Colorchecker dE 2000 * | 2.5 | 4.3 -72% | 2.4 4% | 2.97 -19% | 3.1 -24% | 1.3 48% |
| Colorchecker dE 2000 max. * | 3.7 | 6.7 -81% | 4.1 -11% | 5.33 -44% | 5.6 -51% | 2.7 27% |
| Colorchecker dE 2000 calibrated * | 1.3 | 1.5 -15% | 1.3 -0% | 0.88 32% | 0.8 38% | 0.7 46% |
| Greyscale dE 2000 * | 2.9 | 5.3 -83% | 3.3 -14% | 2.4 17% | 4.5 -55% | 1.6 45% |
| Gamma | 2.03 108% | 2.42 91% | 2.13 103% | 2.06 107% | 2 110% | 2.14 103% |
| CCT | 6840 95% | 7631 85% | 6848 95% | 6668 97% | 6528 100% | 6554 99% |
| Color Space (Percent of AdobeRGB 1998) (%) | 61.1 | |||||
| Color Space (Percent of sRGB) (%) | 96.4 | |||||
| Média Total (Programa/Configurações) | -26% /
-23% | 1% /
2% | -10% /
-5% | -16% /
-14% | 6% /
9% |
* ... menor é melhor
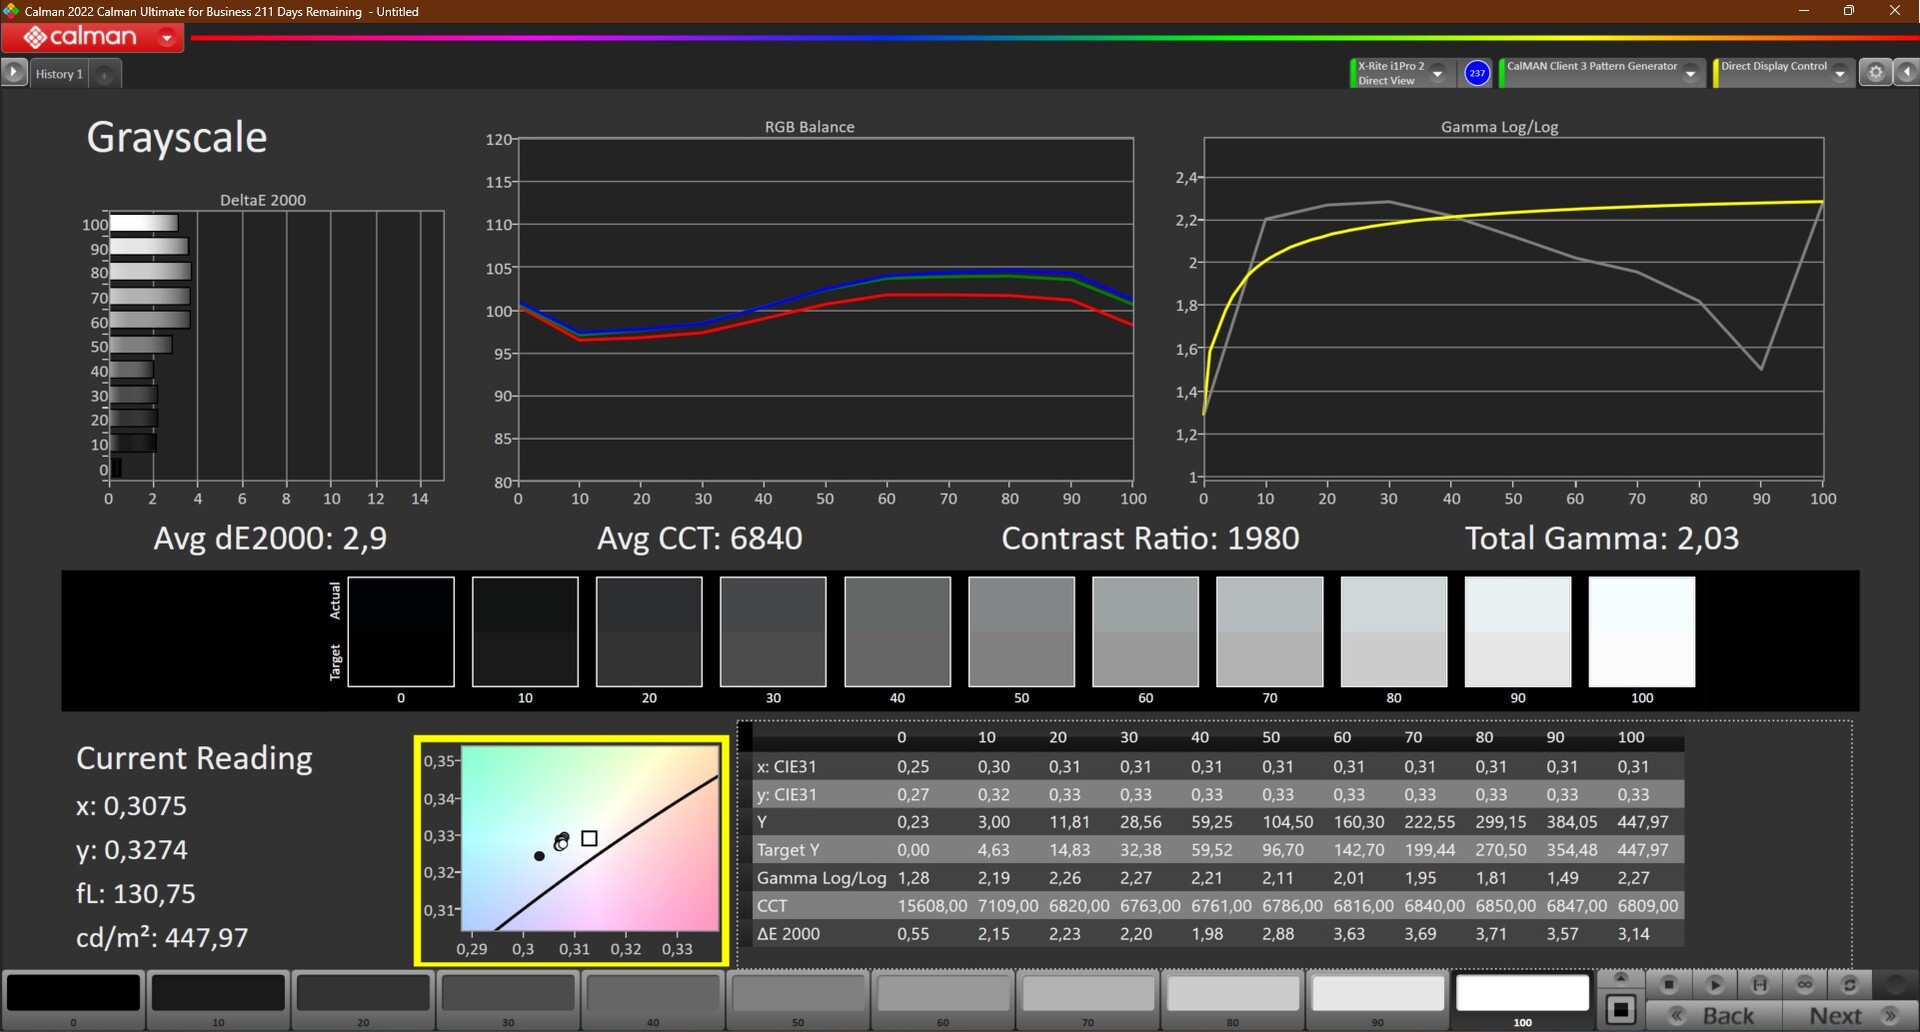
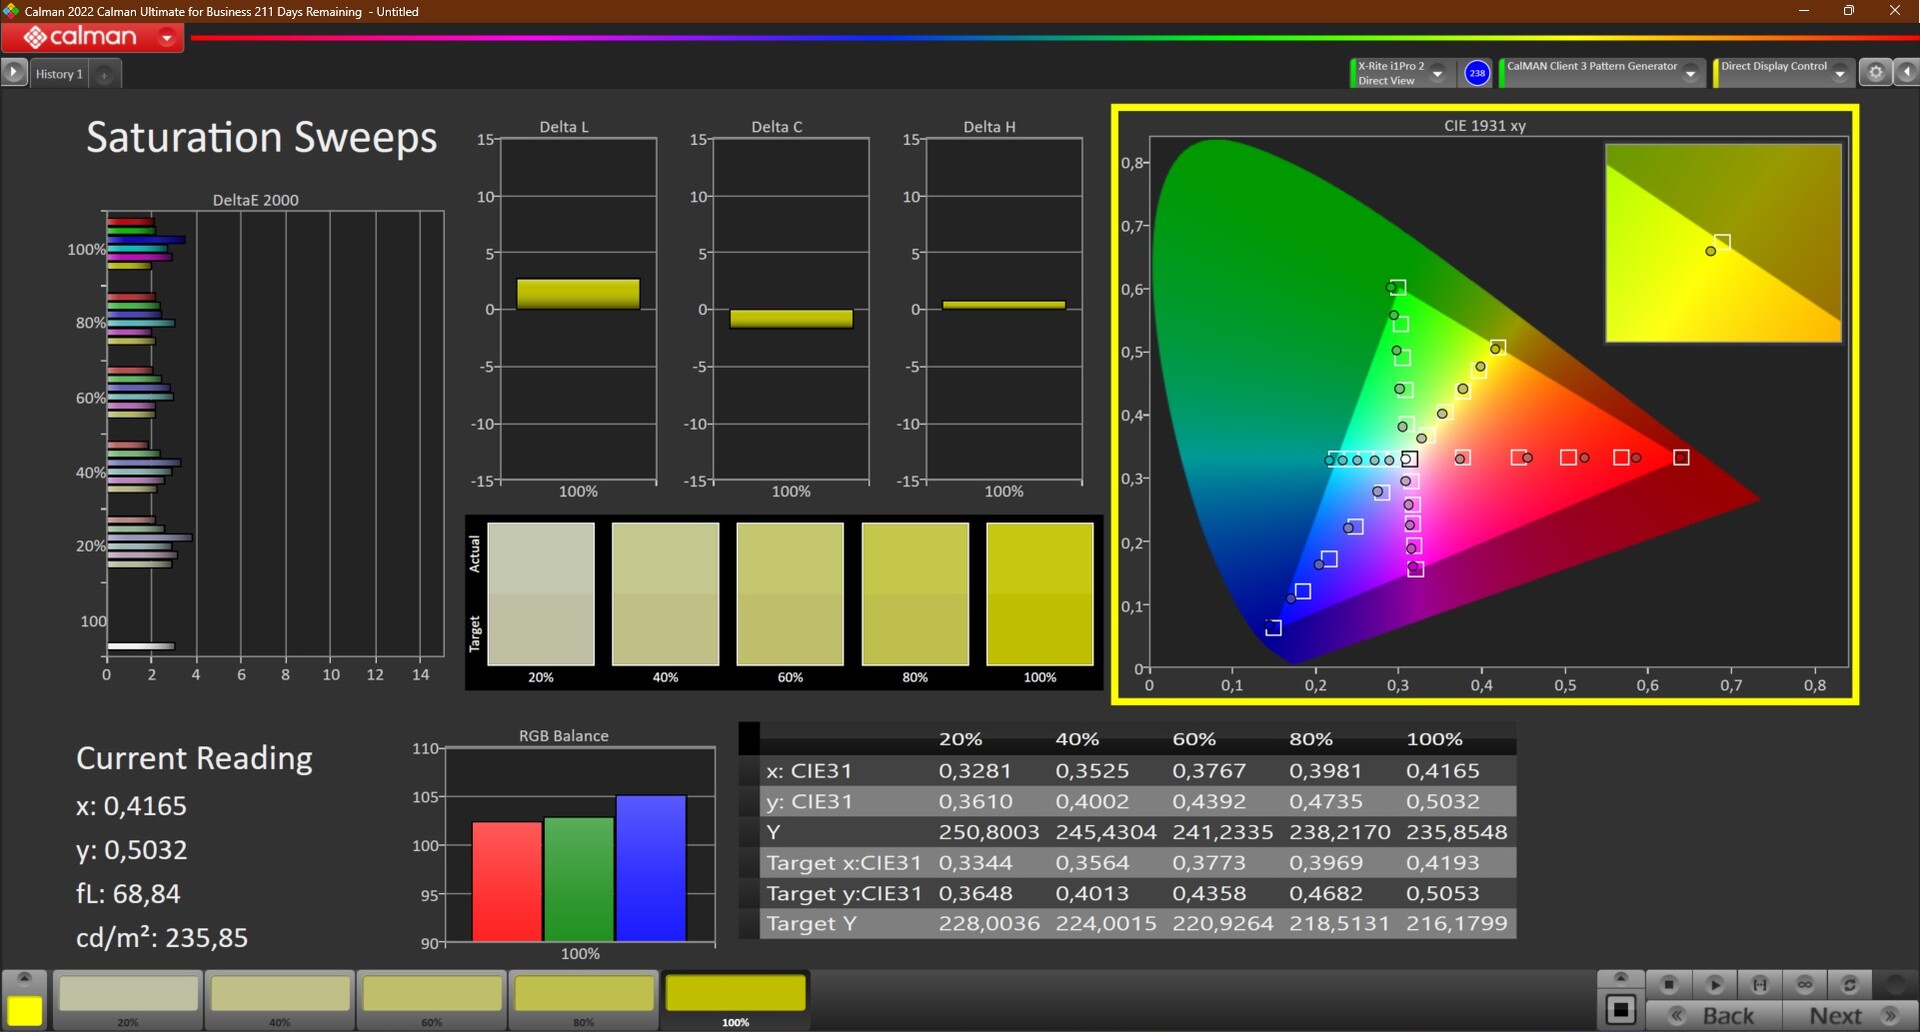
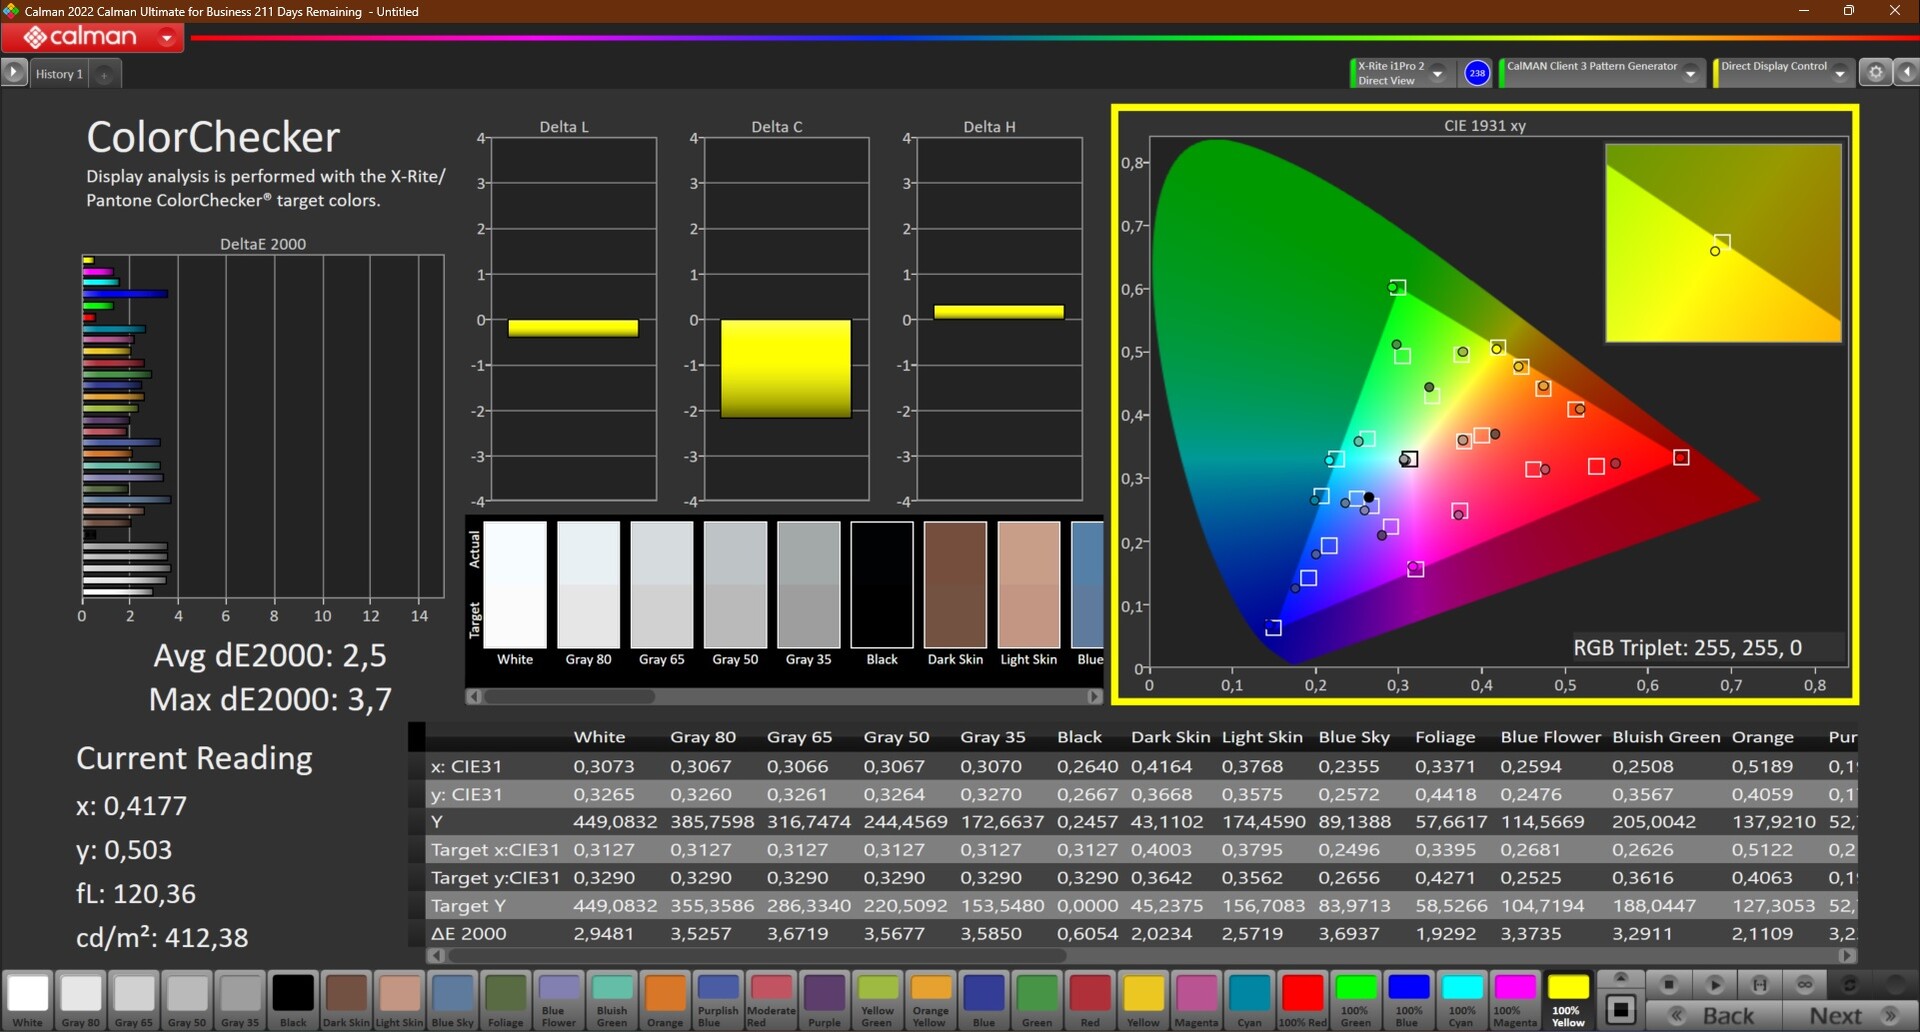
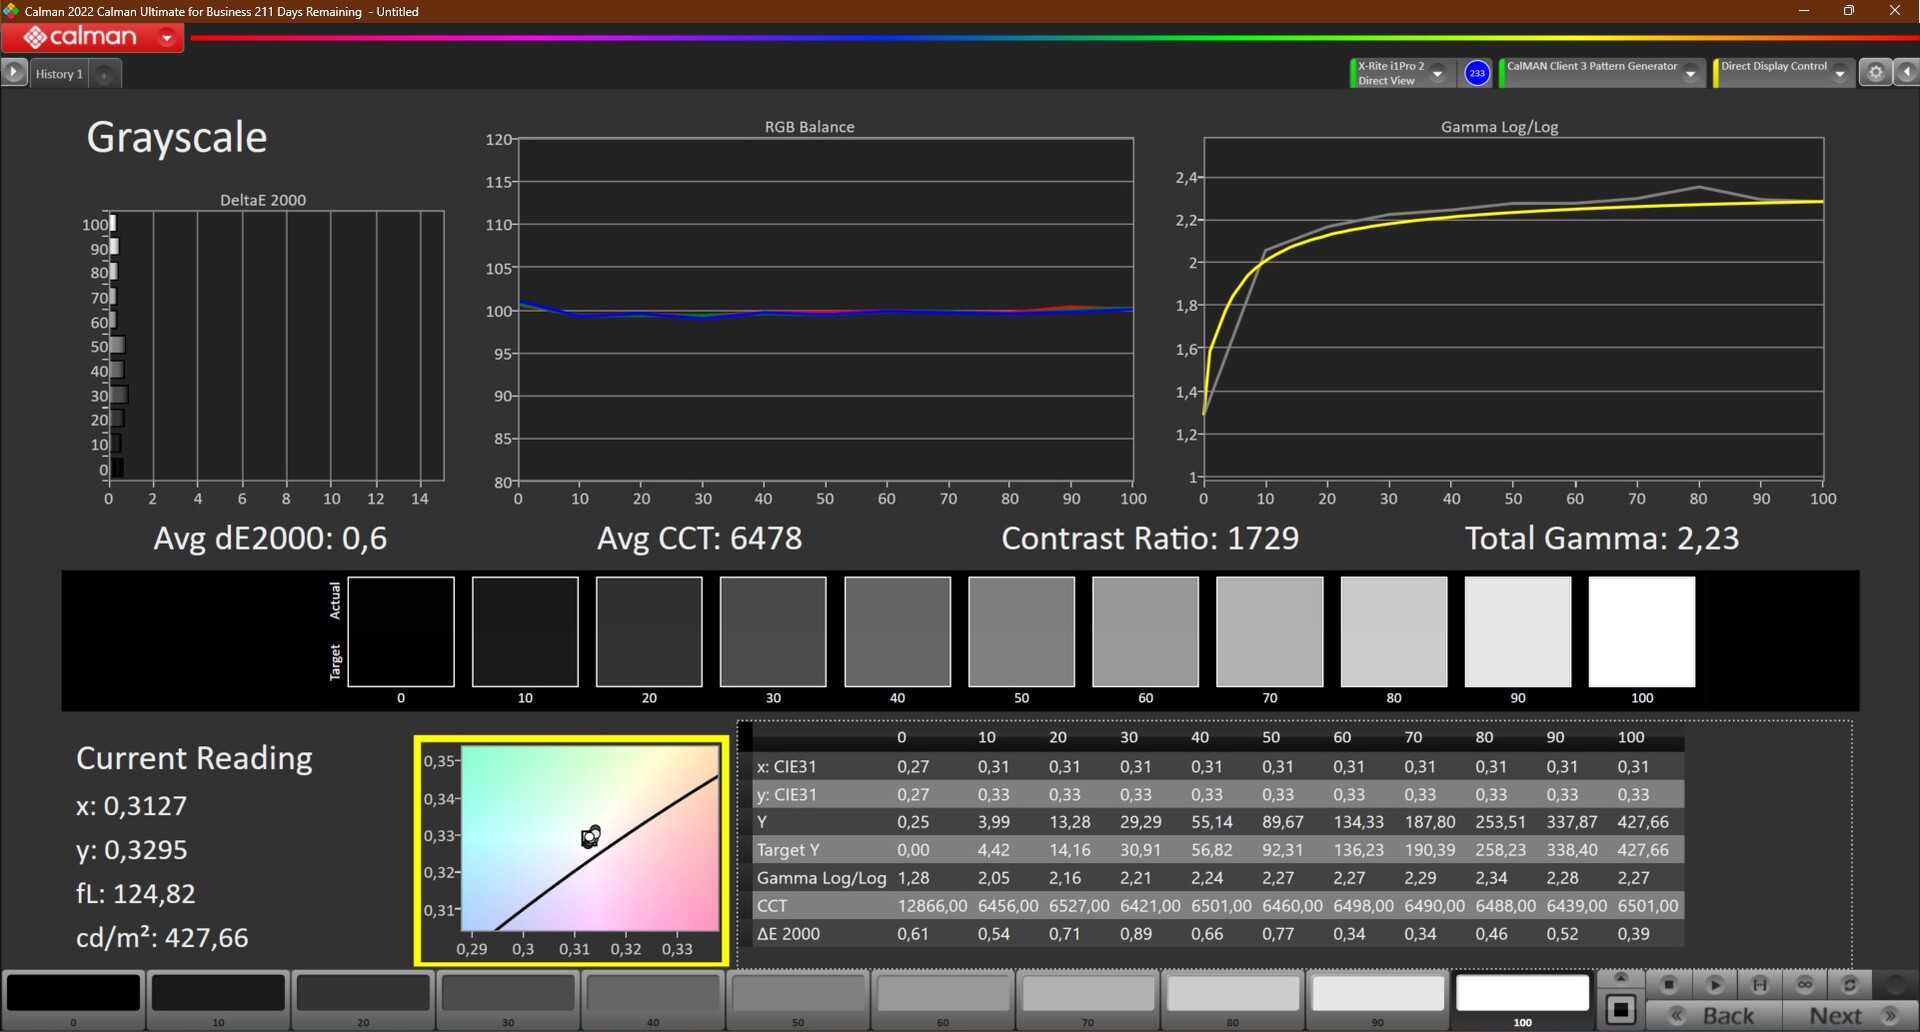
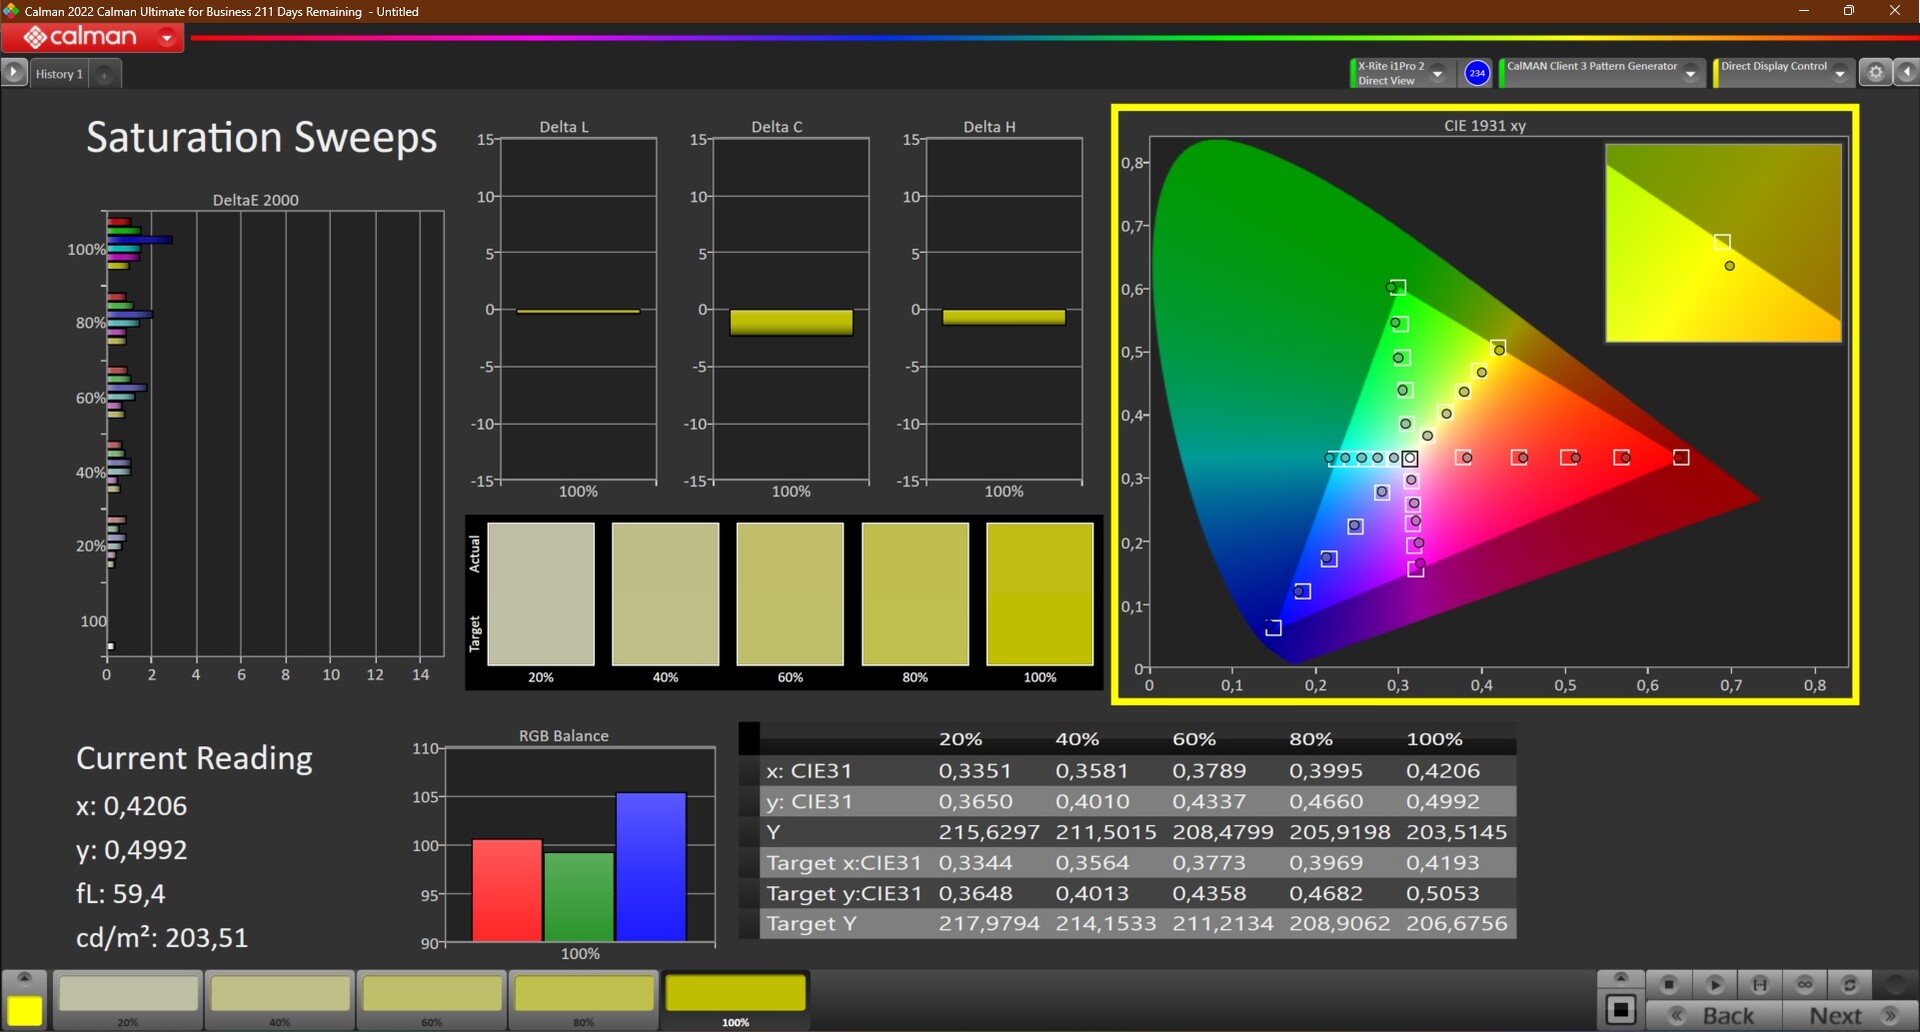
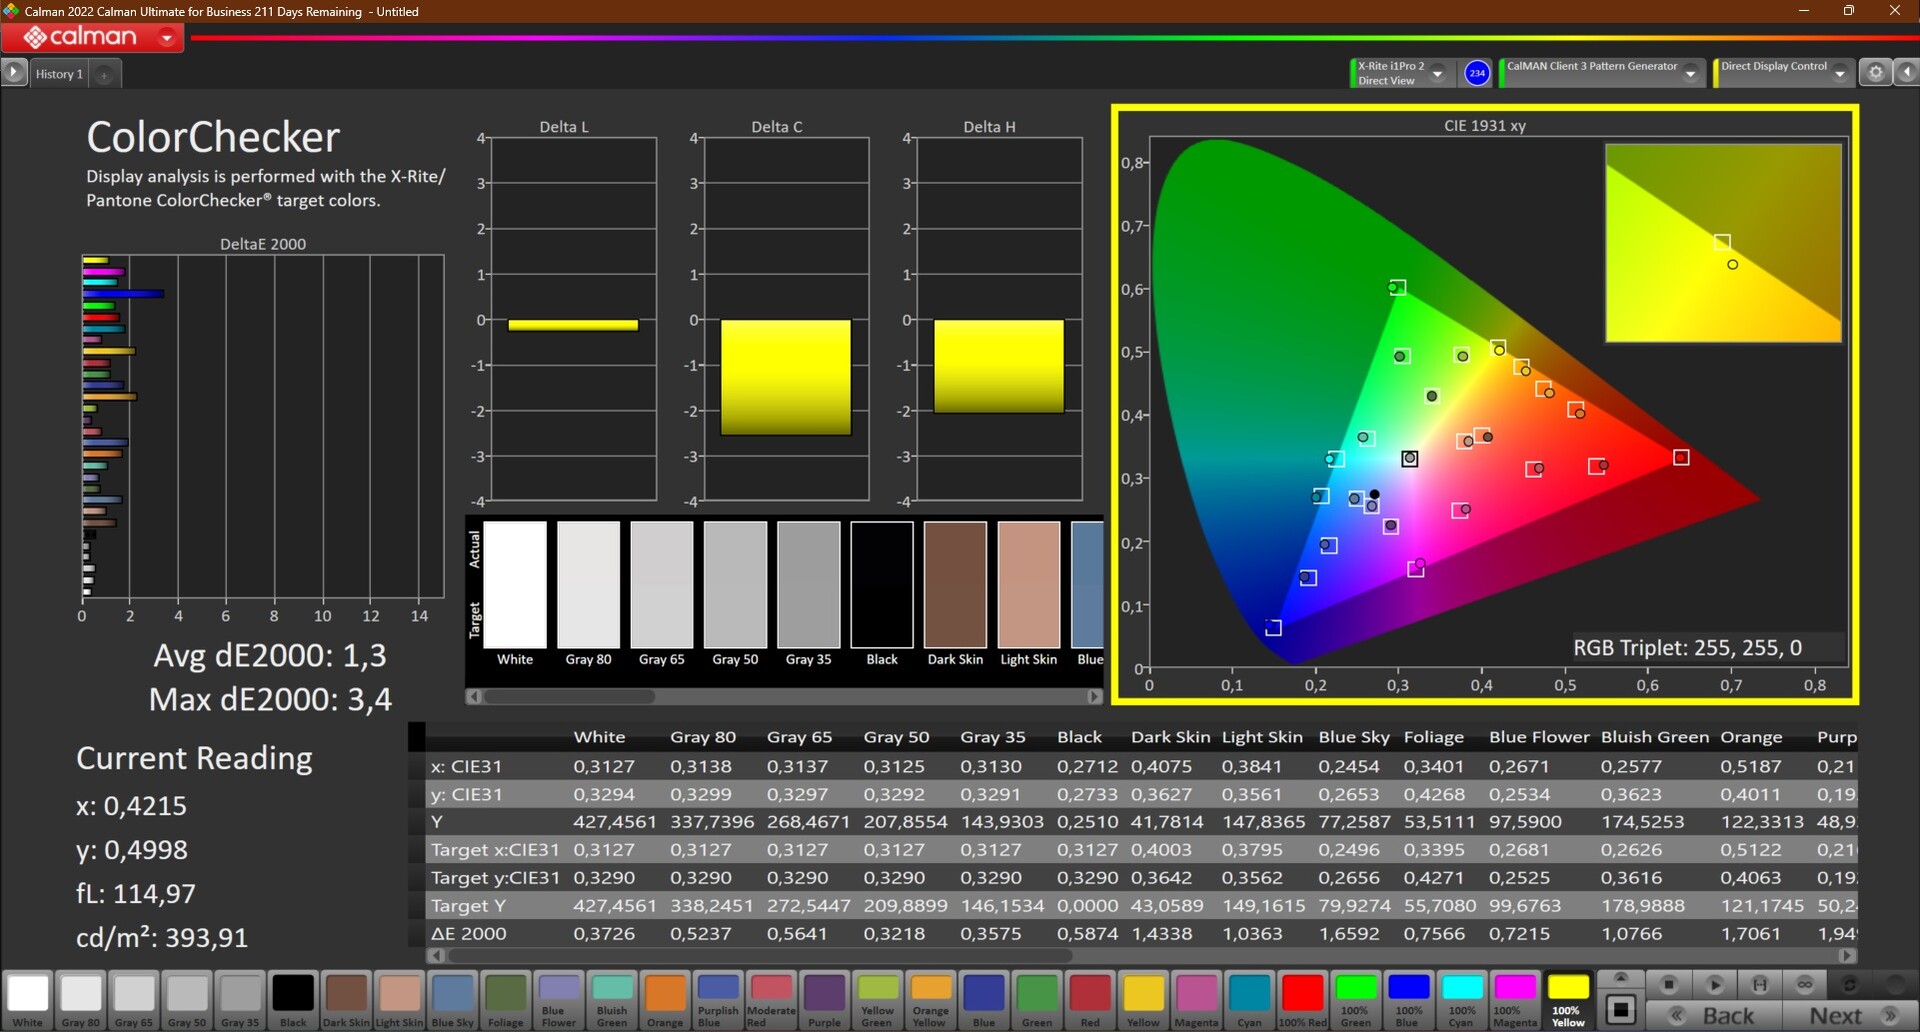
As cores da tela estavam um pouco frias diretamente fora da caixa, que medimos usando o software Calman e o colorímetro X-Rite i1Pro 2. Uma calibração usando o i1Profiler foi capaz de corrigir este desequilíbrio de cores. Como sempre, o perfil correspondente está disponível para download gratuito na caixa cinza com os valores medidos. O valor do deltaE--Colorchecker atingiu um valor muito bom de 1,3 no estado calibrado.
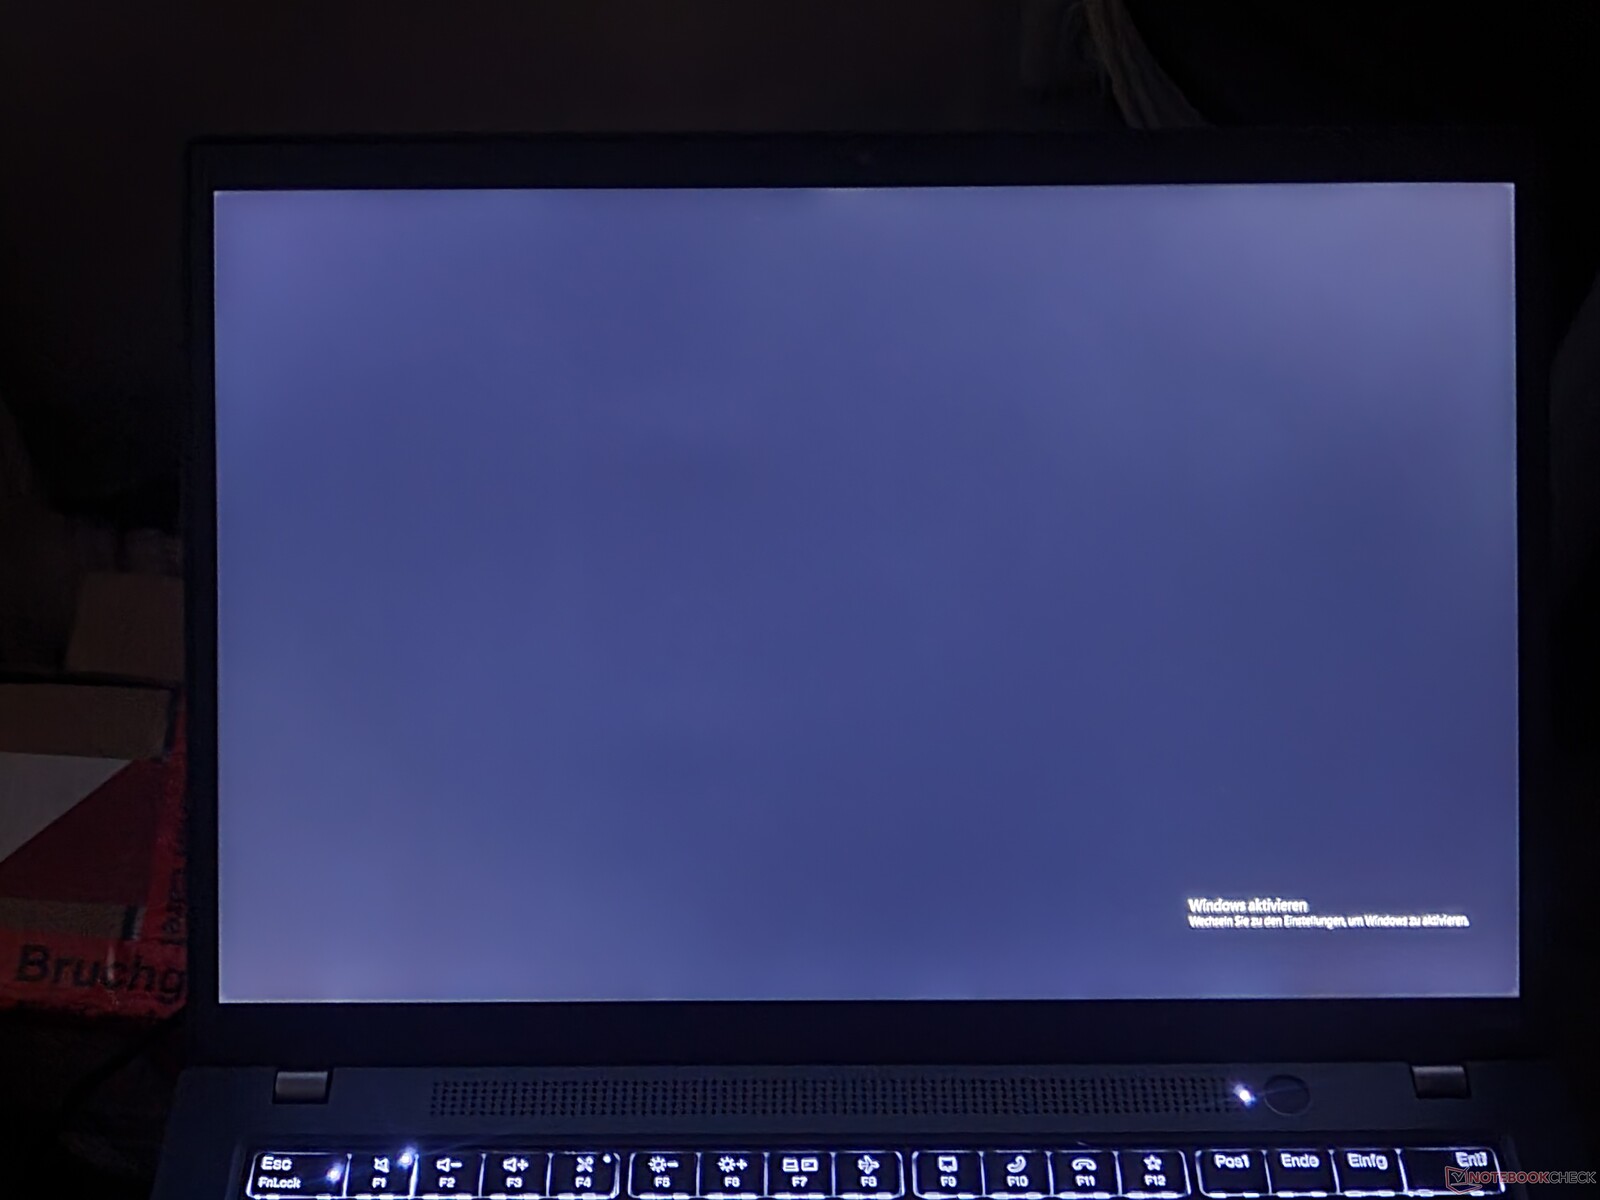
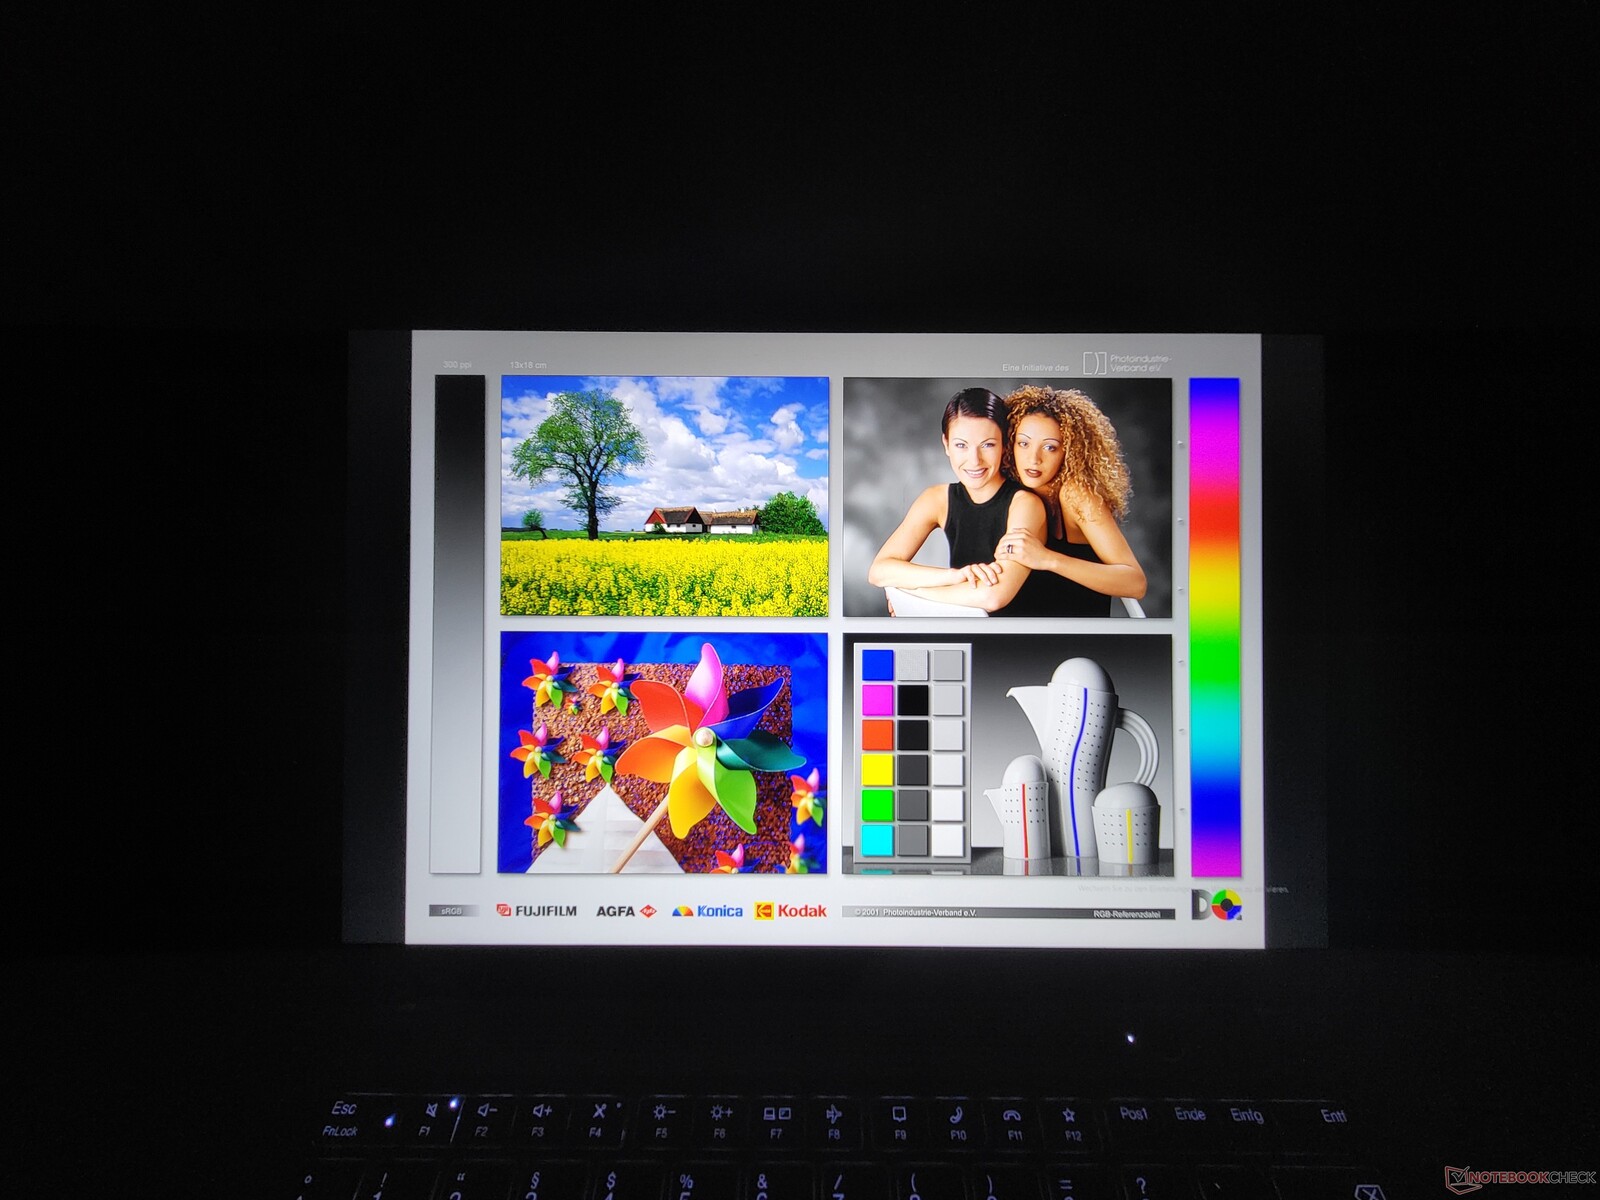
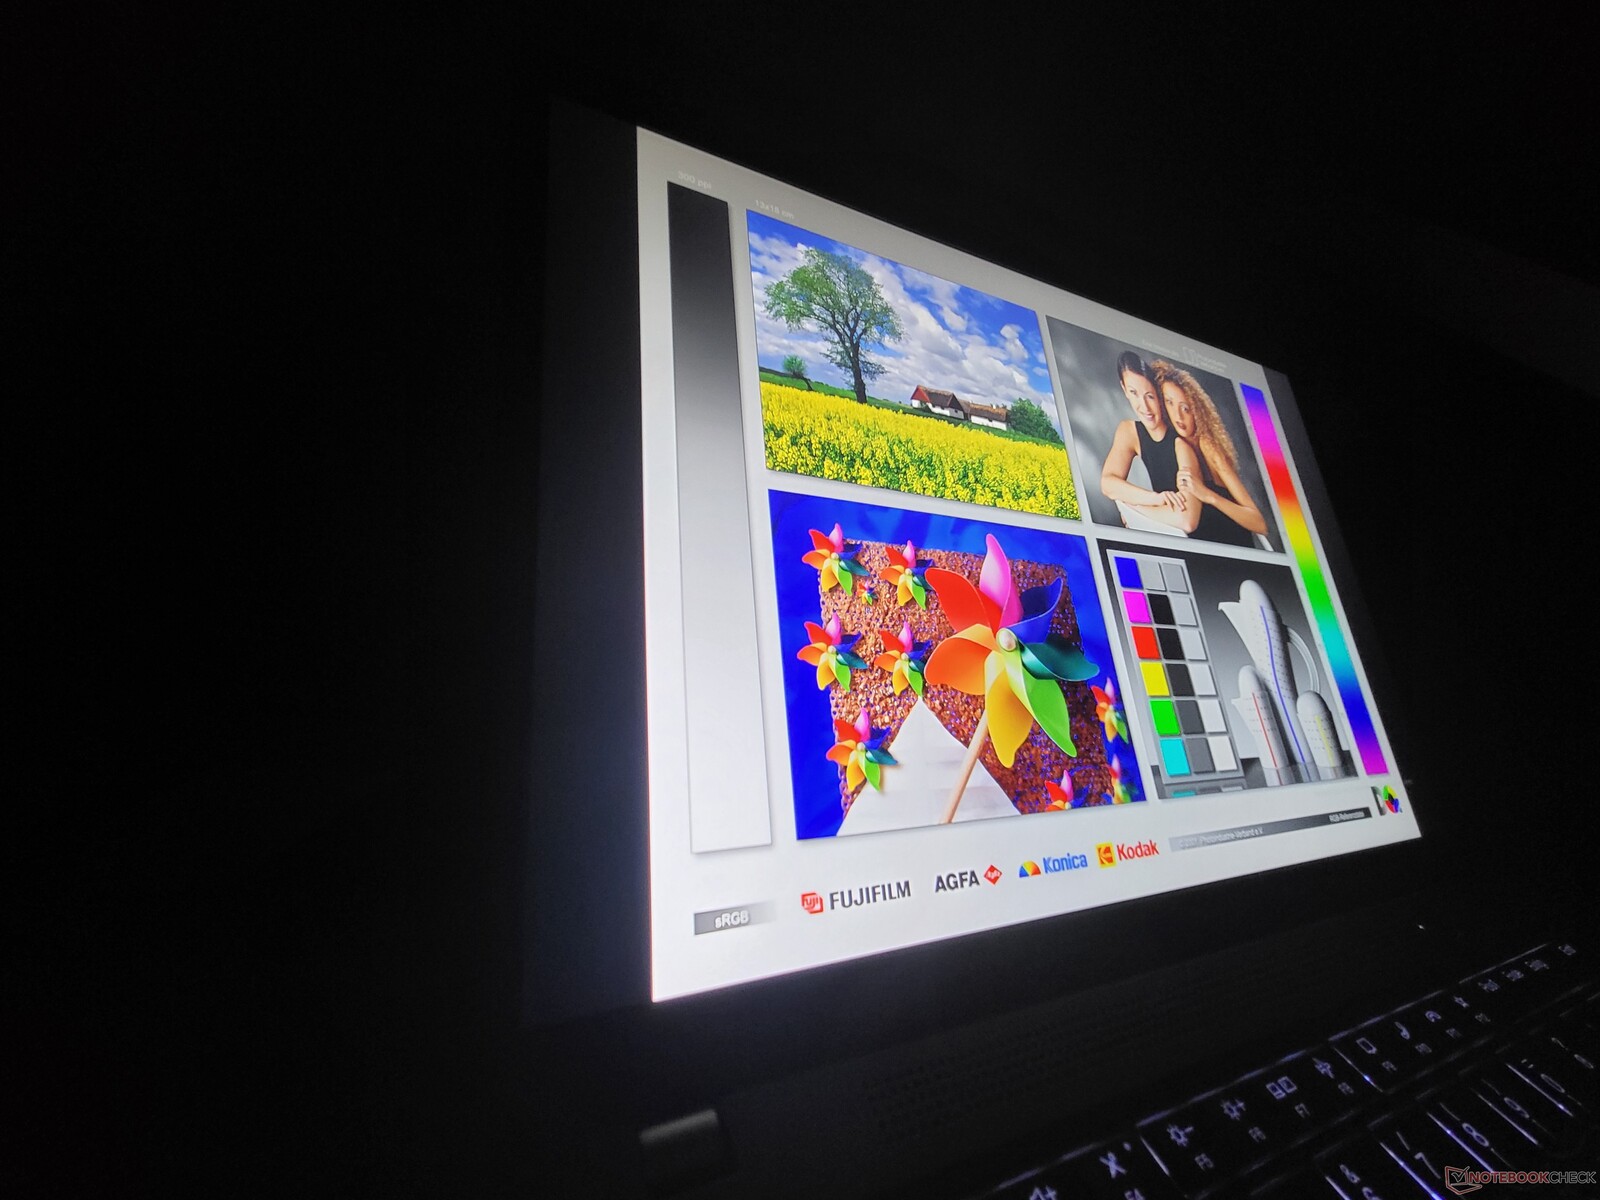
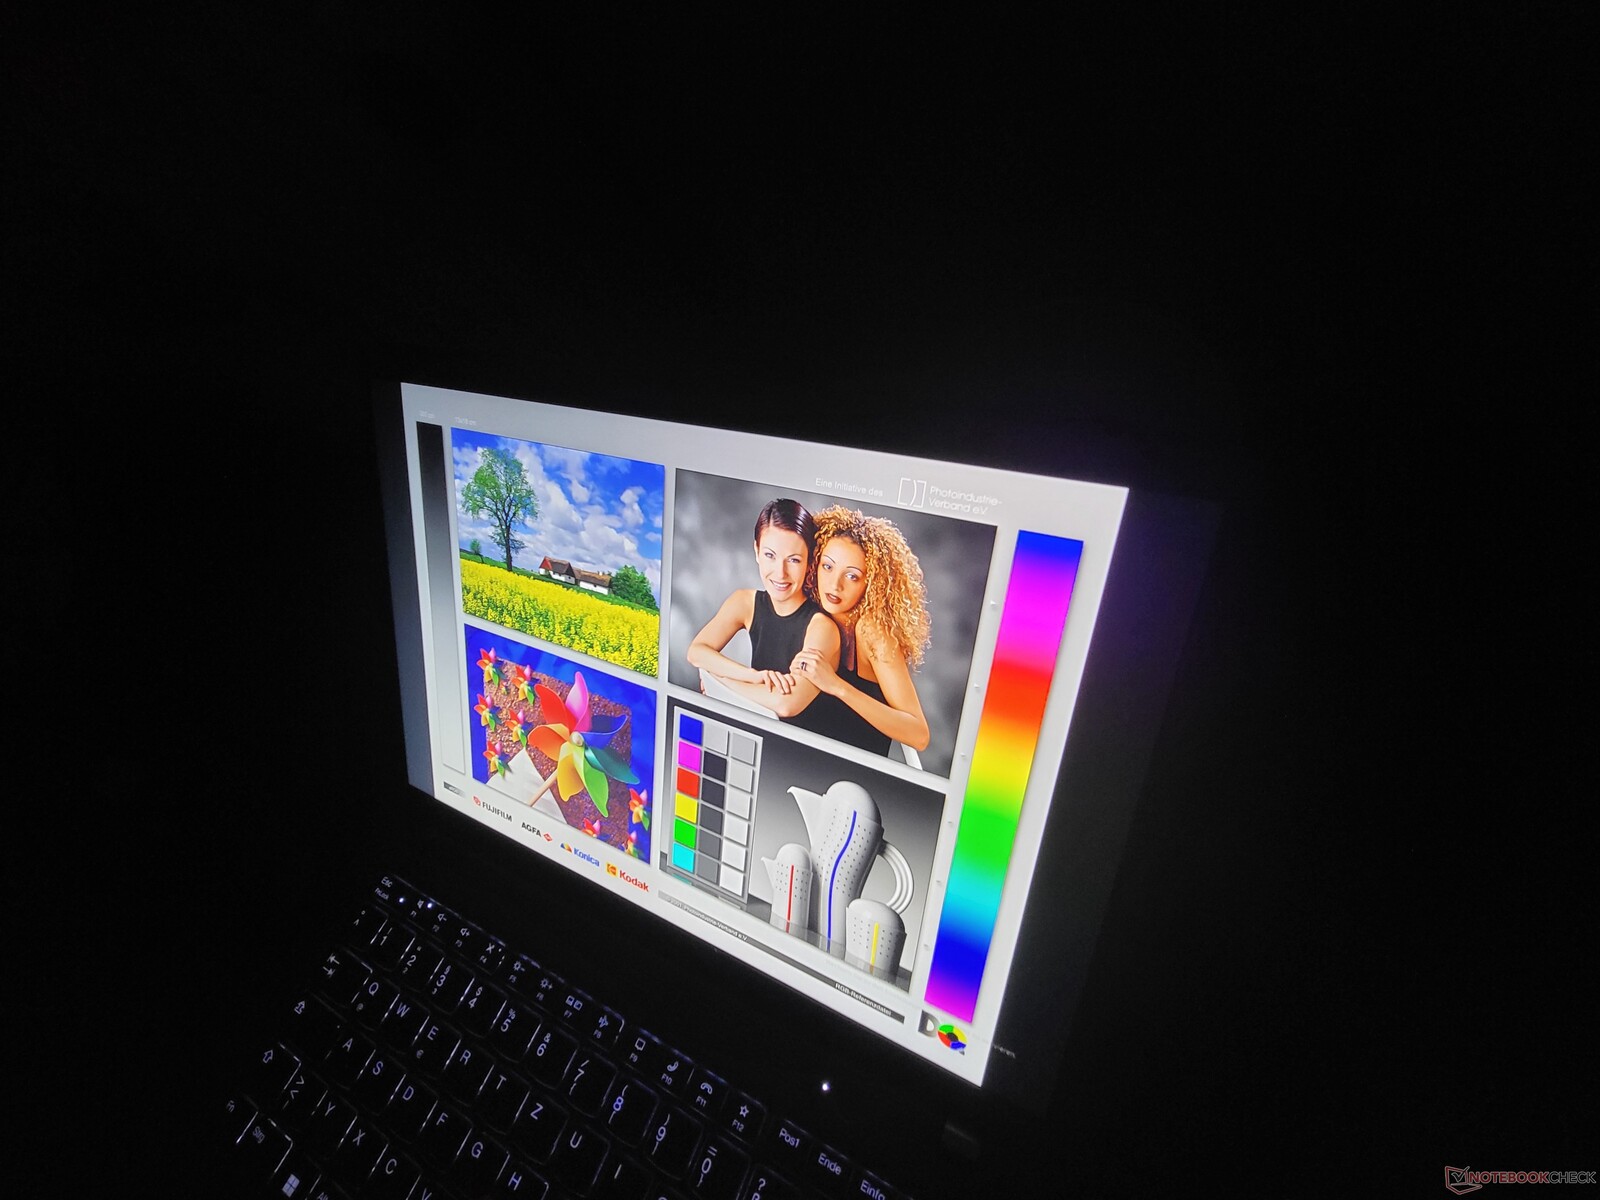
O visor LG não conseguiu atingir o valor anunciado de 100% sRGB: a 94,3%, a meta foi simplesmente perdida. Posteriormente, o painel do Lenovo ThinkPad P14s Gen 3 não pode ser recomendado para a edição de imagens. Os usuários que procuram fazer isso ficariam melhor com a tela WQUXGA.
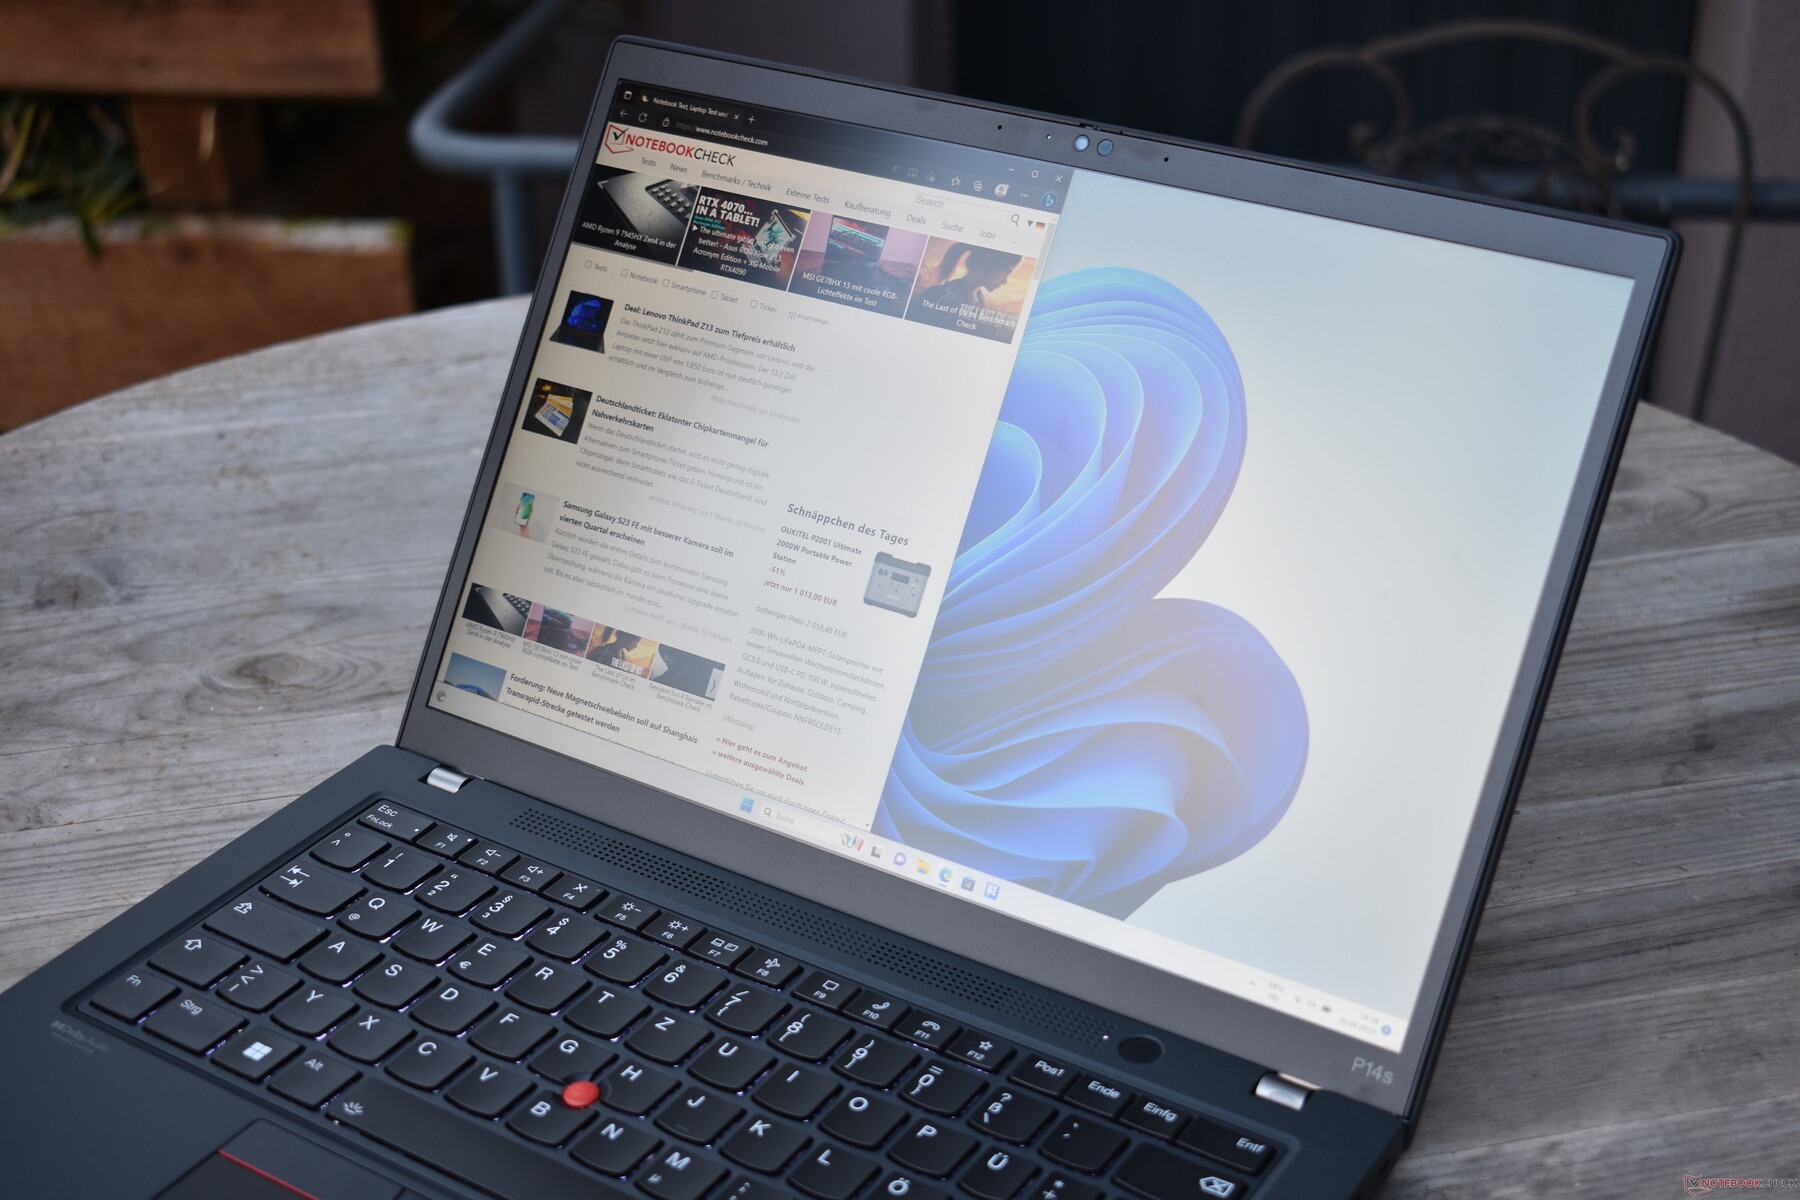
O laptop ThinkPad teve um desempenho aceitável no uso externo, o que poderia ser atribuído à combinação de um bom brilho de tela e sua superfície fosca (chamada de anti-brilho pela Lenovo).
Exibir tempos de resposta
| ↔ Tempo de resposta preto para branco | ||
|---|---|---|
| 24.9 ms ... ascensão ↗ e queda ↘ combinadas | ↗ 11.6 ms ascensão | 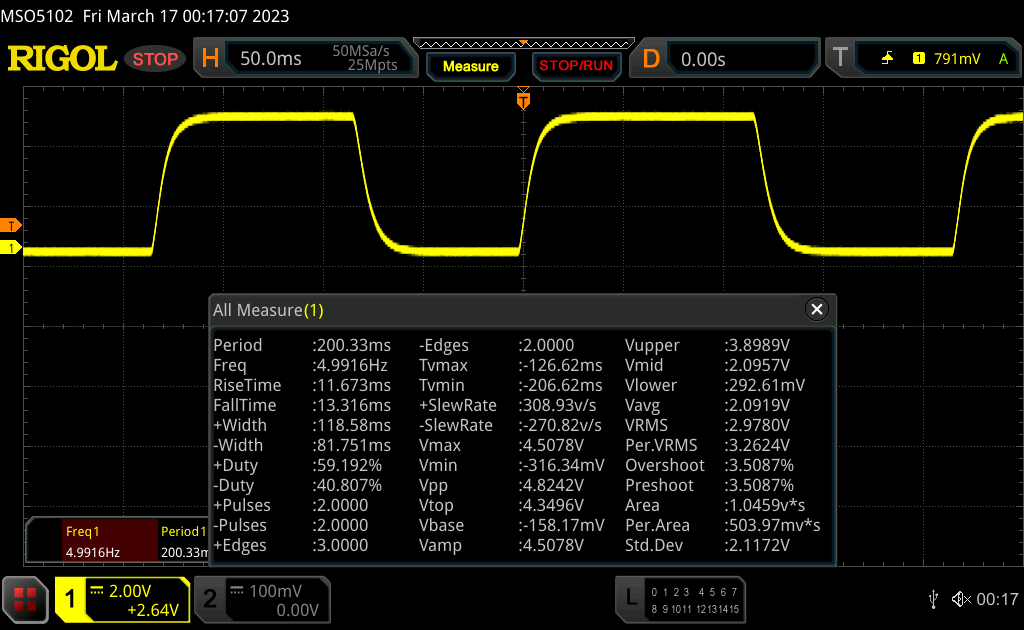 |
| ↘ 13.3 ms queda | ||
| A tela mostra boas taxas de resposta em nossos testes, mas pode ser muito lenta para jogadores competitivos. Em comparação, todos os dispositivos testados variam de 0.1 (mínimo) a 240 (máximo) ms. » 59 % de todos os dispositivos são melhores. Isso significa que o tempo de resposta medido é pior que a média de todos os dispositivos testados (19.8 ms). | ||
| ↔ Tempo de resposta 50% cinza a 80% cinza | ||
| 33.5 ms ... ascensão ↗ e queda ↘ combinadas | ↗ 14.9 ms ascensão | 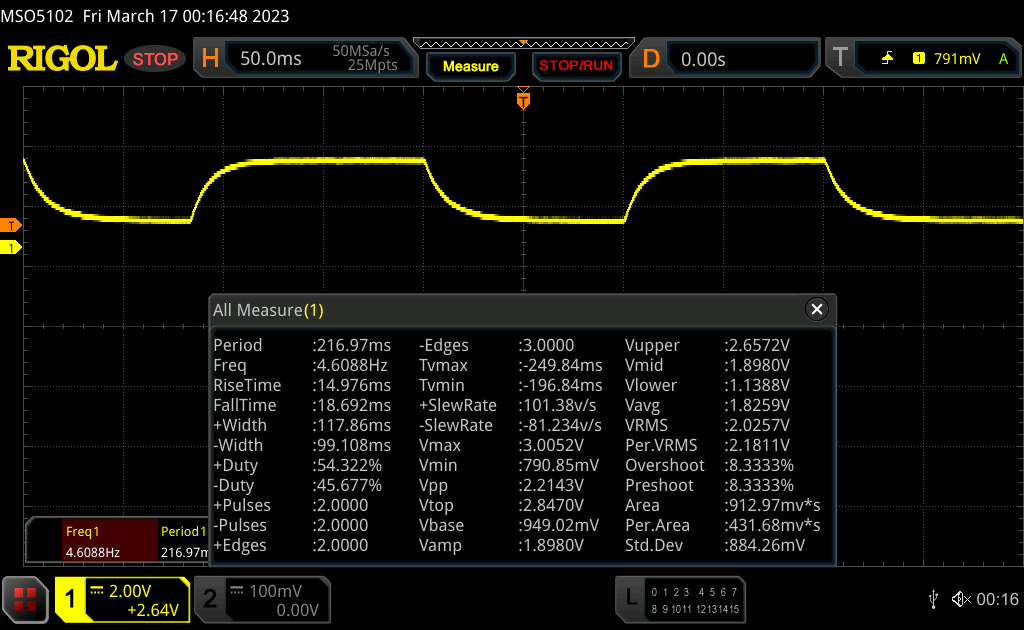 |
| ↘ 18.6 ms queda | ||
| A tela mostra taxas de resposta lentas em nossos testes e será insatisfatória para os jogadores. Em comparação, todos os dispositivos testados variam de 0.165 (mínimo) a 636 (máximo) ms. » 46 % de todos os dispositivos são melhores. Isso significa que o tempo de resposta medido é semelhante à média de todos os dispositivos testados (31 ms). | ||
Cintilação da tela / PWM (modulação por largura de pulso)
| Tela tremeluzindo / PWM não detectado | 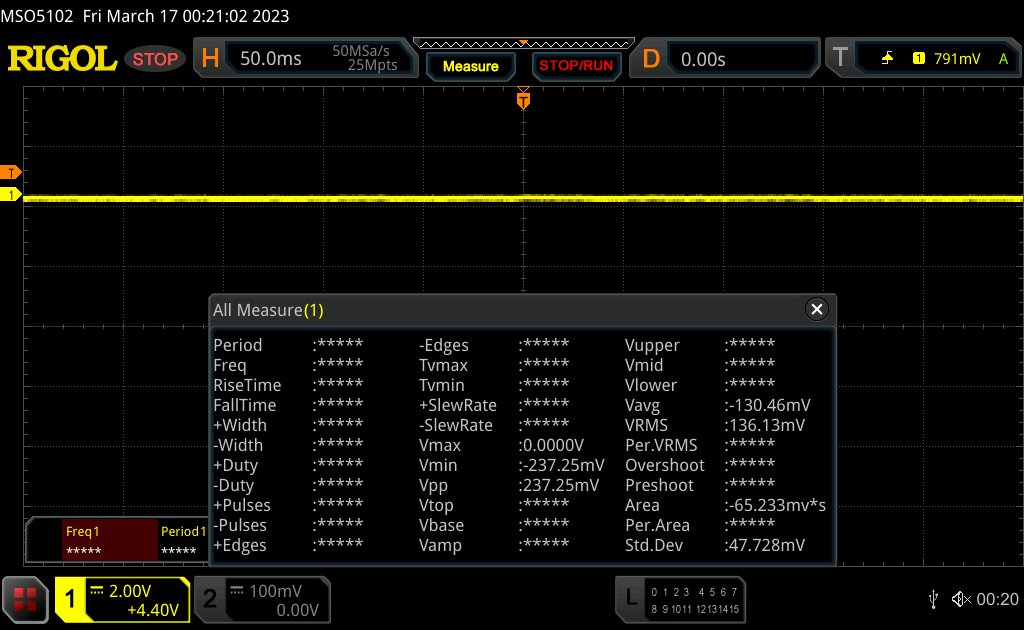 | ||
[pwm_comparison] Em comparação: 52 % de todos os dispositivos testados não usam PWM para escurecer a tela. Se PWM foi detectado, uma média de 7757 (mínimo: 5 - máximo: 343500) Hz foi medida. | |||
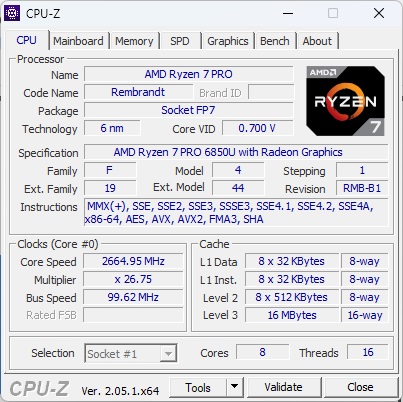
Desempenho: AMD Ryzen 6000U com ótimo desempenho
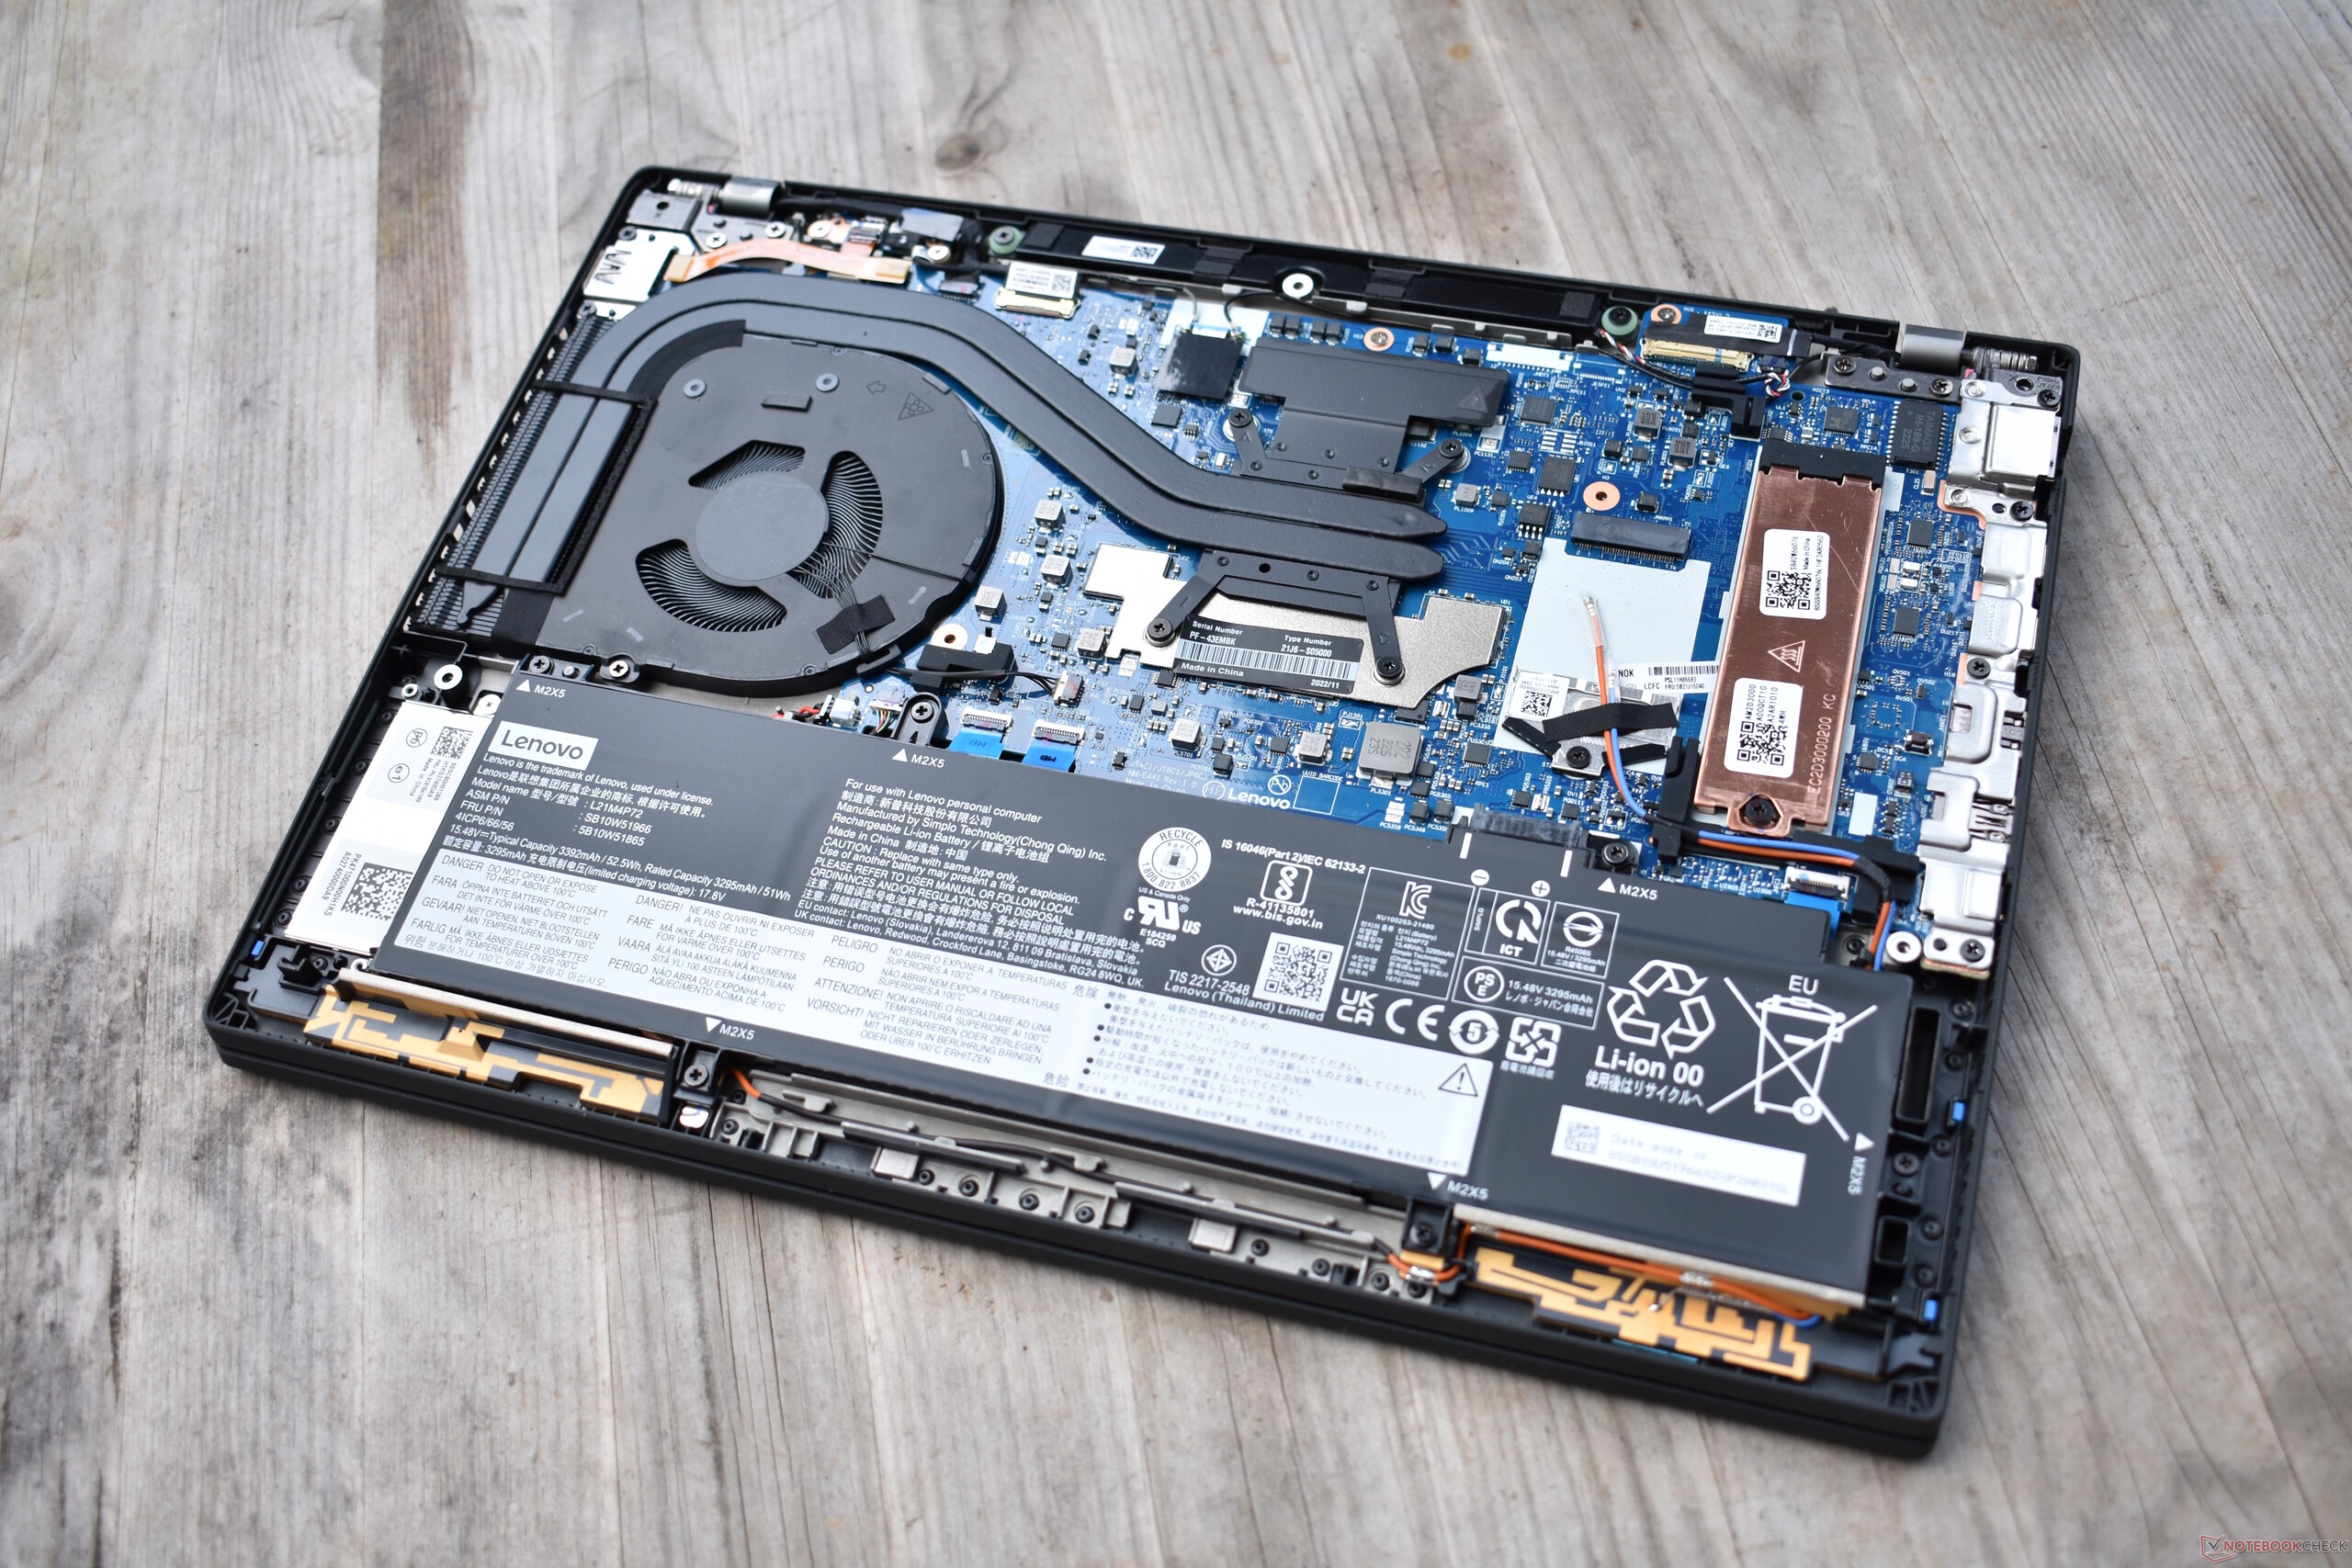
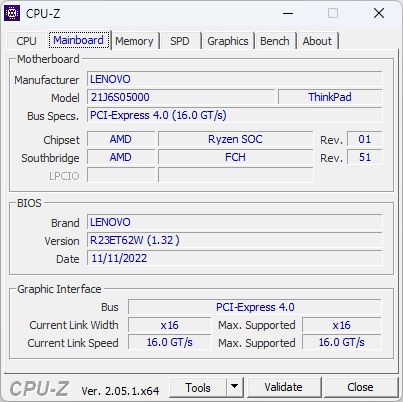
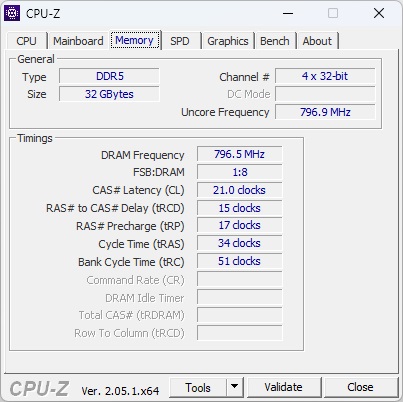
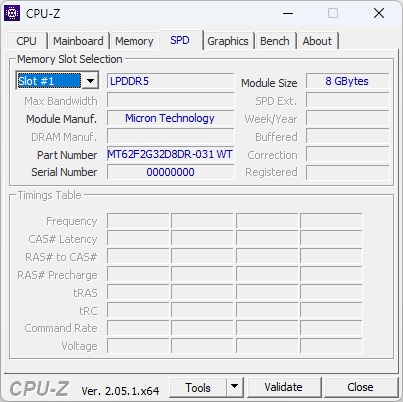
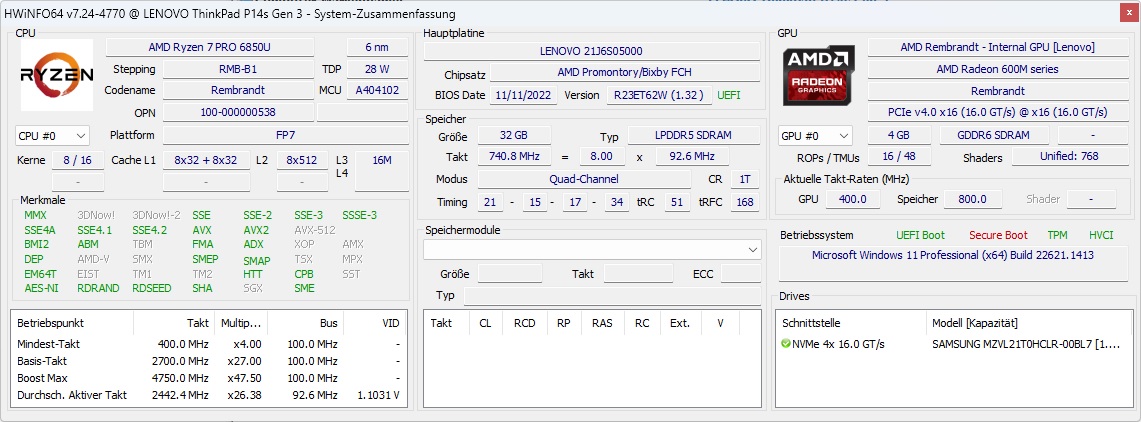
O Lenovo ThinkPad P14s Gen 3 vem em múltiplas configurações diferentes. Todos eles usam as CPUs Ryzen da AMD, com o Ryzen 5 Pro 6650U eRyzen 7 Pro 6850U estar disponível para escolher. O Ryzen 5 apresenta o AMD Radeon 660Me o Ryzen 7 tem o mais poderoso Radeon 680M. A RAM é geralmente soldada na versão AMD do P14s, com a Lenovo oferecendo 16 ou 32 GB de LPDDR5-6400. Um único SSD M.2-2280 atua como seu armazenamento; ex-works, a Lenovo instala um máximo de 2 TB.
Condições de teste
Em seus laptops ThinkPad, a Lenovo entrelaçou seus perfis energéticos internos com o controle de energia do Windows. Assim, três perfis diferentes que afetam o desempenho podem ser selecionados no aplicativo de configurações do Windows:
- A melhor economia de energia: 30 watts (limite de potência de curto prazo) / 25 watts (limite de potência de longo prazo).
- Equilibrado: 36 watts (limite de potência de curto prazo) / 31 watts (limite de potência de longo prazo)
- Melhor potência: 40 watts (limite de potência a curto prazo) / 31 watts (limite de potência a longo prazo)
Processador
OAMD Ryzen 7 Pro 6850U é o processador "U" mais rápido da série Ryzen 6000 (além do 6860Zque está disponível apenas no site ThinkPad Z13). Como U-CPU, ele é otimizado para um consumo de 15 a 25 watts. Seus oito núcleos com 16 fios operam em 2,7 a 4,7 GHz. Você pode dar uma olhada em nosso Lista de referência de CPU para comparações mais amplas com outros processadores.
Em comparação com o ThinkPad T14 G3 com a mesma CPU, seus limites de potência são um pouco mais altos. Isto poderia ser observado no loop multicore Cinebench R15, por exemplo, onde o ThinkPad P14s teve melhor pontuação que o T14. Entretanto, a diferença não foi grande. Ao compará-lo com seus concorrentes, o desempenho de sua CPU é respeitável. O ThinkPad P14s Gen 3 é significativamente mais rápido do que oZBook Firefly 14 G9 e não muito atrás do Dell Precision 5470apesar de sua CPU H45, nominalmente mais alta. Somente em termos de desempenho de núcleo único, os modelos Intel têm uma vantagem.
A CPU também funciona com sucesso apenas com a energia da bateria.
Cinebench R15 multi continuous test
Cinebench R23: Multi Core | Single Core
Cinebench R20: CPU (Multi Core) | CPU (Single Core)
Cinebench R15: CPU Multi 64Bit | CPU Single 64Bit
Blender: v2.79 BMW27 CPU
7-Zip 18.03: 7z b 4 | 7z b 4 -mmt1
Geekbench 5.5: Multi-Core | Single-Core
HWBOT x265 Benchmark v2.2: 4k Preset
LibreOffice : 20 Documents To PDF
R Benchmark 2.5: Overall mean
| CPU Performance rating | |
| Média da turma Workstation | |
| Dell Precision 5000 5470 | |
| Lenovo ThinkPad T14 G3-21CF004NGE | |
| Média AMD Ryzen 7 PRO 6850U | |
| HP ZBook Firefly 14 G9-6B8A2EA | |
| Lenovo ThinkPad P14s G3 AMD 21J6S05000 | |
| Lenovo ThinkPad P14s Gen2-20VX000GGE | |
| Cinebench R23 / Multi Core | |
| Média da turma Workstation (14621 - 38520, n=23, últimos 2 anos) | |
| Dell Precision 5000 5470 | |
| Lenovo ThinkPad P14s G3 AMD 21J6S05000 | |
| Média AMD Ryzen 7 PRO 6850U (9923 - 12945, n=7) | |
| Lenovo ThinkPad T14 G3-21CF004NGE | |
| HP ZBook Firefly 14 G9-6B8A2EA | |
| Lenovo ThinkPad P14s Gen2-20VX000GGE | |
| Cinebench R23 / Single Core | |
| Média da turma Workstation (1712 - 2228, n=23, últimos 2 anos) | |
| Dell Precision 5000 5470 | |
| HP ZBook Firefly 14 G9-6B8A2EA | |
| Lenovo ThinkPad P14s G3 AMD 21J6S05000 | |
| Média AMD Ryzen 7 PRO 6850U (1409 - 1536, n=7) | |
| Lenovo ThinkPad P14s Gen2-20VX000GGE | |
| Lenovo ThinkPad T14 G3-21CF004NGE | |
| Cinebench R20 / CPU (Multi Core) | |
| Média da turma Workstation (5760 - 15043, n=23, últimos 2 anos) | |
| Dell Precision 5000 5470 | |
| Lenovo ThinkPad P14s G3 AMD 21J6S05000 | |
| Média AMD Ryzen 7 PRO 6850U (3784 - 5022, n=7) | |
| Lenovo ThinkPad T14 G3-21CF004NGE | |
| HP ZBook Firefly 14 G9-6B8A2EA | |
| Lenovo ThinkPad P14s Gen2-20VX000GGE | |
| Cinebench R20 / CPU (Single Core) | |
| Média da turma Workstation (671 - 857, n=23, últimos 2 anos) | |
| Dell Precision 5000 5470 | |
| HP ZBook Firefly 14 G9-6B8A2EA | |
| Lenovo ThinkPad P14s G3 AMD 21J6S05000 | |
| Média AMD Ryzen 7 PRO 6850U (587 - 596, n=7) | |
| Lenovo ThinkPad T14 G3-21CF004NGE | |
| Lenovo ThinkPad P14s Gen2-20VX000GGE | |
| Cinebench R15 / CPU Multi 64Bit | |
| Média da turma Workstation (2489 - 5810, n=23, últimos 2 anos) | |
| Dell Precision 5000 5470 | |
| Lenovo ThinkPad P14s G3 AMD 21J6S05000 | |
| Média AMD Ryzen 7 PRO 6850U (1652 - 2092, n=7) | |
| Lenovo ThinkPad T14 G3-21CF004NGE | |
| HP ZBook Firefly 14 G9-6B8A2EA | |
| Lenovo ThinkPad P14s Gen2-20VX000GGE | |
| Cinebench R15 / CPU Single 64Bit | |
| Média da turma Workstation (191.4 - 328, n=23, últimos 2 anos) | |
| HP ZBook Firefly 14 G9-6B8A2EA | |
| Dell Precision 5000 5470 | |
| Lenovo ThinkPad P14s G3 AMD 21J6S05000 | |
| Lenovo ThinkPad T14 G3-21CF004NGE | |
| Média AMD Ryzen 7 PRO 6850U (228 - 244, n=7) | |
| Lenovo ThinkPad P14s Gen2-20VX000GGE | |
| Blender / v2.79 BMW27 CPU | |
| Lenovo ThinkPad P14s Gen2-20VX000GGE | |
| HP ZBook Firefly 14 G9-6B8A2EA | |
| Lenovo ThinkPad T14 G3-21CF004NGE | |
| Lenovo ThinkPad P14s G3 AMD 21J6S05000 | |
| Média AMD Ryzen 7 PRO 6850U (241 - 307, n=7) | |
| Dell Precision 5000 5470 | |
| Média da turma Workstation (91 - 222, n=23, últimos 2 anos) | |
| 7-Zip 18.03 / 7z b 4 | |
| Média da turma Workstation (60489 - 116969, n=23, últimos 2 anos) | |
| Dell Precision 5000 5470 | |
| Lenovo ThinkPad T14 G3-21CF004NGE | |
| Média AMD Ryzen 7 PRO 6850U (44011 - 59045, n=7) | |
| Lenovo ThinkPad P14s G3 AMD 21J6S05000 | |
| HP ZBook Firefly 14 G9-6B8A2EA | |
| Lenovo ThinkPad P14s Gen2-20VX000GGE | |
| 7-Zip 18.03 / 7z b 4 -mmt1 | |
| Média da turma Workstation (5126 - 6960, n=23, últimos 2 anos) | |
| HP ZBook Firefly 14 G9-6B8A2EA | |
| Lenovo ThinkPad P14s Gen2-20VX000GGE | |
| Dell Precision 5000 5470 | |
| Média AMD Ryzen 7 PRO 6850U (5057 - 5662, n=7) | |
| Lenovo ThinkPad T14 G3-21CF004NGE | |
| Lenovo ThinkPad P14s G3 AMD 21J6S05000 | |
| Geekbench 5.5 / Multi-Core | |
| Média da turma Workstation (11542 - 25554, n=23, últimos 2 anos) | |
| Dell Precision 5000 5470 | |
| HP ZBook Firefly 14 G9-6B8A2EA | |
| Lenovo ThinkPad P14s G3 AMD 21J6S05000 | |
| Média AMD Ryzen 7 PRO 6850U (7044 - 9241, n=7) | |
| Lenovo ThinkPad T14 G3-21CF004NGE | |
| Lenovo ThinkPad P14s Gen2-20VX000GGE | |
| Geekbench 5.5 / Single-Core | |
| Média da turma Workstation (1783 - 2183, n=23, últimos 2 anos) | |
| Dell Precision 5000 5470 | |
| HP ZBook Firefly 14 G9-6B8A2EA | |
| Lenovo ThinkPad P14s Gen2-20VX000GGE | |
| Lenovo ThinkPad T14 G3-21CF004NGE | |
| Lenovo ThinkPad P14s G3 AMD 21J6S05000 | |
| Média AMD Ryzen 7 PRO 6850U (1433 - 1533, n=7) | |
| HWBOT x265 Benchmark v2.2 / 4k Preset | |
| Média da turma Workstation (17.8 - 40.5, n=23, últimos 2 anos) | |
| Dell Precision 5000 5470 | |
| Lenovo ThinkPad T14 G3-21CF004NGE | |
| Lenovo ThinkPad P14s G3 AMD 21J6S05000 | |
| Média AMD Ryzen 7 PRO 6850U (11.7 - 16.3, n=7) | |
| HP ZBook Firefly 14 G9-6B8A2EA | |
| Lenovo ThinkPad P14s Gen2-20VX000GGE | |
| LibreOffice / 20 Documents To PDF | |
| Lenovo ThinkPad P14s G3 AMD 21J6S05000 | |
| Média AMD Ryzen 7 PRO 6850U (46.3 - 74, n=7) | |
| Lenovo ThinkPad T14 G3-21CF004NGE | |
| Média da turma Workstation (37.1 - 74.7, n=23, últimos 2 anos) | |
| Dell Precision 5000 5470 | |
| HP ZBook Firefly 14 G9-6B8A2EA | |
| Lenovo ThinkPad P14s Gen2-20VX000GGE | |
| R Benchmark 2.5 / Overall mean | |
| Lenovo ThinkPad P14s Gen2-20VX000GGE | |
| Lenovo ThinkPad P14s G3 AMD 21J6S05000 | |
| Lenovo ThinkPad T14 G3-21CF004NGE | |
| Média AMD Ryzen 7 PRO 6850U (0.4932 - 0.544, n=7) | |
| HP ZBook Firefly 14 G9-6B8A2EA | |
| Dell Precision 5000 5470 | |
| Média da turma Workstation (0.3825 - 0.603, n=23, últimos 2 anos) | |
* ... menor é melhor
AIDA64: FP32 Ray-Trace | FPU Julia | CPU SHA3 | CPU Queen | FPU SinJulia | FPU Mandel | CPU AES | CPU ZLib | FP64 Ray-Trace | CPU PhotoWorxx
| Performance rating | |
| Média da turma Workstation | |
| Média AMD Ryzen 7 PRO 6850U | |
| Lenovo ThinkPad P14s G3 AMD 21J6S05000 | |
| Dell Precision 5000 5470 | |
| Lenovo ThinkPad T14 G3-21CF004NGE | |
| HP ZBook Firefly 14 G9-6B8A2EA | |
| AIDA64 / FP32 Ray-Trace | |
| Média da turma Workstation (16730 - 61611, n=23, últimos 2 anos) | |
| Dell Precision 5000 5470 | |
| Média AMD Ryzen 7 PRO 6850U (11272 - 14704, n=8) | |
| Lenovo ThinkPad P14s G3 AMD 21J6S05000 | |
| Lenovo ThinkPad T14 G3-21CF004NGE | |
| HP ZBook Firefly 14 G9-6B8A2EA | |
| AIDA64 / FPU Julia | |
| Média da turma Workstation (89597 - 186971, n=23, últimos 2 anos) | |
| Média AMD Ryzen 7 PRO 6850U (72242 - 92957, n=8) | |
| Lenovo ThinkPad P14s G3 AMD 21J6S05000 | |
| Lenovo ThinkPad T14 G3-21CF004NGE | |
| Dell Precision 5000 5470 | |
| HP ZBook Firefly 14 G9-6B8A2EA | |
| AIDA64 / CPU SHA3 | |
| Média da turma Workstation (4178 - 8975, n=23, últimos 2 anos) | |
| Dell Precision 5000 5470 | |
| Média AMD Ryzen 7 PRO 6850U (2419 - 3104, n=8) | |
| Lenovo ThinkPad P14s G3 AMD 21J6S05000 | |
| Lenovo ThinkPad T14 G3-21CF004NGE | |
| HP ZBook Firefly 14 G9-6B8A2EA | |
| AIDA64 / CPU Queen | |
| Dell Precision 5000 5470 | |
| Média da turma Workstation (60778 - 144411, n=23, últimos 2 anos) | |
| Lenovo ThinkPad P14s G3 AMD 21J6S05000 | |
| Média AMD Ryzen 7 PRO 6850U (86644 - 96912, n=7) | |
| Lenovo ThinkPad T14 G3-21CF004NGE | |
| HP ZBook Firefly 14 G9-6B8A2EA | |
| AIDA64 / FPU SinJulia | |
| Média da turma Workstation (8165 - 29343, n=23, últimos 2 anos) | |
| Lenovo ThinkPad P14s G3 AMD 21J6S05000 | |
| Média AMD Ryzen 7 PRO 6850U (10917 - 12571, n=8) | |
| Lenovo ThinkPad T14 G3-21CF004NGE | |
| Dell Precision 5000 5470 | |
| HP ZBook Firefly 14 G9-6B8A2EA | |
| AIDA64 / FPU Mandel | |
| Média da turma Workstation (44497 - 98153, n=23, últimos 2 anos) | |
| Média AMD Ryzen 7 PRO 6850U (39609 - 51296, n=8) | |
| Lenovo ThinkPad P14s G3 AMD 21J6S05000 | |
| Lenovo ThinkPad T14 G3-21CF004NGE | |
| Dell Precision 5000 5470 | |
| HP ZBook Firefly 14 G9-6B8A2EA | |
| AIDA64 / CPU AES | |
| Média da turma Workstation (73133 - 187841, n=23, últimos 2 anos) | |
| Média AMD Ryzen 7 PRO 6850U (45568 - 60867, n=8) | |
| Lenovo ThinkPad T14 G3-21CF004NGE | |
| Lenovo ThinkPad P14s G3 AMD 21J6S05000 | |
| HP ZBook Firefly 14 G9-6B8A2EA | |
| Dell Precision 5000 5470 | |
| AIDA64 / CPU ZLib | |
| Média da turma Workstation (929 - 2148, n=23, últimos 2 anos) | |
| Lenovo ThinkPad P14s G3 AMD 21J6S05000 | |
| Média AMD Ryzen 7 PRO 6850U (641 - 805, n=8) | |
| Lenovo ThinkPad T14 G3-21CF004NGE | |
| HP ZBook Firefly 14 G9-6B8A2EA | |
| Dell Precision 5000 5470 | |
| AIDA64 / FP64 Ray-Trace | |
| Média da turma Workstation (8545 - 32891, n=23, últimos 2 anos) | |
| Dell Precision 5000 5470 | |
| Média AMD Ryzen 7 PRO 6850U (5967 - 7821, n=8) | |
| Lenovo ThinkPad P14s G3 AMD 21J6S05000 | |
| Lenovo ThinkPad T14 G3-21CF004NGE | |
| HP ZBook Firefly 14 G9-6B8A2EA | |
| AIDA64 / CPU PhotoWorxx | |
| Média da turma Workstation (37151 - 93684, n=23, últimos 2 anos) | |
| Dell Precision 5000 5470 | |
| HP ZBook Firefly 14 G9-6B8A2EA | |
| Média AMD Ryzen 7 PRO 6850U (19707 - 27840, n=8) | |
| Lenovo ThinkPad T14 G3-21CF004NGE | |
| Lenovo ThinkPad P14s G3 AMD 21J6S05000 | |
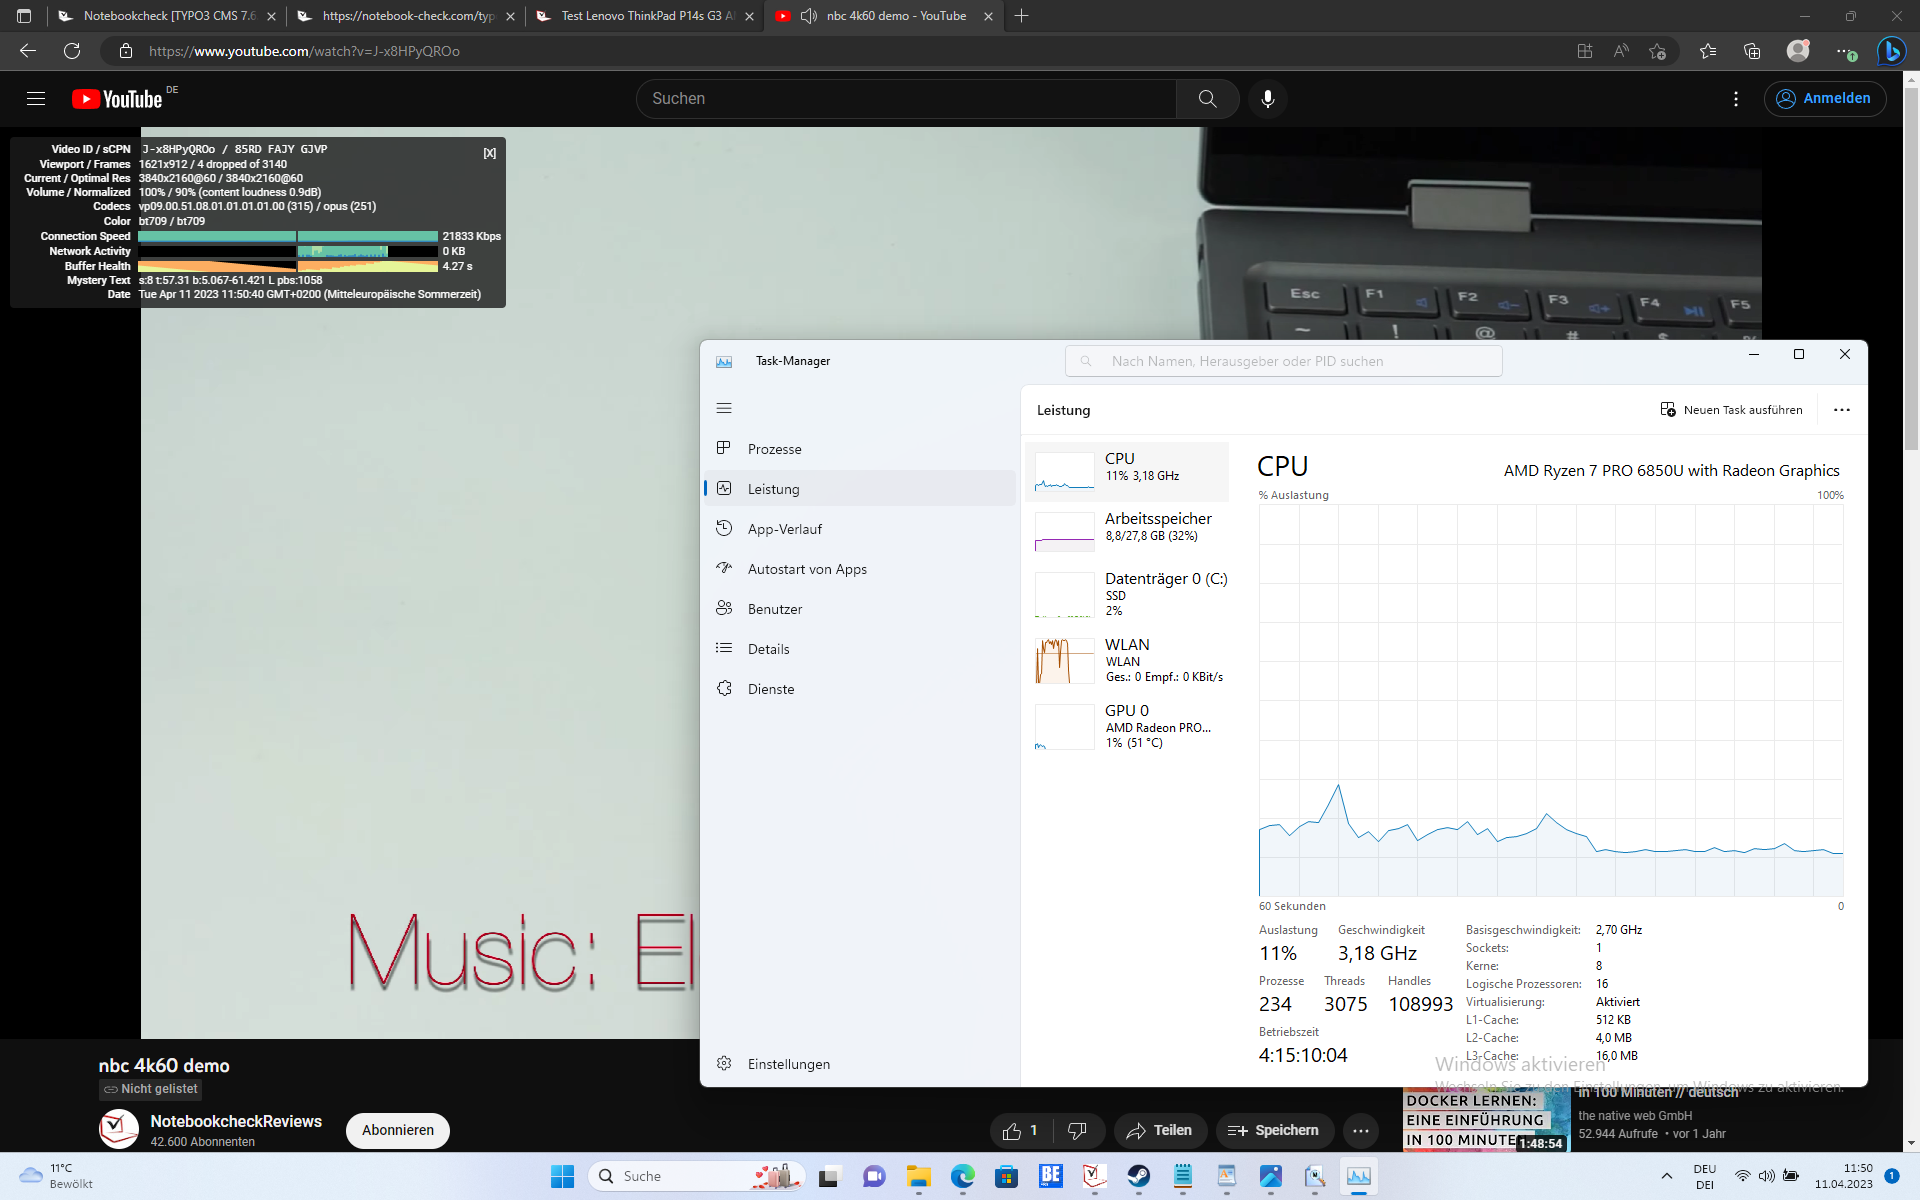
Desempenho do sistema
Seu desempenho do sistema foi ligeiramente pior que o de seus rivais diretos, mas isto não é tão perceptível no uso diário. Uma característica típica dos sistemas AMD atuais é seu desempenho de memória inferior em comparação com os modelos Intel.
CrossMark: Overall | Productivity | Creativity | Responsiveness
| PCMark 10 / Score | |
| Média da turma Workstation (6563 - 10409, n=19, últimos 2 anos) | |
| Dell Precision 5000 5470 | |
| HP ZBook Firefly 14 G9-6B8A2EA | |
| Média AMD Ryzen 7 PRO 6850U, AMD Radeon 680M (5873 - 6311, n=7) | |
| Lenovo ThinkPad T14 G3-21CF004NGE | |
| Lenovo ThinkPad P14s G3 AMD 21J6S05000 | |
| Lenovo ThinkPad P14s Gen2-20VX000GGE | |
| PCMark 10 / Essentials | |
| Dell Precision 5000 5470 | |
| Média da turma Workstation (9622 - 11157, n=19, últimos 2 anos) | |
| HP ZBook Firefly 14 G9-6B8A2EA | |
| Lenovo ThinkPad T14 G3-21CF004NGE | |
| Média AMD Ryzen 7 PRO 6850U, AMD Radeon 680M (9151 - 10263, n=7) | |
| Lenovo ThinkPad P14s Gen2-20VX000GGE | |
| Lenovo ThinkPad P14s G3 AMD 21J6S05000 | |
| PCMark 10 / Productivity | |
| Média da turma Workstation (8789 - 20616, n=19, últimos 2 anos) | |
| HP ZBook Firefly 14 G9-6B8A2EA | |
| Lenovo ThinkPad P14s Gen2-20VX000GGE | |
| Média AMD Ryzen 7 PRO 6850U, AMD Radeon 680M (8435 - 8891, n=7) | |
| Lenovo ThinkPad T14 G3-21CF004NGE | |
| Dell Precision 5000 5470 | |
| Lenovo ThinkPad P14s G3 AMD 21J6S05000 | |
| PCMark 10 / Digital Content Creation | |
| Média da turma Workstation (8108 - 15631, n=19, últimos 2 anos) | |
| Dell Precision 5000 5470 | |
| Lenovo ThinkPad P14s G3 AMD 21J6S05000 | |
| Média AMD Ryzen 7 PRO 6850U, AMD Radeon 680M (6796 - 8422, n=7) | |
| Lenovo ThinkPad T14 G3-21CF004NGE | |
| HP ZBook Firefly 14 G9-6B8A2EA | |
| Lenovo ThinkPad P14s Gen2-20VX000GGE | |
| CrossMark / Overall | |
| Média da turma Workstation (1307 - 2267, n=22, últimos 2 anos) | |
| Dell Precision 5000 5470 | |
| HP ZBook Firefly 14 G9-6B8A2EA | |
| Lenovo ThinkPad T14 G3-21CF004NGE | |
| Média AMD Ryzen 7 PRO 6850U, AMD Radeon 680M (1154 - 1442, n=7) | |
| Lenovo ThinkPad P14s G3 AMD 21J6S05000 | |
| CrossMark / Productivity | |
| Média da turma Workstation (1130 - 2122, n=22, últimos 2 anos) | |
| Dell Precision 5000 5470 | |
| HP ZBook Firefly 14 G9-6B8A2EA | |
| Lenovo ThinkPad T14 G3-21CF004NGE | |
| Média AMD Ryzen 7 PRO 6850U, AMD Radeon 680M (1188 - 1444, n=7) | |
| Lenovo ThinkPad P14s G3 AMD 21J6S05000 | |
| CrossMark / Creativity | |
| Média da turma Workstation (1657 - 2725, n=22, últimos 2 anos) | |
| Dell Precision 5000 5470 | |
| HP ZBook Firefly 14 G9-6B8A2EA | |
| Lenovo ThinkPad T14 G3-21CF004NGE | |
| Média AMD Ryzen 7 PRO 6850U, AMD Radeon 680M (1180 - 1523, n=7) | |
| Lenovo ThinkPad P14s G3 AMD 21J6S05000 | |
| CrossMark / Responsiveness | |
| Média da turma Workstation (993 - 2096, n=22, últimos 2 anos) | |
| Dell Precision 5000 5470 | |
| HP ZBook Firefly 14 G9-6B8A2EA | |
| Lenovo ThinkPad T14 G3-21CF004NGE | |
| Média AMD Ryzen 7 PRO 6850U, AMD Radeon 680M (990 - 1282, n=7) | |
| Lenovo ThinkPad P14s G3 AMD 21J6S05000 | |
| PCMark 10 Score | 5953 pontos | |
Ajuda | ||
| AIDA64 / Memory Copy | |
| Média da turma Workstation (56003 - 164795, n=23, últimos 2 anos) | |
| Dell Precision 5000 5470 | |
| HP ZBook Firefly 14 G9-6B8A2EA | |
| Lenovo ThinkPad T14 G3-21CF004NGE | |
| Lenovo ThinkPad P14s G3 AMD 21J6S05000 | |
| Média AMD Ryzen 7 PRO 6850U (31003 - 48605, n=8) | |
| AIDA64 / Memory Read | |
| Média da turma Workstation (55795 - 121563, n=23, últimos 2 anos) | |
| Dell Precision 5000 5470 | |
| HP ZBook Firefly 14 G9-6B8A2EA | |
| Média AMD Ryzen 7 PRO 6850U (34682 - 45912, n=8) | |
| Lenovo ThinkPad T14 G3-21CF004NGE | |
| Lenovo ThinkPad P14s G3 AMD 21J6S05000 | |
| AIDA64 / Memory Write | |
| Média da turma Workstation (55663 - 214520, n=23, últimos 2 anos) | |
| HP ZBook Firefly 14 G9-6B8A2EA | |
| Dell Precision 5000 5470 | |
| Lenovo ThinkPad P14s G3 AMD 21J6S05000 | |
| Lenovo ThinkPad T14 G3-21CF004NGE | |
| Média AMD Ryzen 7 PRO 6850U (34532 - 51096, n=8) | |
| AIDA64 / Memory Latency | |
| Média da turma Workstation (84.5 - 165.2, n=23, últimos 2 anos) | |
| Lenovo ThinkPad P14s G3 AMD 21J6S05000 | |
| Lenovo ThinkPad T14 G3-21CF004NGE | |
| Dell Precision 5000 5470 | |
| Média AMD Ryzen 7 PRO 6850U (86.1 - 135.3, n=8) | |
| HP ZBook Firefly 14 G9-6B8A2EA | |
* ... menor é melhor
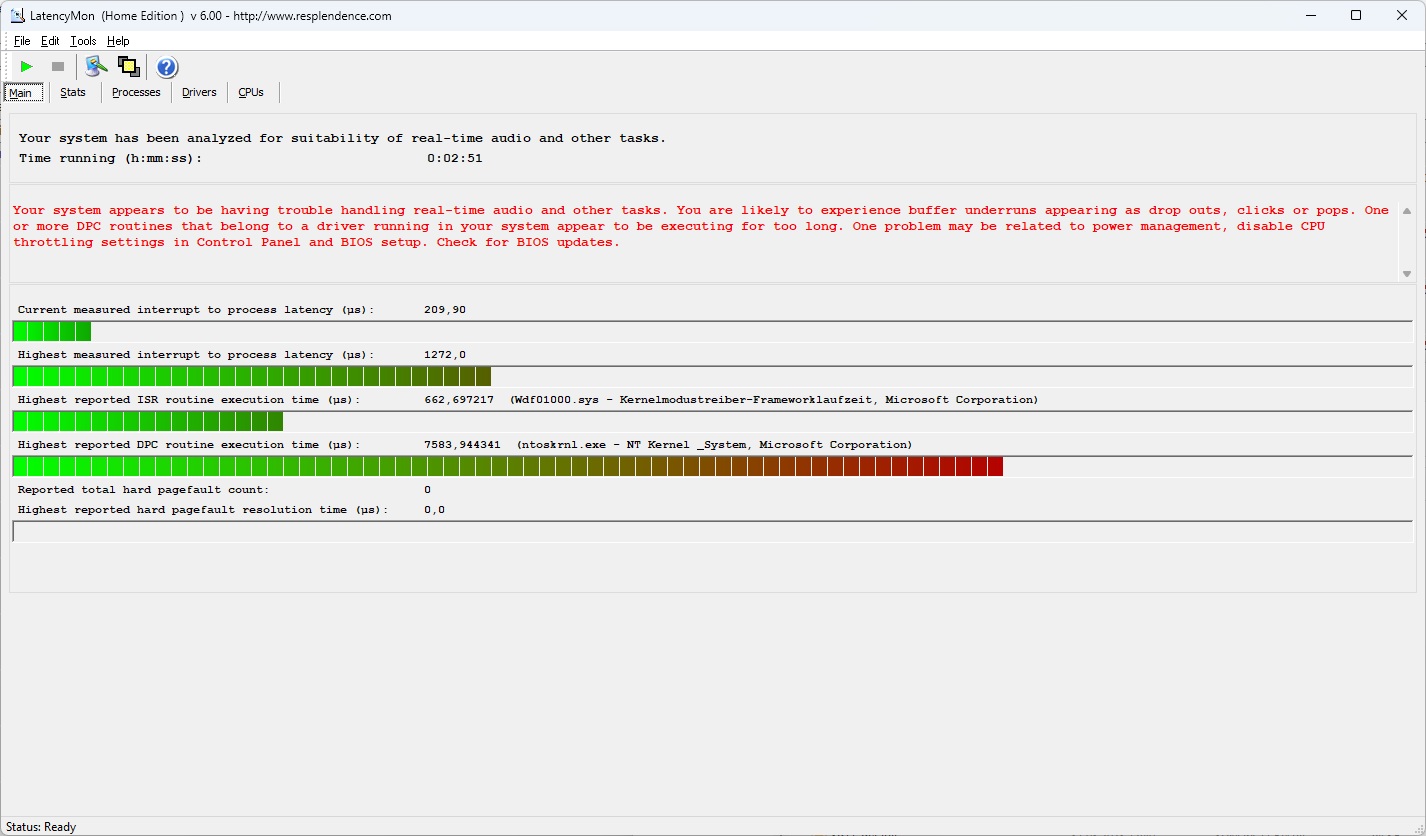
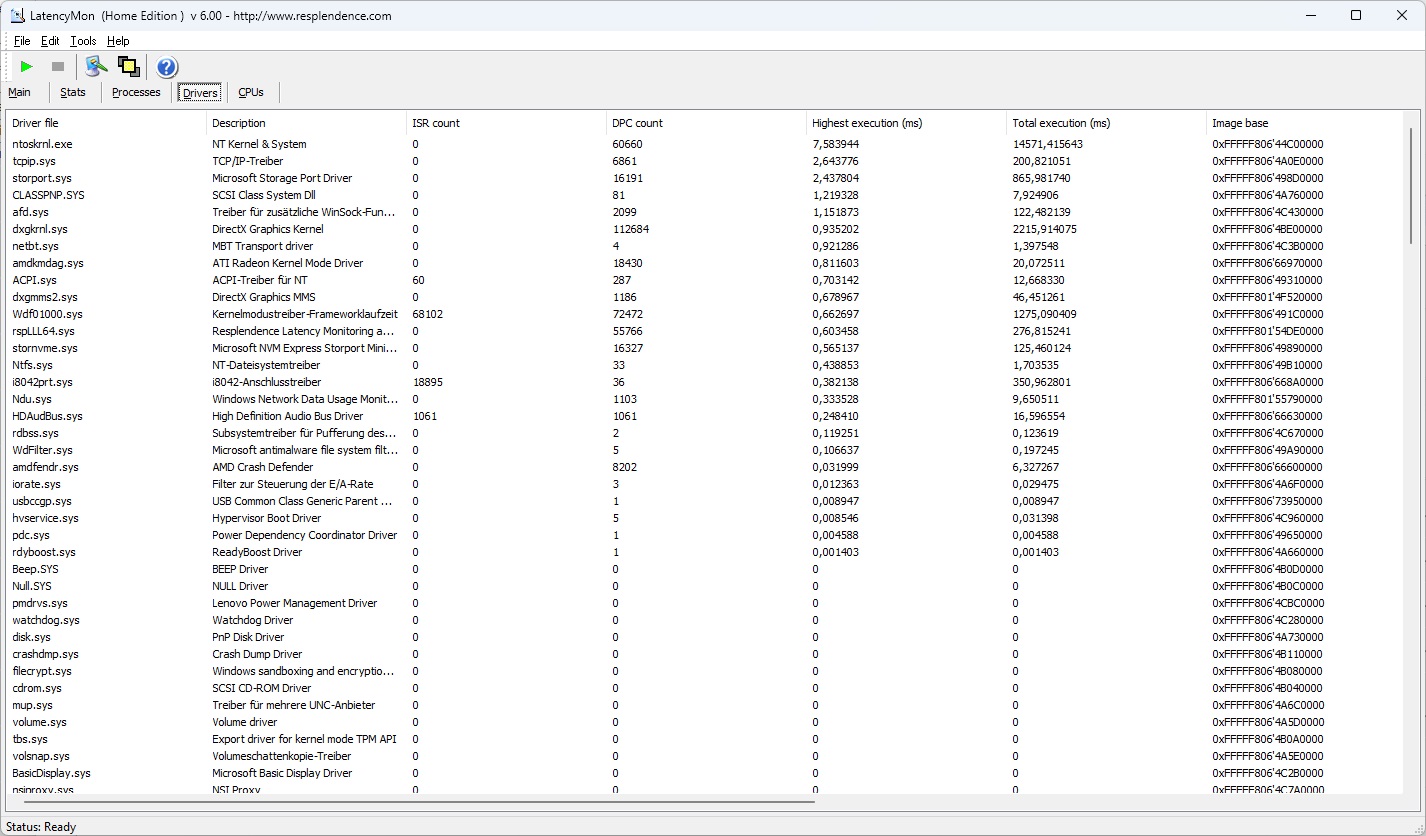
Latência do DPC
O ThinkPad P14s Gen 3 luta com as latências DPC na configuração apresentada. Isto pode ser devido a um problema de driver, e pode muito bem ser resolvido em uma futura atualização de software.
| DPC Latencies / LatencyMon - interrupt to process latency (max), Web, Youtube, Prime95 | |
| Dell Precision 5000 5470 | |
| Lenovo ThinkPad P14s G3 AMD 21J6S05000 | |
| Lenovo ThinkPad P14s Gen2-20VX000GGE | |
| HP ZBook Firefly 14 G9-6B8A2EA | |
| Lenovo ThinkPad T14 G3-21CF004NGE | |
* ... menor é melhor
Dispositivos de armazenamento
O Samsung PM9A1 no Lenovo ThinkPad P14s G3 oferece alto desempenho - típico para um SSD PCIe 4.0. O SSD M.2-2280 de um só lado também funciona muito rápido sob carga contínua e sem estrangulamento.

* ... menor é melhor
Reading continuous performance: DiskSpd Read Loop, Queue Depth 8
Placa gráfica
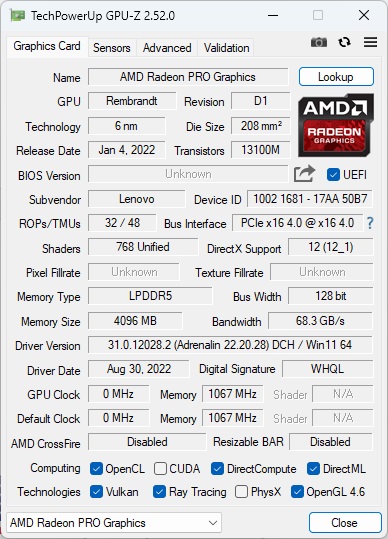
Uma marca registrada das estações de trabalho móveis é que, ao contrário dos laptops de escritório, seus gráficos têm bom desempenho em CAD e outras tarefas de GPU intensivo. Uma GPU dedicada normalmente seria instalada para isso. Entretanto, a Lenovo decidiu não colocar uma no ThinkPad P14s Gen 3. Em vez disso, o laptop Lenovo conta exclusivamente com o AMD Radeon 680M.
O resultado é um desempenho fraco da GPU para uma estação de trabalho - muito abaixo da média. Para ser justo, porém, oNvidia T550 noZBook Firefly 14 não é realmente melhor. Somente o Nvidia RTX A1000 na DellPrecision 5470 começa a mostrar um desempenho significativamente melhor. Uma coisa deve ficar clara se você estiver pensando em comprar o P14: É um modelo de nível básico absoluto que renuncia ao desempenho da GPU em nome da mobilidade.
Para jogos, o P14s G3 é tão adequado quanto todos os outros laptops AMD atuais com um Radeon 680M: Muitos jogos funcionam de forma bastante suave em Full HD - mas com ajustes reduzidos de detalhes.
Como no caso do processador, não notamos nenhuma limitação da GPU no modo de bateria.
| 3DMark Performance rating - Percent | |
| Média da turma Workstation | |
| Dell Precision 5000 5470 | |
| Lenovo ThinkPad P14s G3 AMD 21J6S05000 | |
| Lenovo ThinkPad T14 G3-21CF004NGE | |
| Média AMD Radeon 680M | |
| HP ZBook Firefly 14 G9-6B8A2EA -1! | |
| Lenovo ThinkPad P14s Gen2-20VX000GGE | |
| 3DMark 11 - 1280x720 Performance GPU | |
| Média da turma Workstation (12535 - 69594, n=23, últimos 2 anos) | |
| Dell Precision 5000 5470 | |
| Lenovo ThinkPad P14s G3 AMD 21J6S05000 | |
| Lenovo ThinkPad T14 G3-21CF004NGE | |
| Média AMD Radeon 680M (6858 - 11755, n=39) | |
| HP ZBook Firefly 14 G9-6B8A2EA | |
| Lenovo ThinkPad P14s Gen2-20VX000GGE | |
| 3DMark | |
| 1280x720 Cloud Gate Standard Graphics | |
| Média da turma Workstation (58392 - 152418, n=14, últimos 2 anos) | |
| Dell Precision 5000 5470 | |
| Lenovo ThinkPad T14 G3-21CF004NGE | |
| Lenovo ThinkPad P14s G3 AMD 21J6S05000 | |
| Média AMD Radeon 680M (24634 - 50120, n=31) | |
| Lenovo ThinkPad P14s Gen2-20VX000GGE | |
| 1920x1080 Fire Strike Graphics | |
| Média da turma Workstation (8293 - 52560, n=23, últimos 2 anos) | |
| Dell Precision 5000 5470 | |
| Lenovo ThinkPad P14s G3 AMD 21J6S05000 | |
| Lenovo ThinkPad T14 G3-21CF004NGE | |
| Média AMD Radeon 680M (3791 - 7706, n=41) | |
| HP ZBook Firefly 14 G9-6B8A2EA | |
| Lenovo ThinkPad P14s Gen2-20VX000GGE | |
| 2560x1440 Time Spy Graphics | |
| Média da turma Workstation (2725 - 24806, n=23, últimos 2 anos) | |
| Dell Precision 5000 5470 | |
| Lenovo ThinkPad P14s G3 AMD 21J6S05000 | |
| Lenovo ThinkPad T14 G3-21CF004NGE | |
| HP ZBook Firefly 14 G9-6B8A2EA | |
| Média AMD Radeon 680M (1359 - 2607, n=41) | |
| Lenovo ThinkPad P14s Gen2-20VX000GGE | |
| SPECviewperf Performance rating - Percent | |
| Média da turma Workstation | |
| Dell Precision 5000 5470 | |
| HP ZBook Firefly 14 G9-6B8A2EA | |
| Lenovo ThinkPad P14s G3 AMD 21J6S05000 | |
| Média AMD Radeon 680M | |
| Lenovo ThinkPad T14 G3-21CF004NGE | |
| Lenovo ThinkPad P14s Gen2-20VX000GGE -1! | |
| 3DMark 11 Performance | 10377 pontos | |
| 3DMark Cloud Gate Standard Score | 30226 pontos | |
| 3DMark Fire Strike Score | 6722 pontos | |
| 3DMark Time Spy Score | 2724 pontos | |
Ajuda | ||
| Blender | |
| v3.3 Classroom HIP/AMD | |
| Média AMD Radeon 680M (270 - 555, n=34) | |
| Lenovo ThinkPad T14 G3-21CF004NGE | |
| Lenovo ThinkPad P14s G3 AMD 21J6S05000 | |
| Lenovo ThinkPad P14s G3 AMD 21J6S05000 | |
| v3.3 Classroom OPTIX/RTX | |
| HP ZBook Firefly 14 G9-6B8A2EA | |
| Dell Precision 5000 5470 | |
| Média da turma Workstation (10 - 43, n=17, últimos 2 anos) | |
| v3.3 Classroom CUDA | |
| HP ZBook Firefly 14 G9-6B8A2EA | |
| Dell Precision 5000 5470 | |
| Média da turma Workstation (16 - 74, n=17, últimos 2 anos) | |
| v3.3 Classroom CPU | |
| HP ZBook Firefly 14 G9-6B8A2EA | |
| Lenovo ThinkPad T14 G3-21CF004NGE | |
| Média AMD Radeon 680M (389 - 980, n=37) | |
| Lenovo ThinkPad P14s G3 AMD 21J6S05000 | |
| Dell Precision 5000 5470 | |
| Média da turma Workstation (148 - 364, n=23, últimos 2 anos) | |
* ... menor é melhor
| Performance rating - Percent | |
| Média da turma Workstation | |
| Dell Precision 5000 5470 | |
| HP ZBook Firefly 14 G9-6B8A2EA | |
| Lenovo ThinkPad T14 G3-21CF004NGE | |
| Lenovo ThinkPad P14s G3 AMD 21J6S05000 | |
| Lenovo ThinkPad P14s Gen2-20VX000GGE | |
| The Witcher 3 - 1920x1080 Ultra Graphics & Postprocessing (HBAO+) | |
| Média da turma Workstation (n=1últimos 2 anos) | |
| Dell Precision 5000 5470 | |
| Lenovo ThinkPad P14s G3 AMD 21J6S05000 | |
| Lenovo ThinkPad T14 G3-21CF004NGE | |
| HP ZBook Firefly 14 G9-6B8A2EA | |
| Lenovo ThinkPad P14s Gen2-20VX000GGE | |
| GTA V - 1920x1080 Highest AA:4xMSAA + FX AF:16x | |
| Média da turma Workstation (18.1 - 156.1, n=23, últimos 2 anos) | |
| Dell Precision 5000 5470 | |
| HP ZBook Firefly 14 G9-6B8A2EA | |
| Lenovo ThinkPad P14s G3 AMD 21J6S05000 | |
| Lenovo ThinkPad T14 G3-21CF004NGE | |
| Lenovo ThinkPad P14s Gen2-20VX000GGE | |
| Final Fantasy XV Benchmark - 1920x1080 High Quality | |
| Média da turma Workstation (26.4 - 197.6, n=23, últimos 2 anos) | |
| Dell Precision 5000 5470 | |
| Lenovo ThinkPad P14s G3 AMD 21J6S05000 | |
| Lenovo ThinkPad T14 G3-21CF004NGE | |
| HP ZBook Firefly 14 G9-6B8A2EA | |
| Lenovo ThinkPad P14s Gen2-20VX000GGE | |
| Strange Brigade - 1920x1080 ultra AA:ultra AF:16 | |
| Média da turma Workstation (93.2 - 418, n=17, últimos 2 anos) | |
| Dell Precision 5000 5470 | |
| Lenovo ThinkPad T14 G3-21CF004NGE | |
| HP ZBook Firefly 14 G9-6B8A2EA | |
| Lenovo ThinkPad P14s G3 AMD 21J6S05000 | |
| Lenovo ThinkPad P14s Gen2-20VX000GGE | |
| Dota 2 Reborn - 1920x1080 ultra (3/3) best looking | |
| Dell Precision 5000 5470 | |
| Média da turma Workstation (50.7 - 178.4, n=23, últimos 2 anos) | |
| HP ZBook Firefly 14 G9-6B8A2EA | |
| Lenovo ThinkPad P14s Gen2-20VX000GGE | |
| Lenovo ThinkPad T14 G3-21CF004NGE | |
| Lenovo ThinkPad P14s G3 AMD 21J6S05000 | |
| X-Plane 11.11 - 1920x1080 high (fps_test=3) | |
| Média da turma Workstation (30.5 - 139.7, n=23, últimos 2 anos) | |
| Dell Precision 5000 5470 | |
| HP ZBook Firefly 14 G9-6B8A2EA | |
| Lenovo ThinkPad P14s Gen2-20VX000GGE | |
| Lenovo ThinkPad T14 G3-21CF004NGE | |
| Lenovo ThinkPad P14s G3 AMD 21J6S05000 | |
Witcher 3 fps diagram
| baixo | média | alto | ultra | |
|---|---|---|---|---|
| GTA V (2015) | 123.2 | 110.2 | 47.6 | 23.8 |
| The Witcher 3 (2015) | 111.1 | 42.6 | 26.8 | |
| Dota 2 Reborn (2015) | 90.2 | 84.7 | 67.4 | 57.8 |
| Final Fantasy XV Benchmark (2018) | 61.3 | 36.1 | 25.4 | |
| X-Plane 11.11 (2018) | 52 | 39.3 | 31.9 | |
| Far Cry 5 (2018) | 60 | 38 | 35 | 33 |
| Strange Brigade (2018) | 106.8 | 49.1 | 39.9 | 34.1 |
| F1 22 (2022) | 53.1 | 49.1 | 35.4 | 8.32 |
Emissões: Um pouco mais alto do que o ThinkPad T14 G3 AMD
Emissões sonoras
Em comparação com o ThinkPad T14 Gen 3, o ThinkPad P14s Gen 3 teve a tendência de ficar um pouco mais alto - especialmente no Witcher 3 teste. Embora, seus níveis máximos de ruído fossem comparáveis. Seus concorrentes Dell e HP possuem sistemas de resfriamento ativo muito mais alto.
Não pudemos notar nenhuma lamúria de bobina no P14s G3 - entretanto, observamos uma espécie de crepitação silenciosa, que provavelmente era apenas o SSD.
Barulho
| Ocioso |
| 22.9 / 22.9 / 22.9 dB |
| Carga |
| 30.8 / 39.5 dB |
 | ||
30 dB silencioso 40 dB(A) audível 50 dB(A) ruidosamente alto |
||
min: | ||
| Lenovo ThinkPad P14s G3 AMD 21J6S05000 Radeon 680M, R7 PRO 6850U, Samsung PM9A1 MZVL21T0HCLR | Lenovo ThinkPad P14s Gen2-20VX000GGE T500 Laptop GPU, i7-1185G7, Toshiba XG6 KXG6AZNV1T02 | Lenovo ThinkPad T14 G3-21CF004NGE Radeon 680M, R7 PRO 6850U, Kioxia BG5 KBG5AZNV512G | Dell Precision 5000 5470 RTX A1000 Laptop GPU, i9-12900H, Samsung PM9A1 MZVL21T0HCLR | HP ZBook Firefly 14 G9-6B8A2EA T550 Laptop GPU, i7-1265U, Micron 3400 1TB MTFDKBA1T0TFH | |
|---|---|---|---|---|---|
| Noise | -9% | -3% | -16% | -9% | |
| desligado / ambiente * (dB) | 22.9 | 24.6 -7% | 24.2 -6% | 23 -0% | 23.6 -3% |
| Idle Minimum * (dB) | 22.9 | 24.6 -7% | 24.2 -6% | 23.3 -2% | 23.6 -3% |
| Idle Average * (dB) | 22.9 | 24.6 -7% | 24.2 -6% | 23.3 -2% | 23.6 -3% |
| Idle Maximum * (dB) | 22.9 | 24.6 -7% | 25.8 -13% | 23.3 -2% | 23.6 -3% |
| Load Average * (dB) | 30.8 | 38.9 -26% | 32.2 -5% | 48.5 -57% | 42.5 -38% |
| Witcher 3 ultra * (dB) | 39.4 | 34.1 13% | 48.6 -23% | 42.5 -8% | |
| Load Maximum * (dB) | 39.5 | 38.9 2% | 38.8 2% | 50.4 -28% | 42.5 -8% |
* ... menor é melhor
Temperatura
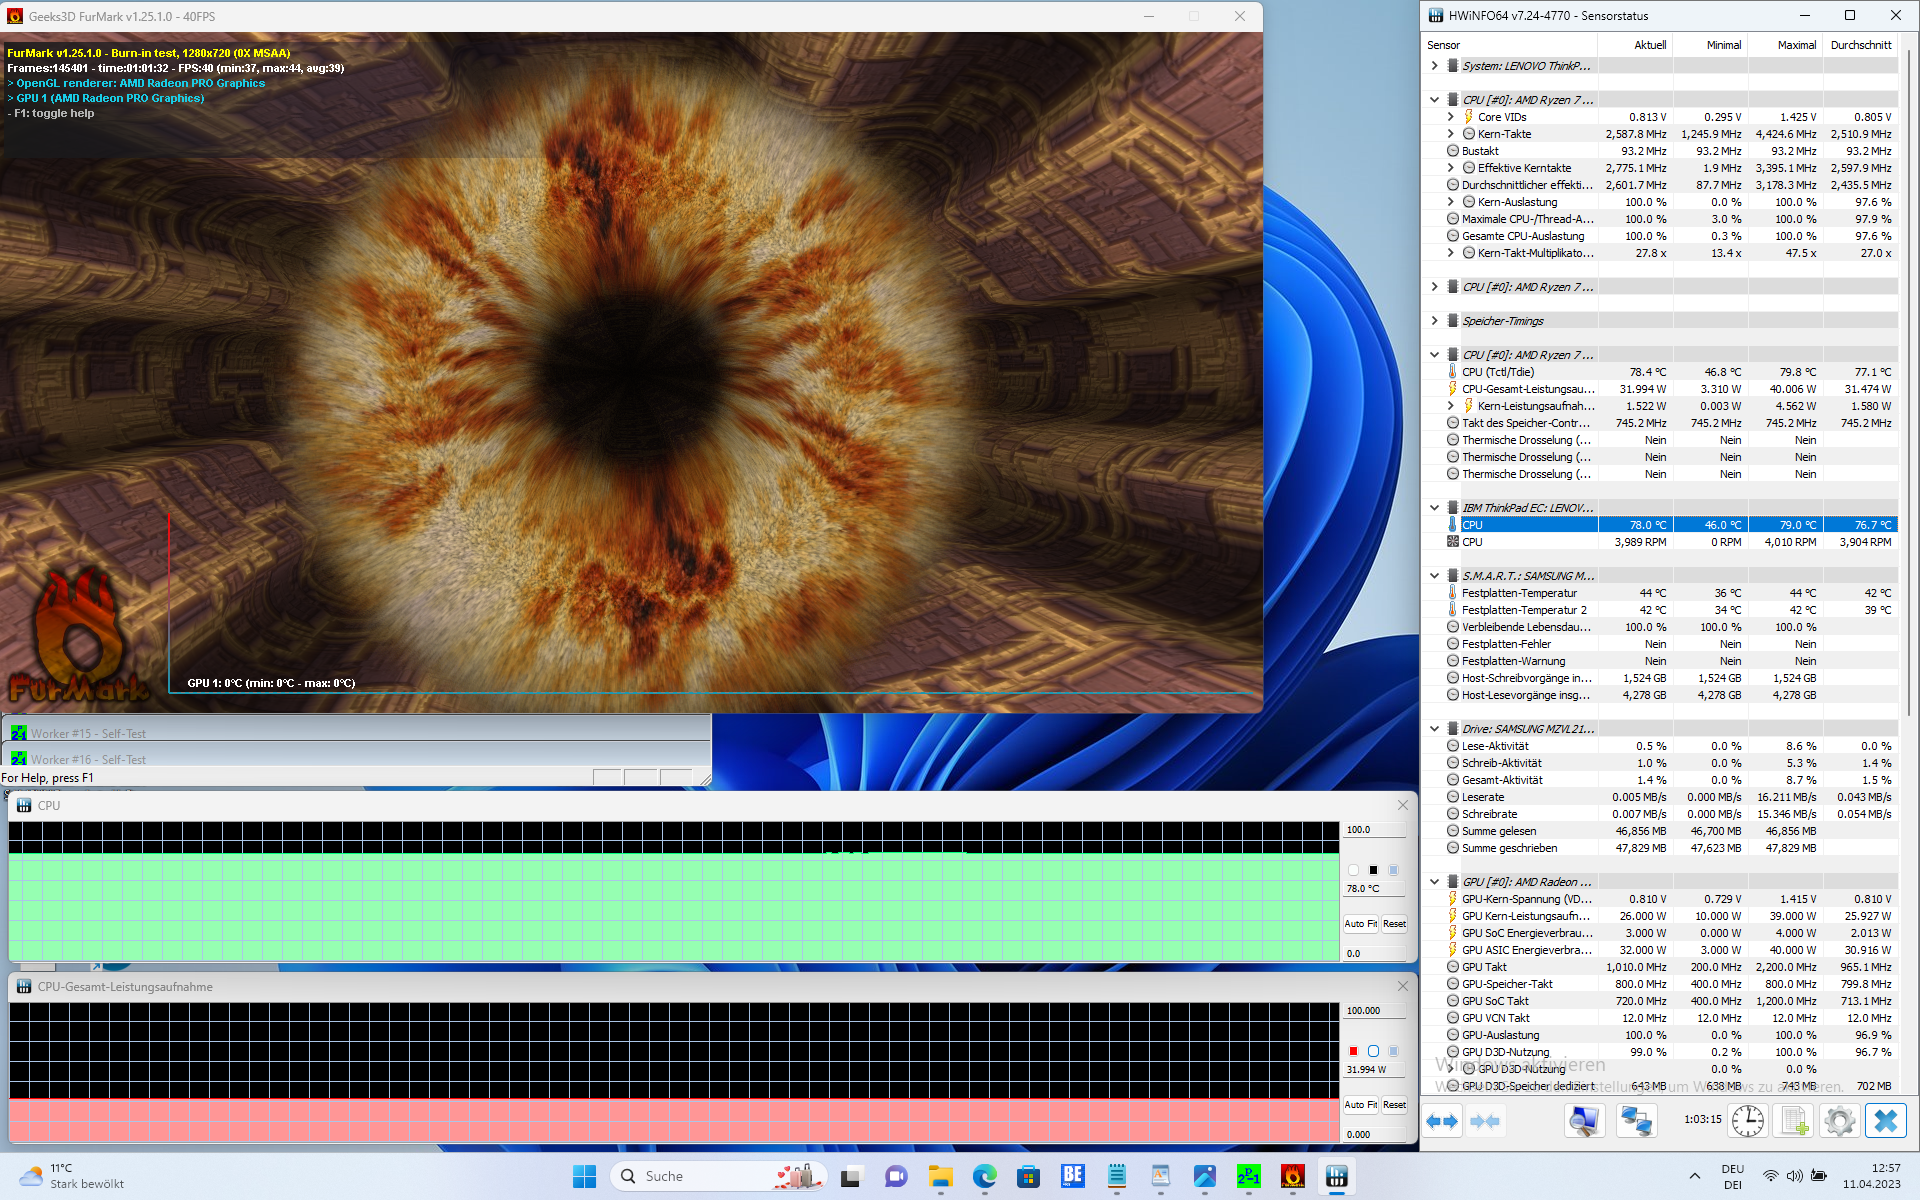
O P14s G3 AMD é um laptop comparativamente legal. O predecessor do P14s Gen 2, baseado na Intel, em particular, funcionava muito mais quente. Medimos um máximo de 43,1 graus Celsius no P14s, que também está abaixo da temperatura máxima do T14 Gen 3 AMD - presumivelmente por causa de seu ventilador um pouco mais ativo.
Não houve absolutamente nenhum estrangulamento no teste de estresse, seu processador foi capaz de manter seu desempenho estável.
(±) A temperatura máxima no lado superior é 42.7 °C / 109 F, em comparação com a média de 38.2 °C / 101 F , variando de 22.2 a 69.8 °C para a classe Workstation.
(±) A parte inferior aquece até um máximo de 43.1 °C / 110 F, em comparação com a média de 41.1 °C / 106 F
(+) Em uso inativo, a temperatura média para o lado superior é 24.6 °C / 76 F, em comparação com a média do dispositivo de 32 °C / ### class_avg_f### F.
(±) Jogando The Witcher 3, a temperatura média para o lado superior é 32.3 °C / 90 F, em comparação com a média do dispositivo de 32 °C / ## #class_avg_f### F.
(+) Os apoios para as mãos e o touchpad são mais frios que a temperatura da pele, com um máximo de 26.8 °C / 80.2 F e, portanto, são frios ao toque.
(±) A temperatura média da área do apoio para as mãos de dispositivos semelhantes foi 27.8 °C / 82 F (+1 °C / 1.8 F).
| Lenovo ThinkPad P14s G3 AMD 21J6S05000 AMD Ryzen 7 PRO 6850U, AMD Radeon 680M | Lenovo ThinkPad P14s Gen2-20VX000GGE Intel Core i7-1185G7, NVIDIA T500 Laptop GPU | Lenovo ThinkPad T14 G3-21CF004NGE AMD Ryzen 7 PRO 6850U, AMD Radeon 680M | Dell Precision 5000 5470 Intel Core i9-12900H, NVIDIA RTX A1000 Laptop GPU | HP ZBook Firefly 14 G9-6B8A2EA Intel Core i7-1265U, NVIDIA T550 Laptop GPU | |
|---|---|---|---|---|---|
| Heat | -16% | -6% | -11% | -3% | |
| Maximum Upper Side * (°C) | 42.7 | 52.4 -23% | 48.2 -13% | 41.8 2% | 41.2 4% |
| Maximum Bottom * (°C) | 43.1 | 63.7 -48% | 52.8 -23% | 36 16% | 47.9 -11% |
| Idle Upper Side * (°C) | 25.7 | 24.6 4% | 24.4 5% | 34.6 -35% | 26.5 -3% |
| Idle Bottom * (°C) | 26.4 | 26 2% | 24.5 7% | 33.6 -27% | 27 -2% |
* ... menor é melhor
Oradores
Os alto-falantes do ThinkPad P14s Gen 3, que são colocados acima do teclado, não são particularmente bons. Eles são muito silenciosos e não são suficientemente bajuladores. Uma solução externa é definitivamente recomendada para a audição de música.
Lenovo ThinkPad P14s G3 AMD 21J6S05000 análise de áudio
(-) | alto-falantes não muito altos (###valor### dB)
Graves 100 - 315Hz
(-) | quase nenhum baixo - em média 20.4% menor que a mediana
(-) | graves não são lineares (15.1% delta para frequência anterior)
Médios 400 - 2.000 Hz
(+) | médios equilibrados - apenas 1.6% longe da mediana
(+) | médios são lineares (5.8% delta para frequência anterior)
Altos 2 - 16 kHz
(+) | agudos equilibrados - apenas 2% longe da mediana
(+) | os máximos são lineares (6.1% delta da frequência anterior)
Geral 100 - 16.000 Hz
(±) | a linearidade do som geral é média (18.7% diferença em relação à mediana)
Comparado com a mesma classe
» 63% de todos os dispositivos testados nesta classe foram melhores, 8% semelhantes, 29% piores
» O melhor teve um delta de 7%, a média foi 17%, o pior foi 35%
Comparado com todos os dispositivos testados
» 43% de todos os dispositivos testados foram melhores, 8% semelhantes, 49% piores
» O melhor teve um delta de 4%, a média foi 23%, o pior foi 134%
HP ZBook Firefly 14 G9-6B8A2EA análise de áudio
(+) | os alto-falantes podem tocar relativamente alto (###valor### dB)
Graves 100 - 315Hz
(-) | quase nenhum baixo - em média 19.6% menor que a mediana
(±) | a linearidade dos graves é média (13% delta para a frequência anterior)
Médios 400 - 2.000 Hz
(+) | médios equilibrados - apenas 2.5% longe da mediana
(+) | médios são lineares (3.5% delta para frequência anterior)
Altos 2 - 16 kHz
(+) | agudos equilibrados - apenas 1.9% longe da mediana
(+) | os máximos são lineares (3.2% delta da frequência anterior)
Geral 100 - 16.000 Hz
(+) | o som geral é linear (12.7% diferença em relação à mediana)
Comparado com a mesma classe
» 21% de todos os dispositivos testados nesta classe foram melhores, 4% semelhantes, 74% piores
» O melhor teve um delta de 7%, a média foi 17%, o pior foi 35%
Comparado com todos os dispositivos testados
» 12% de todos os dispositivos testados foram melhores, 3% semelhantes, 86% piores
» O melhor teve um delta de 4%, a média foi 23%, o pior foi 134%
Gerenciamento de energia: A eficiência da AMD faz com que os tempos de funcionamento sejam bons
Consumo de energia
Seu consumo de energia é muito semelhante ao do ThinkPad T14 G3 - a diferença é que o ThinkPad P14s G3 consome um pouco mais sob carga. Entretanto, seu consumo ainda é tão baixo que uma fonte de energia de 65 watts é mais do que suficiente. Este não é o caso de seus concorrentes Dell e HP.
| desligado | |
| Ocioso | |
| Carga |
|
Key:
min: | |
| Lenovo ThinkPad P14s G3 AMD 21J6S05000 R7 PRO 6850U, Radeon 680M, Samsung PM9A1 MZVL21T0HCLR, IPS LED, 1920x1200, 14" | Lenovo ThinkPad P14s Gen2-20VX000GGE i7-1185G7, T500 Laptop GPU, Toshiba XG6 KXG6AZNV1T02, IPS, 1920x1080, 14" | Lenovo ThinkPad T14 G3-21CF004NGE R7 PRO 6850U, Radeon 680M, Kioxia BG5 KBG5AZNV512G, IPS, 1920x1200, 14" | Dell Precision 5000 5470 i9-12900H, RTX A1000 Laptop GPU, Samsung PM9A1 MZVL21T0HCLR, IPS, 2560x1600, 14" | HP ZBook Firefly 14 G9-6B8A2EA i7-1265U, T550 Laptop GPU, Micron 3400 1TB MTFDKBA1T0TFH, IPS, 1920x1200, 14" | Média AMD Radeon 680M | Média da turma Workstation | |
|---|---|---|---|---|---|---|---|
| Power Consumption | -34% | 9% | -110% | -19% | -72% | -187% | |
| Idle Minimum * (Watt) | 2.6 | 4.5 -73% | 2.4 8% | 4.3 -65% | 4.2 -62% | 6.93 ? -167% | 9.11 ? -250% |
| Idle Average * (Watt) | 5 | 7.1 -42% | 5.3 -6% | 8.9 -78% | 6.5 -30% | 8.98 ? -80% | 13.8 ? -176% |
| Idle Maximum * (Watt) | 5.6 | 9.7 -73% | 5.6 -0% | 18.9 -238% | 7.2 -29% | 10.5 ? -88% | 17.9 ? -220% |
| Load Average * (Watt) | 49.7 | 37.8 24% | 39.7 20% | 94 -89% | 47.7 4% | 53.5 ? -8% | 96 ? -93% |
| Witcher 3 ultra * (Watt) | 50.6 | 42.8 15% | 83.2 -64% | 42.9 15% | |||
| Load Maximum * (Watt) | 61.1 | 64.7 -6% | 50.6 17% | 137.5 -125% | 68.2 -12% | 70.5 ? -15% | 180.3 ? -195% |
* ... menor é melhor
Power consumption Witcher 3 / stress test
Power consumption with external monitor
Duração da bateria
Assim como o ThinkPad T14 Gen 3 da Lenovo, o ThinkPad P14s G3 consegue tirar muito de sua bateria de 52,5 watts-hora. Doze horas no teste de Wi-Fi (150 cd/m²) dão um resultado respeitável. Mesmo com o brilho máximo da tela, o portátil ThinkPad ainda funcionou durante quase dez horas no teste Wi-Fi. Seus rivais da Dell e da HP, baseados em Intel, só podem sonhar com isso.
| Lenovo ThinkPad P14s G3 AMD 21J6S05000 R7 PRO 6850U, Radeon 680M, 52.5 Wh | Lenovo ThinkPad P14s Gen2-20VX000GGE i7-1185G7, T500 Laptop GPU, 50 Wh | Lenovo ThinkPad T14 G3-21CF004NGE R7 PRO 6850U, Radeon 680M, 52.5 Wh | Dell Precision 5000 5470 i9-12900H, RTX A1000 Laptop GPU, 72 Wh | HP ZBook Firefly 14 G9-6B8A2EA i7-1265U, T550 Laptop GPU, 51 Wh | Média da turma Workstation | |
|---|---|---|---|---|---|---|
| Duração da bateria | -25% | 20% | -11% | -28% | -5% | |
| H.264 (h) | 12 | 16.4 37% | 10.1 ? -16% | |||
| WiFi v1.3 (h) | 12.2 | 9.2 -25% | 12.9 6% | 9.6 -21% | 8.8 -28% | 8.55 ? -30% |
| Load (h) | 1.1 | 1.3 18% | 1.1 0% | 1.441 ? 31% |
Pro
Contra
Veredicto: O Lenovo ThinkPad P14s G3 AMD é uma grande estação de trabalho de nível básico

Uma estação de trabalho móvel que torna elaborados projetos CAD durante horas a fio ou que pode ser usada para o desenvolvimento de jogos - isto é exatamente o que o Lenovo ThinkPad P14s Gen 3 AMD não é. Ao contrário, é um modelo básico que oferece principalmente um bom desempenho da CPU, mas fica muito atrás dos laptops de estações de trabalho maiores em termos de desempenho da GPU. O laptop Lenovo compensa este desempenho inferior com muito boa mobilidade.
Isto também deve deixar claro que não se destina a substituir "grandes" estações de trabalho como a ThinkPad P16. É uma variante do ThinkPad T14 G3 - um laptop de escritório que também é comercializado para clientes de estações de trabalho. Logicamente, ele compartilha pontos fortes e fracos semelhantes com o ThinkPad T14 G3 AMD. Seu slot de cartão SD ausente é um desses pontos fracos, assim como o padrão USB4 não suportado. A RAM soldada é ainda mais um incômodo em um dispositivo de estação de trabalho, e o teclado não está exatamente no mesmo nível em comparação com o P14s Gen 2embora ainda seja muito bom. Sua presença Ethernet e seu teclado facilmente substituível também são positivos.
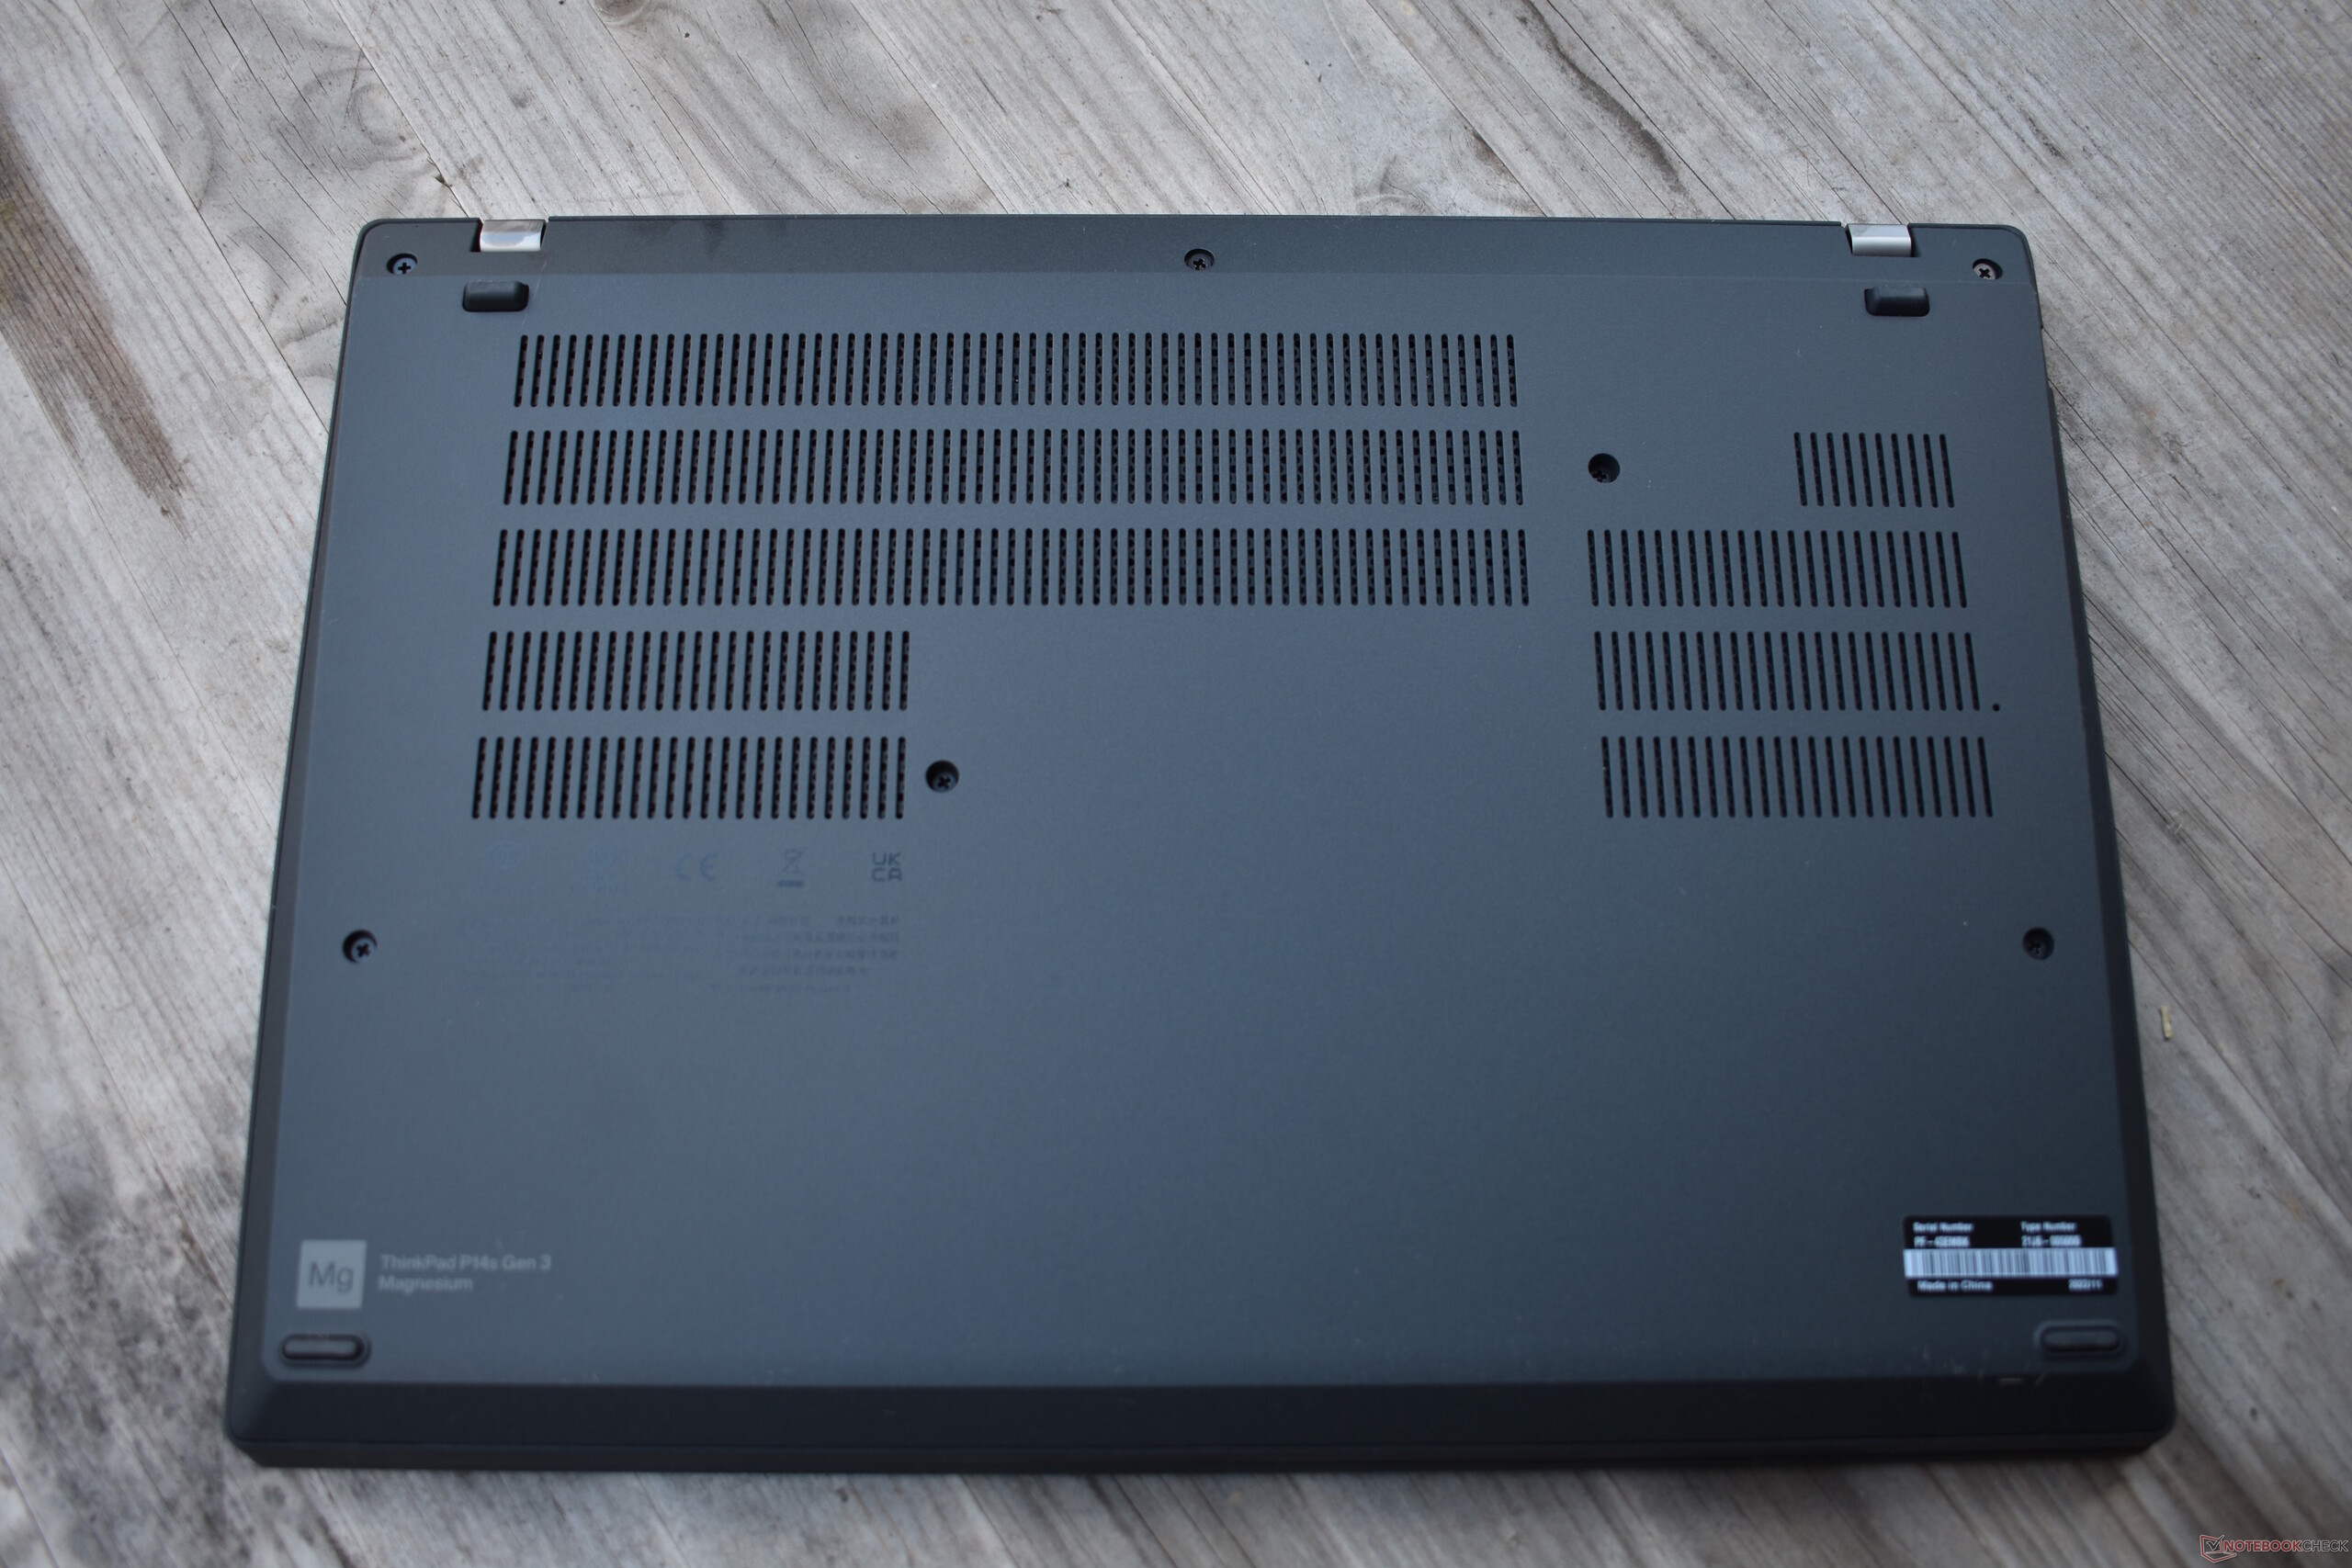
Bom desempenho da CPU e vida útil da bateria, baixo desempenho da GPU para uma estação de trabalho: O Lenovo ThinkPad P14s Gen 3 AMD
O Lenovo ThinkPad P14s Gen 3 AMD é uma excelente estação de trabalho móvel para tarefas que requerem desempenho de CPU. Seus principais concorrentes são a HP ZBook Firefly 14 G9que oferece Thunderbolt, mas tem um desempenho multi-núcleo inferior e menor duração da bateria com o processador Intel mais ineficiente. Outra alternativa é o Dell Precision 5470a GPU, que se caracteriza principalmente por seu desempenho significativamente melhor - mas faz grandes sacrifícios em termos de portos (além da presença do Thunderbolt e de um leitor de cartões SD).
Preço e disponibilidade
O modelo que testamos com Ryzen 7, display WUXGA, 32 GB de RAM e 1 TB SSD com o modelo número 21J6S05000 é um modelo especial que só está disponível no programa Campus da Lenovo para compradores elegíveis. Custa cerca de $1.640 e vem sem um sistema operacional. Para todos os outros clientes, este modelo com Windows 11 Pro(21J5002FGE) está disponível por cerca de US$1.900. A Amazon tem o ThinkPad P14s Gen 3 AMD com uma tela WQUXGA de maior resolução em oferta por cerca de $1.661.
Lenovo ThinkPad P14s G3 AMD 21J6S05000
- 04/17/2023 v7 (old)
Benjamin Herzig
Transparência
A seleção dos dispositivos a serem analisados é feita pela nossa equipe editorial. A amostra de teste foi fornecida ao autor como empréstimo pelo fabricante ou varejista para fins desta revisão. O credor não teve influência nesta revisão, nem o fabricante recebeu uma cópia desta revisão antes da publicação. Não houve obrigação de publicar esta revisão. Como empresa de mídia independente, a Notebookcheck não está sujeita à autoridade de fabricantes, varejistas ou editores.
É assim que o Notebookcheck está testando
Todos os anos, o Notebookcheck analisa de forma independente centenas de laptops e smartphones usando procedimentos padronizados para garantir que todos os resultados sejam comparáveis. Desenvolvemos continuamente nossos métodos de teste há cerca de 20 anos e definimos padrões da indústria no processo. Em nossos laboratórios de teste, equipamentos de medição de alta qualidade são utilizados por técnicos e editores experientes. Esses testes envolvem um processo de validação em vários estágios. Nosso complexo sistema de classificação é baseado em centenas de medições e benchmarks bem fundamentados, o que mantém a objetividade.Price comparison

