Revisão da estação de trabalho Lenovo ThinkPad P16 G1 RTX A5500: Mais rápido que a Dell Precision 7670
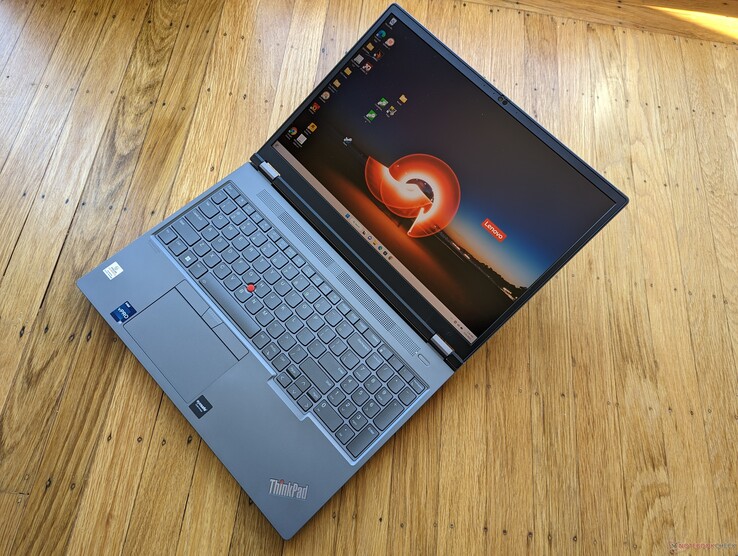
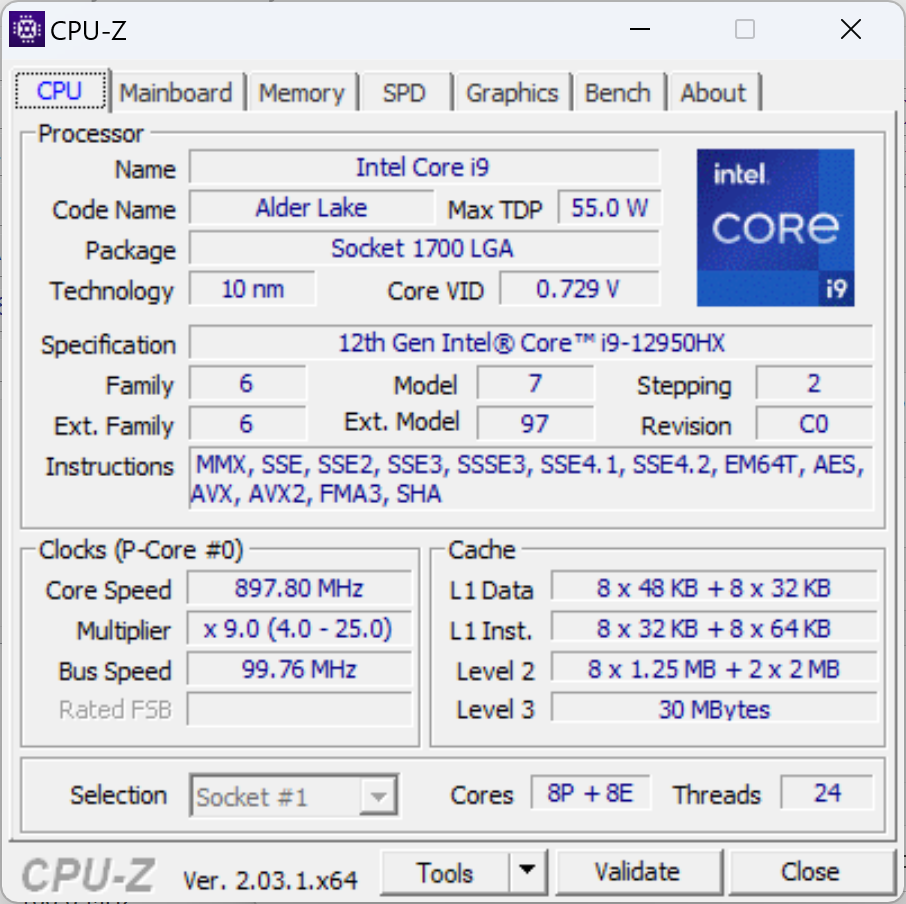
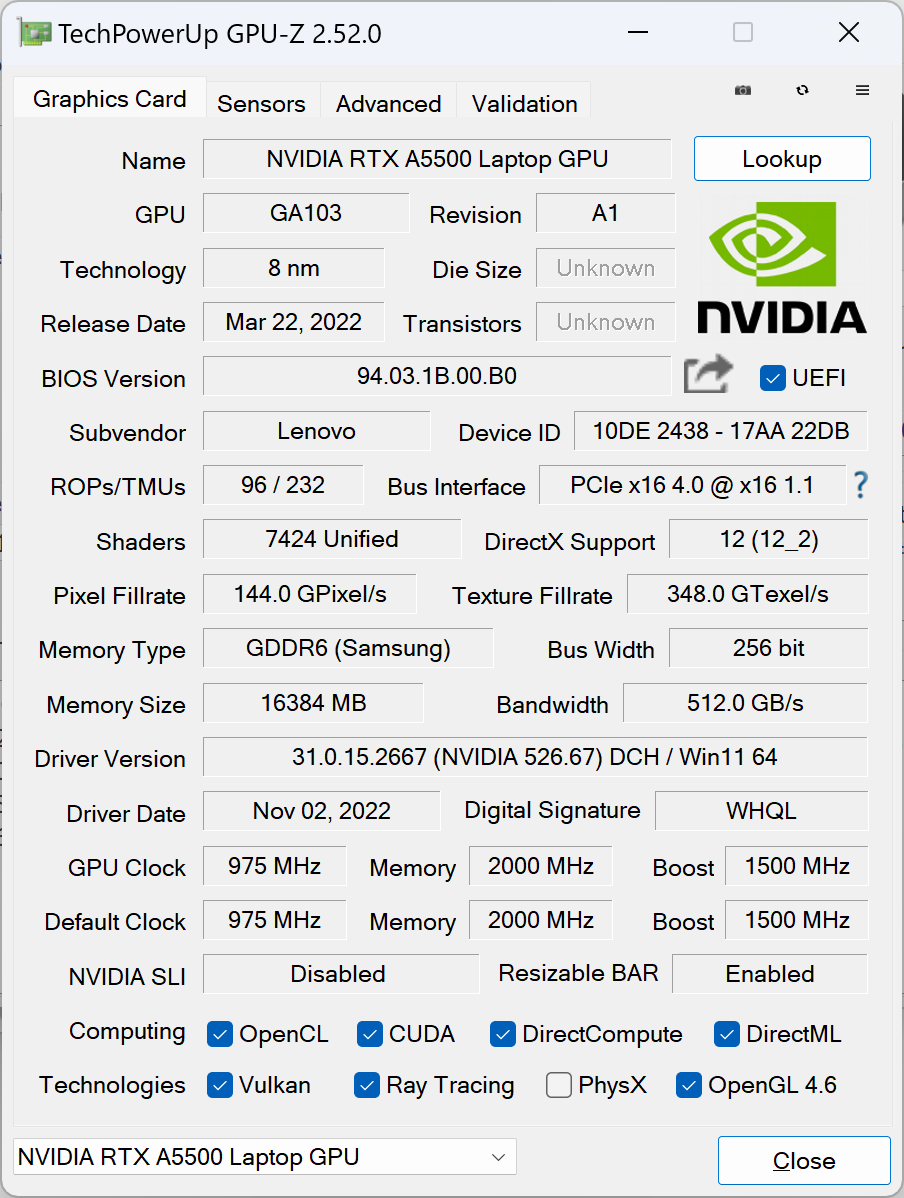
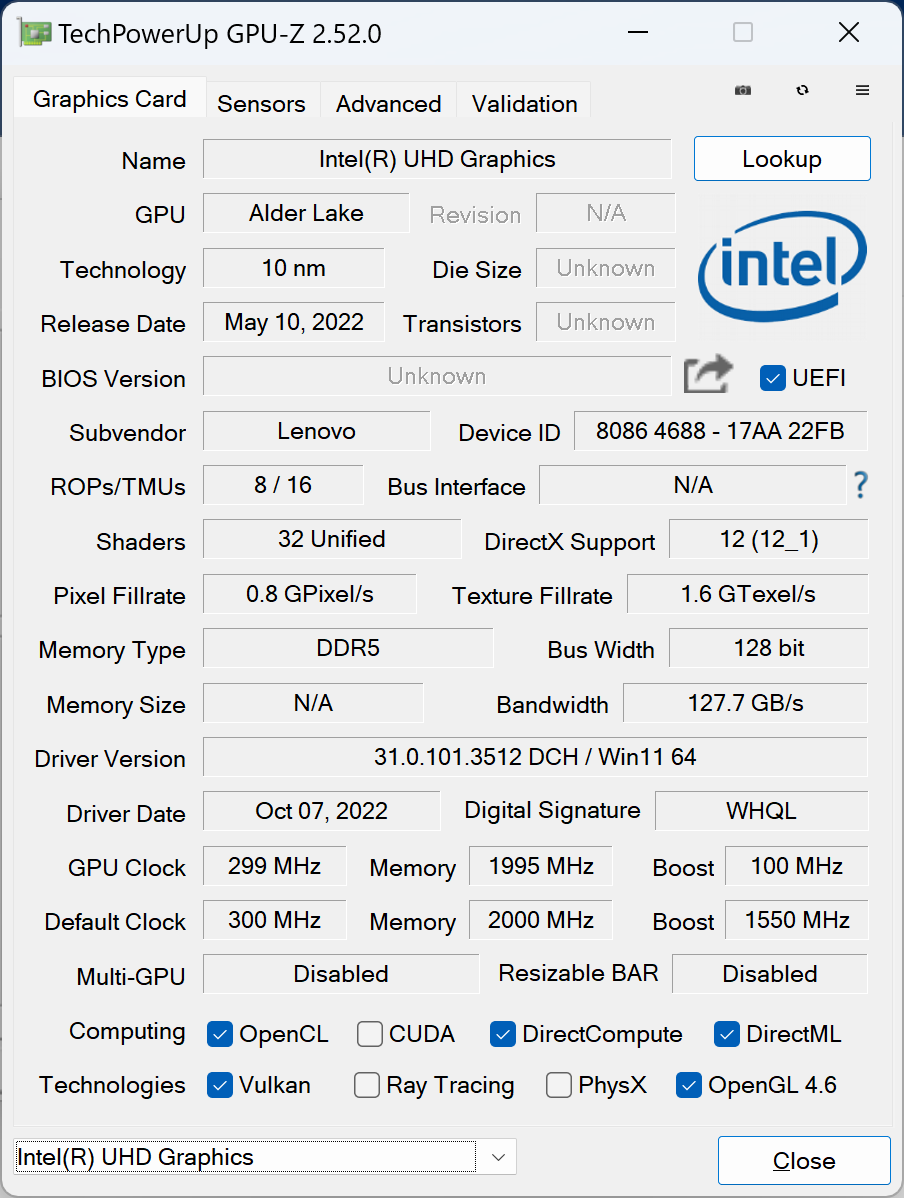
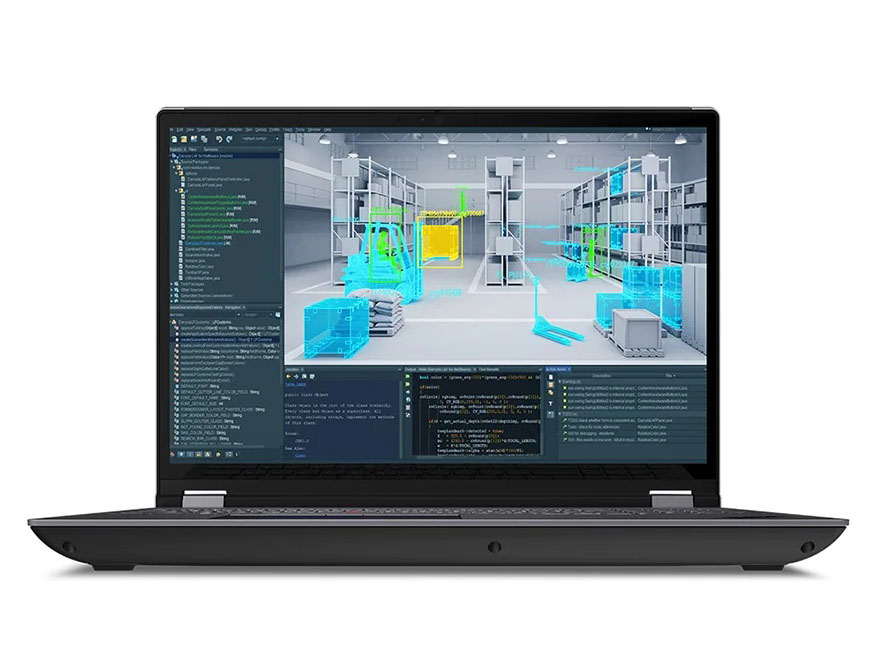
O ThinkPad P16 G1 é uma nova geração de estações de trabalho ThinkPad de 16 polegadas projetada para superar as 16-polegadas existentes ThinkPad série P1. Ele transporta algumas das CPUs e GPUs de estações de trabalho móveis mais rápidas atualmente disponíveis até o Core i9-12950HX e RTX A5500, respectivamente, para ser uma das estações de trabalho móveis mais rápidas do mercado. Nossa unidade como configurada de varejo por aproximadamente $9000 USD. Naturalmente, SKUs de última geração com gráficos UHD integrados mais lentos ou o Intel ARC Pro A30M também estão disponíveis com preços iniciais de US$ 3400.
O modelo compete diretamente com outras estações de trabalho móveis high-end e alguns laptops Nvidia Studio como o Dell Precision 7670, Asus ProArt StudioBook Pro 16, MSI CreatorPro Z16P, ou o HP ZBook Studio 16 G9. Veja nossa revisão completa no ThinkPad P16 G1 RTX A2000 configuração para saber mais sobre o chassi e outras características físicas do modelo. Esta revisão se concentrará no que os usuários podem esperar do ThinkPad P16 G1 em termos de desempenho se configurar com as opções mais avançadas de CPU e GPU.
Mais análises da Lenovo:
Possíveis concorrentes em comparação
Avaliação | Data | Modelo | Peso | Altura | Size | Resolução | Preço |
|---|---|---|---|---|---|---|---|
| 91 % v7 (old) | 02/2023 | Lenovo ThinkPad P16 G1 RTX A5500 i9-12950HX, RTX A5500 Laptop GPU | 3 kg | 30.23 mm | 16.00" | 3840x2400 | |
v (old) | 12/2021 | Asus ProArt StudioBook 16 W7600H5A-2BL2 W-11955M, RTX A5000 Laptop GPU | 2.4 kg | 21.4 mm | 16.00" | 3840x2400 | |
| 89.1 % v7 (old) | 12/2022 | Dell Precision 7000 7670 Performance i9-12950HX, RTX A5500 Laptop GPU | 2.8 kg | 25.95 mm | 16.00" | 3840x2400 | |
| 88.2 % v7 (old) | 02/2023 | Lenovo ThinkPad P16 G1 21D6001DMB i7-12850HX, RTX A2000 Laptop GPU | 3 kg | 30.23 mm | 16.00" | 2560x1600 | |
| 84.3 % v7 (old) | 11/2022 | MSI CreatorPro Z16P B12UKST i7-12700H, RTX A3000 Laptop GPU | 2.4 kg | 19 mm | 16.00" | 2560x1600 | |
| 90.1 % v7 (old) | 11/2022 | HP ZBook Studio 16 G9 62U04EA i7-12800H, RTX A2000 Laptop GPU | 1.8 kg | 19 mm | 16.00" | 3840x2400 |
Caso
Leitor de cartões SD
O leitor de cartões integrado oferece apenas taxas de transferência médias. A transferência de 1 GB de fotos de nosso cartão de teste UHS-II para a área de trabalho leva cerca de 14 segundos, em comparação com menos da metade que no Precision 7670. Para uma estação de trabalho móvel de alta qualidade como nosso ThinkPad P1, estávamos esperando um pouco mais.
| SD Card Reader | |
| average JPG Copy Test (av. of 3 runs) | |
| Dell Precision 7000 7670 Performance (Toshiba Exceria Pro SDXC 64 GB UHS-II) | |
| MSI CreatorPro Z16P B12UKST (AV Pro V60) | |
| Lenovo ThinkPad P16 G1 RTX A5500 (Toshiba Exceria Pro SDXC 64 GB UHS-II) | |
| HP ZBook Studio 16 G9 62U04EA (Angelbird AV PRO V60) | |
| Asus ProArt StudioBook 16 W7600H5A-2BL2 (AV Pro SD microSD 128 GB V60) | |
| Lenovo ThinkPad P16 G1 21D6001DMB (AV Pro V60) | |
| maximum AS SSD Seq Read Test (1GB) | |
| Dell Precision 7000 7670 Performance (Toshiba Exceria Pro SDXC 64 GB UHS-II) | |
| Asus ProArt StudioBook 16 W7600H5A-2BL2 (AV Pro SD microSD 128 GB V60) | |
| MSI CreatorPro Z16P B12UKST (AV Pro V60) | |
| Lenovo ThinkPad P16 G1 RTX A5500 (Toshiba Exceria Pro SDXC 64 GB UHS-II) | |
| HP ZBook Studio 16 G9 62U04EA (Angelbird AV PRO V60) | |
| Lenovo ThinkPad P16 G1 21D6001DMB (AV Pro V60) | |
Comunicação
| Networking | |
| iperf3 transmit AX12 | |
| Asus ProArt StudioBook 16 W7600H5A-2BL2 | |
| iperf3 receive AX12 | |
| Asus ProArt StudioBook 16 W7600H5A-2BL2 | |
| iperf3 receive AXE11000 6GHz | |
| MSI CreatorPro Z16P B12UKST | |
| HP ZBook Studio 16 G9 62U04EA | |
| Dell Precision 7000 7670 Performance | |
| Lenovo ThinkPad P16 G1 RTX A5500 | |
| iperf3 receive AXE11000 | |
| Lenovo ThinkPad P16 G1 21D6001DMB | |
| Lenovo ThinkPad P16 G1 RTX A5500 | |
| Dell Precision 7000 7670 Performance | |
| iperf3 transmit AXE11000 | |
| Lenovo ThinkPad P16 G1 RTX A5500 | |
| Lenovo ThinkPad P16 G1 21D6001DMB | |
| Dell Precision 7000 7670 Performance | |
| iperf3 transmit AXE11000 6GHz | |
| MSI CreatorPro Z16P B12UKST | |
| HP ZBook Studio 16 G9 62U04EA | |
| Lenovo ThinkPad P16 G1 RTX A5500 | |
| Dell Precision 7000 7670 Performance | |
Webcam


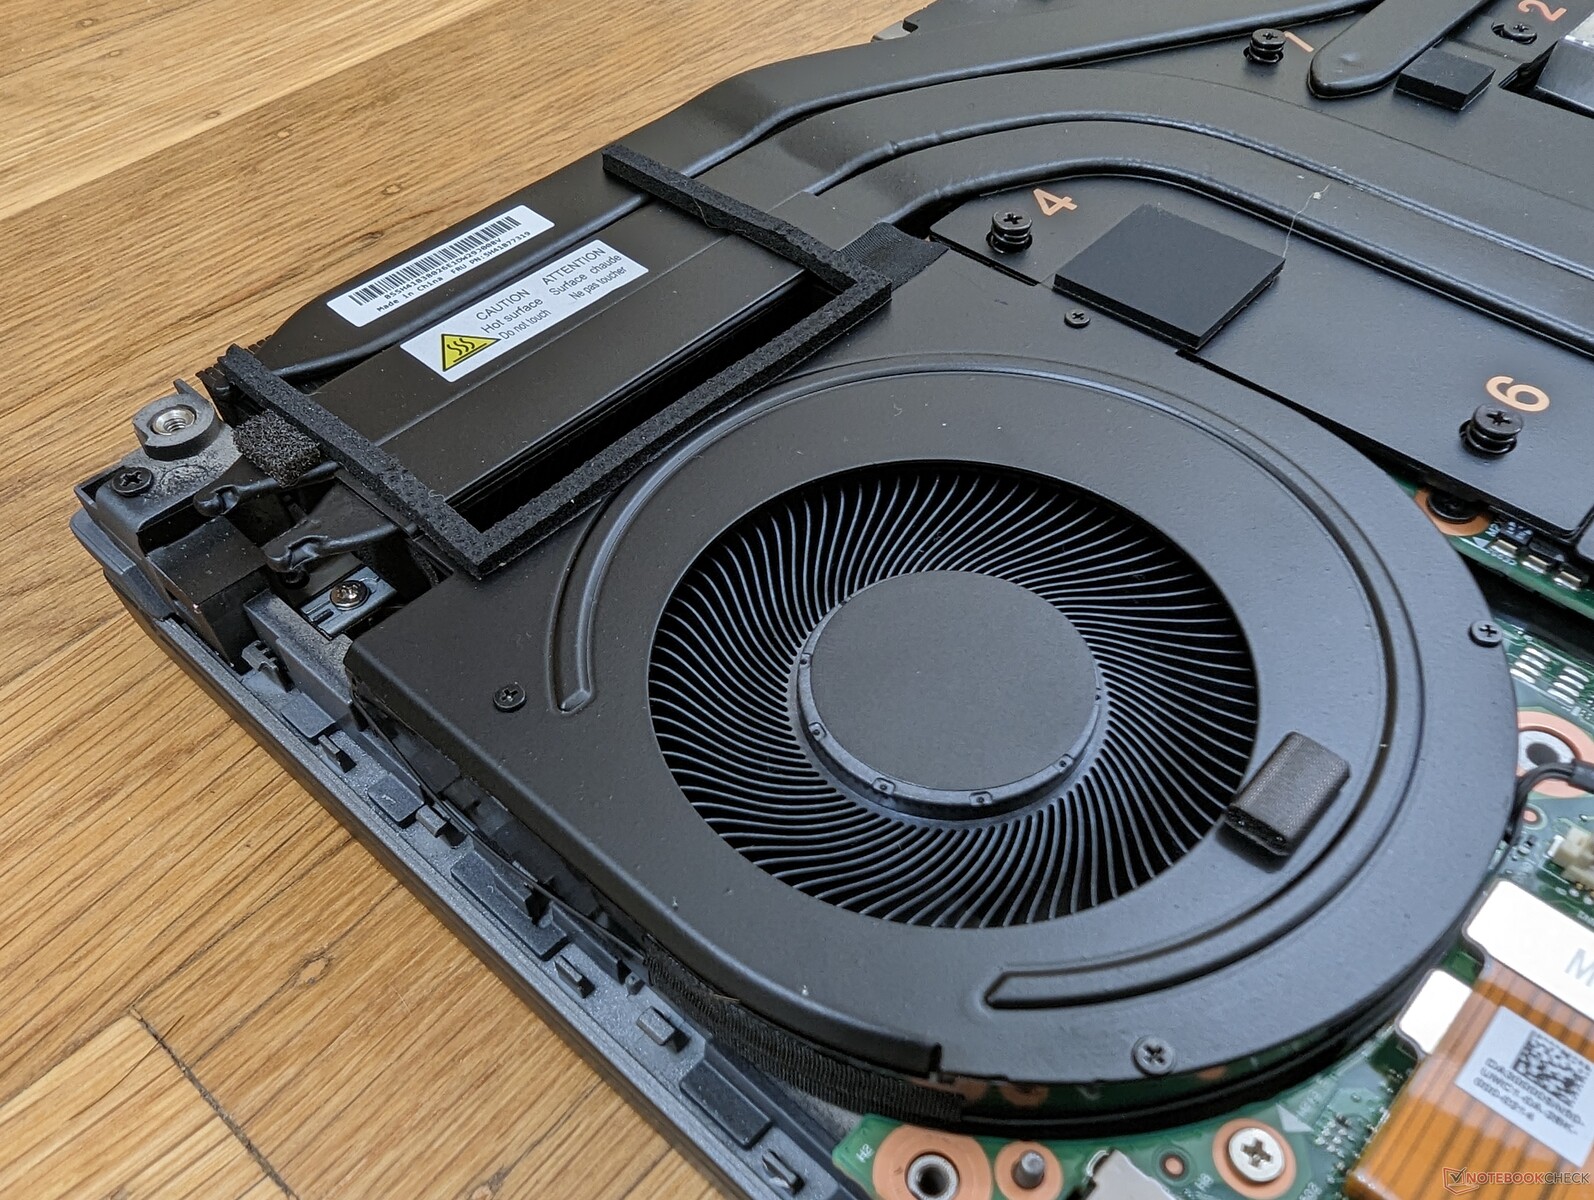
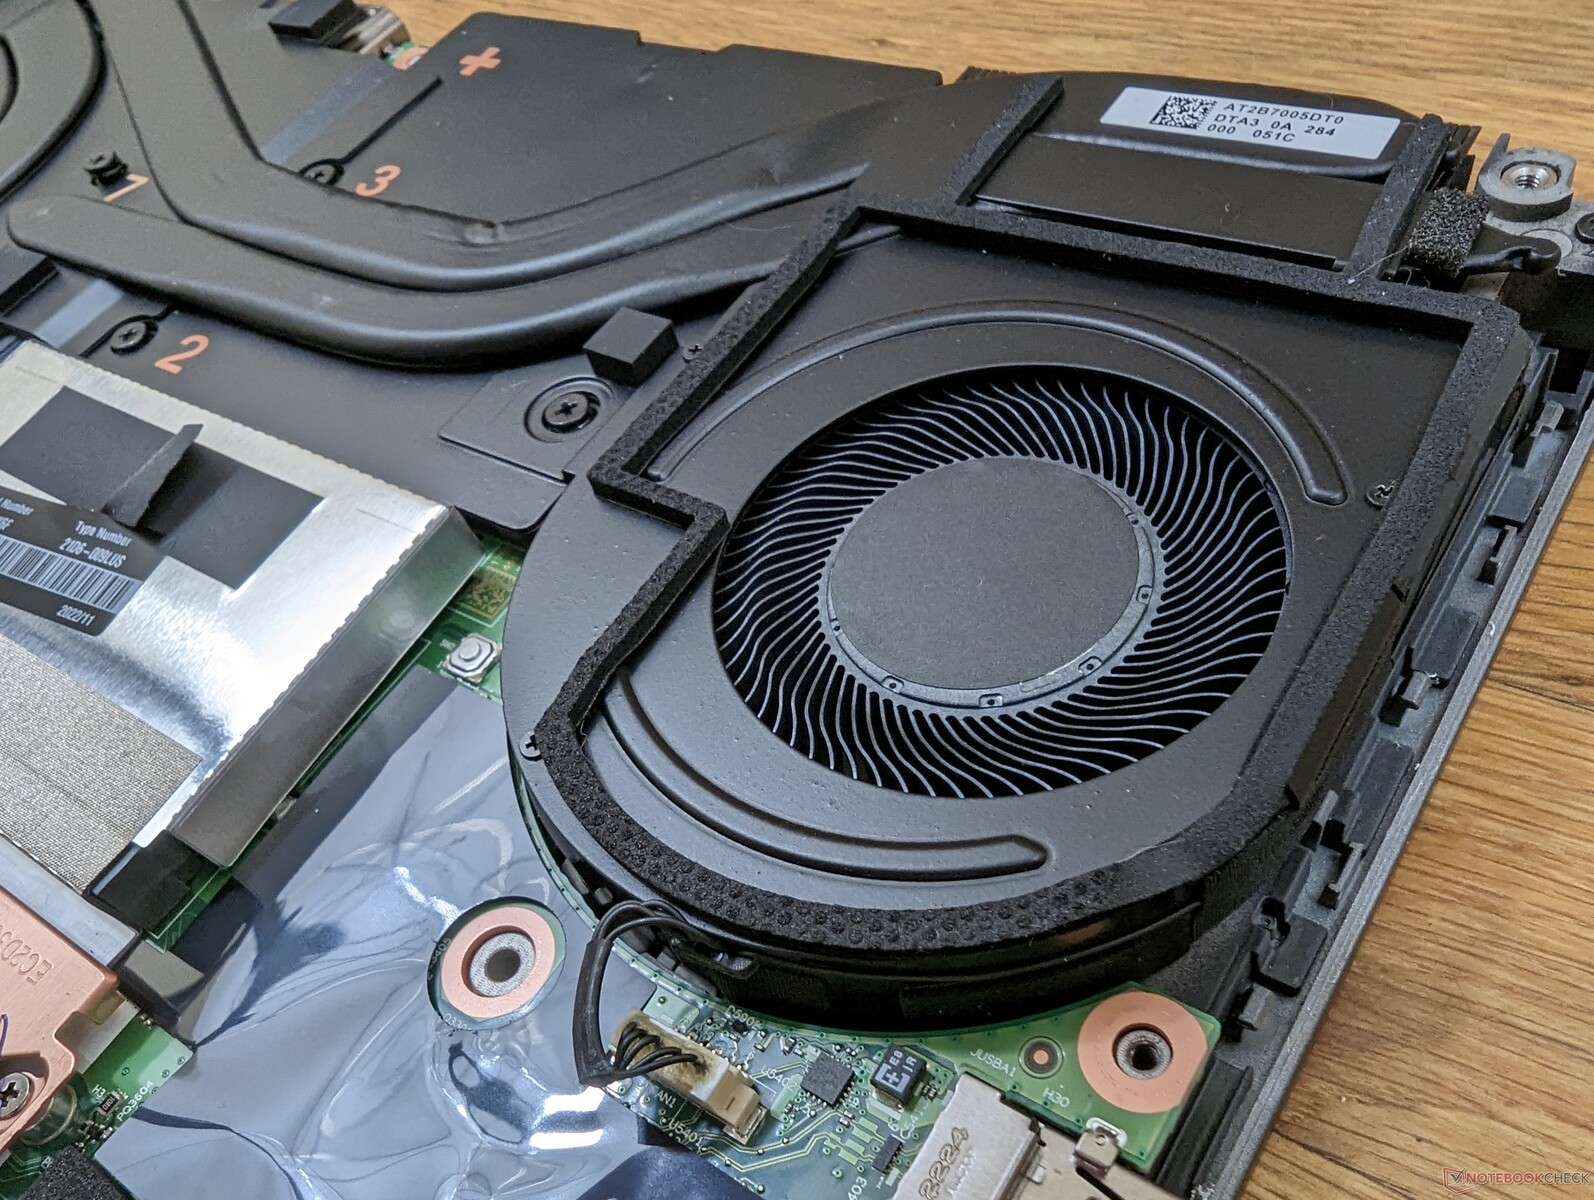
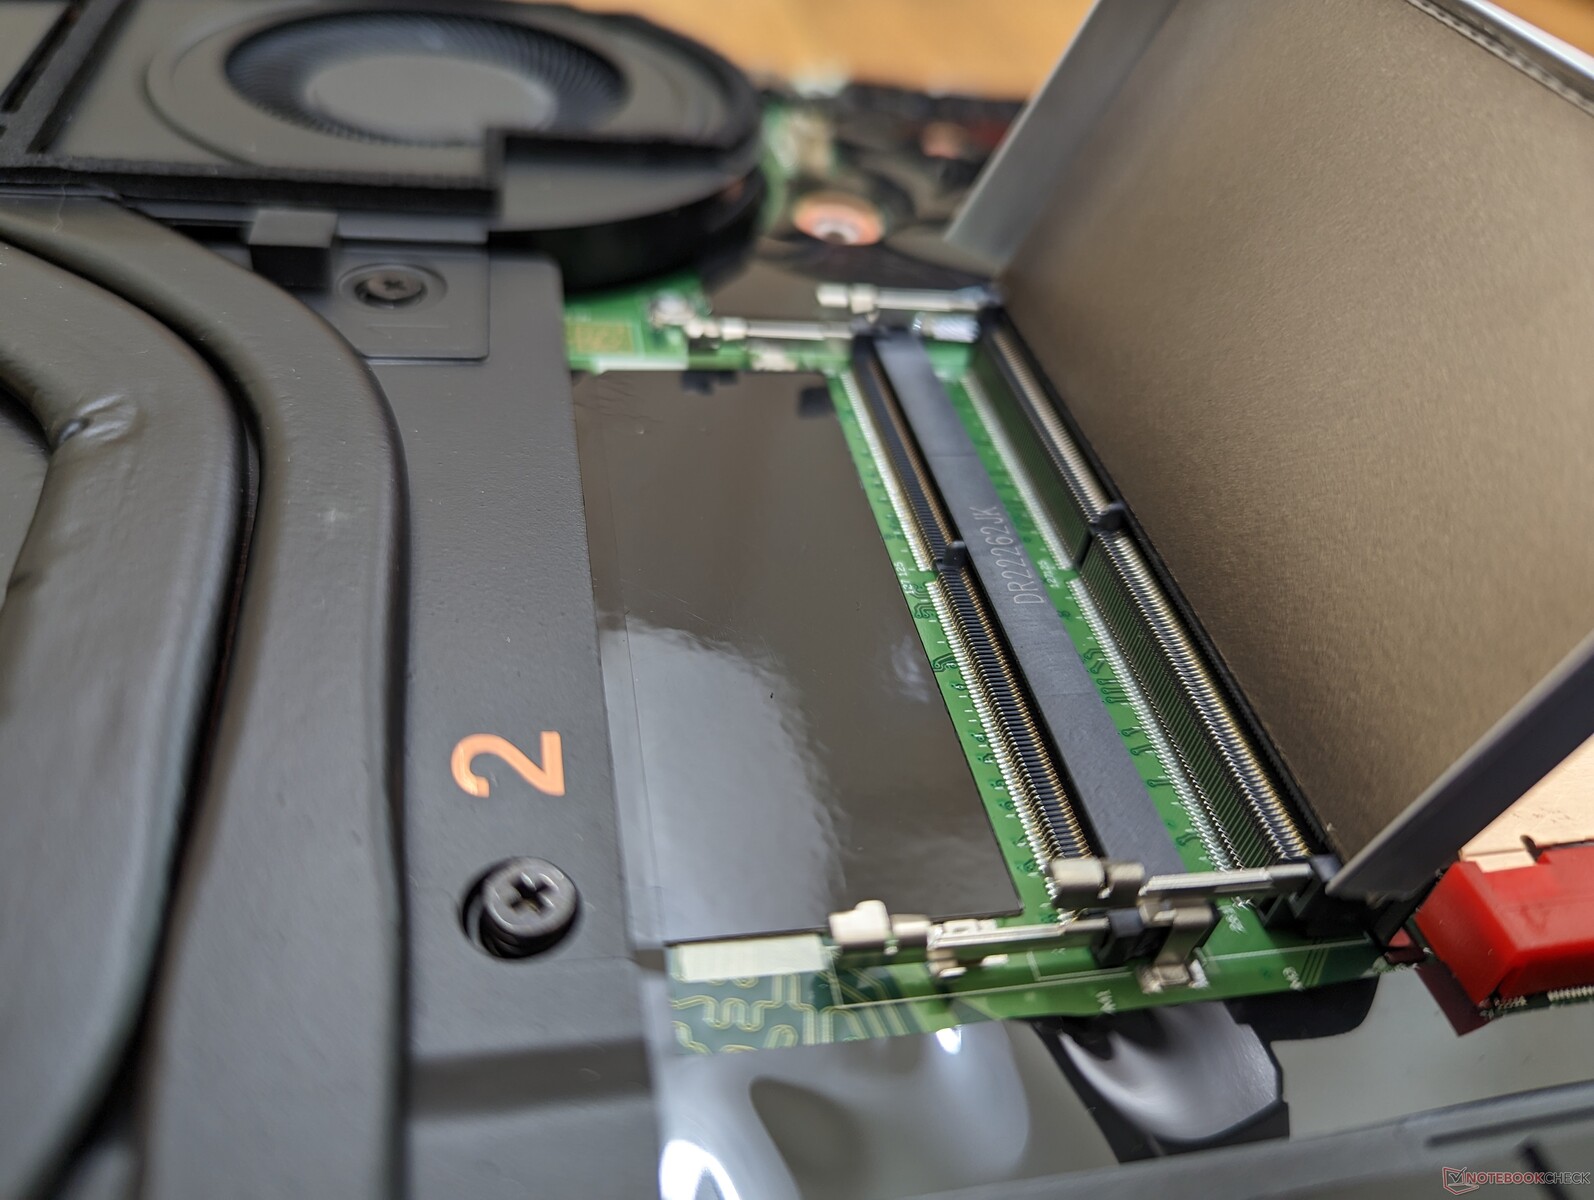
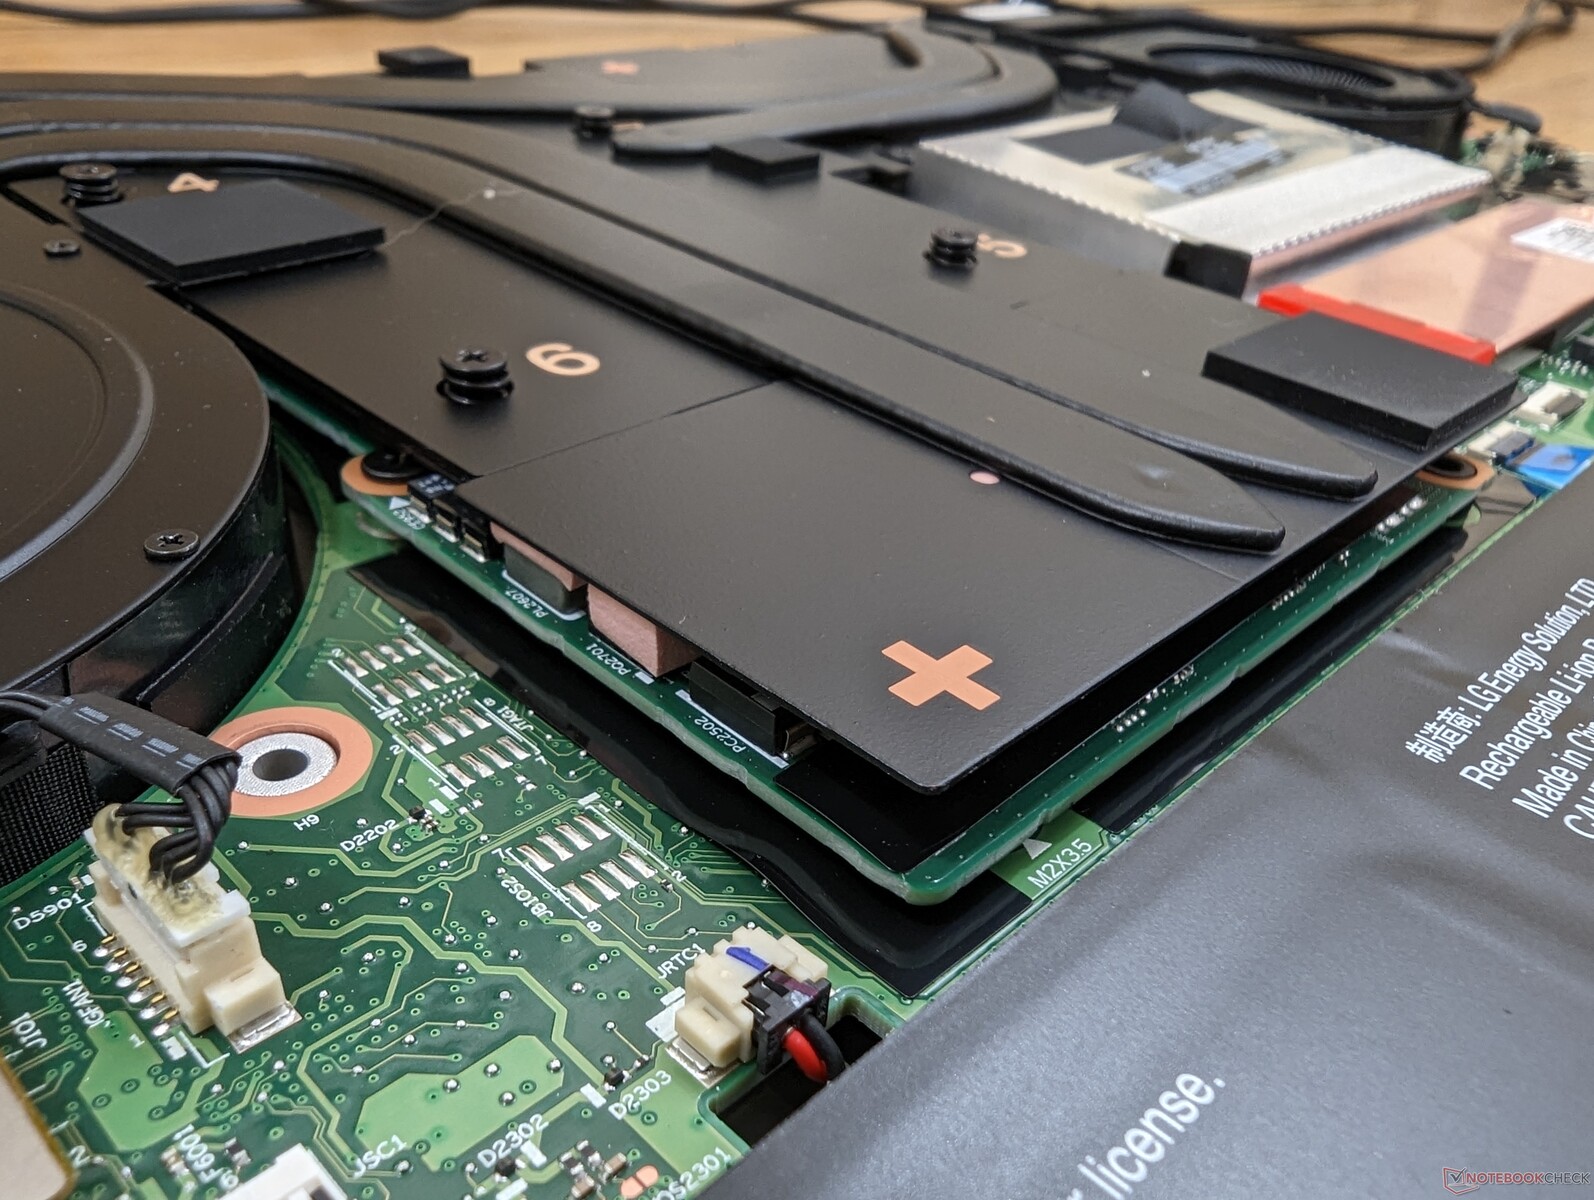
Manutenção
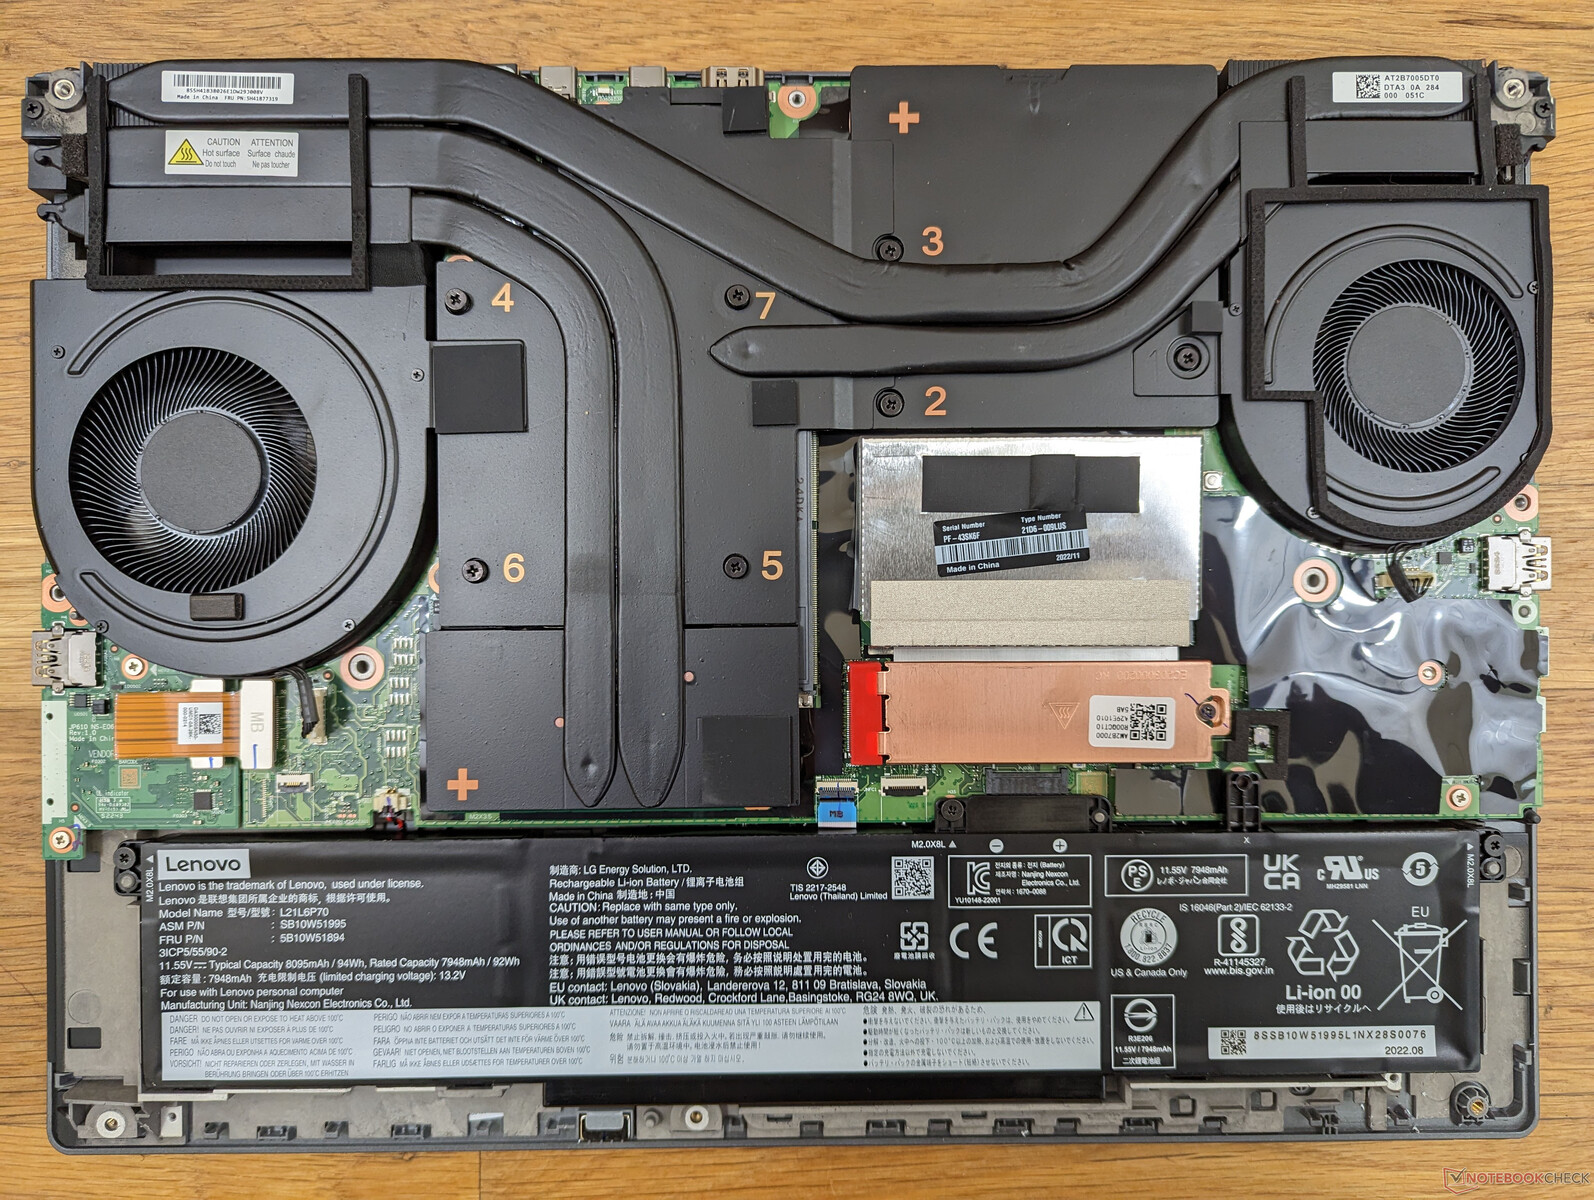
O painel inferior é fixado por 12 parafusos Philips. O teclado deve ser removido para acessar o módulo WAN, o slot primário M.2 SSD, e dois dos quatro slots SODIMM. A Lenovo tem um manual de manutenção oficial https://download.lenovo.com/pccbbs/mobiles_pdf/p16_gen1_hmm_en.pdf para que os usuários finais sigam.
Curiosamente, o ThinkPad P16 G1 é um dos poucos laptops com GPU removível. A troca de uma placa gráfica de laptop não é tipicamente recomendada, exceto para fins de manutenção ou substituição.
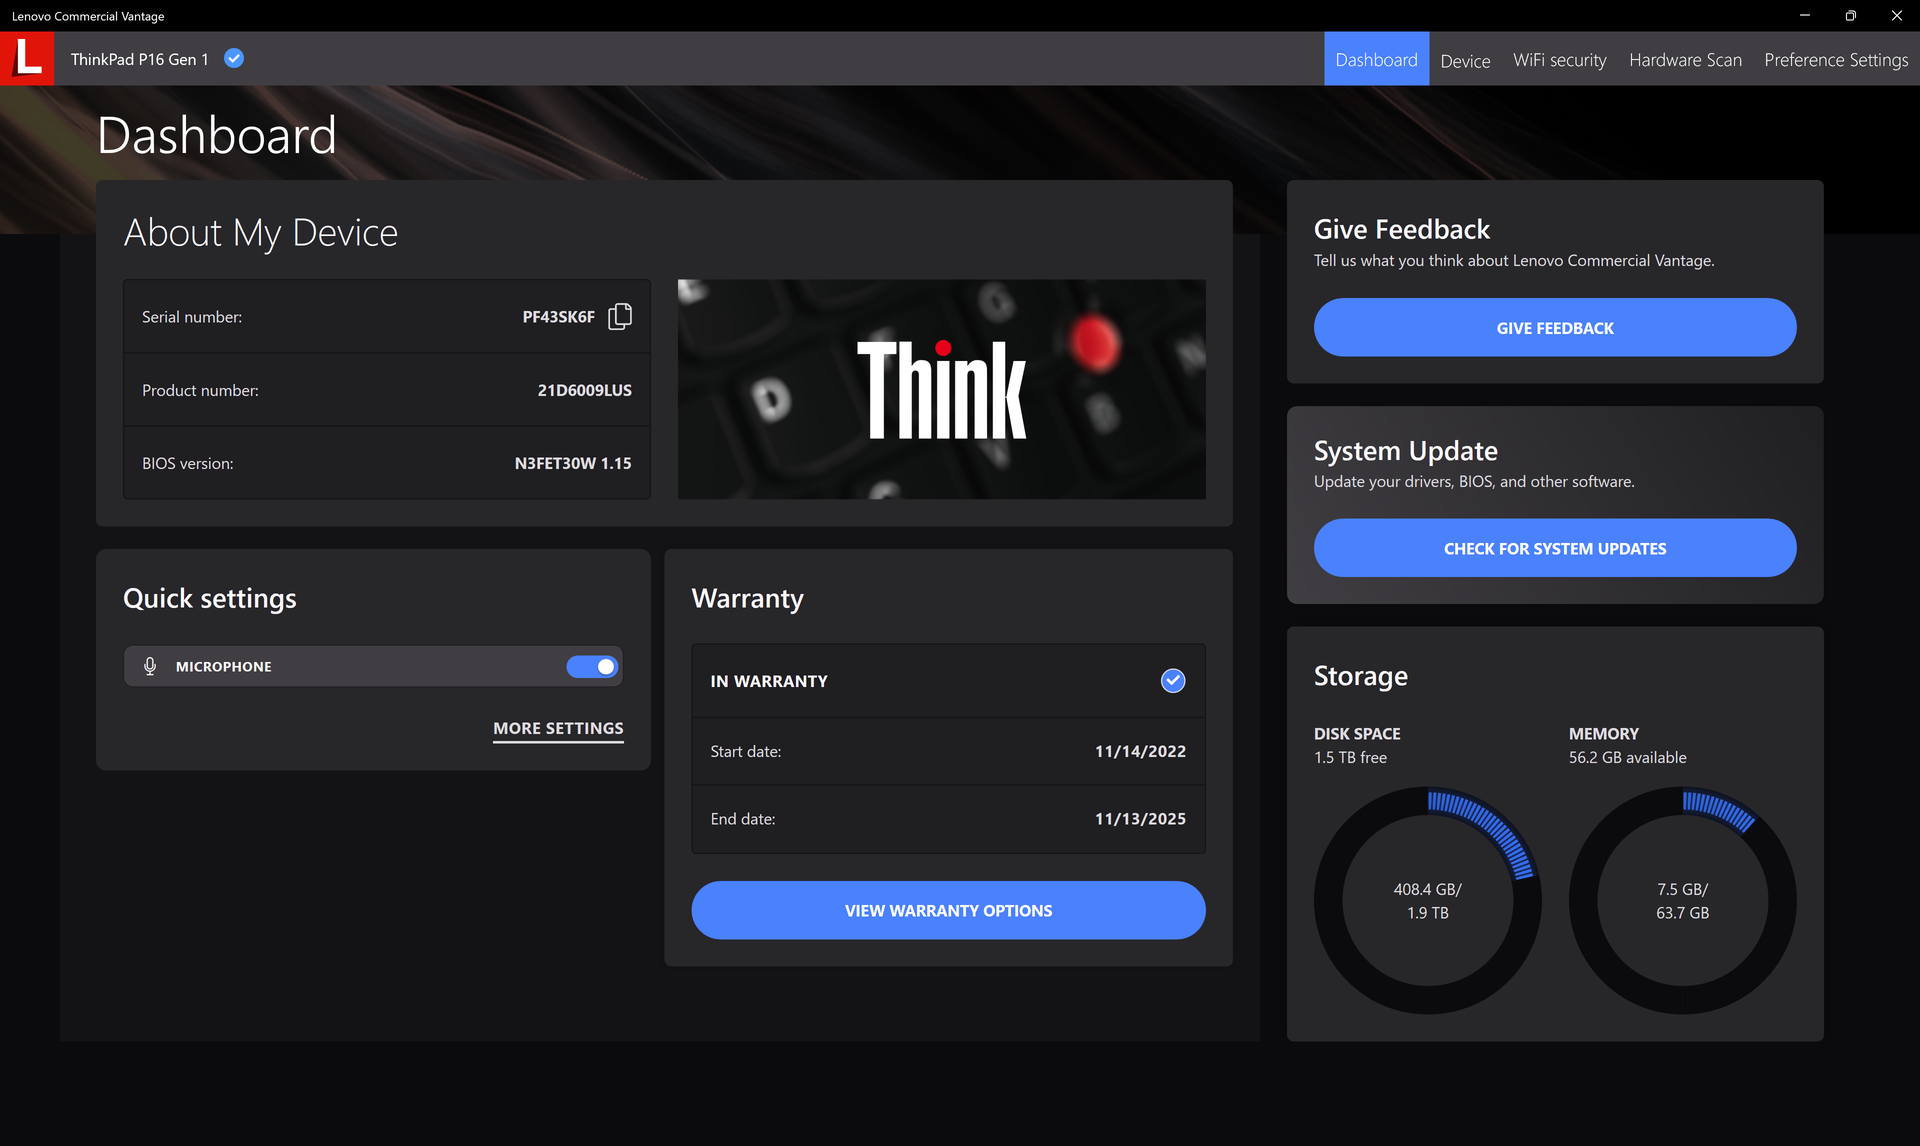
Acessórios e Garantia
Não há extras na caixa de varejo além do adaptador AC e da papelada.
Aplica-se uma garantia limitada de um ano enquanto que a Dell Precision 7670 vem com três anos como padrão. Entretanto, a Lenovo oferece serviço no local durante o período de um ano, se necessário.
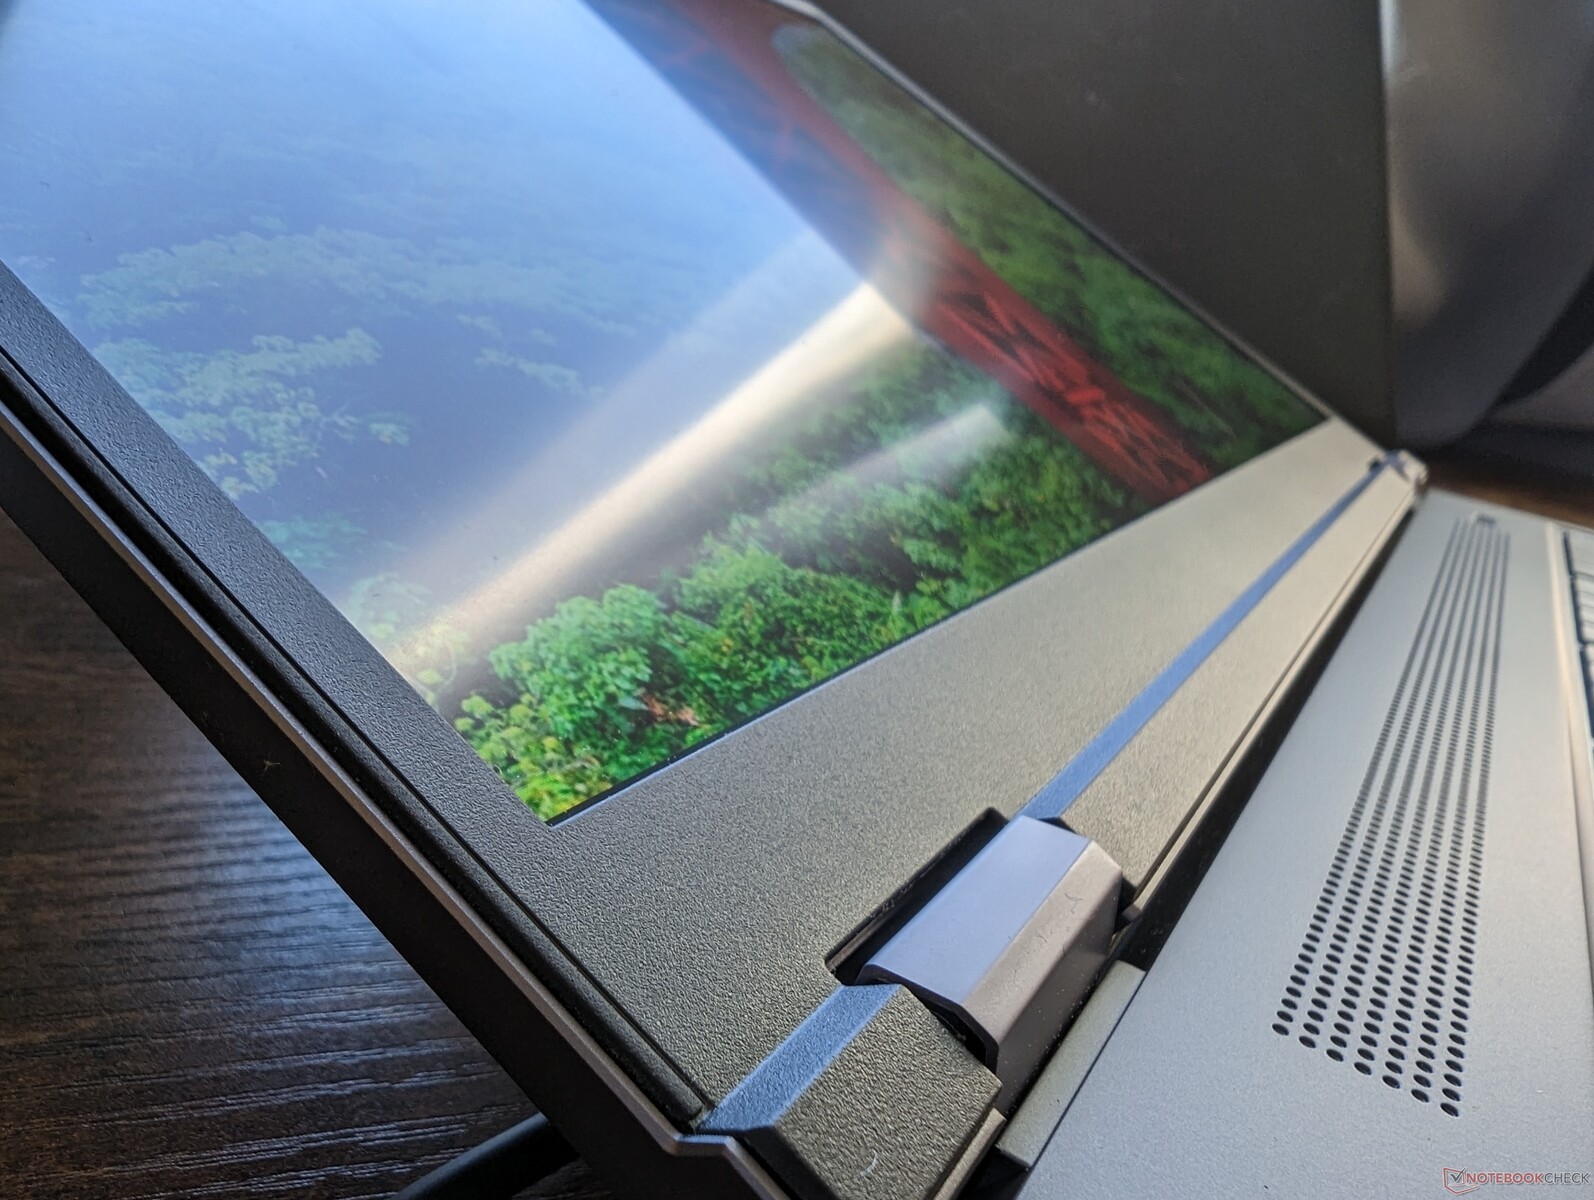
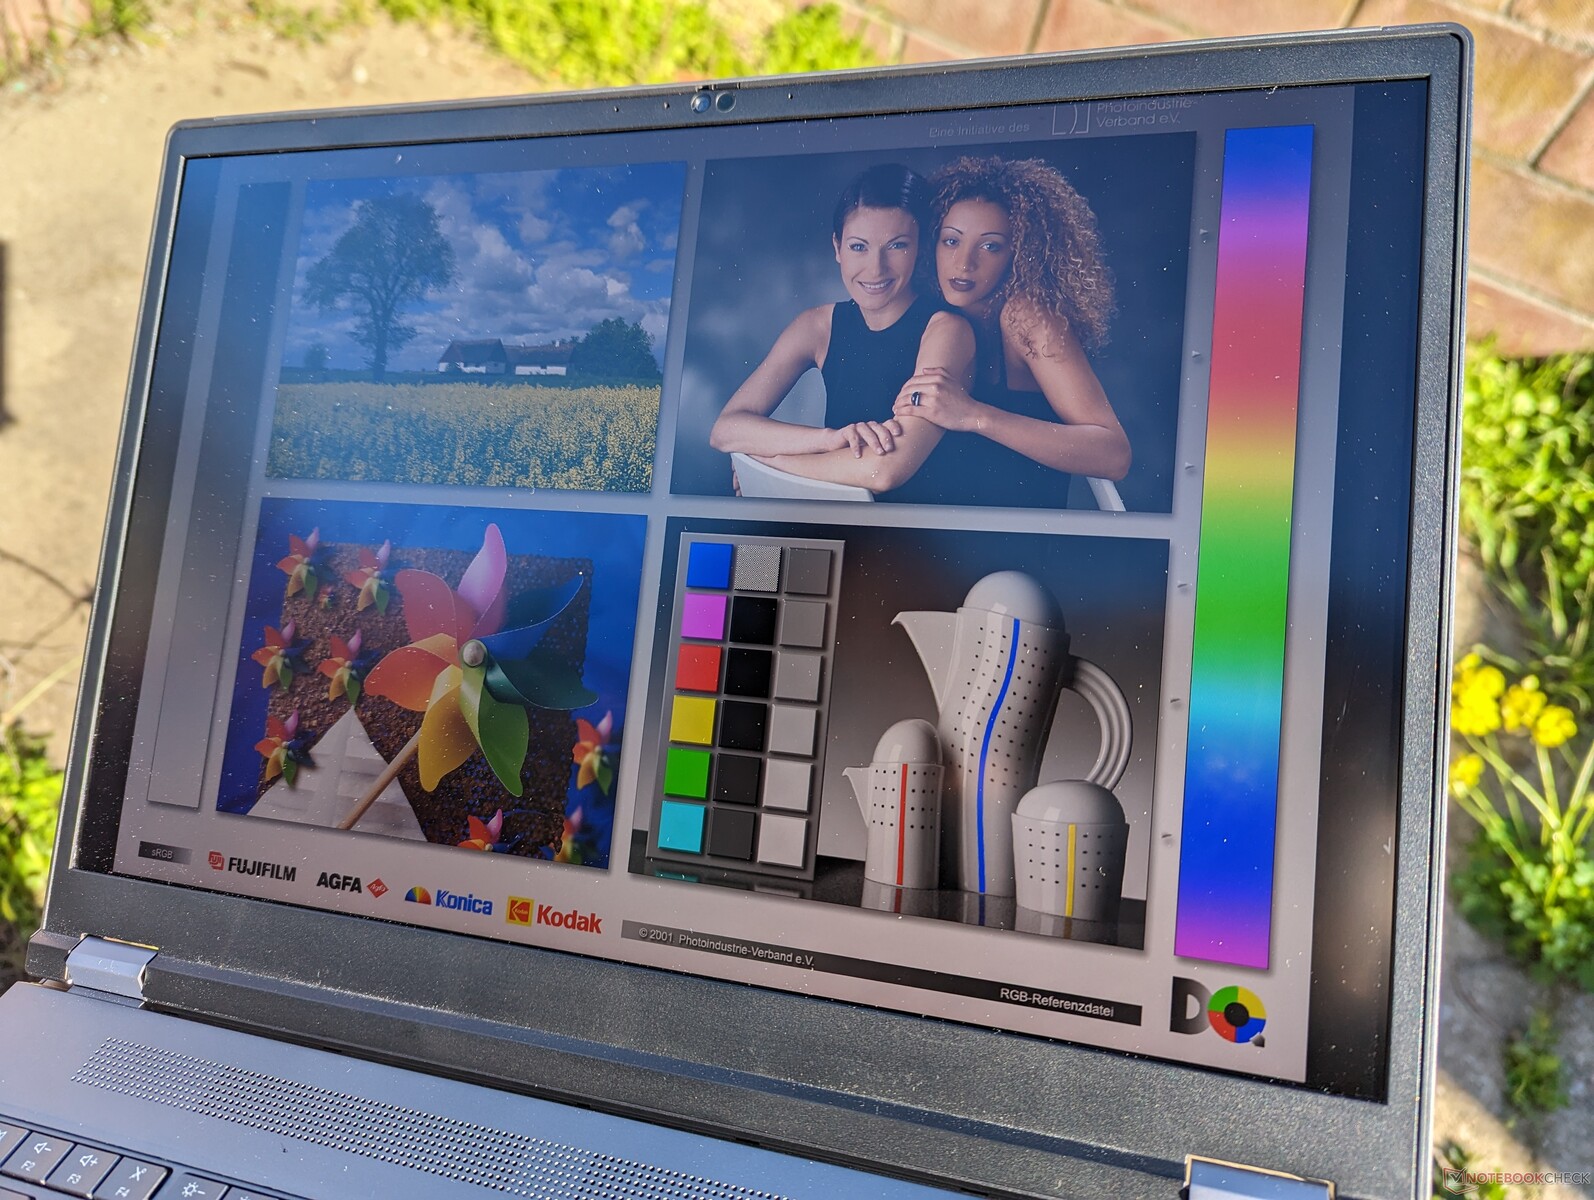
Mostrar
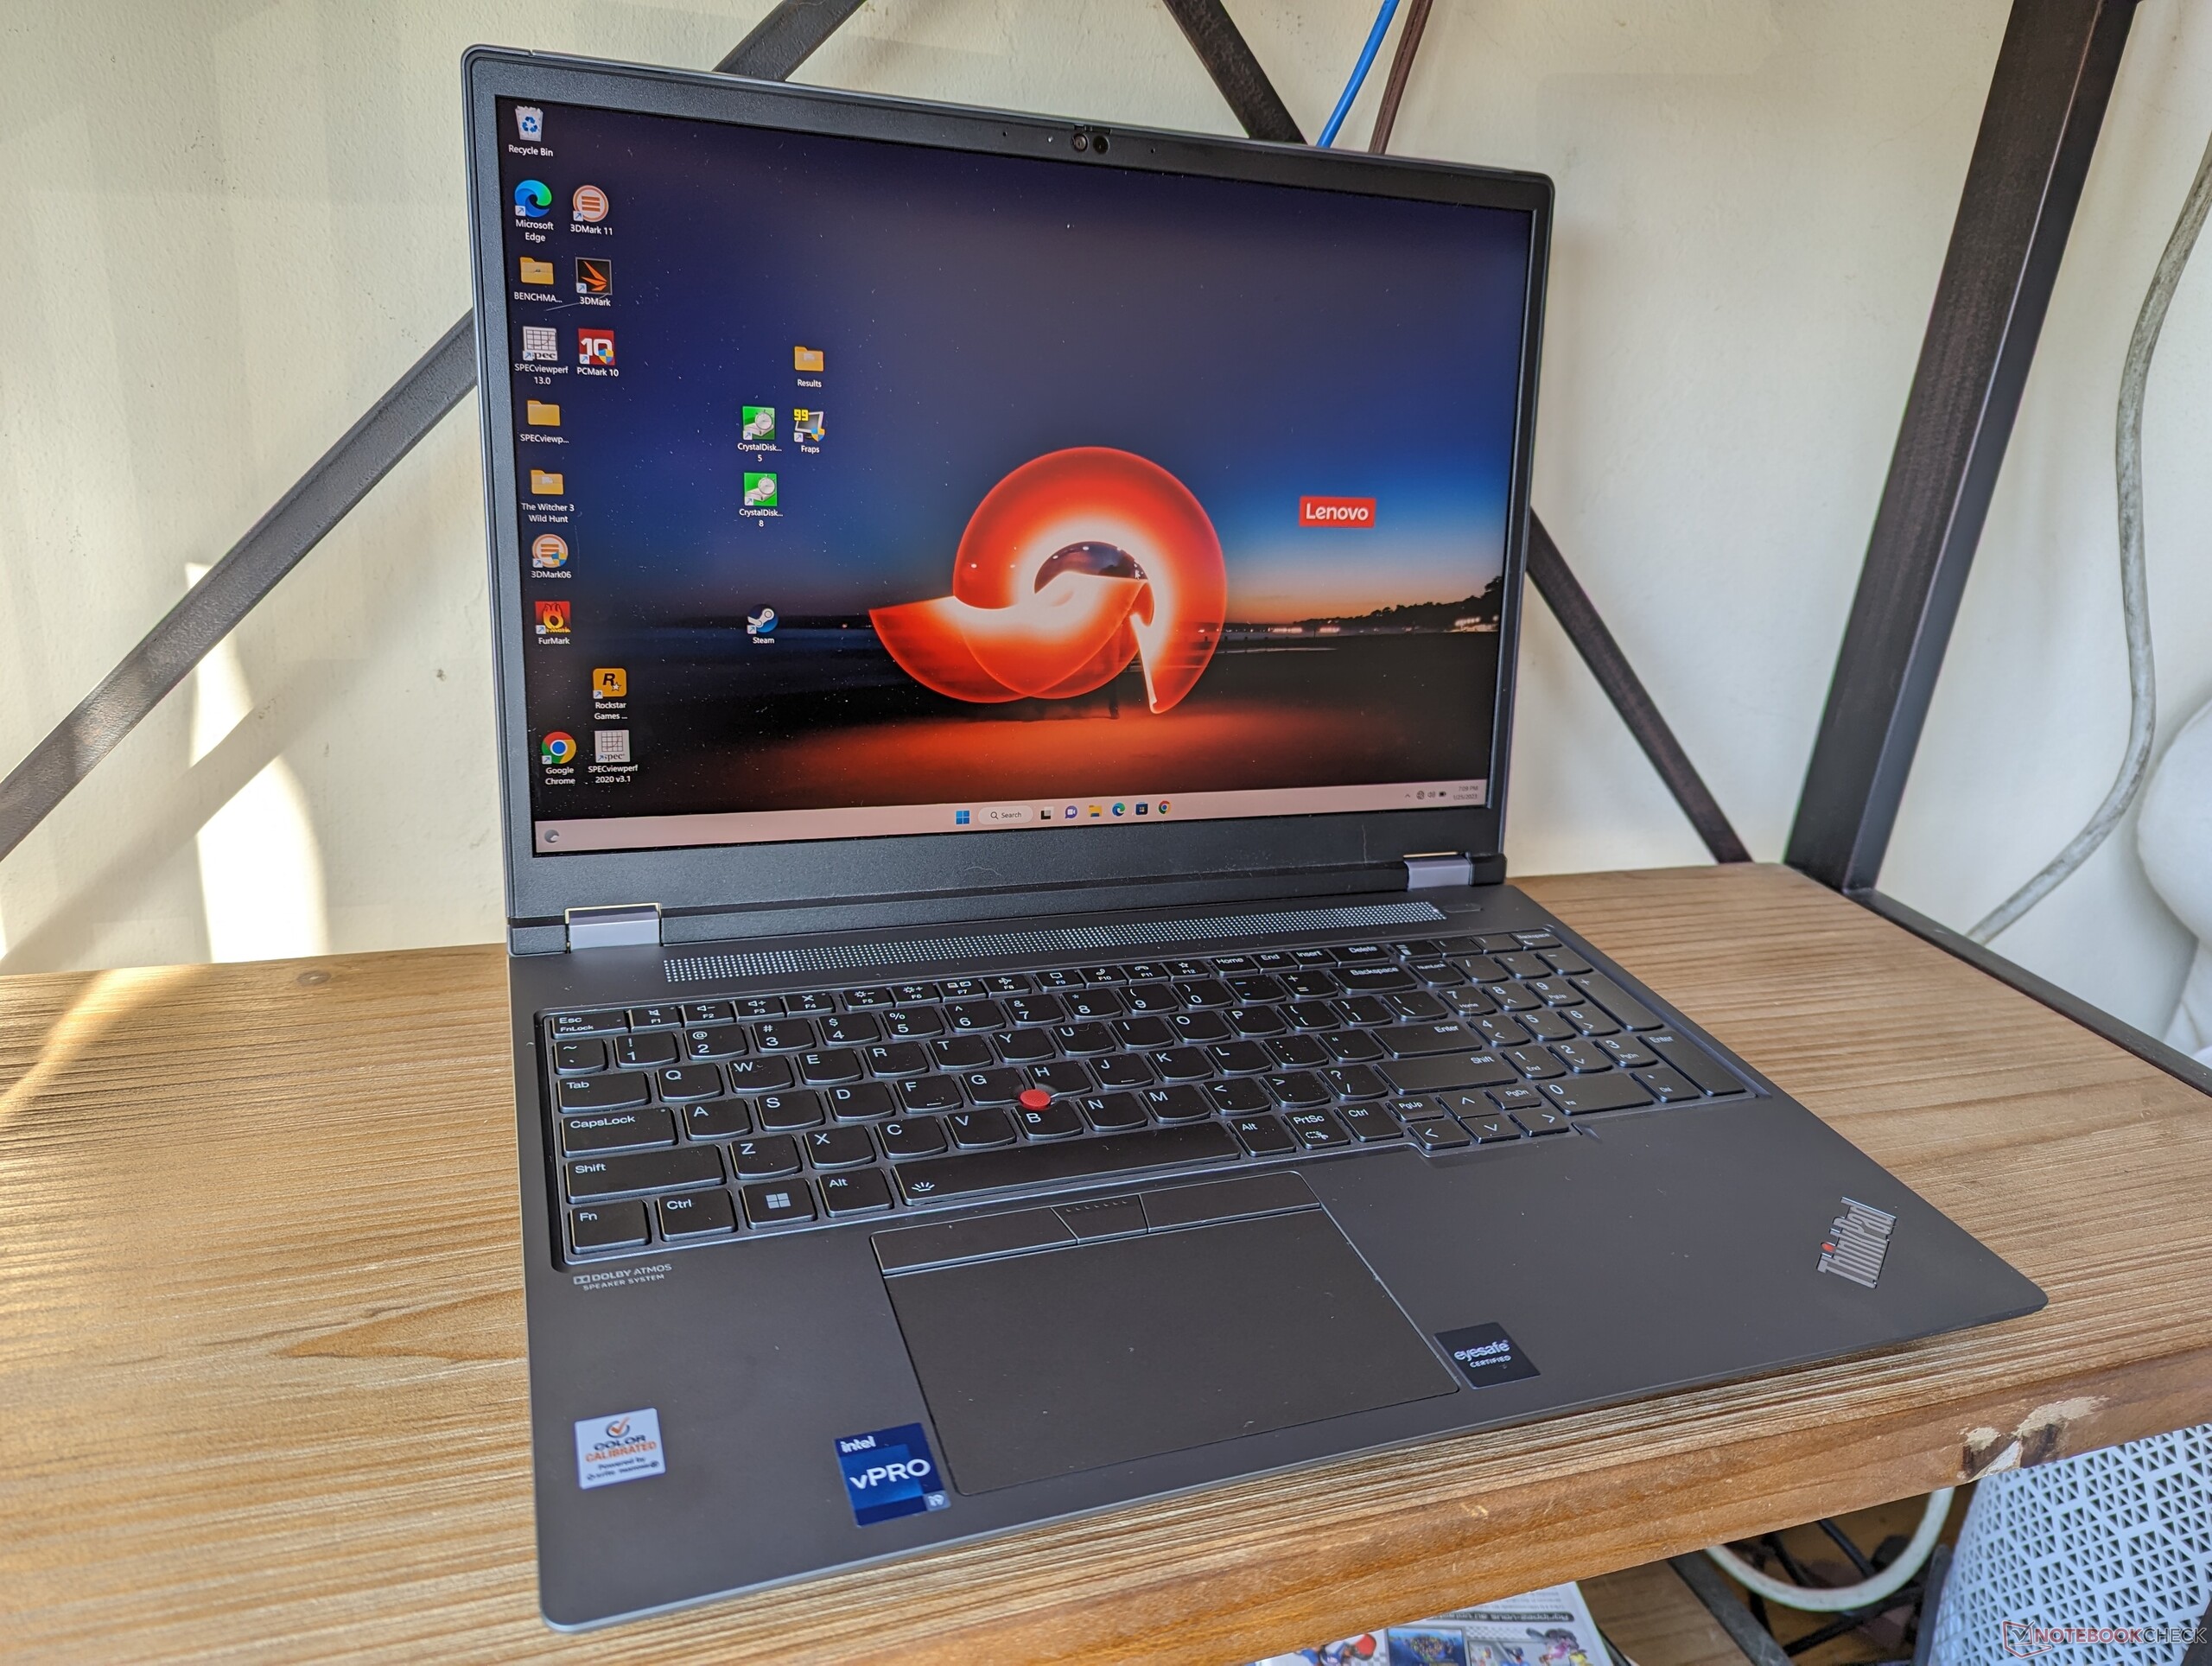
A Lenovo oferece quatro diferentes opções de exibição de 60 Hz, todas elas calibradas de fábrica em Pantone com escurecimento DC. Nossas medidas abaixo refletem apenas a opção arrojada, enquanto nossa segunda unidade com a GPU RTX A2000 vem equipada com a opção 1600p.
- 1920 x 1200, sem toque, IPS, 300-nits, fosco, 100% sRGB
- 2560 x 1600, sem toque, IPS, 400-nits, fosco, 100% sRGB
- 3840 x 2400, sem toque, IPS, 600-nits, fosco, 100% AdobeRGB
- 3840 x 2400, toque, OLED, 400-nits, brilhante, 100% DCI-P3
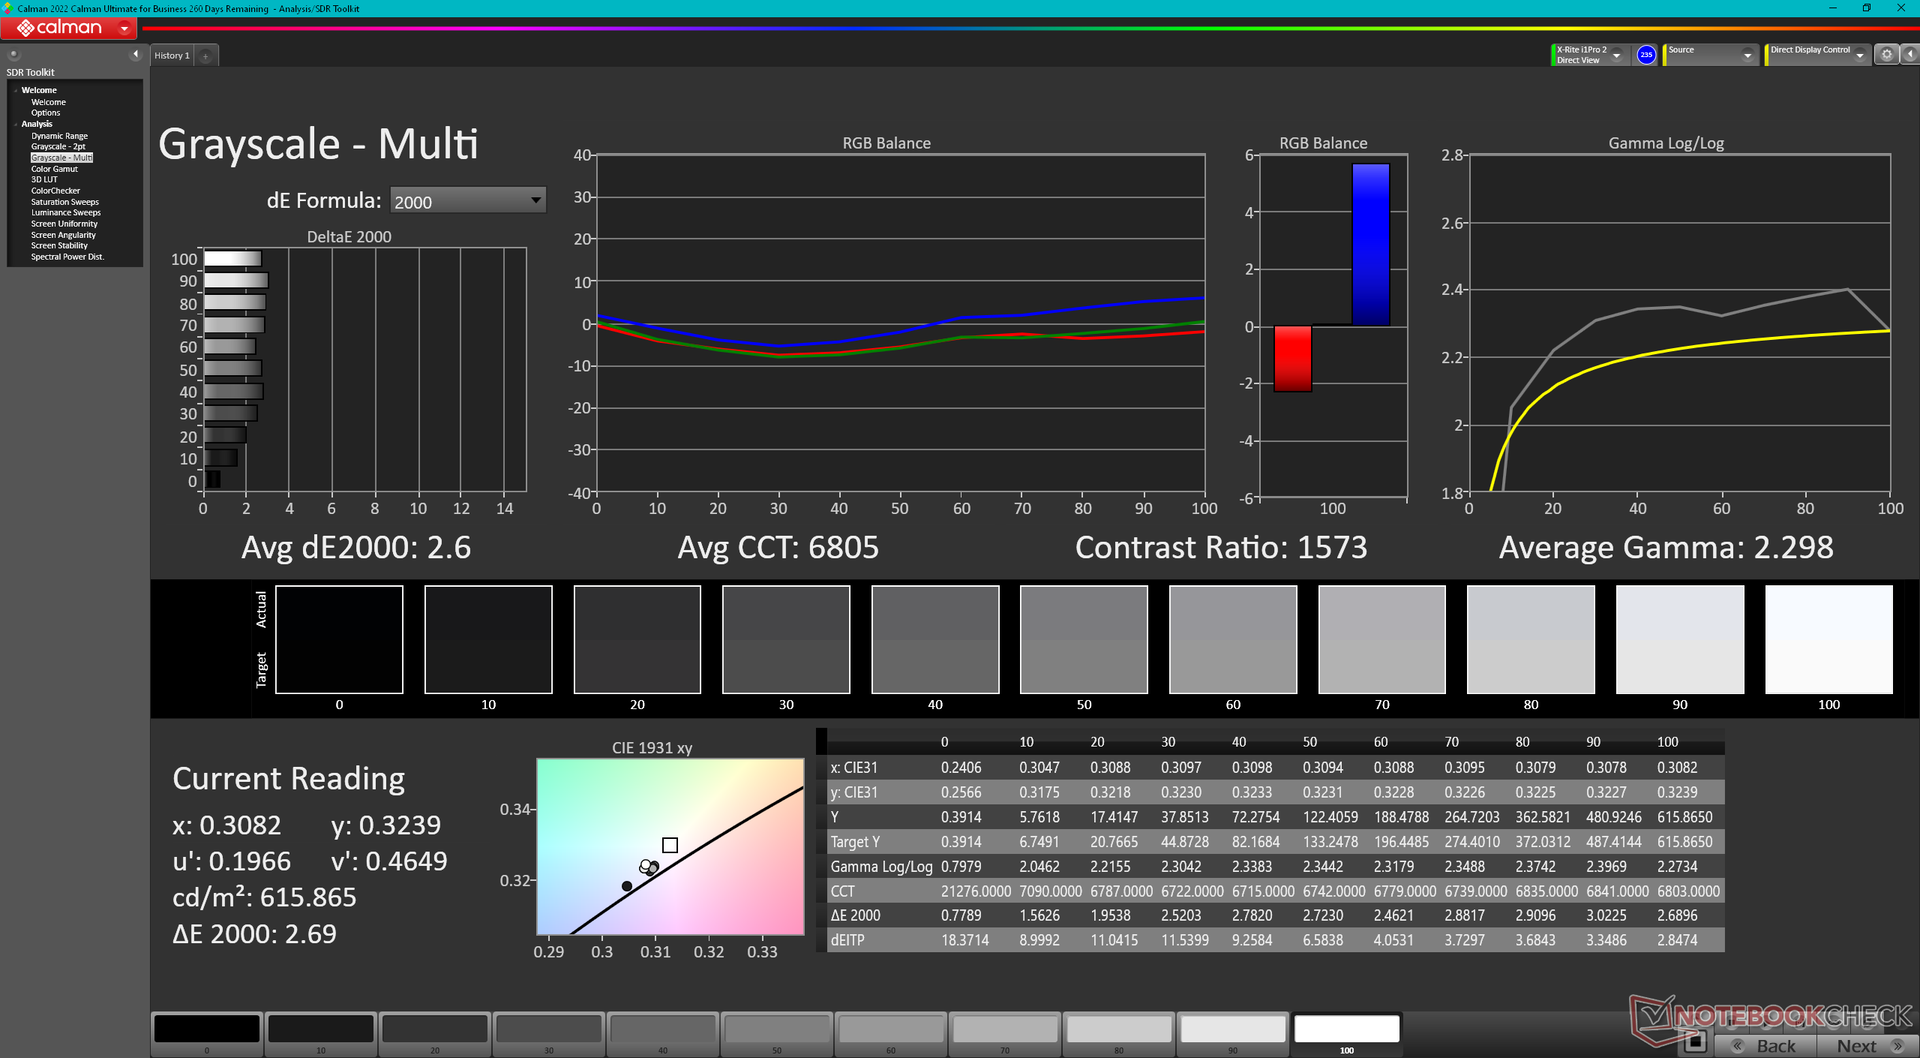
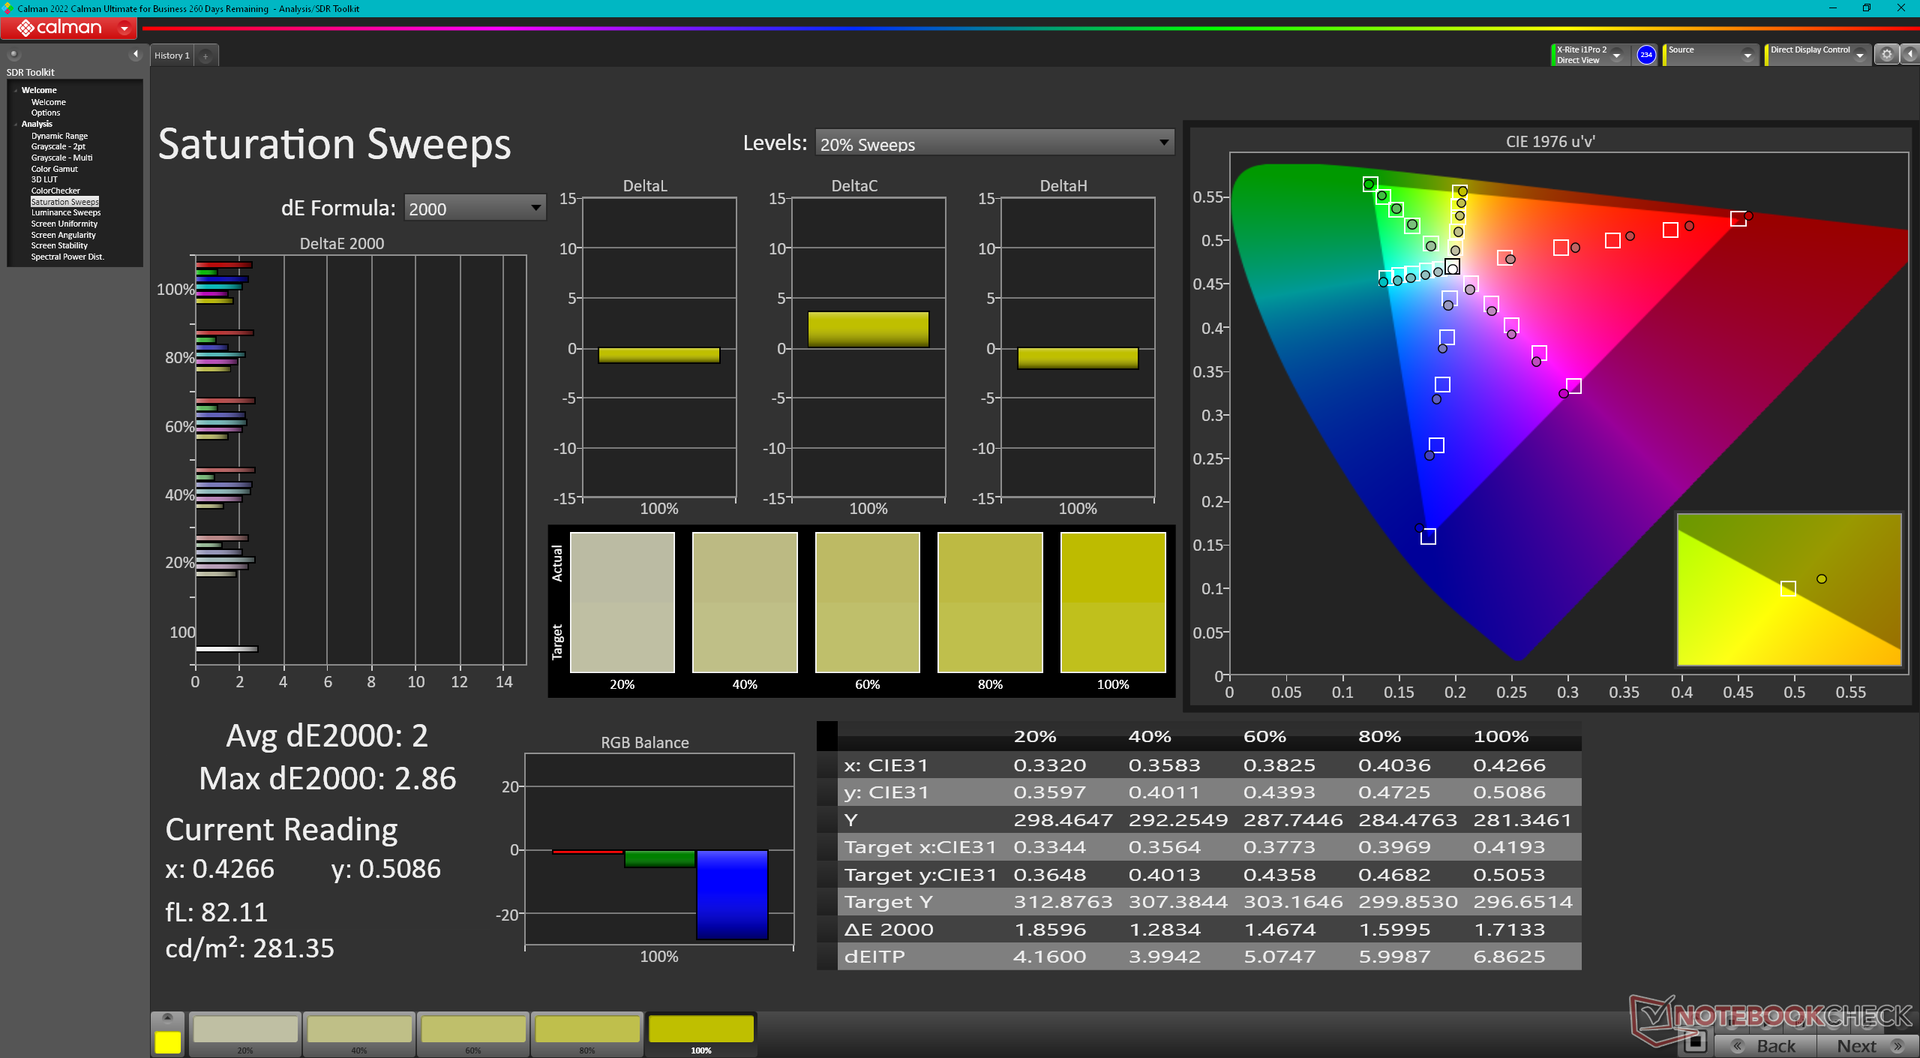
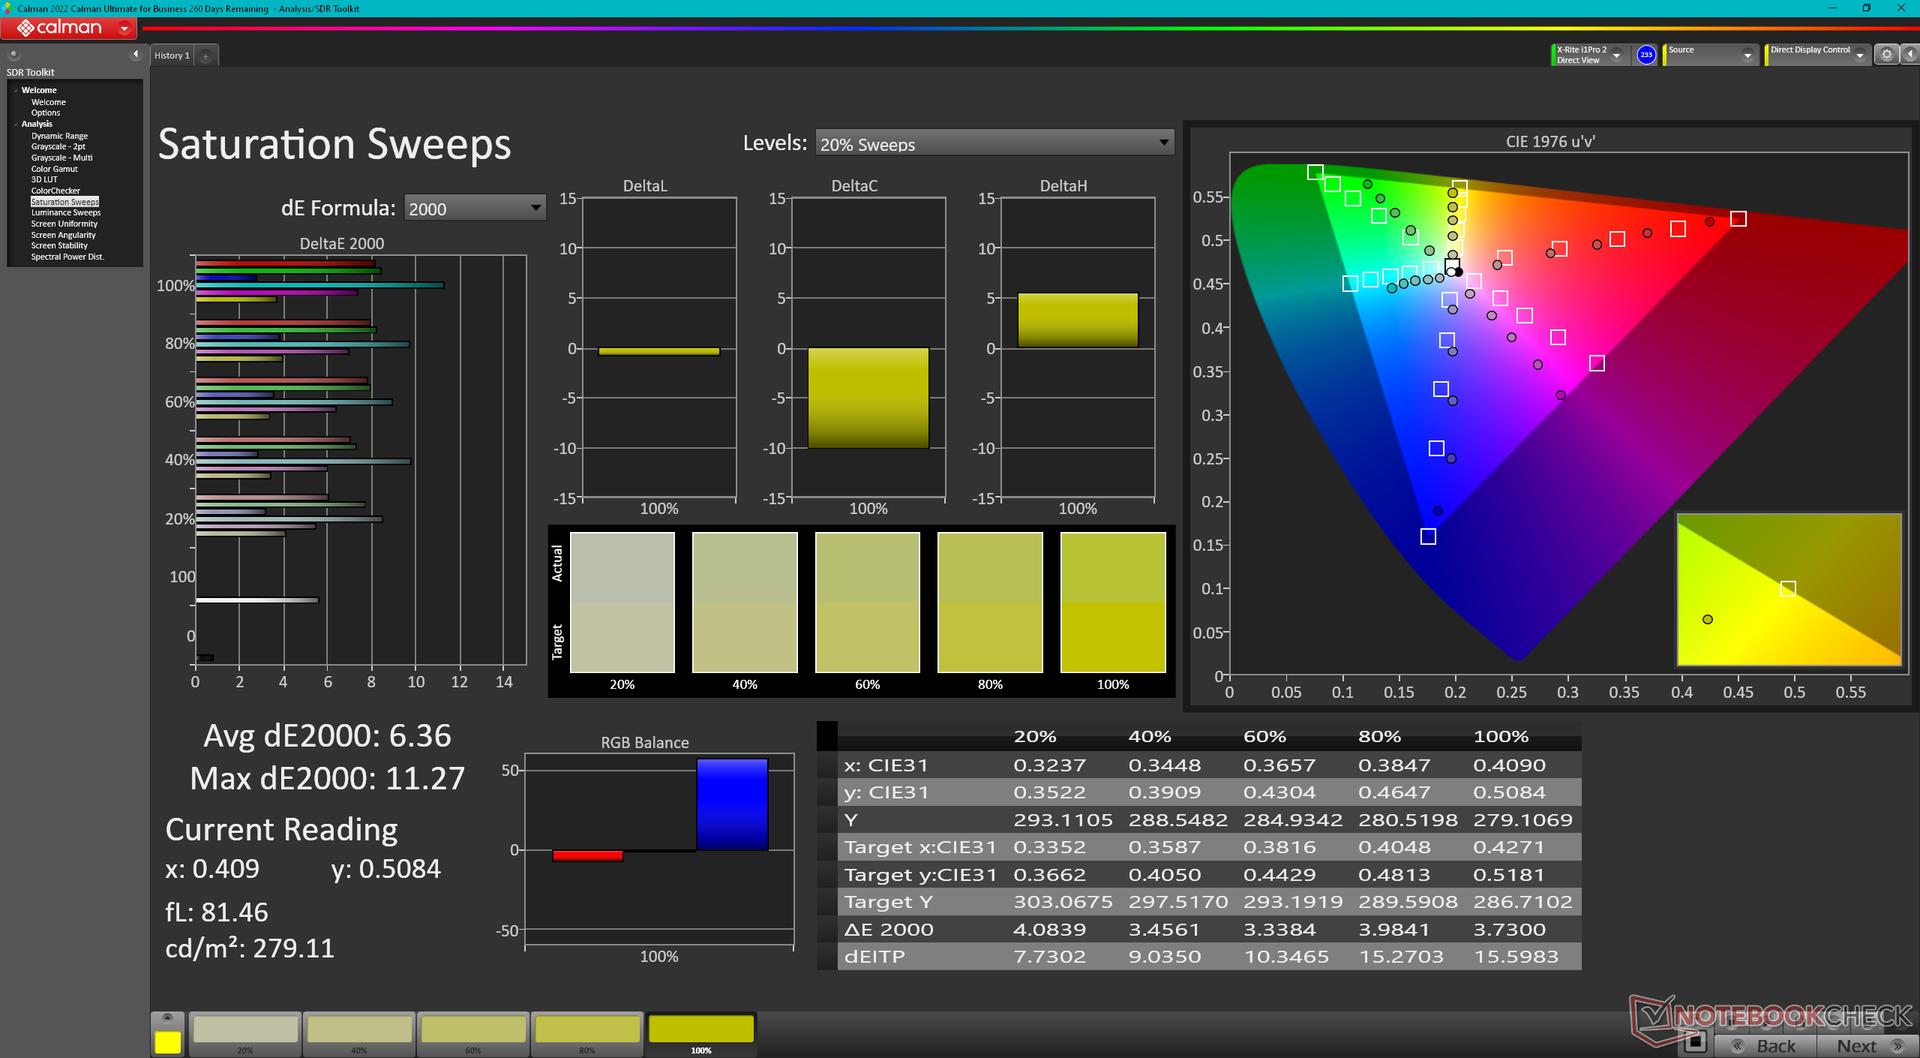
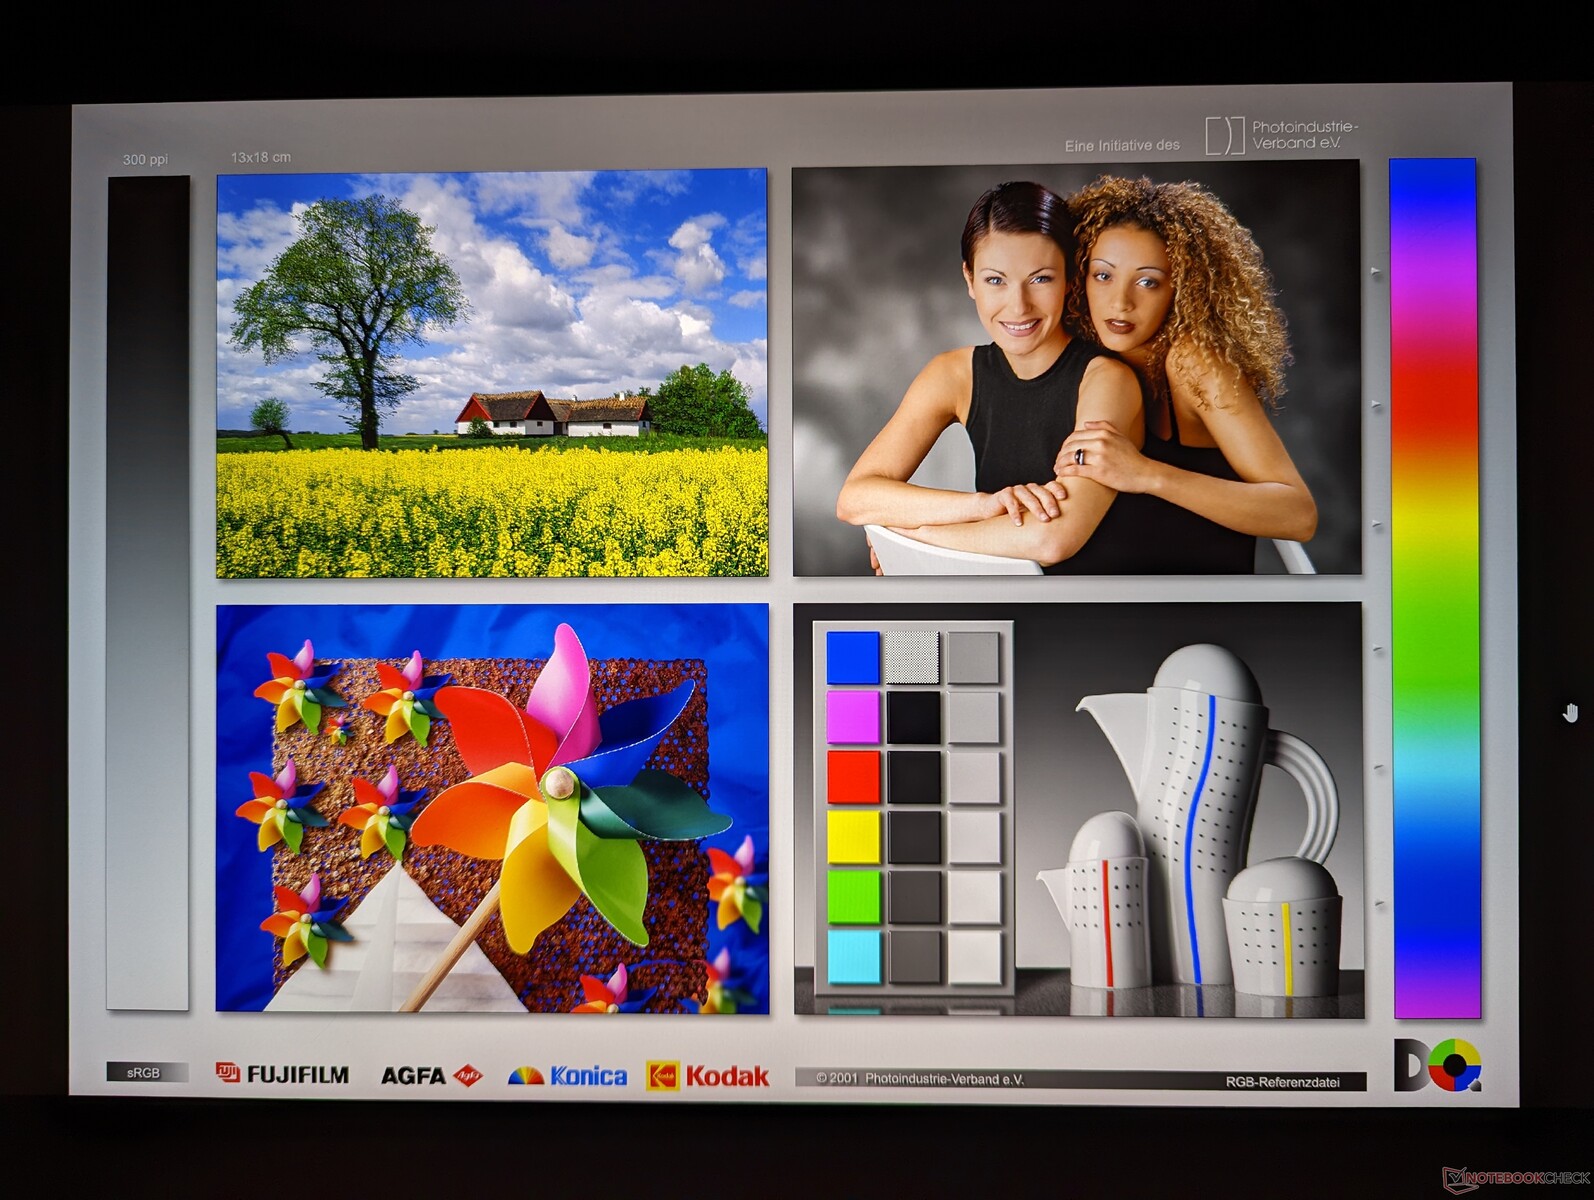
Nossas medidas independentes podem confirmar a cobertura total do AdobeRGB e o brilho de 600-nit. A distribuição de brilho, no entanto, é apenas média, apesar da meta de 600-nit. O quadrante superior esquerdo de nossa tela, por exemplo, é 29% mais brilhante do que o quadrante inferior direito (642 lêndeas contra 497 lêndeas). Optar pelo painel OLED melhoraria a distribuição de brilho, mas esperávamos melhor de nosso painel IPS ao considerar o preço pedido do ThinkPad P1 G1.
Vale notar que a Lenovo utiliza o mesmo painel IPS LP160UQ1-SPB1 no ThinkPad P1 G1 para seus outros modelos ThinkPad de 16 polegadas, incluindo oPensePad P1 G4 eThinkPad X1 Extreme G4.


| |||||||||||||||||||||||||
iluminação: 77 %
iluminação com acumulador: 601.9 cd/m²
Contraste: 1281:1 (Preto: 0.47 cd/m²)
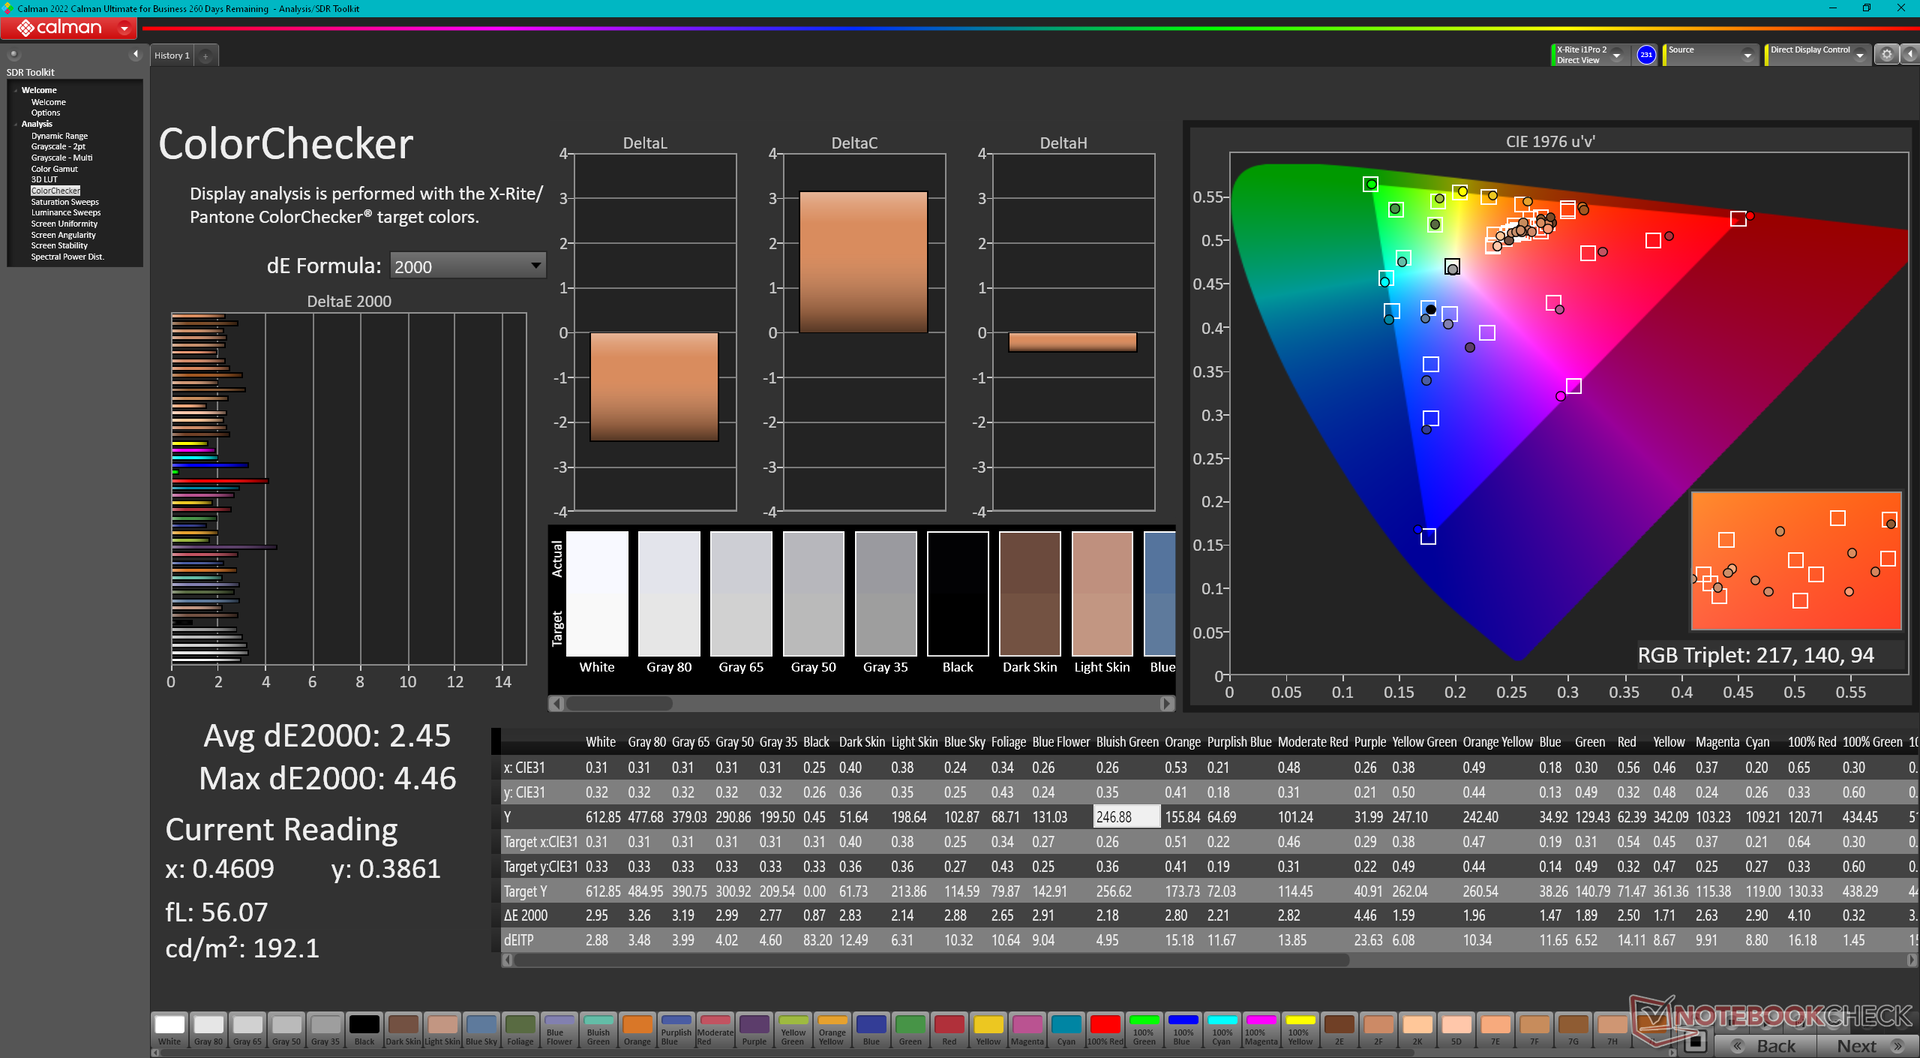
ΔE ColorChecker Calman: 2.45 | ∀{0.5-29.43 Ø4.71}
ΔE Greyscale Calman: 2.6 | ∀{0.09-98 Ø4.96}
95.9% AdobeRGB 1998 (Argyll 3D)
98.9% sRGB (Argyll 3D)
82.9% Display P3 (Argyll 3D)
Gamma: 2.3
CCT: 6805 K
| Lenovo ThinkPad P16 G1 RTX A5500 LP160UQ1-SPB1, IPS, 3840x2400, 16" | Asus ProArt StudioBook 16 W7600H5A-2BL2 ATNA60YV02-0, OLED, 3840x2400, 16" | Dell Precision 7000 7670 Performance Samsung 160YV03, OLED, 3840x2400, 16" | Lenovo ThinkPad P16 G1 21D6001DMB NE160QDM-N63 , IPS LED, 2560x1600, 16" | MSI CreatorPro Z16P B12UKST B160QAN02.N, IPS, 2560x1600, 16" | HP ZBook Studio 16 G9 62U04EA BOE0A52, IPS, 3840x2400, 16" | |
|---|---|---|---|---|---|---|
| Display | 8% | 8% | -12% | 3% | 3% | |
| Display P3 Coverage (%) | 82.9 | 99.9 21% | 99.9 21% | 71.5 -14% | 97.6 18% | 97.5 18% |
| sRGB Coverage (%) | 98.9 | 100 1% | 100 1% | 100 1% | 99.9 1% | 99.9 1% |
| AdobeRGB 1998 Coverage (%) | 95.9 | 98.6 3% | 98.1 2% | 73.3 -24% | 87.4 -9% | 86.3 -10% |
| Response Times | 96% | 96% | 23% | 76% | 75% | |
| Response Time Grey 50% / Grey 80% * (ms) | 45.6 ? | 2 ? 96% | 1.84 ? 96% | 37.7 ? 17% | 12.8 ? 72% | 15.3 ? 66% |
| Response Time Black / White * (ms) | 36.8 ? | 2 ? 95% | 1.92 ? 95% | 26.3 ? 29% | 7.4 ? 80% | 6.1 ? 83% |
| PWM Frequency (Hz) | 240 ? | 59.52 ? | ||||
| Screen | -2% | -36% | -4% | 9% | 16% | |
| Brightness middle (cd/m²) | 601.9 | 353 -41% | 325.2 -46% | 424 -30% | 407 -32% | 554 -8% |
| Brightness (cd/m²) | 569 | 360 -37% | 328 -42% | 398 -30% | 388 -32% | 516 -9% |
| Brightness Distribution (%) | 77 | 96 25% | 97 26% | 90 17% | 88 14% | 84 9% |
| Black Level * (cd/m²) | 0.47 | 0.24 49% | 0.36 23% | 0.47 -0% | ||
| Contrast (:1) | 1281 | 1767 38% | 1131 -12% | 1179 -8% | ||
| Colorchecker dE 2000 * | 2.45 | 2.45 -0% | 4.59 -87% | 2.6 -6% | 1.3 47% | 1 59% |
| Colorchecker dE 2000 max. * | 4.46 | 3.75 16% | 7.65 -72% | 4.9 -10% | 2.5 44% | 2.4 46% |
| Greyscale dE 2000 * | 2.6 | 1.88 28% | 2.5 4% | 4.1 -58% | 2.1 19% | 1.6 38% |
| Gamma | 2.3 96% | 2.31 95% | 2.1 105% | 2.13 103% | 2.26 97% | 2.29 96% |
| CCT | 6805 96% | 6441 101% | 6541 99% | 7252 90% | 6437 101% | 6458 101% |
| Colorchecker dE 2000 calibrated * | 2.77 | 0.8 | 0.7 | 0.6 | ||
| Média Total (Programa/Configurações) | 34% /
19% | 23% /
-0% | 2% /
-2% | 29% /
18% | 31% /
22% |
* ... menor é melhor
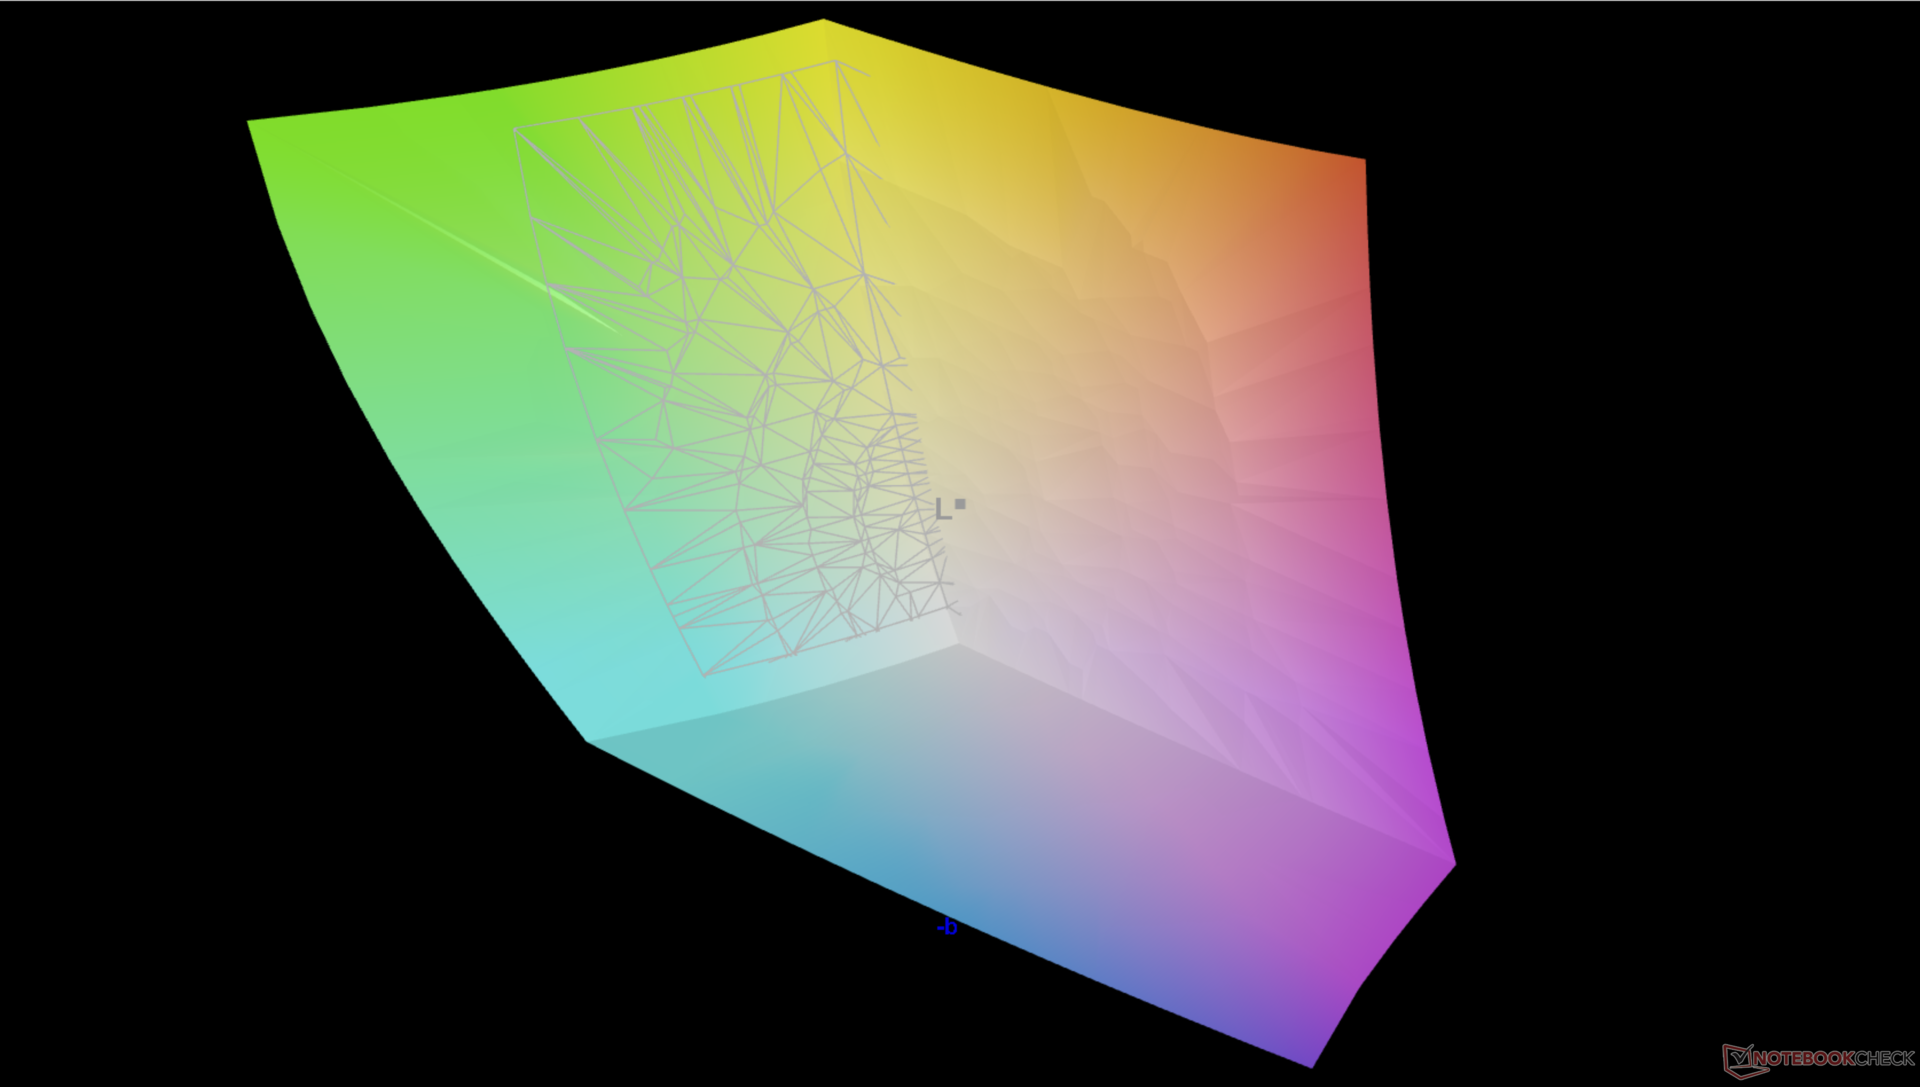
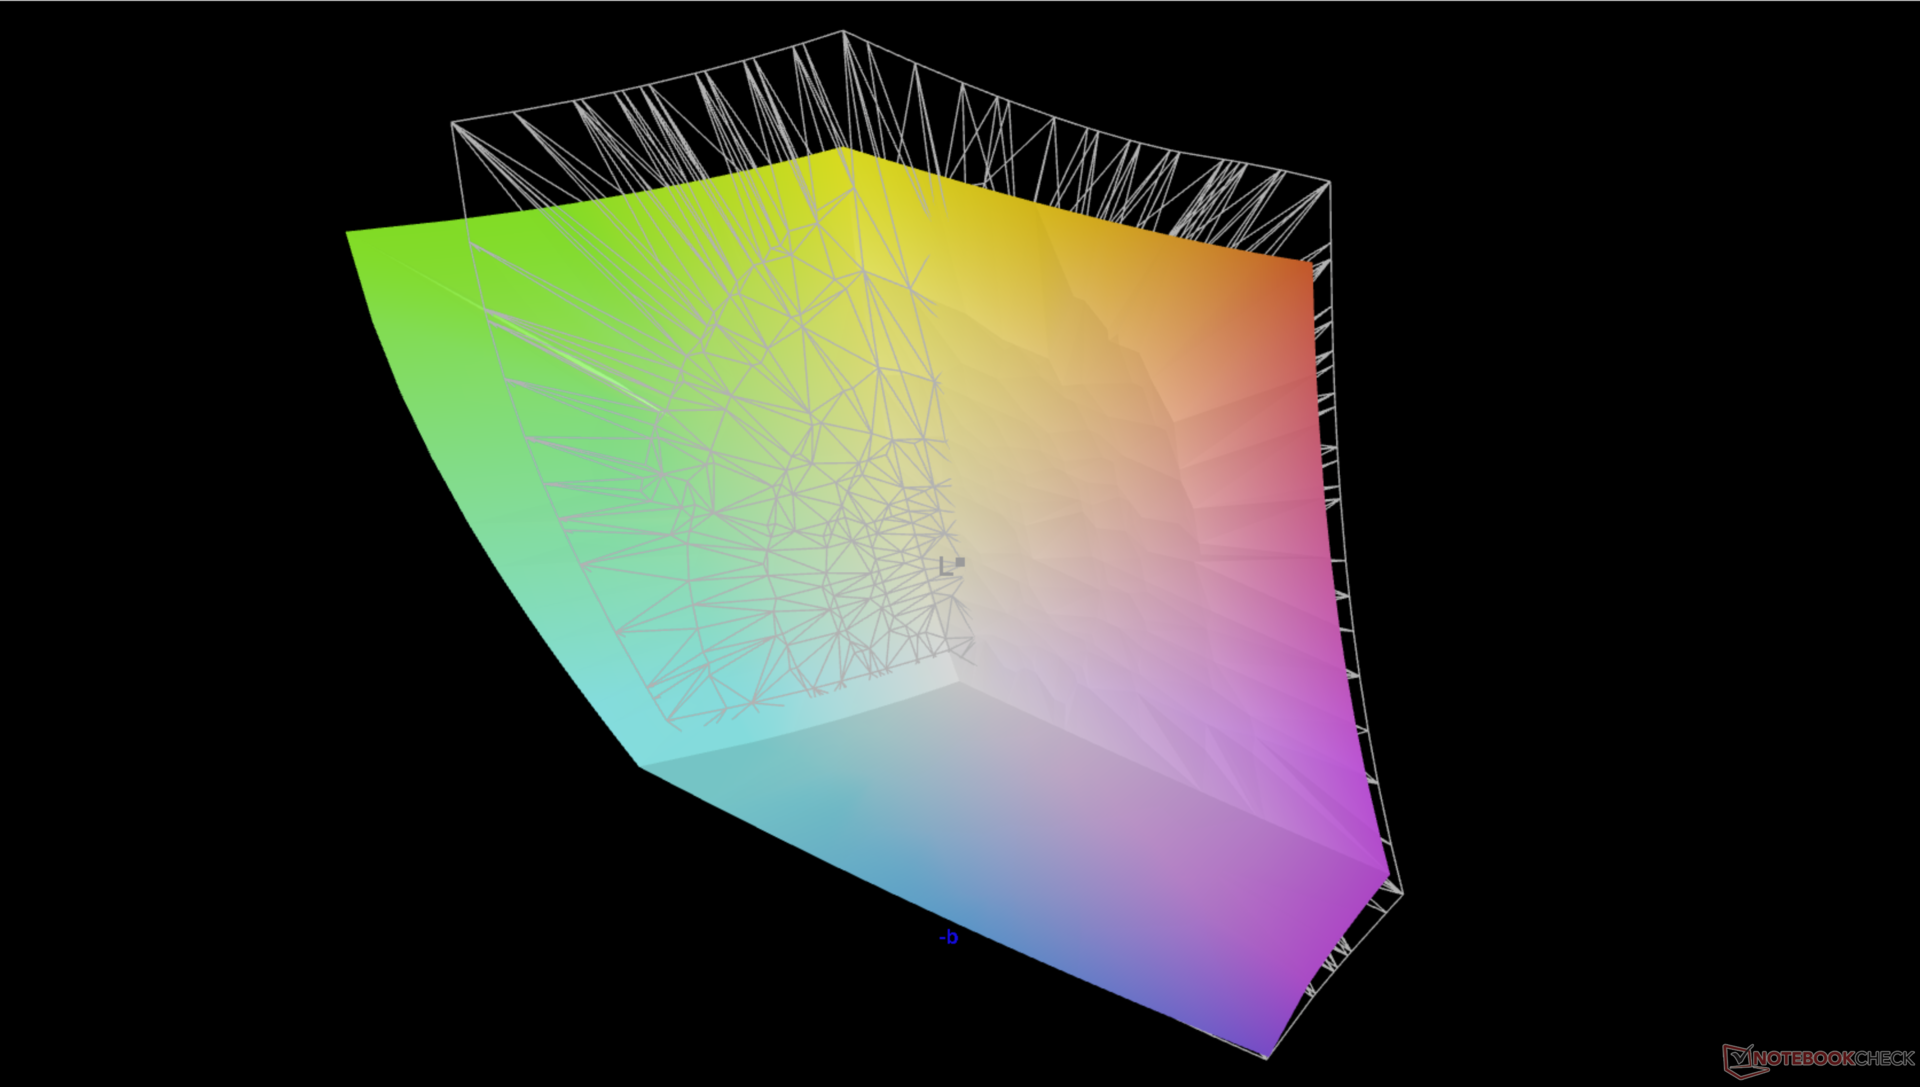
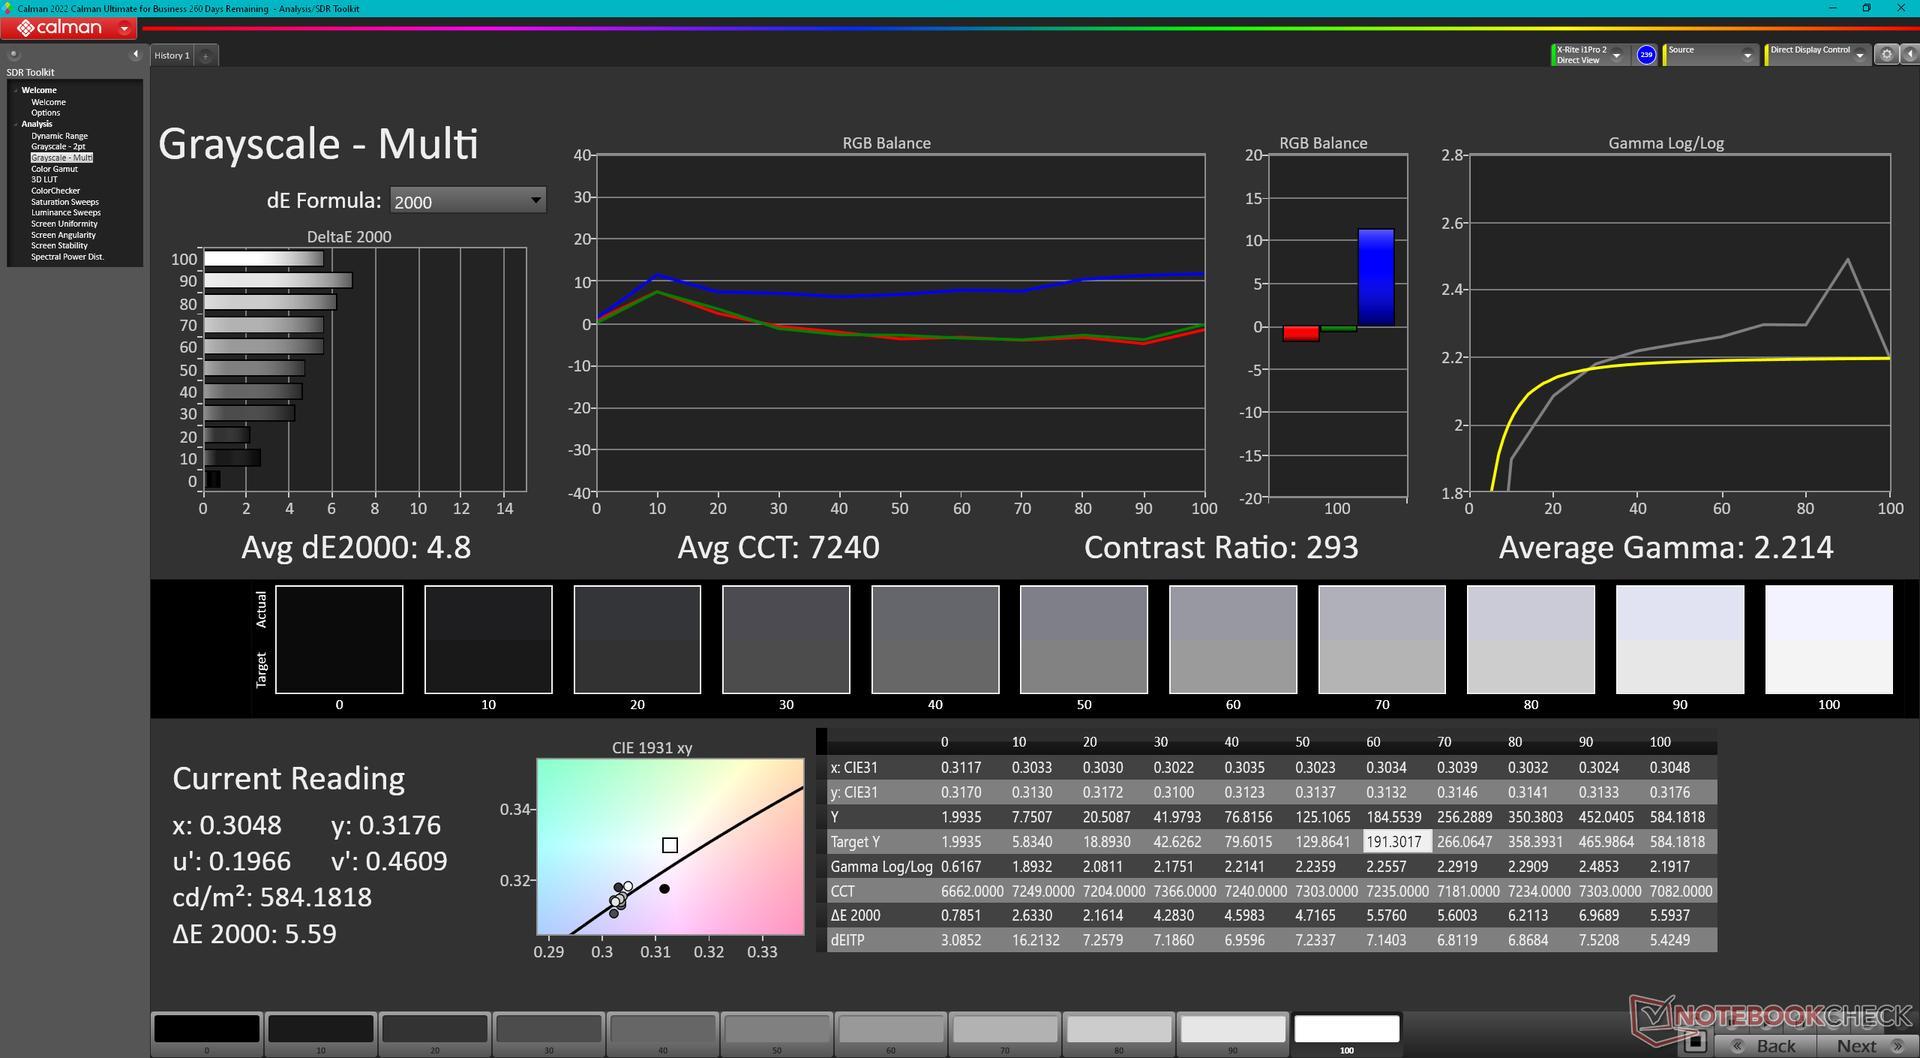
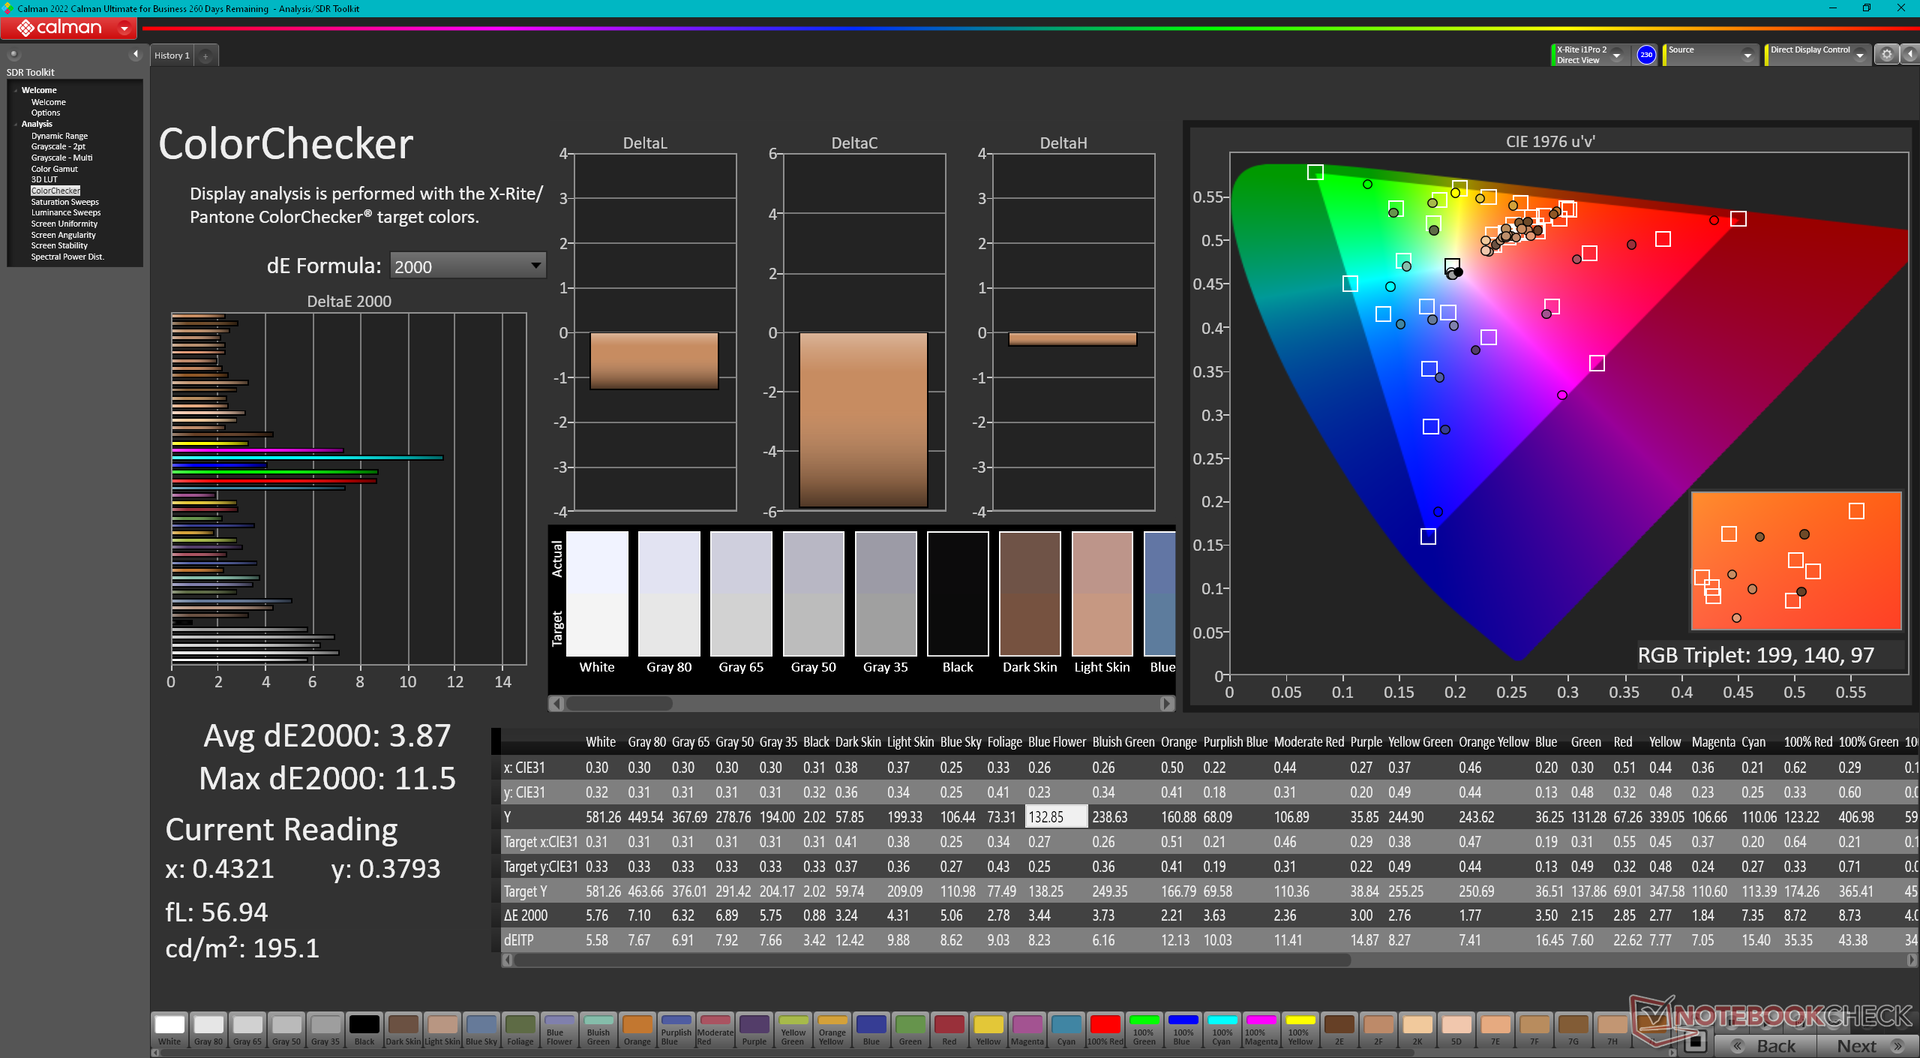
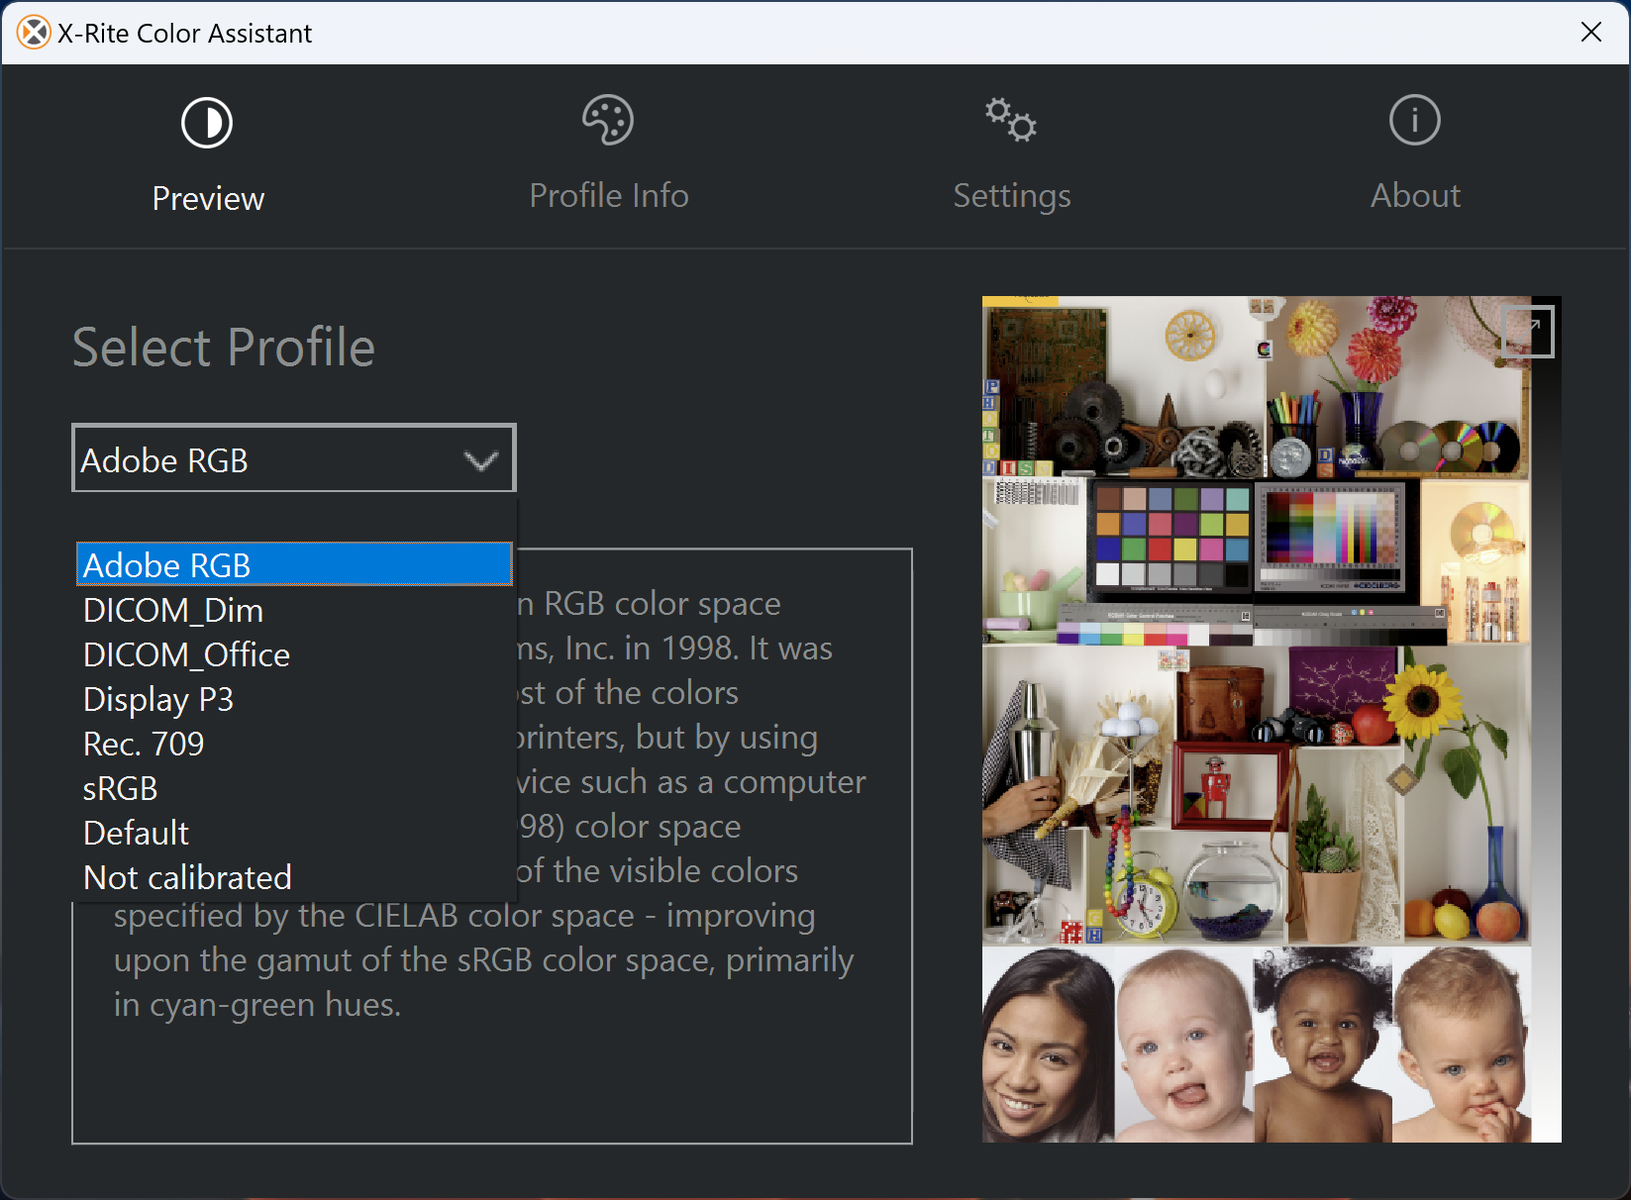
O perfil de cor pode ser alterado através do software X-Rite Color Assistant pré-instalado. Parece ser um buggy no momento, já que as cores não são tão precisas como deveriam ser, apesar da cobertura completa do AdobeRGB de nosso painel. Quando ajustado para o modo sRGB, por exemplo, os valores médios de escala de cinza e deltaE de cor seriam apenas 2,6 e 2,45, respectivamente, em comparação com 4,8 e 3,87 quando ajustado para o modo AdobeRGB.
Exibir tempos de resposta
| ↔ Tempo de resposta preto para branco | ||
|---|---|---|
| 36.8 ms ... ascensão ↗ e queda ↘ combinadas | ↗ 19.6 ms ascensão | 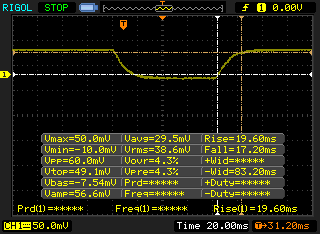 |
| ↘ 17.2 ms queda | ||
| A tela mostra taxas de resposta lentas em nossos testes e será insatisfatória para os jogadores. Em comparação, todos os dispositivos testados variam de 0.1 (mínimo) a 240 (máximo) ms. » 95 % de todos os dispositivos são melhores. Isso significa que o tempo de resposta medido é pior que a média de todos os dispositivos testados (19.8 ms). | ||
| ↔ Tempo de resposta 50% cinza a 80% cinza | ||
| 45.6 ms ... ascensão ↗ e queda ↘ combinadas | ↗ 21.2 ms ascensão | 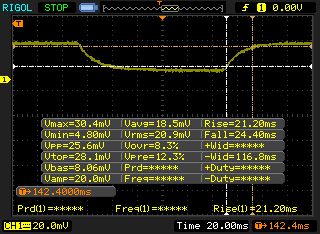 |
| ↘ 24.4 ms queda | ||
| A tela mostra taxas de resposta lentas em nossos testes e será insatisfatória para os jogadores. Em comparação, todos os dispositivos testados variam de 0.165 (mínimo) a 636 (máximo) ms. » 78 % de todos os dispositivos são melhores. Isso significa que o tempo de resposta medido é pior que a média de todos os dispositivos testados (31 ms). | ||
Cintilação da tela / PWM (modulação por largura de pulso)
| Tela tremeluzindo / PWM não detectado | 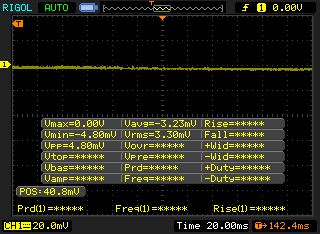 | ||
[pwm_comparison] Em comparação: 52 % de todos os dispositivos testados não usam PWM para escurecer a tela. Se PWM foi detectado, uma média de 7754 (mínimo: 5 - máximo: 343500) Hz foi medida. | |||
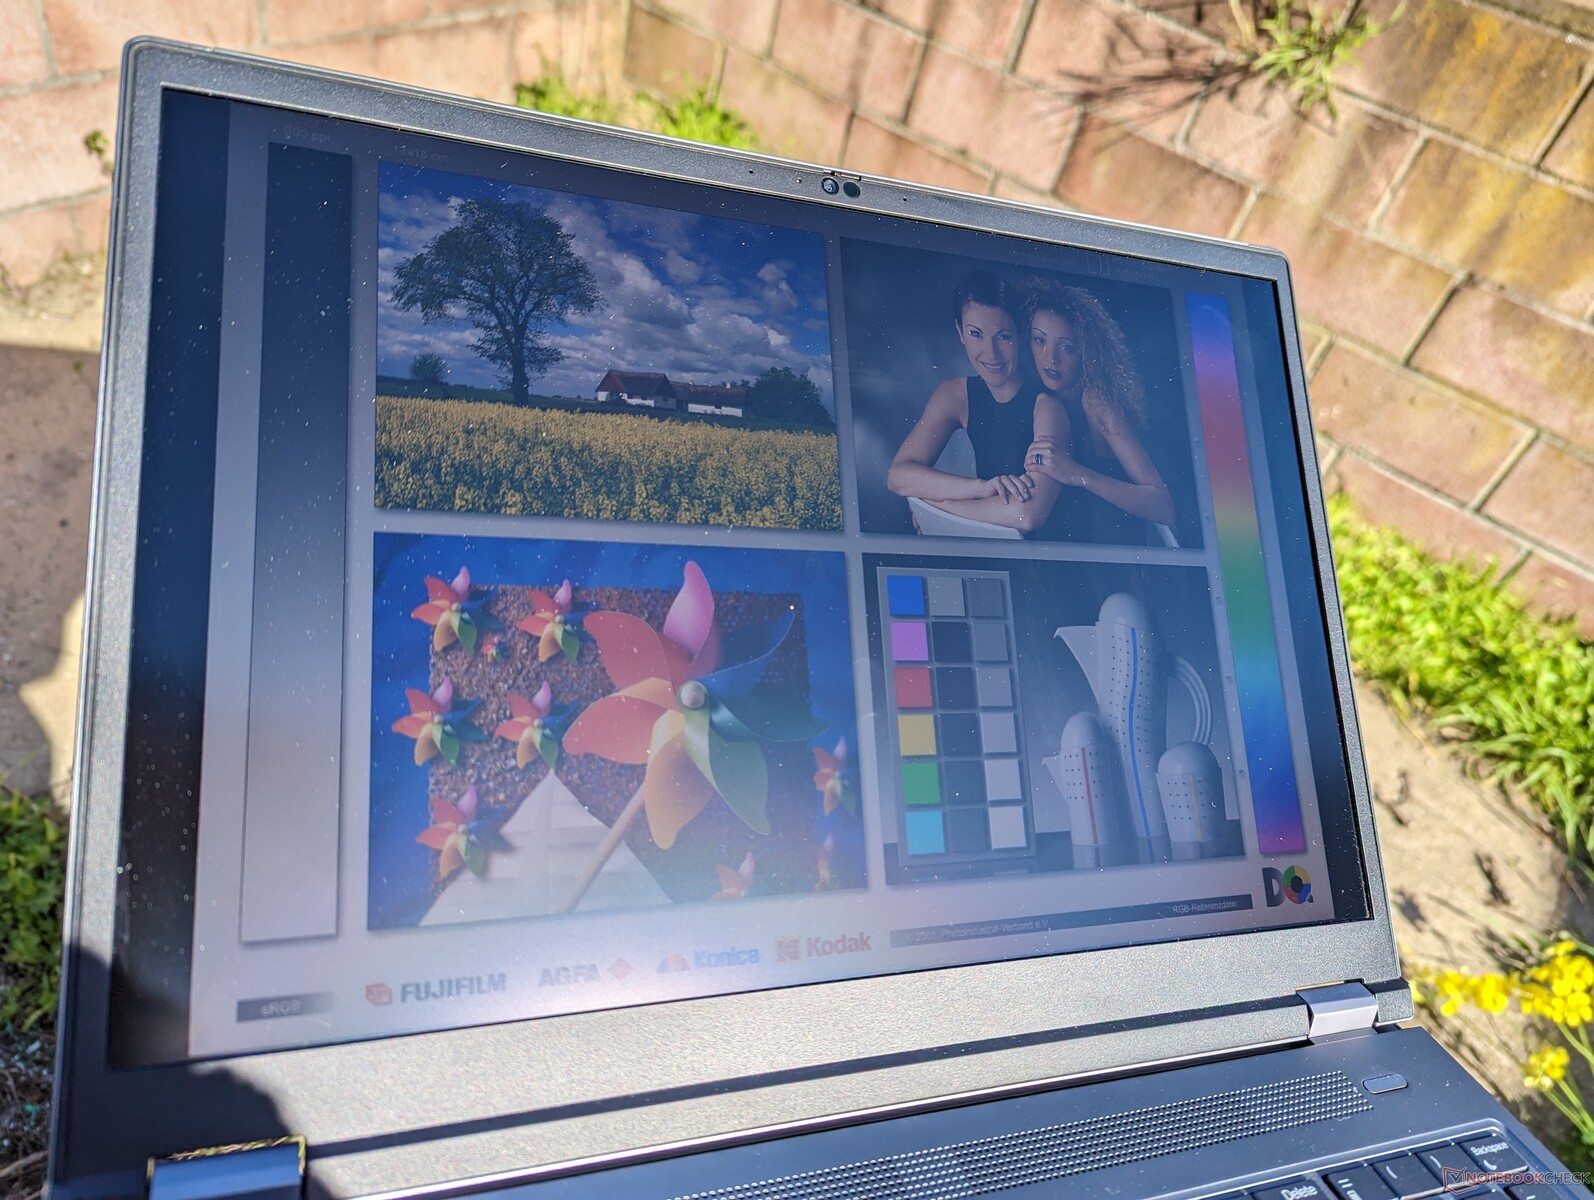
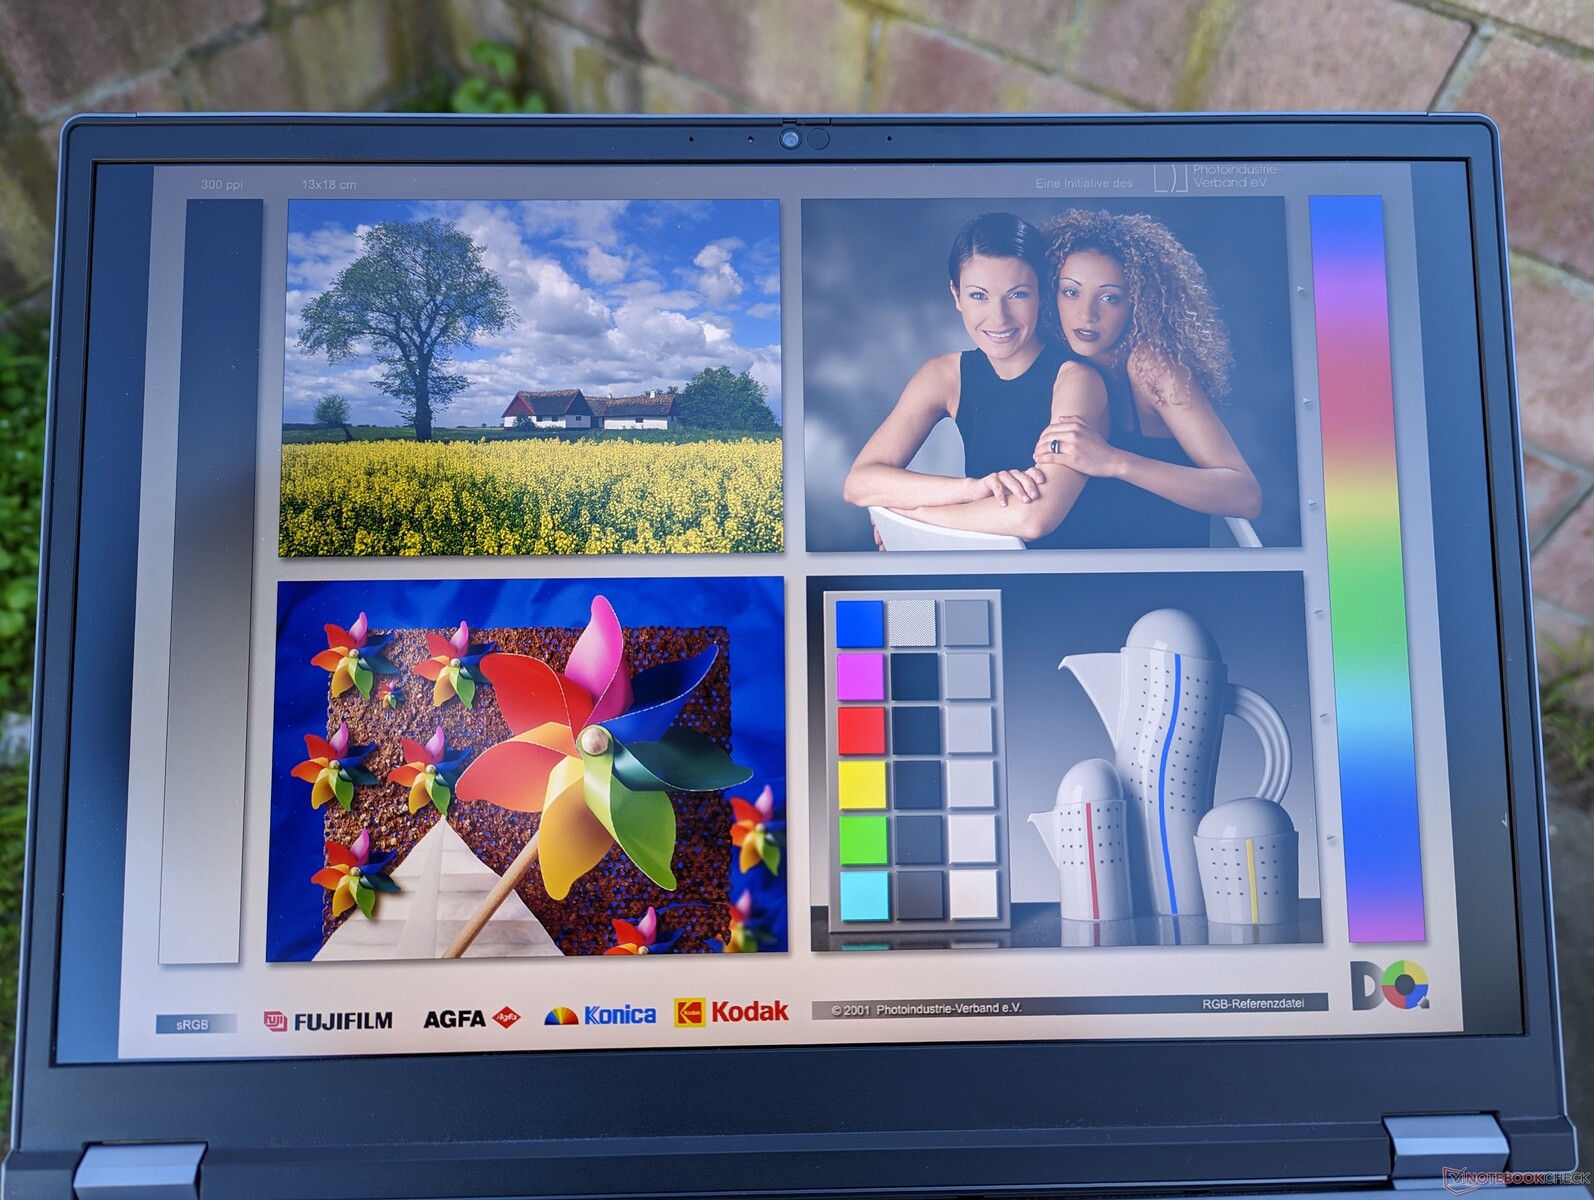
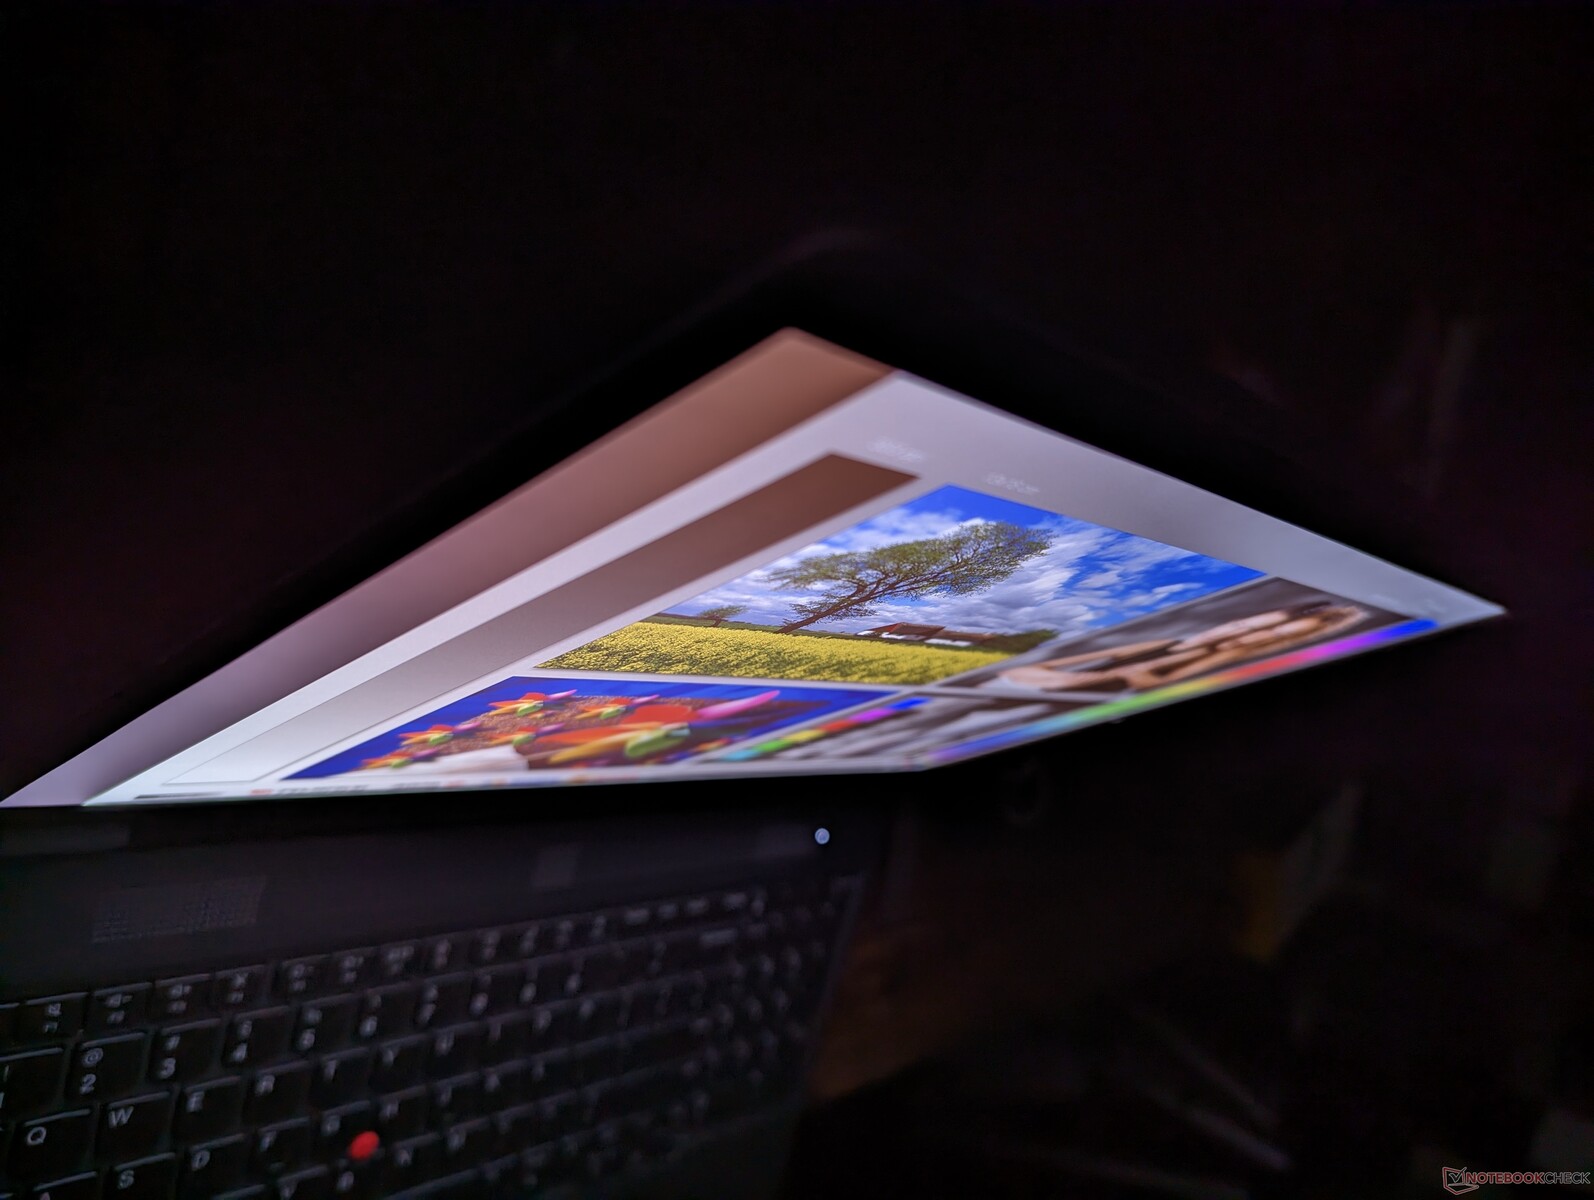
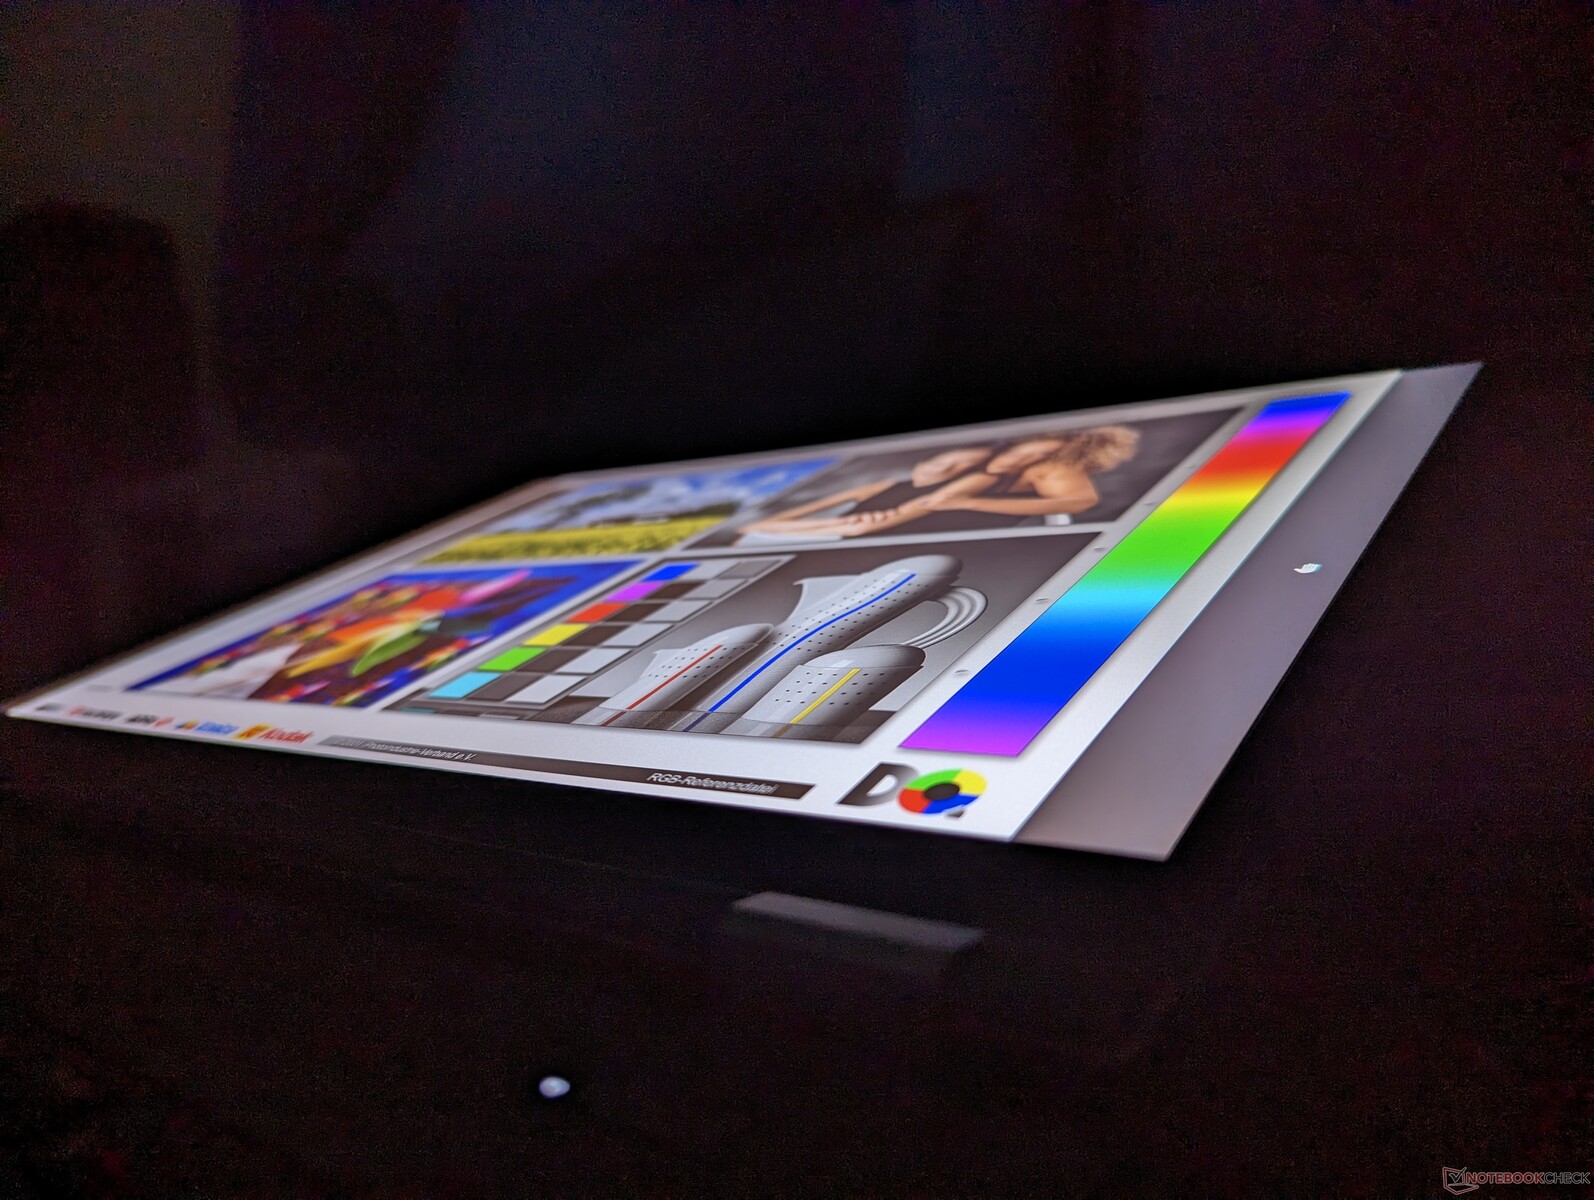
A visibilidade externa é decente, pois o visor é mais brilhante do que na maioria dos outros laptops onde a faixa de 300 a 400 nit é mais comum. No entanto, ainda é recomendado trabalhar sob sombra sempre que possível, pois a luz solar direta degradará a qualidade e as cores da imagem.
Desempenho
Condições de teste
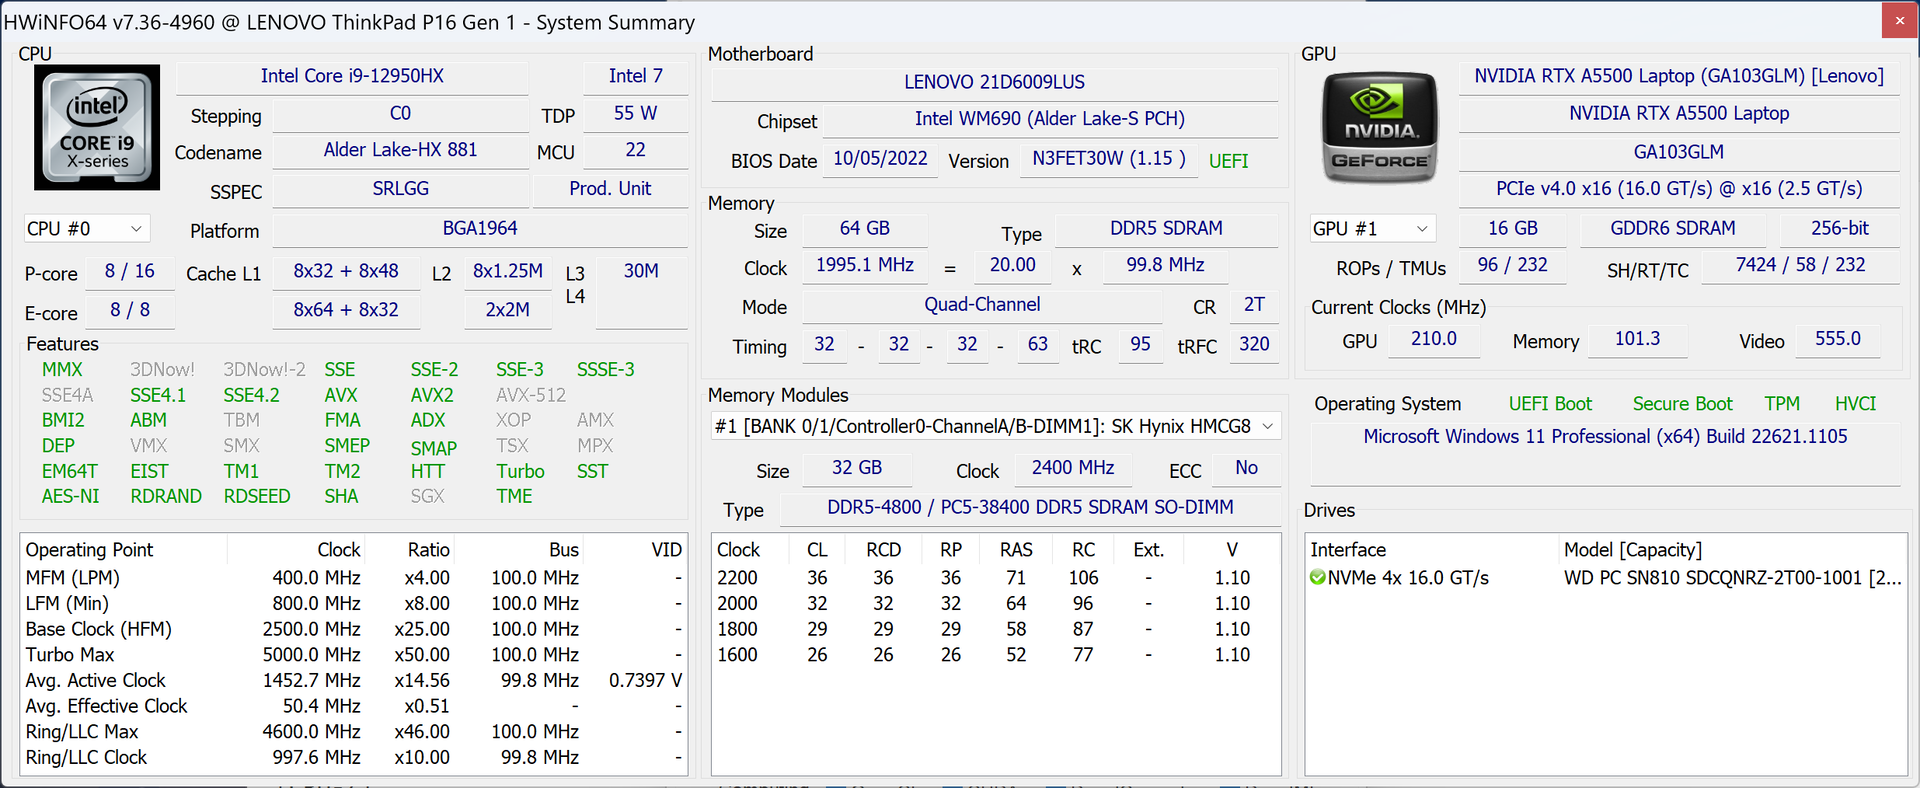
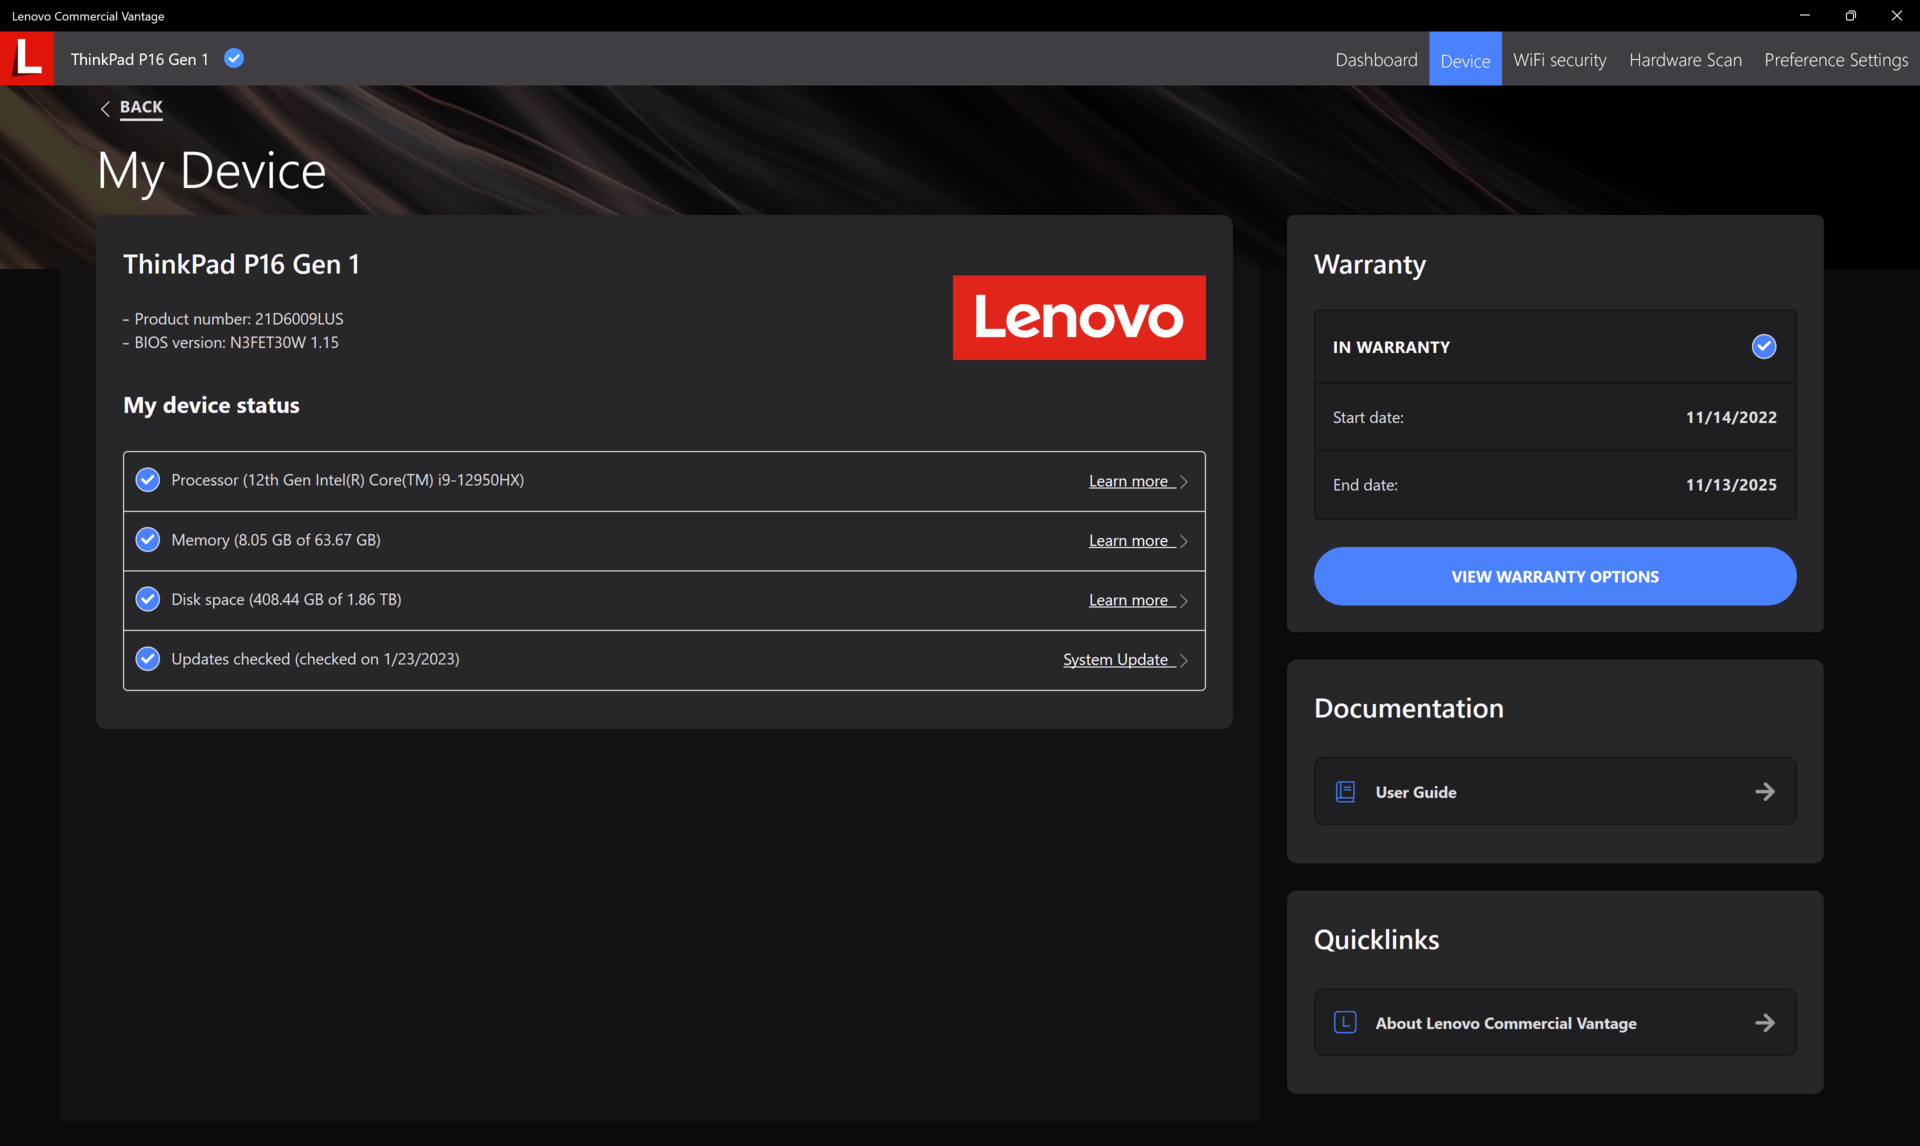
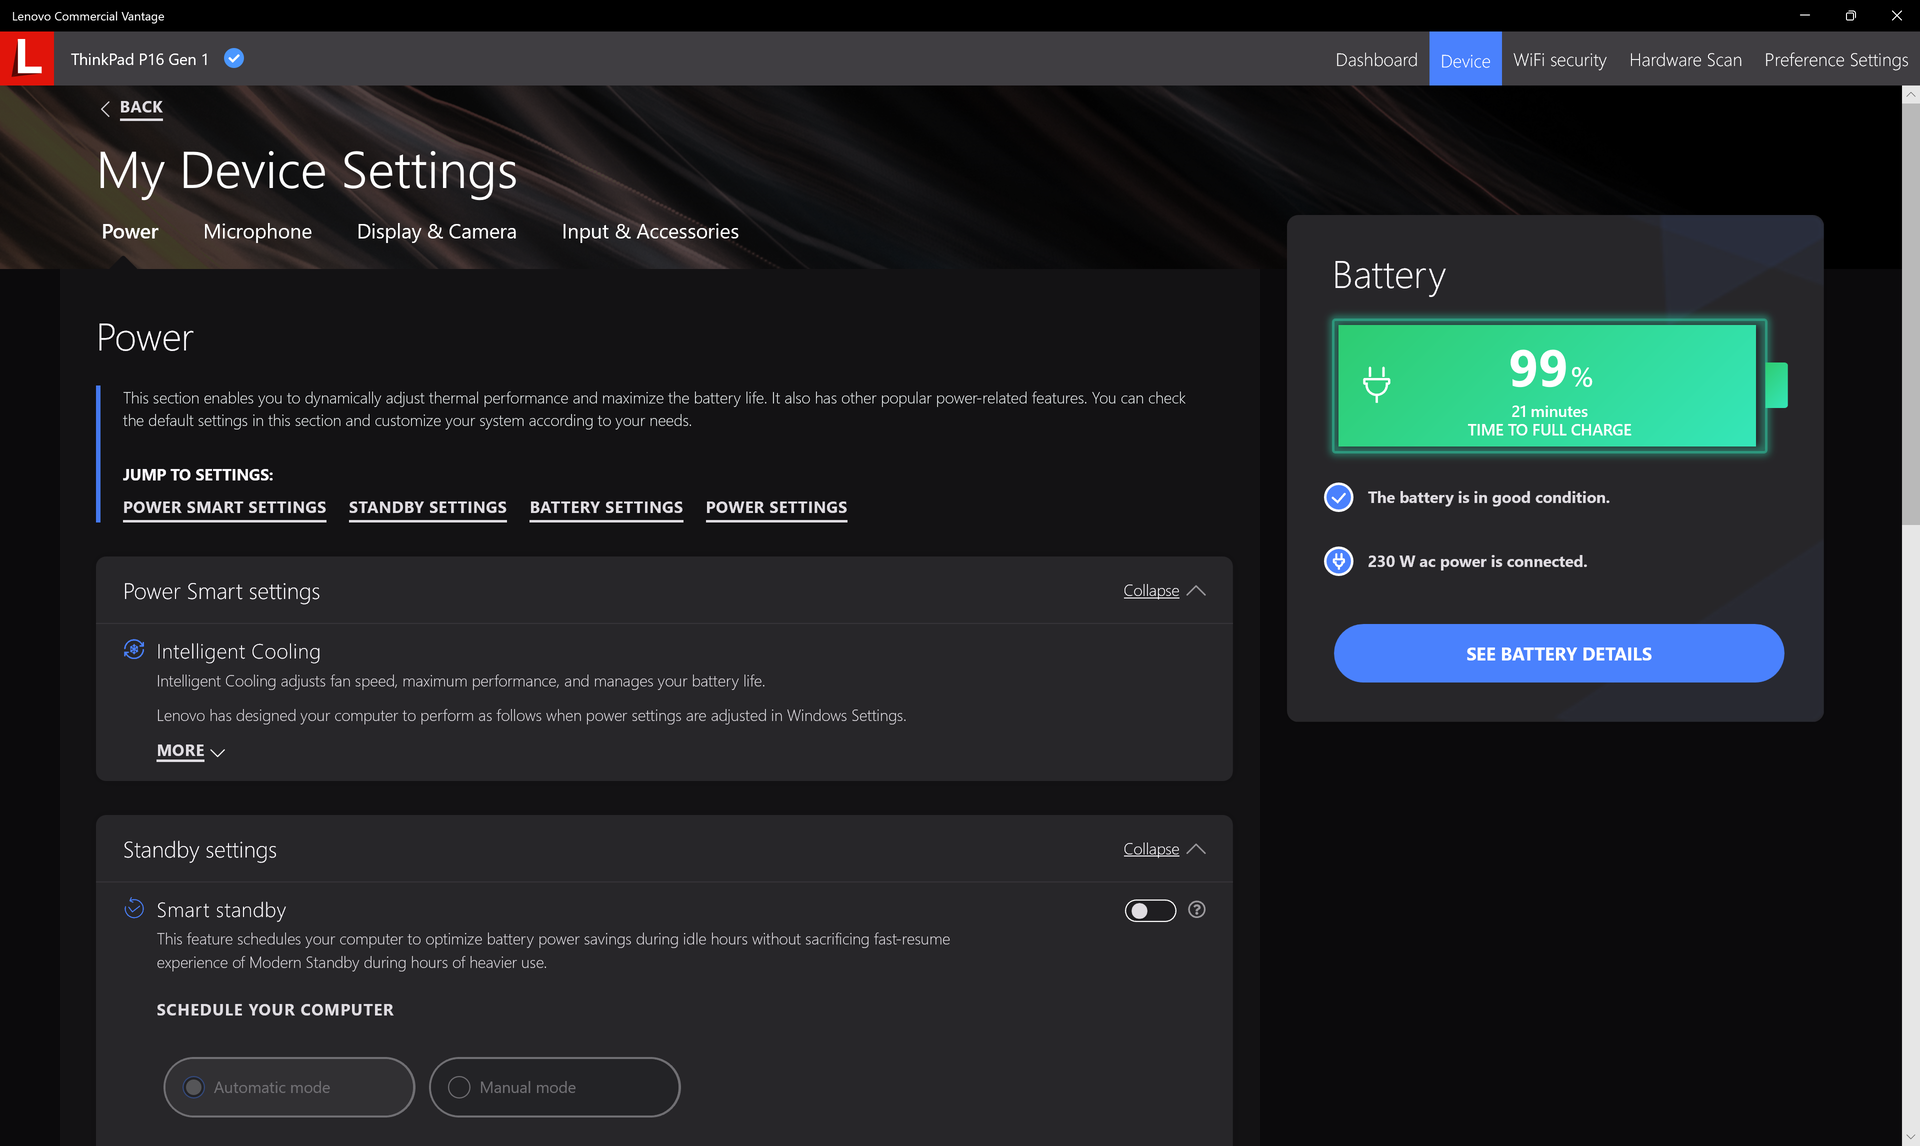
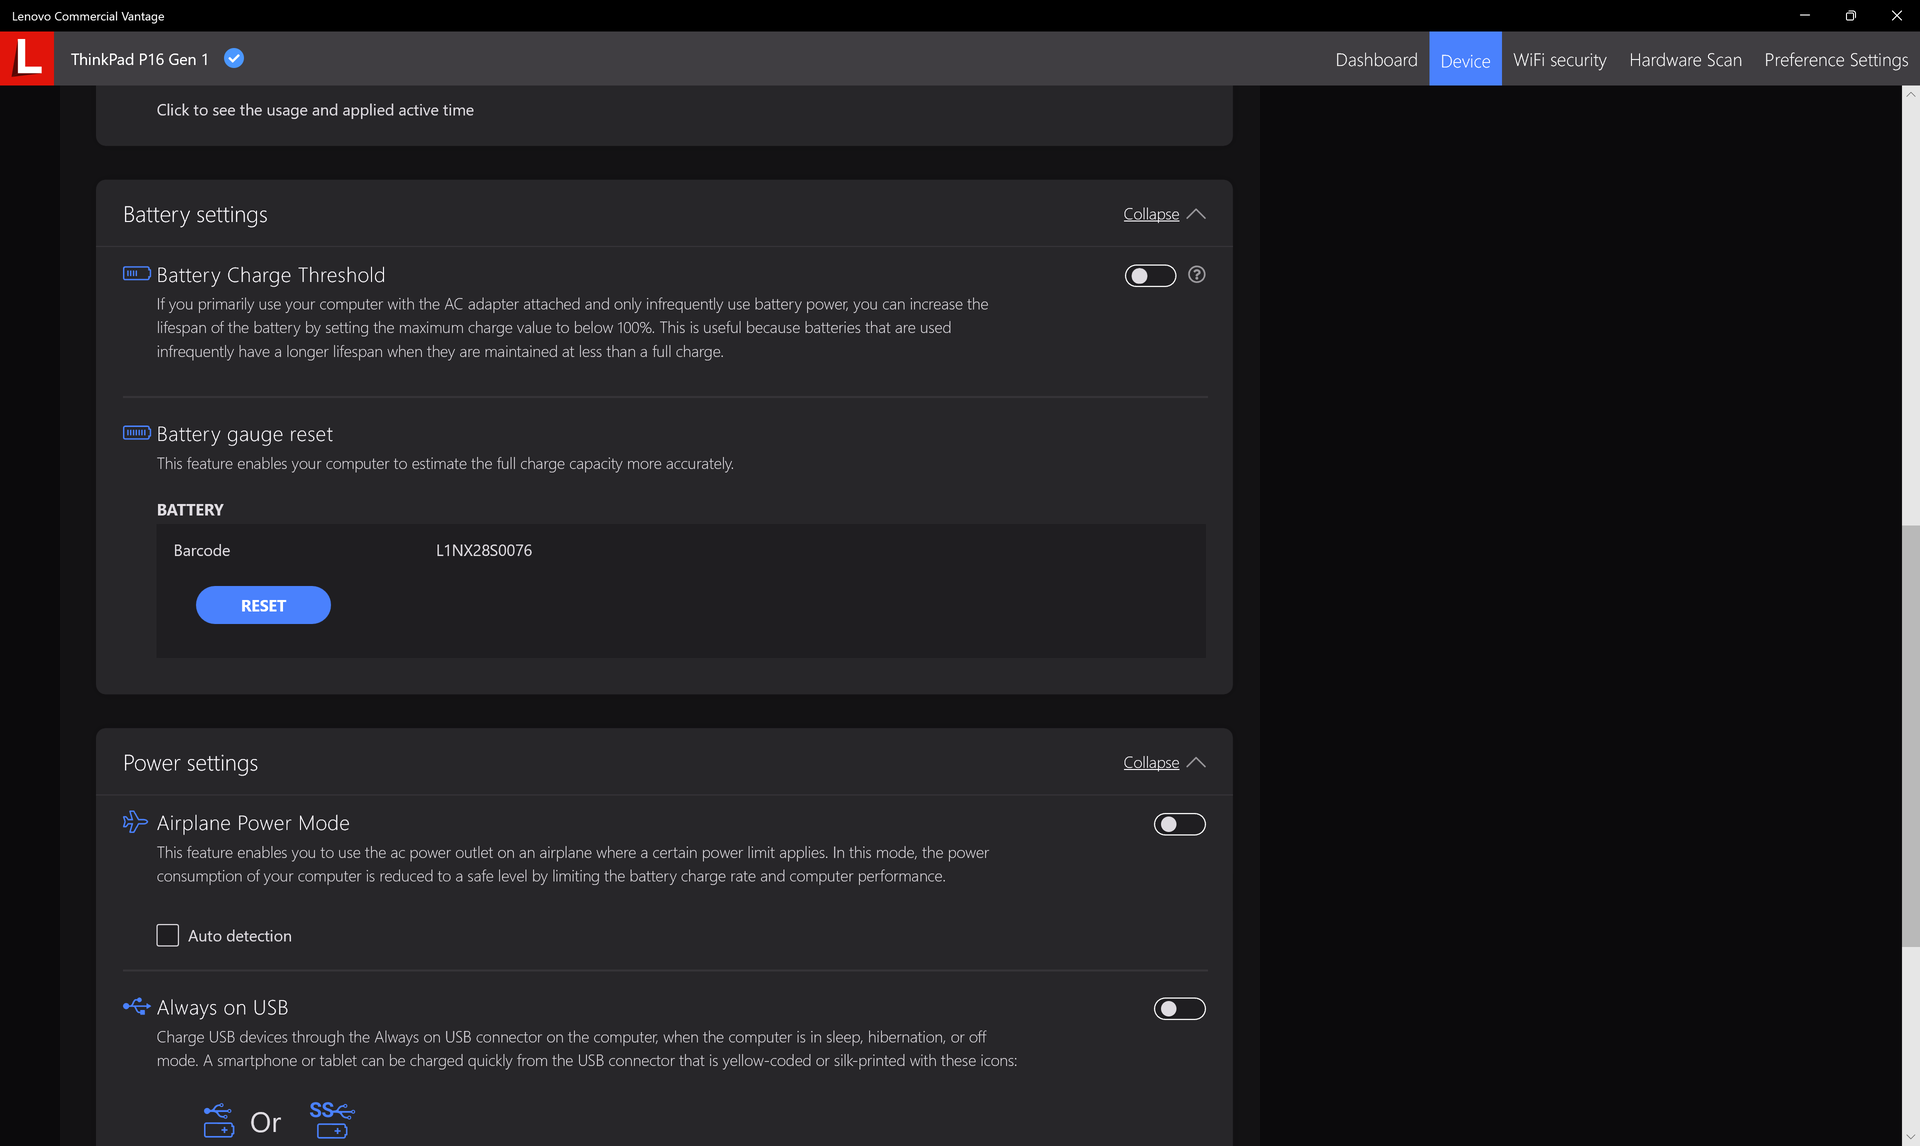
Ajustamos nossa unidade ao modo Performance e dGPU via Windows e o painel de controle Nvidia, respectivamente, antes de executar quaisquer benchmarks de performance abaixo. É recomendado que os usuários se familiarizem com o software Lenovo Vantage pré-instalado, pois ele é o núcleo central para atualizações BIOS específicas da Lenovo, características, status de garantia e muito mais.
Não há opções de CPU Xeon e, portanto, a RAM ECC não é suportada. Entretanto, o estado ECC para a GPU pode ser ligado ou desligado através do painel de controle da Nvidia.
Processador
O desempenho bruto multi-fio é cerca de 10% mais rápido do que o Núcleo i9-12900H na concorrência MSI CreatorPro Z16P. Atualização a partir doNúcleo i7-12850HX configuração para nossa Núcleo i9-12950HX um aumentará o desempenho em 15 por cento. Talvez mais notavelmente, o Precision 7670 é aproximadamente 15 a 20 por cento mais lento, apesar de ser enviado com a mesma CPU Core i9-12950HX que nossa Lenovo.
A sustentabilidade do Turbo Boost é boa, mas não perfeita. Ao executar o CineBench R15 xT em loop, por exemplo, a pontuação original de 3141 pontos cairia para ~2830 pontos ao longo do tempo para um mergulho de desempenho de 10 por cento.
Cinebench R15 Multi Loop
Cinebench R23: Multi Core | Single Core
Cinebench R20: CPU (Multi Core) | CPU (Single Core)
Cinebench R15: CPU Multi 64Bit | CPU Single 64Bit
Blender: v2.79 BMW27 CPU
7-Zip 18.03: 7z b 4 | 7z b 4 -mmt1
Geekbench 5.5: Multi-Core | Single-Core
HWBOT x265 Benchmark v2.2: 4k Preset
LibreOffice : 20 Documents To PDF
R Benchmark 2.5: Overall mean
* ... menor é melhor
AIDA64: FP32 Ray-Trace | FPU Julia | CPU SHA3 | CPU Queen | FPU SinJulia | FPU Mandel | CPU AES | CPU ZLib | FP64 Ray-Trace | CPU PhotoWorxx
| Performance rating | |
| Média Intel Core i9-12950HX | |
| Lenovo ThinkPad P16 G1 RTX A5500 | |
| Lenovo ThinkPad P16 G1 21D6001DMB | |
| MSI CreatorPro Z16P B12UKST | |
| HP ZBook Studio 16 G9 62U04EA | |
| Dell Precision 7000 7670 Performance | |
| Asus ProArt StudioBook 16 W7600H5A-2BL2 -9! | |
| AIDA64 / FP32 Ray-Trace | |
| Lenovo ThinkPad P16 G1 RTX A5500 | |
| Média Intel Core i9-12950HX (15499 - 22868, n=7) | |
| Lenovo ThinkPad P16 G1 21D6001DMB | |
| Dell Precision 7000 7670 Performance | |
| HP ZBook Studio 16 G9 62U04EA | |
| MSI CreatorPro Z16P B12UKST | |
| AIDA64 / FPU Julia | |
| Lenovo ThinkPad P16 G1 RTX A5500 | |
| Média Intel Core i9-12950HX (77846 - 115907, n=7) | |
| Lenovo ThinkPad P16 G1 21D6001DMB | |
| HP ZBook Studio 16 G9 62U04EA | |
| Dell Precision 7000 7670 Performance | |
| MSI CreatorPro Z16P B12UKST | |
| AIDA64 / CPU SHA3 | |
| Lenovo ThinkPad P16 G1 RTX A5500 | |
| Média Intel Core i9-12950HX (3426 - 5069, n=7) | |
| Lenovo ThinkPad P16 G1 21D6001DMB | |
| HP ZBook Studio 16 G9 62U04EA | |
| MSI CreatorPro Z16P B12UKST | |
| Dell Precision 7000 7670 Performance | |
| AIDA64 / CPU Queen | |
| HP ZBook Studio 16 G9 62U04EA | |
| Média Intel Core i9-12950HX (102752 - 104726, n=7) | |
| Lenovo ThinkPad P16 G1 RTX A5500 | |
| Dell Precision 7000 7670 Performance | |
| MSI CreatorPro Z16P B12UKST | |
| Lenovo ThinkPad P16 G1 21D6001DMB | |
| AIDA64 / FPU SinJulia | |
| Lenovo ThinkPad P16 G1 RTX A5500 | |
| Média Intel Core i9-12950HX (10134 - 12823, n=7) | |
| Lenovo ThinkPad P16 G1 21D6001DMB | |
| Dell Precision 7000 7670 Performance | |
| HP ZBook Studio 16 G9 62U04EA | |
| MSI CreatorPro Z16P B12UKST | |
| AIDA64 / FPU Mandel | |
| Lenovo ThinkPad P16 G1 RTX A5500 | |
| Média Intel Core i9-12950HX (37146 - 57340, n=7) | |
| Lenovo ThinkPad P16 G1 21D6001DMB | |
| HP ZBook Studio 16 G9 62U04EA | |
| Dell Precision 7000 7670 Performance | |
| MSI CreatorPro Z16P B12UKST | |
| AIDA64 / CPU AES | |
| MSI CreatorPro Z16P B12UKST | |
| Média Intel Core i9-12950HX (72599 - 181128, n=7) | |
| Lenovo ThinkPad P16 G1 RTX A5500 | |
| Lenovo ThinkPad P16 G1 21D6001DMB | |
| HP ZBook Studio 16 G9 62U04EA | |
| Dell Precision 7000 7670 Performance | |
| AIDA64 / FP64 Ray-Trace | |
| Lenovo ThinkPad P16 G1 RTX A5500 | |
| Média Intel Core i9-12950HX (8455 - 12432, n=7) | |
| Lenovo ThinkPad P16 G1 21D6001DMB | |
| HP ZBook Studio 16 G9 62U04EA | |
| Dell Precision 7000 7670 Performance | |
| MSI CreatorPro Z16P B12UKST | |
| AIDA64 / CPU PhotoWorxx | |
| MSI CreatorPro Z16P B12UKST | |
| Dell Precision 7000 7670 Performance | |
| Média Intel Core i9-12950HX (35479 - 42655, n=7) | |
| Lenovo ThinkPad P16 G1 RTX A5500 | |
| HP ZBook Studio 16 G9 62U04EA | |
| Lenovo ThinkPad P16 G1 21D6001DMB | |
Desempenho do sistema
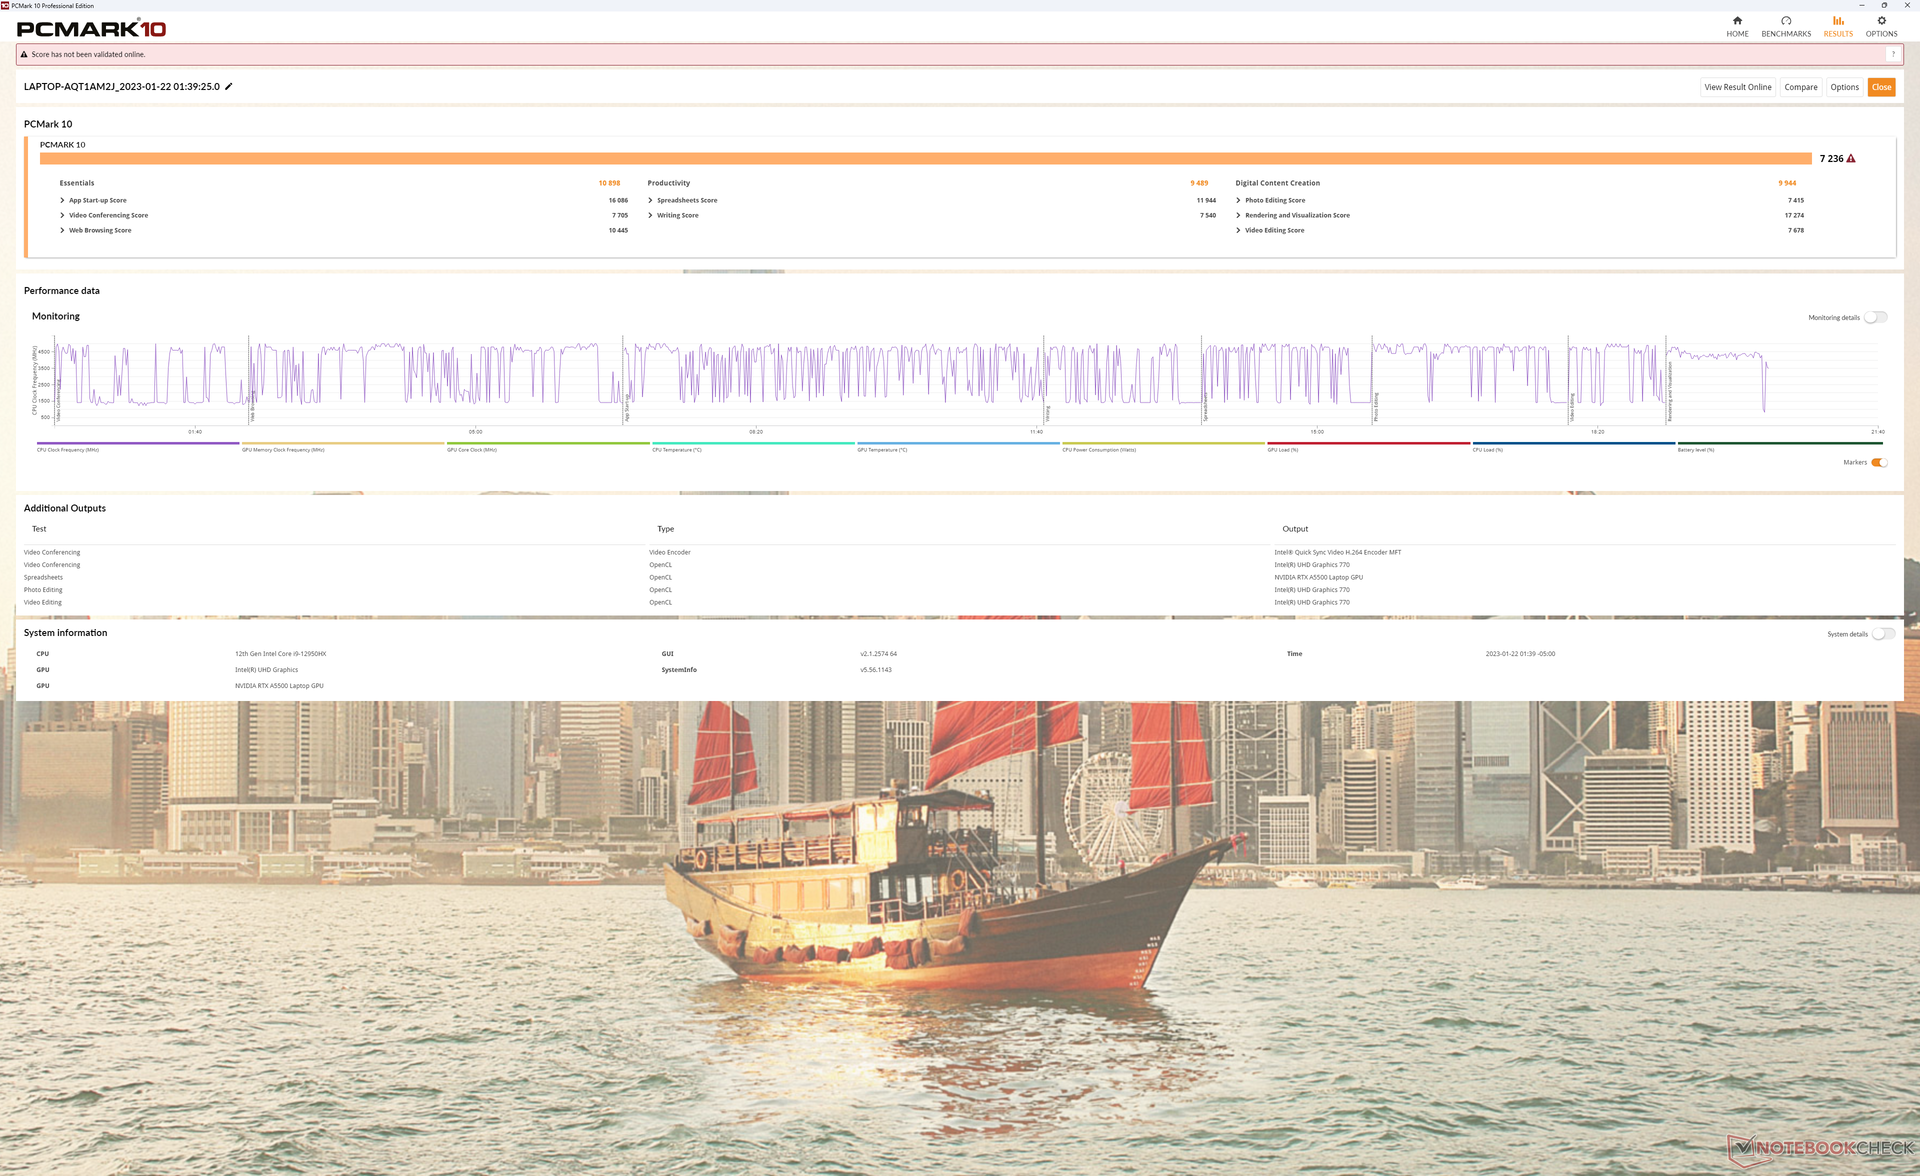
As pontuações PCMark são algumas das mais altas que já vimos em qualquer estação de trabalho móvel. Nosso sistema até mesmo beira o Dell Precision 7670 que vem com as mesmas opções de CPU e GPU que o ThinkPad P16 G1.
CrossMark: Overall | Productivity | Creativity | Responsiveness
| PCMark 10 / Score | |
| Lenovo ThinkPad P16 G1 RTX A5500 | |
| MSI CreatorPro Z16P B12UKST | |
| Média Intel Core i9-12950HX, NVIDIA RTX A5500 Laptop GPU (6883 - 7236, n=3) | |
| Asus ProArt StudioBook 16 W7600H5A-2BL2 | |
| Dell Precision 7000 7670 Performance | |
| HP ZBook Studio 16 G9 62U04EA | |
| Lenovo ThinkPad P16 G1 21D6001DMB | |
| PCMark 10 / Essentials | |
| Dell Precision 7000 7670 Performance | |
| Média Intel Core i9-12950HX, NVIDIA RTX A5500 Laptop GPU (10898 - 11465, n=3) | |
| Lenovo ThinkPad P16 G1 RTX A5500 | |
| MSI CreatorPro Z16P B12UKST | |
| Asus ProArt StudioBook 16 W7600H5A-2BL2 | |
| Lenovo ThinkPad P16 G1 21D6001DMB | |
| HP ZBook Studio 16 G9 62U04EA | |
| PCMark 10 / Productivity | |
| Lenovo ThinkPad P16 G1 RTX A5500 | |
| MSI CreatorPro Z16P B12UKST | |
| Lenovo ThinkPad P16 G1 21D6001DMB | |
| Asus ProArt StudioBook 16 W7600H5A-2BL2 | |
| Média Intel Core i9-12950HX, NVIDIA RTX A5500 Laptop GPU (8054 - 9489, n=3) | |
| Dell Precision 7000 7670 Performance | |
| HP ZBook Studio 16 G9 62U04EA | |
| PCMark 10 / Digital Content Creation | |
| Asus ProArt StudioBook 16 W7600H5A-2BL2 | |
| Lenovo ThinkPad P16 G1 RTX A5500 | |
| MSI CreatorPro Z16P B12UKST | |
| Dell Precision 7000 7670 Performance | |
| Média Intel Core i9-12950HX, NVIDIA RTX A5500 Laptop GPU (9155 - 9944, n=3) | |
| HP ZBook Studio 16 G9 62U04EA | |
| Lenovo ThinkPad P16 G1 21D6001DMB | |
| CrossMark / Overall | |
| MSI CreatorPro Z16P B12UKST | |
| Lenovo ThinkPad P16 G1 RTX A5500 | |
| Média Intel Core i9-12950HX, NVIDIA RTX A5500 Laptop GPU (1801 - 1889, n=3) | |
| HP ZBook Studio 16 G9 62U04EA | |
| Dell Precision 7000 7670 Performance | |
| Lenovo ThinkPad P16 G1 21D6001DMB | |
| CrossMark / Productivity | |
| MSI CreatorPro Z16P B12UKST | |
| Lenovo ThinkPad P16 G1 RTX A5500 | |
| Média Intel Core i9-12950HX, NVIDIA RTX A5500 Laptop GPU (1684 - 1785, n=3) | |
| HP ZBook Studio 16 G9 62U04EA | |
| Dell Precision 7000 7670 Performance | |
| Lenovo ThinkPad P16 G1 21D6001DMB | |
| CrossMark / Creativity | |
| Lenovo ThinkPad P16 G1 RTX A5500 | |
| Média Intel Core i9-12950HX, NVIDIA RTX A5500 Laptop GPU (2042 - 2192, n=3) | |
| HP ZBook Studio 16 G9 62U04EA | |
| MSI CreatorPro Z16P B12UKST | |
| Dell Precision 7000 7670 Performance | |
| Lenovo ThinkPad P16 G1 21D6001DMB | |
| CrossMark / Responsiveness | |
| MSI CreatorPro Z16P B12UKST | |
| HP ZBook Studio 16 G9 62U04EA | |
| Média Intel Core i9-12950HX, NVIDIA RTX A5500 Laptop GPU (1501 - 1585, n=3) | |
| Dell Precision 7000 7670 Performance | |
| Lenovo ThinkPad P16 G1 RTX A5500 | |
| Lenovo ThinkPad P16 G1 21D6001DMB | |
| PCMark 10 Score | 7236 pontos | |
Ajuda | ||
| AIDA64 / Memory Copy | |
| Dell Precision 7000 7670 Performance | |
| Média Intel Core i9-12950HX (59731 - 64732, n=7) | |
| Lenovo ThinkPad P16 G1 RTX A5500 | |
| MSI CreatorPro Z16P B12UKST | |
| HP ZBook Studio 16 G9 62U04EA | |
| Lenovo ThinkPad P16 G1 21D6001DMB | |
| AIDA64 / Memory Read | |
| Dell Precision 7000 7670 Performance | |
| Média Intel Core i9-12950HX (59744 - 70359, n=7) | |
| MSI CreatorPro Z16P B12UKST | |
| HP ZBook Studio 16 G9 62U04EA | |
| Lenovo ThinkPad P16 G1 RTX A5500 | |
| Lenovo ThinkPad P16 G1 21D6001DMB | |
| AIDA64 / Memory Write | |
| MSI CreatorPro Z16P B12UKST | |
| Dell Precision 7000 7670 Performance | |
| HP ZBook Studio 16 G9 62U04EA | |
| Média Intel Core i9-12950HX (57750 - 67899, n=7) | |
| Lenovo ThinkPad P16 G1 RTX A5500 | |
| Lenovo ThinkPad P16 G1 21D6001DMB | |
* ... menor é melhor
Latência do DPC
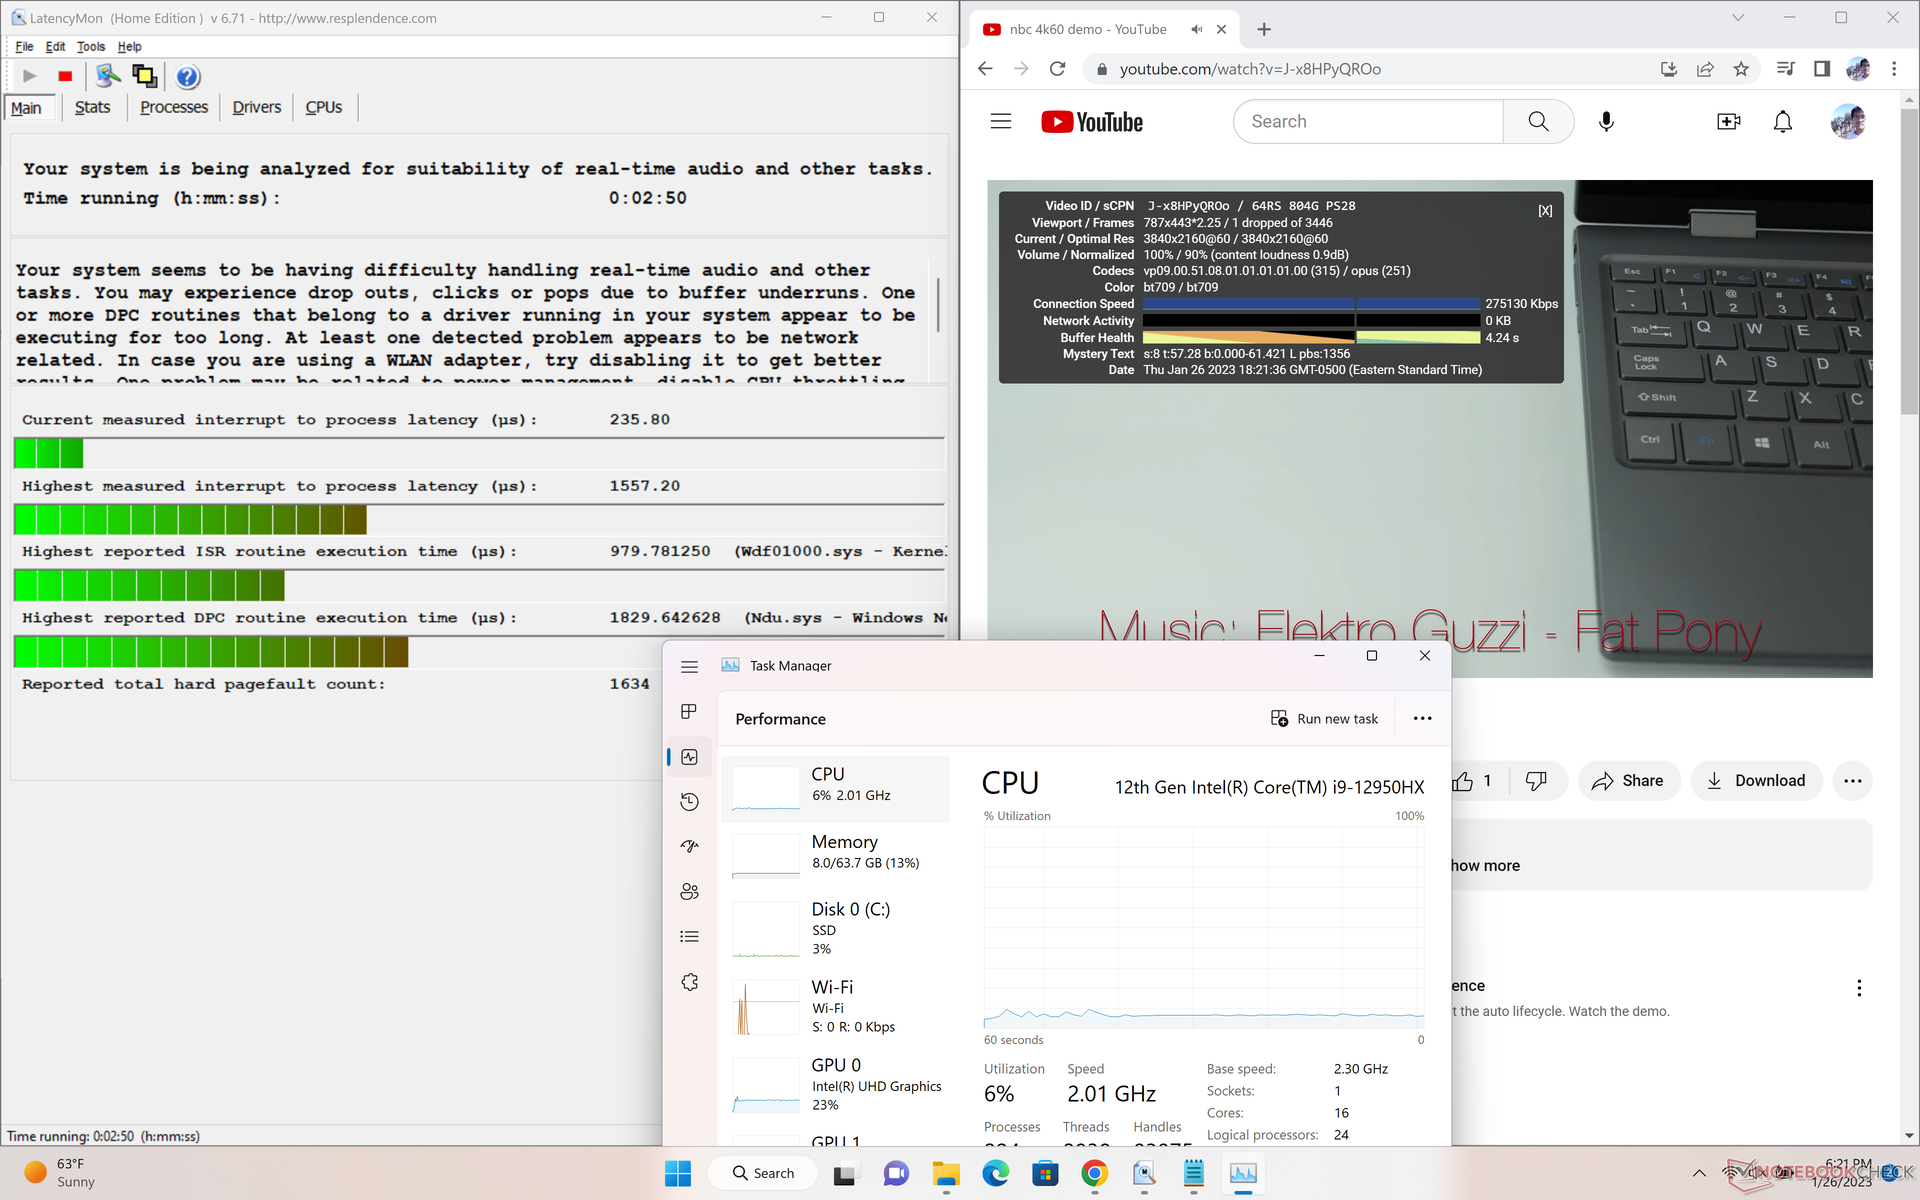
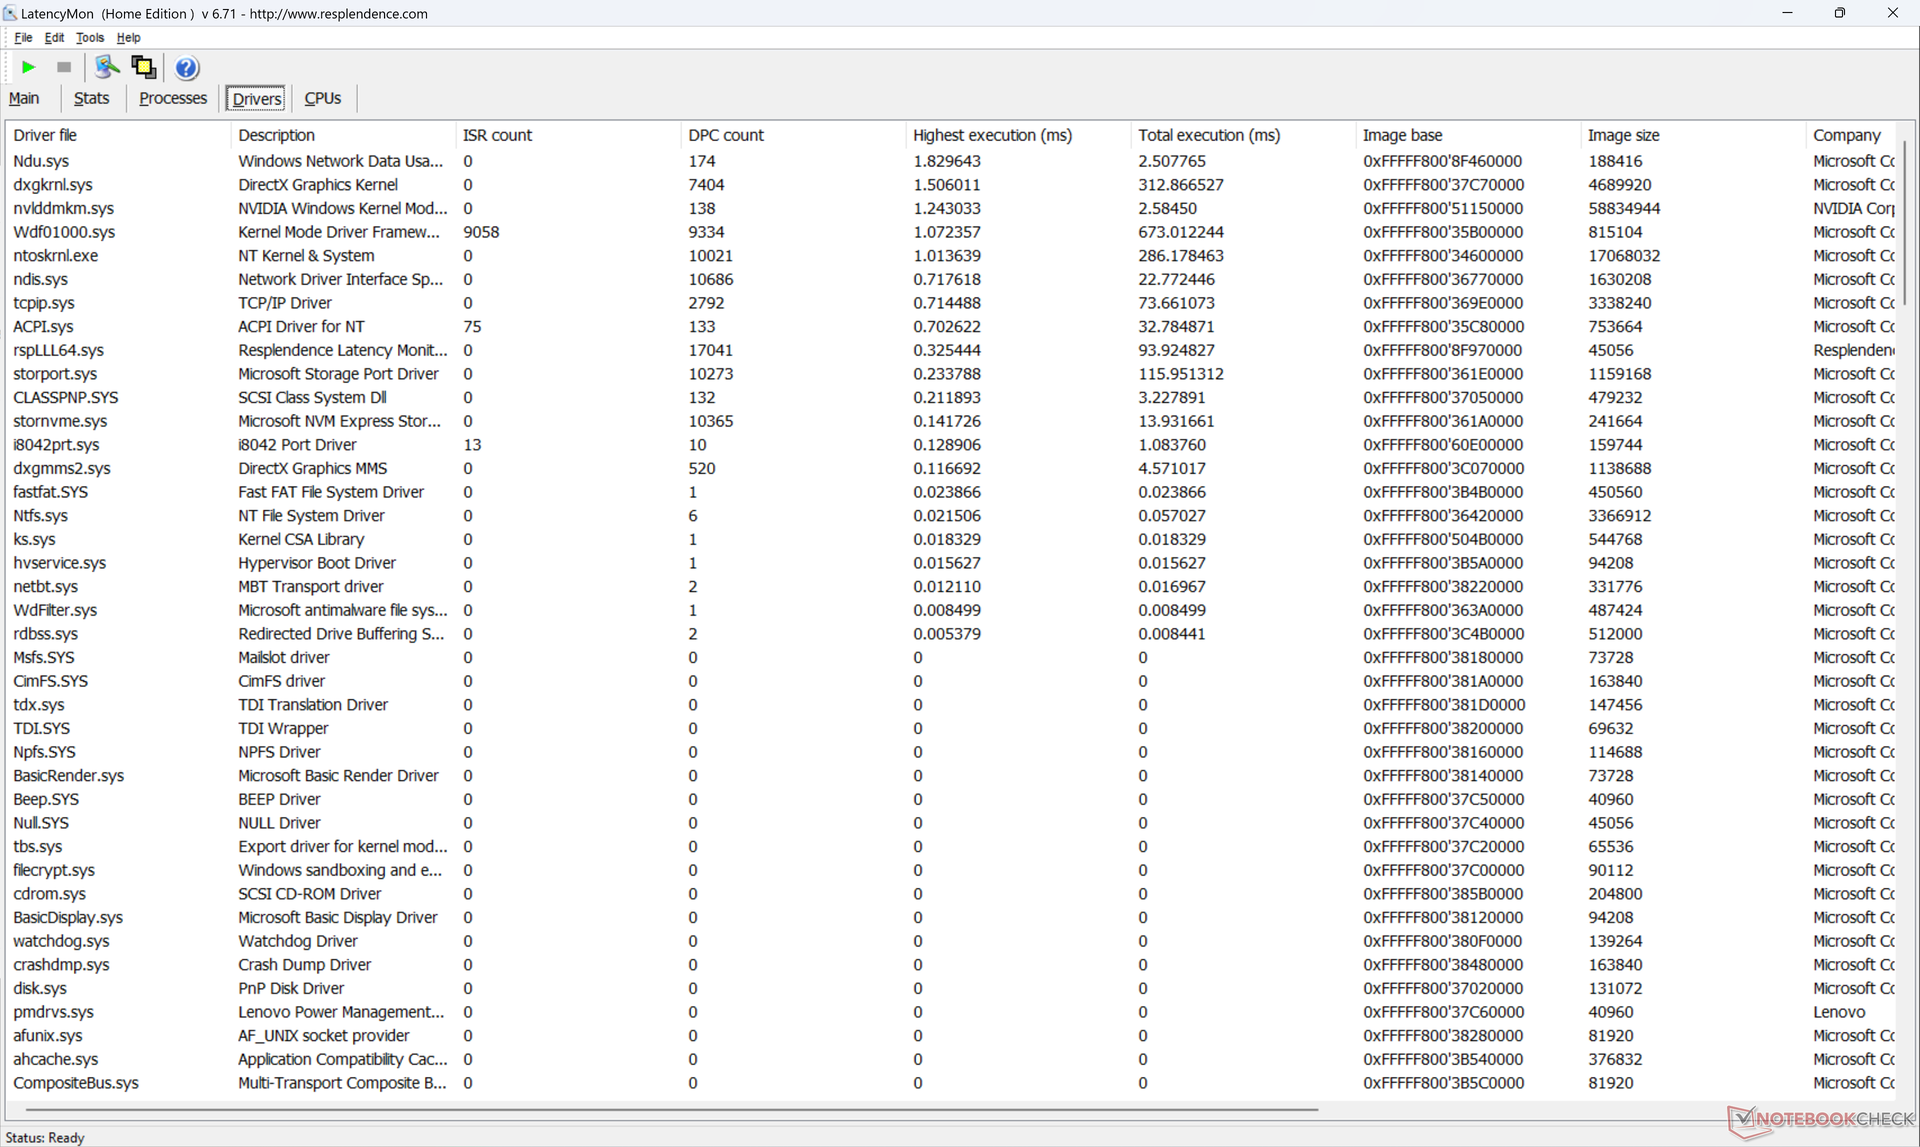
LatencyMon revela pequenos problemas de DPC ao abrir várias abas do navegador em nossa página inicial, o que é decepcionante para uma estação de trabalho. a reprodução do vídeo de 4K a 60 FPS é excelente com apenas um único frame caído durante nosso vídeo de teste.
| DPC Latencies / LatencyMon - interrupt to process latency (max), Web, Youtube, Prime95 | |
| Dell Precision 7000 7670 Performance | |
| Lenovo ThinkPad P16 G1 RTX A5500 | |
| Asus ProArt StudioBook 16 W7600H5A-2BL2 | |
| Lenovo ThinkPad P16 G1 21D6001DMB | |
| HP ZBook Studio 16 G9 62U04EA | |
| MSI CreatorPro Z16P B12UKST | |
* ... menor é melhor
Dispositivos de armazenamento
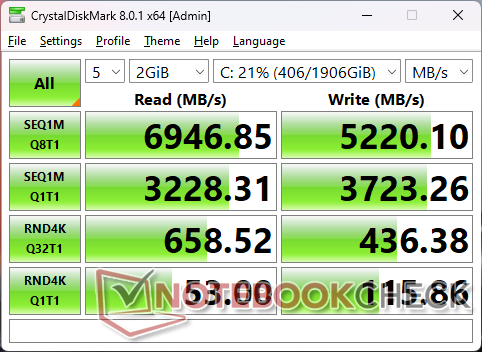
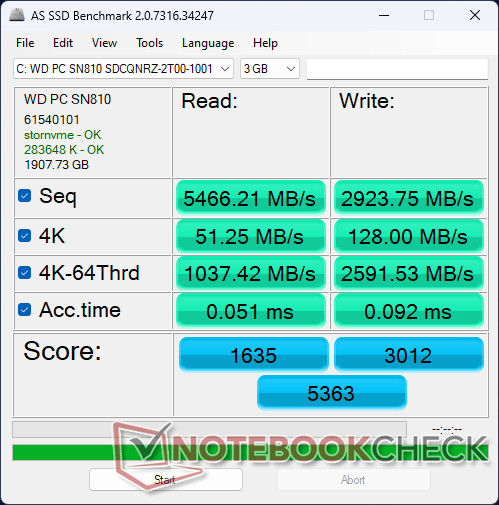
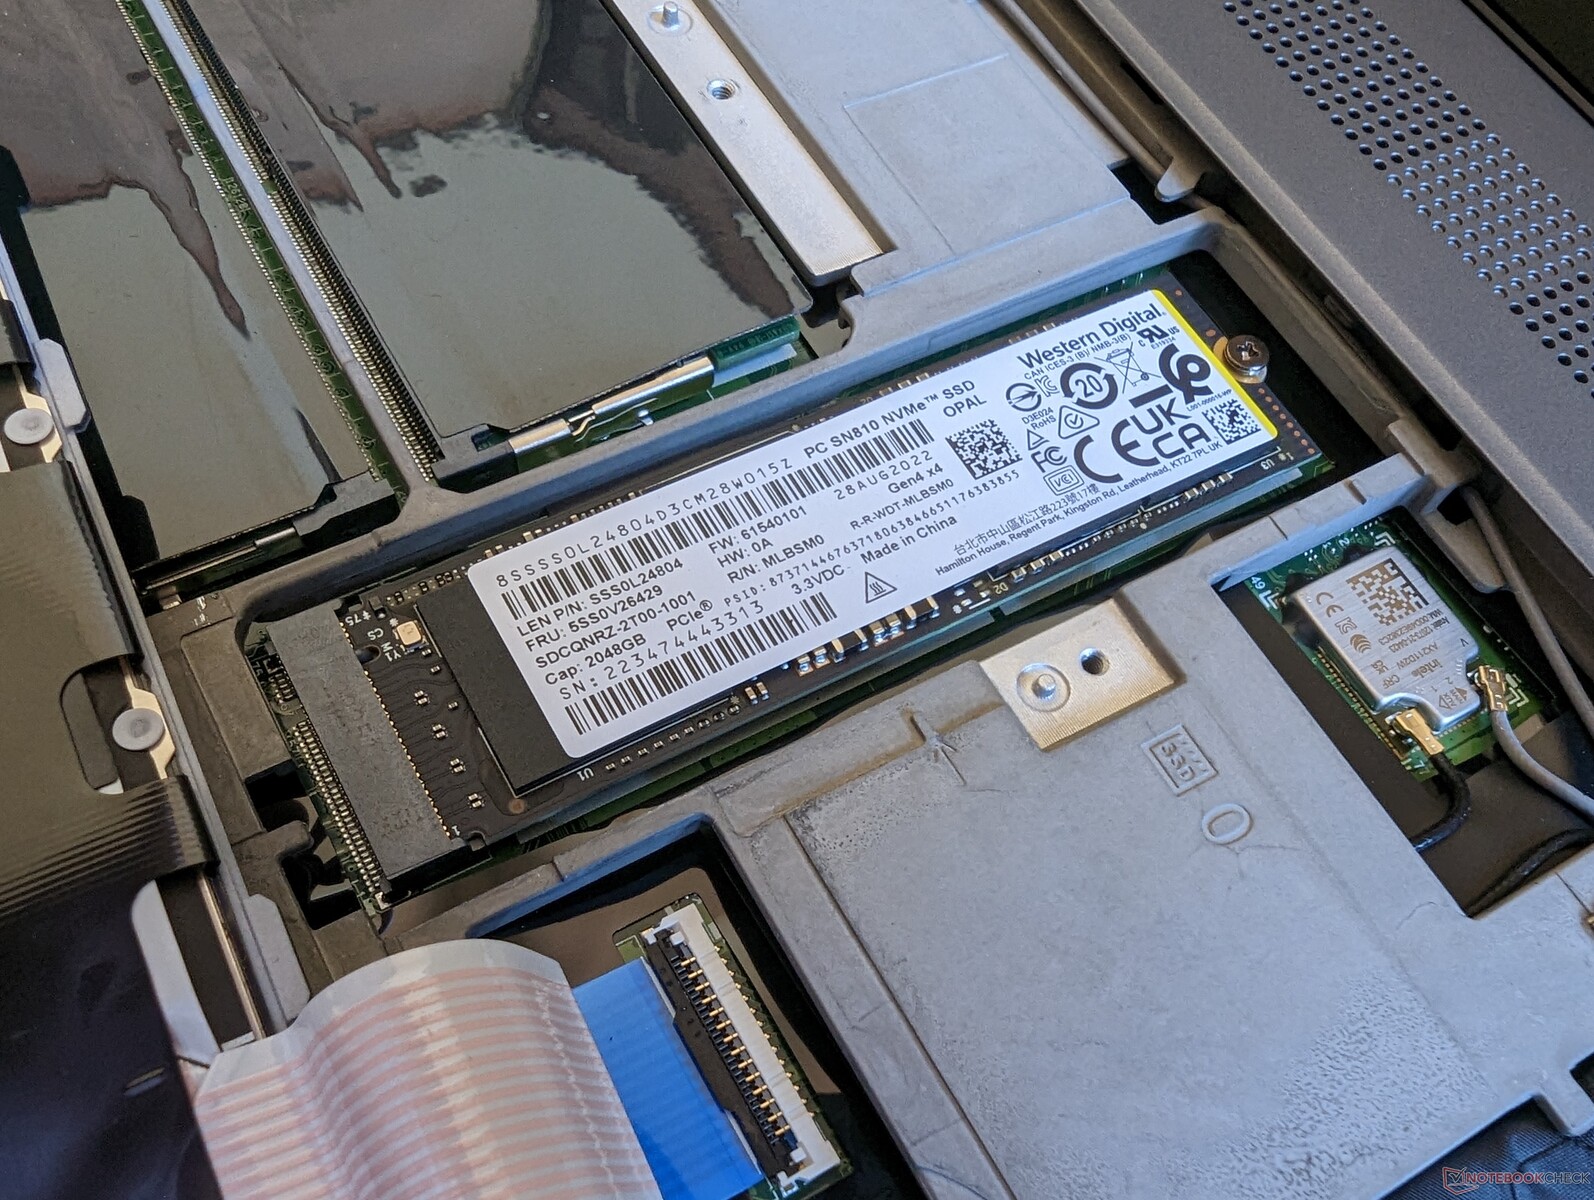
Enquanto nossa configuração A2000 seria enviada com um SSD Micron 3400, nossa configuração A5500 é enviada com um WD SN810 OPAL SSD em vez disso. As taxas seqüenciais de leitura e escrita são comparáveis entre os dois, mas nossa unidade WD parece ter problemas para manter as taxas máximas de transferência após cerca de 5 minutos de estresse, como mostra nosso gráfico de comparação abaixo.

* ... menor é melhor
Disk Throttling: DiskSpd Read Loop, Queue Depth 8
Desempenho da GPU
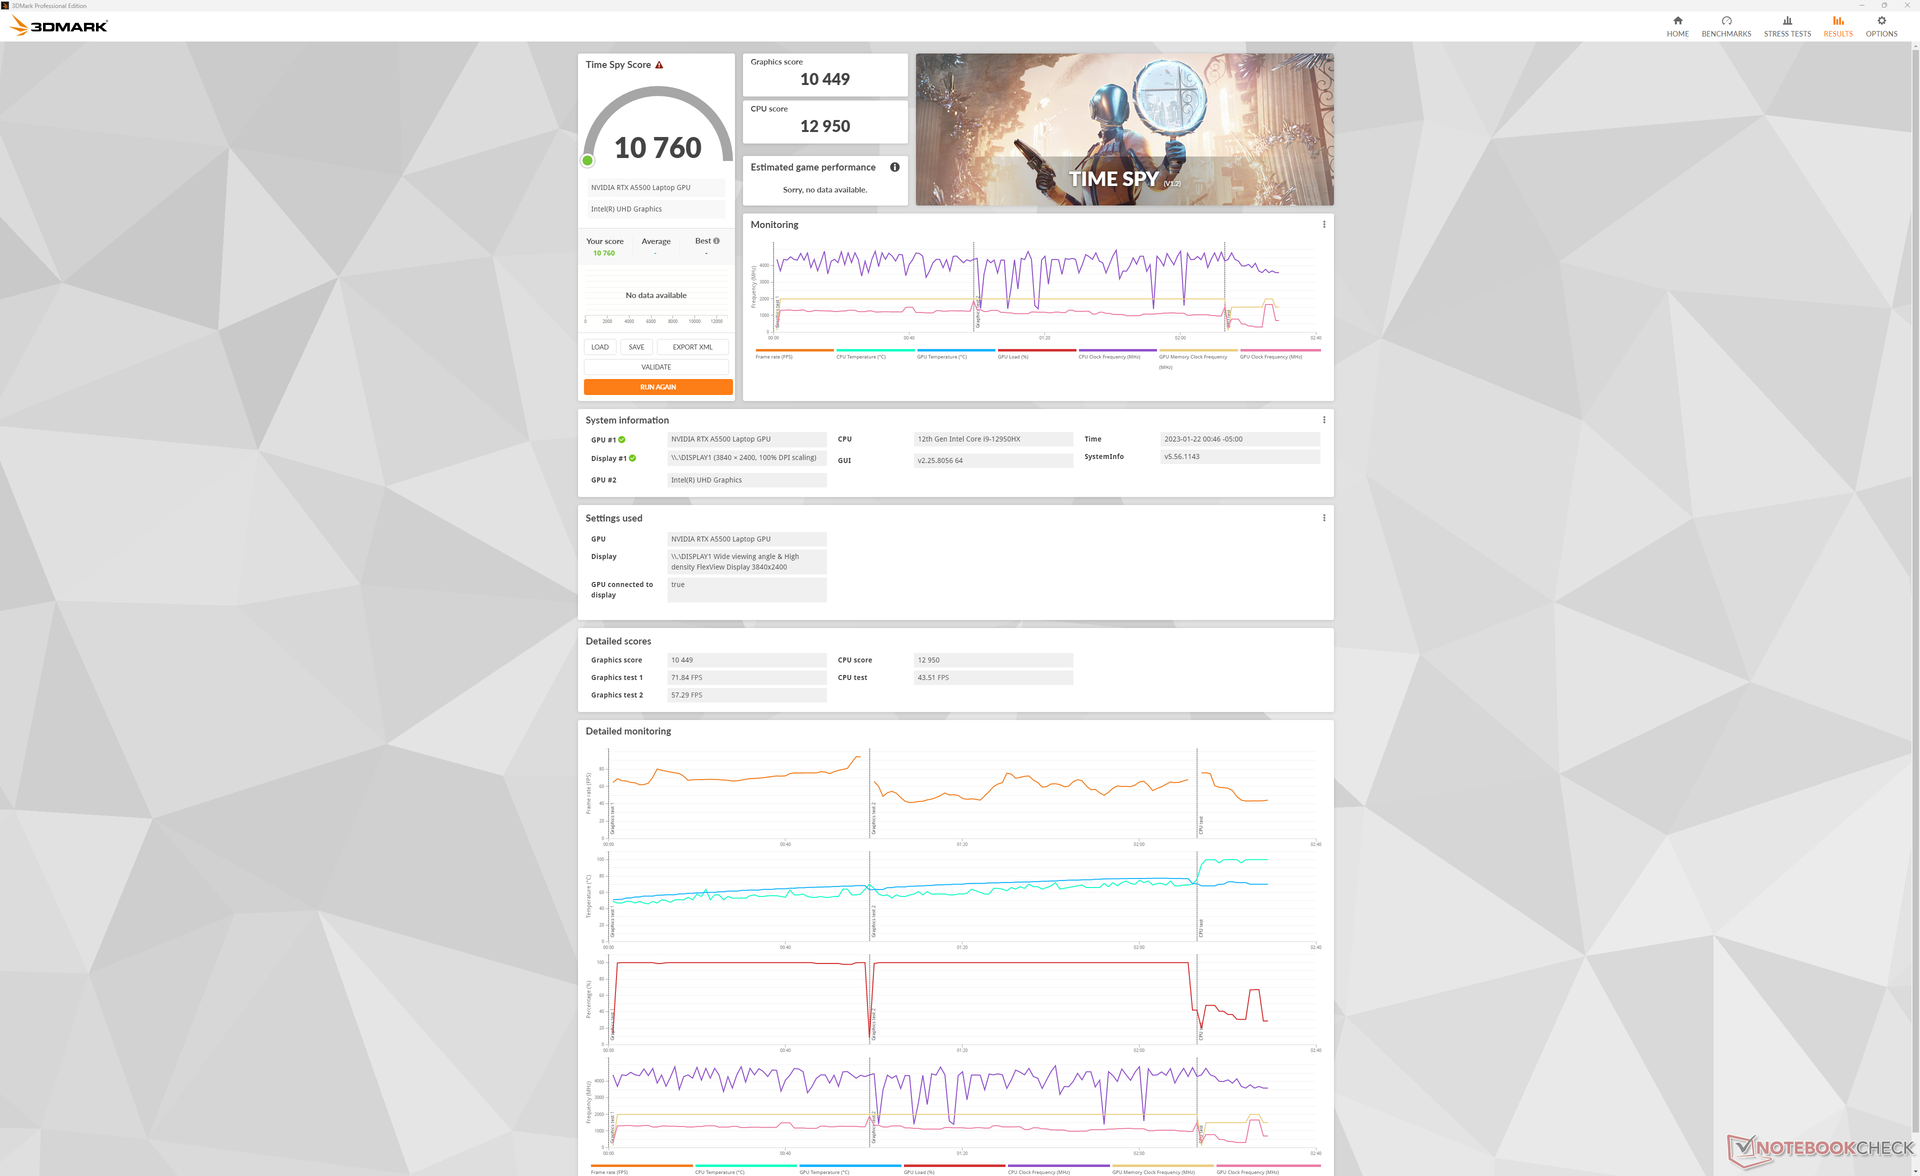
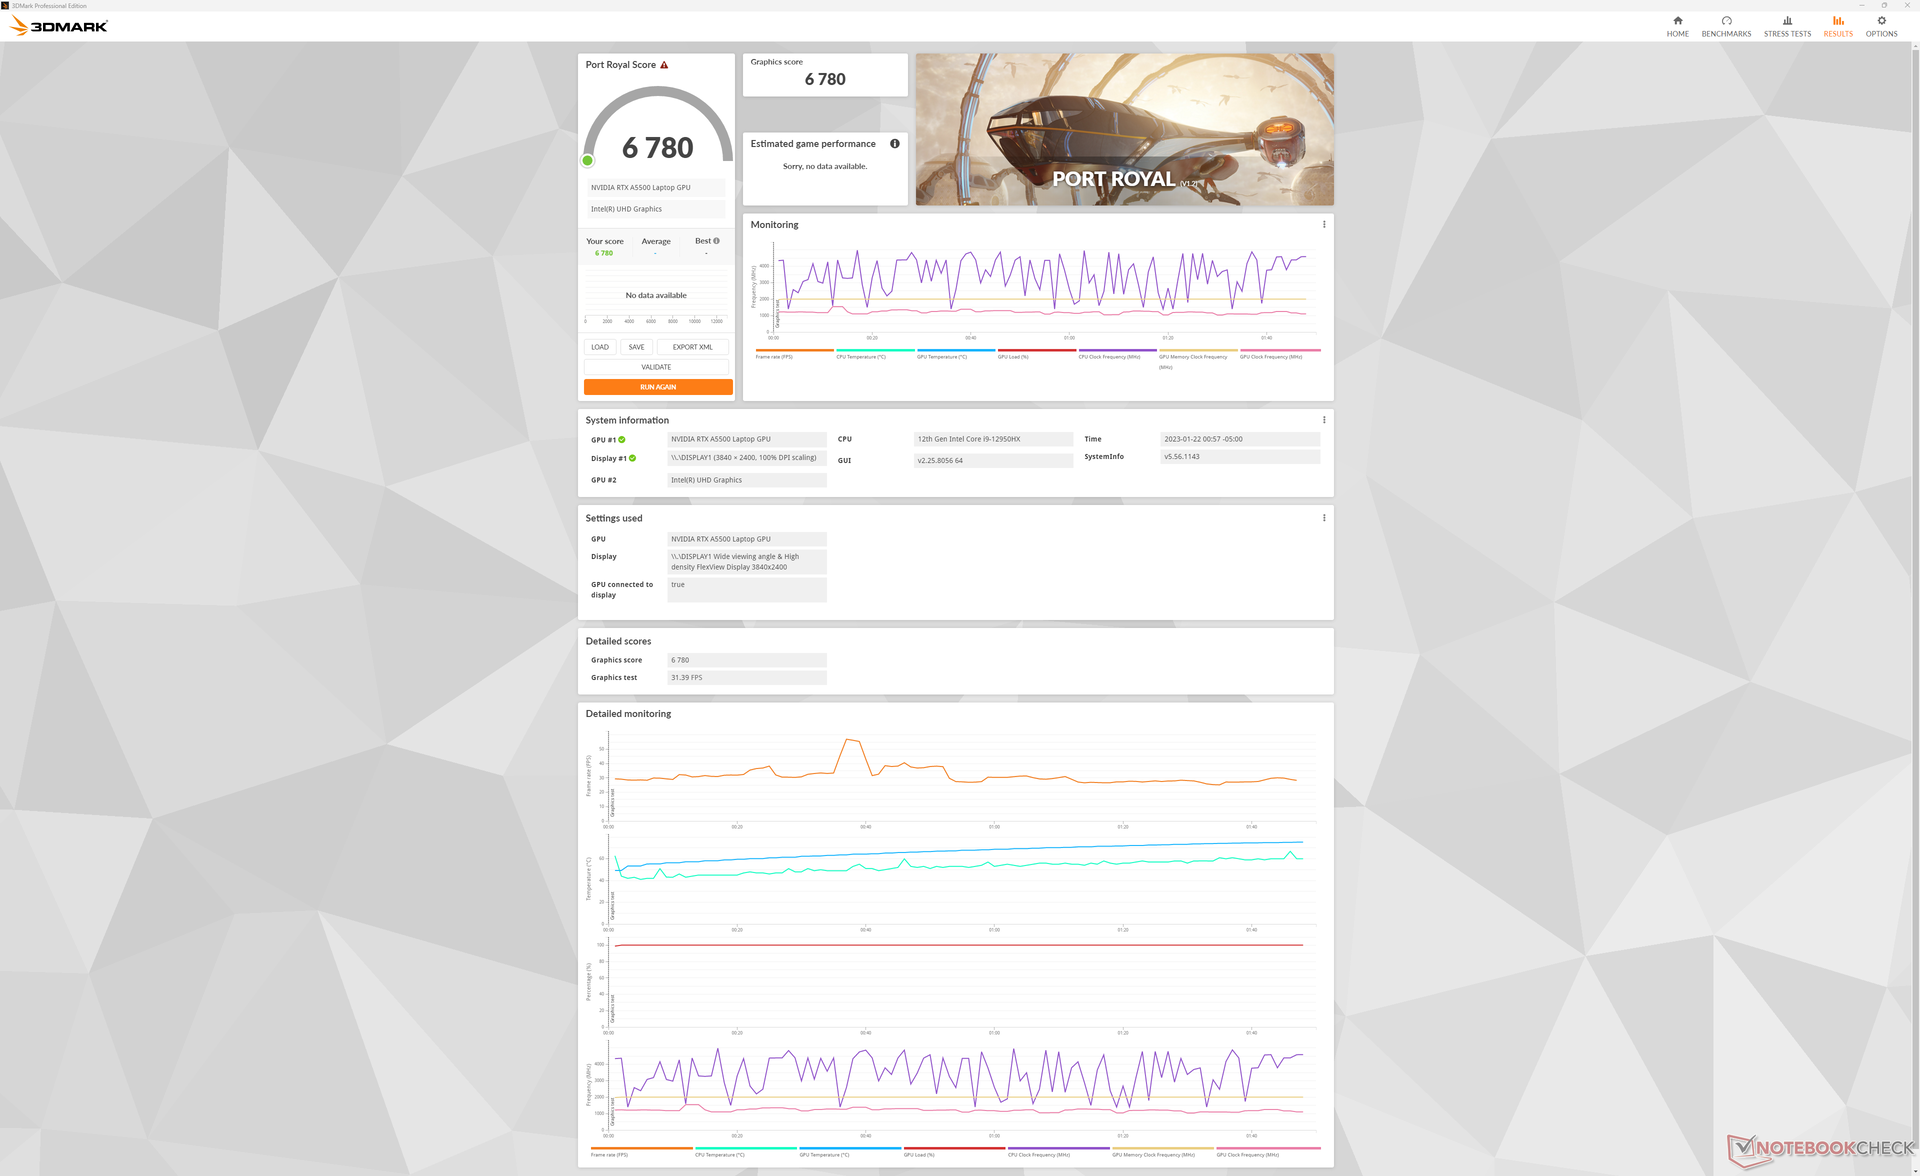
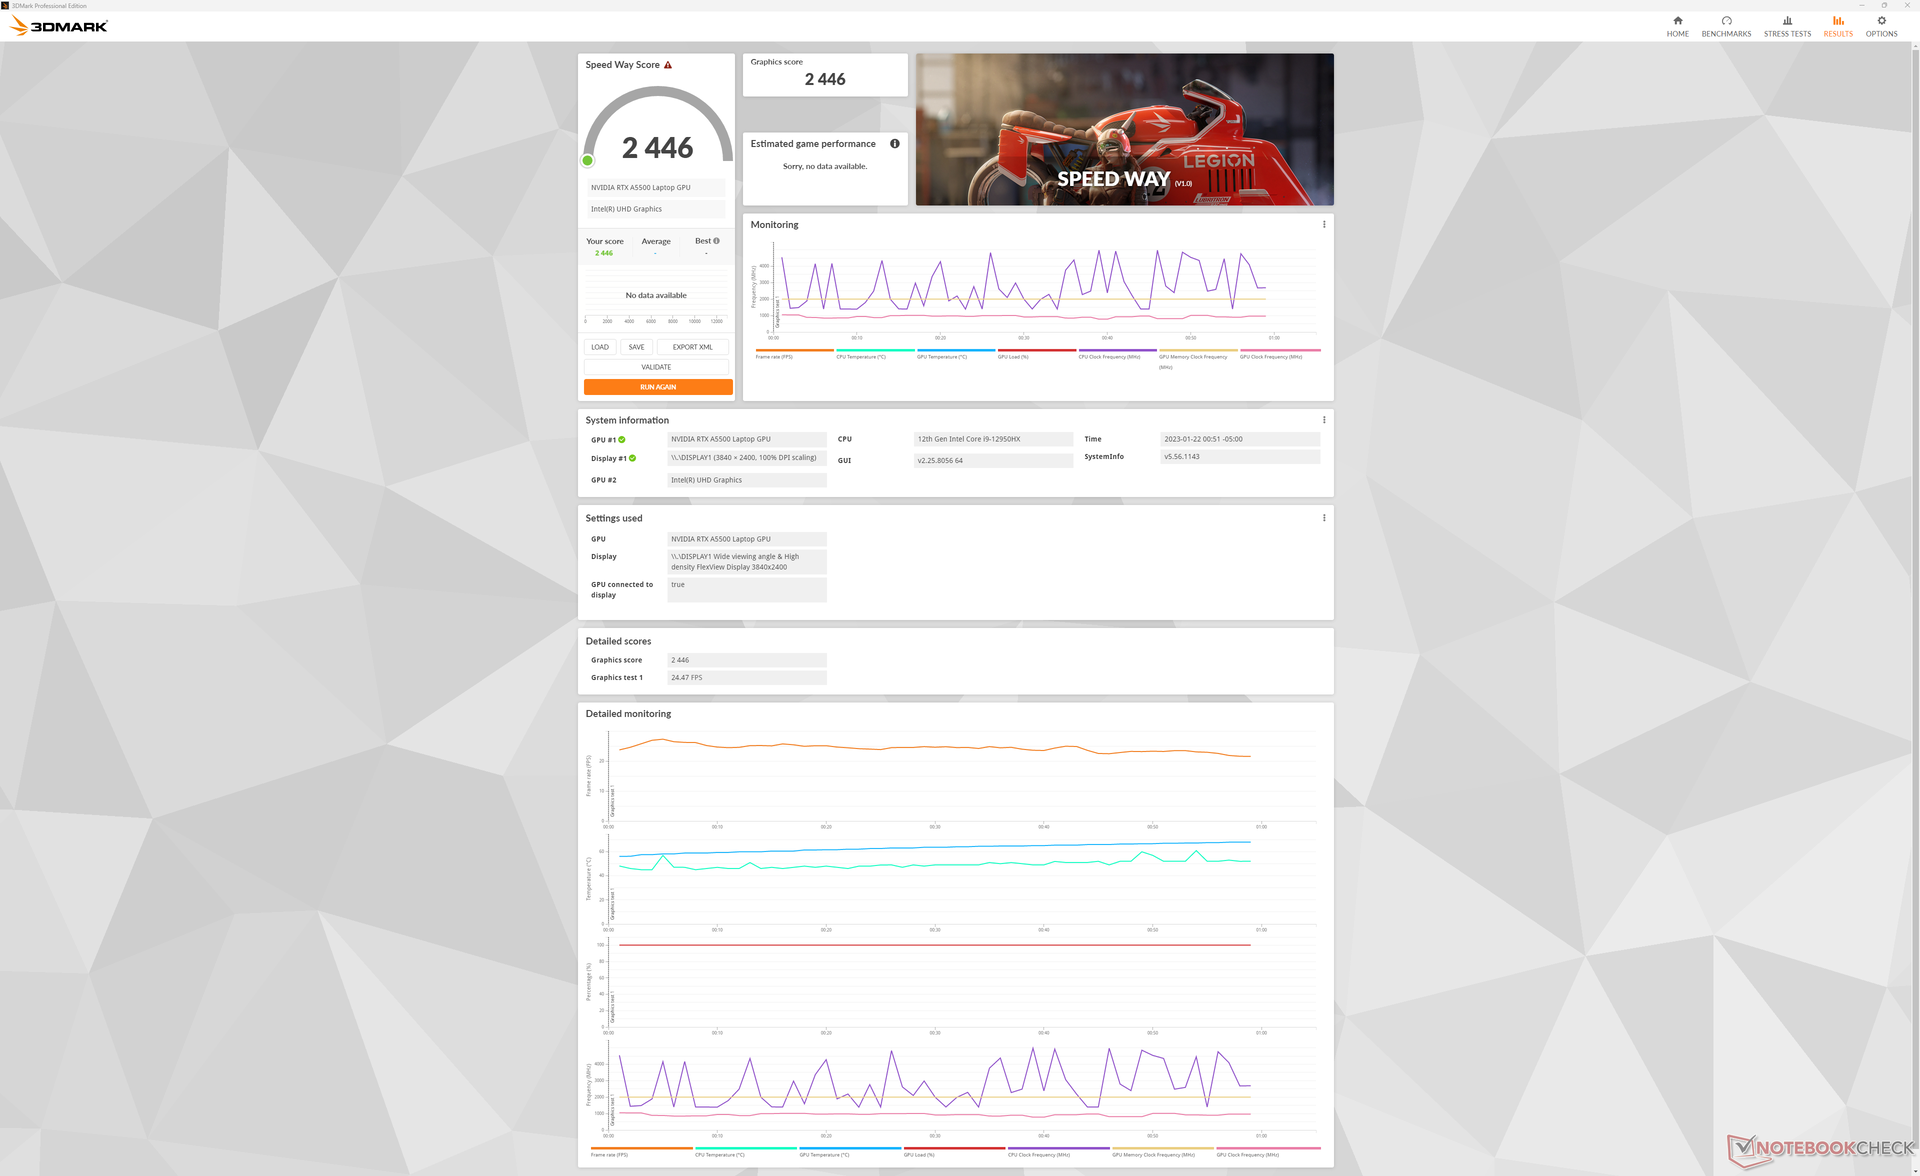
O RTX A5500 em nossa Lenovo está realizando cerca de 10% mais rápido que a mesma GPU na concorrente Precision 7670. Isto apesar do fato de que a GPU na Dell é classificada para um TGP de 135 W contra o TGP de 130 W em nossa Lenovo, de acordo com o painel de controle da Nvidia. Deslocando-se para a parte inferior RTX A2000 A SKU reduzirá o desempenho gráfico em até 50% a 65%.
| 3DMark Performance rating - Percent | |
| Lenovo Legion 7 16IAX7-82TD004SGE -34! | |
| Lenovo ThinkPad P16 G1 RTX A5500 | |
| Dell Precision 7000 7670 Performance -1! | |
| Média NVIDIA RTX A5500 Laptop GPU | |
| Asus ProArt StudioBook 16 W7600H5A-2BL2 -19! | |
| MSI WE76 11UM-456 -9! | |
| HP ZBook Fury 15 G8 -1! | |
| MSI CreatorPro Z16P B12UKST -17! | |
| HP ZBook Studio 15 G8 -17! | |
| HP ZBook Studio G7 -17! | |
| HP ZBook Studio 16 G9 62U04EA -9! | |
| Dell Precision 5000 5470 -9! | |
| Lenovo ThinkPad P16 G1 21D6001DMB -17! | |
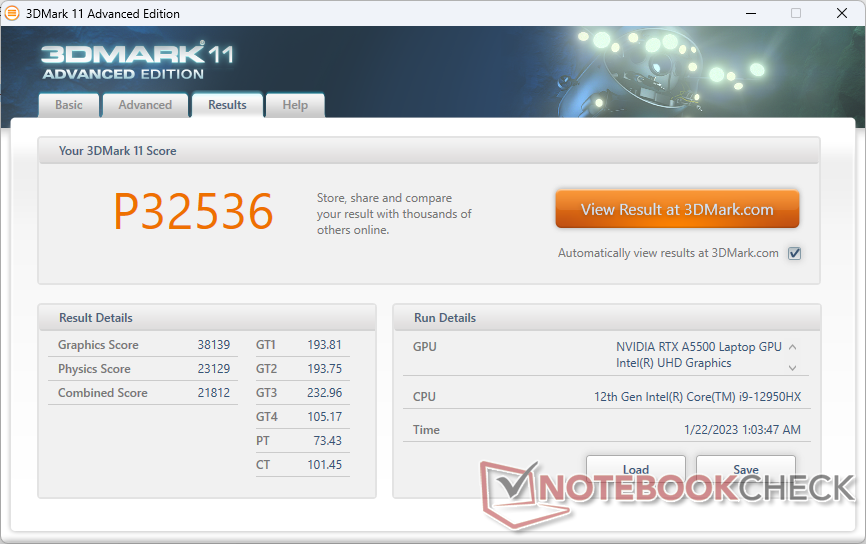
| 3DMark 11 Performance | 32536 pontos | |
| 3DMark Cloud Gate Standard Score | 54323 pontos | |
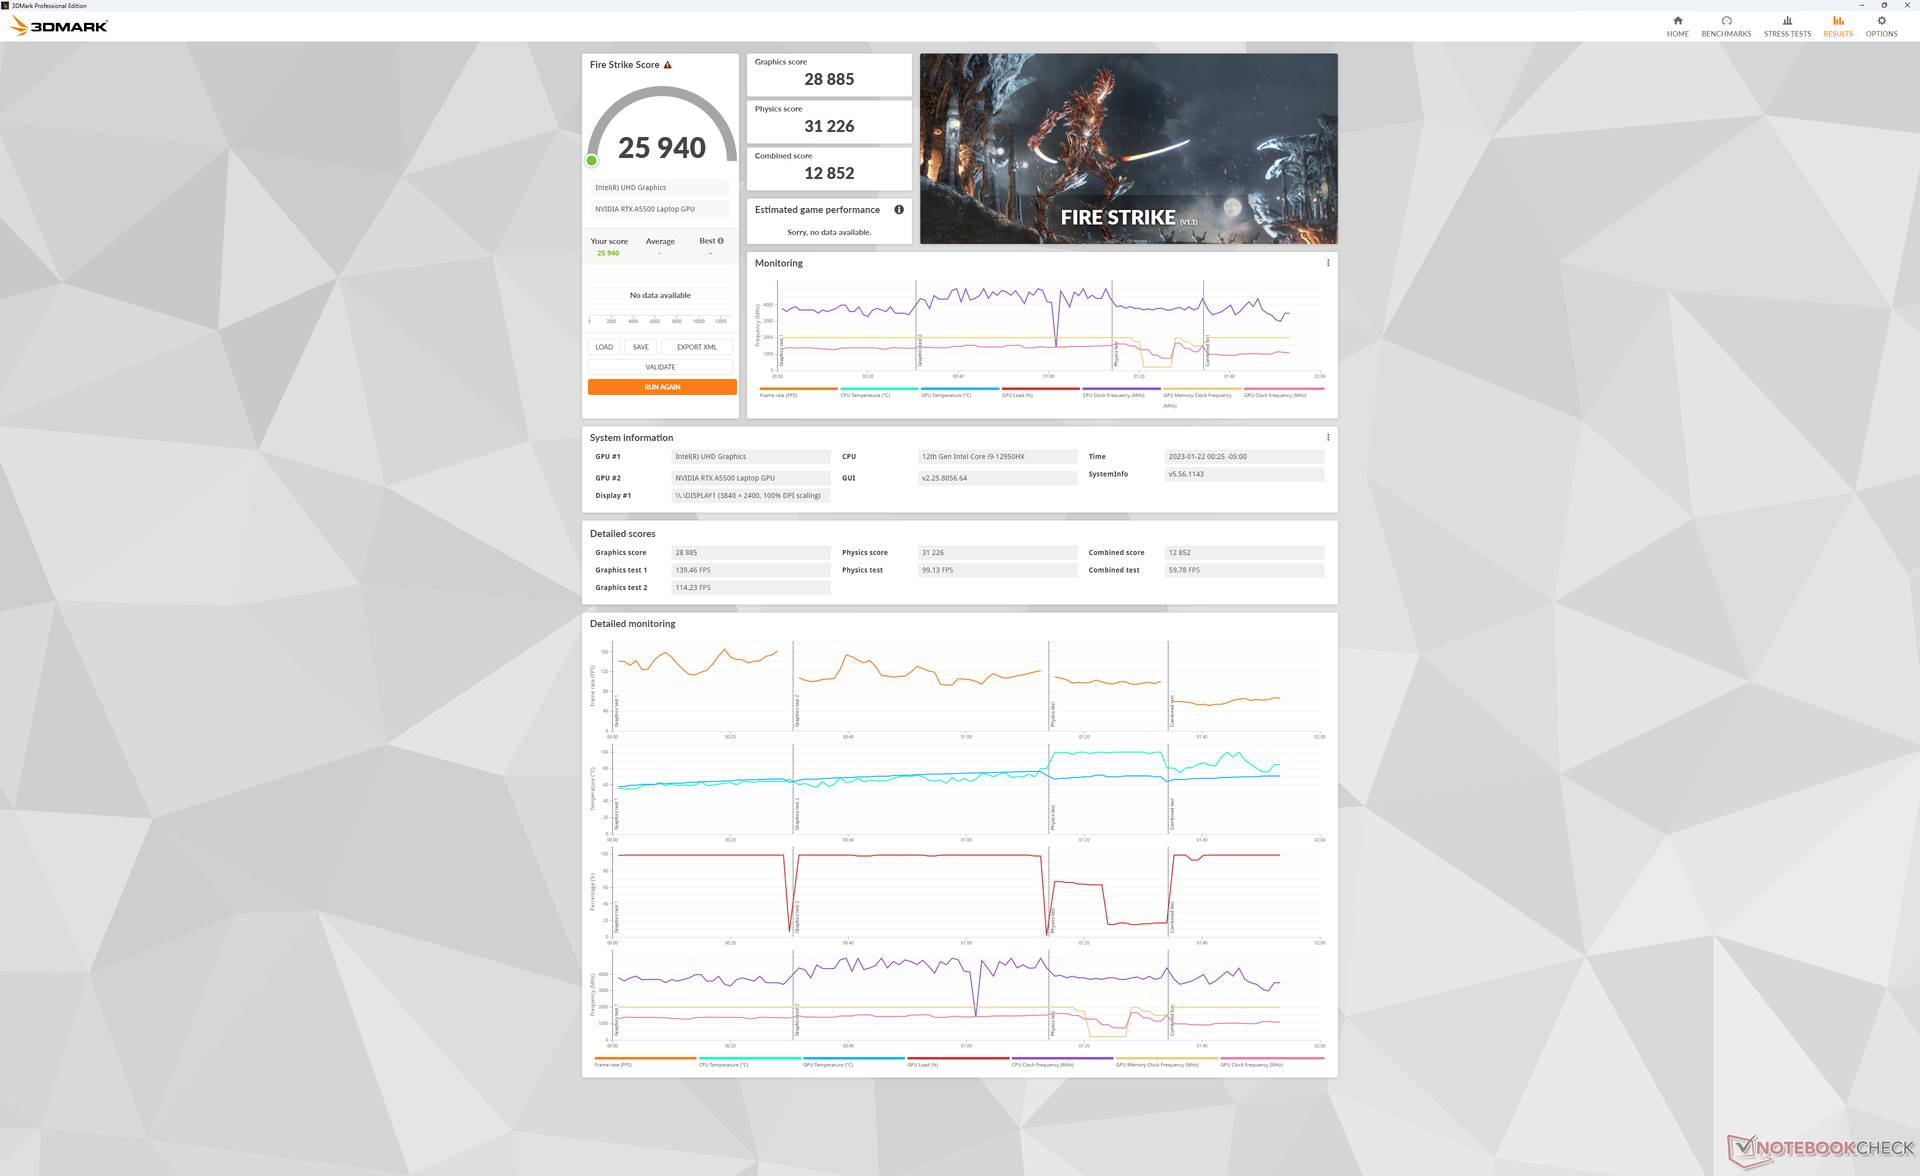
| 3DMark Fire Strike Score | 25940 pontos | |
| 3DMark Time Spy Score | 10760 pontos | |
Ajuda | ||
* ... menor é melhor
Witcher 3 FPS Chart
| baixo | média | alto | ultra | QHD | 4K | |
|---|---|---|---|---|---|---|
| GTA V (2015) | 185.9 | 183.4 | 177.7 | 124.4 | 103.5 | |
| The Witcher 3 (2015) | 489.4 | 329.9 | 211.8 | 110.4 | 63.7 | |
| Dota 2 Reborn (2015) | 194.3 | 174.5 | 166.1 | 156.3 | 132.8 | |
| Final Fantasy XV Benchmark (2018) | 212 | 142.5 | 113.1 | 83.5 | 45.4 | |
| X-Plane 11.11 (2018) | 155.8 | 137.6 | 108.8 | 93.7 | ||
| Strange Brigade (2018) | 442 | 264 | 223 | 197.7 | 138.6 | |
| Cyberpunk 2077 1.6 (2022) | 132.3 | 117.7 | 96.1 | 80.7 | 47 | 20.4 |
Emissões
Ruído do sistema
Quando no modo balanceado padrão, os ventiladores permaneceriam silenciosos por períodos mais longos do que o esperado, apesar dos processadores de alto desempenho no interior. Ao rodar o 3DMark 06, por exemplo, o nariz do ventilador ficaria a apenas 28 dB(A) no final da primeira cena de referência. Seria necessário fazer várias execuções antes que os ventiladores pulsassem a RPMs mais altas até a faixa de 40 dB(A).
O ruído dos ventiladores ao executar cargas mais exigentes no modo Performance seria superior a pouco mais de 50 dB(A) para ser visivelmente mais alto do que as estações de trabalho concorrentes, incluindo a Precision 7670, como mostra a tabela abaixo. Naturalmente, estas alternativas também são mais lentas do que nossa configuração Lenovo.
Barulho
| Ocioso |
| 23.1 / 23.1 / 23.1 dB |
| Carga |
| 28.9 / 51.4 dB |
 | ||
30 dB silencioso 40 dB(A) audível 50 dB(A) ruidosamente alto |
||
min: | ||
| Lenovo ThinkPad P16 G1 RTX A5500 RTX A5500 Laptop GPU, i9-12950HX, WDC PC SN810 2TB | Asus ProArt StudioBook 16 W7600H5A-2BL2 RTX A5000 Laptop GPU, W-11955M, 2x Micron 2300 2TB MTFDHBA2T0TDV (RAID 0) | Dell Precision 7000 7670 Performance RTX A5500 Laptop GPU, i9-12950HX | Lenovo ThinkPad P16 G1 21D6001DMB RTX A2000 Laptop GPU, i7-12850HX, Micron 3400 1TB MTFDKBA1T0TFH | MSI CreatorPro Z16P B12UKST RTX A3000 Laptop GPU, i7-12700H, Samsung PM9A1 MZVL21T0HCLR | HP ZBook Studio 16 G9 62U04EA RTX A2000 Laptop GPU, i7-12800H, Micron 3400 1TB MTFDKBA1T0TFH | |
|---|---|---|---|---|---|---|
| Noise | -14% | -16% | -6% | -11% | -9% | |
| desligado / ambiente * (dB) | 23.1 | 26 -13% | 23.9 -3% | 23.2 -0% | 24.1 -4% | 24 -4% |
| Idle Minimum * (dB) | 23.1 | 26 -13% | 24 -4% | 23.2 -0% | 27.1 -17% | 24 -4% |
| Idle Average * (dB) | 23.1 | 26 -13% | 24 -4% | 23.2 -0% | 27.1 -17% | 27.7 -20% |
| Idle Maximum * (dB) | 23.1 | 26.5 -15% | 38 -65% | 23.2 -0% | 27.1 -17% | 27.7 -20% |
| Load Average * (dB) | 28.9 | 42 -45% | 46.3 -60% | 47.8 -65% | 42.9 -48% | 39.8 -38% |
| Witcher 3 ultra * (dB) | 51.6 | 41.9 19% | 34.1 34% | 44 15% | 44.3 14% | |
| Load Maximum * (dB) | 51.4 | 43 16% | 47.9 7% | 56.3 -10% | 47 9% | 47.7 7% |
* ... menor é melhor
Temperatura
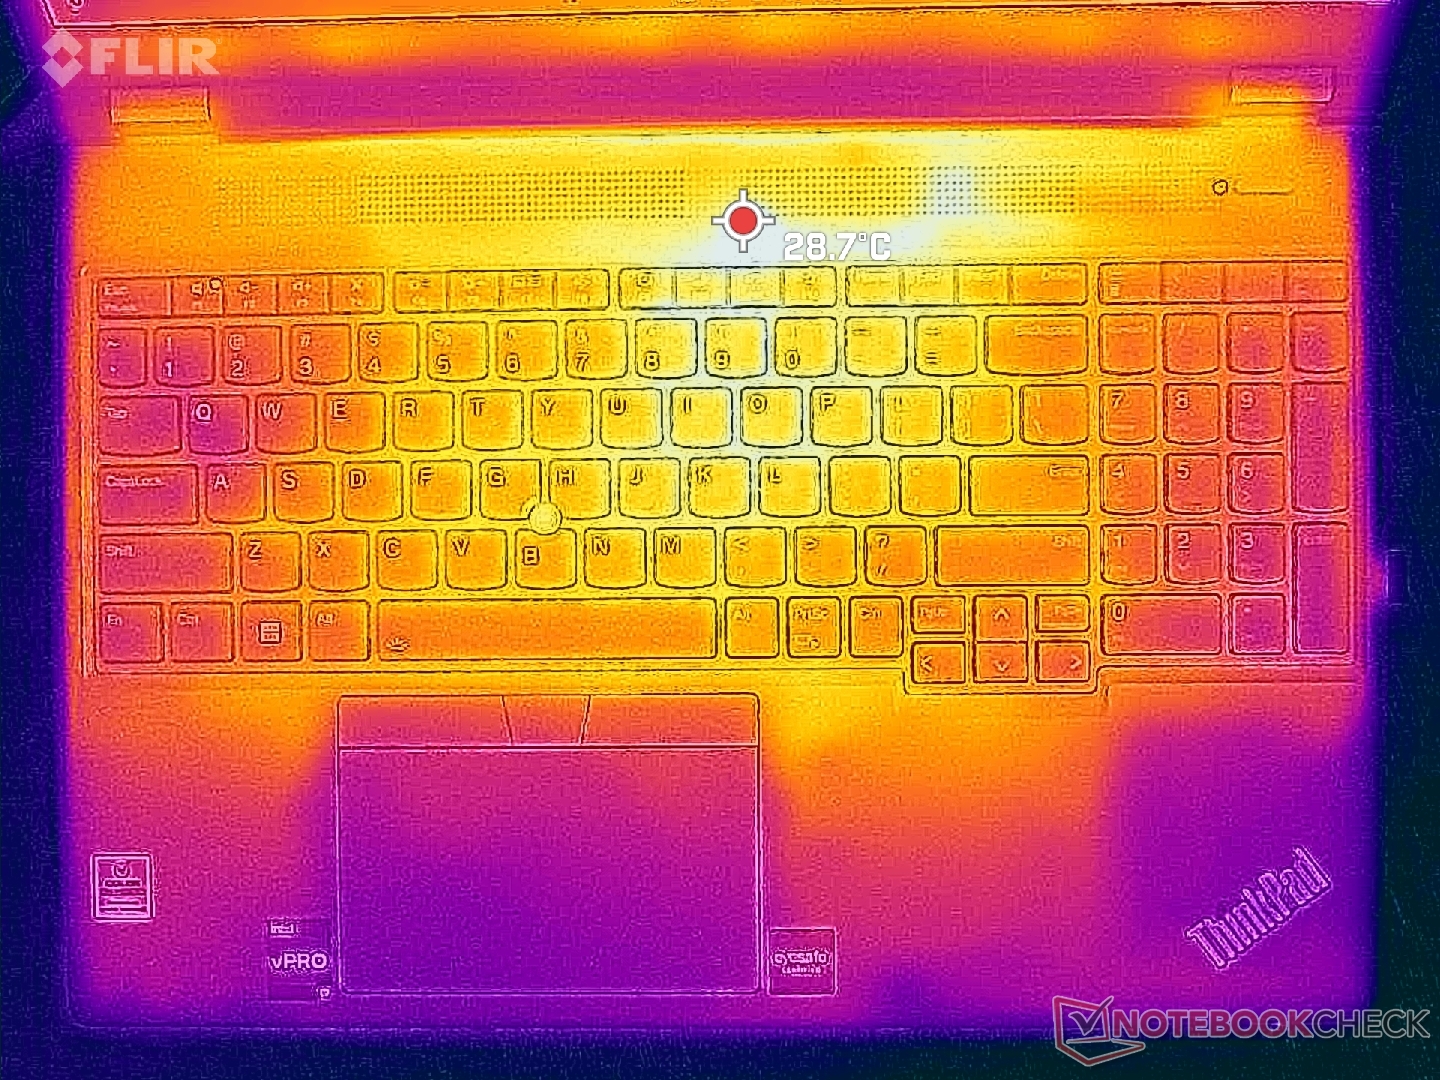
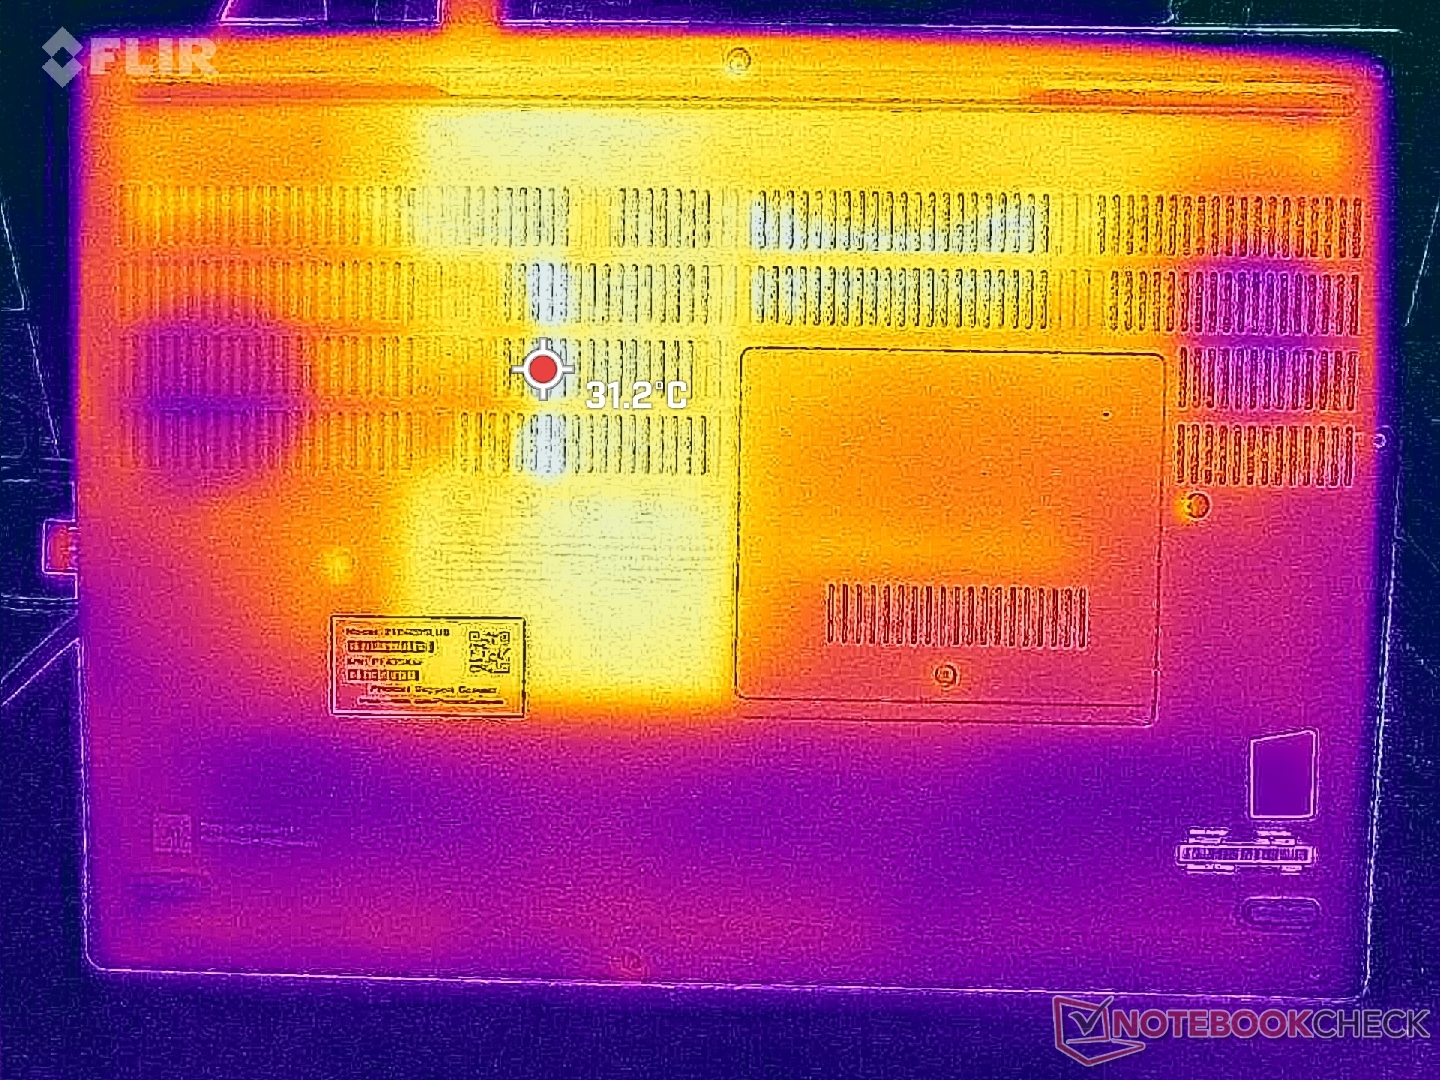
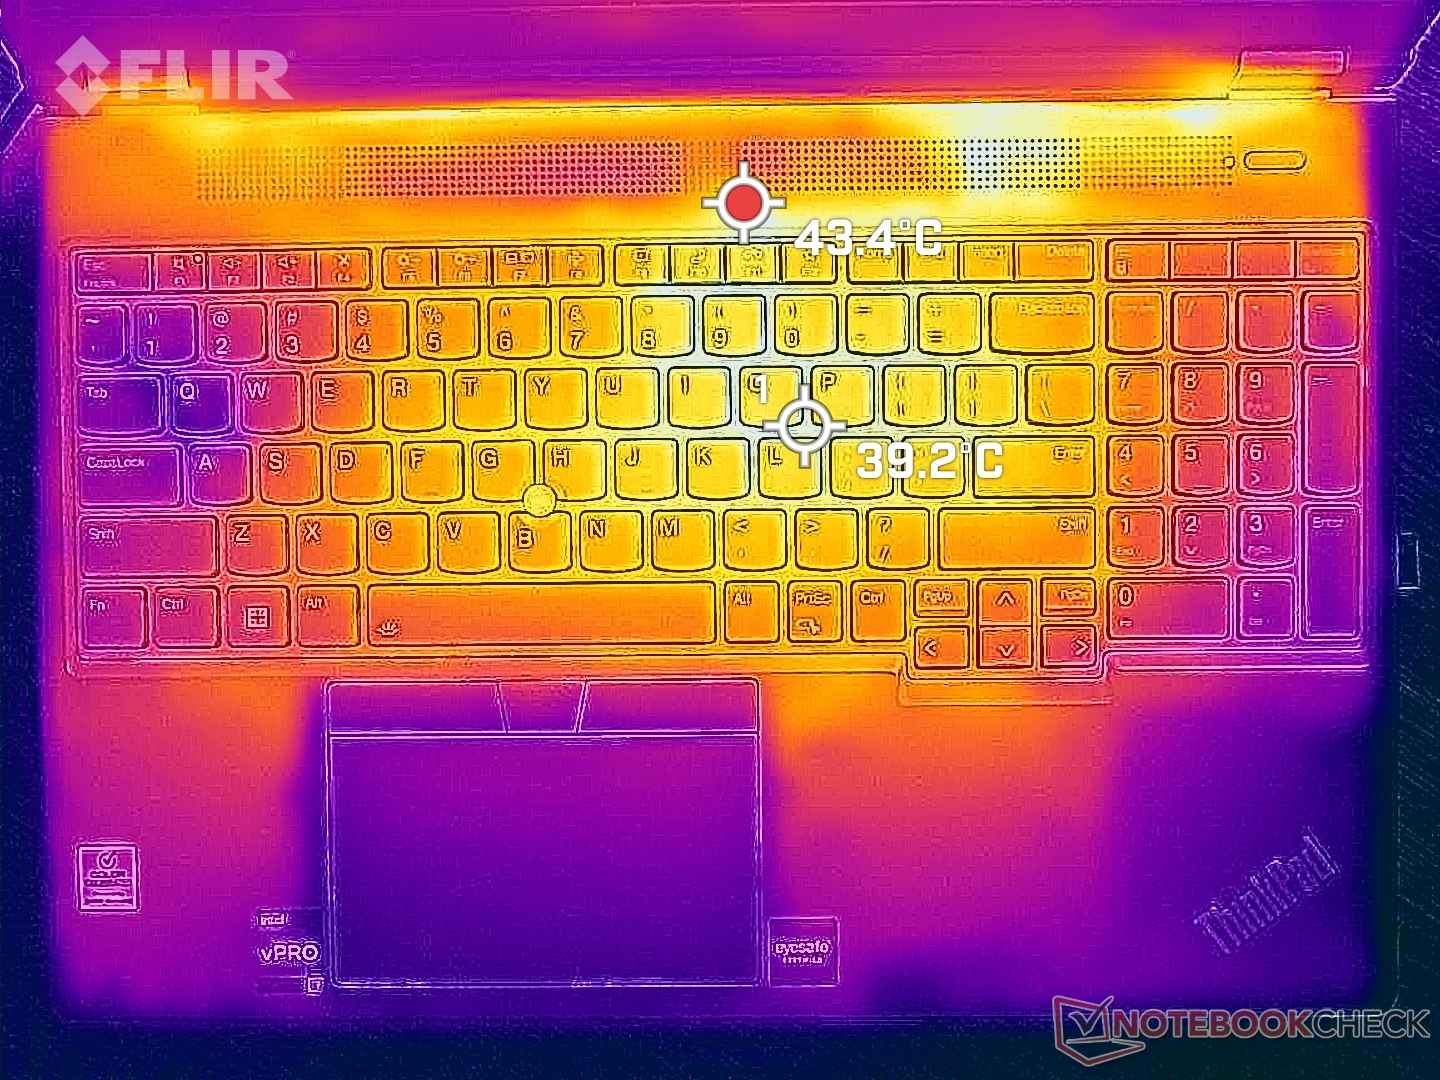
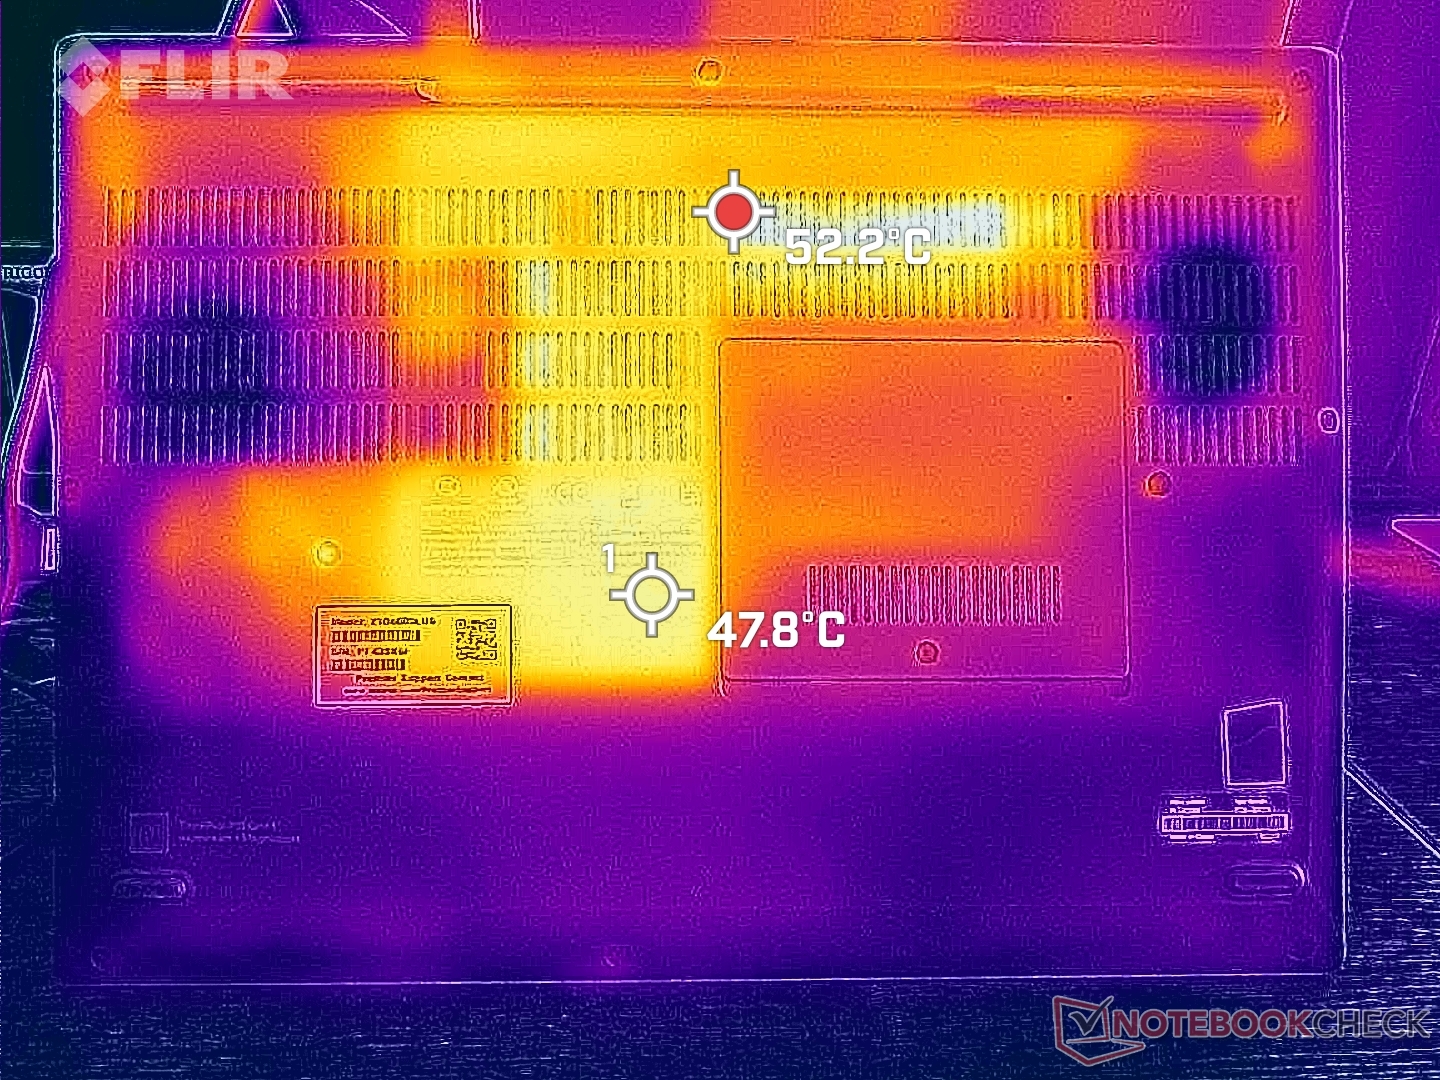
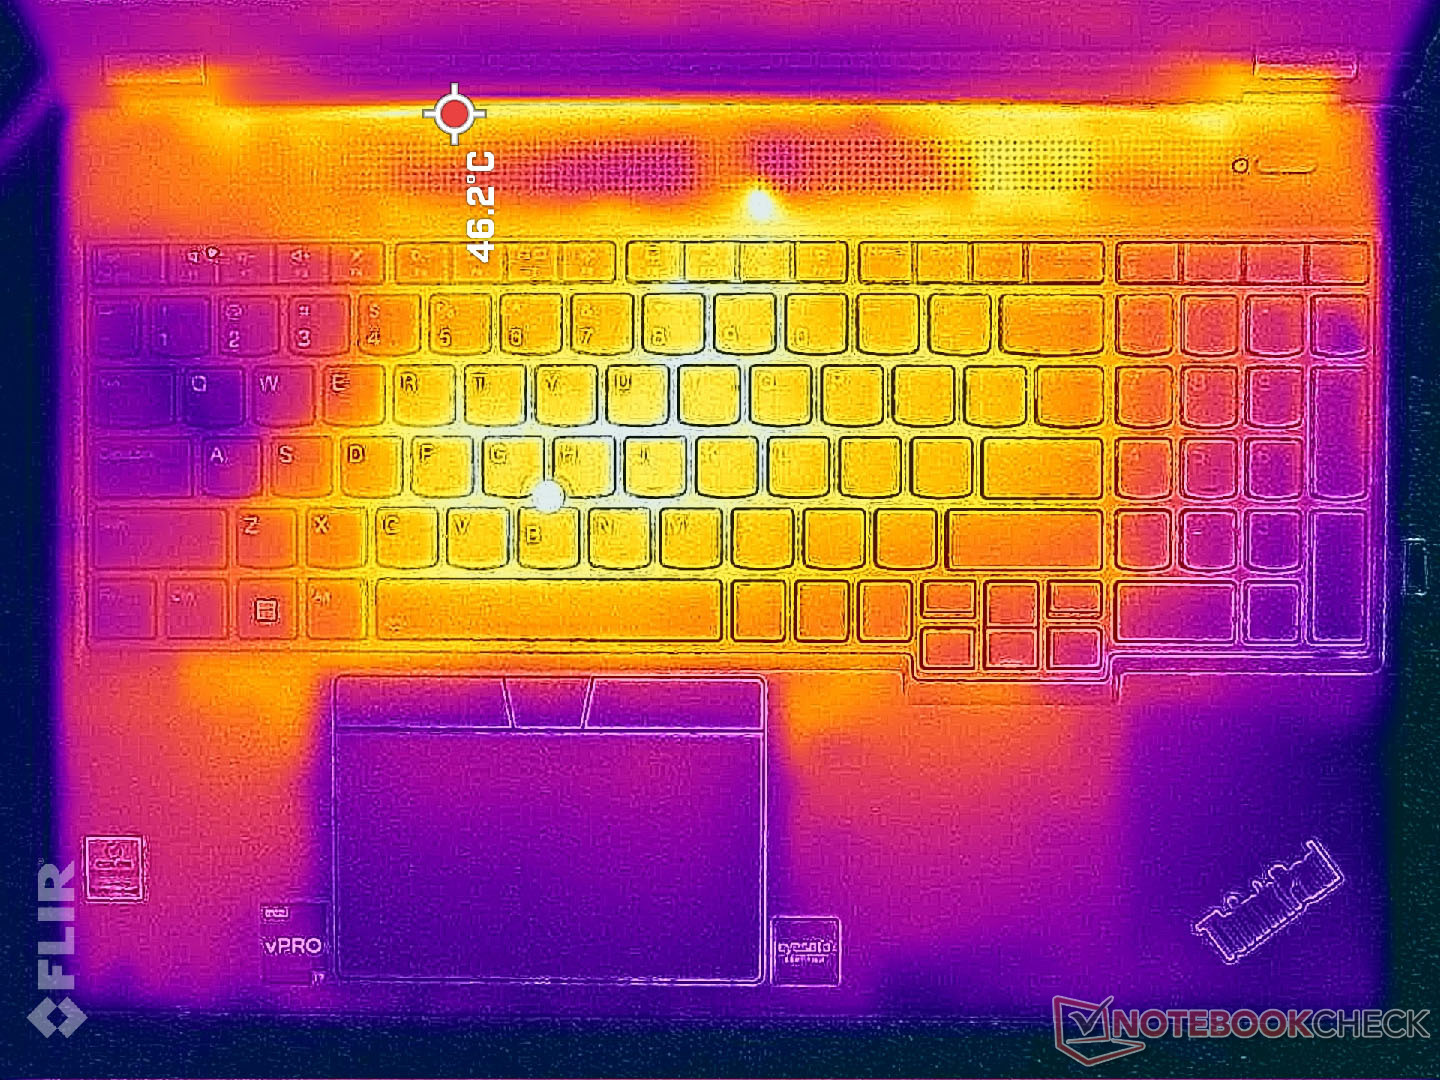
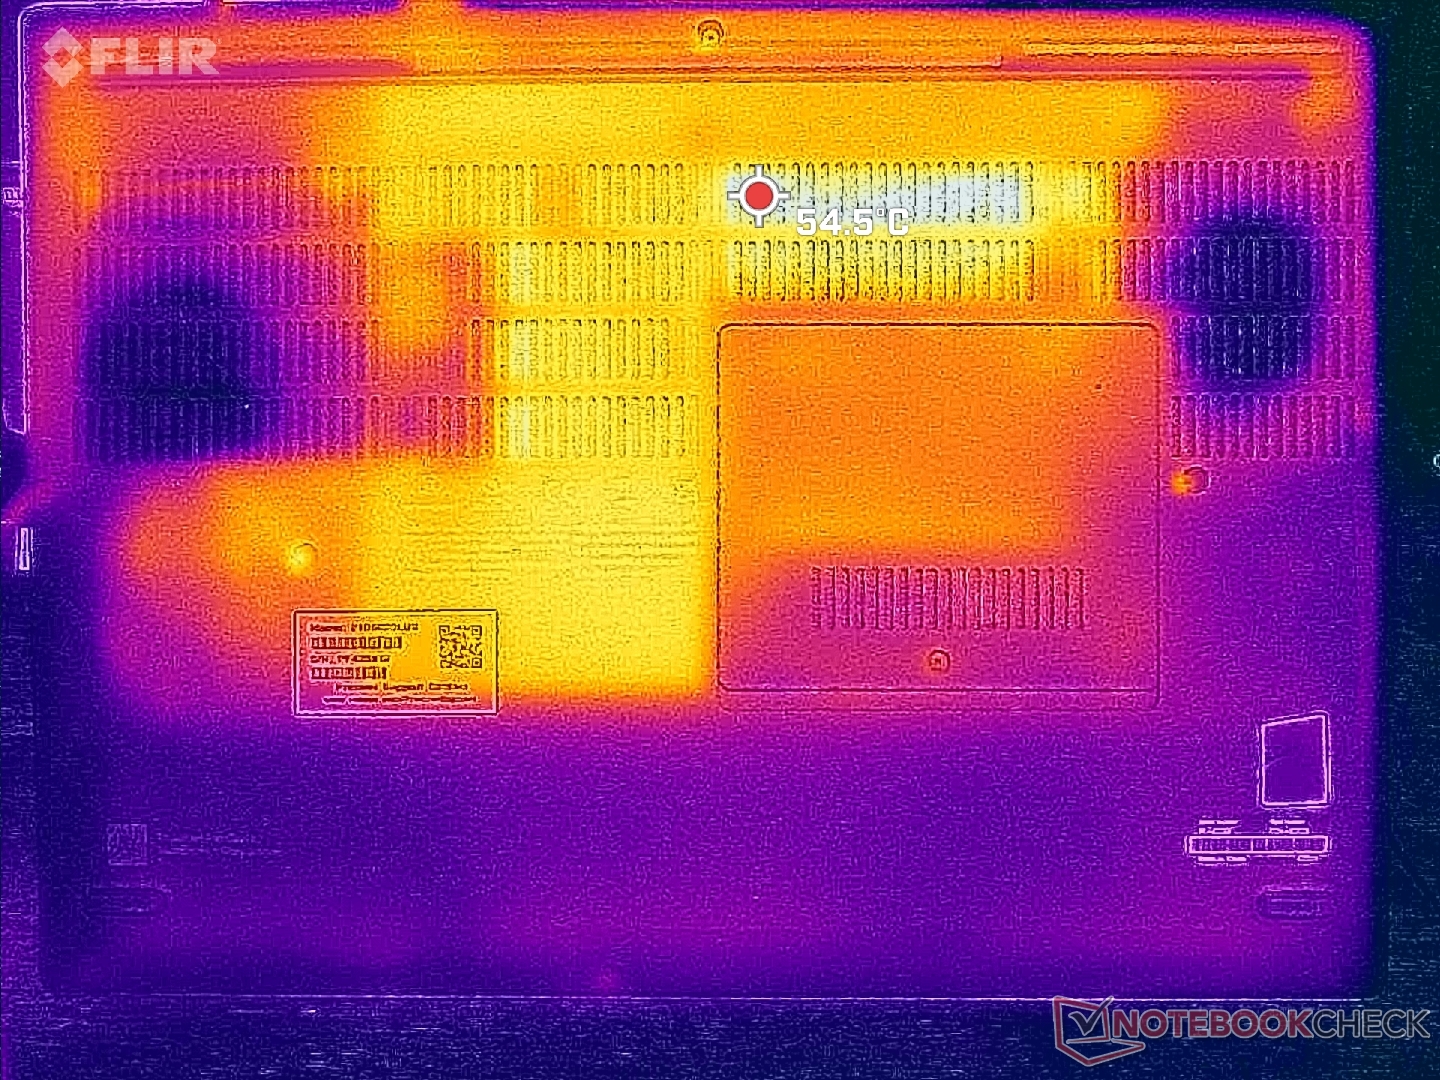
As temperaturas de superfície são mais quentes do que o esperado, mesmo quando ociosas na área de trabalho, sem aplicações em execução. O fundo, por exemplo, pode ser tão quente quanto 37 C em comparação com apenas 31 C no Precision 7670. Se a carga for maior, estes mesmos pontos quentes na Lenovo podem atingir 49 C ou mais quentes enquanto o centro do teclado pode atingir 40 C. As temperaturas da pele podem ser desconfortáveis se o laptop estiver sobre a volta em vez de sobre uma mesa.
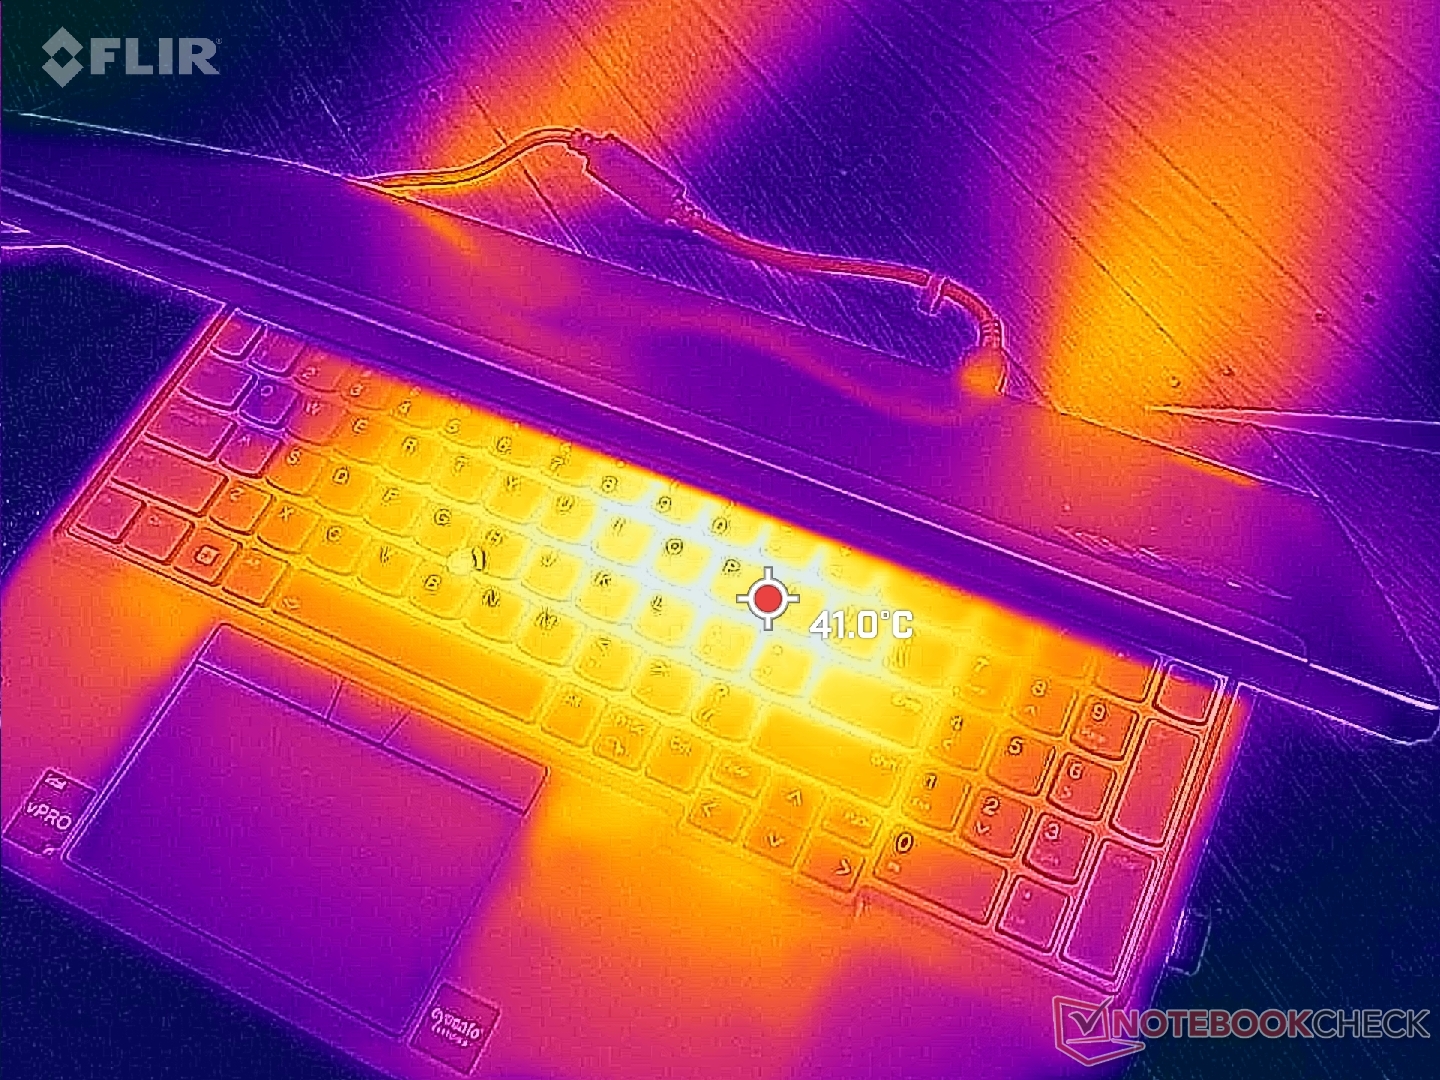
(±) A temperatura máxima no lado superior é 44.8 °C / 113 F, em comparação com a média de 38.2 °C / 101 F , variando de 22.2 a 69.8 °C para a classe Workstation.
(-) A parte inferior aquece até um máximo de 49.8 °C / 122 F, em comparação com a média de 41.1 °C / 106 F
(+) Em uso inativo, a temperatura média para o lado superior é 28.6 °C / 83 F, em comparação com a média do dispositivo de 32 °C / ### class_avg_f### F.
(±) Jogando The Witcher 3, a temperatura média para o lado superior é 36.4 °C / 98 F, em comparação com a média do dispositivo de 32 °C / ## #class_avg_f### F.
(+) Os apoios para as mãos e o touchpad estão atingindo a temperatura máxima da pele (32.4 °C / 90.3 F) e, portanto, não estão quentes.
(-) A temperatura média da área do apoio para as mãos de dispositivos semelhantes foi 27.8 °C / 82 F (-4.6 °C / -8.3 F).
| Lenovo ThinkPad P16 G1 RTX A5500 Intel Core i9-12950HX, NVIDIA RTX A5500 Laptop GPU | Asus ProArt StudioBook 16 W7600H5A-2BL2 Intel Xeon W-11955M, NVIDIA RTX A5000 Laptop GPU | Dell Precision 7000 7670 Performance Intel Core i9-12950HX, NVIDIA RTX A5500 Laptop GPU | Lenovo ThinkPad P16 G1 21D6001DMB Intel Core i7-12850HX, NVIDIA RTX A2000 Laptop GPU | MSI CreatorPro Z16P B12UKST Intel Core i7-12700H, NVIDIA RTX A3000 Laptop GPU | HP ZBook Studio 16 G9 62U04EA Intel Core i7-12800H, NVIDIA RTX A2000 Laptop GPU | |
|---|---|---|---|---|---|---|
| Heat | -1% | -3% | 17% | -3% | 9% | |
| Maximum Upper Side * (°C) | 44.8 | 45.7 -2% | 53 -18% | 43.1 4% | 56.3 -26% | 38.7 14% |
| Maximum Bottom * (°C) | 49.8 | 48.3 3% | 43.2 13% | 39.9 20% | 68.3 -37% | 53.4 -7% |
| Idle Upper Side * (°C) | 30.6 | 35.3 -15% | 36.8 -20% | 26 15% | 25.2 18% | 27.3 11% |
| Idle Bottom * (°C) | 38.6 | 34.4 11% | 33.8 12% | 27.6 28% | 25.9 33% | 31.6 18% |
* ... menor é melhor
Teste de estresse
O sistema está definitivamente pressionando quando os processadores estão sob carga pesada. Ao executar Prime95, por exemplo, as taxas de clock da CPU e o consumo de energia da placa aumentariam para 4,1 GHz e 135 W, respectivamente. Infelizmente, a temperatura central subiria para 100 C quase imediatamente e assim as taxas de clock cairiam rapidamente para evitar temperaturas ainda mais quentes. O processador eventualmente estabilizaria em 3 GHz, 82 W e 100 C, o que significa que ele está empurrando os limites da solução de resfriamento ThinkPad P16 G1. Repetir este teste no Precision 7670 equipado com o mesmo processador resultaria em uma freqüência de clock mais lenta e estável de 2,3 GHz e uma temperatura central mais fria de 78 C.
Ao funcionar Witcher 3 para representar cargas elevadas, taxa de relógio GPU, relógio de memória e temperatura se estabilizariam em 1477 MHz, 2000 MHz e 78 C, respectivamente, em comparação com 1417 MHz, 1750 MHz e 82 C no Precision 7670 quando em condições semelhantes. O consumo de energia da placa também seria maior em nossa Lenovo a 129 W em comparação com apenas 100 W na Dell, o que explicaria as vantagens de desempenho da GPU mencionadas acima.
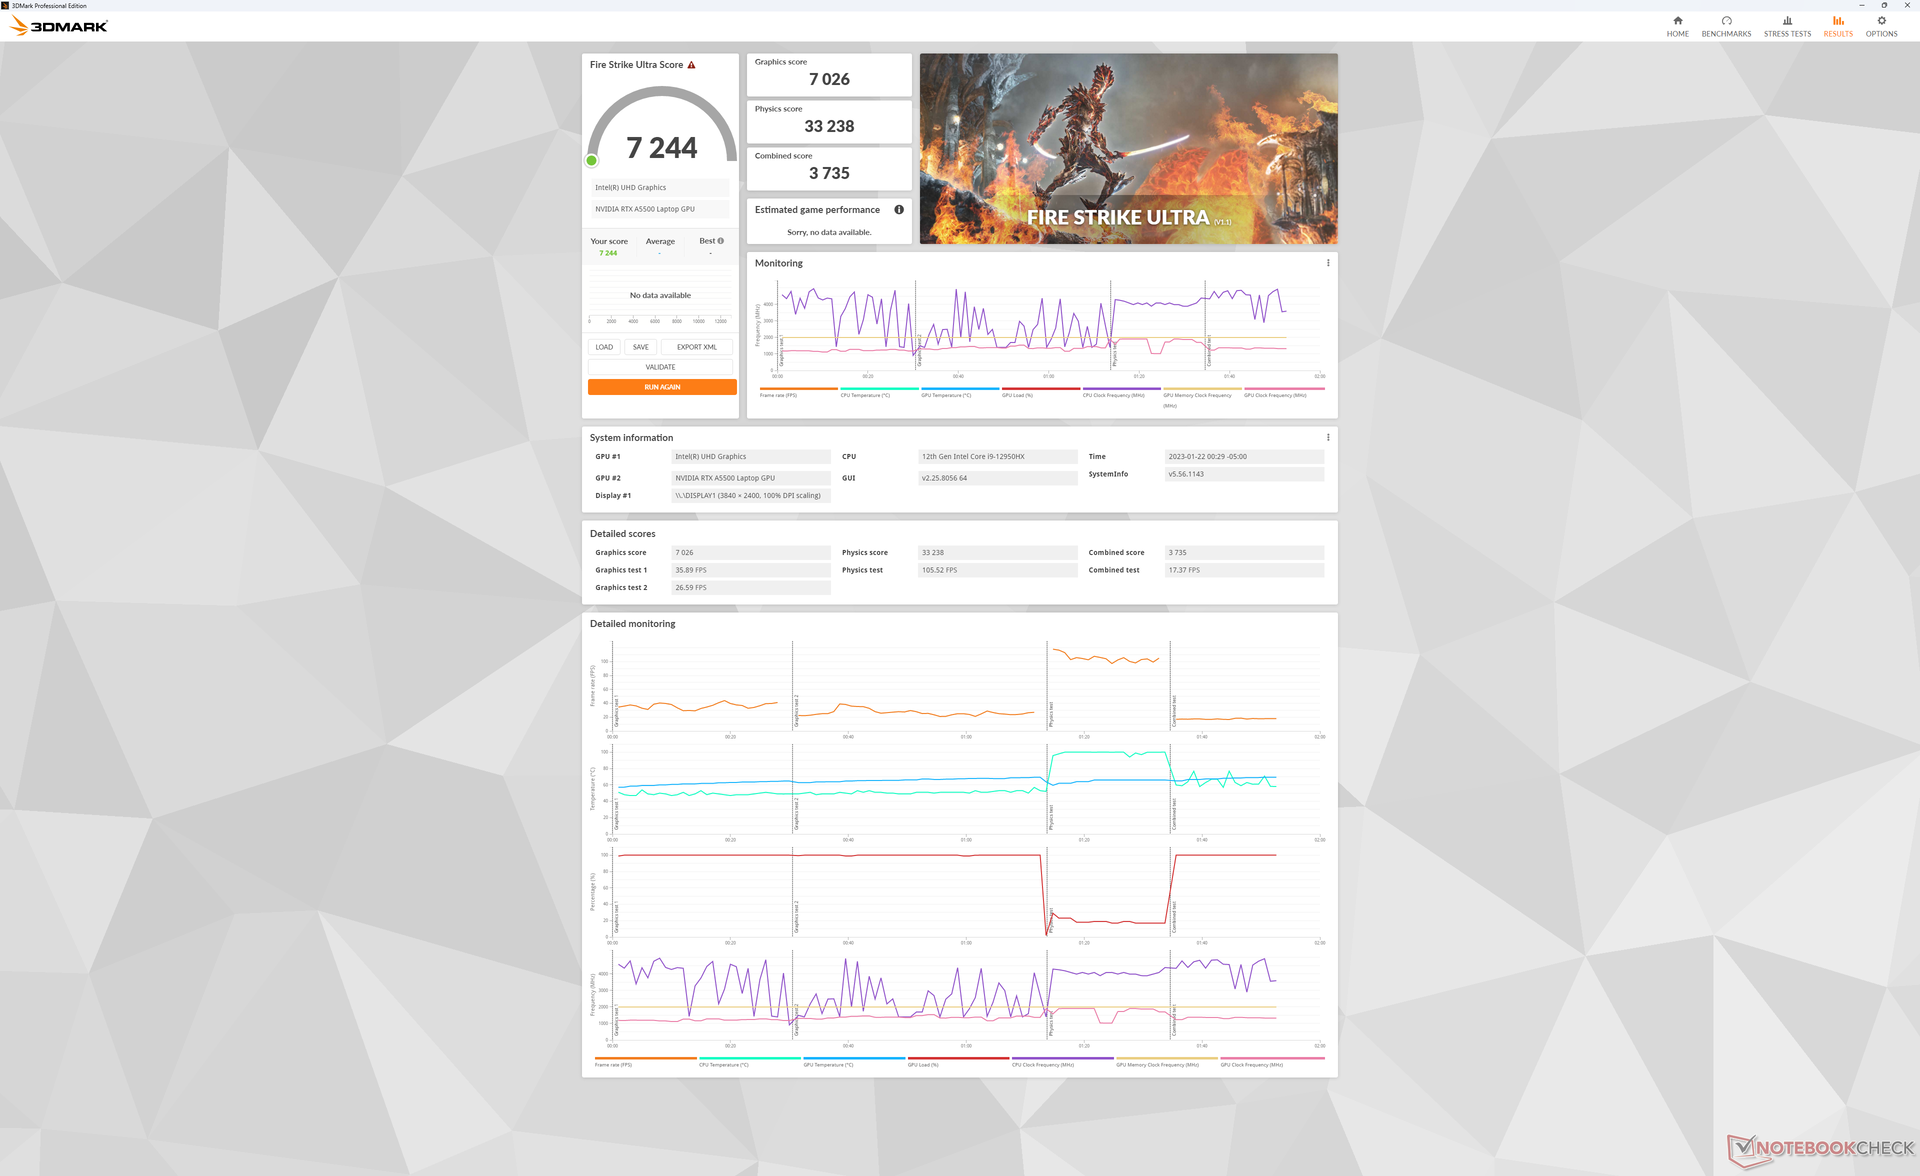
Funcionando com a potência da bateria limita o desempenho. Um teste Fire Strike em baterias retornaria pontuações de Física e Gráficos de 18903 e 12395 pontos, respectivamente, em comparação com 31226 e 28885 pontos quando em rede elétrica.
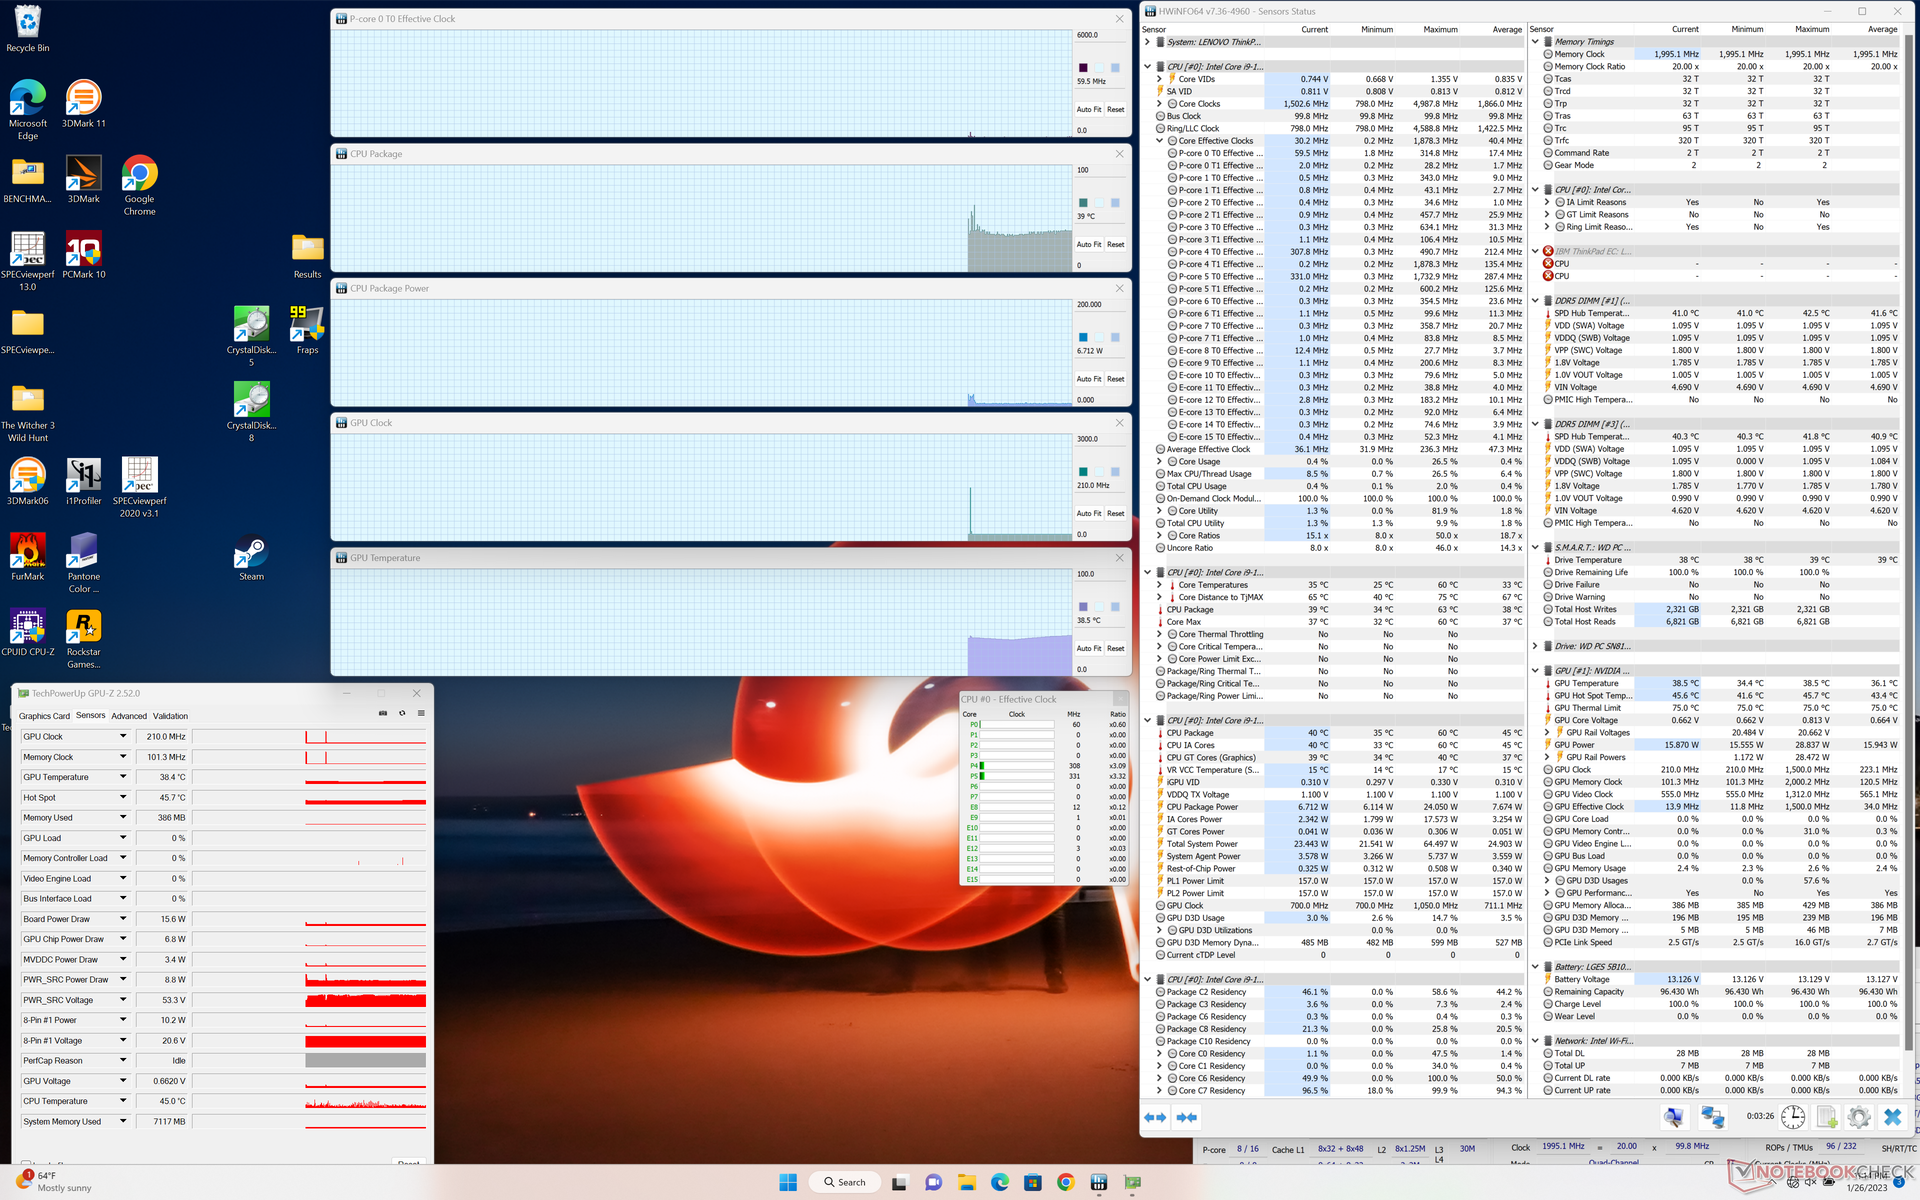
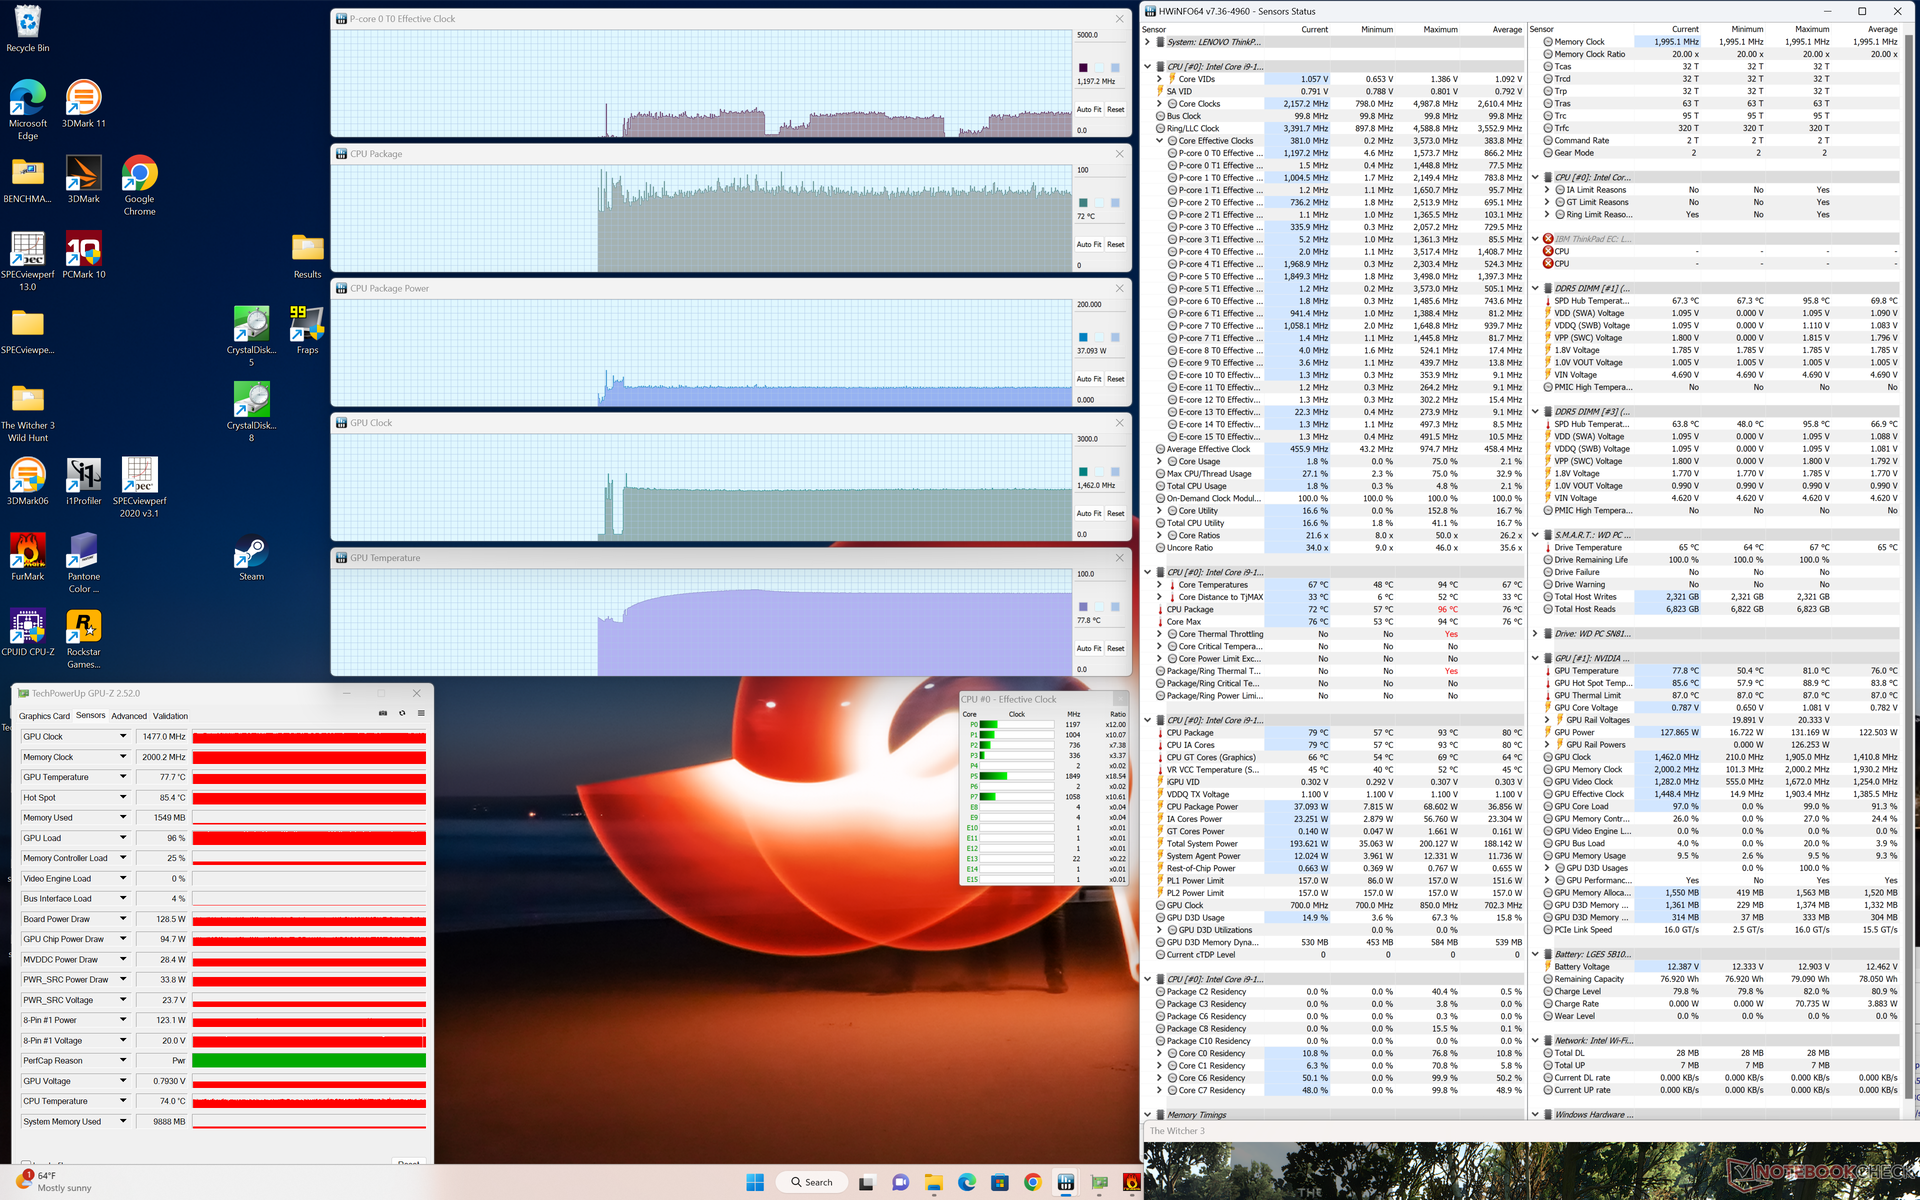
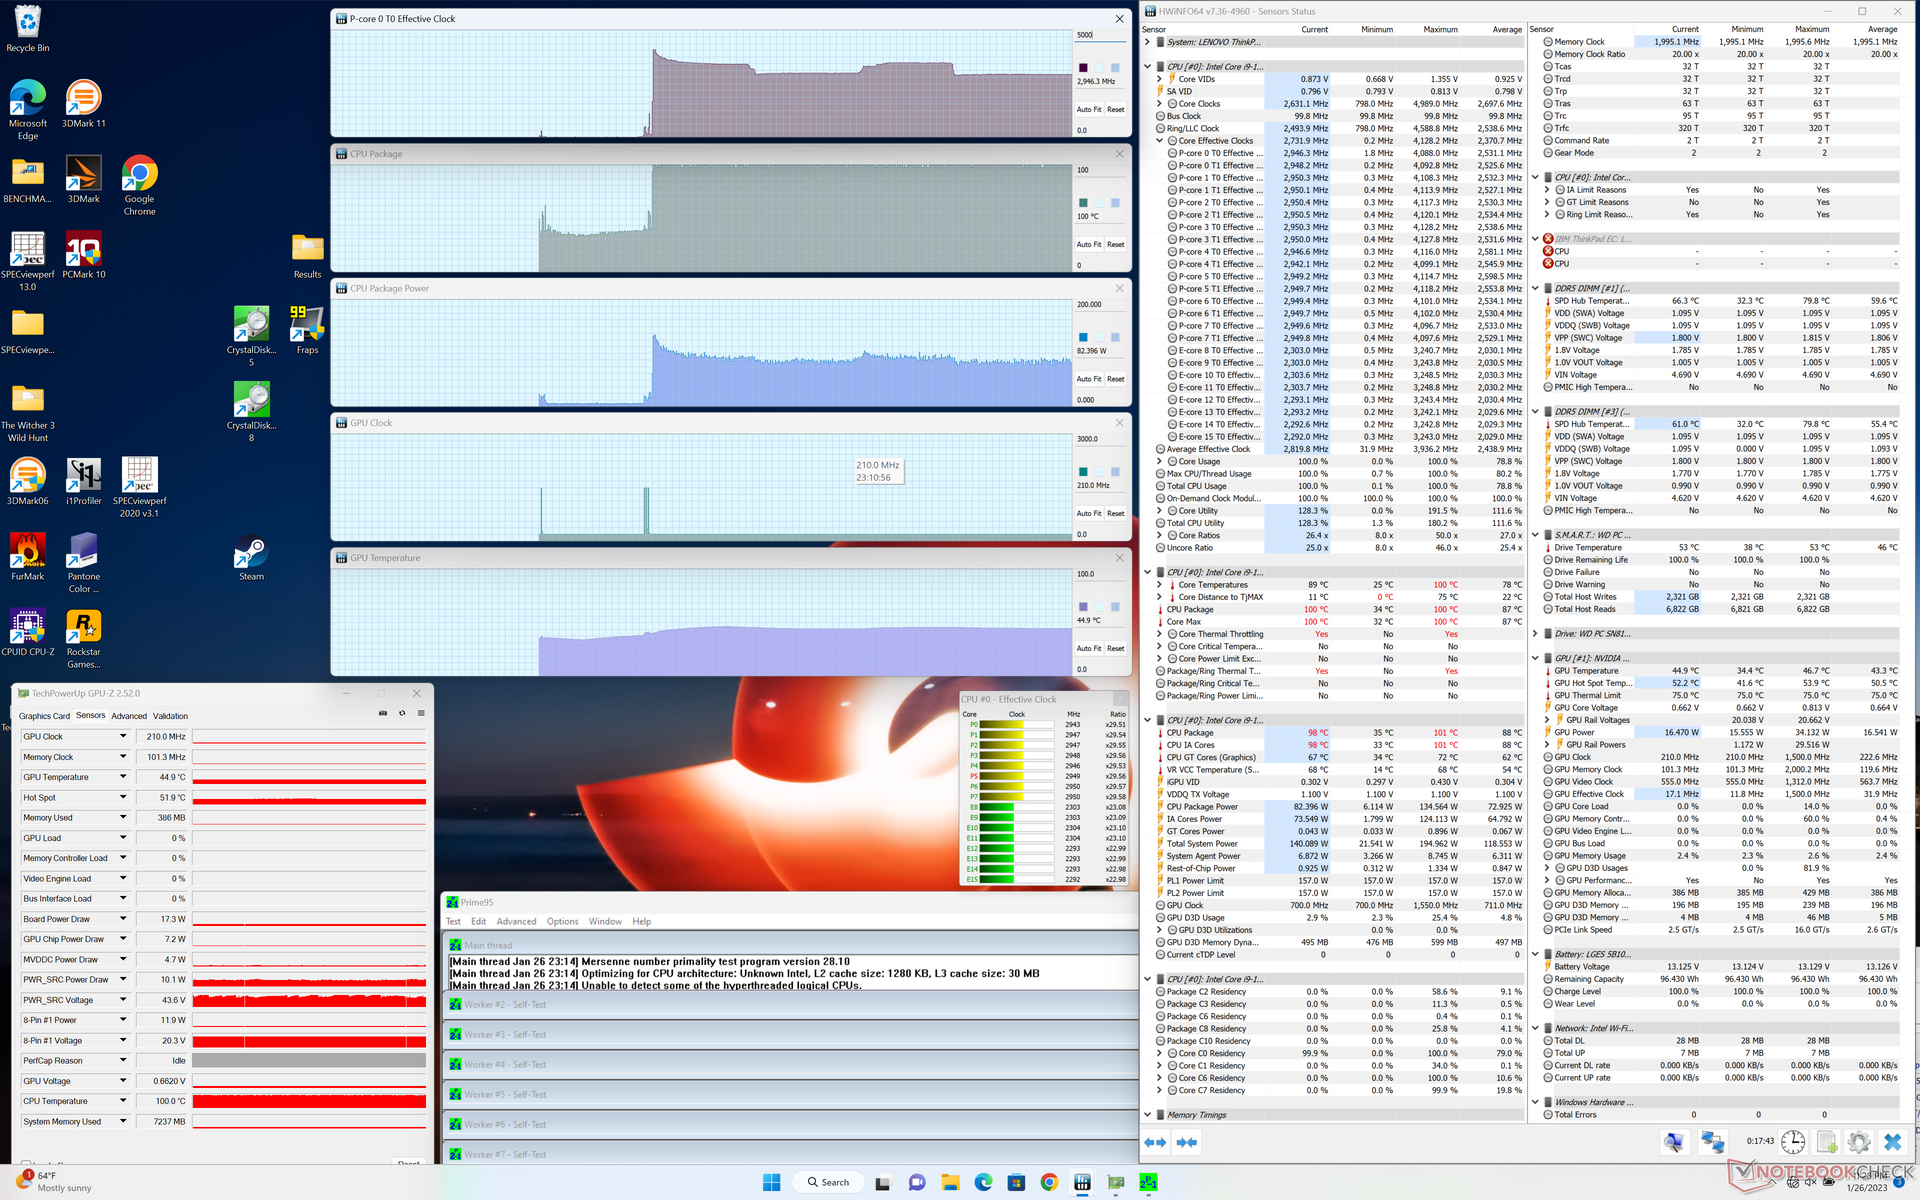
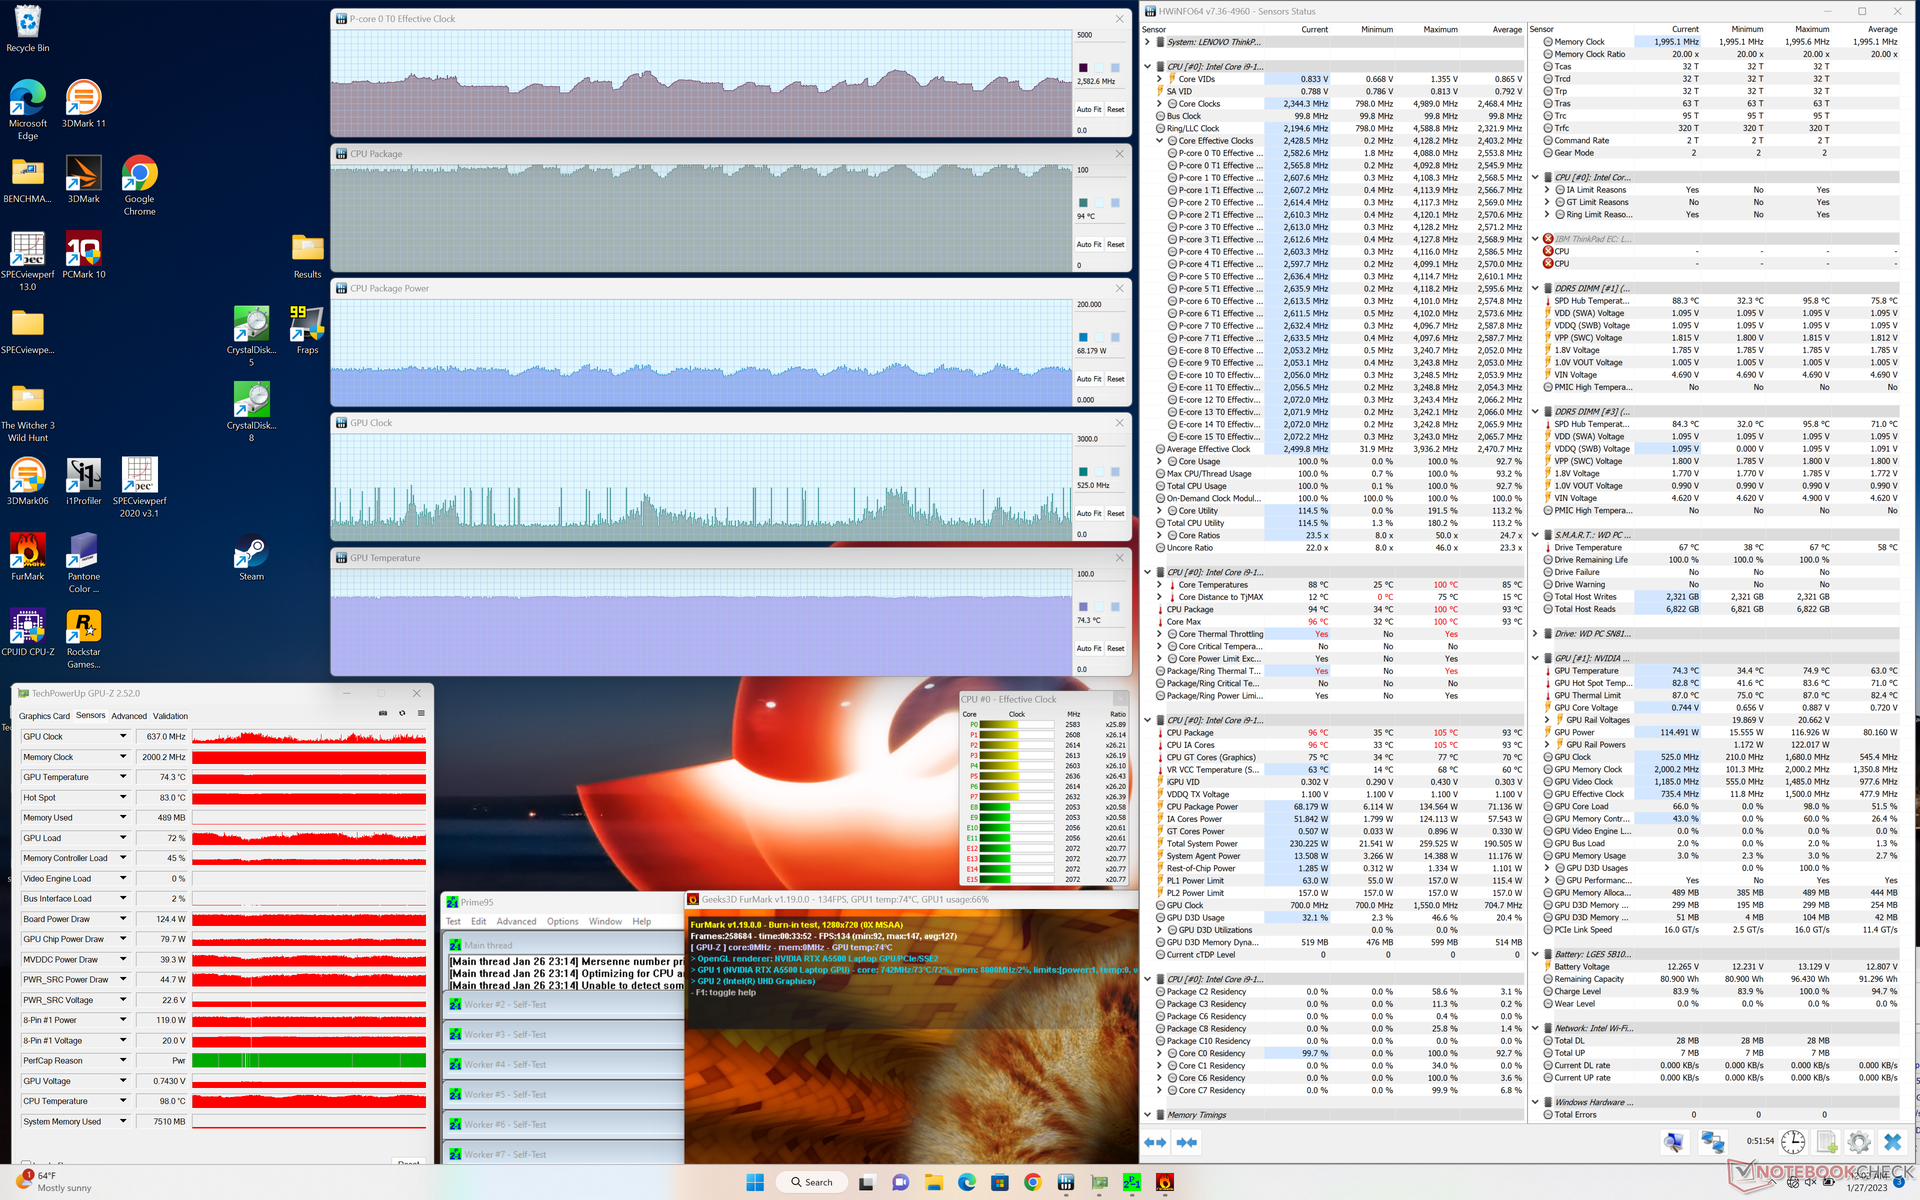
| Relógio CPU (GHz) | Relógio GPU (MHz) | Temperatura média da CPU (°C) | Temperatura média da GPU (°C) | |
| System Idle | -- | -- | 39 | 39 |
| Prime95 Stress | 3.0 | -- | 100 | 45 |
| Prime95 + FurMark Stress | 2.1 - 2.8 | ~500 - 1550 | 88 - 100 | 75 |
| Witcher 3 Estresse | ~1.2 | 1477 | 72 | 78 |
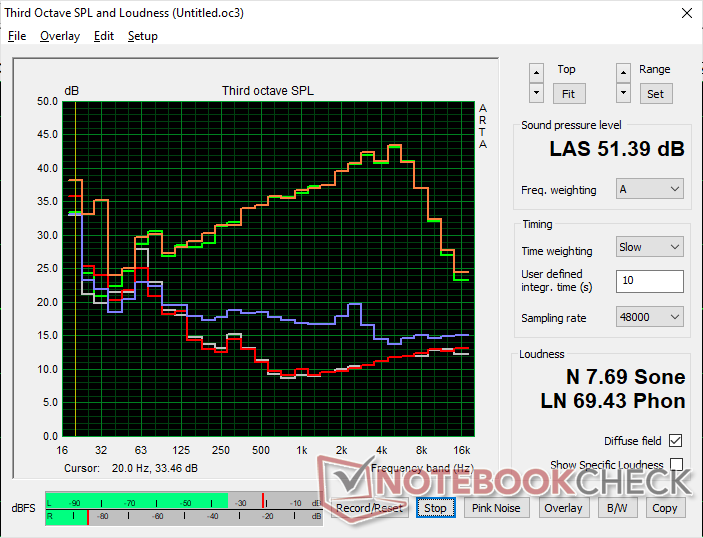
Oradores
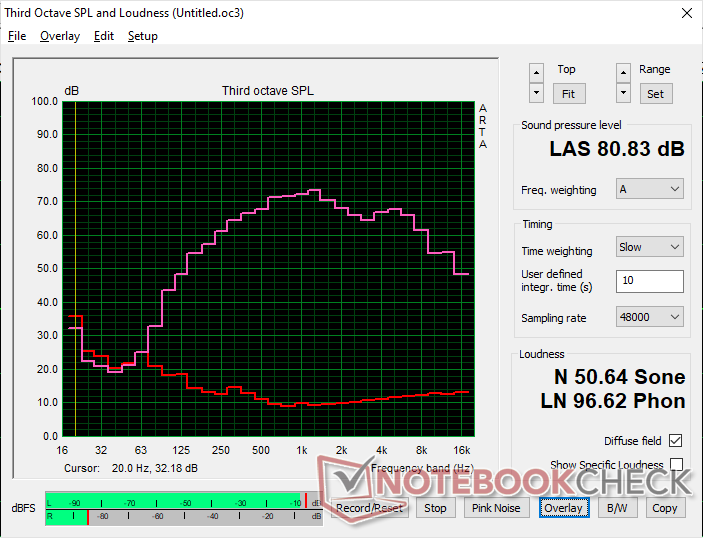
Lenovo ThinkPad P16 G1 RTX A5500 análise de áudio
(±) | o volume do alto-falante é médio, mas bom (###valor### dB)
Graves 100 - 315Hz
(±) | graves reduzidos - em média 11.1% menor que a mediana
(±) | a linearidade dos graves é média (9.7% delta para a frequência anterior)
Médios 400 - 2.000 Hz
(+) | médios equilibrados - apenas 4.1% longe da mediana
(+) | médios são lineares (3.3% delta para frequência anterior)
Altos 2 - 16 kHz
(+) | agudos equilibrados - apenas 2.9% longe da mediana
(+) | os máximos são lineares (5.2% delta da frequência anterior)
Geral 100 - 16.000 Hz
(+) | o som geral é linear (13.2% diferença em relação à mediana)
Comparado com a mesma classe
» 23% de todos os dispositivos testados nesta classe foram melhores, 6% semelhantes, 71% piores
» O melhor teve um delta de 7%, a média foi 17%, o pior foi 35%
Comparado com todos os dispositivos testados
» 13% de todos os dispositivos testados foram melhores, 3% semelhantes, 84% piores
» O melhor teve um delta de 4%, a média foi 23%, o pior foi 134%
Apple MacBook Pro 16 2021 M1 Pro análise de áudio
(+) | os alto-falantes podem tocar relativamente alto (###valor### dB)
Graves 100 - 315Hz
(+) | bons graves - apenas 3.8% longe da mediana
(+) | o baixo é linear (5.2% delta para a frequência anterior)
Médios 400 - 2.000 Hz
(+) | médios equilibrados - apenas 1.3% longe da mediana
(+) | médios são lineares (2.1% delta para frequência anterior)
Altos 2 - 16 kHz
(+) | agudos equilibrados - apenas 1.9% longe da mediana
(+) | os máximos são lineares (2.7% delta da frequência anterior)
Geral 100 - 16.000 Hz
(+) | o som geral é linear (4.6% diferença em relação à mediana)
Comparado com a mesma classe
» 0% de todos os dispositivos testados nesta classe foram melhores, 0% semelhantes, 100% piores
» O melhor teve um delta de 5%, a média foi 17%, o pior foi 45%
Comparado com todos os dispositivos testados
» 0% de todos os dispositivos testados foram melhores, 0% semelhantes, 100% piores
» O melhor teve um delta de 4%, a média foi 23%, o pior foi 134%
Gestão de energia
Consumo de energia
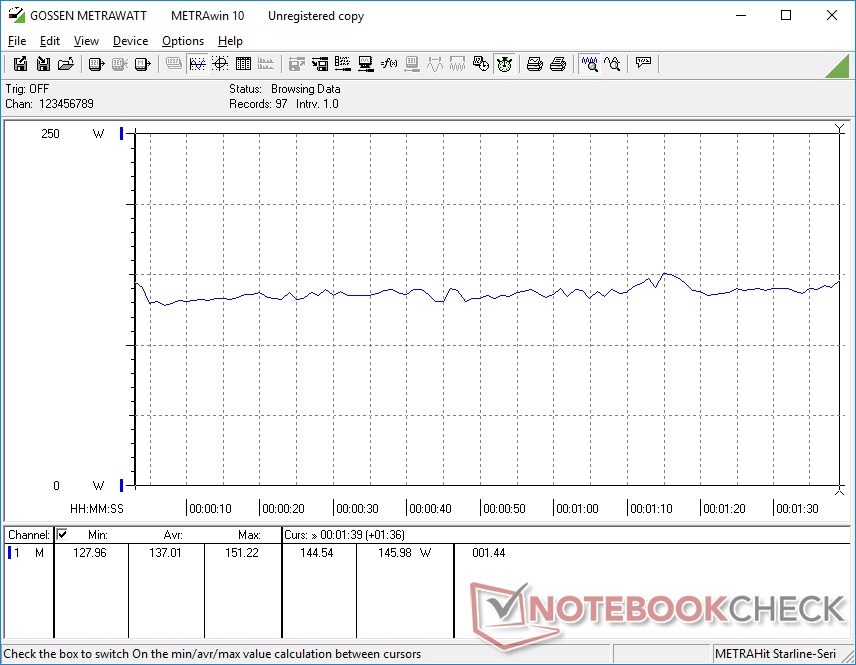
O consumo de energia quando ocioso é menor que no Precision 7670 por vários watts, provavelmente devido ao painel OLED mais exigente neste último. Quando a carga é maior, como Witcher 3no entanto, o consumo se tornaria notavelmente maior na Lenovo do que na Dell (208 W vs. 159 W). O maior consumo de energia coincide com o desempenho mais rápido da CPU e da GPU em relação ao modelo concorrente da Dell, como mostrado através de nossos benchmarks acima.
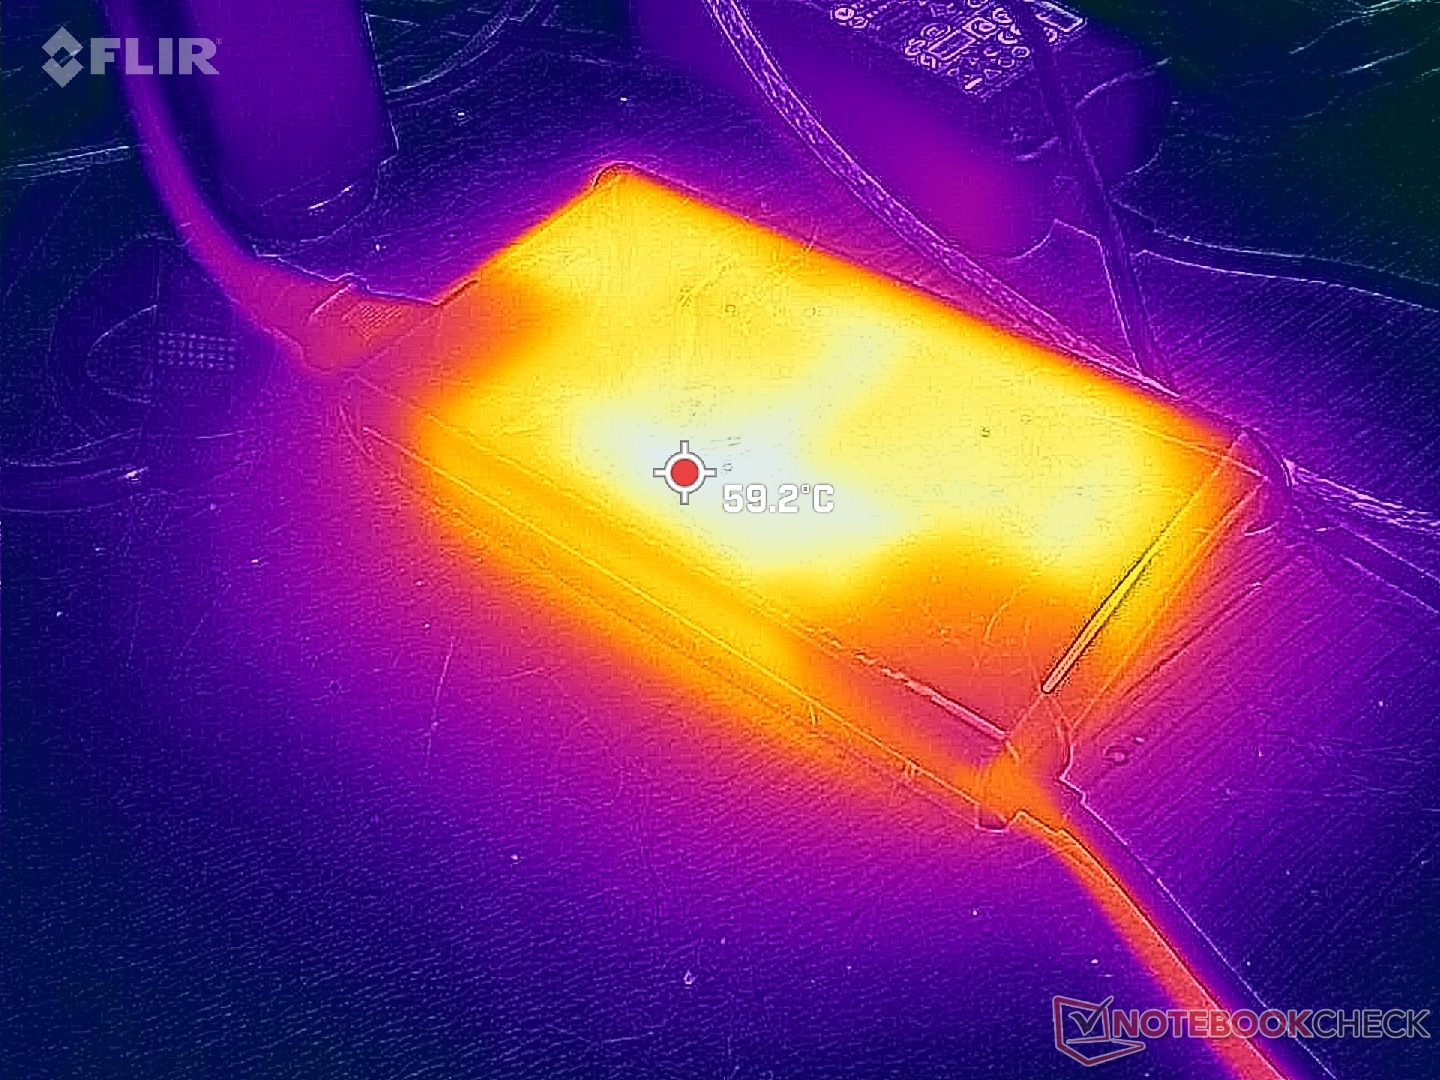
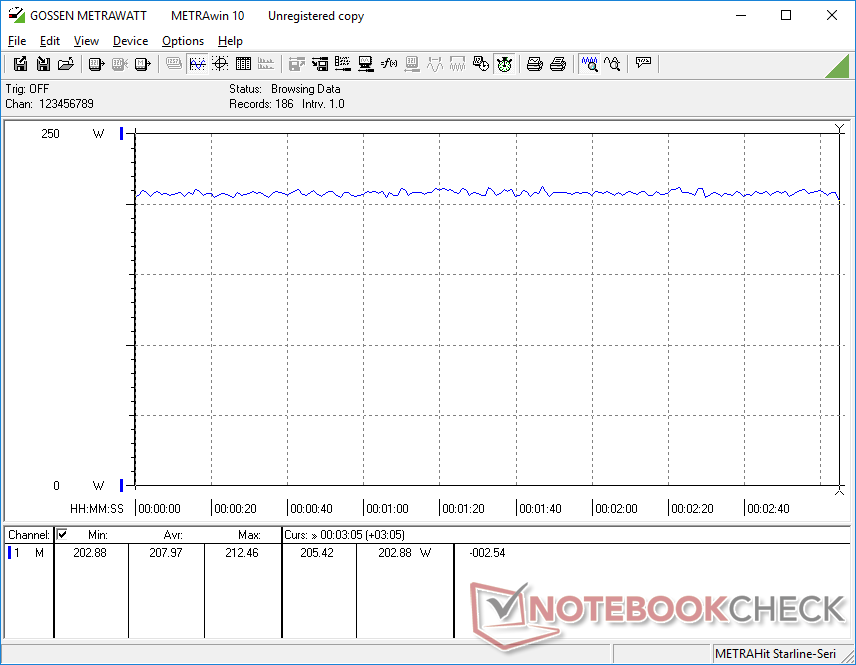
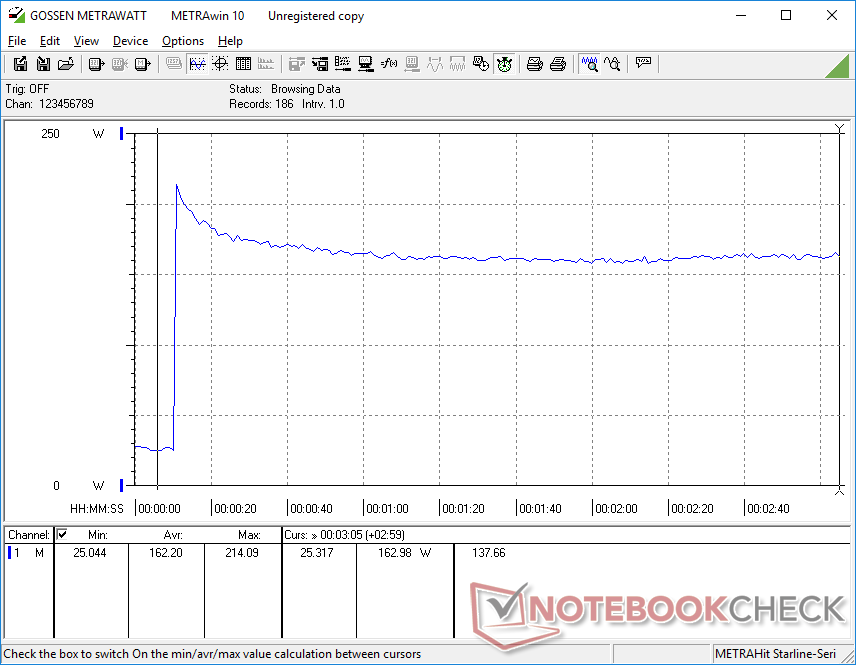
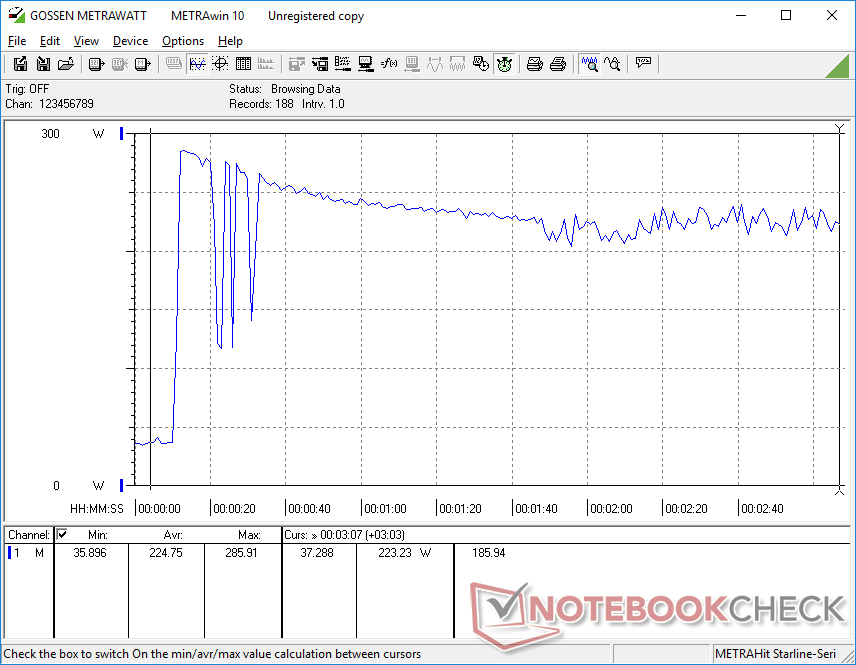
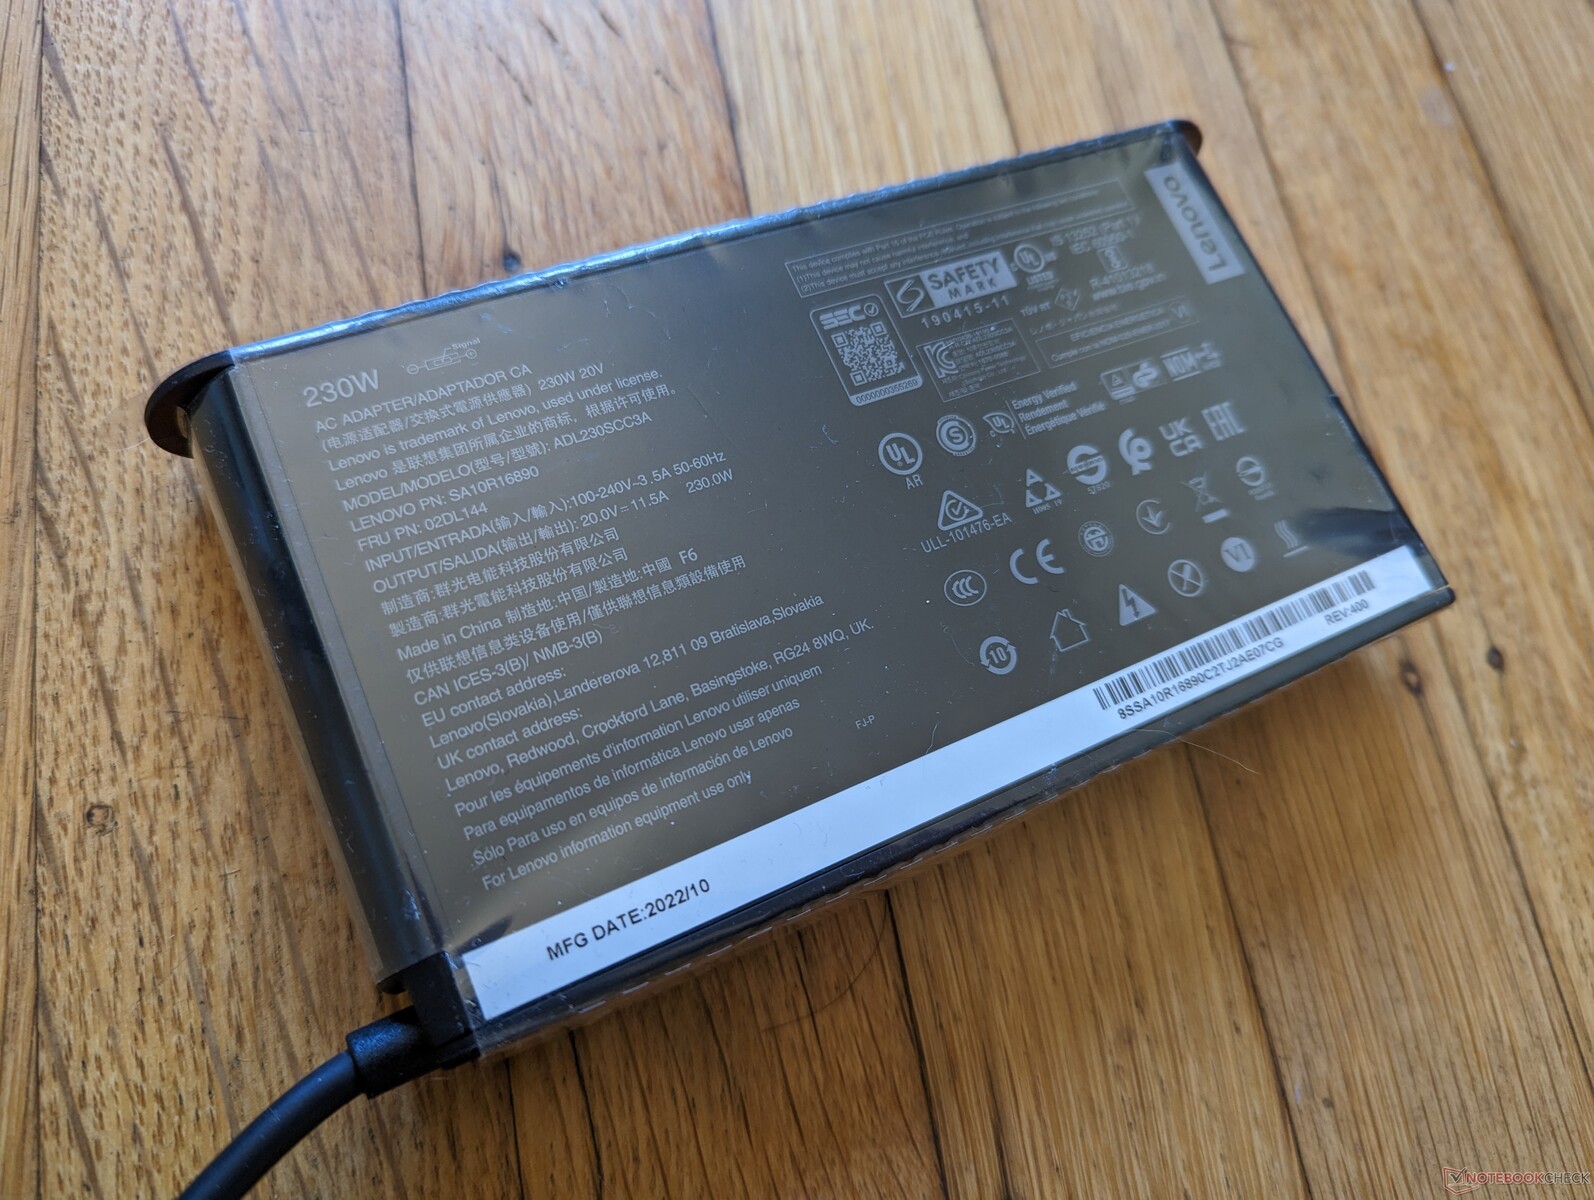
Embora os usuários de energia possam apreciar o desempenho extra, nossa Lenovo totalmente carregada é significativamente mais exigente do que a maioria das outras estações de trabalho móveis. Na verdade, o adaptador de 230 W AC de tamanho médio (~15 x 8,6 x 2,6 cm) pode não ser suficiente para alimentar a máquina quando a CPU e a GPU estão em alta utilização. Somos capazes de medir um consumo máximo temporário de 286 W do adaptador de 230 W antes que ele eventualmente caia e se estabilize em torno de 223 W. Assim, espera-se que a taxa de carga da bateria diminua ou até mesmo se torne negativa quando se trabalha com cargas exigentes. Quando em funcionamento Witcher 3 durante 90 minutos seguidos, por exemplo, observamos a queda do nível da nossa bateria de 100% para 87%. Um comportamento semelhante foi observado no mais antigo XPS 17 ou Precision 5750. É uma pena que a Lenovo não ofereça opções de adaptador AC superiores a 230 W no checkout.
A configuração com o RTX A2000 de última geração reduziria o consumo em cerca da metade. Neste caso, o adaptador AC de 230 W seria suficiente.
| desligado | |
| Ocioso | |
| Carga |
|
Key:
min: | |
| Lenovo ThinkPad P16 G1 RTX A5500 i9-12950HX, RTX A5500 Laptop GPU, WDC PC SN810 2TB, IPS, 3840x2400, 16" | Asus ProArt StudioBook 16 W7600H5A-2BL2 W-11955M, RTX A5000 Laptop GPU, 2x Micron 2300 2TB MTFDHBA2T0TDV (RAID 0), OLED, 3840x2400, 16" | Dell Precision 7000 7670 Performance i9-12950HX, RTX A5500 Laptop GPU, , OLED, 3840x2400, 16" | Lenovo ThinkPad P16 G1 21D6001DMB i7-12850HX, RTX A2000 Laptop GPU, Micron 3400 1TB MTFDKBA1T0TFH, IPS LED, 2560x1600, 16" | MSI CreatorPro Z16P B12UKST i7-12700H, RTX A3000 Laptop GPU, Samsung PM9A1 MZVL21T0HCLR, IPS, 2560x1600, 16" | HP ZBook Studio 16 G9 62U04EA i7-12800H, RTX A2000 Laptop GPU, Micron 3400 1TB MTFDKBA1T0TFH, IPS, 3840x2400, 16" | |
|---|---|---|---|---|---|---|
| Power Consumption | 14% | -35% | 45% | 19% | 28% | |
| Idle Minimum * (Watt) | 7.5 | 12.4 -65% | 16.4 -119% | 5.1 32% | 10.8 -44% | 7.2 4% |
| Idle Average * (Watt) | 20.1 | 16.5 18% | 35.9 -79% | 9.2 54% | 16.3 19% | 18.1 10% |
| Idle Maximum * (Watt) | 40 | 25 37% | 47 -18% | 9.9 75% | 16.9 58% | 18.5 54% |
| Load Average * (Watt) | 137 | 132 4% | 147.1 -7% | 124.1 9% | 111.7 18% | 112.8 18% |
| Witcher 3 ultra * (Watt) | 208 | 132 37% | 158.8 24% | 87.7 58% | 152.1 27% | 106.7 49% |
| Load Maximum * (Watt) | 285.9 | 134 53% | 311 -9% | 168.9 41% | 177.4 38% | 186 35% |
* ... menor é melhor
Power Consumption Witcher 3 / Stresstest
Power Consumption external Monitor
Vida útil da bateria
O tempo de execução é várias horas menor do que em nosso menor SKU RTX A2000 por um total de pouco menos de 6 horas, se ajustado ao perfil de potência Balanceado.
O carregamento do vazio para o cheio leva cerca de 2 horas. O tempo estimado de carga da Lenovo não é tão exato, no entanto, já que o Vantage pode mostrar que ele pode ser tão longo quanto 4 horas no início, antes de se recalibrar automaticamente. Tenha em mente que a taxa de carga irá diminuir significativamente se estiver executando aplicações exigentes, como mencionado acima.
O sistema não pode ser recarregado via USB-C.
| Lenovo ThinkPad P16 G1 RTX A5500 i9-12950HX, RTX A5500 Laptop GPU, 94 Wh | Asus ProArt StudioBook 16 W7600H5A-2BL2 W-11955M, RTX A5000 Laptop GPU, 90 Wh | Dell Precision 7000 7670 Performance i9-12950HX, RTX A5500 Laptop GPU, 93 Wh | Lenovo ThinkPad P16 G1 21D6001DMB i7-12850HX, RTX A2000 Laptop GPU, 94 Wh | MSI CreatorPro Z16P B12UKST i7-12700H, RTX A3000 Laptop GPU, 90 Wh | HP ZBook Studio 16 G9 62U04EA i7-12800H, RTX A2000 Laptop GPU, 86 Wh | |
|---|---|---|---|---|---|---|
| Duração da bateria | -14% | -19% | 62% | 0% | 9% | |
| WiFi v1.3 (h) | 5.8 | 5 -14% | 4.7 -19% | 9.4 62% | 5.8 0% | 6.3 9% |
| H.264 (h) | 1.8 | 8.5 | ||||
| Witcher 3 ultra (h) | 1.6 | |||||
| Load (h) | 1.8 | 1.1 |
Pro
Contra
Veredicto - O adaptador de 230 W AC não é suficiente
De uma perspectiva puramente de desempenho, o ThinkPad P16 G1 é uma das estações de trabalho móveis mais rápidas atualmente disponíveis, independentemente do tamanho da tela. Sua CPU Core i9-12950HX e GPU RTX A5500 superam ligeiramente, mas consistentemente, o desempenho da Precision 7670 mesmo que o modelo Dell venha com opções de processador similares.
Há dois inconvenientes chave que esperamos que a Lenovo possa resolver em futuras iterações. Primeiro, a temperatura da CPU é muito mais quente do que a média quando se trabalha com cargas exigentes. As altas temperaturas não são inesperadas, é claro, mas o platô a 100 C é muito quente para conforto quando a mesma CPU no modelo Dell acima mencionado mal quebraria a marca de 80 C em condições similares. A alta temperatura talvez seja o preço a pagar pelo desempenho um pouco mais rápido.
Em segundo lugar, o adaptador de 230 W AC está suando balas tentando alimentar uma CPU de 100+ W e uma GPU de 130 W. A luta é observável quando se corre com cargas exigentes, pois a taxa de carga do sistema diminuiria significativamente ou mesmo começaria a drenar a bateria em certos cenários. Quando somos capazes de medir um pico de extração de 285 W de um adaptador CA classificado para apenas 230 W, então há claramente um gargalo de estrangulamento aqui. Um adaptador CA maior de 280 W ou 330 W teria sido mais apropriado, dado nosso nível de configuração.
O ThinkPad P16 Gen 1 maximiza o desempenho, mesmo que isso signifique maior consumo de energia e temperaturas centrais mais altas. O adaptador AC de 230 W pode ser muito conservador, no entanto, dados os processadores muito exigentes de nossa configuração topo-de-gama.
No entanto, o alto desempenho geral do sistema é inegável apesar das altas temperaturas e do tijolo de 230 W de potência insuficiente. Certifique-se de sair de qualquer aplicação exigente para velocidades de carregamento decentes.
Preço e Disponibilidade
O ThinkPad P16 G1 é agora enviado na Best Buy e Amazon em níveis de configuração mais baixos a partir de US$2570 ou US$3850, respectivamente. Recomendamos a compra diretamente da Lenovo, pois eles têm as opções mais configuráveis em estoque.
Lenovo ThinkPad P16 G1 RTX A5500
- 02/06/2023 v7 (old)
Allen Ngo
Transparência
A seleção dos dispositivos a serem analisados é feita pela nossa equipe editorial. A amostra de teste foi fornecida ao autor como empréstimo pelo fabricante ou varejista para fins desta revisão. O credor não teve influência nesta revisão, nem o fabricante recebeu uma cópia desta revisão antes da publicação. Não houve obrigação de publicar esta revisão. Como empresa de mídia independente, a Notebookcheck não está sujeita à autoridade de fabricantes, varejistas ou editores.
É assim que o Notebookcheck está testando
Todos os anos, o Notebookcheck analisa de forma independente centenas de laptops e smartphones usando procedimentos padronizados para garantir que todos os resultados sejam comparáveis. Desenvolvemos continuamente nossos métodos de teste há cerca de 20 anos e definimos padrões da indústria no processo. Em nossos laboratórios de teste, equipamentos de medição de alta qualidade são utilizados por técnicos e editores experientes. Esses testes envolvem um processo de validação em vários estágios. Nosso complexo sistema de classificação é baseado em centenas de medições e benchmarks bem fundamentados, o que mantém a objetividade.Price comparison

