Lenovo ThinkPad P14s Gen 1 Revisão do laptop: Estação de trabalho de baixo nível com desenvolvimento de calor de alto nível
A série Lenovo ThinkPad P tem um grupo alvo claro: clientes de estações de trabalho com a área de aplicação CAD mais importante. Isto explica a existência do Lenovo ThinkPad P14s Gen 1. Este ThinkPad de 14 polegadas usa o mesmo design que o Lenovo ThinkPad T14 Gen 1, mas inclui uma GPU Quadro certificada ISV em vez de gráficos opcionais GeForce. As outras especificações permanecem as mesmas, com este ThinkPad portátil P14s sendo construído sobre o Intel T14. Isso também significa U-CPUs na classe de 15 watts.
Como uma estação de trabalho ultrabook com tela de 14 polegadas, o laptop da Lenovo compete com o ZBook Firefly 14 G7 da HP. Além do ThinkPad T14 Intel, o ThinkPad T14 da Lenovo com CPU AMD também é um bom objeto de comparação. Também comparamos o ThinkPad P14s com seu predecessor direto, o Lenovo ThinkPad P43s.
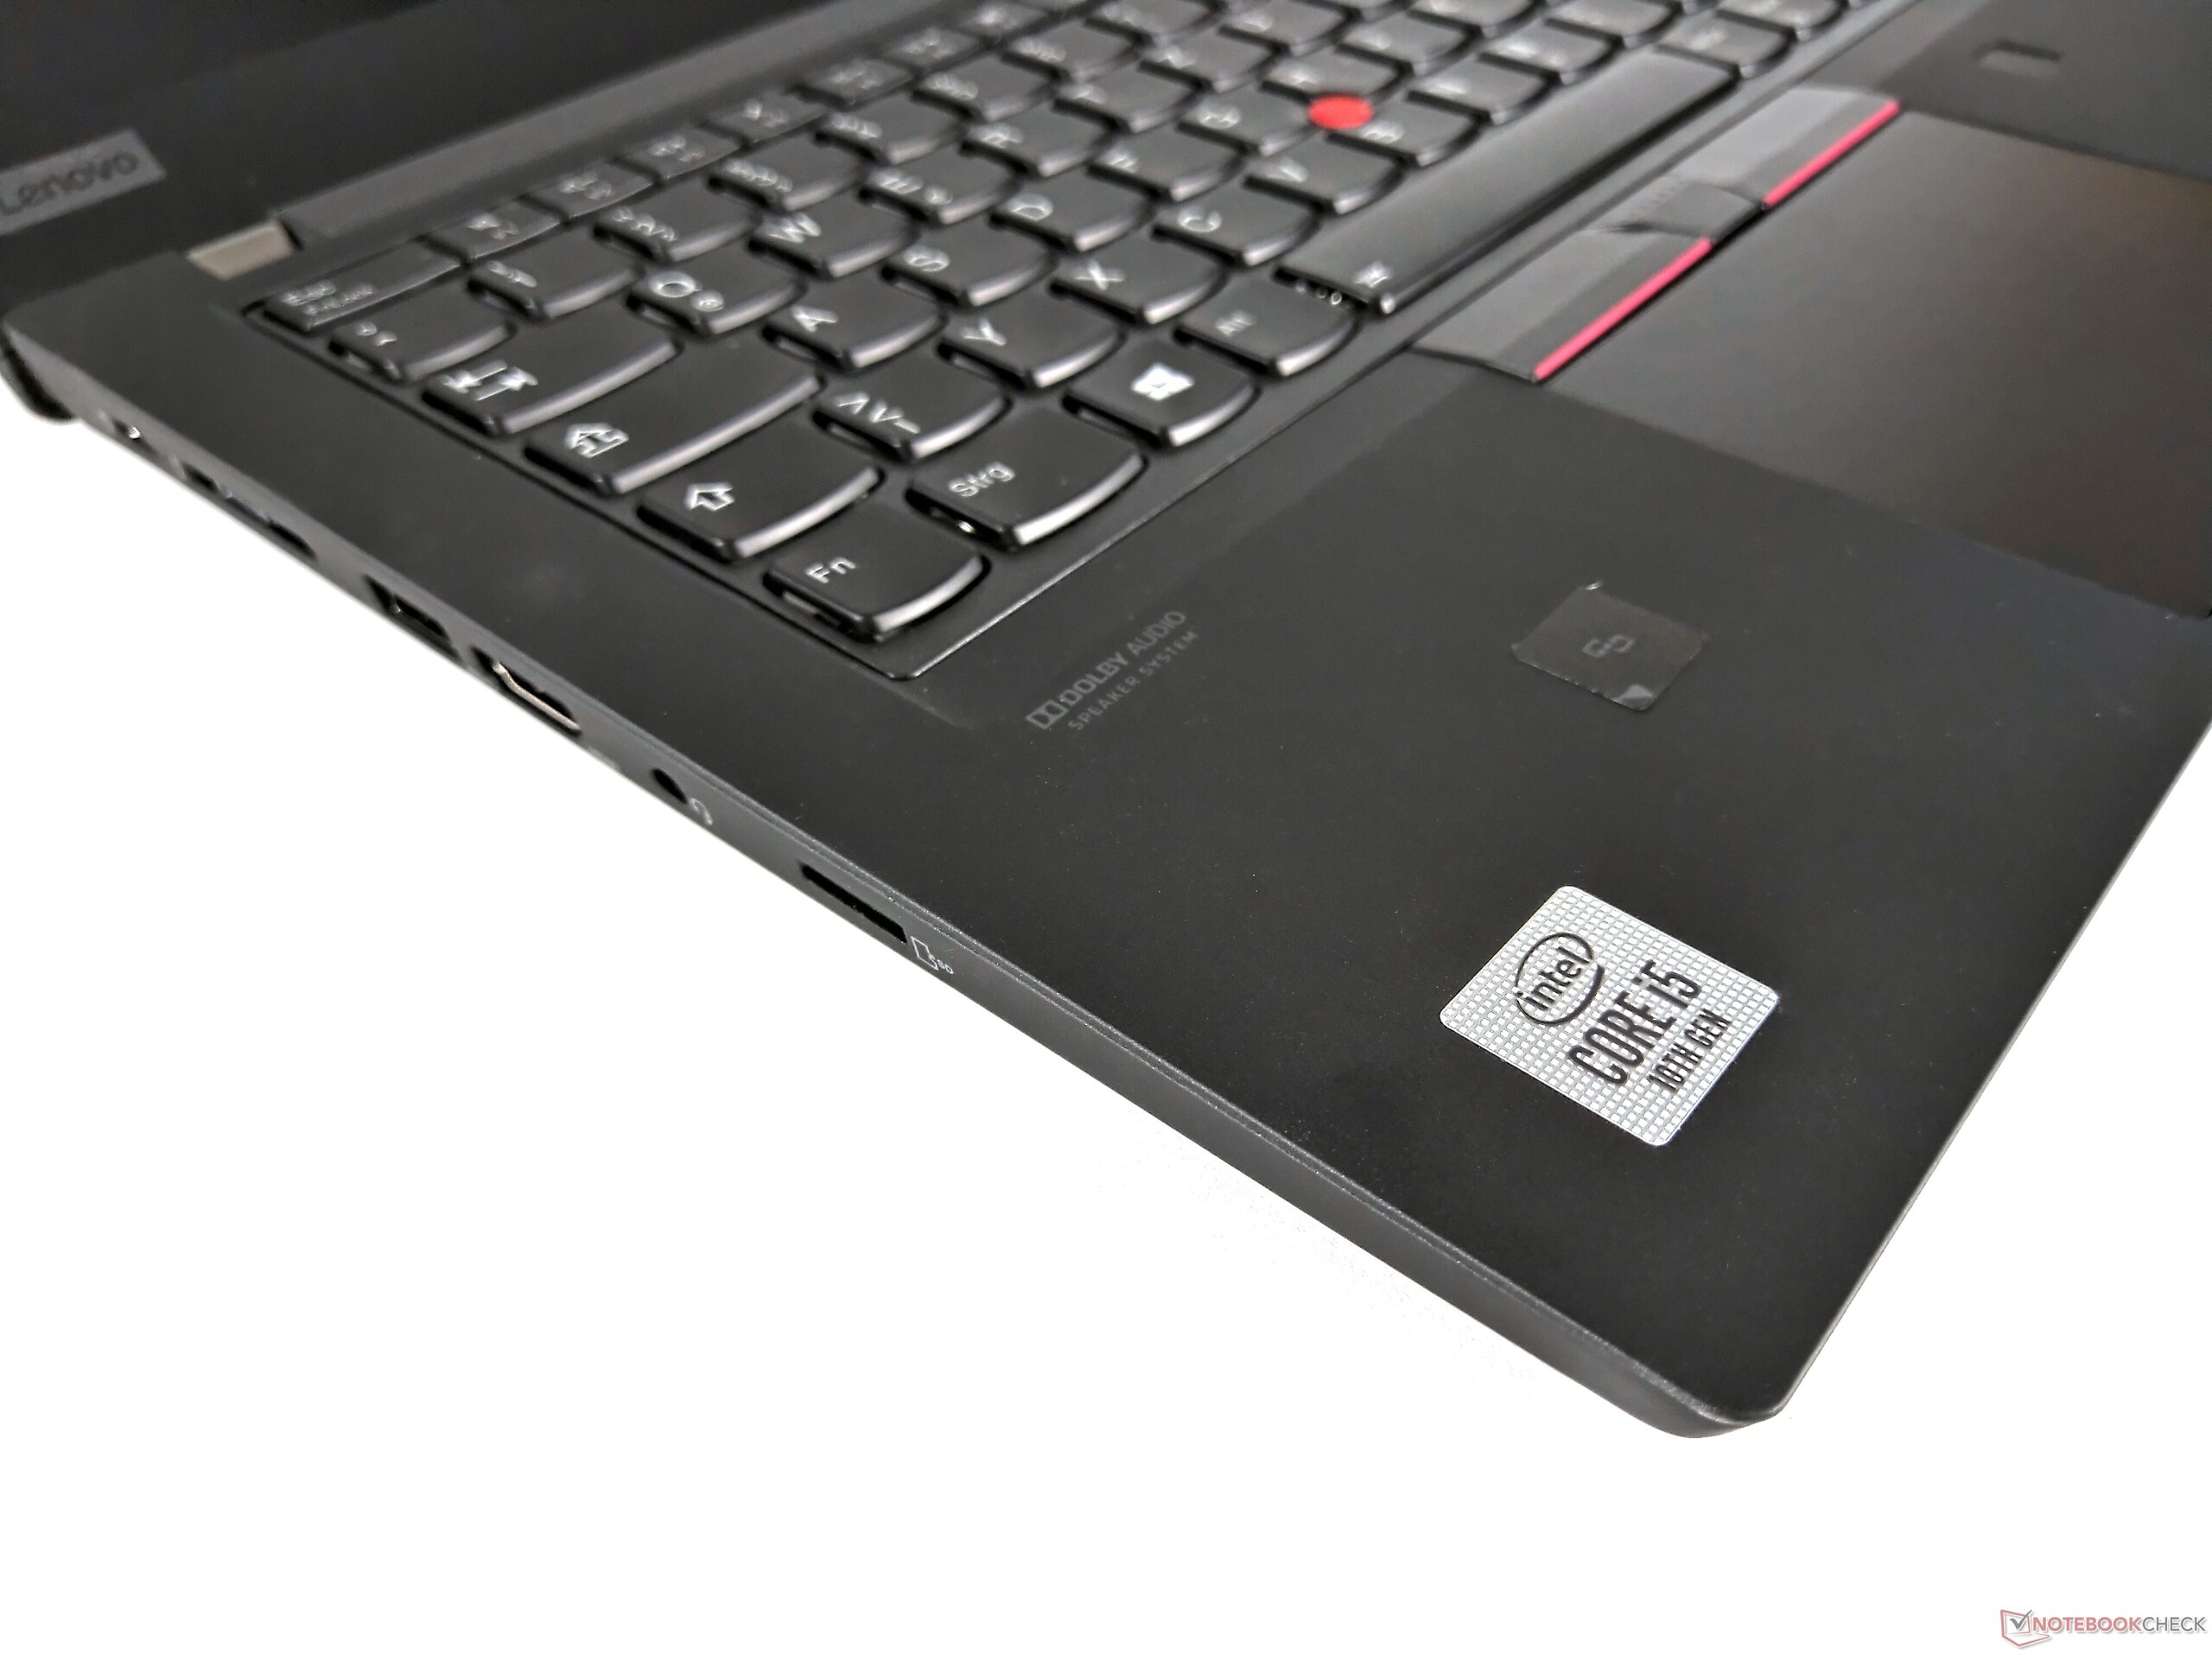
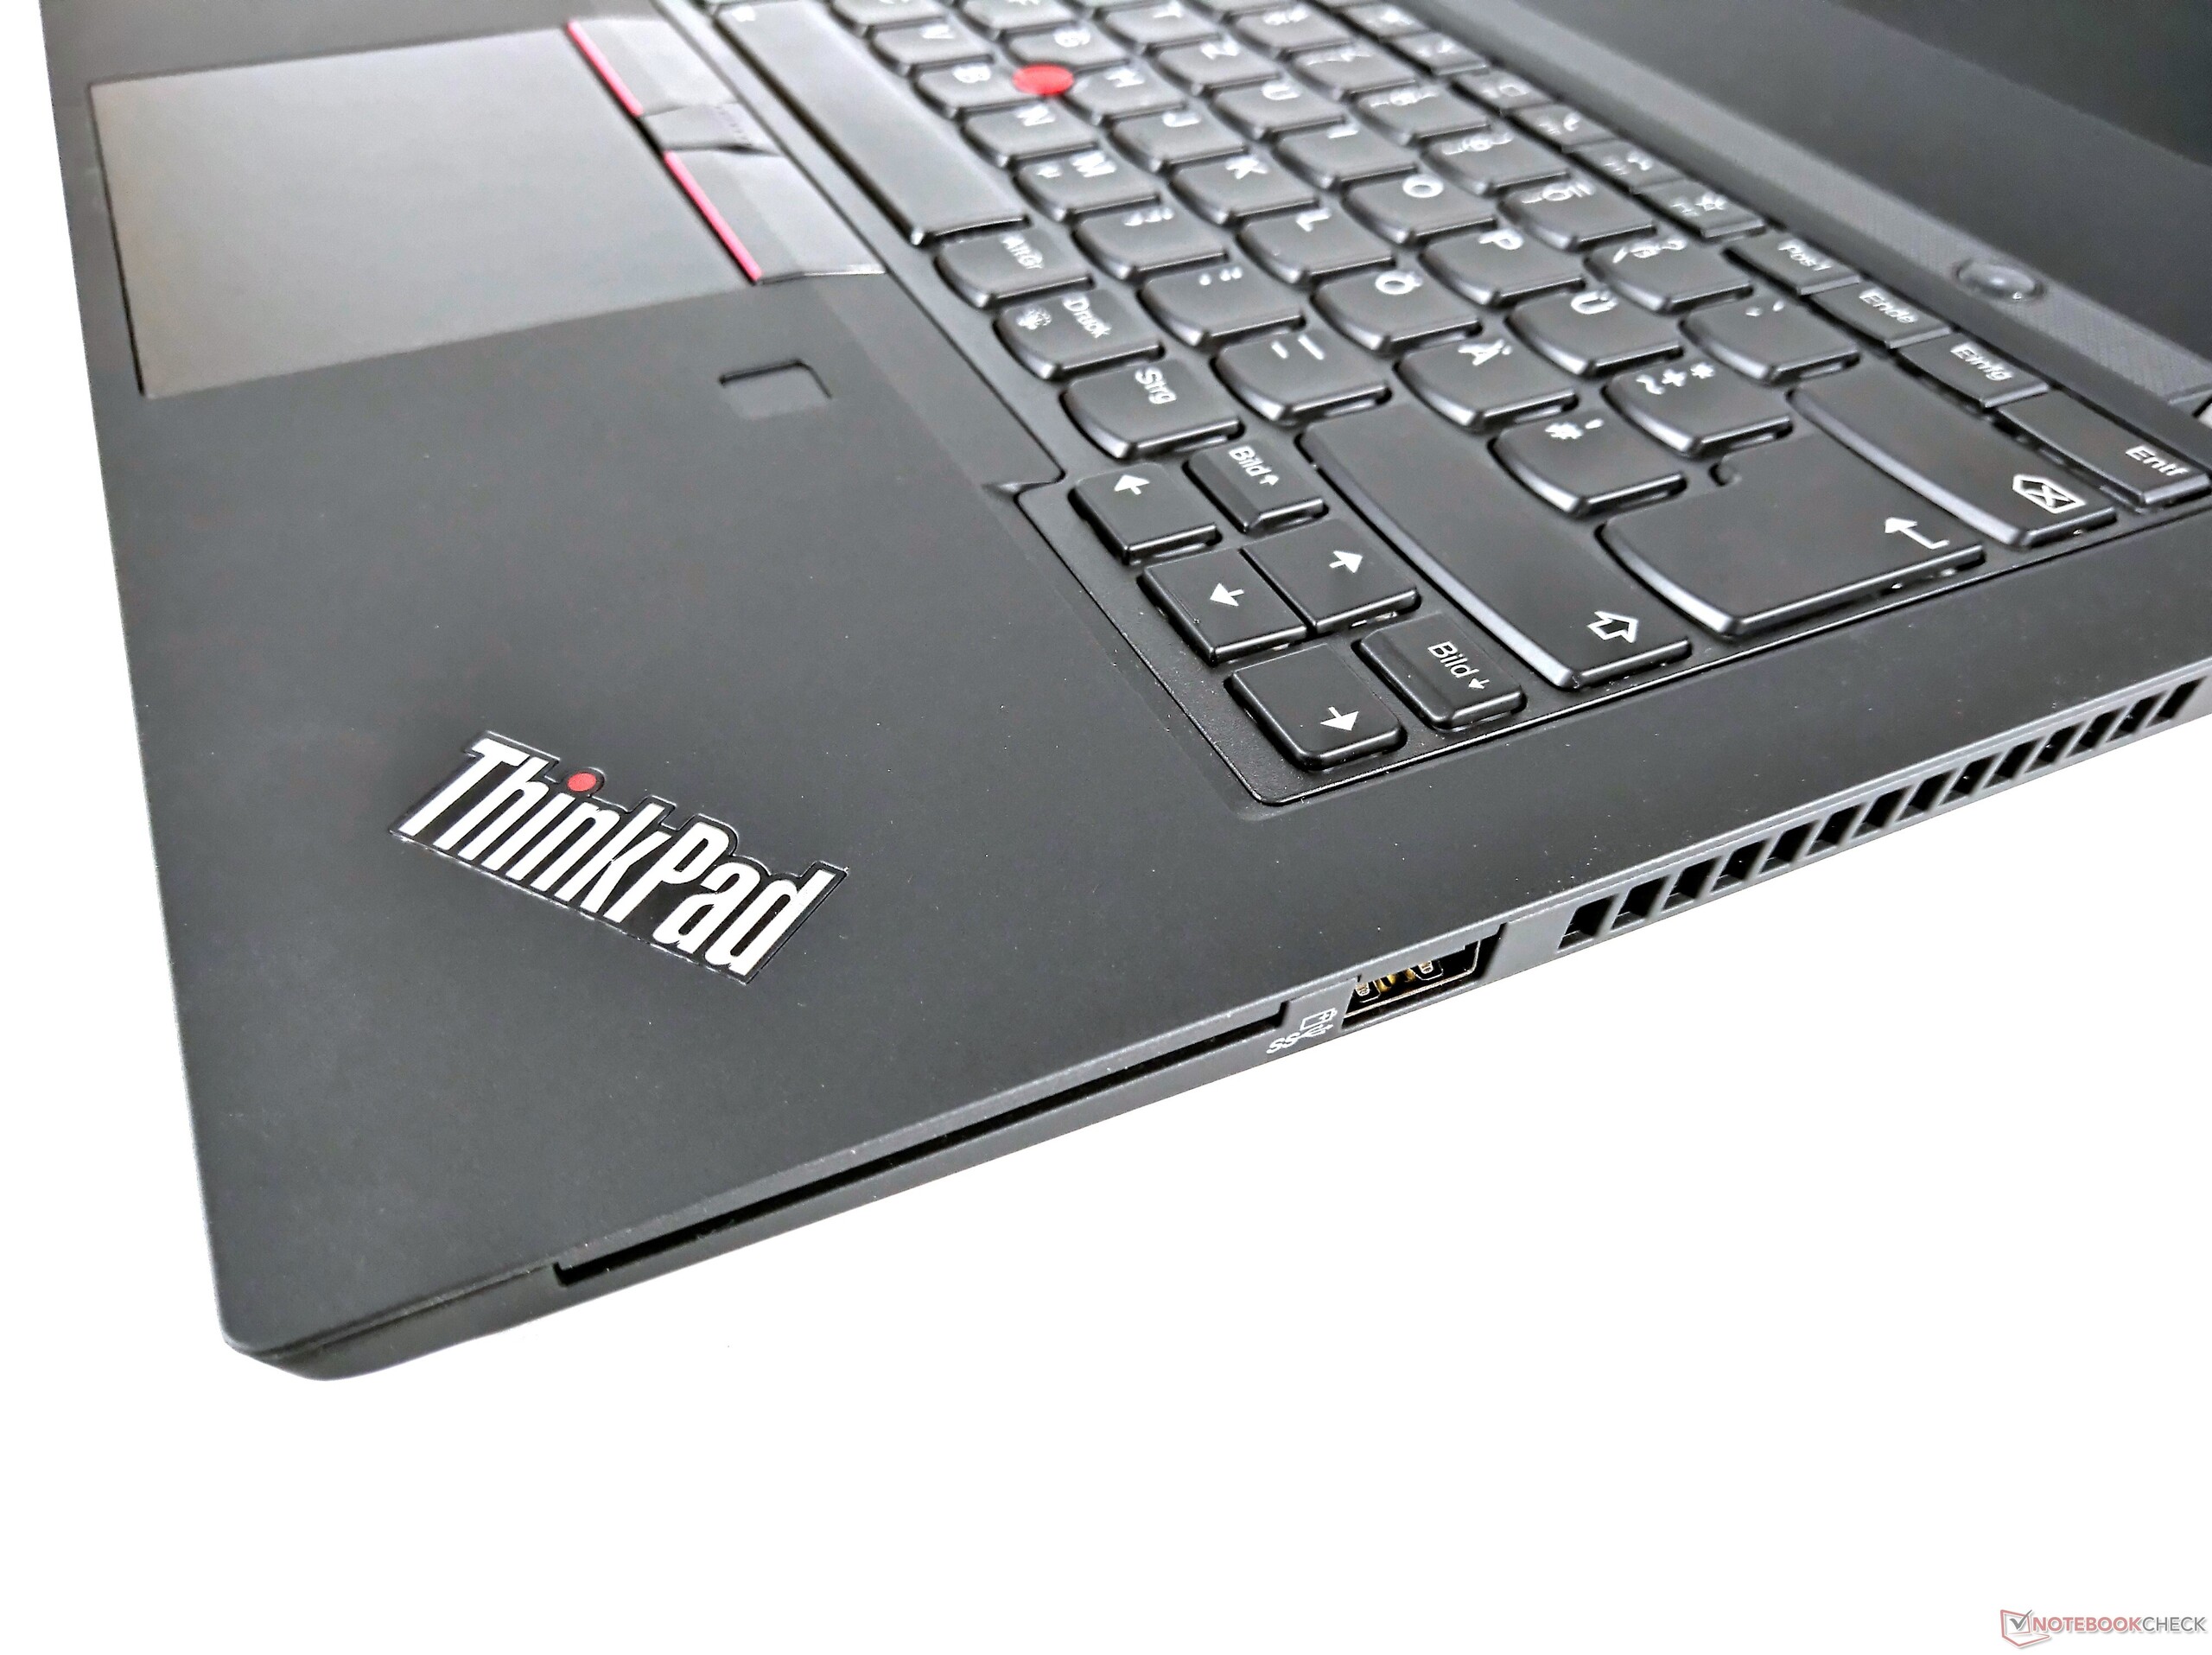
Como o caso, portas e dispositivos de entrada do ThinkPad P14s são exatamente idênticos ao ThinkPad T14 ou ao predecessor ThinkPad T490, saltaremos as seções sobre estes tópicos e começaremos diretamente com a tela. Informações sobre estes tópicos podem ser encontradas na revisão do ThinkPad T490
Possible competitors in comparison
Avaliação | Data | Modelo | Peso | Altura | Size | Resolução | Preço |
|---|---|---|---|---|---|---|---|
| 82.7 % v7 (old) | 01/2021 | Lenovo ThinkPad P14s Gen1 20S40009GE i7-10510U, Quadro P520 | 1.5 kg | 17.9 mm | 14.00" | 1920x1080 | |
| 82.4 % v7 (old) | 01/2021 | HP ZBook Firefly 14 G7 i7-10610U, Quadro P520 | 1.4 kg | 17.9 mm | 14.00" | 1920x1080 | |
| 88 % v7 (old) | 07/2020 | Lenovo ThinkPad T14-20S1S06B00 i5-10210U, UHD Graphics 620 | 1.5 kg | 17.9 mm | 14.00" | 1920x1080 | |
| 88.9 % v7 (old) | 11/2020 | Lenovo ThinkPad T14-20UES00H00 R5 PRO 4650U, Vega 6 | 1.5 kg | 17.9 mm | 14.00" | 1920x1080 | |
| 80.1 % v7 (old) | 10/2019 | Lenovo ThinkPad P43s-20RH001FGE i7-8565U, Quadro P520 | 1.5 kg | 18.9 mm | 14.00" | 1920x1080 |
| SD Card Reader | |
| average JPG Copy Test (av. of 3 runs) | |
| Média da turma Workstation (49.6 - 681, n=14, últimos 2 anos) | |
| Lenovo ThinkPad P43s-20RH001FGE (Toshiba Exceria Pro M501 64 GB UHS-II) | |
| Lenovo ThinkPad T14-20UES00H00 (Toshiba Exceria Pro M501 64 GB UHS-II) | |
| Lenovo ThinkPad T14-20S1S06B00 (Toshiba Exceria Pro M501 64 GB UHS-II) | |
| Lenovo ThinkPad P14s Gen1 20S40009GE (Toshiba Exceria Pro SDXC 64 GB UHS-II) | |
| maximum AS SSD Seq Read Test (1GB) | |
| Média da turma Workstation (87.6 - 1455, n=14, últimos 2 anos) | |
| Lenovo ThinkPad T14-20UES00H00 (Toshiba Exceria Pro M501 64 GB UHS-II) | |
| Lenovo ThinkPad P43s-20RH001FGE (Toshiba Exceria Pro M501 64 GB UHS-II) | |
| Lenovo ThinkPad T14-20S1S06B00 (Toshiba Exceria Pro M501 64 GB UHS-II) | |
| Lenovo ThinkPad P14s Gen1 20S40009GE (Toshiba Exceria Pro SDXC 64 GB UHS-II) | |


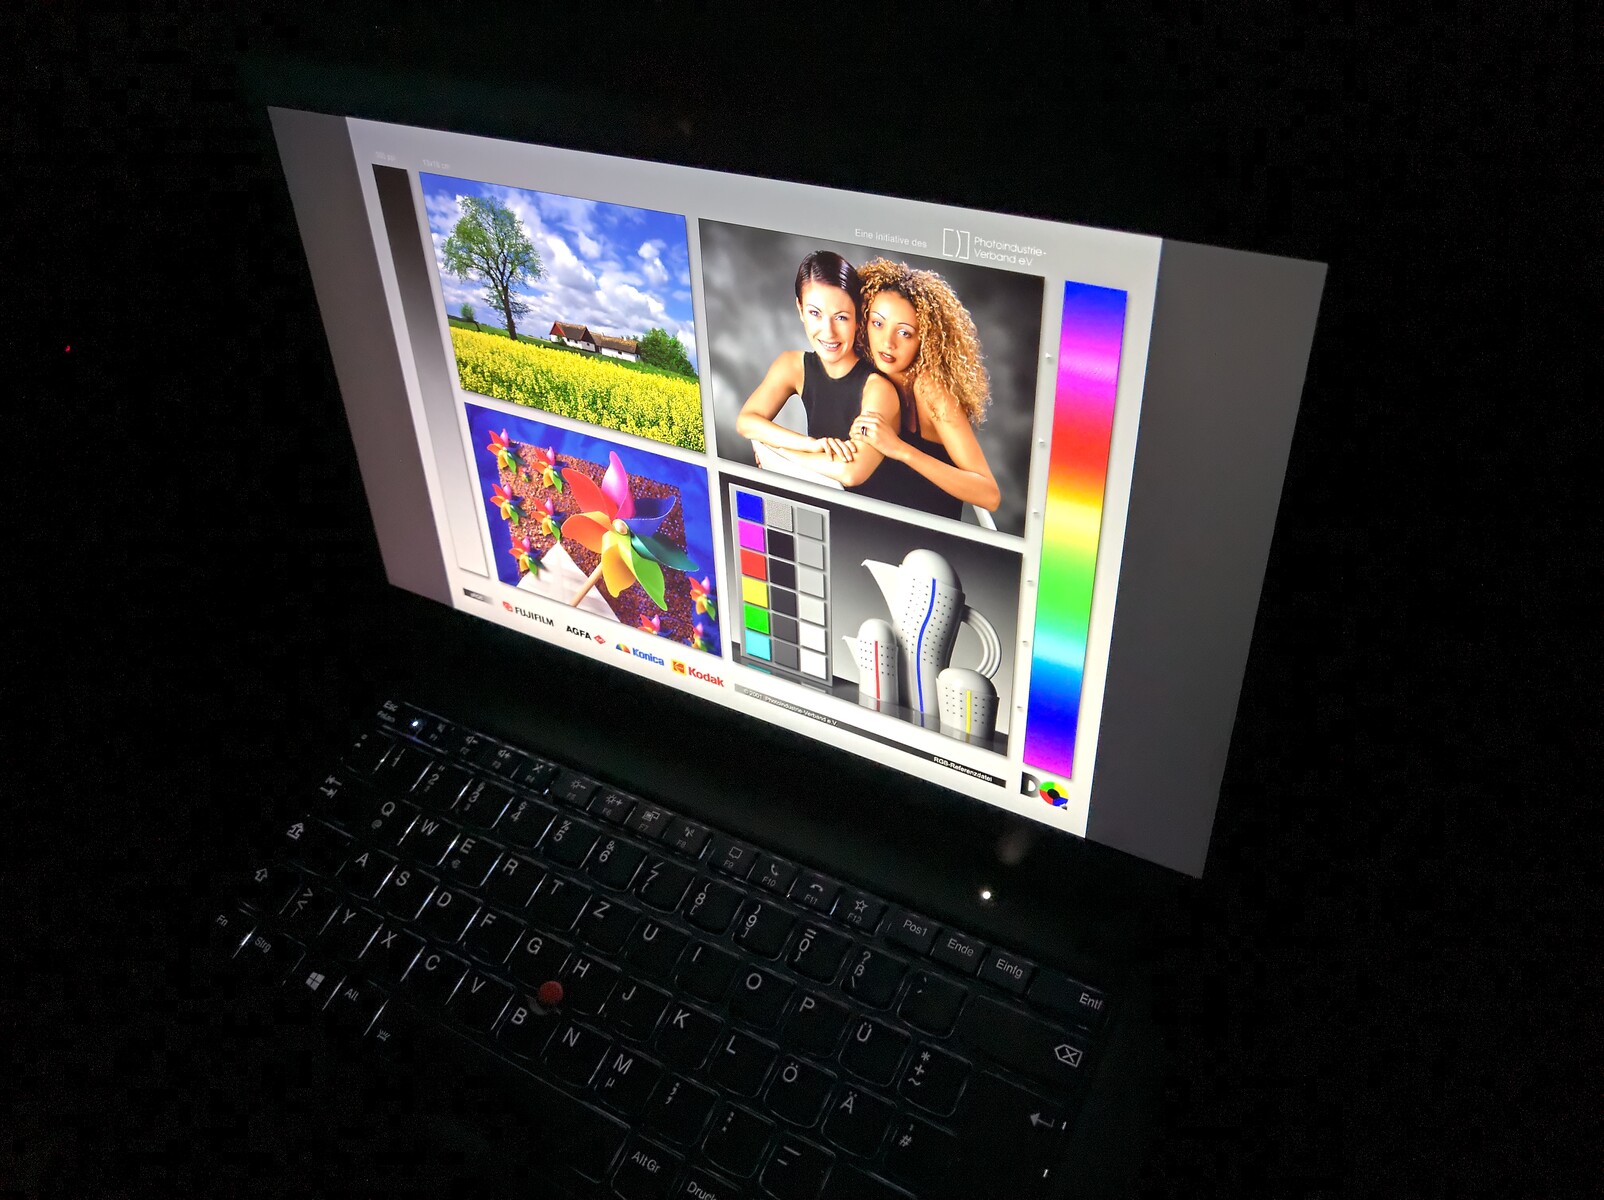
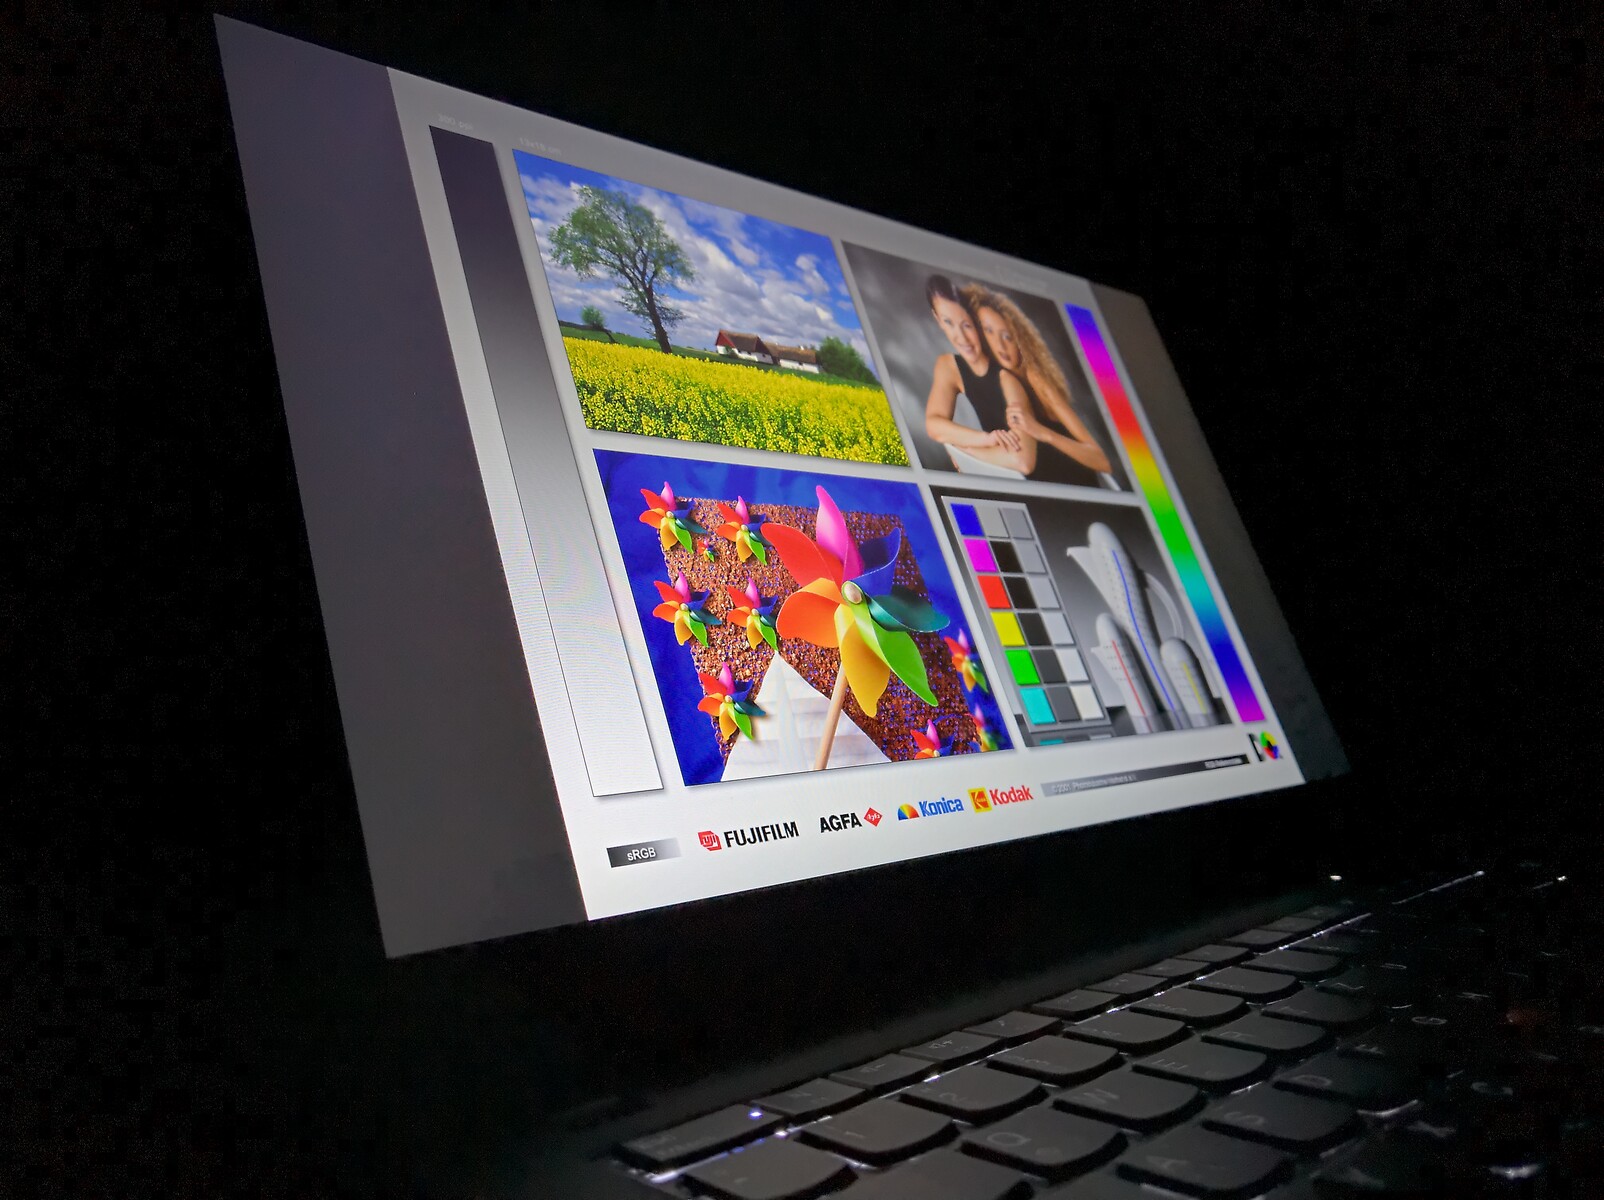
Visor de baixa potência conhecido no computador Lenovo
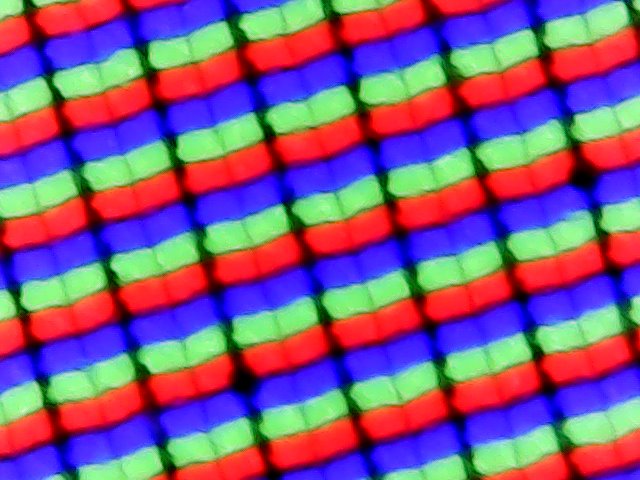
A seleção de displays de 14 polegadas no formato 16:9 é basicamente idêntica ao Lenovo ThinkPad T14 Intel, com a diferença de que a opção HD TN não está disponível. Nosso dispositivo de teste contém o LCD Full HD de baixa potência, fabricado pela AUO neste caso. Já testamos este tipo de painel no ThinkPad T14. Embora o painel instalado aqui seja marginalmente mais escuro, os LCDs são praticamente idênticos em princípio. Além do bom brilho e a falta de PWM, isto também significa tempos de resposta relativamente altos
| |||||||||||||||||||||||||
iluminação: 88 %
iluminação com acumulador: 389 cd/m²
Contraste: 2032:1 (Preto: 0.19 cd/m²)
ΔE ColorChecker Calman: 4.4 | ∀{0.5-29.43 Ø4.73}
calibrated: 1.2
ΔE Greyscale Calman: 5.1 | ∀{0.09-98 Ø4.97}
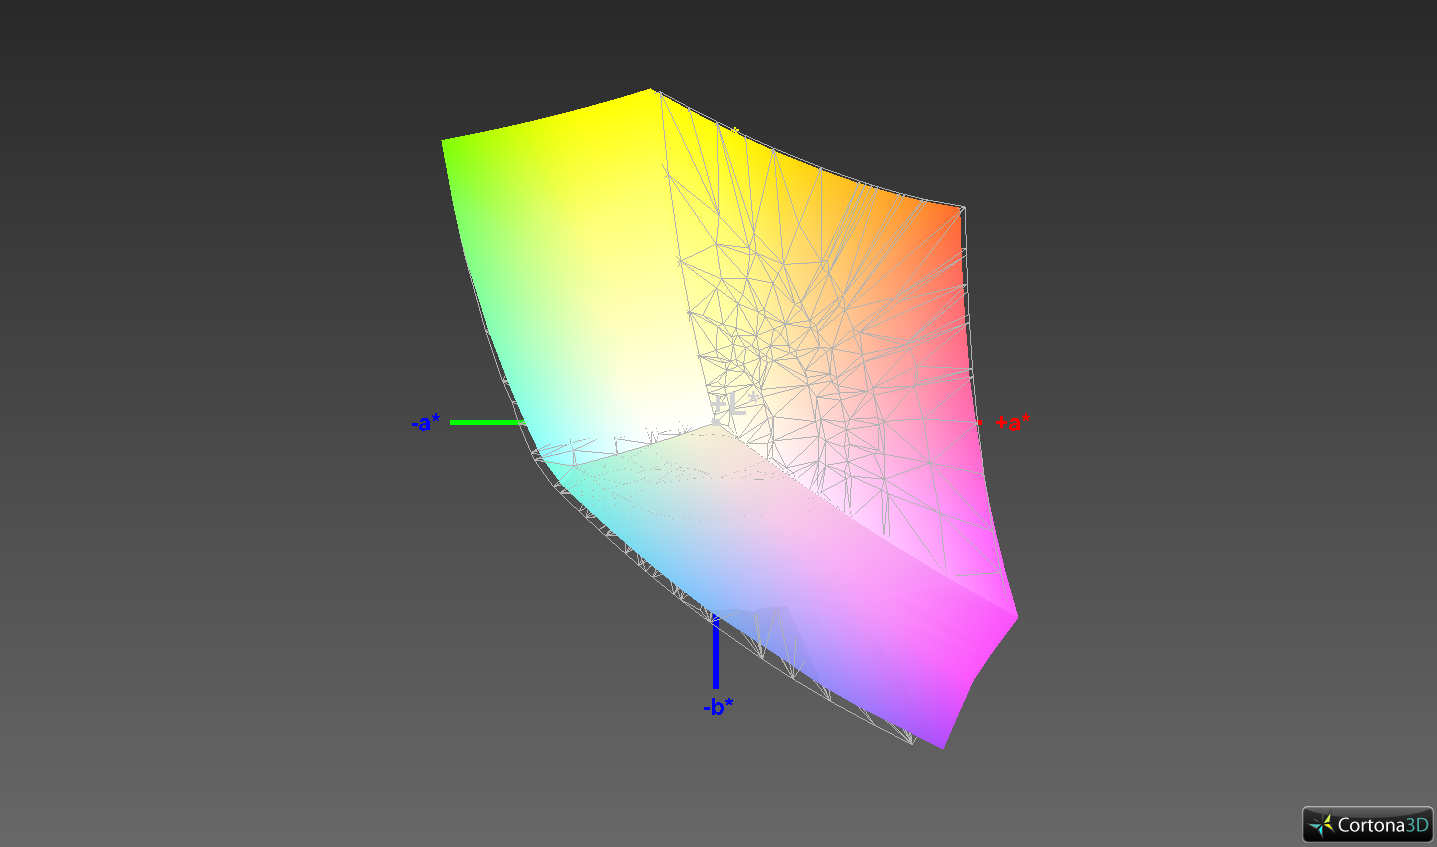
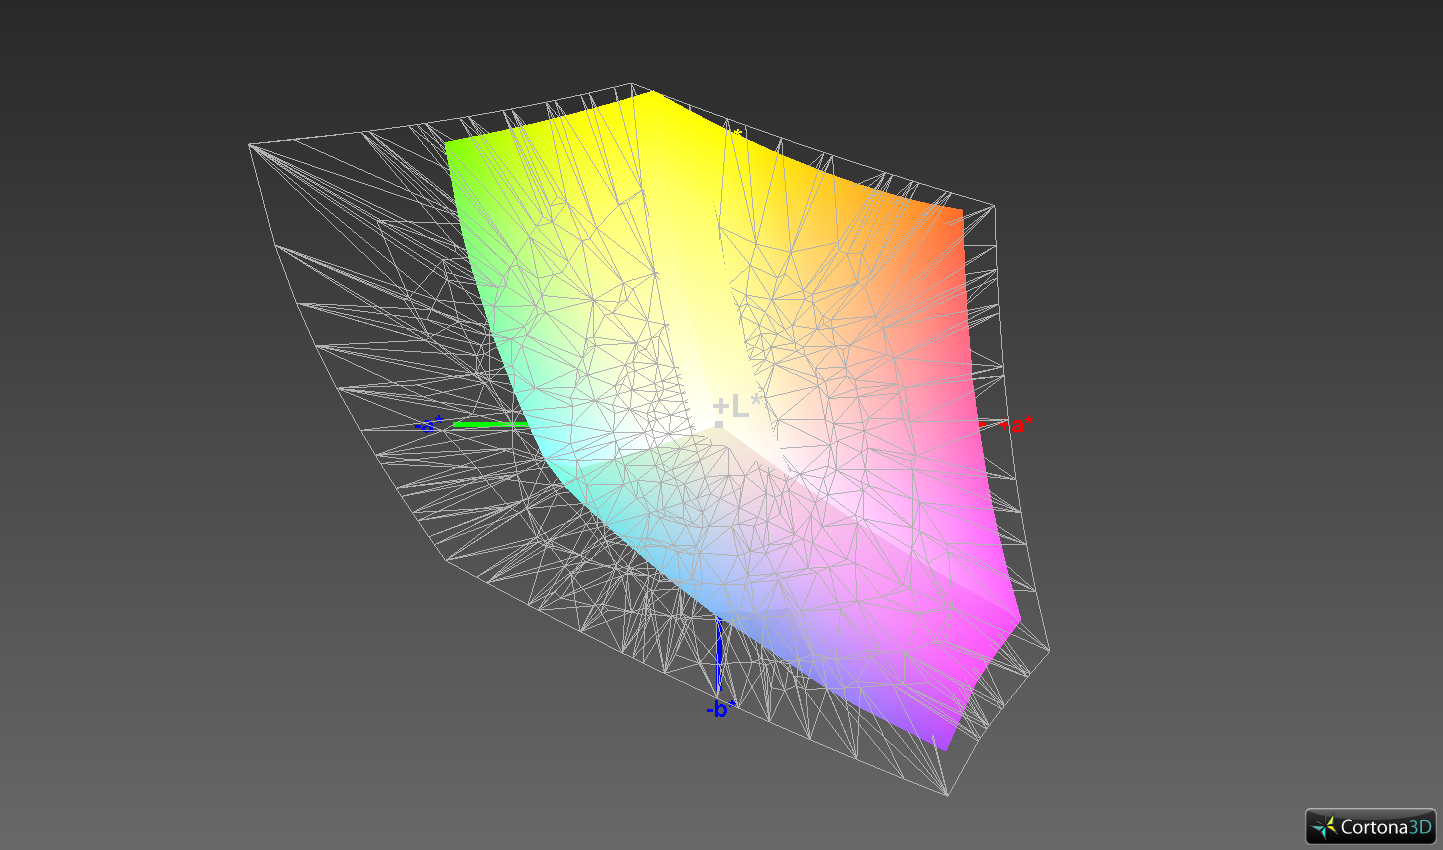
96.4% sRGB (Argyll 1.6.3 3D)
61.2% AdobeRGB 1998 (Argyll 1.6.3 3D)
66.7% AdobeRGB 1998 (Argyll 3D)
96.6% sRGB (Argyll 3D)
65.5% Display P3 (Argyll 3D)
Gamma: 2.5
CCT: 7464 K
| Lenovo ThinkPad P14s Gen1 20S40009GE B140HAN05.7, LTPS IPS LED, 1920x1080, 14" | HP ZBook Firefly 14 G7 InfoVision IVO8C78 (X140NVFC R0), IPS, 1920x1080, 14" | Lenovo ThinkPad T14-20S1S06B00 B140HAN05.7, LTPS IPS LED, 1920x1080, 14" | Lenovo ThinkPad T14-20UES00H00 B140HAN05.7, IPS, 1920x1080, 14" | Lenovo ThinkPad P43s-20RH001FGE Lenovo N140HCA-EAC, IPS, 1920x1080, 14" | |
|---|---|---|---|---|---|
| Display | 9% | 1% | 0% | -35% | |
| Display P3 Coverage (%) | 65.5 | 73.8 13% | 66 1% | 66.1 1% | 42.23 -36% |
| sRGB Coverage (%) | 96.6 | 99 2% | 96.8 0% | 95.8 -1% | 63.1 -35% |
| AdobeRGB 1998 Coverage (%) | 66.7 | 75.5 13% | 67.1 1% | 67.2 1% | 43.68 -35% |
| Response Times | -16% | 10% | 0% | 17% | |
| Response Time Grey 50% / Grey 80% * (ms) | 64 ? | 54.8 ? 14% | 58.4 ? 9% | 64 ? -0% | 42.6 ? 33% |
| Response Time Black / White * (ms) | 29.6 ? | 43.2 ? -46% | 26.4 ? 11% | 29.6 ? -0% | 29.6 ? -0% |
| PWM Frequency (Hz) | 284.1 ? | 24750 ? | |||
| Screen | 10% | 6% | 6% | -59% | |
| Brightness middle (cd/m²) | 386 | 934 142% | 397 3% | 406 5% | 232 -40% |
| Brightness (cd/m²) | 379 | 937 147% | 394 4% | 403 6% | 214 -44% |
| Brightness Distribution (%) | 88 | 87 -1% | 90 2% | 88 0% | 89 1% |
| Black Level * (cd/m²) | 0.19 | 0.37 -95% | 0.2 -5% | 0.2 -5% | 0.17 11% |
| Contrast (:1) | 2032 | 2524 24% | 1985 -2% | 2030 0% | 1365 -33% |
| Colorchecker dE 2000 * | 4.4 | 4.7 -7% | 3.6 18% | 3.3 25% | 5.9 -34% |
| Colorchecker dE 2000 max. * | 7.2 | 10.5 -46% | 5.9 18% | 4.8 33% | 20.3 -182% |
| Colorchecker dE 2000 calibrated * | 1.2 | 1.6 -33% | 1.2 -0% | 1.5 -25% | 4.4 -267% |
| Greyscale dE 2000 * | 5.1 | 7.1 -39% | 3.9 24% | 3.6 29% | 4.8 6% |
| Gamma | 2.5 88% | 2.31 95% | 2.48 89% | 2.43 91% | 1.98 111% |
| CCT | 7464 87% | 6348 102% | 7090 92% | 6893 94% | 6226 104% |
| Color Space (Percent of AdobeRGB 1998) (%) | 61.2 | 68.5 12% | 61.4 0% | 61.5 0% | 40.2 -34% |
| Color Space (Percent of sRGB) (%) | 96.4 | 98.9 3% | 96.6 0% | 95.5 -1% | 62.8 -35% |
| Média Total (Programa/Configurações) | 1% /
6% | 6% /
5% | 2% /
4% | -26% /
-45% |
* ... menor é melhor
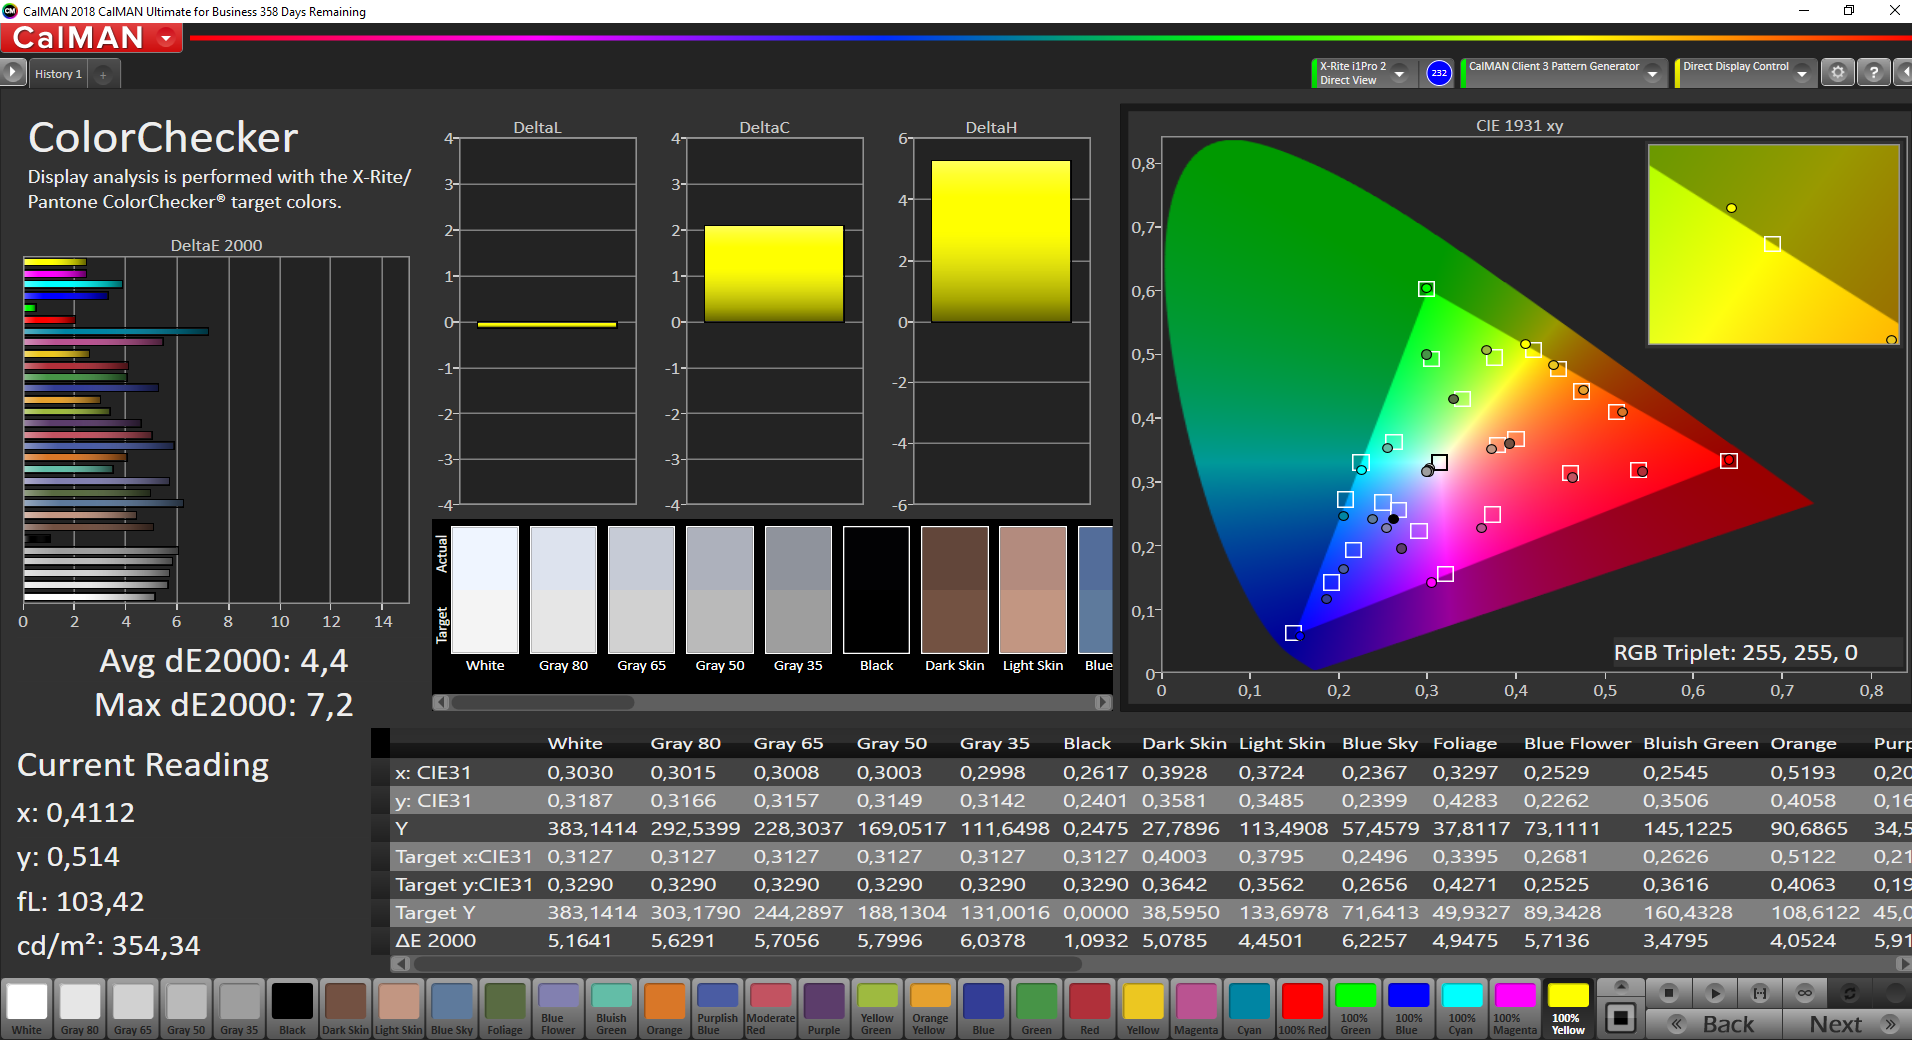
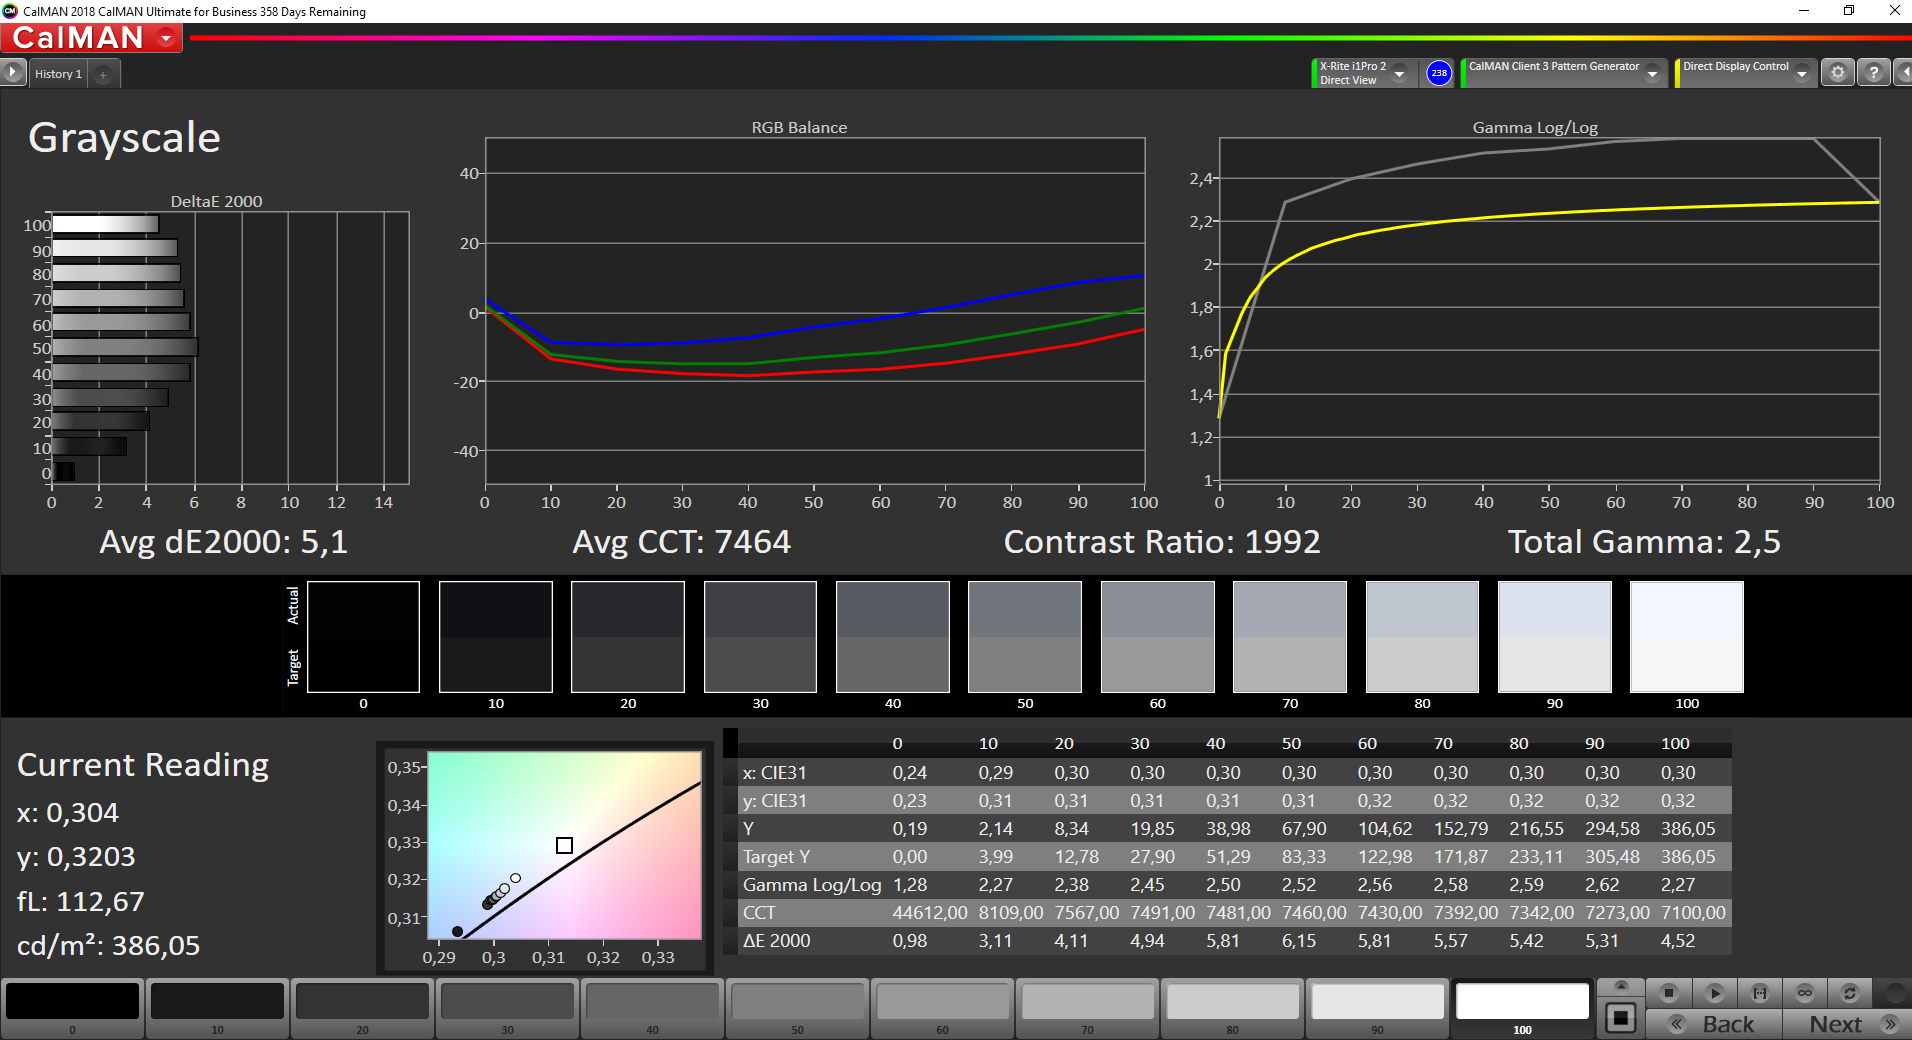
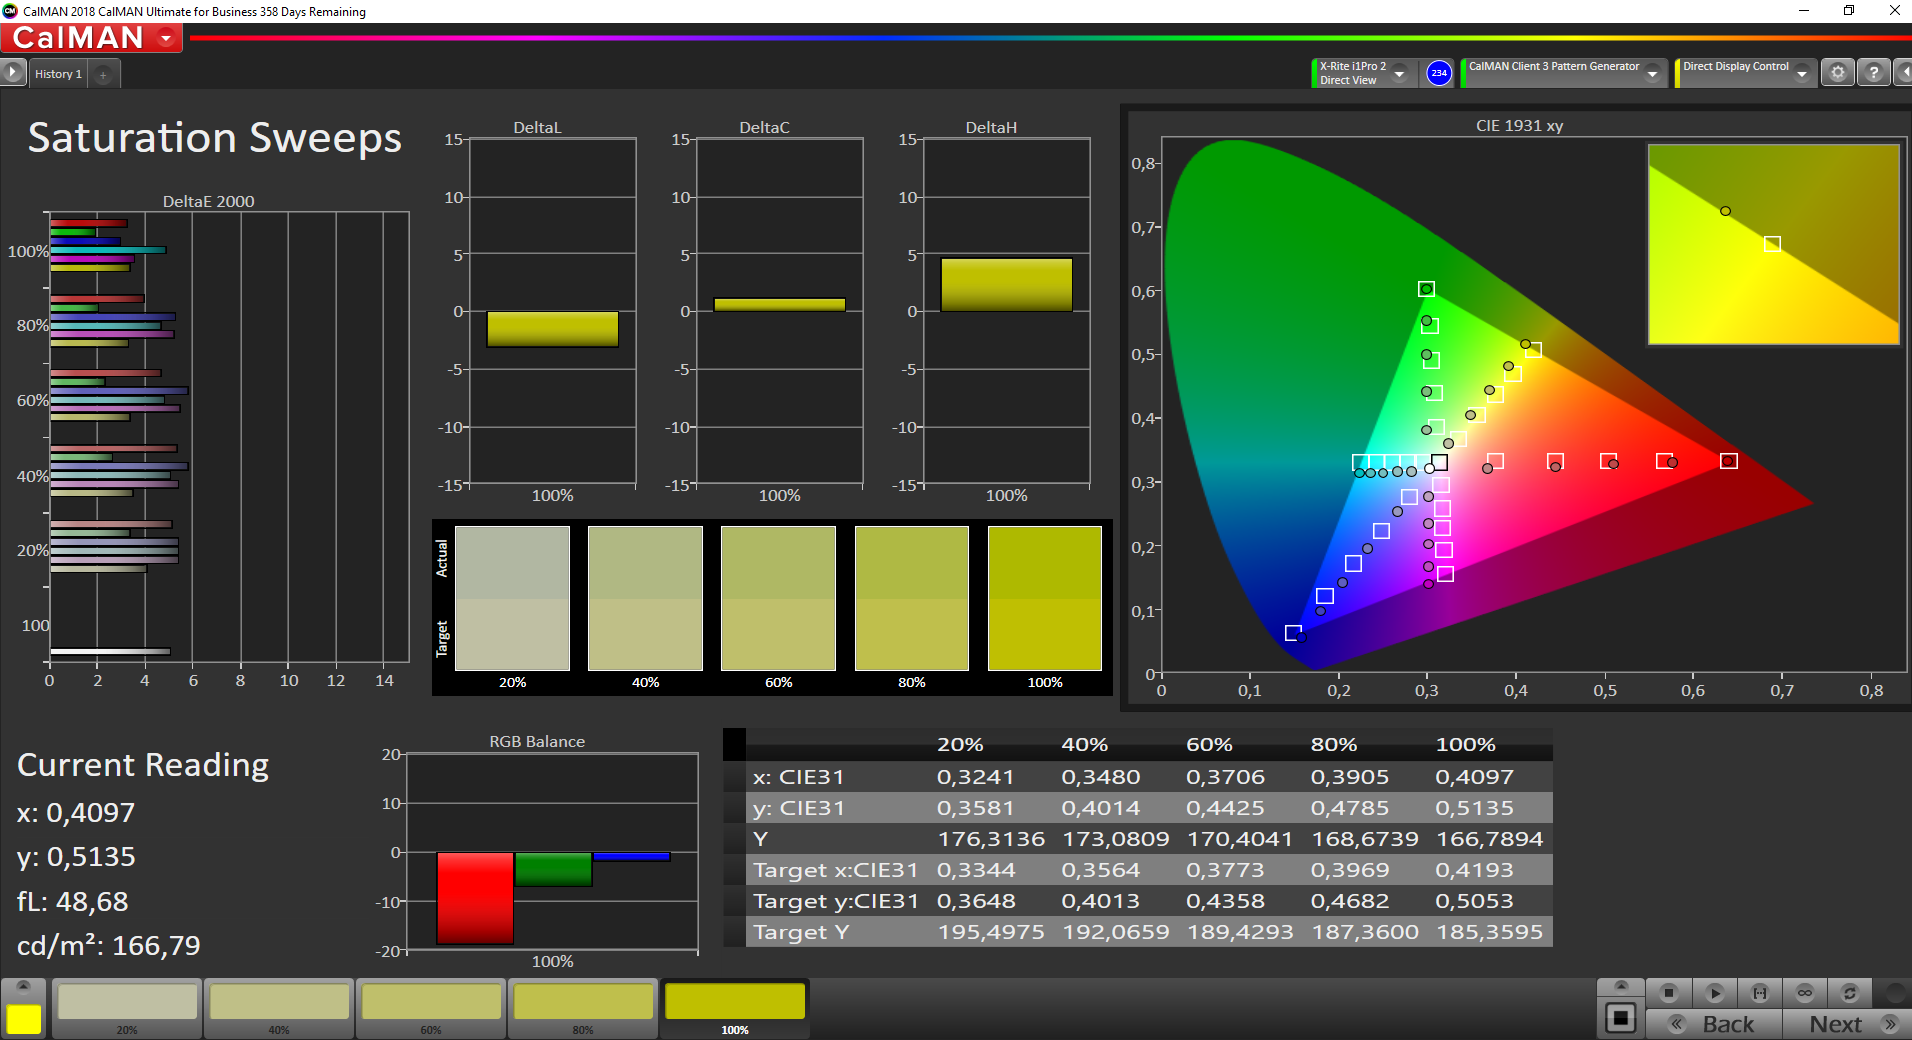
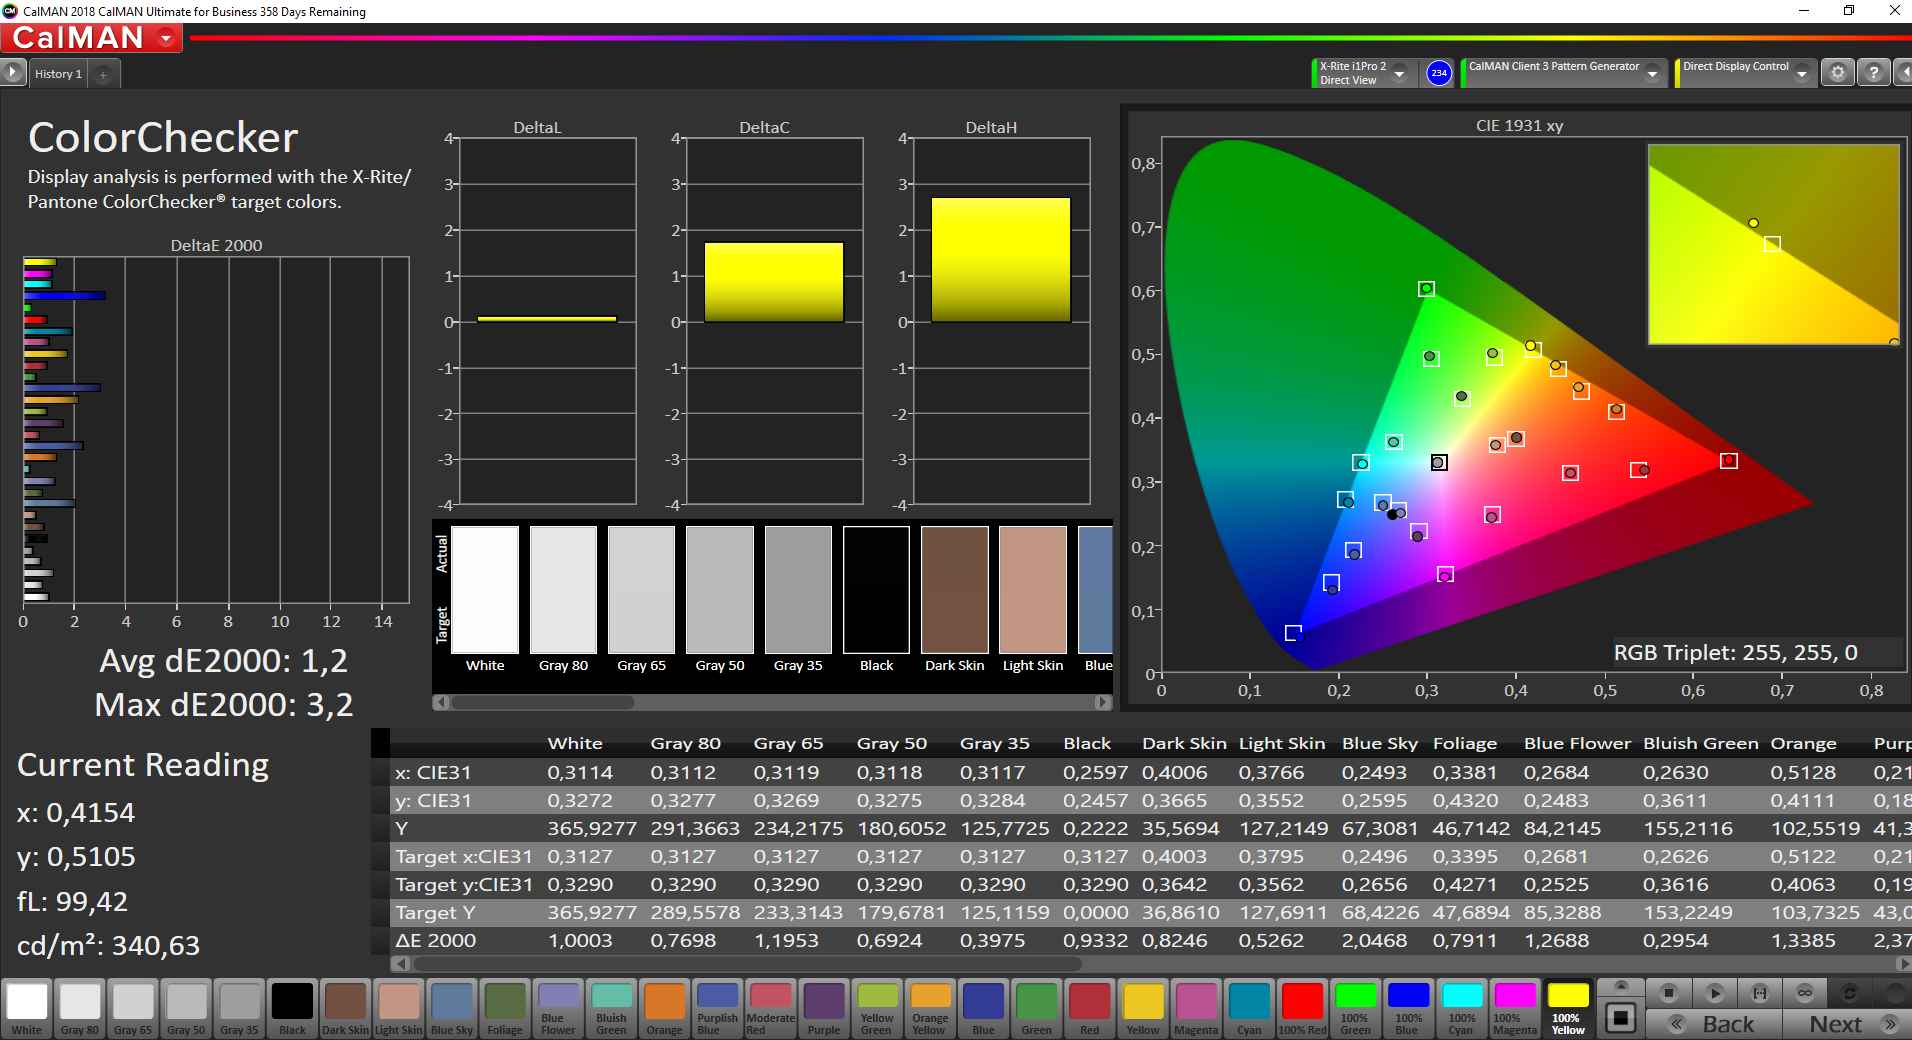
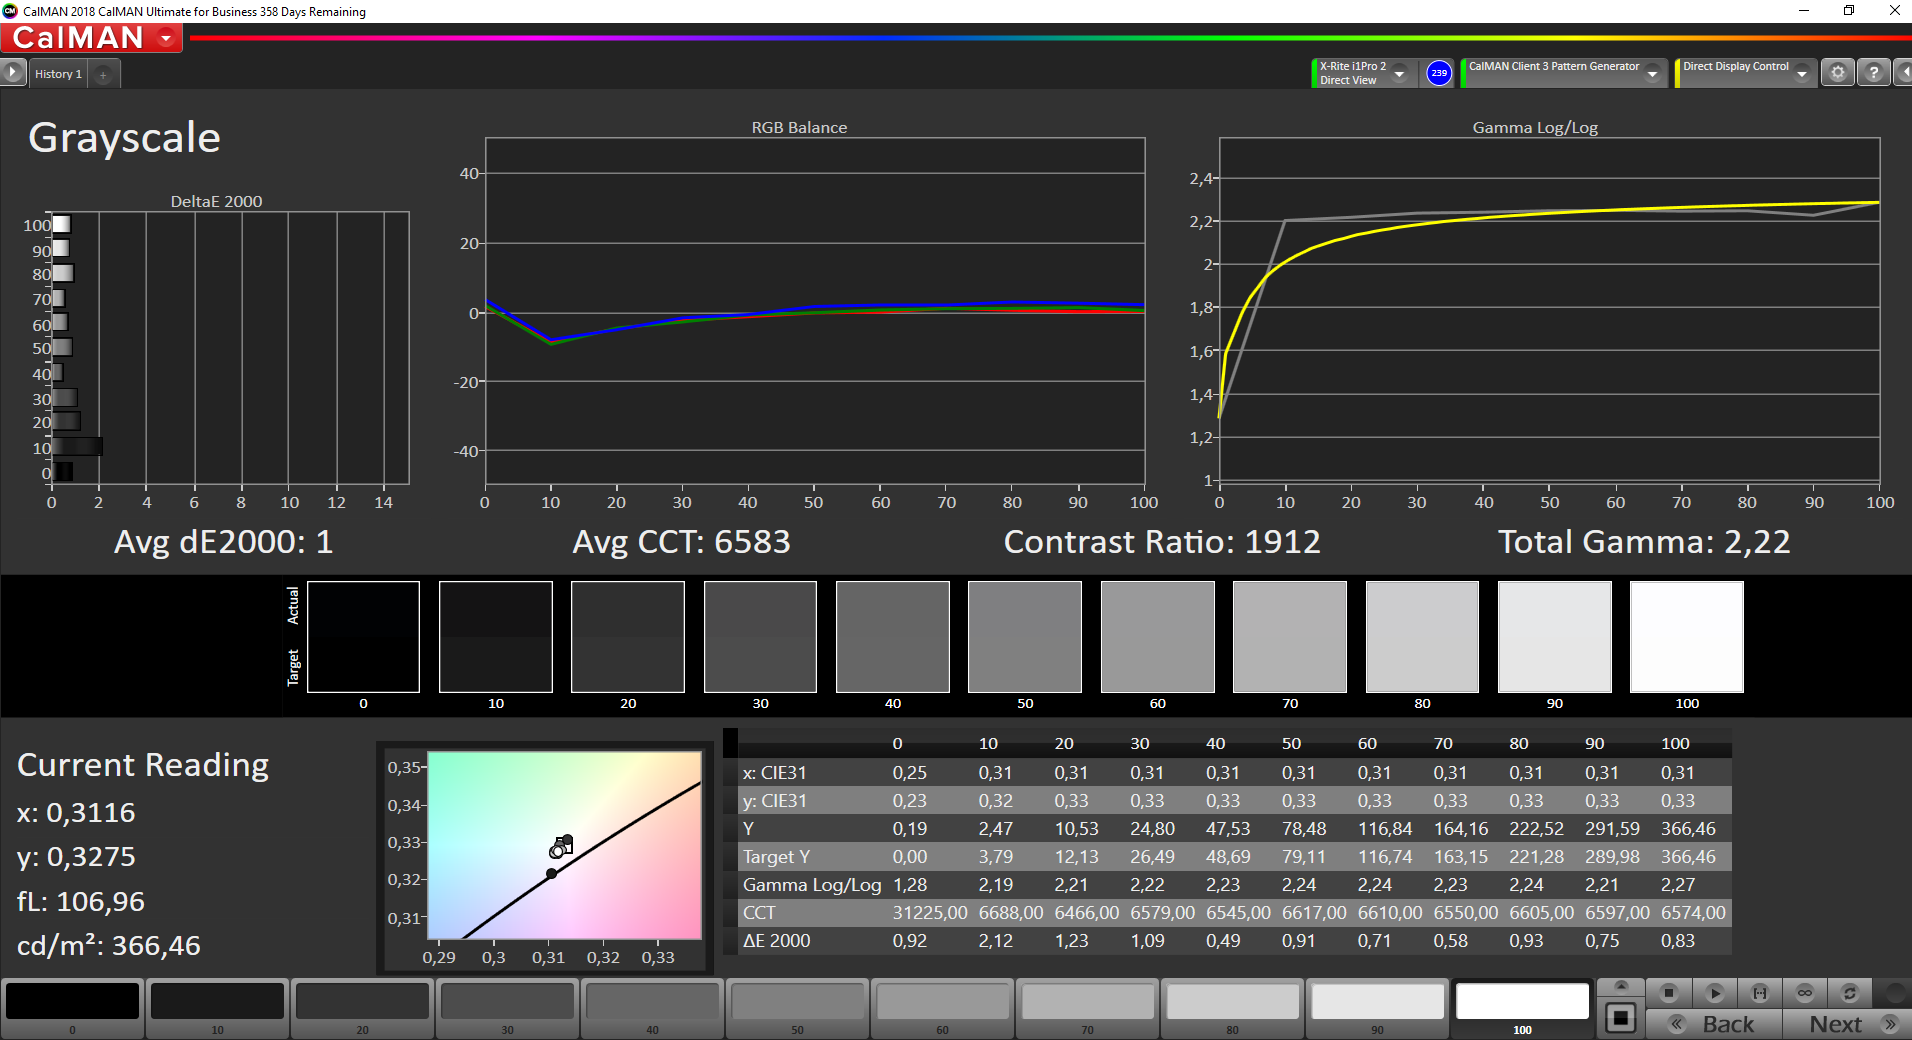
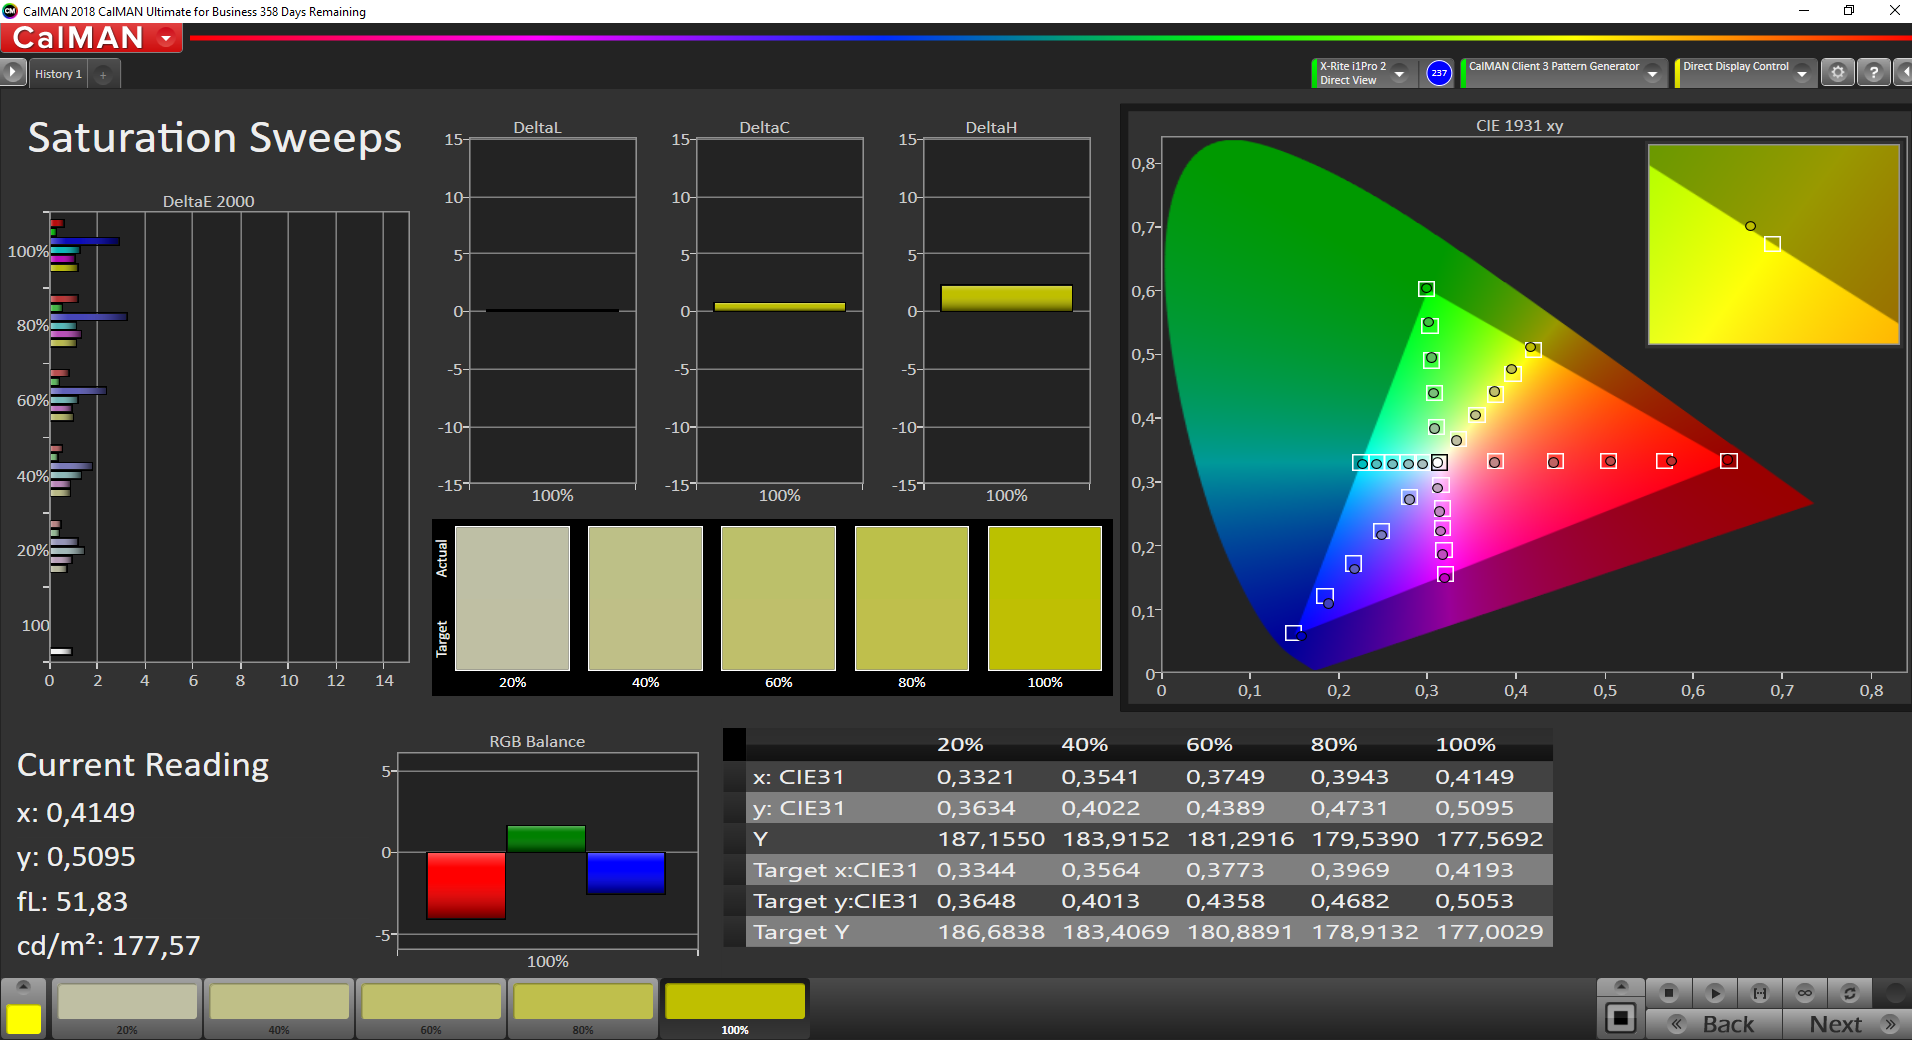
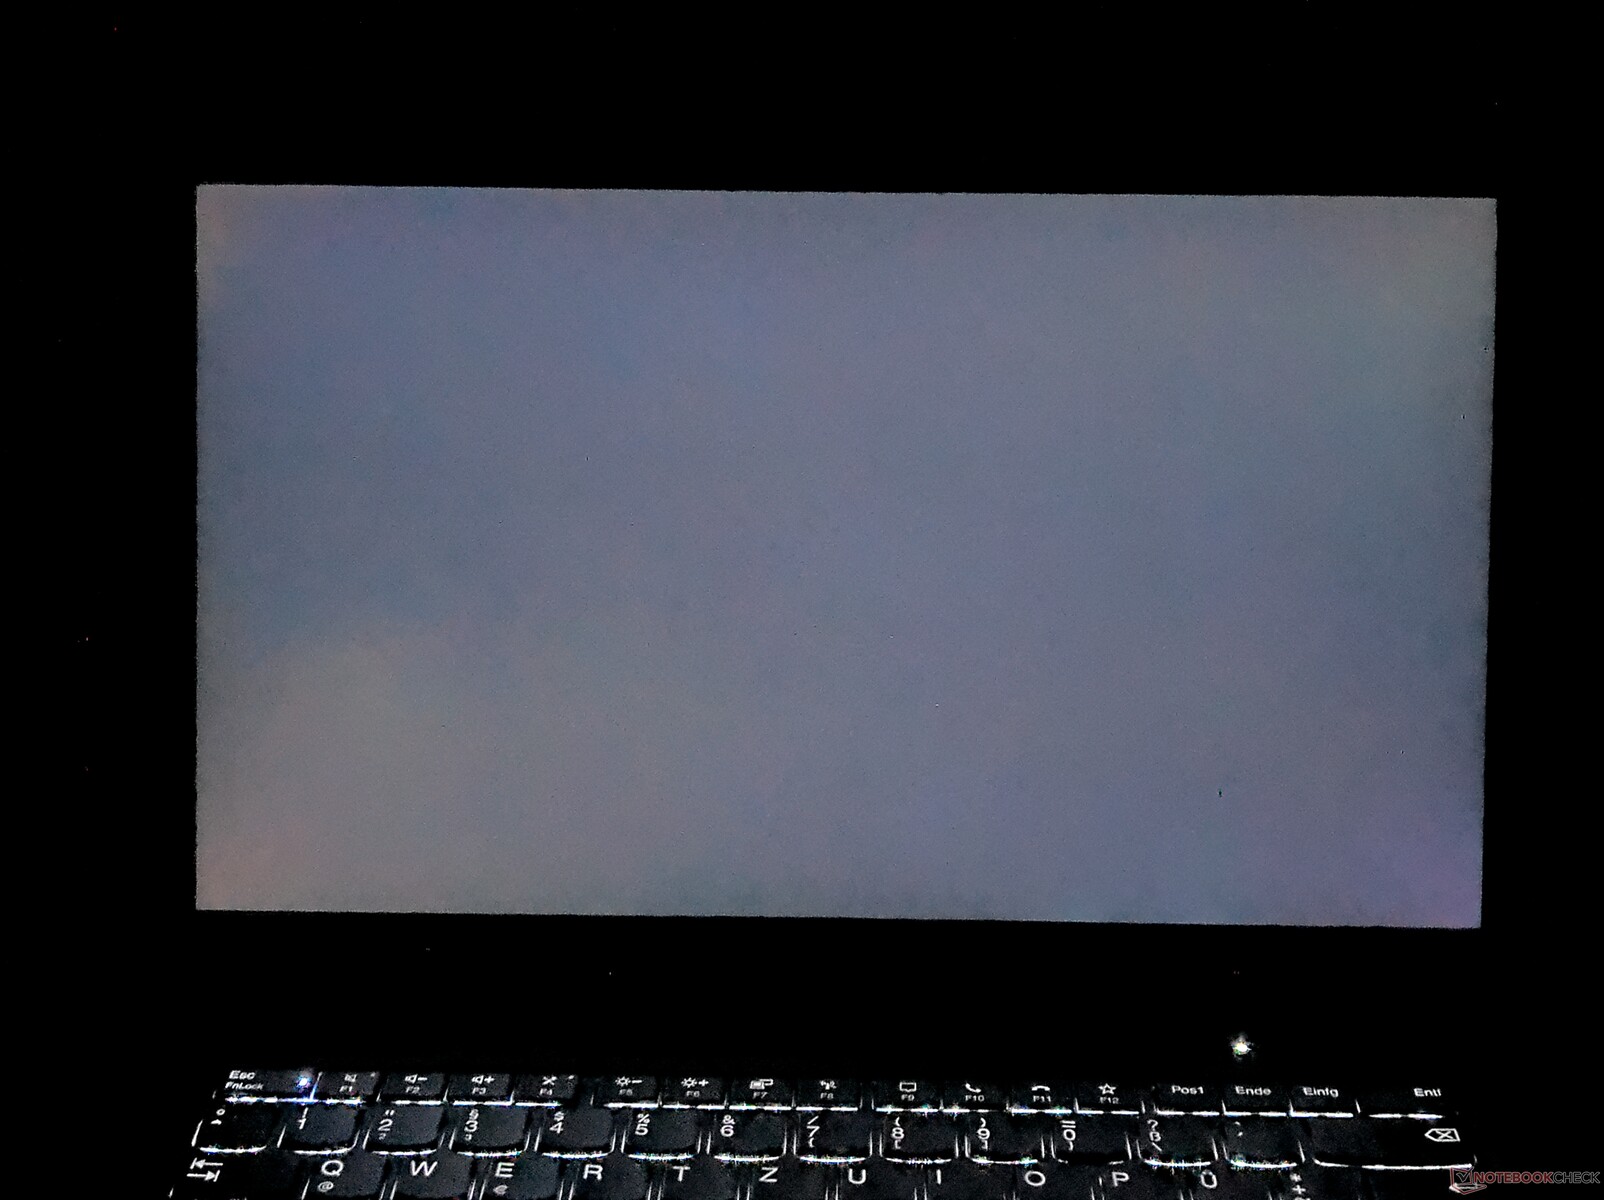
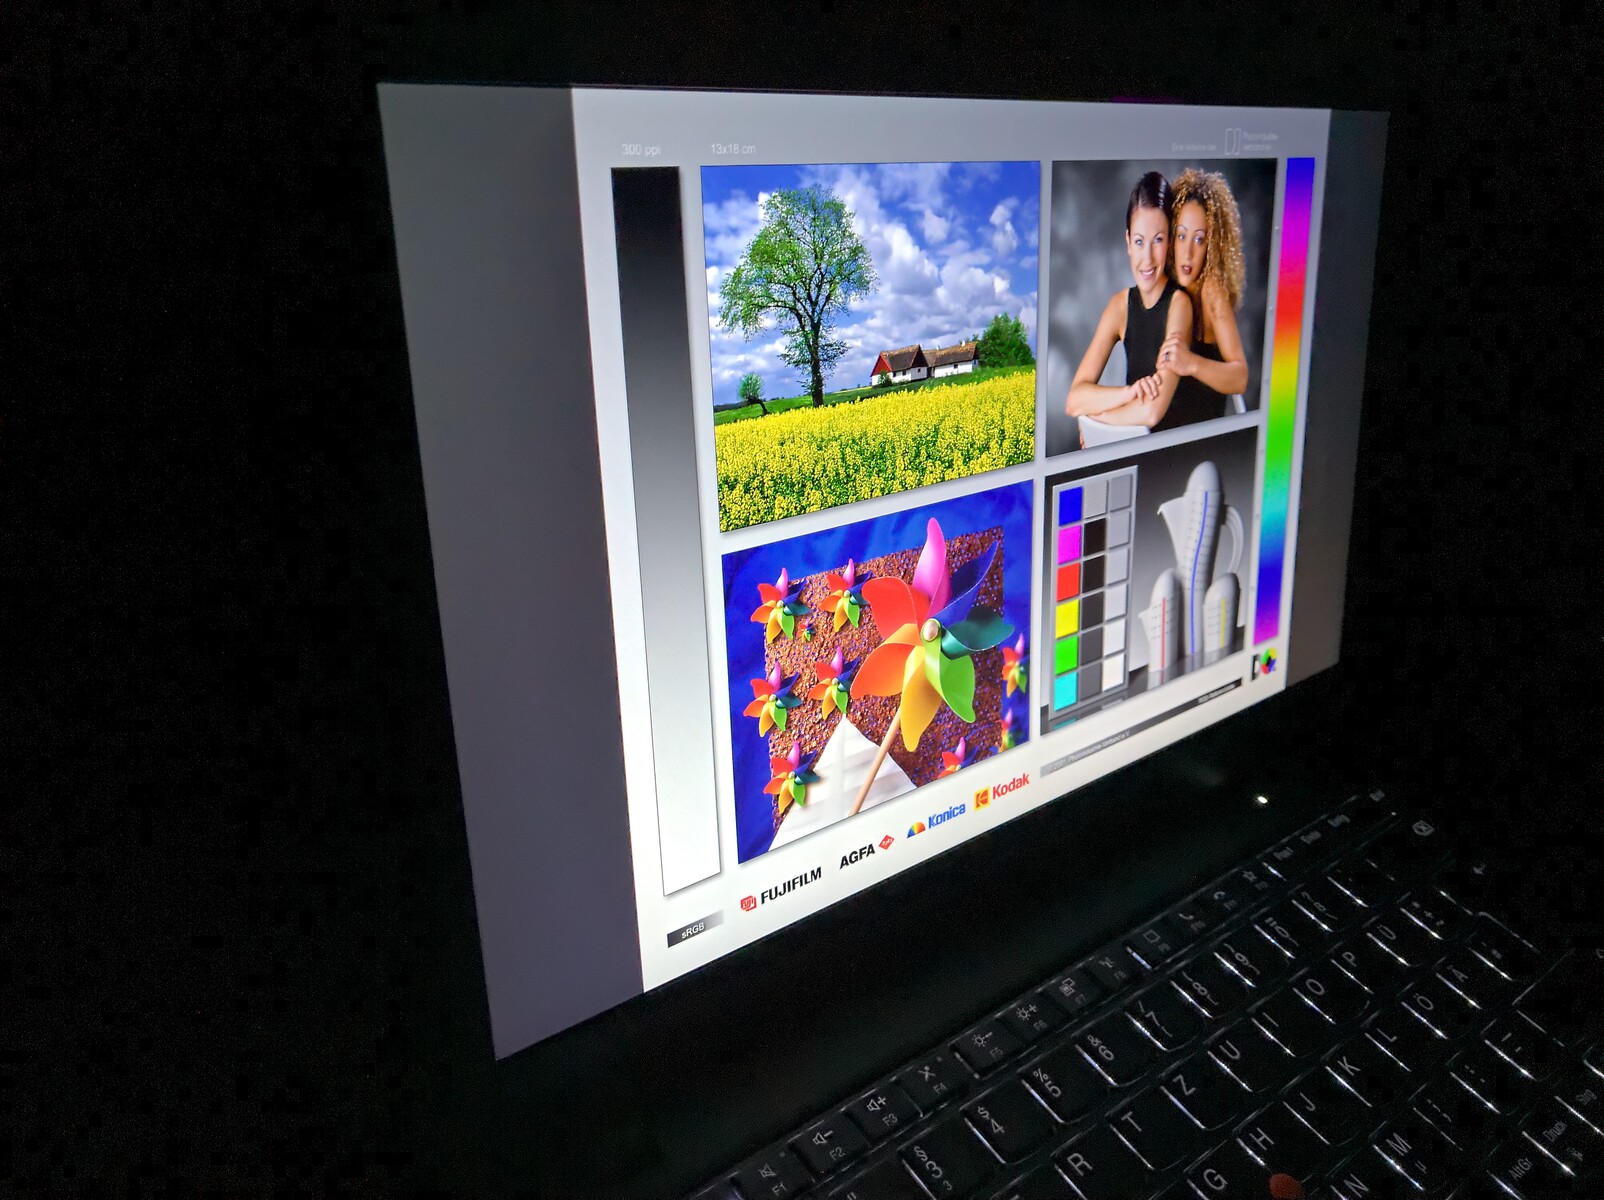
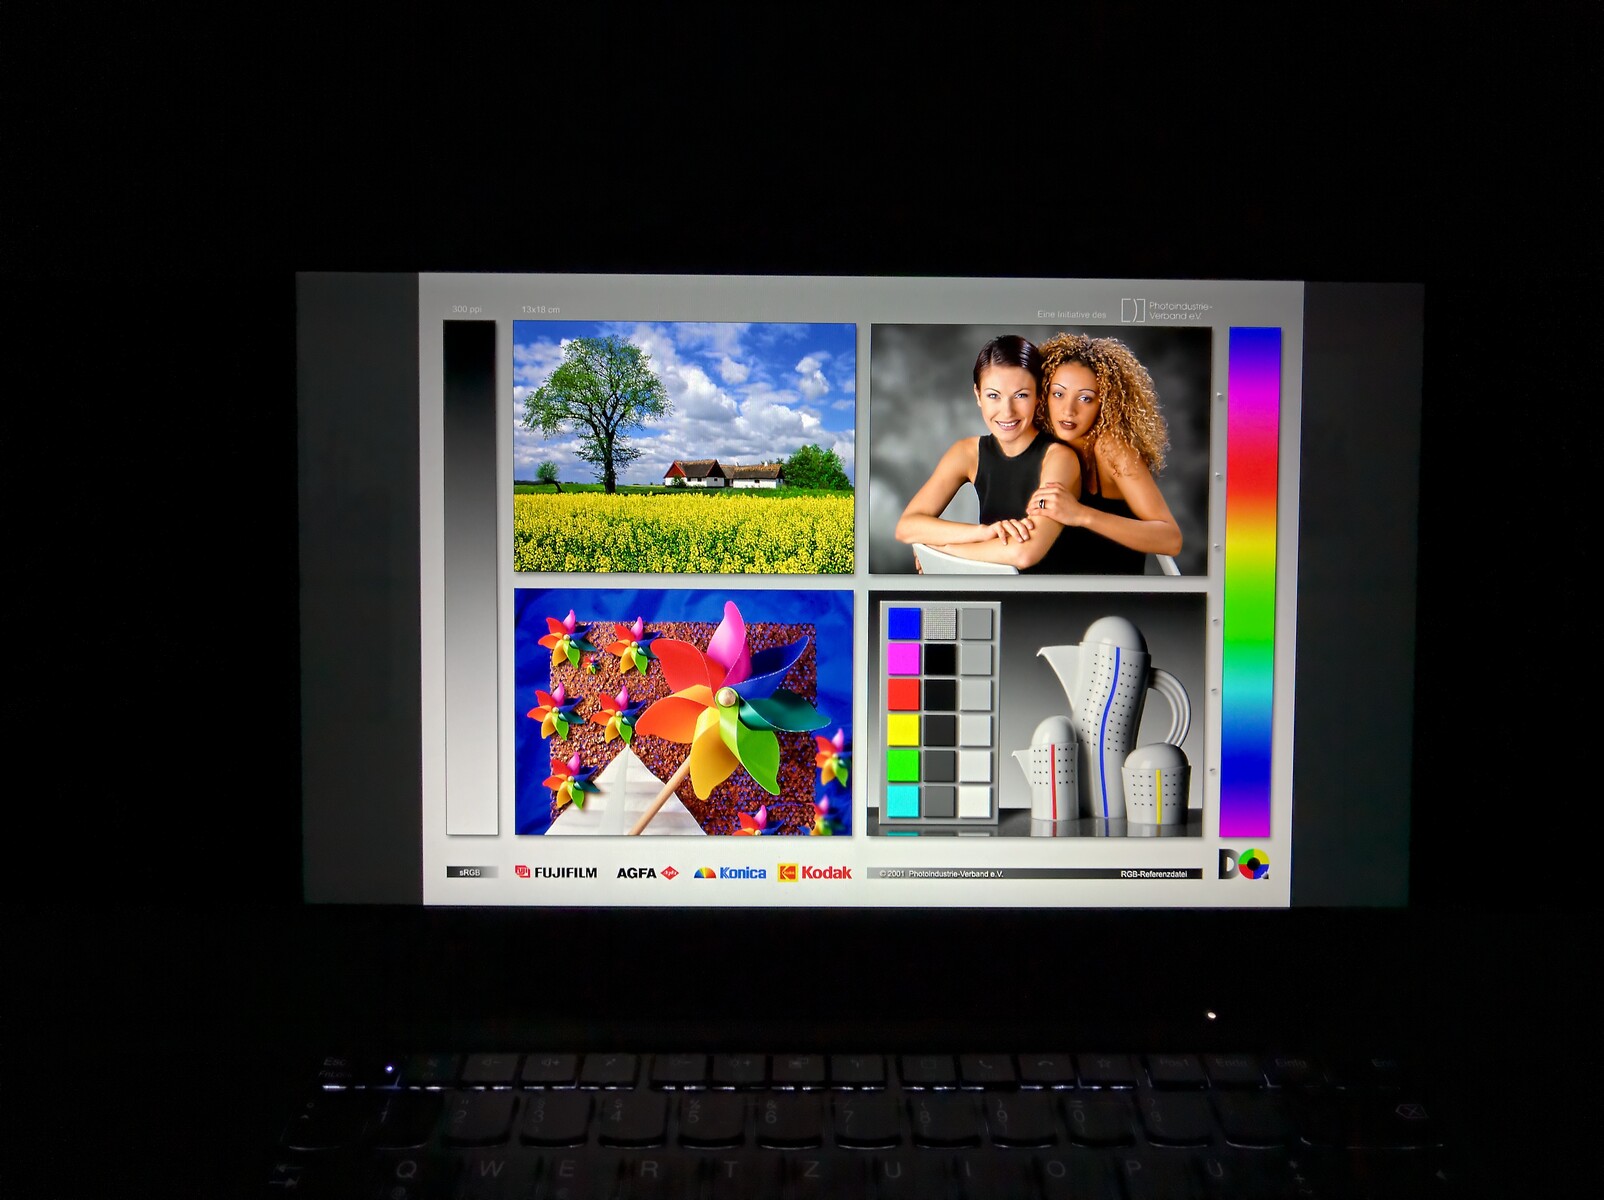
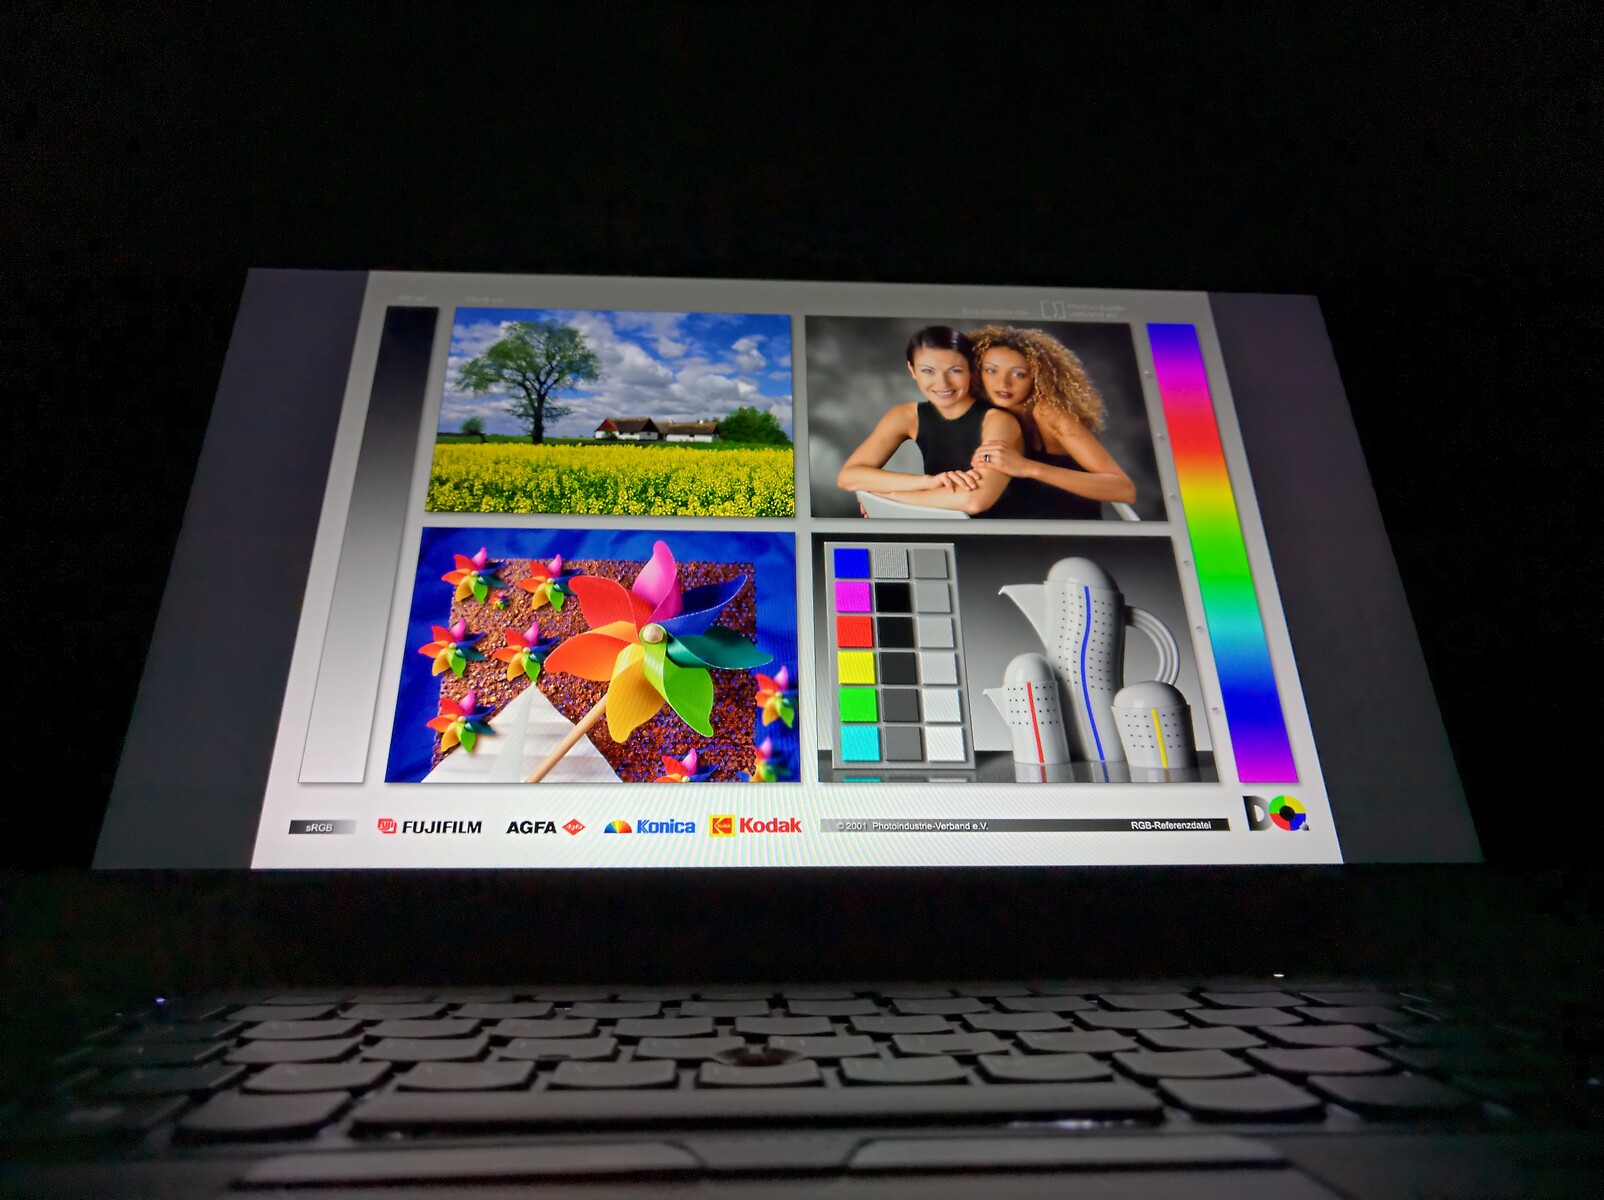
Conseguimos remover o leve molde azulado do display ex-works com uma calibração. O painel foi medido com o CalMan e o colorímetro X-Rite i1Pro2. Também foi assim que determinamos a excelente relação de contraste de cerca de 2000:1 - que já está no nível superior para um painel LCD normal. Entretanto, este visor não é tão normal assim: é um painel LTPS.
Com 96,4%, o espaço de cor sRGB é praticamente totalmente coberto, de modo que você também pode usar este display para edição simples de imagens
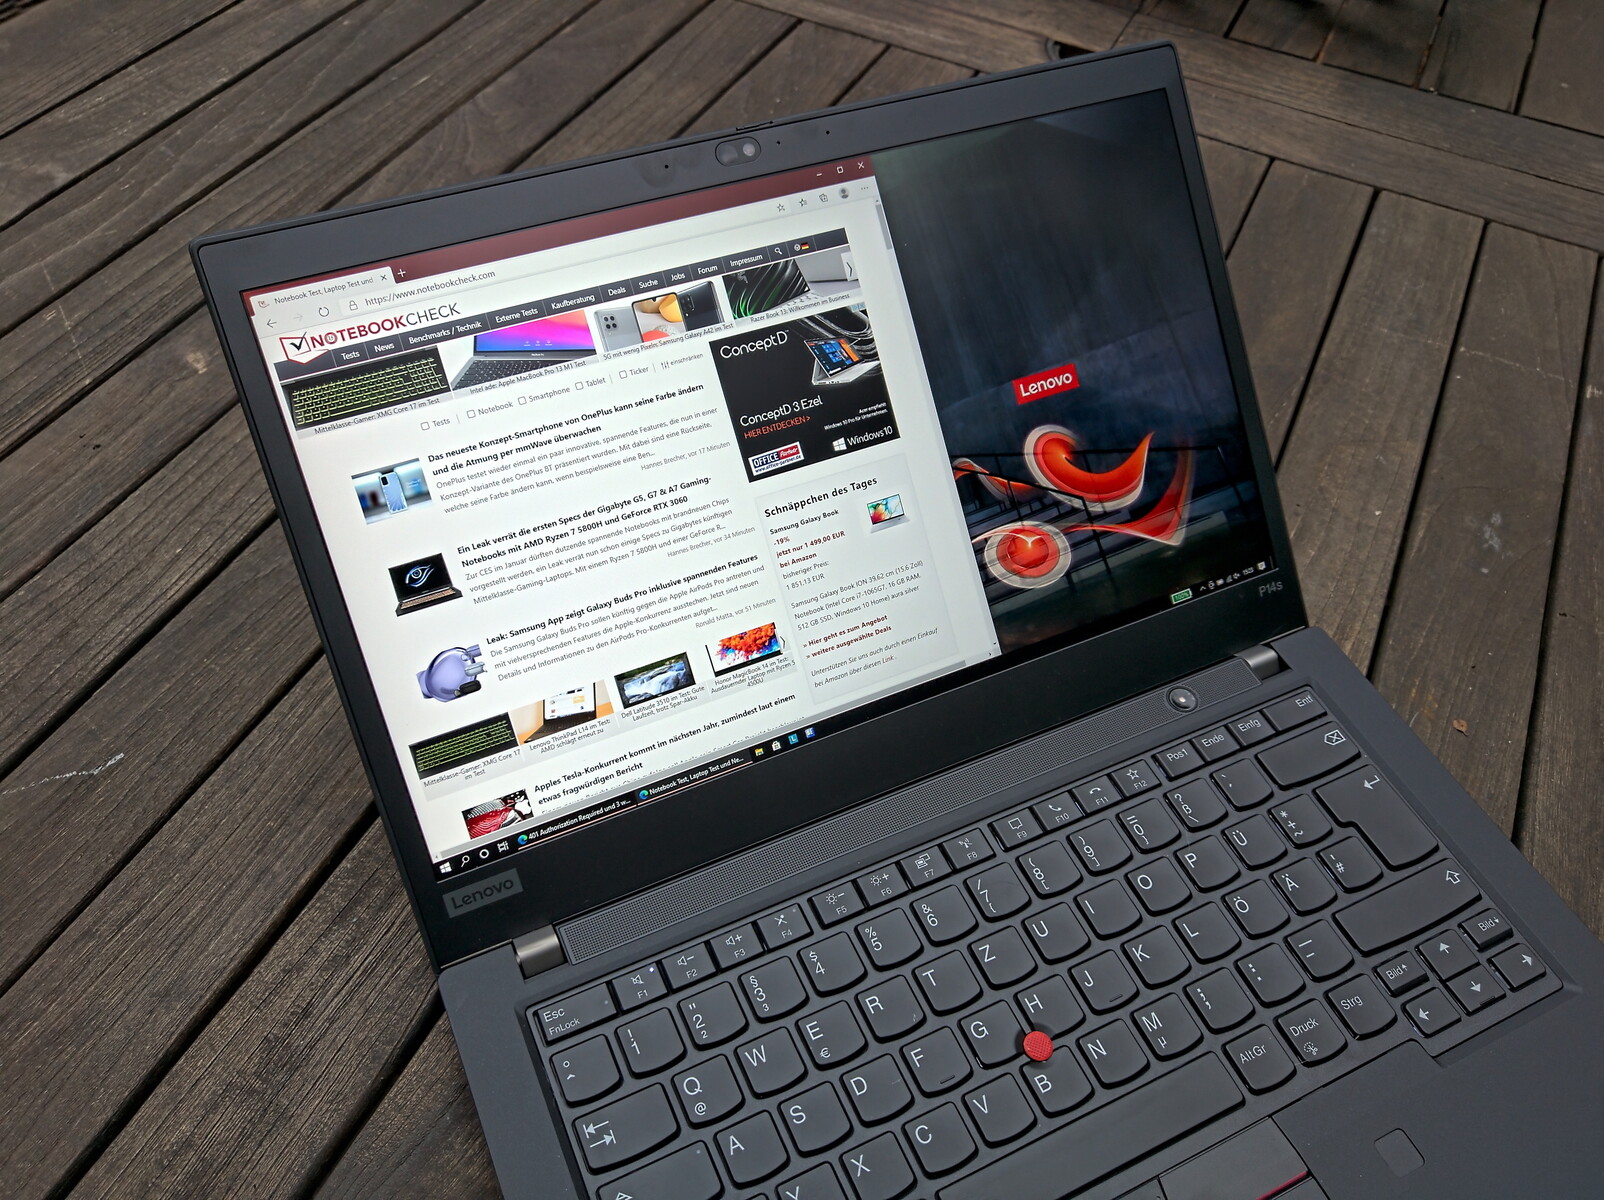
A superfície mate do painel e as boas taxas de brilho beneficiam o uso ao ar livre. Desde que você evite a luz direta do sol, você deve ser capaz de trabalhar bem ao ar livre
Exibir tempos de resposta
| ↔ Tempo de resposta preto para branco | ||
|---|---|---|
| 29.6 ms ... ascensão ↗ e queda ↘ combinadas | ↗ 13.2 ms ascensão | 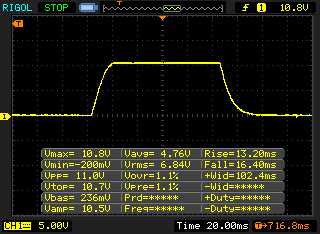 |
| ↘ 16.4 ms queda | ||
| A tela mostra taxas de resposta relativamente lentas em nossos testes e pode ser muito lenta para os jogadores. Em comparação, todos os dispositivos testados variam de 0.1 (mínimo) a 240 (máximo) ms. » 79 % de todos os dispositivos são melhores. Isso significa que o tempo de resposta medido é pior que a média de todos os dispositivos testados (19.9 ms). | ||
| ↔ Tempo de resposta 50% cinza a 80% cinza | ||
| 64 ms ... ascensão ↗ e queda ↘ combinadas | ↗ 30.8 ms ascensão | 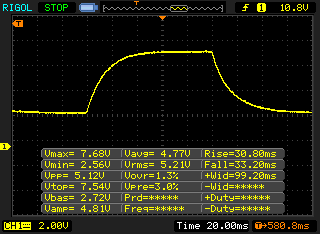 |
| ↘ 33.2 ms queda | ||
| A tela mostra taxas de resposta lentas em nossos testes e será insatisfatória para os jogadores. Em comparação, todos os dispositivos testados variam de 0.165 (mínimo) a 636 (máximo) ms. » 97 % de todos os dispositivos são melhores. Isso significa que o tempo de resposta medido é pior que a média de todos os dispositivos testados (31.1 ms). | ||
Cintilação da tela / PWM (modulação por largura de pulso)
| Tela tremeluzindo / PWM não detectado | 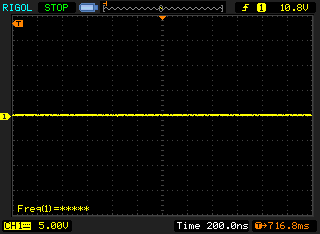 | ||
[pwm_comparison] Em comparação: 52 % de todos os dispositivos testados não usam PWM para escurecer a tela. Se PWM foi detectado, uma média de 7801 (mínimo: 5 - máximo: 343500) Hz foi medida. | |||
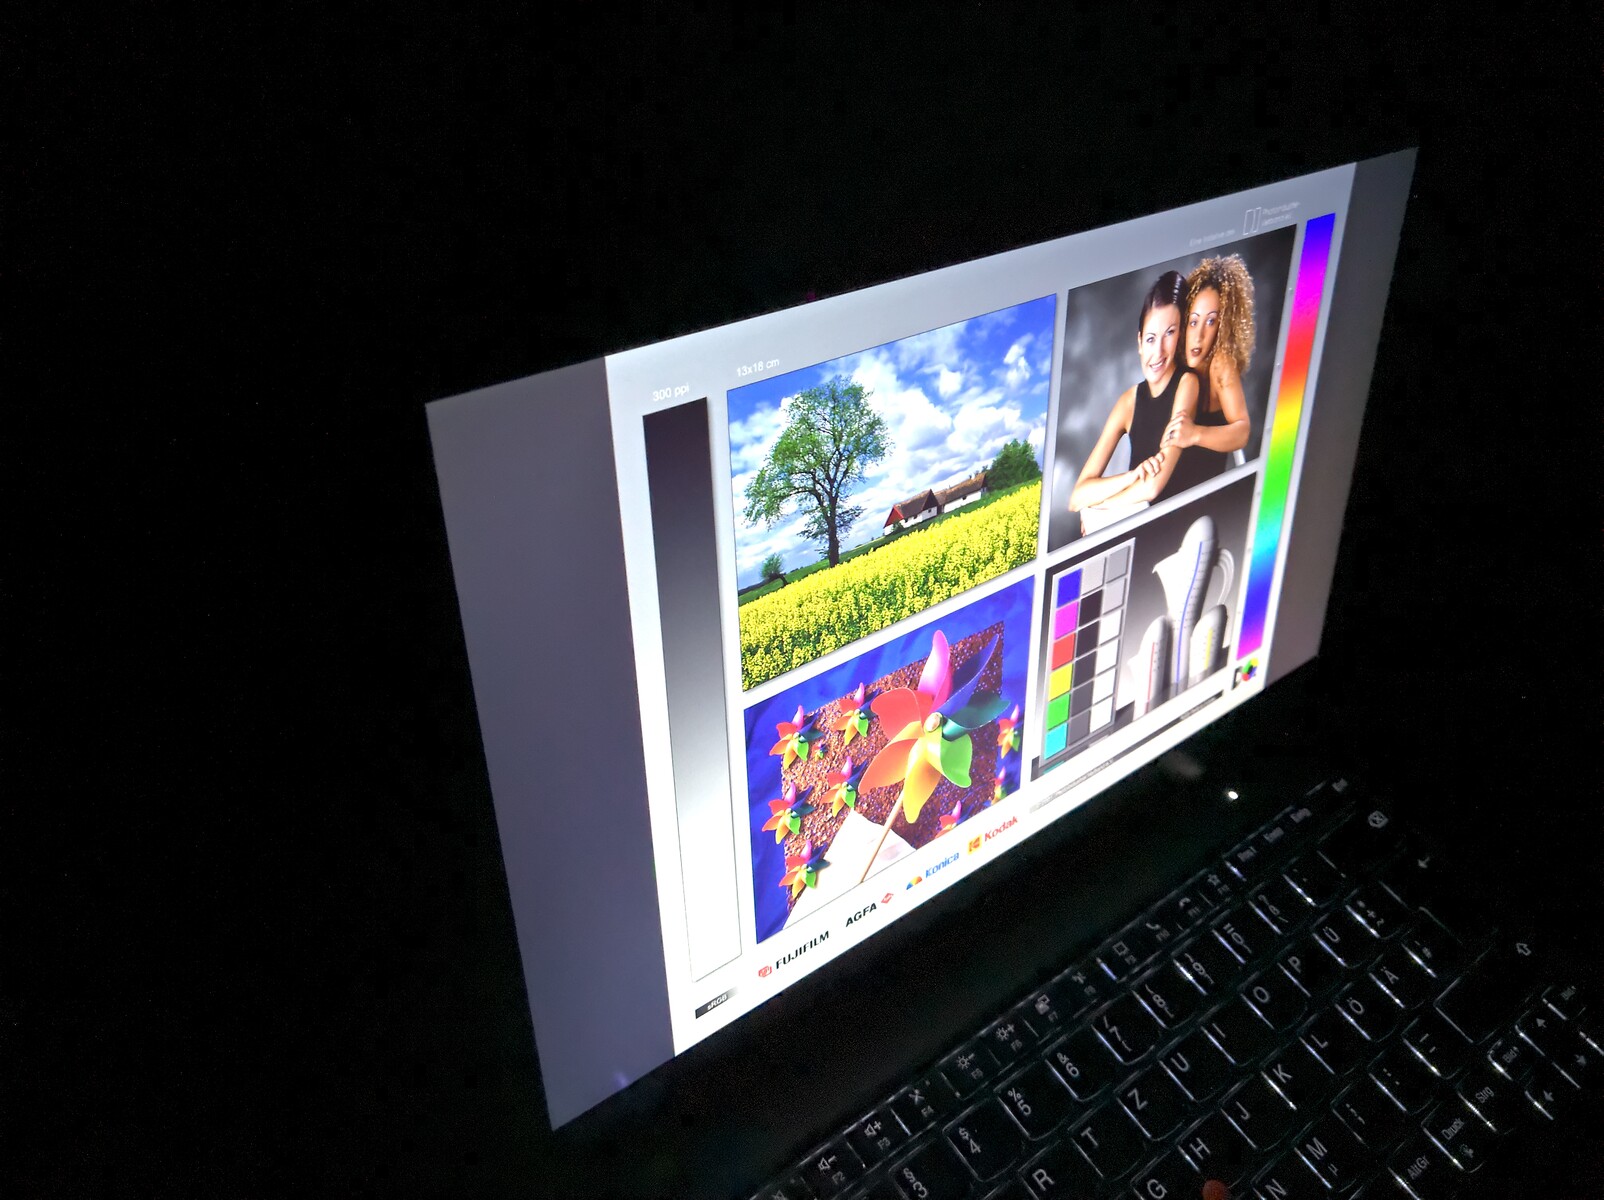
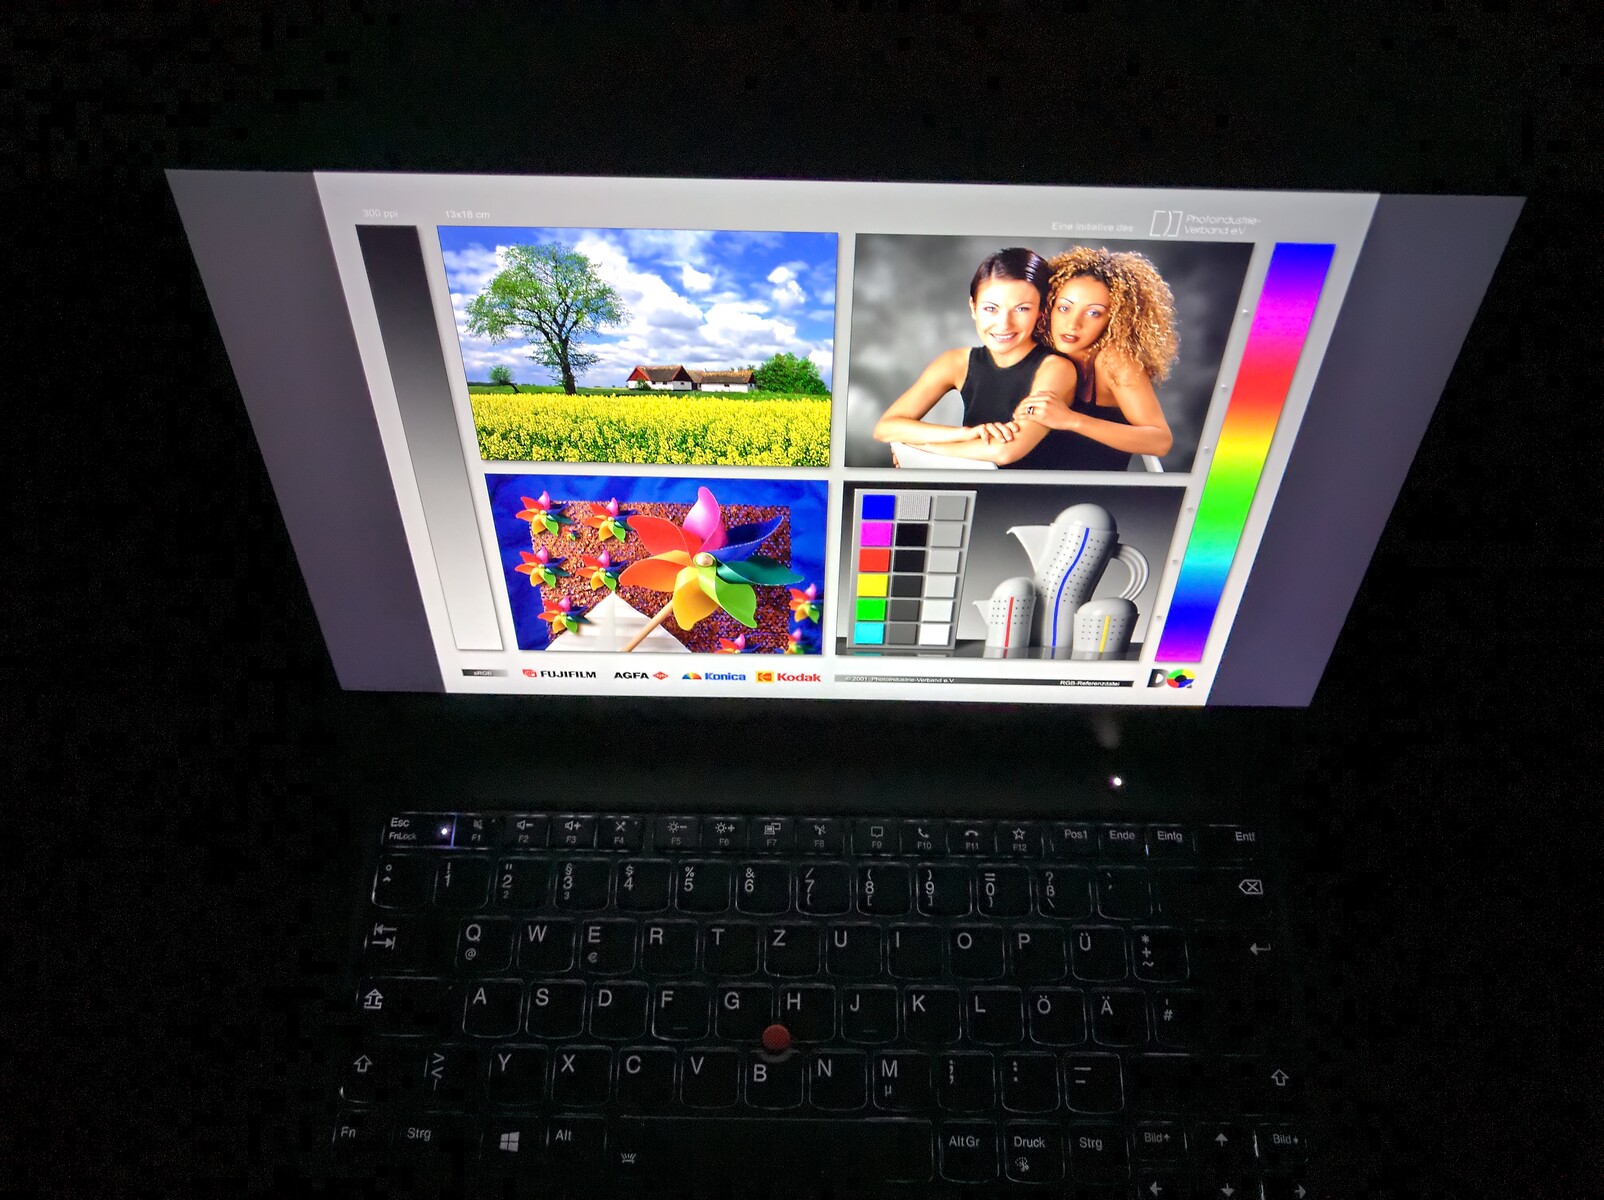
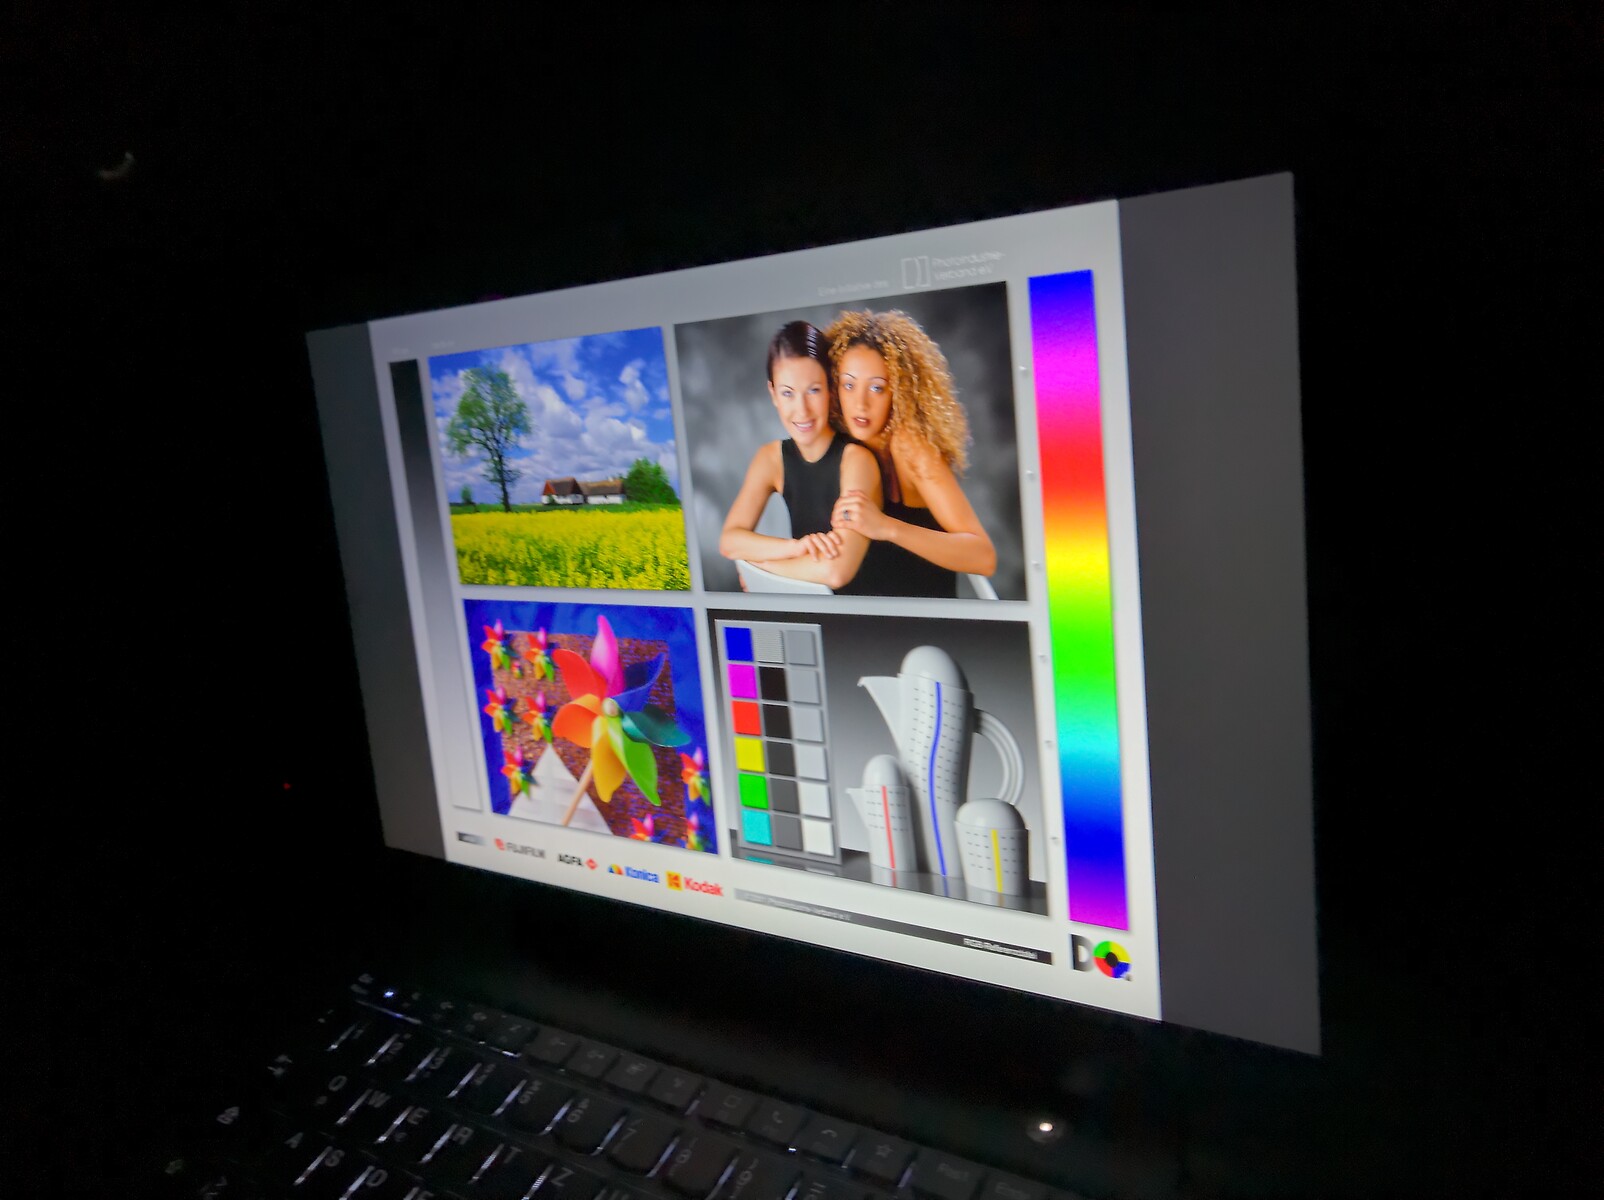
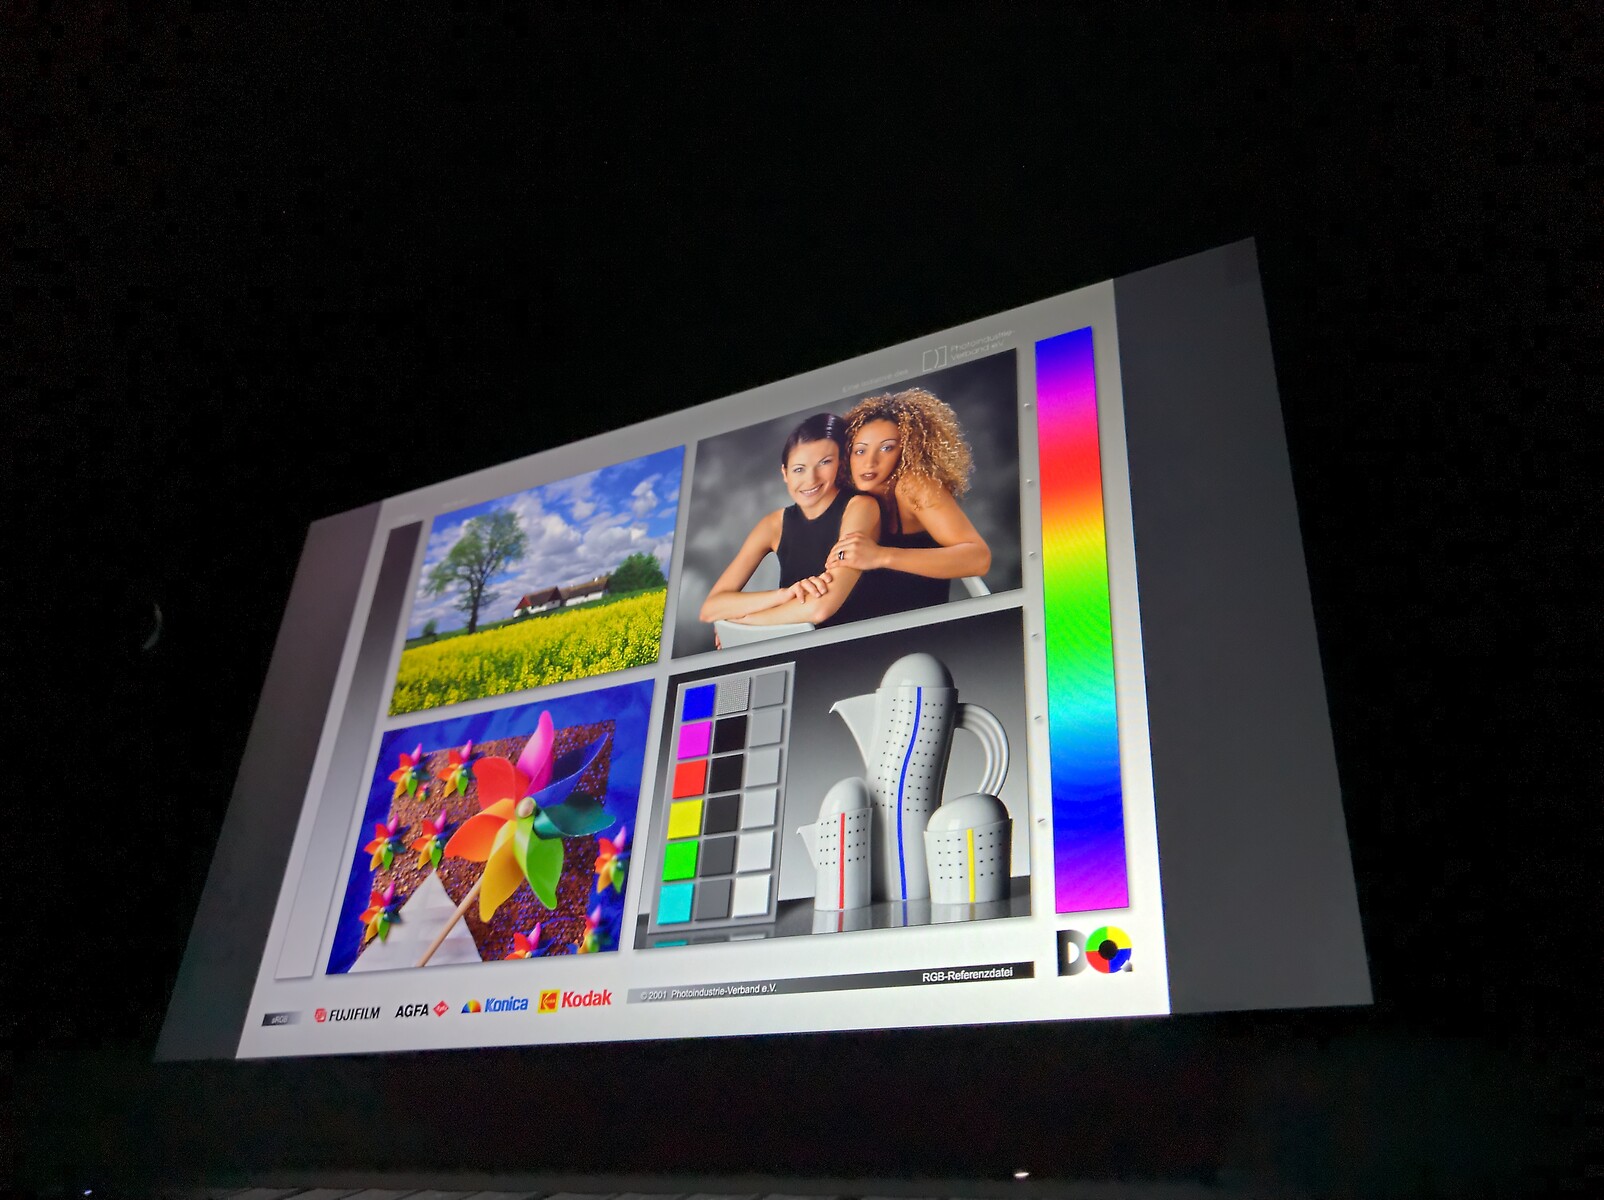
Graças à tecnologia IPS, não há nada a reclamar sobre a estabilidade do ângulo de visão.
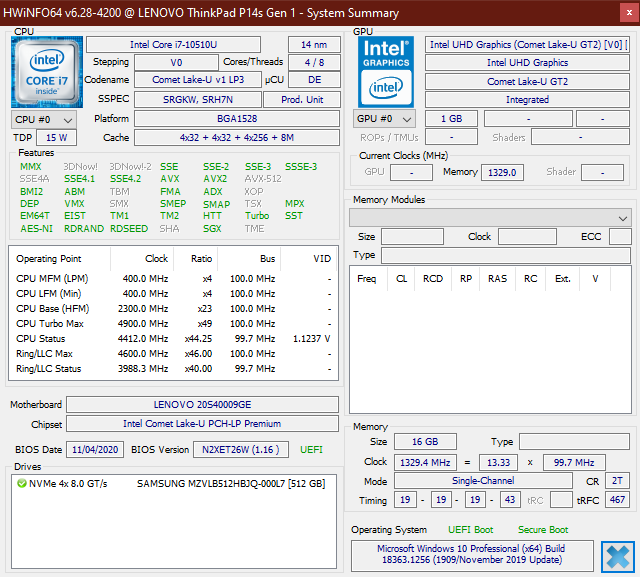
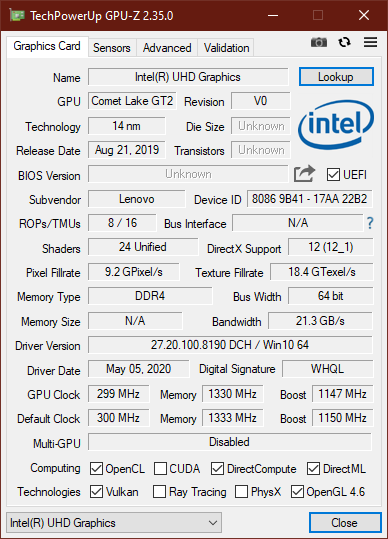
Desempenho: GPU Nvidia desatualizada no ThinkPad P14s da Lenovo
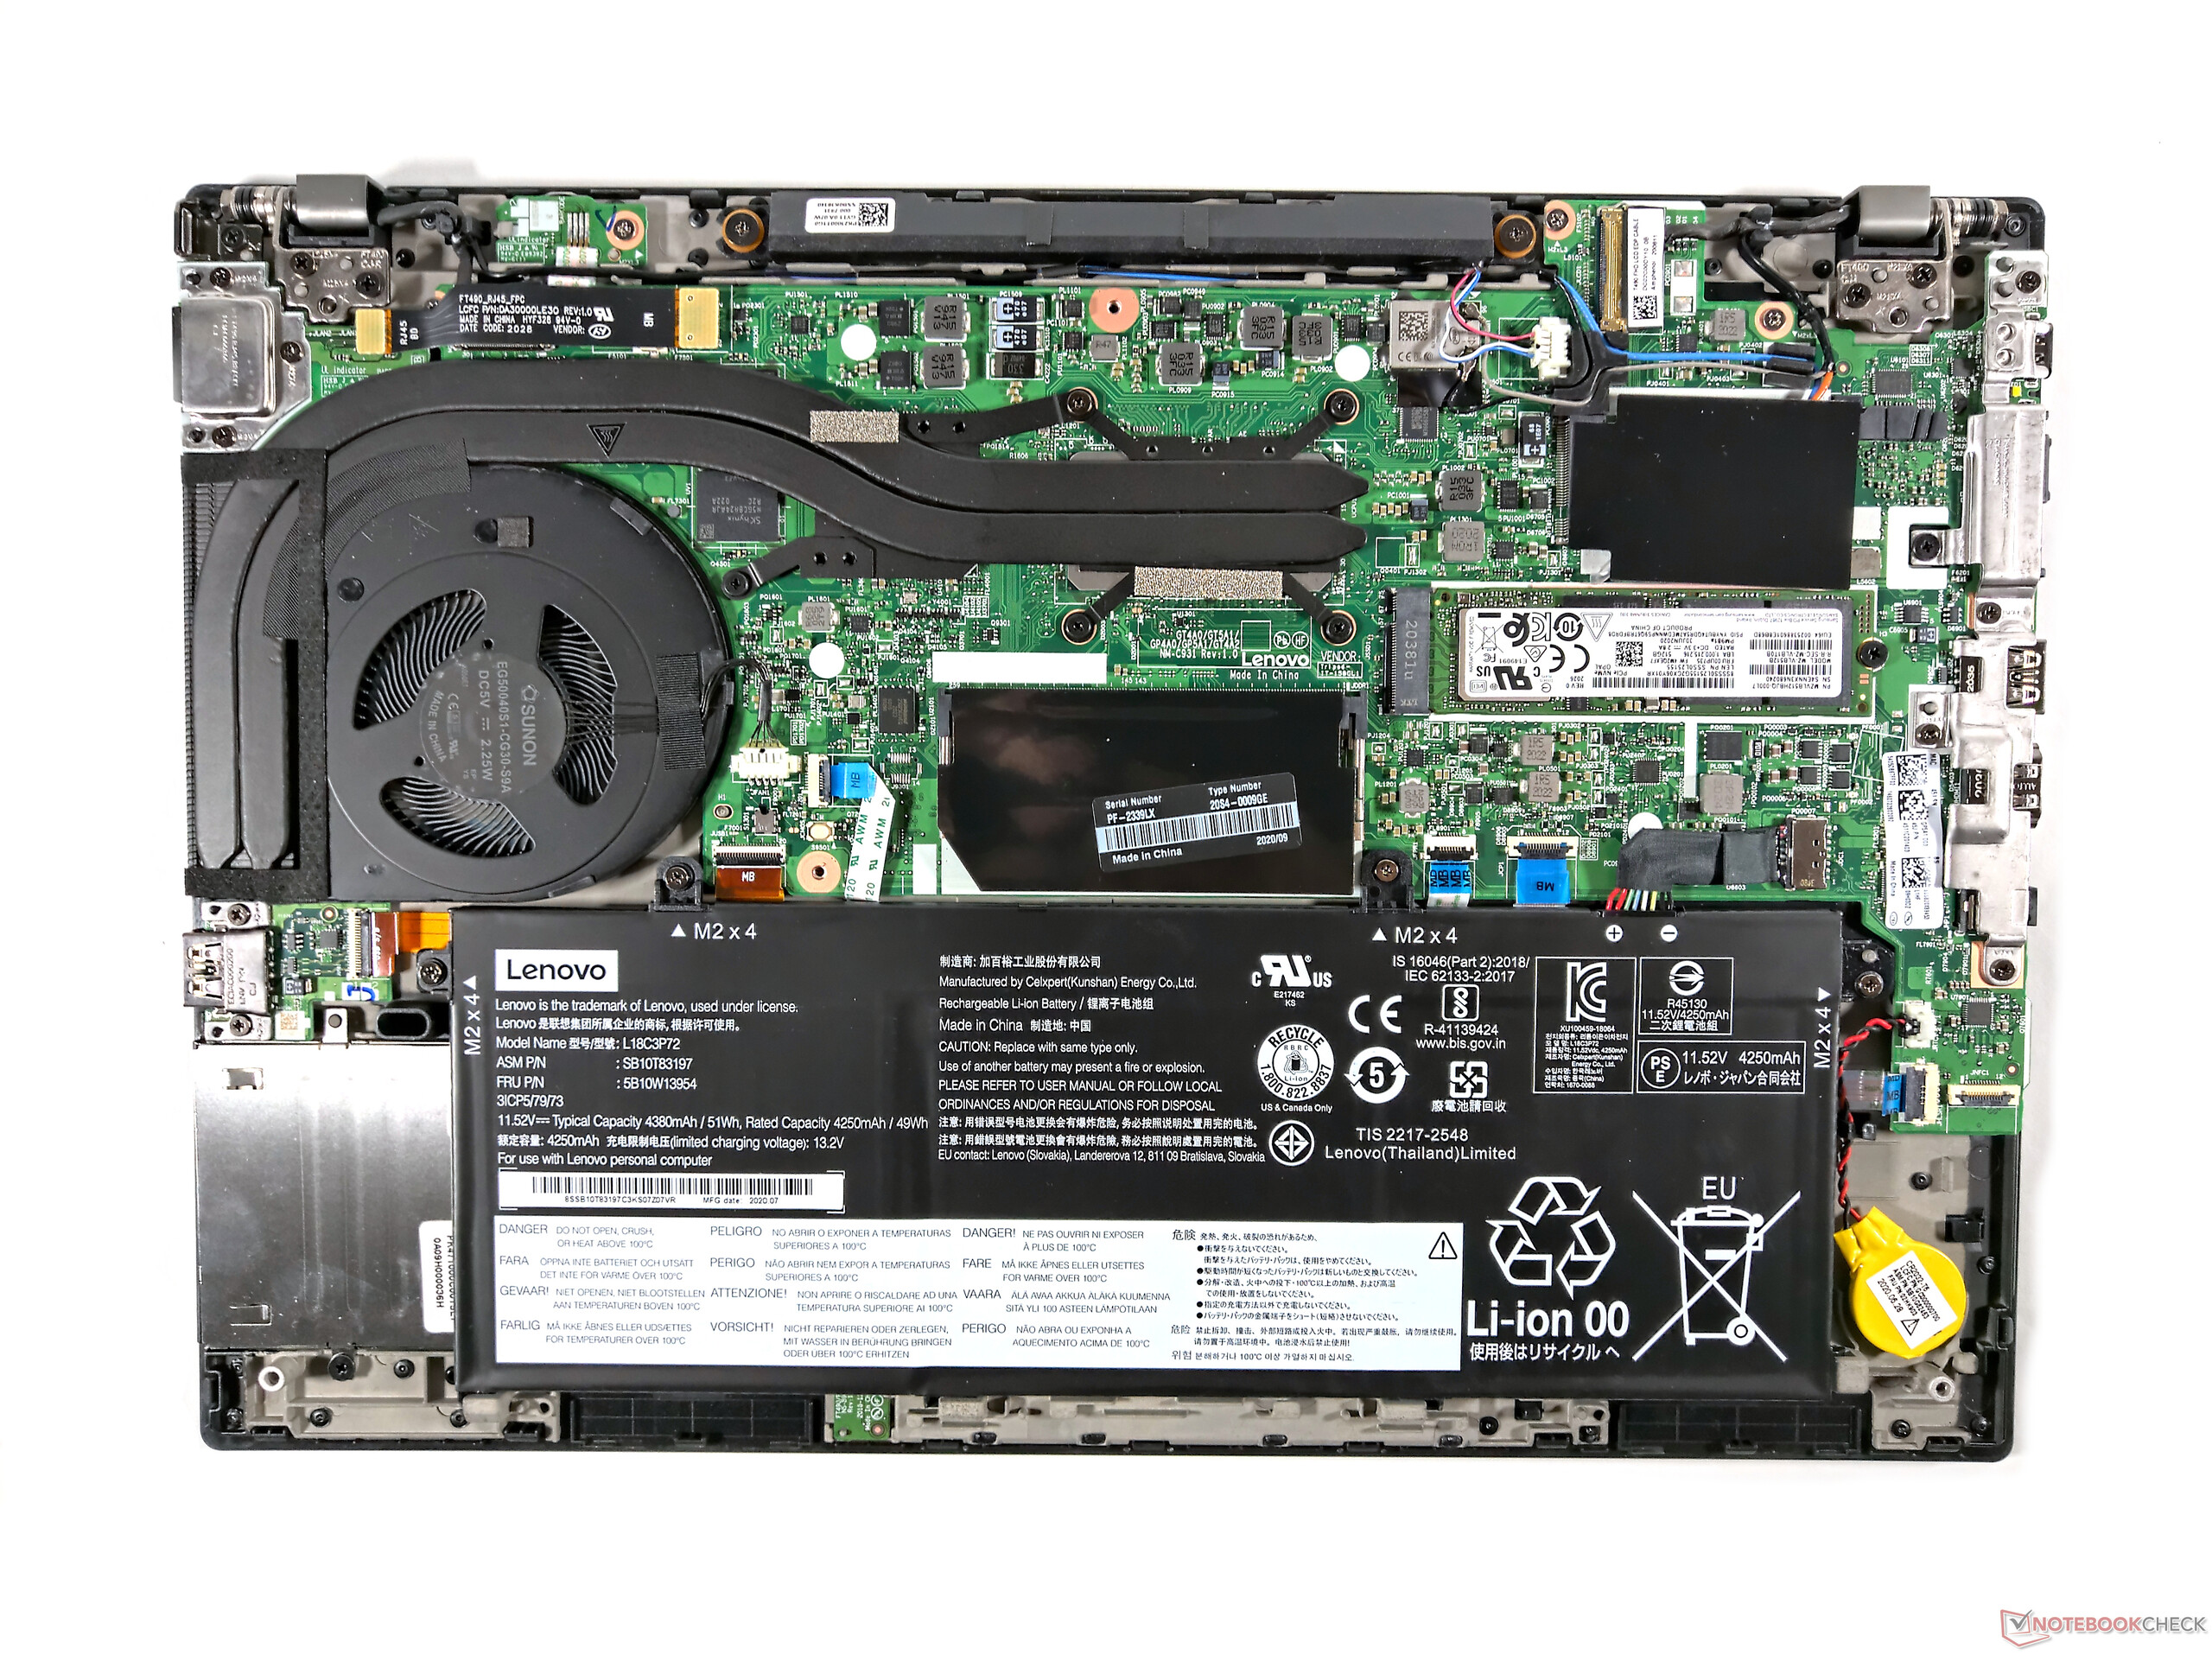
No papel, o Lenovo ThinkPad P14s oferece toda a gama de CPUs Comet Lake U. Na realidade, porém, apenas os modelos Intel Core i5-10210U, i5-10310U, i7-10510U e i7-10610U estão disponíveis - os modelos hexa-core i7-10710U e i7-10810U não são encontrados. O Nvidia Quadro P520 está instalado em todas estas variantes. Apenas um modelo dos P14s não possui a GPU Nvidia: A nova variante AMD, que utiliza exclusivamente o AMD Ryzen 7 Pro 4750U.
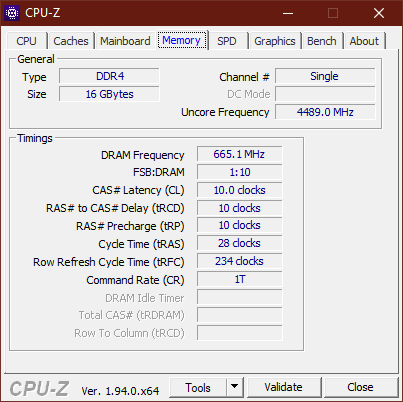
A RAM tem 8 ou 16 GB de RAM soldada DDR4-2666 mais um slot DIMM que pode acomodar módulos de 32 GB. Assim, é possível um máximo de 48 GB. Um SSD M.2-2242 ou M.2-2280 está disponível como armazenamento em massa
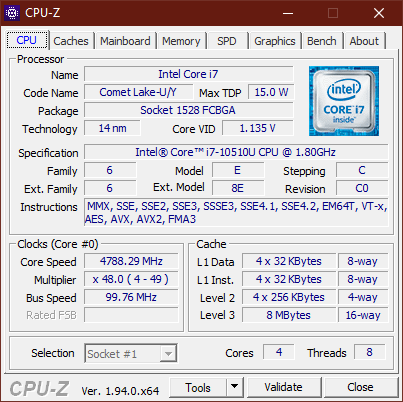
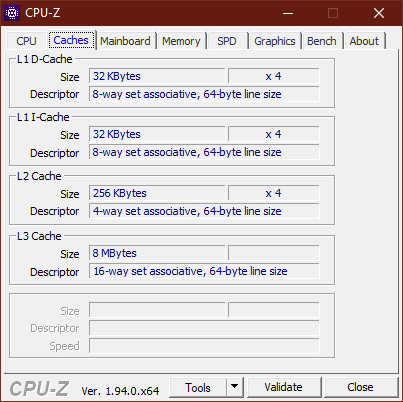
Processador
O Intel Core i7-10510U é um processador quad-core da série "Comet-Lake". Os quatro núcleos "Skylake", que foram fabricados no processo de 14 nanômetros, trabalham com um máximo de 4,8 GHz. O relógio base é de 1,8 GHz, e o processador tem um consumo típico de 15 watts. Ele pode ser comparado com outros chips através de nossa lista de referência de CPU.
No teste Cinebench multicore, o chip Intel pode consumir brevemente cerca de 35 watts antes que o consumo seja limitado a 25 watts. Para este processador, o Lenovo ThinkPad P14s pontua, portanto, ligeiramente acima da média, mas isso não ajuda em comparação com o ThinkPad T14 AMD. O processador AMD Ryzen 4000 com seus seis núcleos é simplesmente muito mais rápido no modo multicondutor. O ThinkPad P14s AMD deve ter um desempenho ainda melhor quando se trata do AMD Ryzen 7 Pro 4750U - que tem oito núcleos, afinal de contas.
Não notamos uma limitação da CPU no modo de bateria
Cinebench R15: CPU Multi 64Bit | CPU Single 64Bit
Blender: v2.79 BMW27 CPU
7-Zip 18.03: 7z b 4 -mmt1 | 7z b 4
Geekbench 5.5: Single-Core | Multi-Core
HWBOT x265 Benchmark v2.2: 4k Preset
LibreOffice : 20 Documents To PDF
R Benchmark 2.5: Overall mean
| Cinebench R20 / CPU (Multi Core) | |
| Média da turma Workstation (5471 - 15043, n=25, últimos 2 anos) | |
| Lenovo ThinkPad T14-20UES00H00 | |
| HP ZBook Firefly 14 G7 | |
| Lenovo ThinkPad P14s Gen1 20S40009GE | |
| Lenovo ThinkPad T14-20S1S06B00 | |
| Média Intel Core i7-10510U (1015 - 1897, n=38) | |
| Lenovo ThinkPad P43s-20RH001FGE | |
| Cinebench R20 / CPU (Single Core) | |
| Média da turma Workstation (671 - 857, n=25, últimos 2 anos) | |
| HP ZBook Firefly 14 G7 | |
| Lenovo ThinkPad P14s Gen1 20S40009GE | |
| Lenovo ThinkPad T14-20UES00H00 | |
| Média Intel Core i7-10510U (362 - 497, n=37) | |
| Lenovo ThinkPad T14-20S1S06B00 | |
| Lenovo ThinkPad P43s-20RH001FGE | |
| Cinebench R15 / CPU Multi 64Bit | |
| Média da turma Workstation (2489 - 5810, n=25, últimos 2 anos) | |
| Lenovo ThinkPad T14-20UES00H00 | |
| HP ZBook Firefly 14 G7 | |
| Lenovo ThinkPad T14-20S1S06B00 | |
| Lenovo ThinkPad P14s Gen1 20S40009GE | |
| Média Intel Core i7-10510U (482 - 856, n=45) | |
| Lenovo ThinkPad P43s-20RH001FGE | |
| Cinebench R15 / CPU Single 64Bit | |
| Média da turma Workstation (191.4 - 328, n=25, últimos 2 anos) | |
| HP ZBook Firefly 14 G7 | |
| Lenovo ThinkPad P14s Gen1 20S40009GE | |
| Média Intel Core i7-10510U (113 - 202, n=42) | |
| Lenovo ThinkPad T14-20UES00H00 | |
| Lenovo ThinkPad T14-20S1S06B00 | |
| Lenovo ThinkPad P43s-20RH001FGE | |
| Blender / v2.79 BMW27 CPU | |
| Lenovo ThinkPad T14-20S1S06B00 | |
| Média Intel Core i7-10510U (628 - 1051, n=31) | |
| Lenovo ThinkPad P43s-20RH001FGE | |
| Lenovo ThinkPad P14s Gen1 20S40009GE | |
| HP ZBook Firefly 14 G7 | |
| Lenovo ThinkPad T14-20UES00H00 | |
| Média da turma Workstation (91 - 261, n=25, últimos 2 anos) | |
| 7-Zip 18.03 / 7z b 4 -mmt1 | |
| Média da turma Workstation (5126 - 6960, n=25, últimos 2 anos) | |
| HP ZBook Firefly 14 G7 | |
| Lenovo ThinkPad P14s Gen1 20S40009GE | |
| Lenovo ThinkPad P43s-20RH001FGE | |
| Média Intel Core i7-10510U (3747 - 4981, n=31) | |
| Lenovo ThinkPad T14-20UES00H00 | |
| Lenovo ThinkPad T14-20S1S06B00 | |
| 7-Zip 18.03 / 7z b 4 | |
| Média da turma Workstation (54741 - 116969, n=25, últimos 2 anos) | |
| Lenovo ThinkPad T14-20UES00H00 | |
| HP ZBook Firefly 14 G7 | |
| Lenovo ThinkPad P14s Gen1 20S40009GE | |
| Lenovo ThinkPad P43s-20RH001FGE | |
| Média Intel Core i7-10510U (12196 - 21298, n=31) | |
| Lenovo ThinkPad T14-20S1S06B00 | |
| Geekbench 5.5 / Single-Core | |
| Média da turma Workstation (1781 - 2183, n=25, últimos 2 anos) | |
| HP ZBook Firefly 14 G7 | |
| Lenovo ThinkPad P14s Gen1 20S40009GE | |
| Média Intel Core i7-10510U (977 - 1287, n=31) | |
| Lenovo ThinkPad T14-20UES00H00 | |
| Lenovo ThinkPad T14-20S1S06B00 | |
| Geekbench 5.5 / Multi-Core | |
| Média da turma Workstation (11542 - 25554, n=25, últimos 2 anos) | |
| Lenovo ThinkPad T14-20UES00H00 | |
| HP ZBook Firefly 14 G7 | |
| Lenovo ThinkPad P14s Gen1 20S40009GE | |
| Média Intel Core i7-10510U (2474 - 4484, n=31) | |
| Lenovo ThinkPad T14-20S1S06B00 | |
| HWBOT x265 Benchmark v2.2 / 4k Preset | |
| Média da turma Workstation (14.4 - 40.5, n=25, últimos 2 anos) | |
| Lenovo ThinkPad T14-20UES00H00 | |
| HP ZBook Firefly 14 G7 | |
| Lenovo ThinkPad P14s Gen1 20S40009GE | |
| Lenovo ThinkPad P43s-20RH001FGE | |
| Média Intel Core i7-10510U (3.41 - 6.04, n=31) | |
| Lenovo ThinkPad T14-20S1S06B00 | |
| LibreOffice / 20 Documents To PDF | |
| HP ZBook Firefly 14 G7 | |
| Lenovo ThinkPad T14-20UES00H00 | |
| Média Intel Core i7-10510U (50.7 - 77.8, n=27) | |
| Lenovo ThinkPad T14-20S1S06B00 | |
| Lenovo ThinkPad P14s Gen1 20S40009GE | |
| Média da turma Workstation (37.1 - 74.7, n=25, últimos 2 anos) | |
| R Benchmark 2.5 / Overall mean | |
| Lenovo ThinkPad T14-20S1S06B00 | |
| Média Intel Core i7-10510U (0.637 - 0.81, n=28) | |
| Lenovo ThinkPad P14s Gen1 20S40009GE | |
| Lenovo ThinkPad T14-20UES00H00 | |
| HP ZBook Firefly 14 G7 | |
| Média da turma Workstation (0.3825 - 0.603, n=25, últimos 2 anos) | |
* ... menor é melhor
Desempenho do sistema
Não há nada a reclamar em termos de desempenho do sistema e o Lenovo ThinkPad P14s também pontua muito bem nos pontos de referência
| PCMark 8 Home Score Accelerated v2 | 3805 pontos | |
| PCMark 8 Work Score Accelerated v2 | 5356 pontos | |
| PCMark 10 Score | 4171 pontos | |
Ajuda | ||
Latências DPC
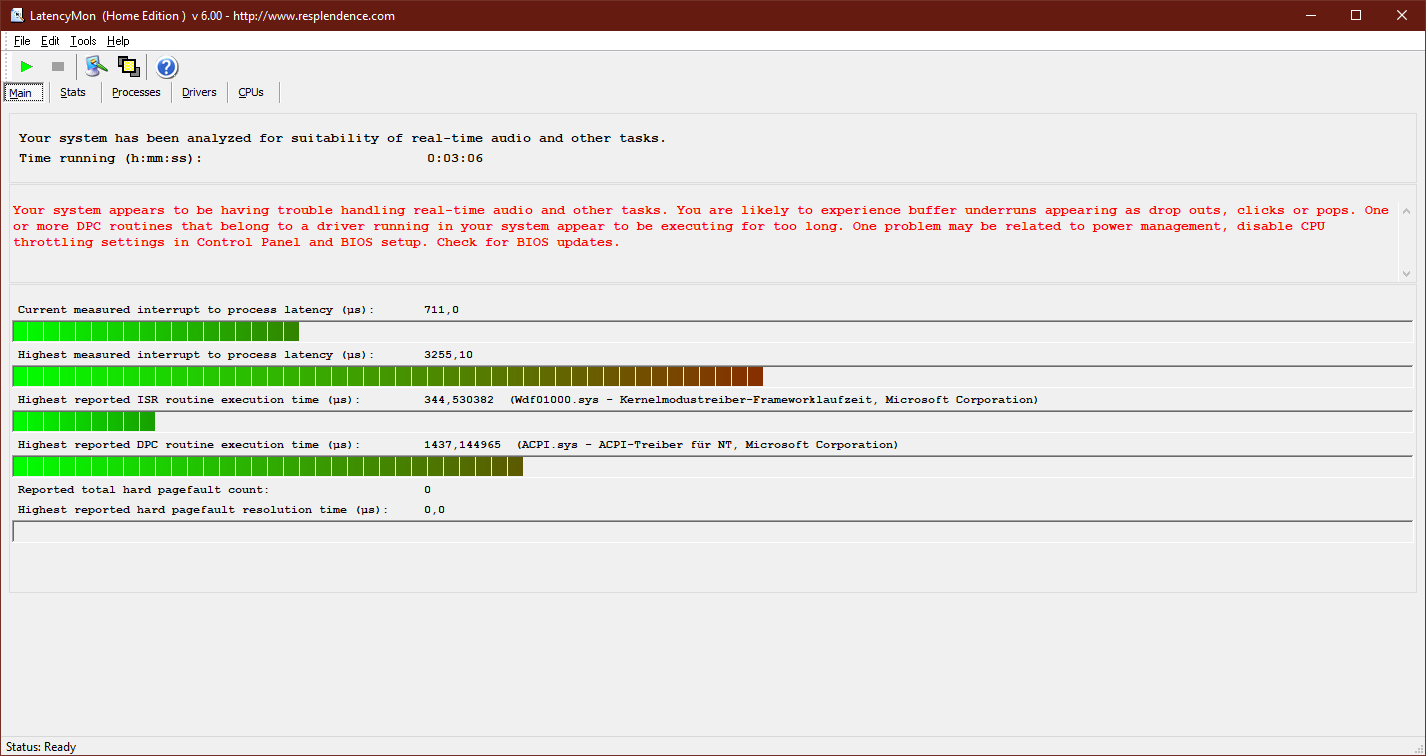
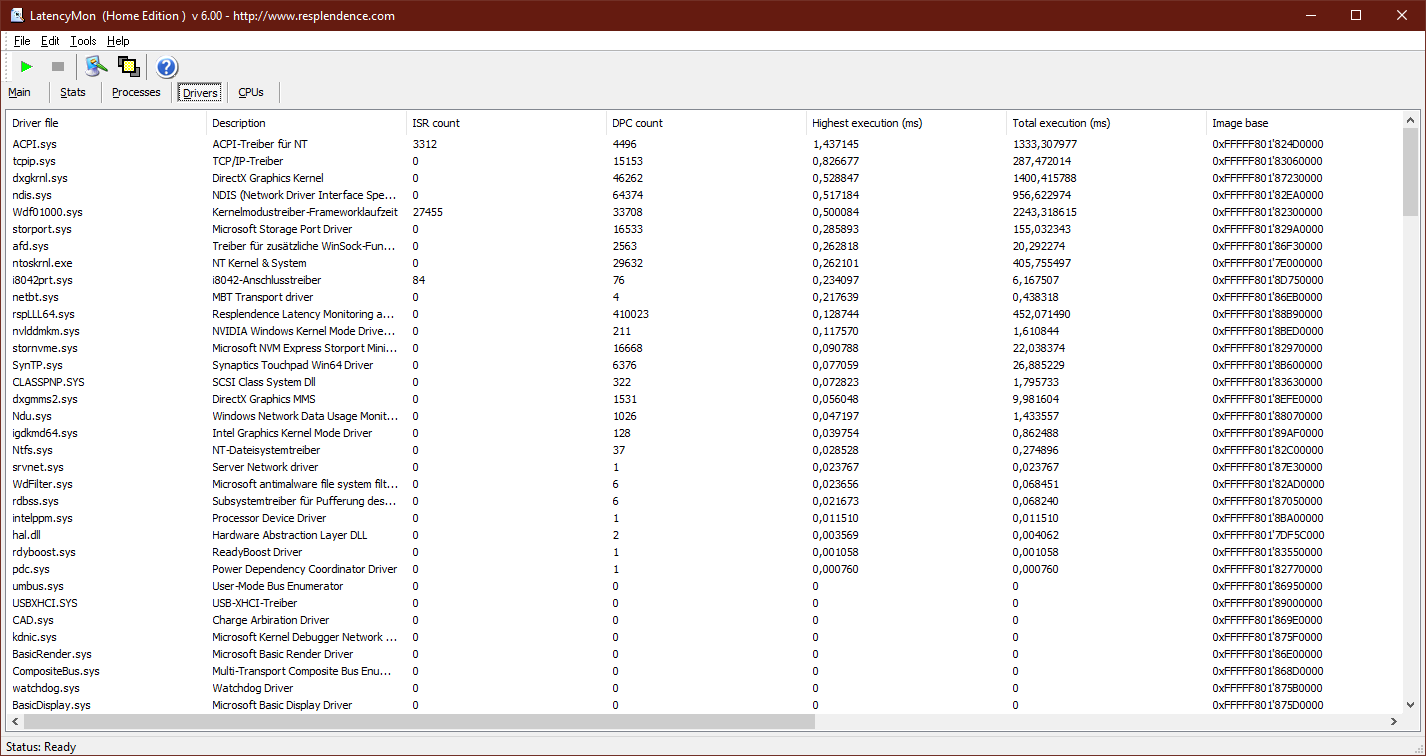
| DPC Latencies / LatencyMon - interrupt to process latency (max), Web, Youtube, Prime95 | |
| Lenovo ThinkPad P14s Gen1 20S40009GE | |
* ... menor é melhor
Armazenamento em massa
O SSD da Samsung no ThinkPad P14s da Lenovo tem uma capacidade de 512 GB. O PCIe-NVMe-SSD no formato M.2-2280 é muito rápido e supera todos os SSDs de outros fabricantes na comparação
| Lenovo ThinkPad P14s Gen1 20S40009GE Samsung SSD PM981a MZVLB512HBJQ | Lenovo ThinkPad T14-20S1S06B00 Lite-On CA5-8D512 | Lenovo ThinkPad T14-20UES00H00 Samsung SSD PM981a MZVLB512HBJQ | Lenovo ThinkPad P43s-20RH001FGE WDC PC SN720 SDAQNTW-256G | Média Samsung SSD PM981a MZVLB512HBJQ | |
|---|---|---|---|---|---|
| CrystalDiskMark 5.2 / 6 | -12% | -11% | -21% | -0% | |
| Write 4K (MB/s) | 145 | 114.1 -21% | 88.1 -39% | 135.3 -7% | 140.8 ? -3% |
| Read 4K (MB/s) | 48.11 | 53.6 11% | 38.28 -20% | 45.09 -6% | 48.6 ? 1% |
| Write Seq (MB/s) | 2138 | 1743 -18% | 2002 -6% | 1576 -26% | 2106 ? -1% |
| Read Seq (MB/s) | 2258 | 2092 -7% | 2153 -5% | 1457 -35% | 2099 ? -7% |
| Write 4K Q32T1 (MB/s) | 467.8 | 394.8 -16% | 423.7 -9% | 356.3 -24% | 451 ? -4% |
| Read 4K Q32T1 (MB/s) | 421.4 | 372.6 -12% | 393.2 -7% | 385.4 -9% | 482 ? 14% |
| Write Seq Q32T1 (MB/s) | 2988 | 2176 -27% | 2889 -3% | 1613 -46% | 2903 ? -3% |
| Read Seq Q32T1 (MB/s) | 3446 | 3204 -7% | 3566 3% | 3017 -12% | 3511 ? 2% |

Dauerleistung Lesen: DiskSpd Read Loop, Queue Depth 8 Continuous reading: DiskSpd Read Loop, Queue Depth 8
Placa gráfica
A Nvidia Quadro P520 é uma GPU de nível básico da geração "Pascal", agora duplamente desatualizada. Com esta GPU, o Lenovo ThinkPad P14s pode ser claramente classificado como um modelo de nível básico. Isto também é apoiado pelos benchmarks: No benchmark SPECviewperf 13 da estação de trabalho, o laptop Lenovo é menos da metade da velocidade média da estação de trabalho.
No modo de bateria, poderíamos determinar uma redução significativa no desempenho da GPU. No teste 3DMark 11 GPU, o desempenho foi cerca de 54% menor (1978 pontos)
| 3DMark 11 Performance | 4490 pontos | |
| 3DMark Fire Strike Score | 2902 pontos | |
| 3DMark Time Spy Score | 1149 pontos | |
Ajuda | ||
Desempenho do jogo
O Nvidia Quadro P520 não é projetado para jogos. Portanto, ele só pode renderizar jogos modernos em níveis baixos de detalhes
| baixo | média | alto | ultra | |
|---|---|---|---|---|
| The Witcher 3 (2015) | 42.7 | 22.1 | ||
| Dota 2 Reborn (2015) | 110 | 37.5 | 19.5 | 13.8 |
| X-Plane 11.11 (2018) | 17.9 | 13.8 | 13.2 | |
| Shadow of the Tomb Raider (2018) | 31.8 | 12.5 | ||
| Total War: Three Kingdoms (2019) | 69.6 | 14.7 |
Emissões: Problema de calor também no ThinkPad P14s da Lenovo
Emissões sonoras
O ventilador é audível sob carga, mas não extremamente barulhento. No modo inativo, o sistema de resfriamento permanece silencioso, mas às vezes faz um ruído muito silencioso. Seria melhor neste ponto se ele permanecesse completamente silencioso sem carga.
Não notamos nenhuma bobina rodopiando neste caderno da Lenovo
Barulho
| Ocioso |
| 29.7 / 29.7 / 30.6 dB |
| Carga |
| 33.1 / 35 dB |
 | ||
30 dB silencioso 40 dB(A) audível 50 dB(A) ruidosamente alto |
||
min: | ||
Temperatura
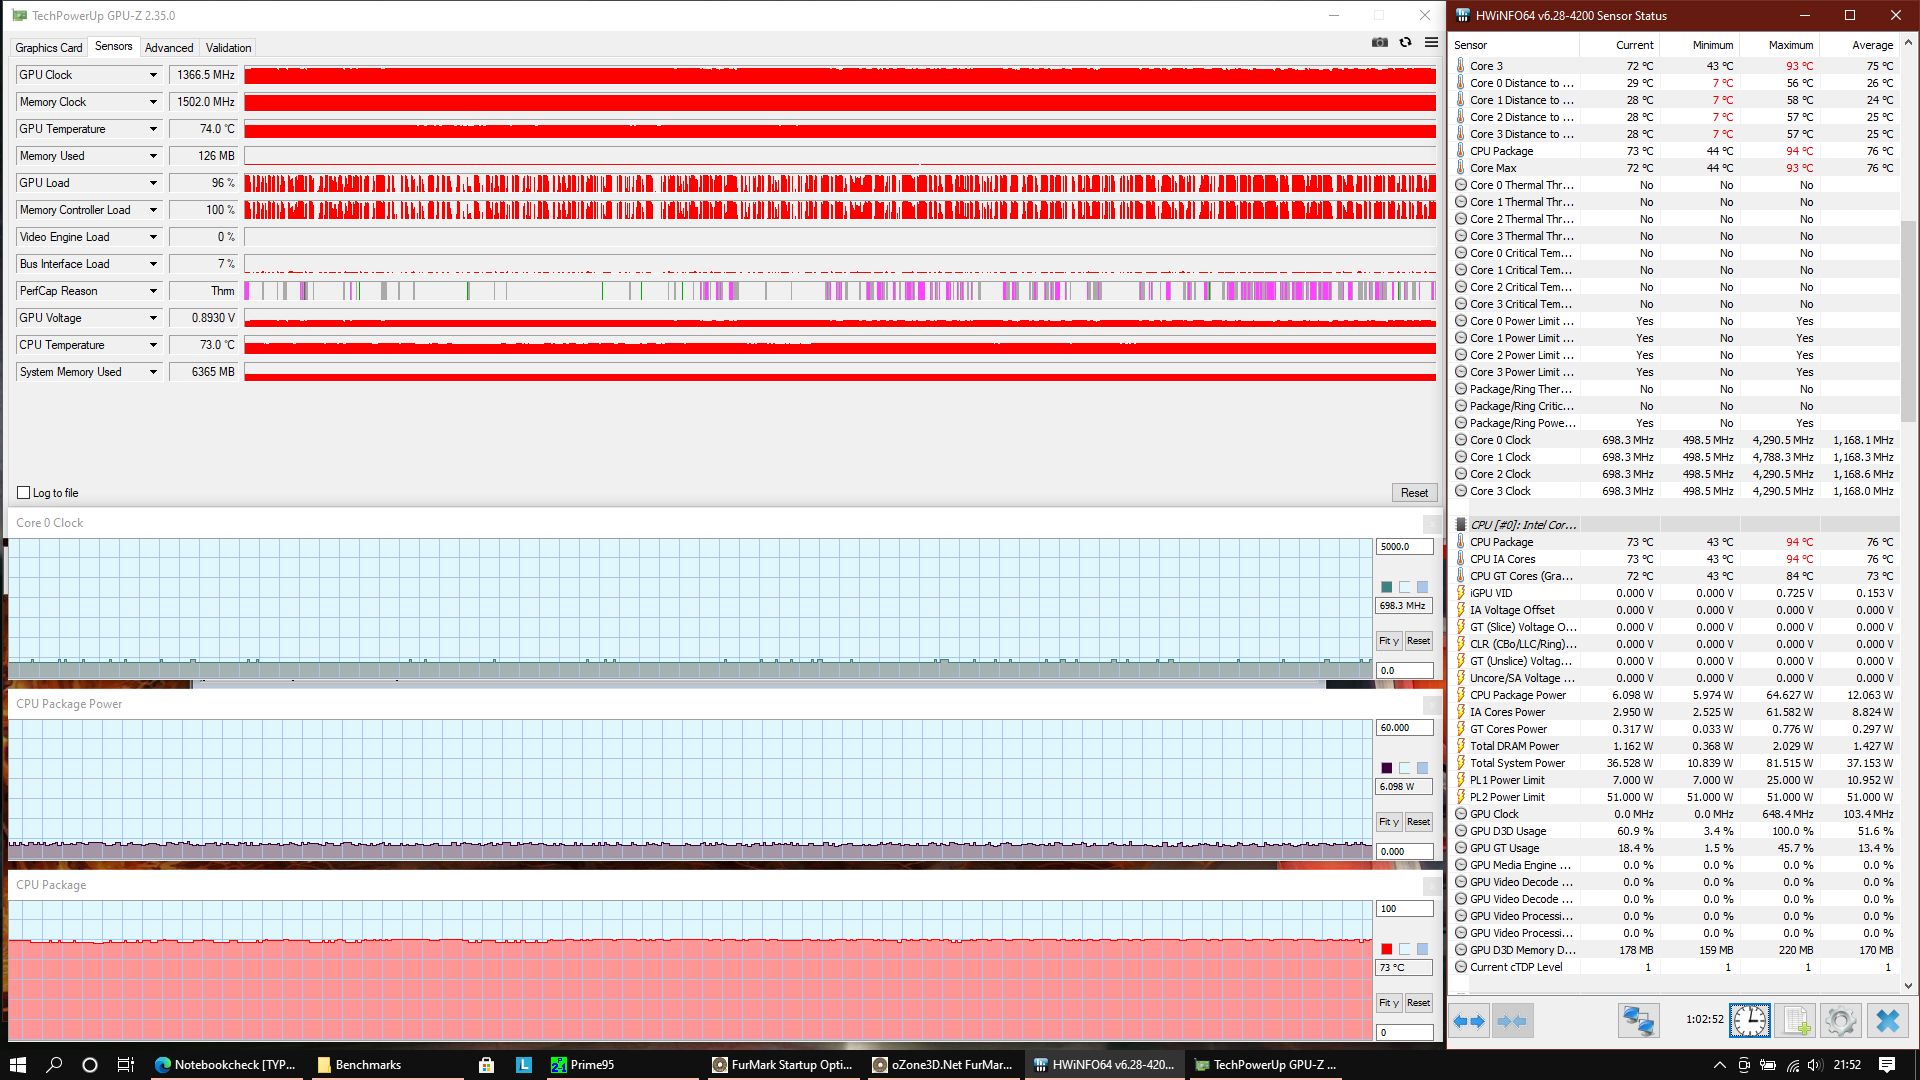
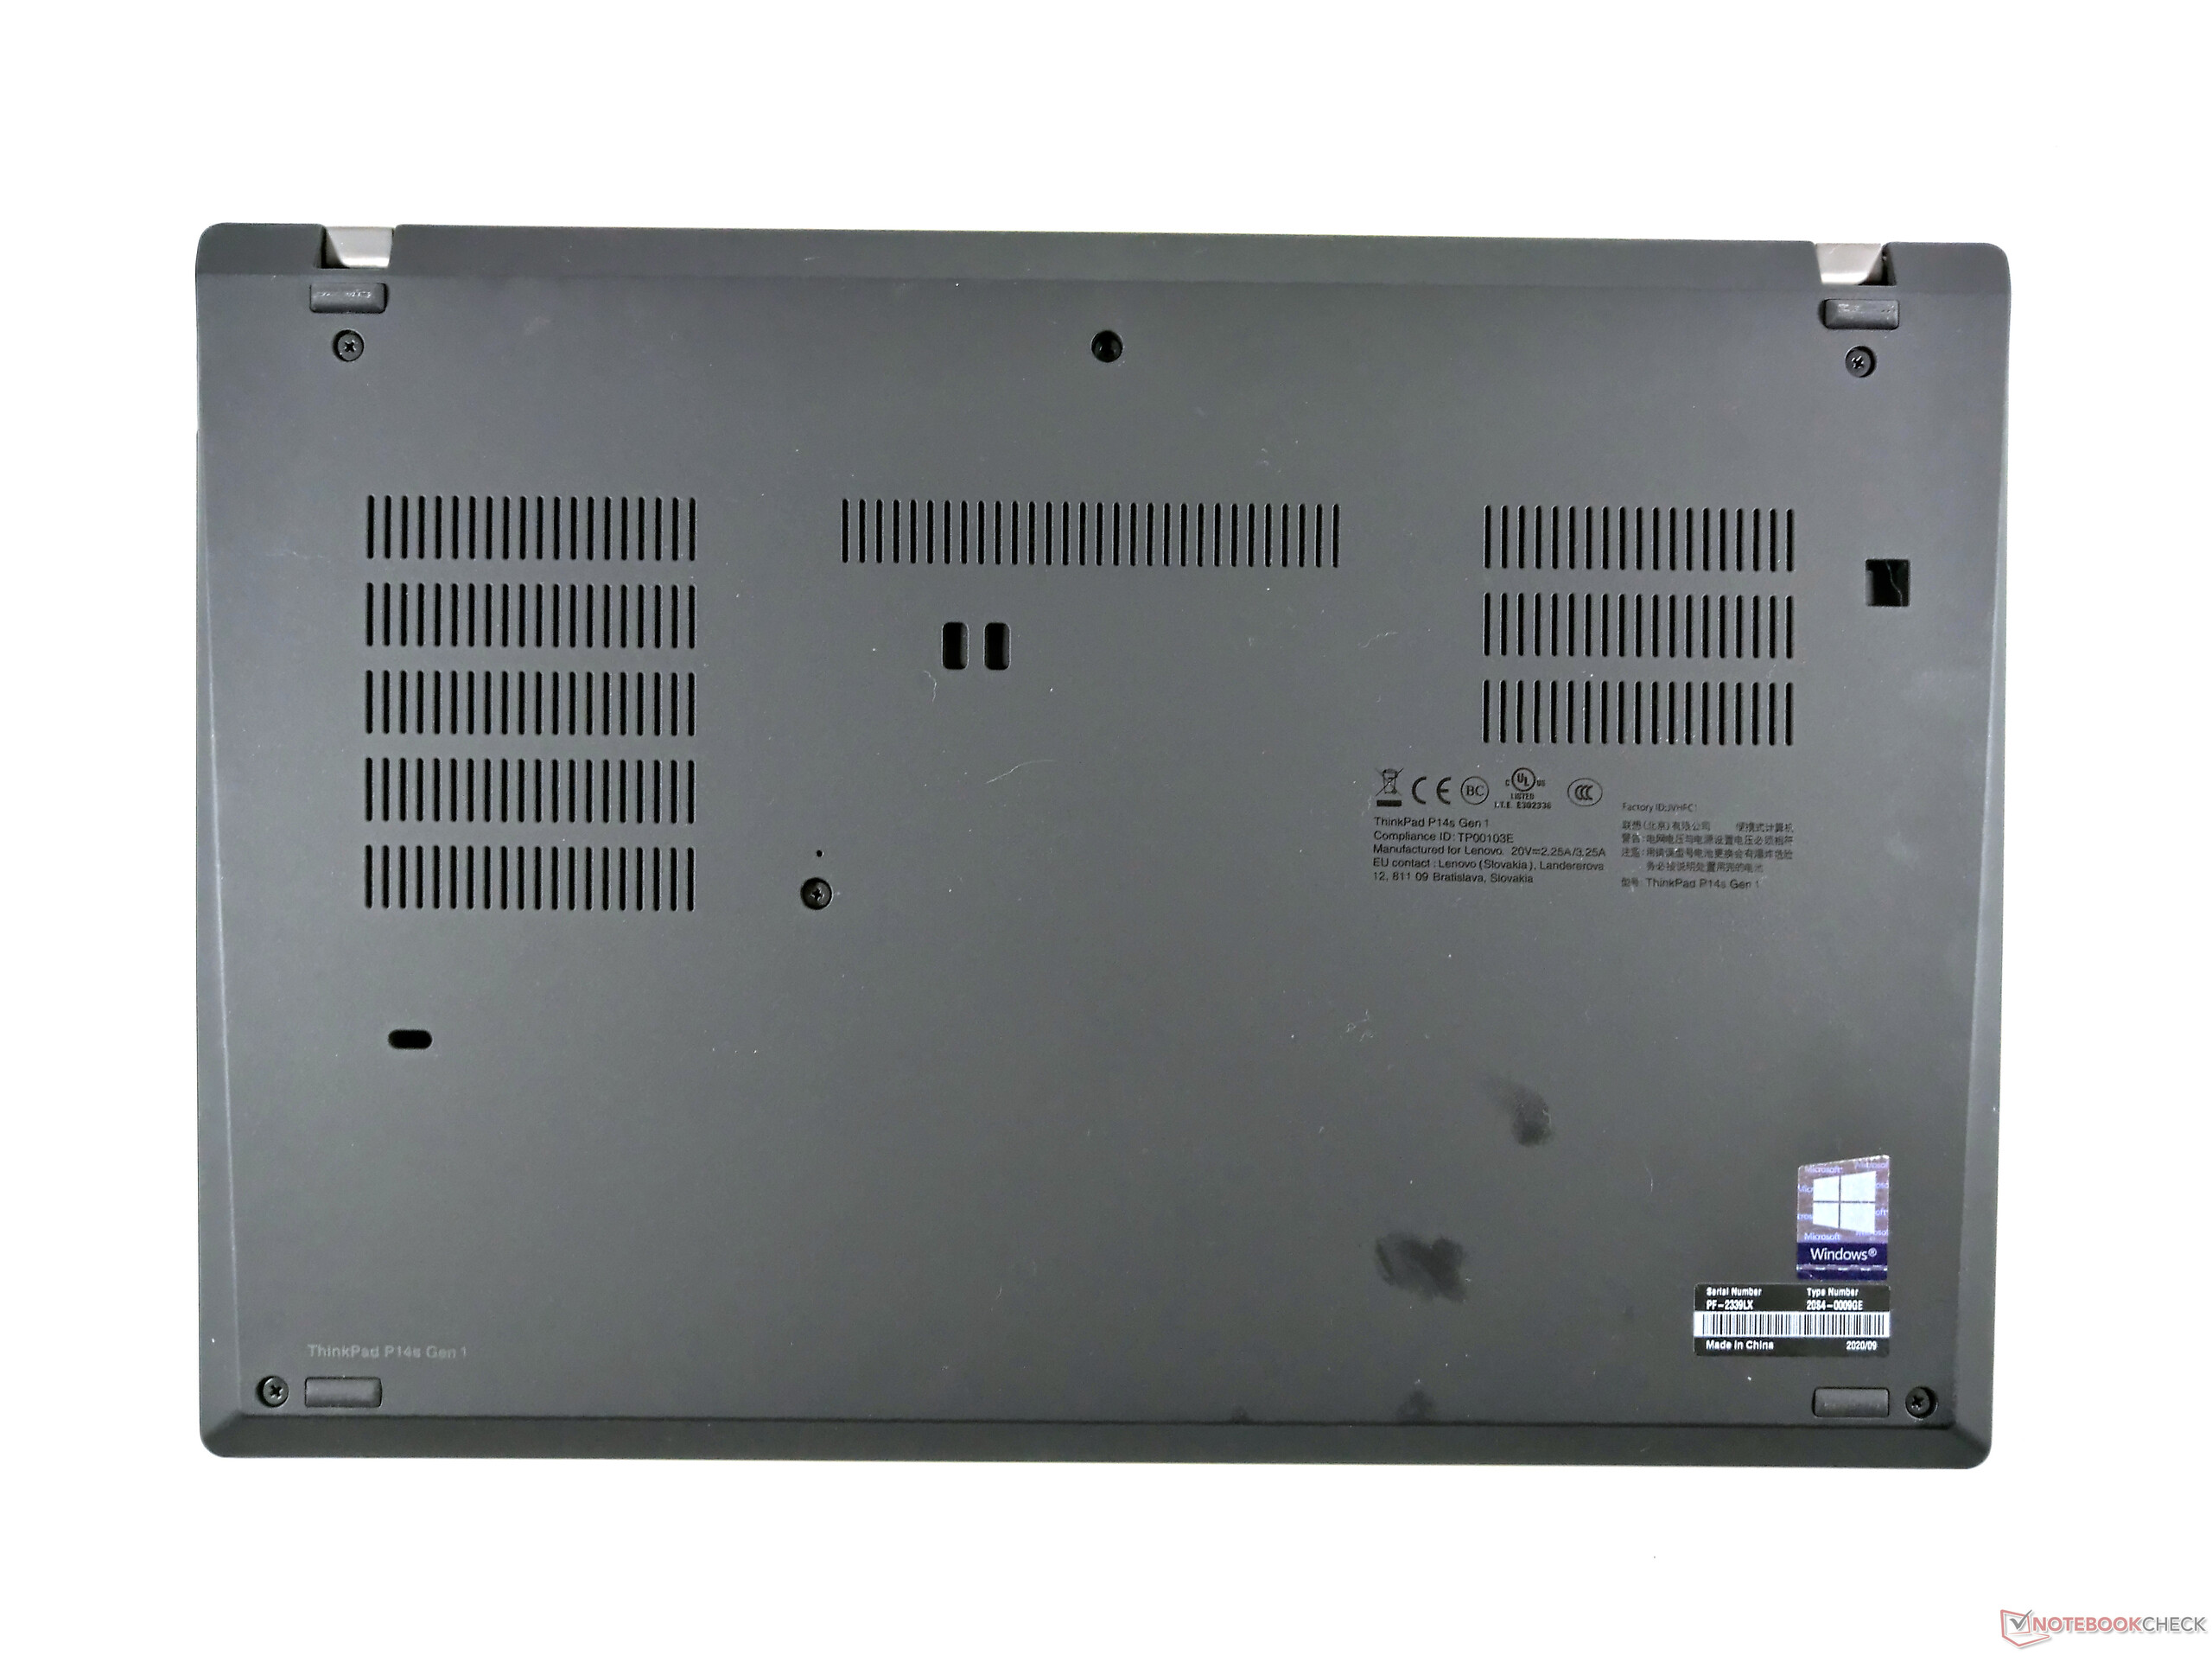
Você pode se assustar ao olhar as leituras de temperatura: Em dois pontos de medição no fundo, 60 °C (140 °F)são claramente excedidos. Isto deixa claro que o ventilador único simplesmente não pode dissipar o calor adequadamente.
O teste de estresse confirma isto. CPU ou GPU, um deles sempre tem que funcionar acionado. No início do teste, é primeiro a GPU que tem que fazer um relógio para baixo. Depois de um tempo, o processador estrangula até 6 watts e 700 MHz. Isto permite que a GPU funcione relativamente estável, mas ainda há pequenas quedas na performance da GPU.
O 3DMark após o teste de estresse mostra isso claramente: Você sempre tem que esperar estrangulamento no ThinkPad P14s da Lenovo. A pontuação de física pesada da CPU, em particular, é significativamente menor em 3594 em vez de 8283 pontos, uma redução de cerca de 56%
(-) A temperatura máxima no lado superior é 59.5 °C / 139 F, em comparação com a média de 38.2 °C / 101 F , variando de 22.2 a 69.8 °C para a classe Workstation.
(-) A parte inferior aquece até um máximo de 68.8 °C / 156 F, em comparação com a média de 41.1 °C / 106 F
(+) Em uso inativo, a temperatura média para o lado superior é 23.5 °C / 74 F, em comparação com a média do dispositivo de 32 °C / ### class_avg_f### F.
(±) Os apoios para as mãos e o touchpad podem ficar muito quentes ao toque, com um máximo de 36.3 °C / 97.3 F.
(-) A temperatura média da área do apoio para as mãos de dispositivos semelhantes foi 27.8 °C / 82 F (-8.5 °C / -15.3 F).
Orador
Os alto-falantes do ThinkPad P14s acima do teclado irradiam para cima e emitem um som medianamente bom para alto-falantes de laptop. Um melhor resultado pode ser alcançado com a tomada de fones de ouvido que funciona perfeitamente
Lenovo ThinkPad P14s Gen1 20S40009GE análise de áudio
(±) | o volume do alto-falante é médio, mas bom (###valor### dB)
Graves 100 - 315Hz
(-) | quase nenhum baixo - em média 19.7% menor que a mediana
(±) | a linearidade dos graves é média (9.4% delta para a frequência anterior)
Médios 400 - 2.000 Hz
(±) | médios mais altos - em média 6.3% maior que a mediana
(±) | a linearidade dos médios é média (8.5% delta para frequência anterior)
Altos 2 - 16 kHz
(+) | agudos equilibrados - apenas 2.7% longe da mediana
(+) | os máximos são lineares (5.6% delta da frequência anterior)
Geral 100 - 16.000 Hz
(±) | a linearidade do som geral é média (25.8% diferença em relação à mediana)
Comparado com a mesma classe
» 87% de todos os dispositivos testados nesta classe foram melhores, 6% semelhantes, 7% piores
» O melhor teve um delta de 7%, a média foi 17%, o pior foi 35%
Comparado com todos os dispositivos testados
» 79% de todos os dispositivos testados foram melhores, 4% semelhantes, 17% piores
» O melhor teve um delta de 4%, a média foi 24%, o pior foi 134%
HP ZBook Firefly 14 G7 análise de áudio
(±) | o volume do alto-falante é médio, mas bom (###valor### dB)
Graves 100 - 315Hz
(±) | graves reduzidos - em média 13.3% menor que a mediana
(±) | a linearidade dos graves é média (13.1% delta para a frequência anterior)
Médios 400 - 2.000 Hz
(+) | médios equilibrados - apenas 2% longe da mediana
(+) | médios são lineares (2.6% delta para frequência anterior)
Altos 2 - 16 kHz
(+) | agudos equilibrados - apenas 3.8% longe da mediana
(±) | a linearidade dos máximos é média (7.4% delta para frequência anterior)
Geral 100 - 16.000 Hz
(±) | a linearidade do som geral é média (17.9% diferença em relação à mediana)
Comparado com a mesma classe
» 56% de todos os dispositivos testados nesta classe foram melhores, 11% semelhantes, 33% piores
» O melhor teve um delta de 7%, a média foi 17%, o pior foi 35%
Comparado com todos os dispositivos testados
» 37% de todos os dispositivos testados foram melhores, 8% semelhantes, 55% piores
» O melhor teve um delta de 4%, a média foi 24%, o pior foi 134%
Gerenciamento de energia: O PC Lenovo proporciona uma boa vida útil da bateria
Absorção de energia
A Lenovo otimizou bem o consumo de energia. Isto também é demonstrado pela comparação com o ZBook Firefly 14 G7 da HP, que consome consideravelmente mais com componentes similares em modo inativo - embora a HP utilize uma tela de 1000 cd/m² aqui, o que pode aumentar o consumo de energia.
Para o consumo máximo médio de energia de 64 watts, a fonte de alimentação de 65 watts é projetada apenas o suficiente
| desligado | |
| Ocioso | |
| Carga |
|
Key:
min: | |
| Lenovo ThinkPad P14s Gen1 20S40009GE i7-10510U, Quadro P520, Samsung SSD PM981a MZVLB512HBJQ, LTPS IPS LED, 1920x1080, 14" | HP ZBook Firefly 14 G7 i7-10610U, Quadro P520, Toshiba XG6 KXG60ZNV512G, IPS, 1920x1080, 14" | Lenovo ThinkPad T14-20S1S06B00 i5-10210U, UHD Graphics 620, Lite-On CA5-8D512, LTPS IPS LED, 1920x1080, 14" | Lenovo ThinkPad T14-20UES00H00 R5 PRO 4650U, Vega 6, Samsung SSD PM981a MZVLB512HBJQ, IPS, 1920x1080, 14" | Lenovo ThinkPad P43s-20RH001FGE i7-8565U, Quadro P520, WDC PC SN720 SDAQNTW-256G, IPS, 1920x1080, 14" | Média NVIDIA Quadro P520 | Média da turma Workstation | |
|---|---|---|---|---|---|---|---|
| Power Consumption | -25% | -4% | -21% | 4% | -13% | -135% | |
| Idle Minimum * (Watt) | 2.92 | 3.3 -13% | 3.2 -10% | 5.8 -99% | 2.9 1% | 3.14 ? -8% | 8.94 ? -206% |
| Idle Average * (Watt) | 5.64 | 9.3 -65% | 6.1 -8% | 8.3 -47% | 4.94 12% | 7.3 ? -29% | 13.8 ? -145% |
| Idle Maximum * (Watt) | 8 | 12.1 -51% | 10.4 -30% | 11 -38% | 7.92 1% | 10.4 ? -30% | 17.5 ? -119% |
| Load Average * (Watt) | 64 | 59.4 7% | 45.6 29% | 39.5 38% | 60.8 5% | 60.7 ? 5% | 95 ? -48% |
| Load Maximum * (Watt) | 68.4 | 69.4 -1% | 68.6 -0% | 40.8 40% | 68.2 -0% | 68.9 ? -1% | 175.2 ? -156% |
| Witcher 3 ultra * (Watt) | 52.7 |
* ... menor é melhor
Duração da bateria
A Lenovo obtém muito das 50 horas de watt integradas. No teste Wi-Fi com um brilho de 150 cd/m², o Lenovo ThinkPad P14s alcança mais de dez horas. Continua com mais de oito horas de brilho máximo - uma taxa respeitável e boa.
| Lenovo ThinkPad P14s Gen1 20S40009GE i7-10510U, Quadro P520, 50 Wh | HP ZBook Firefly 14 G7 i7-10610U, Quadro P520, 53 Wh | Lenovo ThinkPad T14-20S1S06B00 i5-10210U, UHD Graphics 620, 50 Wh | Lenovo ThinkPad T14-20UES00H00 R5 PRO 4650U, Vega 6, 50 Wh | Lenovo ThinkPad P43s-20RH001FGE i7-8565U, Quadro P520, 51 Wh | Média da turma Workstation | |
|---|---|---|---|---|---|---|
| Duração da bateria | 0% | -7% | -14% | 11% | -15% | |
| H.264 (h) | 12.4 | 12.5 1% | 10.4 -16% | 11.6 -6% | 12.7 2% | 9.51 ? -23% |
| WiFi v1.3 (h) | 10.1 | 10.1 0% | 11 9% | 8.4 -17% | 8.5 -16% | 8.53 ? -16% |
| Load (h) | 1.5 | 1.5 0% | 1.3 -13% | 1.2 -20% | 2.2 47% | 1.429 ? -5% |
Pro
Contra
Conclusão: Um ThinkPad T14 com um nome diferente

Como uma variante praticamente idêntica do ThinkPad T14, o Lenovo ThinkPad P14s Gen 1 compartilha tanto os pontos fortes quanto os fracos com ele. Você poderia simplesmente copiar-colar grandes partes da conclusão do modelo Intel aqui: No lado positivo, há aspectos como os grandes dispositivos de entrada, o display de alta qualidade e o rico equipamento. Por outro lado, temos que criticar a caixa difícil de abrir e a opção "ponte de energia" que falta em comparação com os ThinkPads mais antigos.
As altas temperaturas já eram um dos pontos fracos do portátil ThinkPad T14. Isto não melhorou no ThinkPad P14 da Lenovo, mas até piorou ligeiramente devido à GPU Nvidia. Em geral, o Nvidia Quadro P520 é a característica decisiva que diferencia os P14s de seu primo da série T. No entanto, a GPU de nível básico ultrapassada não pode realizar mais do que as tarefas CAD mais simples. O desempenho é simplesmente fraco demais para substituir uma estação de trabalho completa. Você também tem que contar com o estrangulamento, especialmente sob carga.
Basicamente, o Lenovo ThinkPad P14s Gen 1 é exatamente como o T14, apenas com uma GPU Quadro. Se você não precisa disto, está melhor com o ThinkPad T14.
O resultado final é que o Lenovo ThinkPad P14s, assim como o ThinkPad T14, pode valer a pena comprar. No entanto, ele tem que se adequar às suas necessidades - se você só quer comprar um ThinkPad de 14 polegadas e o CAD não desempenha um papel, você está melhor com o ThinkPad T14 AMD
.Preço e disponibilidade
O Lenovo ThinkPad P14s Gen 1 custa cerca de 1.500 Euros (~$1820) na configuração testada. Ele está disponível na Amazon e em outros revendedores da Lenovo, entre outros
Lenovo ThinkPad P14s Gen1 20S40009GE
- 12/28/2020 v7 (old)
Benjamin Herzig
Price comparison
