Lenovo ThinkPad P14s Gen 1 Laptop Review: AMD workstation sans dedicated GPU
Laptops de estação de trabalho e processadores AMD. Estas duas coisas parecem ser inimigas naturais. Os maiores fabricantes - Dell, Lenovo e HP - não oferecem suas estações de trabalho móveis com CPUs AMD Ryzen. No entanto, isto não é 100% verdade: A Lenovo lançou um laptop AMD no final de 2020, que é comercializado como uma estação de trabalho: O Lenovo ThinkPad P14s Gen 1 está sendo oferecido com a AMD Ryzen Pro 4000 desde então.
Certamente, porém, não se trata de uma estação de trabalho tradicional: Como sua contraparte Intel, o ThinkPad P14s usa U CPUs menos potentes. É uma estação de trabalho ultrabook leve e compacta, que contém 32 GB de RAM, um SSD de 1 TB e uma tela ePrivacy especial em nossa amostra de teste.
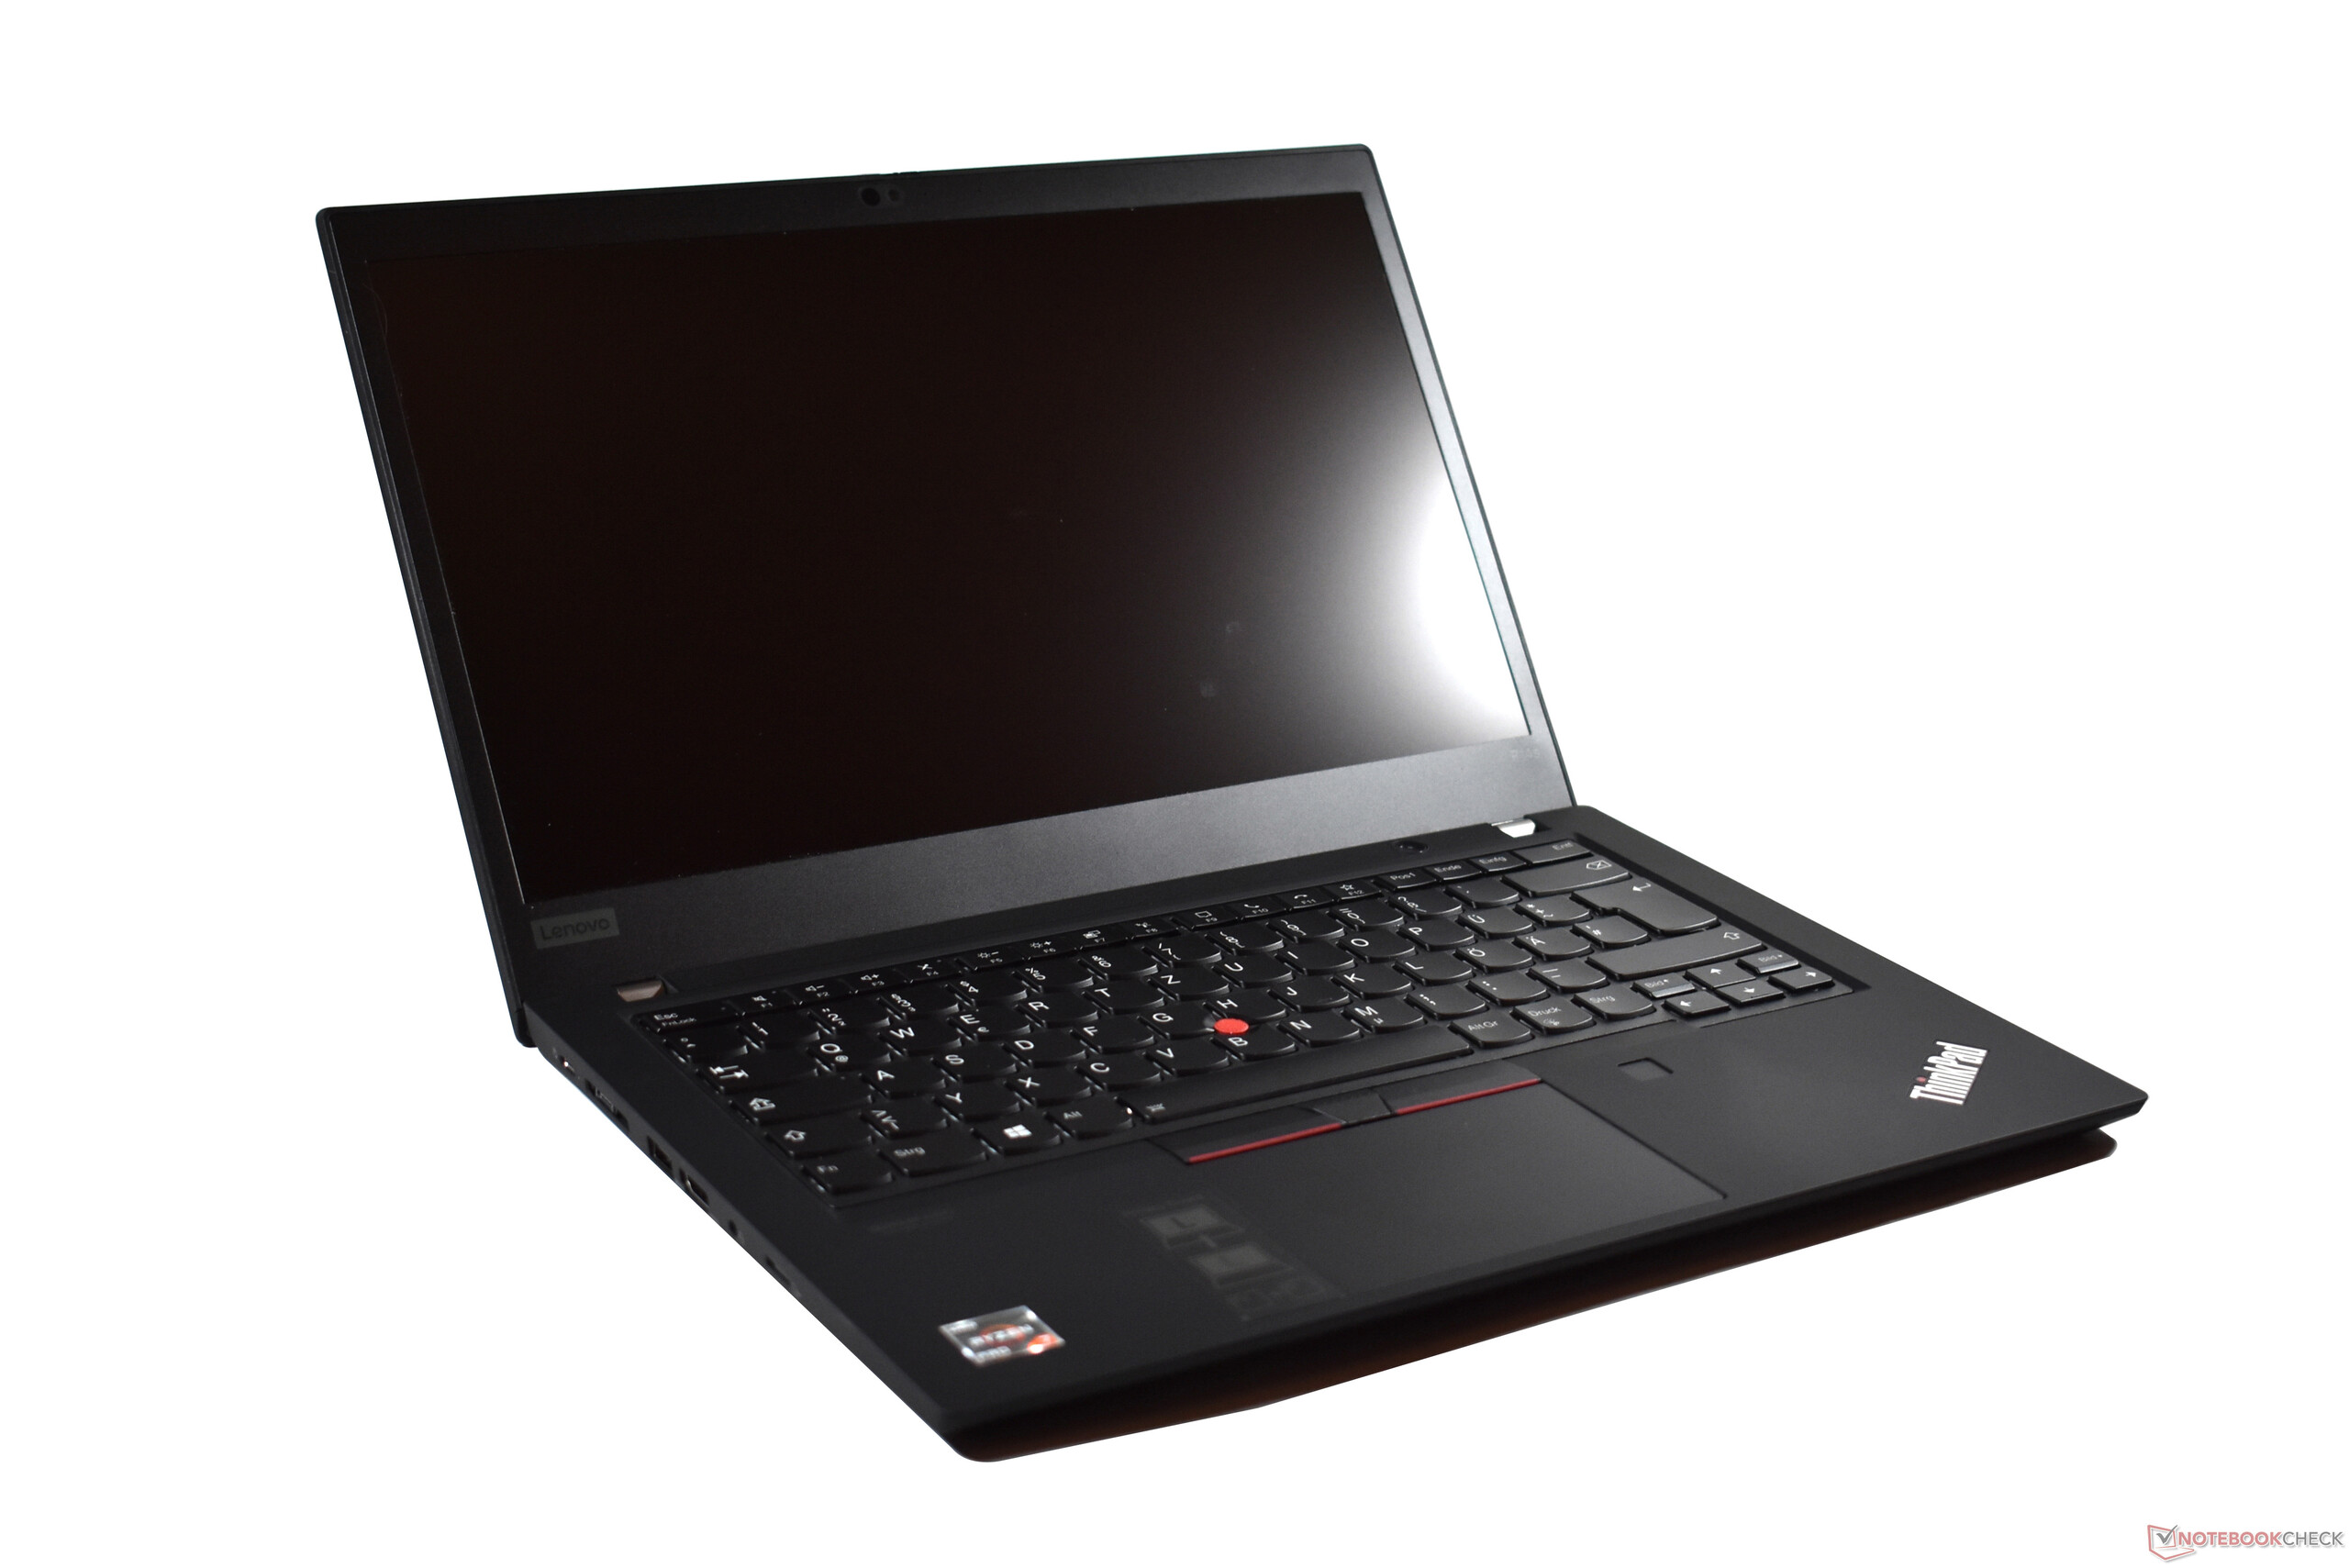
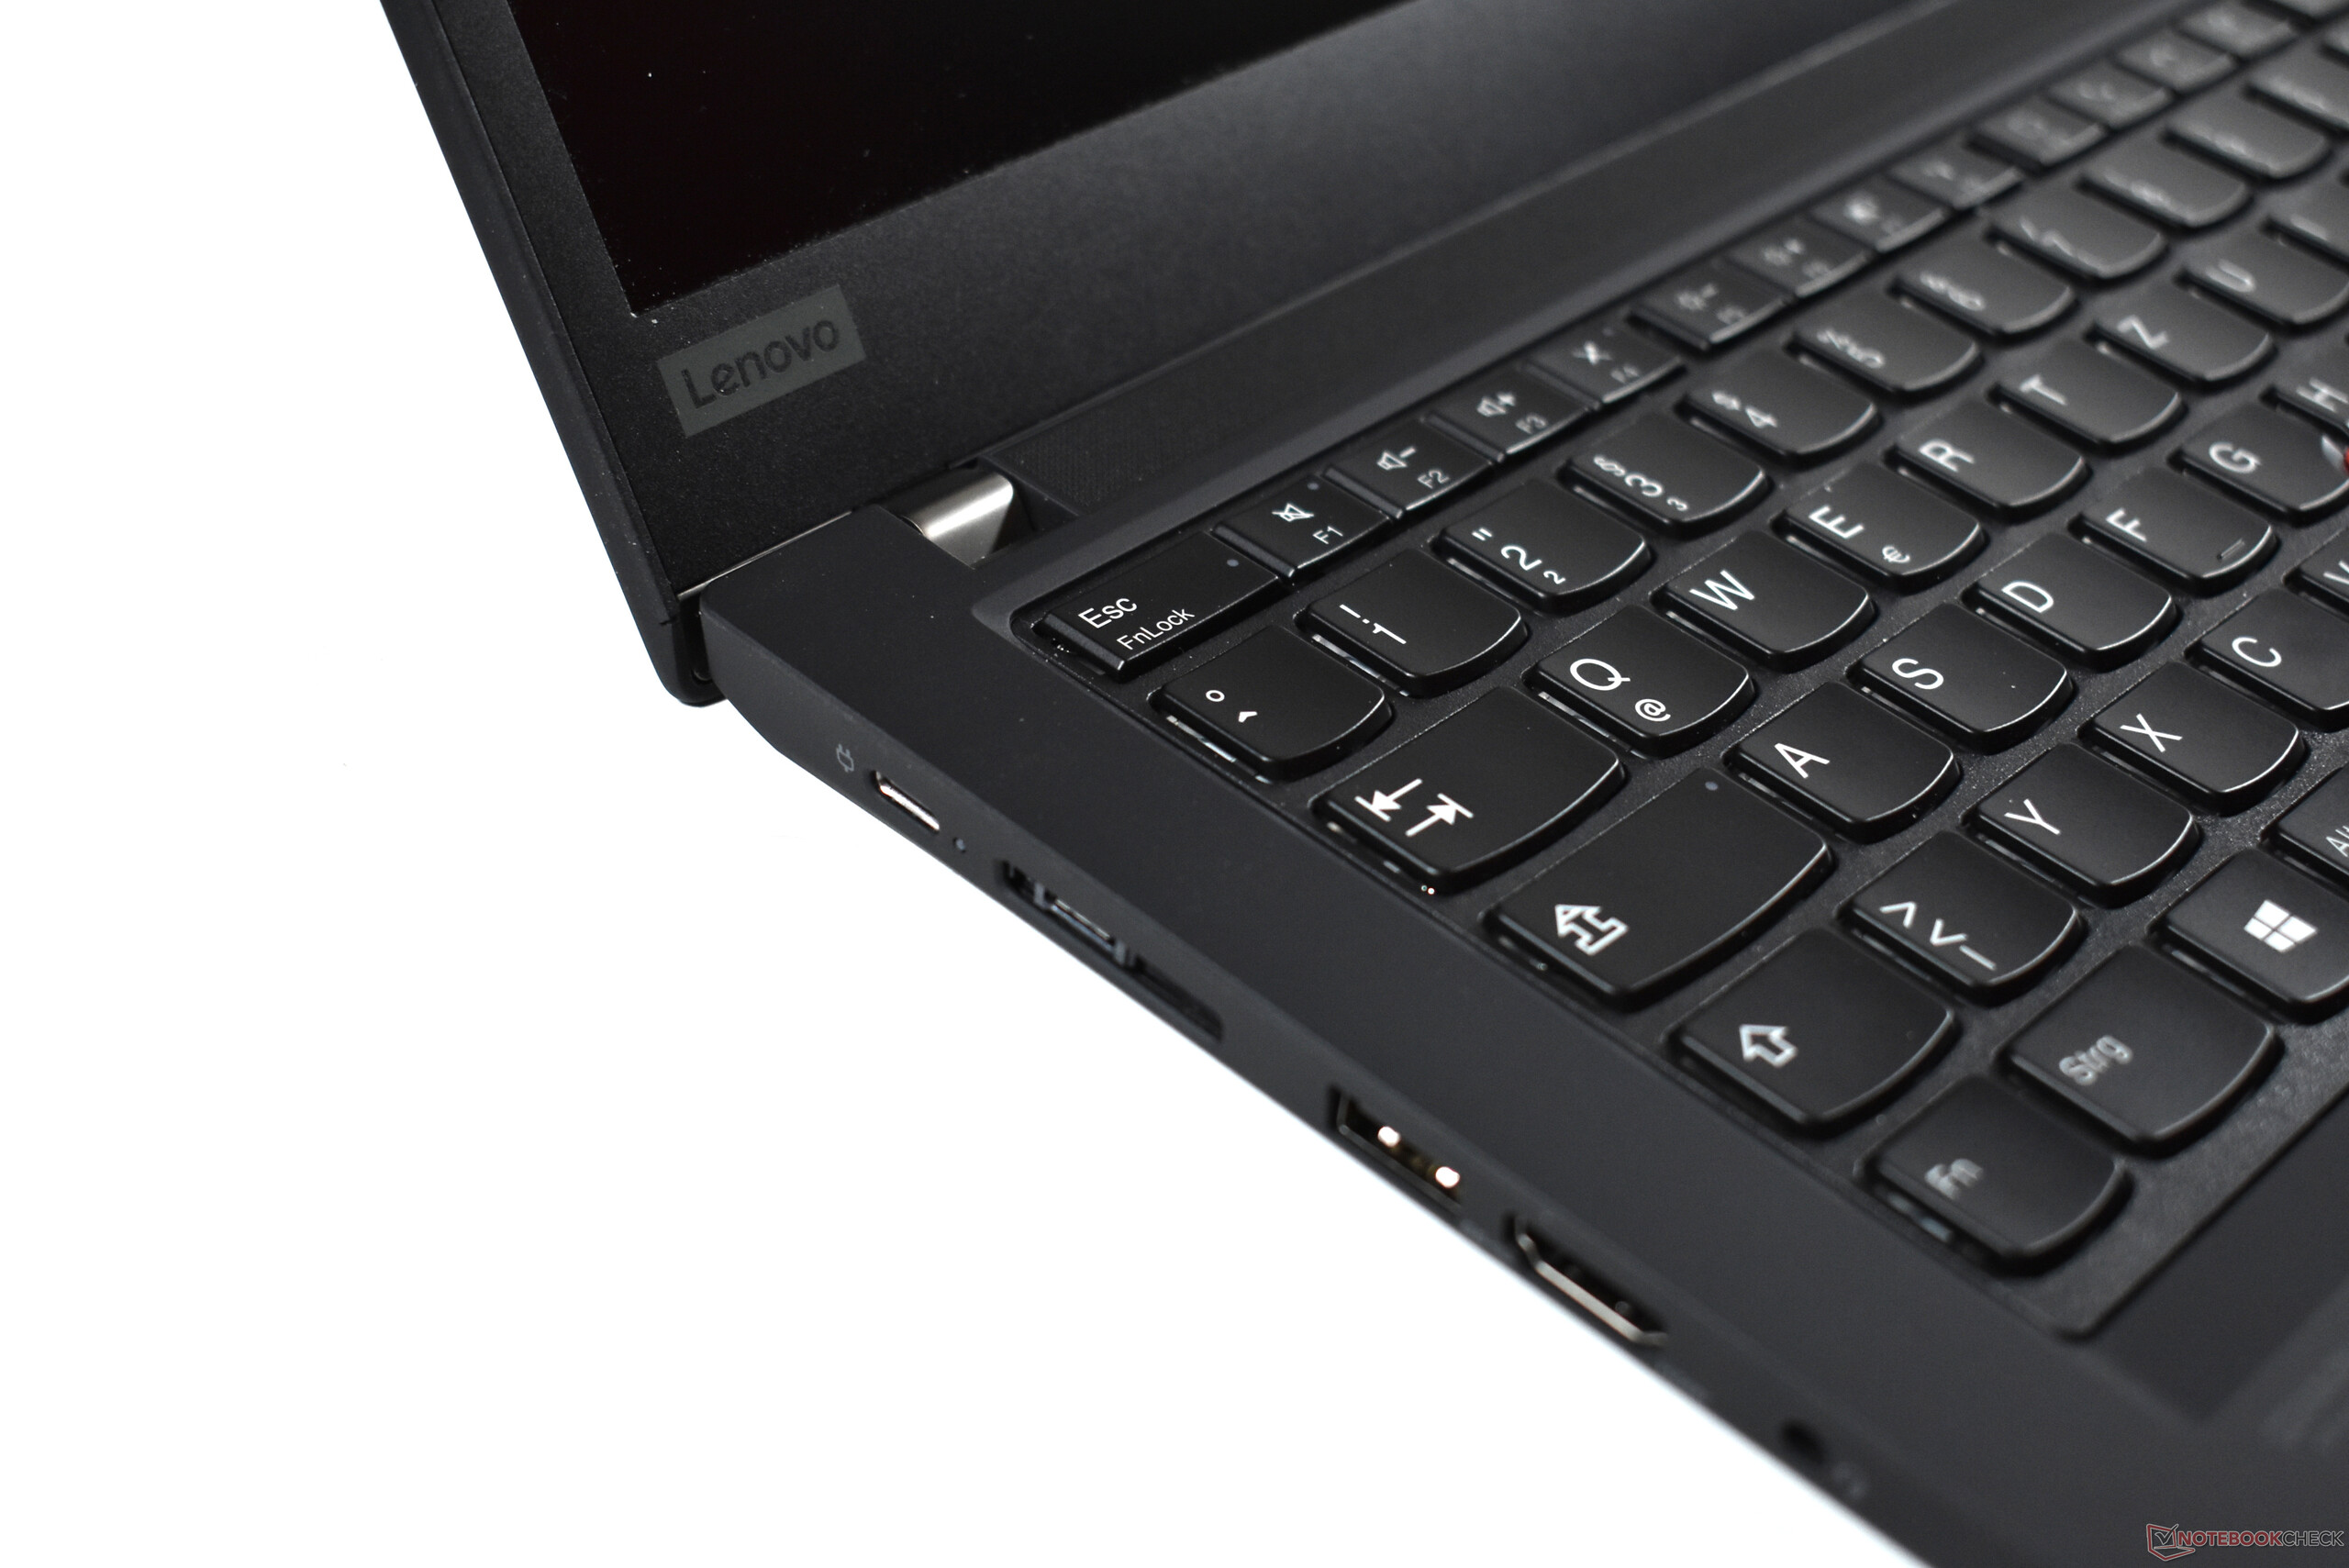
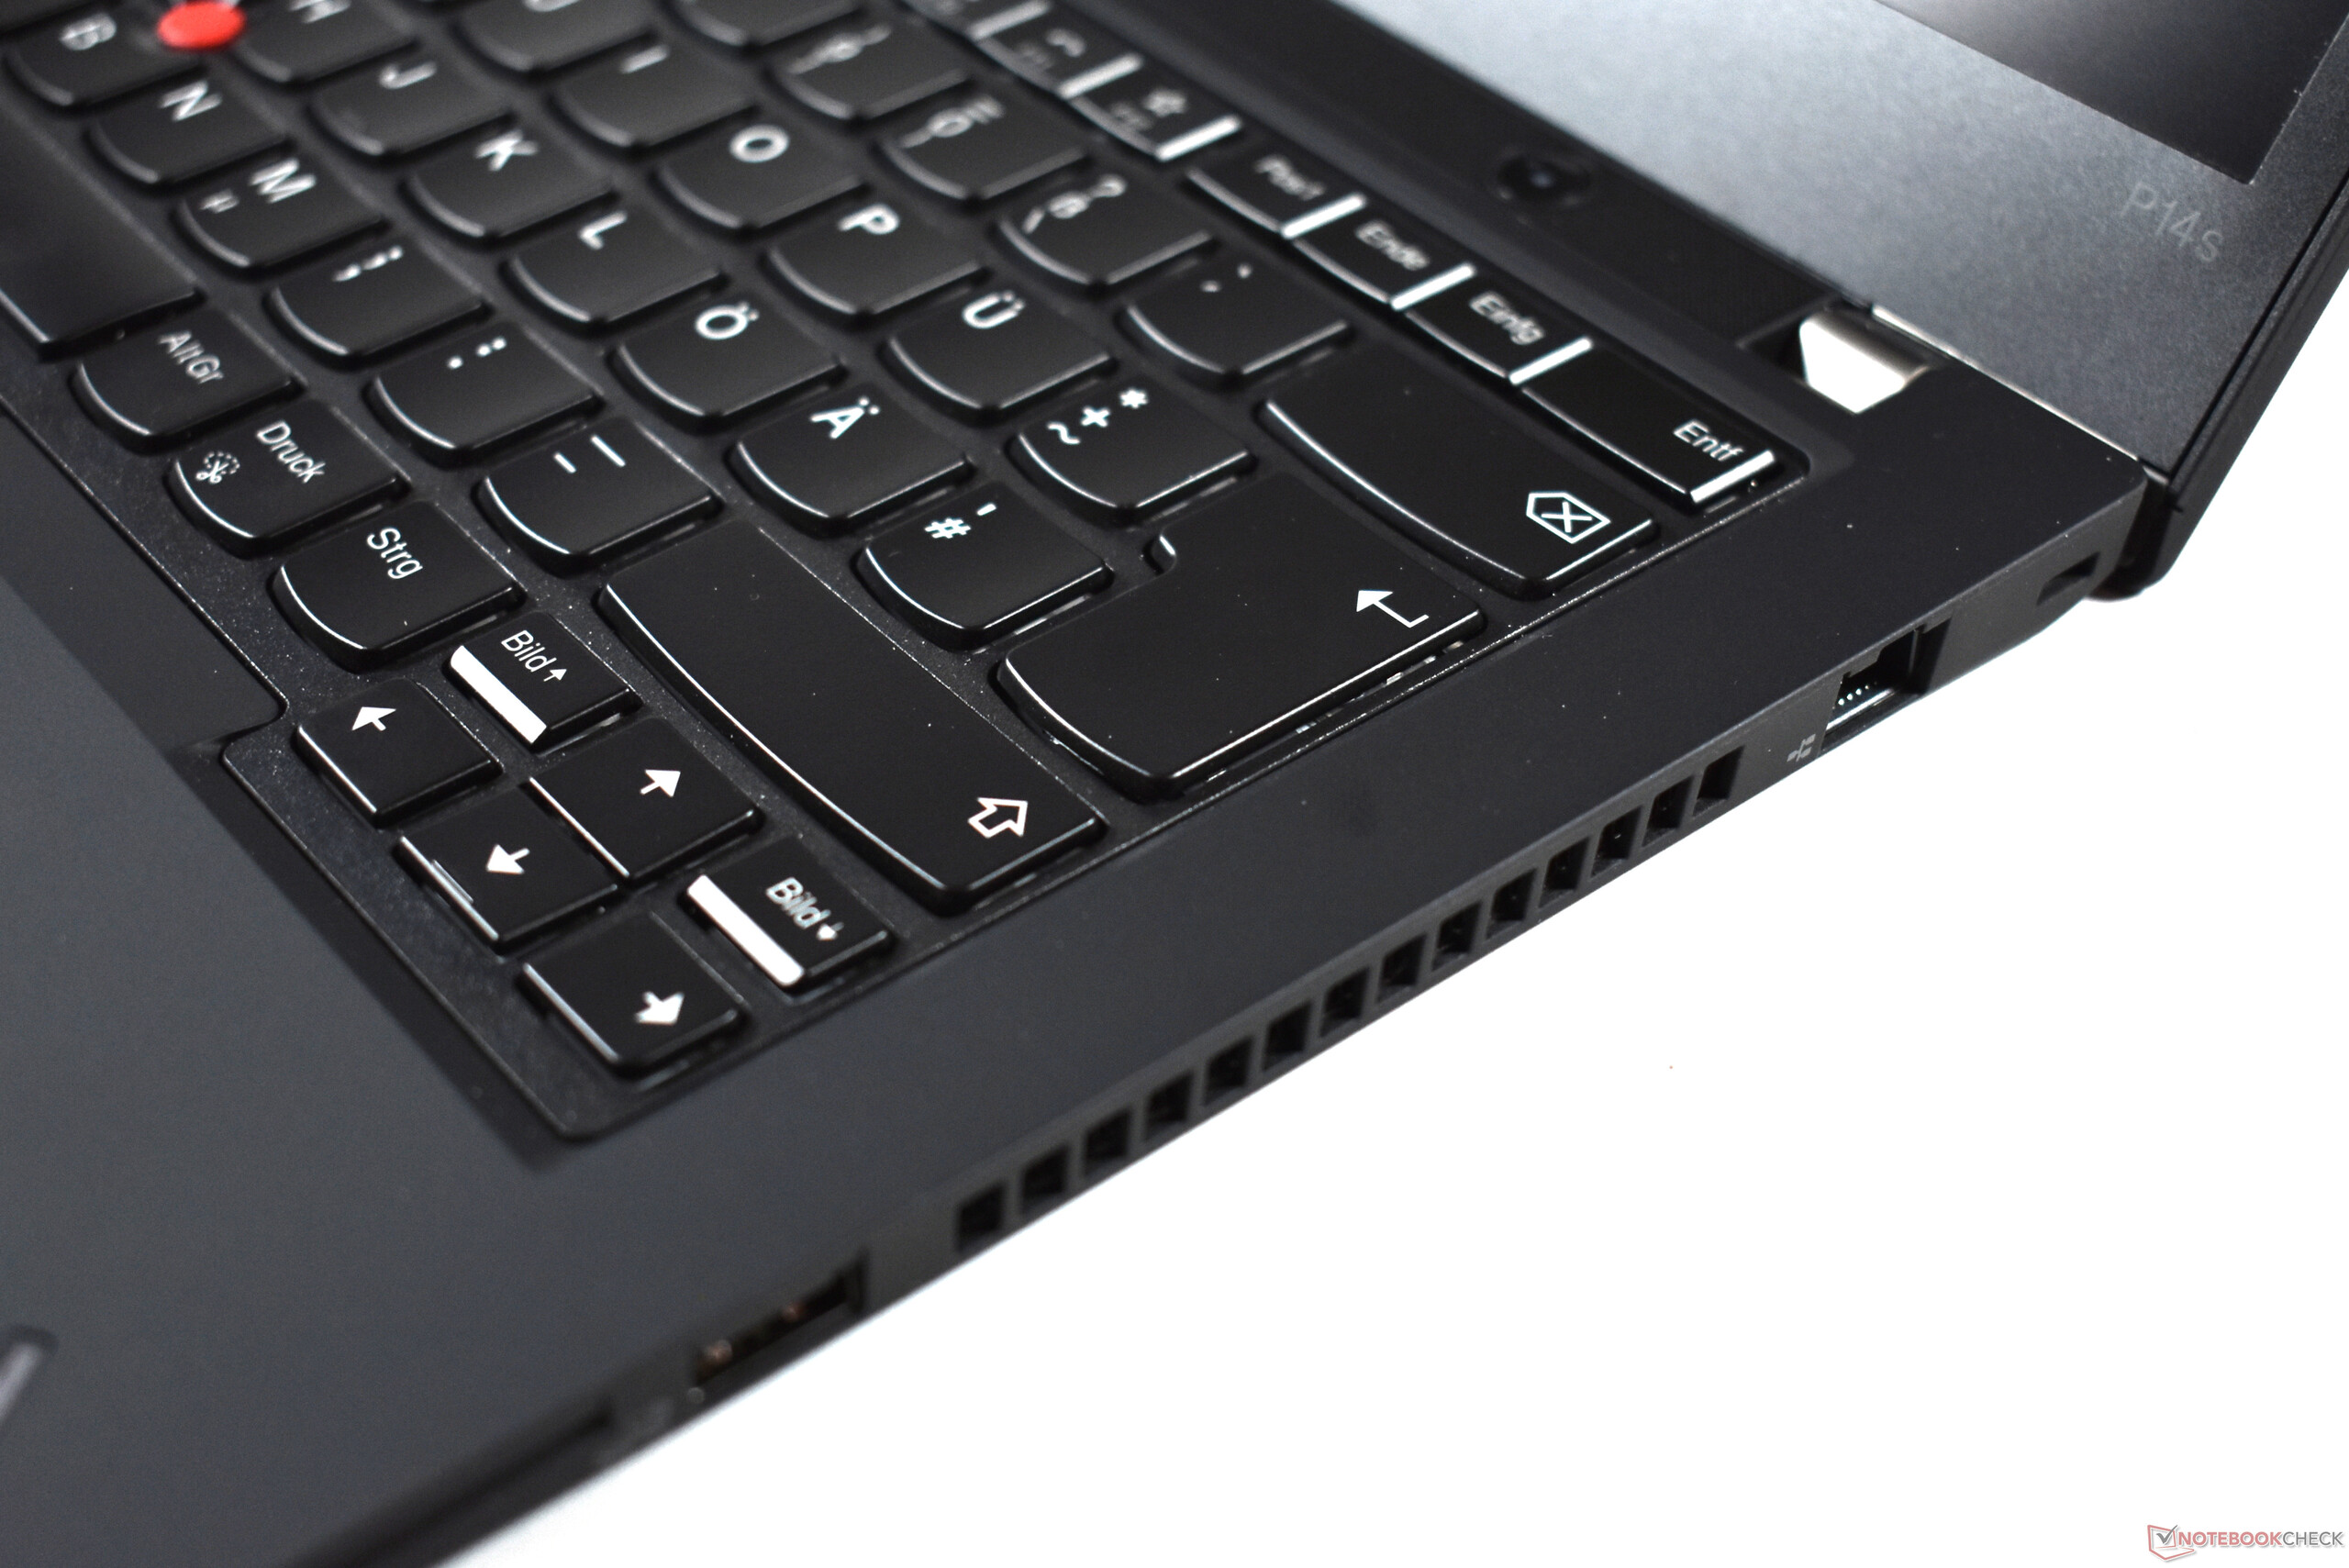
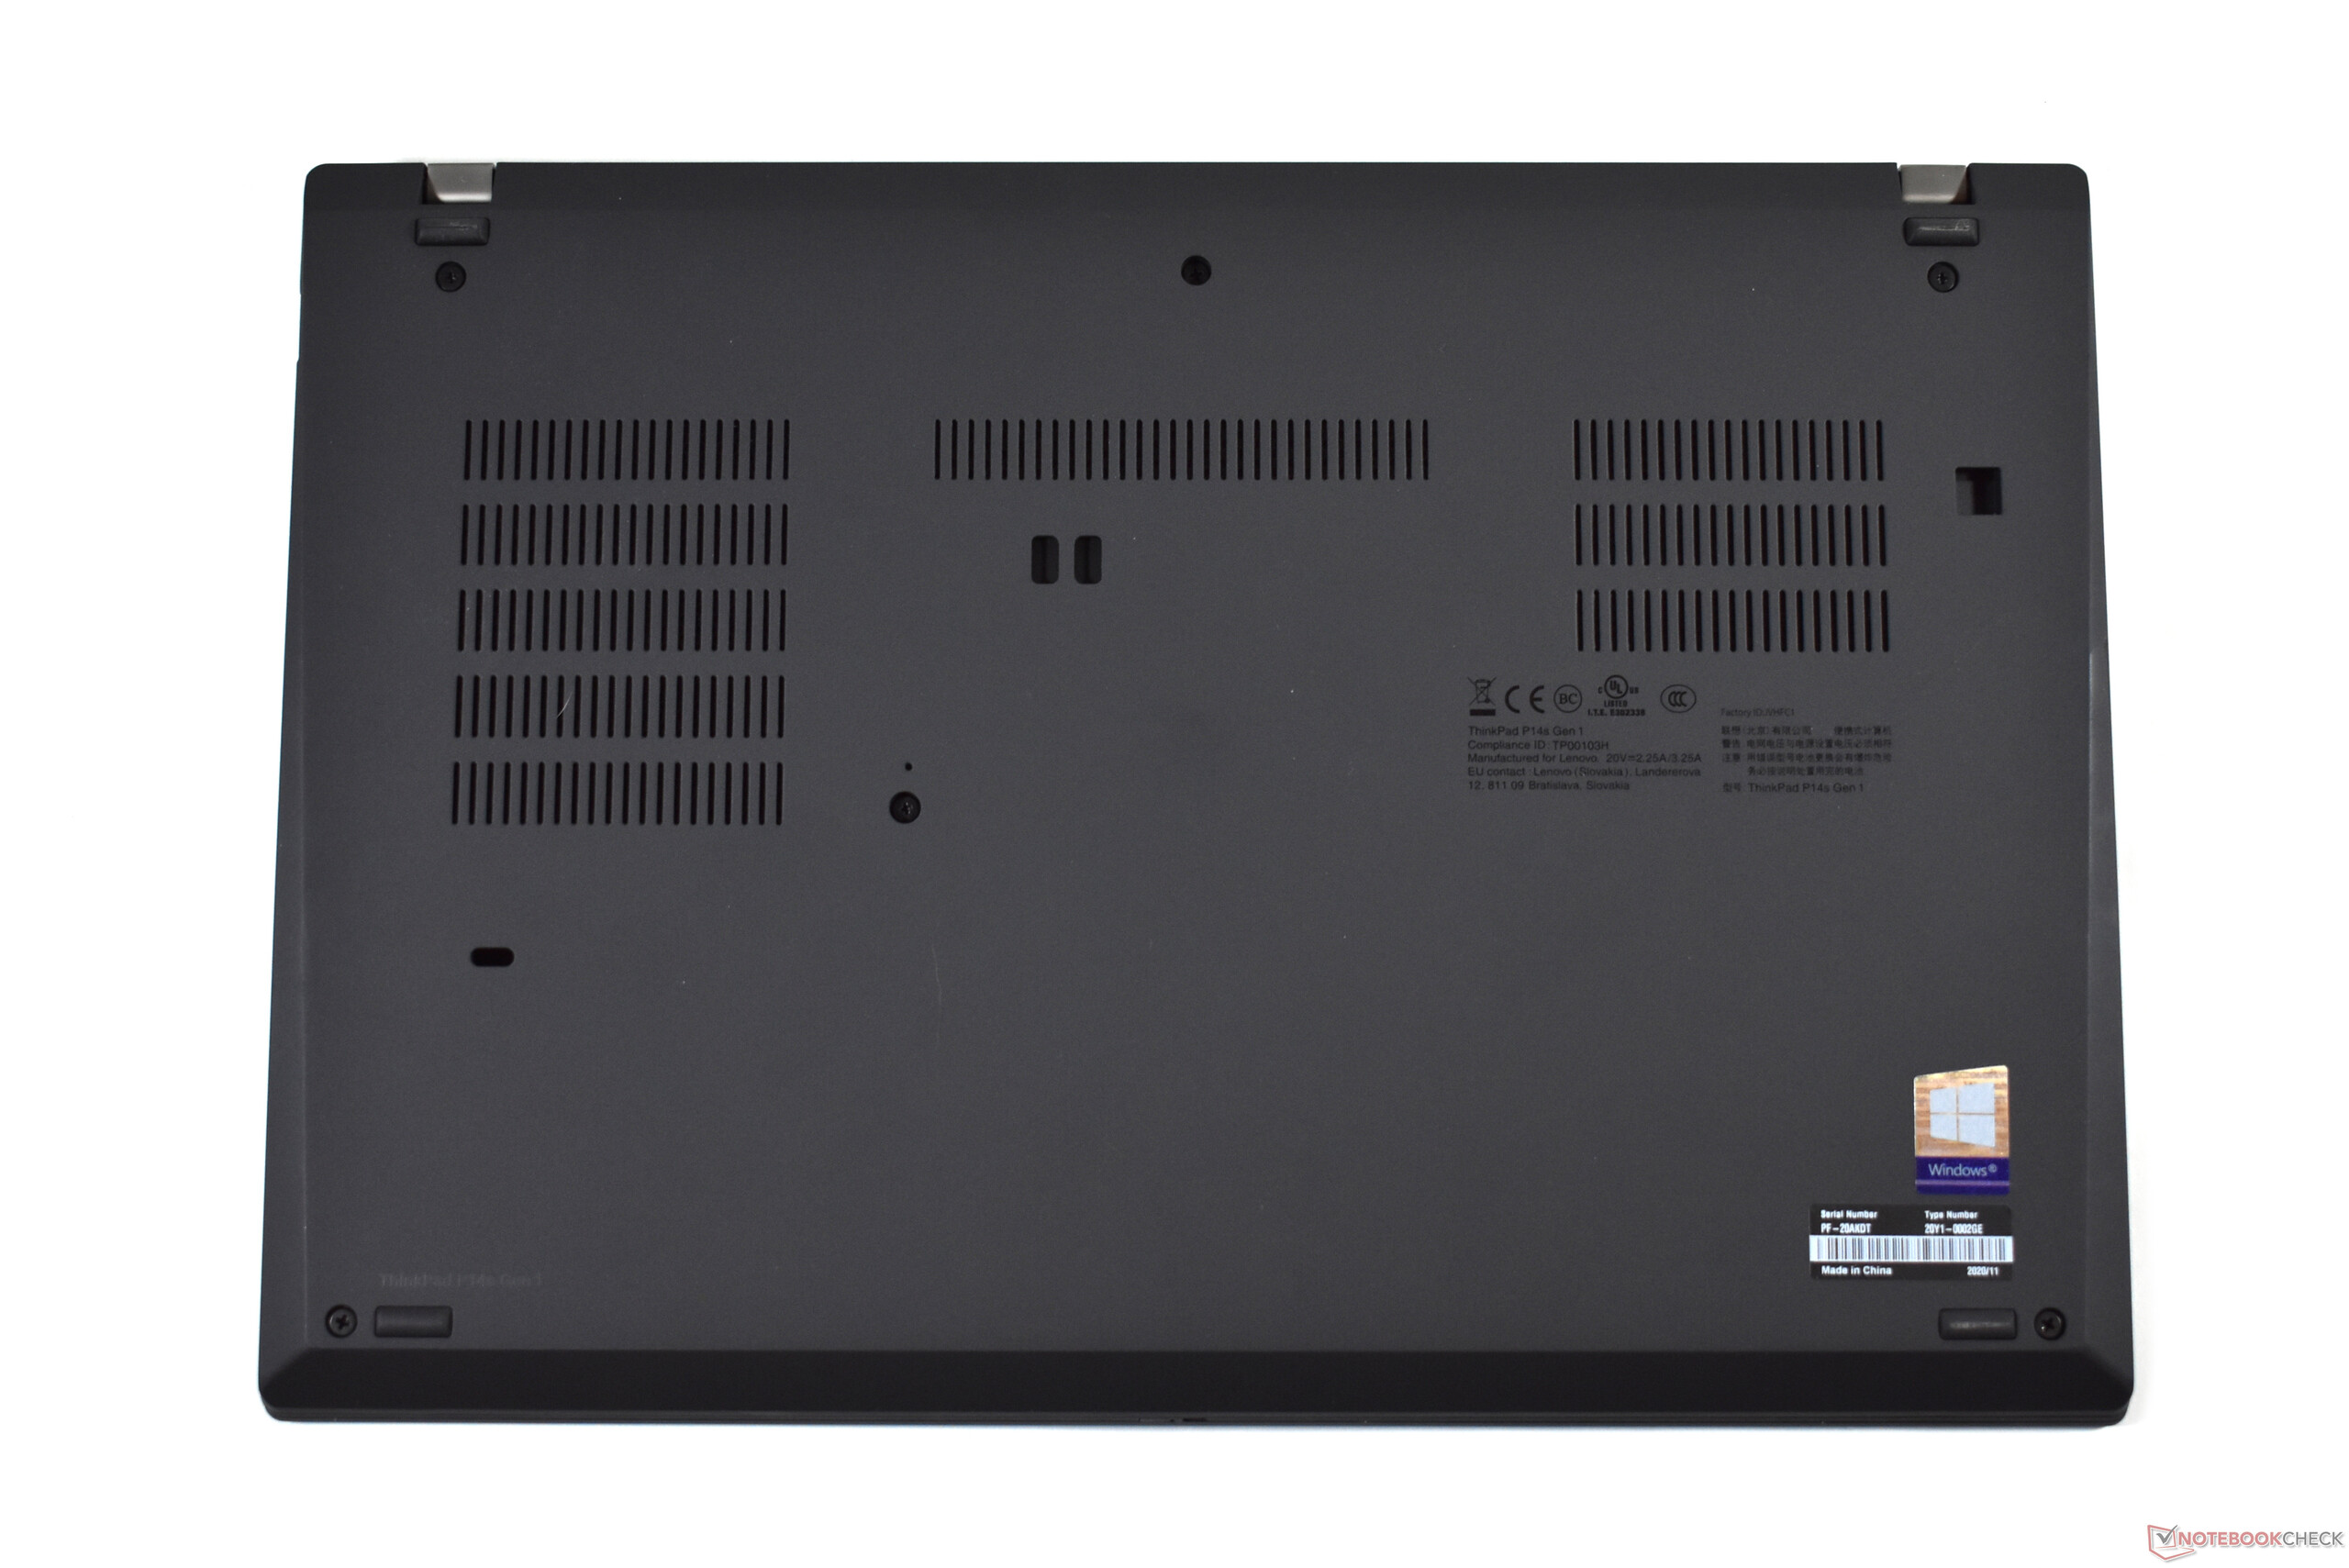
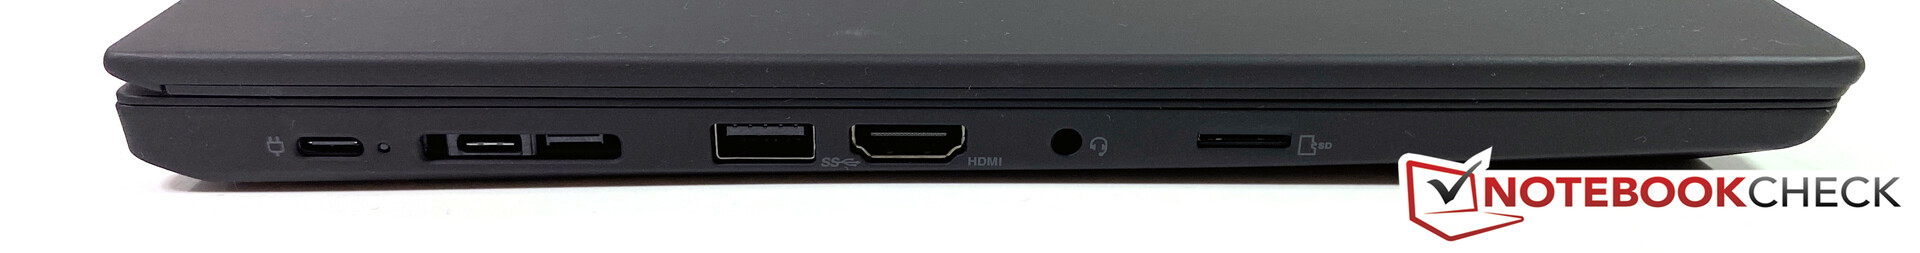
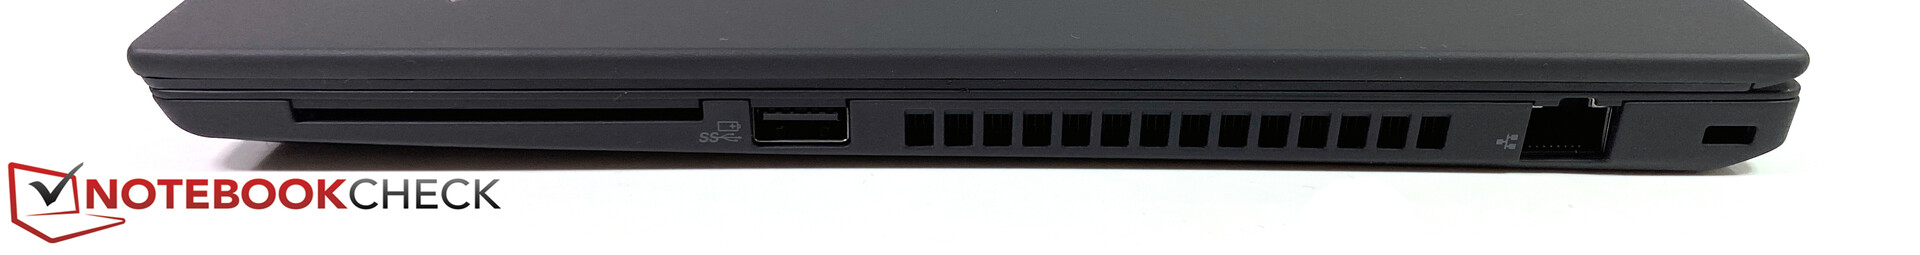
Testamos o chassi do ThinkPad P14s AMD com freqüência. Assim, detalhes sobre o projeto, dispositivos de entrada e opções de conectividade podem ser encontrados na revisão doThinkPad T490 da Lenovo, que é baseado no mesmo chassi
possible competitors for the comparison
Avaliação | Data | Modelo | Peso | Altura | Size | Resolução | Preço |
|---|---|---|---|---|---|---|---|
| 83.8 % v7 (old) | 03/2021 | Lenovo ThinkPad P14s Gen1-20Y10002GE R7 PRO 4750U, Vega 7 | 1.6 kg | 17.9 mm | 14.00" | 1920x1080 | |
| 82.7 % v7 (old) | 01/2021 | Lenovo ThinkPad P14s Gen1 20S40009GE i7-10510U, Quadro P520 | 1.5 kg | 17.9 mm | 14.00" | 1920x1080 | |
| 82.4 % v7 (old) | 01/2021 | HP ZBook Firefly 14 G7 i7-10610U, Quadro P520 | 1.4 kg | 17.9 mm | 14.00" | 1920x1080 | |
| 90.1 % v7 (old) | 01/2021 | Lenovo ThinkPad X1 Extreme Gen3-20TLS0UV00 i7-10750H, GeForce GTX 1650 Ti Max-Q | 1.7 kg | 18.7 mm | 15.60" | 1920x1080 |
| SD Card Reader | |
| average JPG Copy Test (av. of 3 runs) | |
| Média da turma Workstation (49.6 - 681, n=14, últimos 2 anos) | |
| Lenovo ThinkPad X1 Extreme Gen3-20TLS0UV00 (Toshiba Exceria Pro SDXC 64 GB UHS-II) | |
| Lenovo ThinkPad P14s Gen1-20Y10002GE (Toshiba Exceria Pro M501 64 GB UHS-II) | |
| Lenovo ThinkPad P14s Gen1 20S40009GE (Toshiba Exceria Pro SDXC 64 GB UHS-II) | |
| maximum AS SSD Seq Read Test (1GB) | |
| Média da turma Workstation (87.6 - 1455, n=14, últimos 2 anos) | |
| Lenovo ThinkPad X1 Extreme Gen3-20TLS0UV00 (Toshiba Exceria Pro SDXC 64 GB UHS-II) | |
| Lenovo ThinkPad P14s Gen1-20Y10002GE (Toshiba Exceria Pro M501 64 GB UHS-II) | |
| Lenovo ThinkPad P14s Gen1 20S40009GE (Toshiba Exceria Pro SDXC 64 GB UHS-II) | |
Webcam


Mostrador PrivacyGuard: não há muitas vantagens, algumas desvantagens
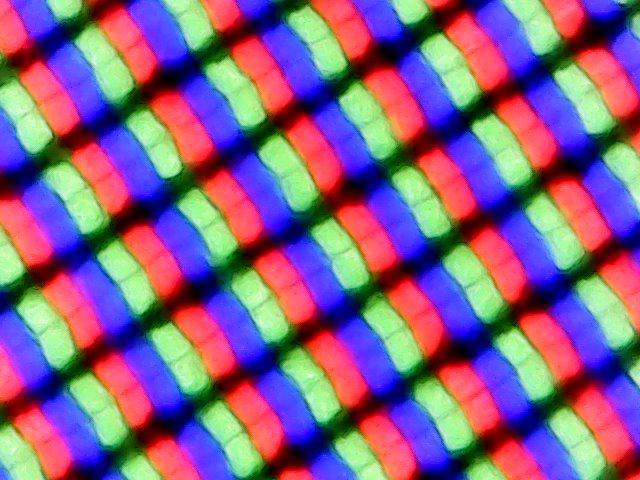
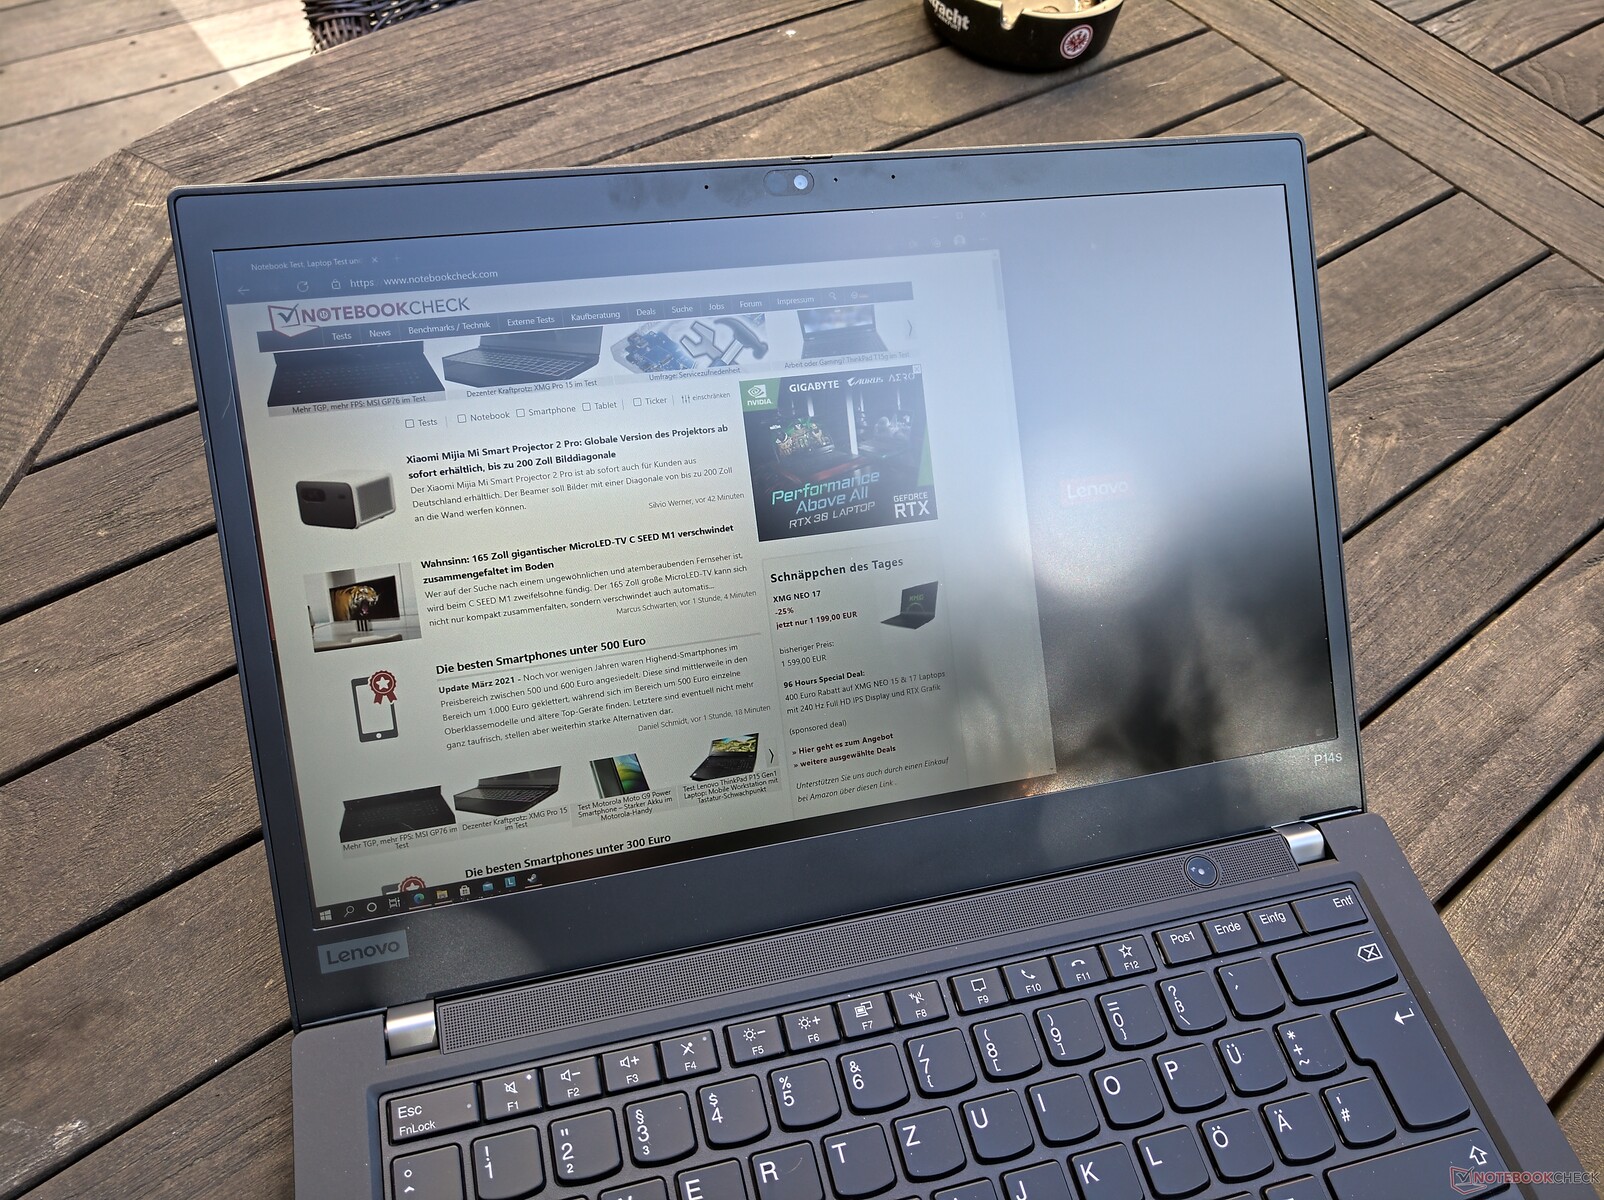
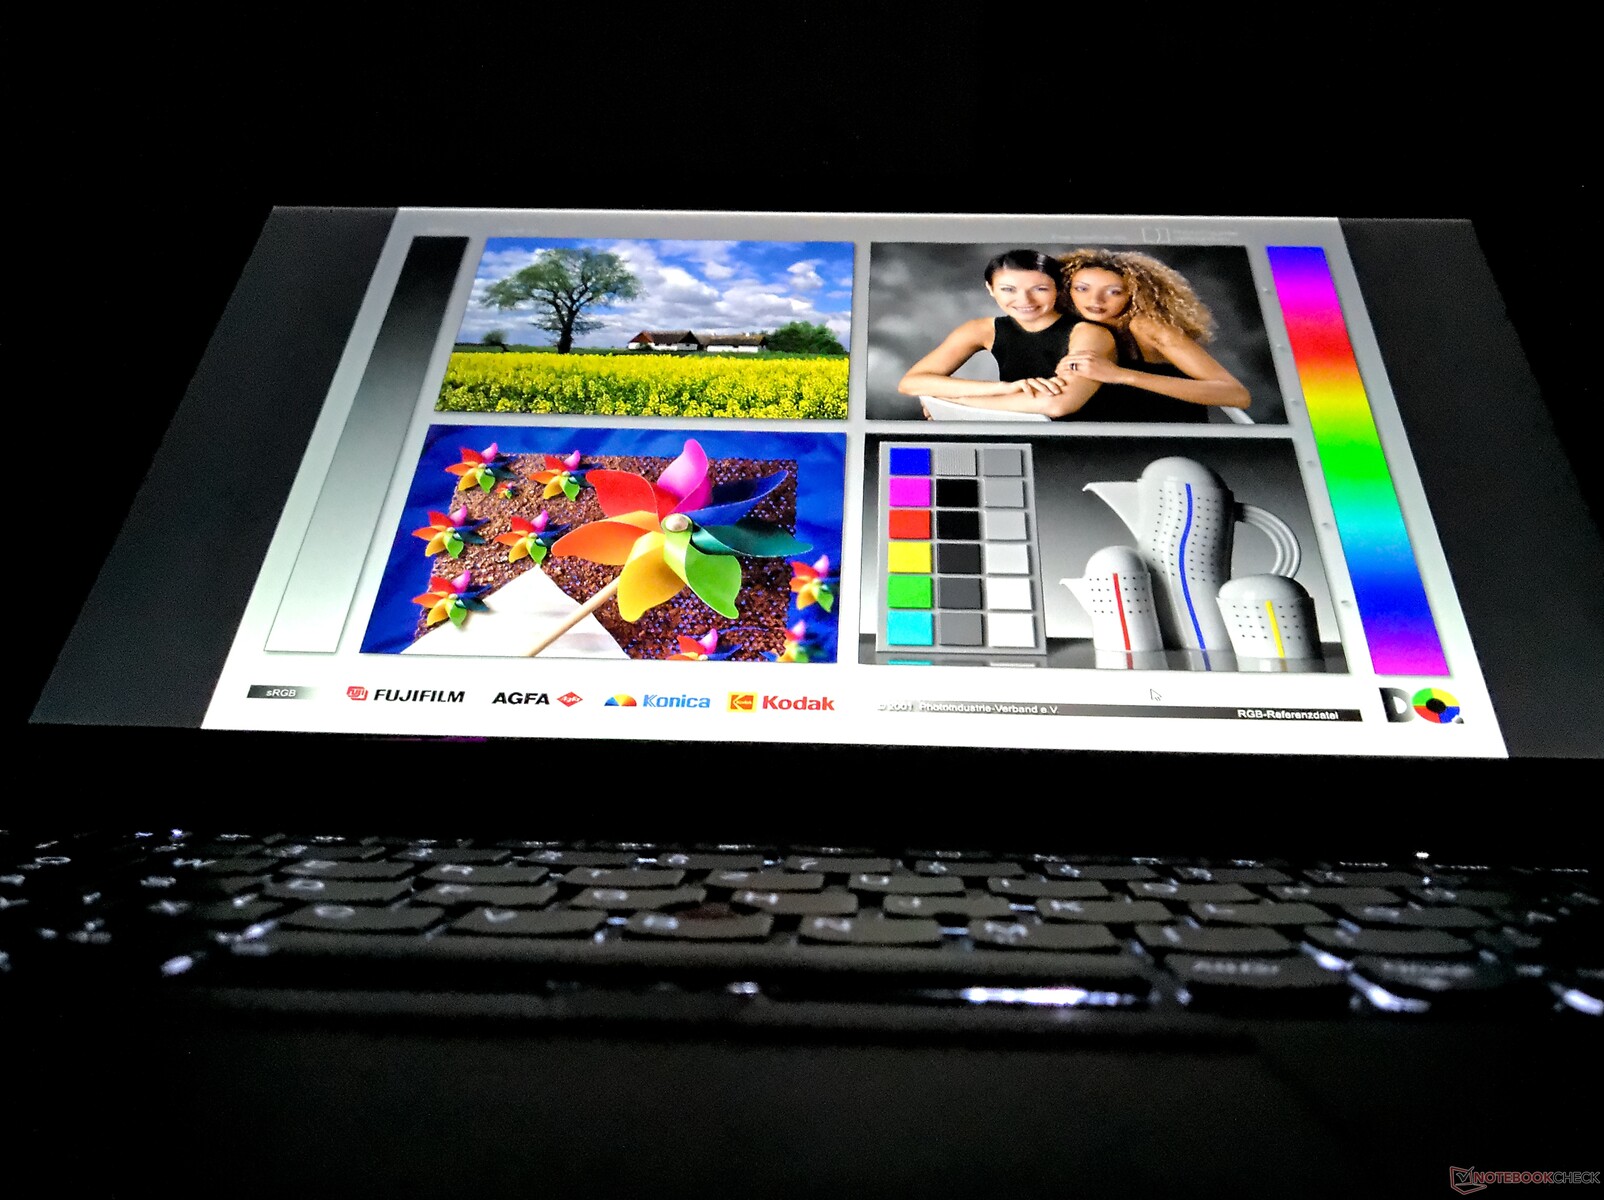
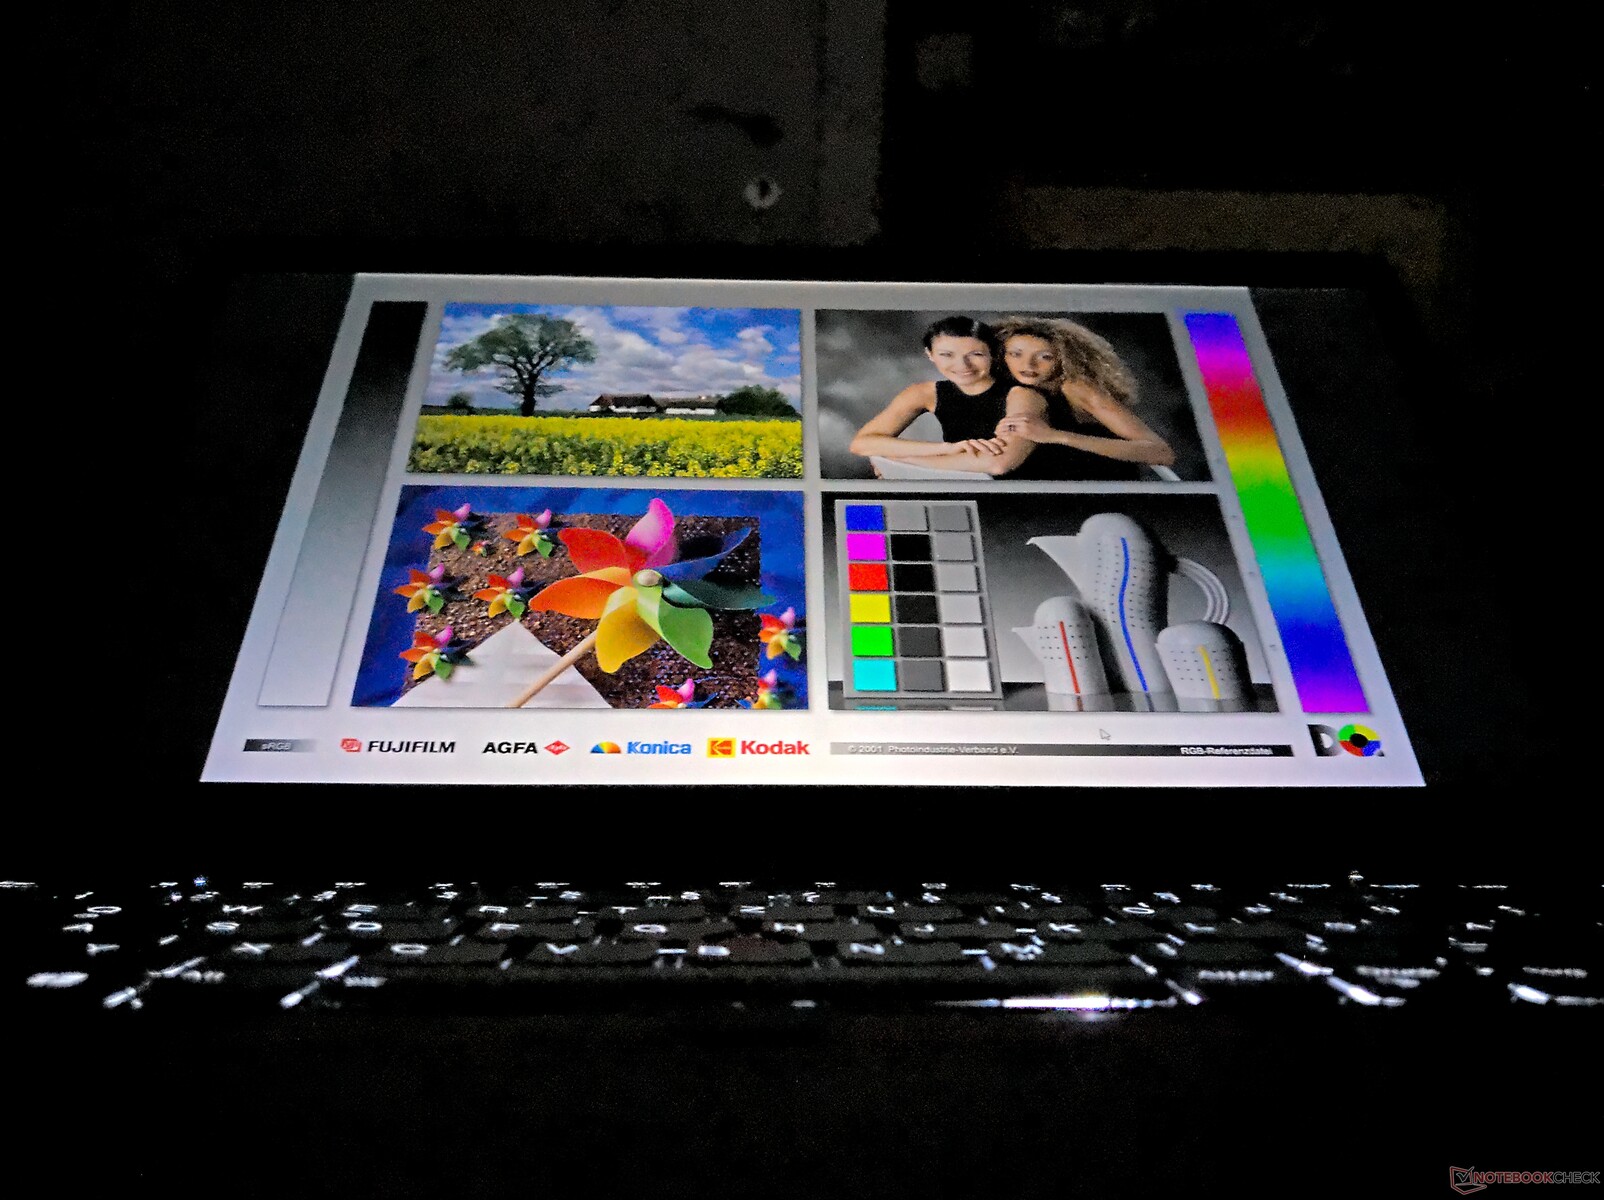
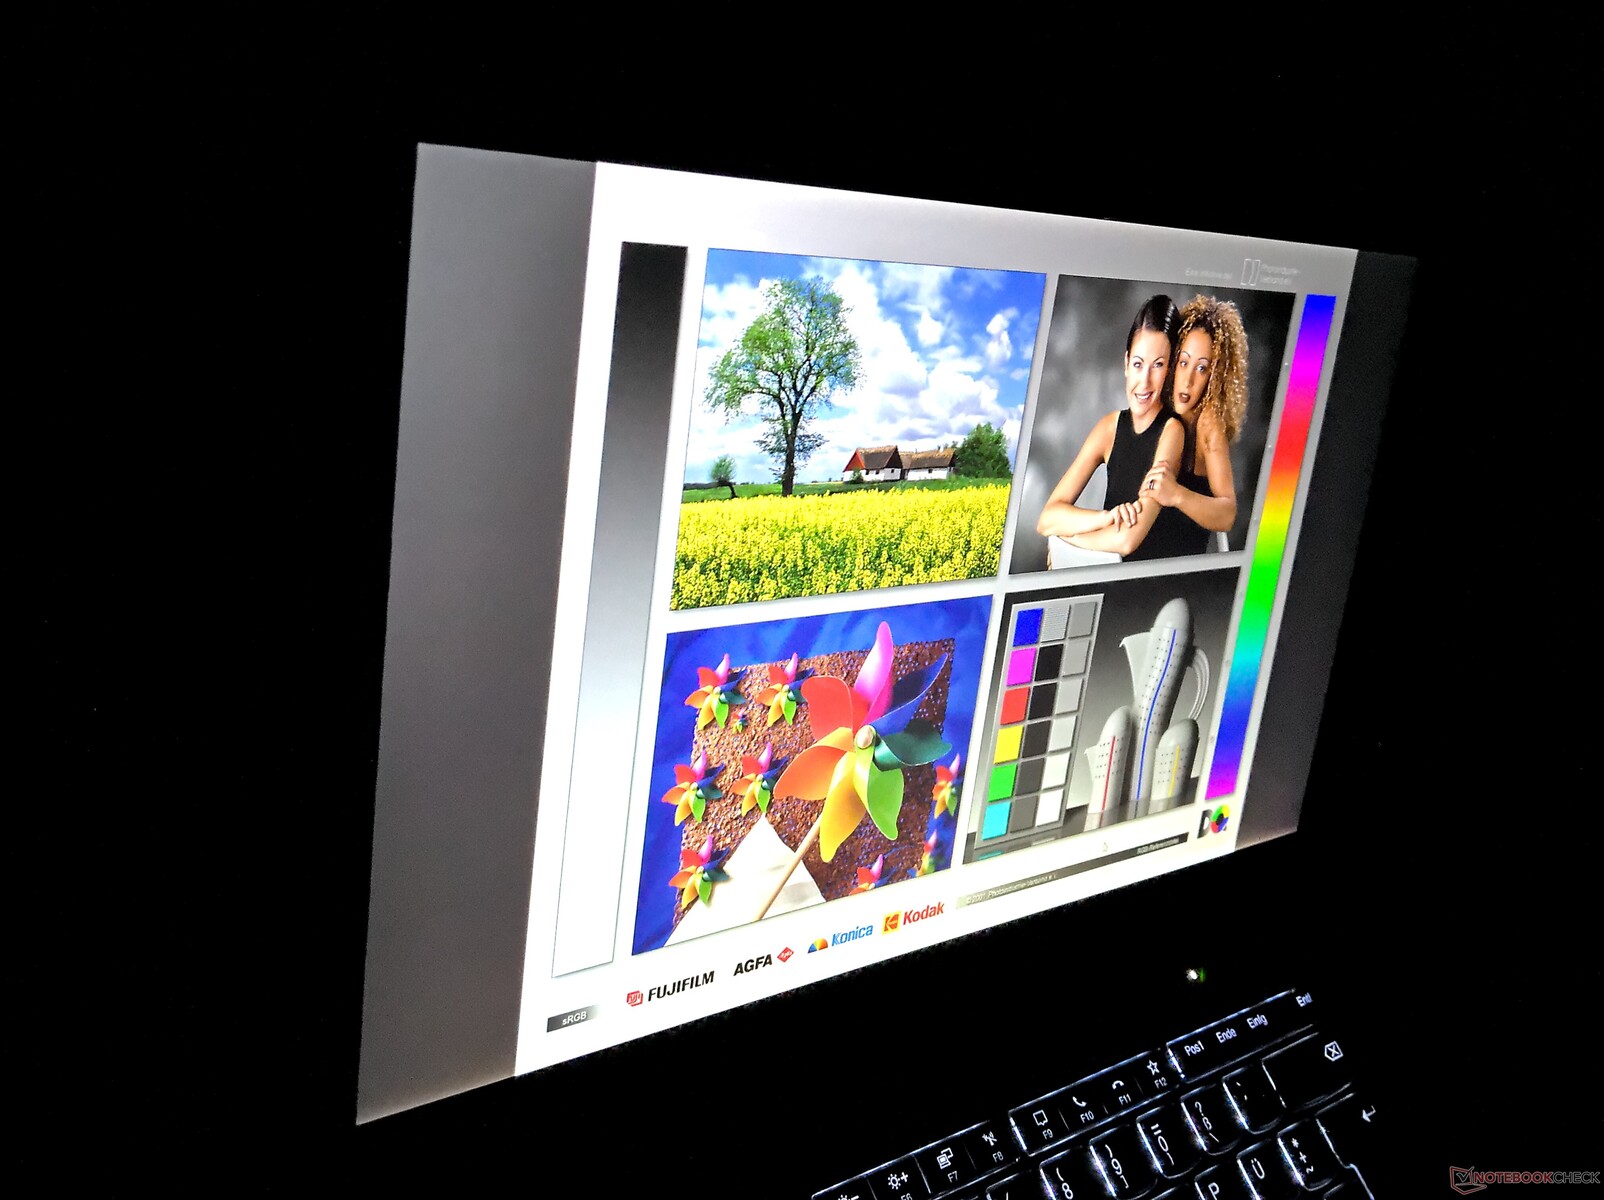
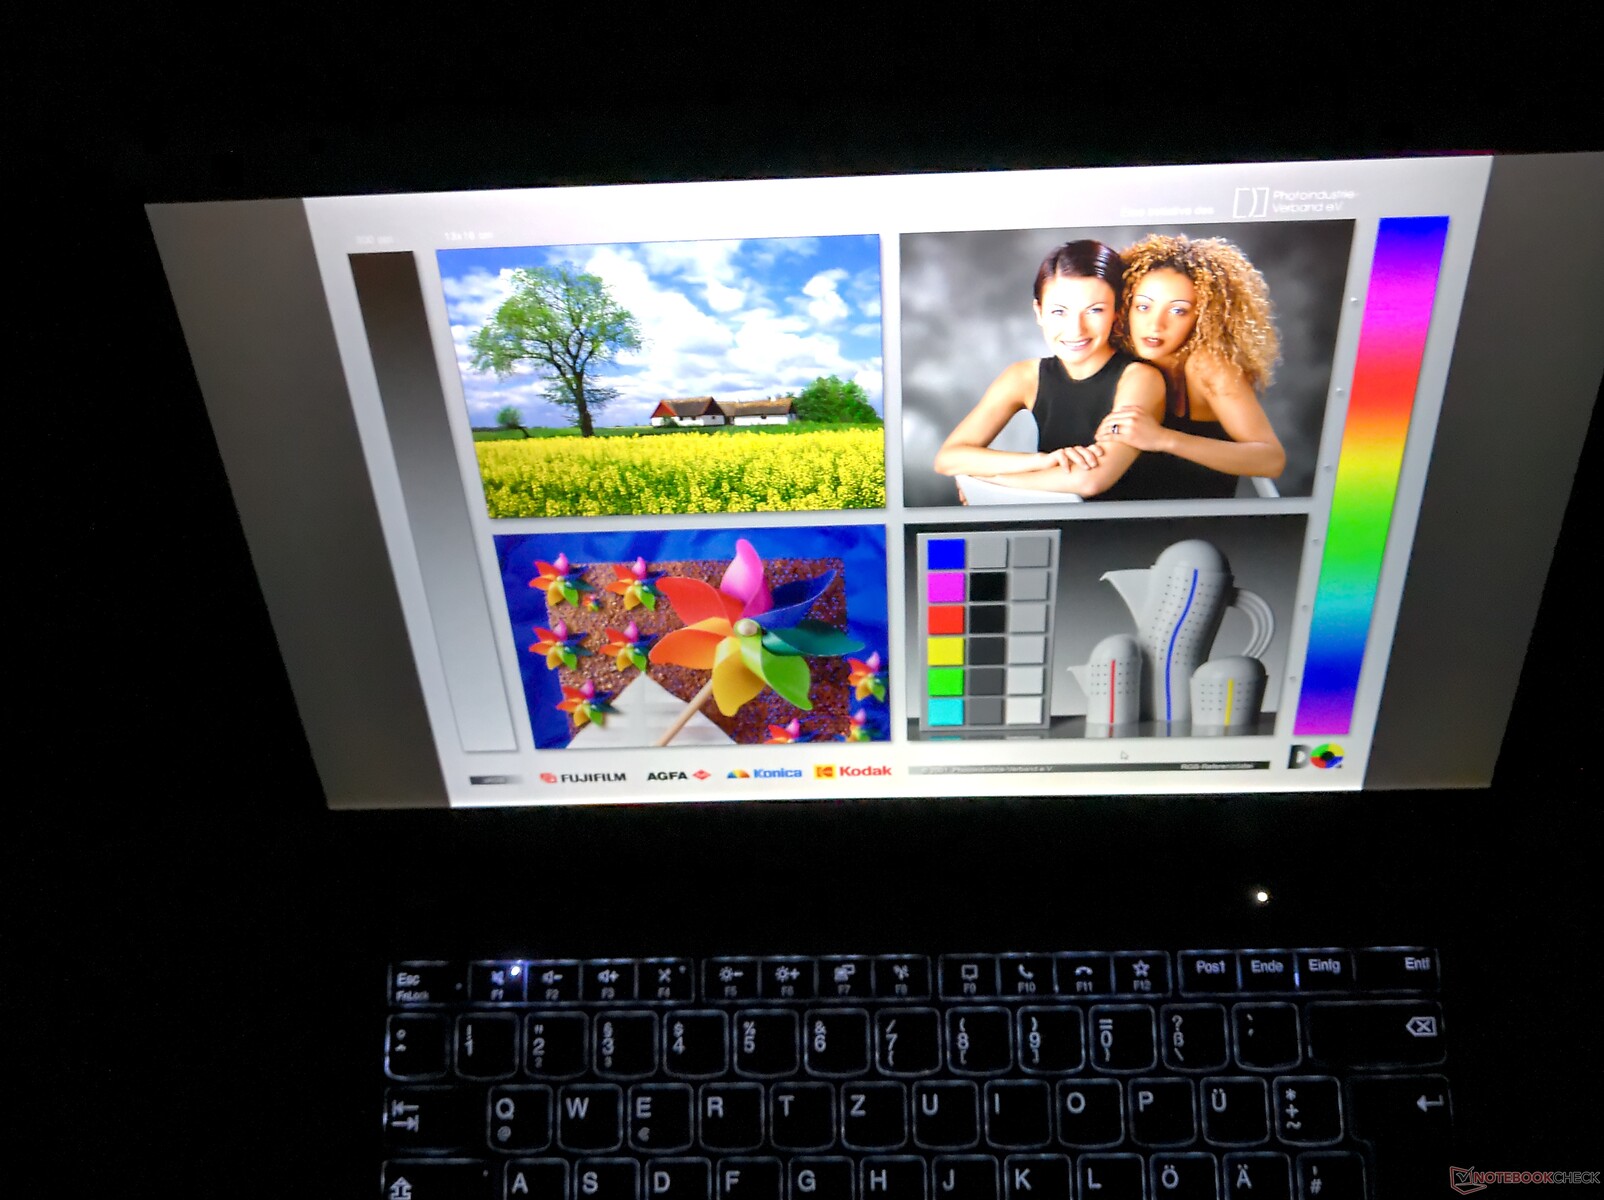
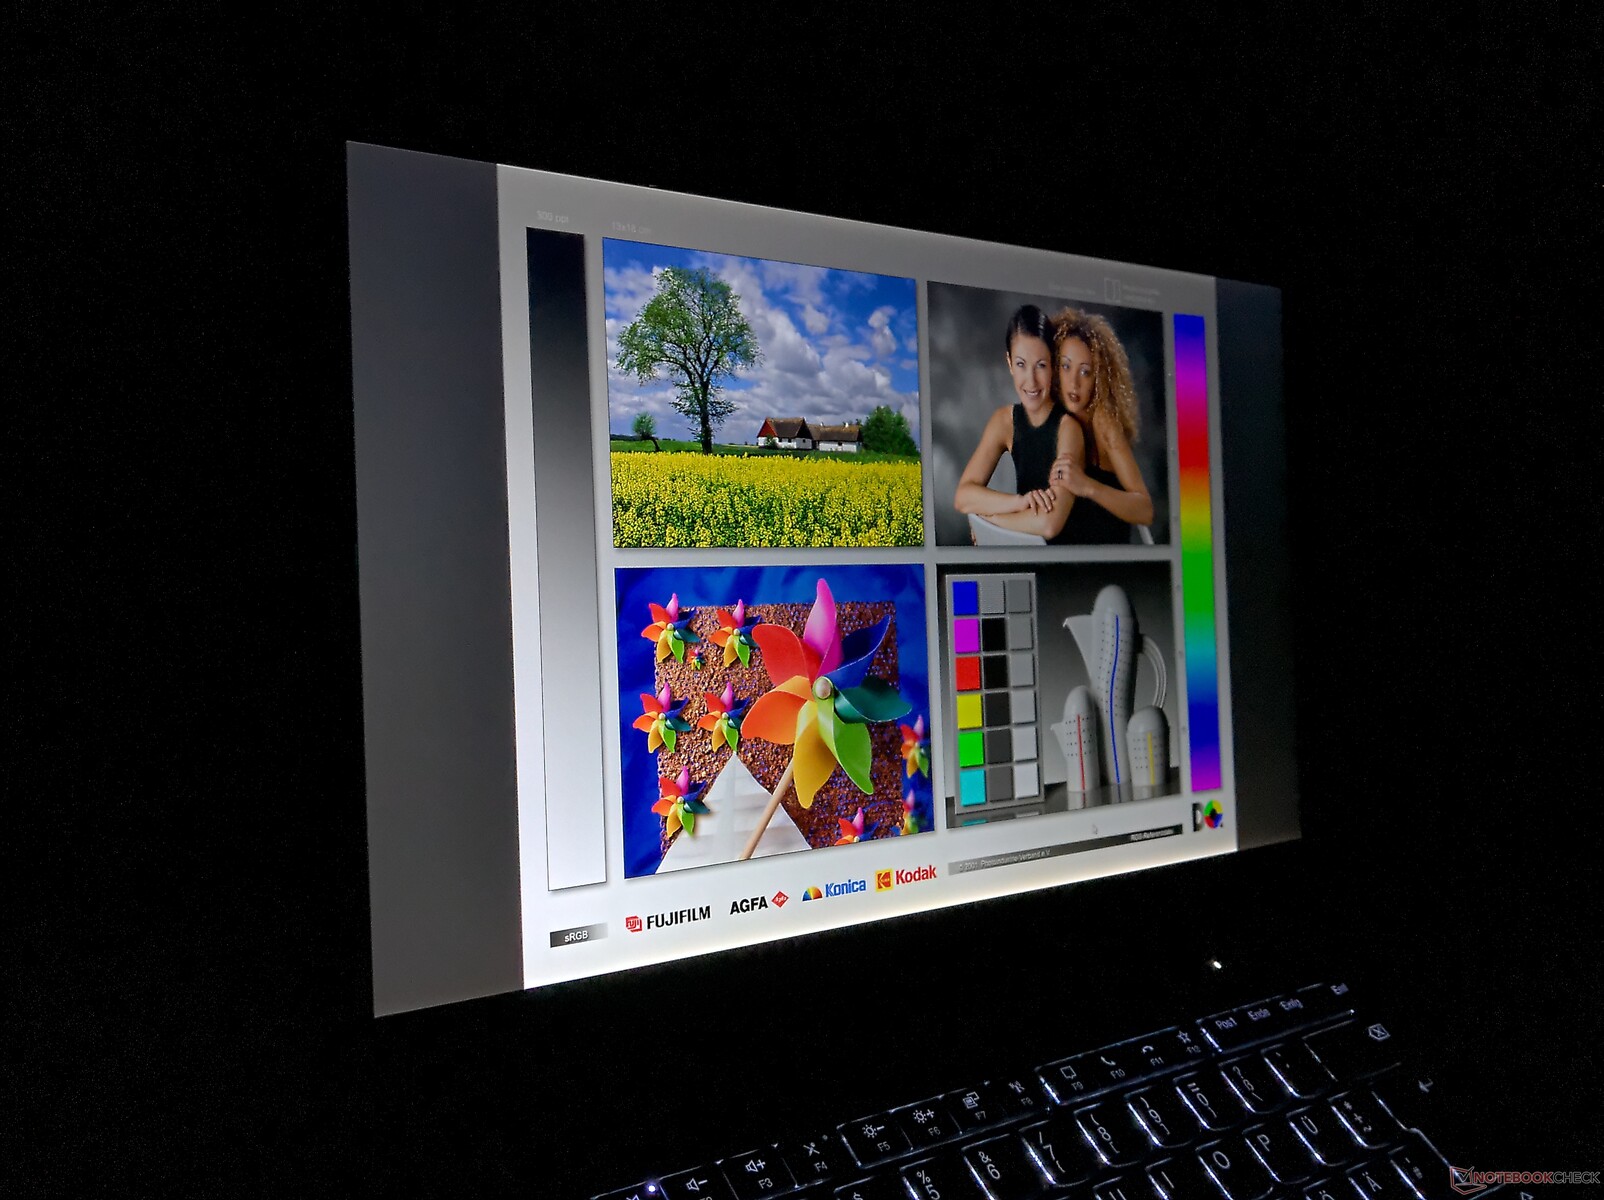
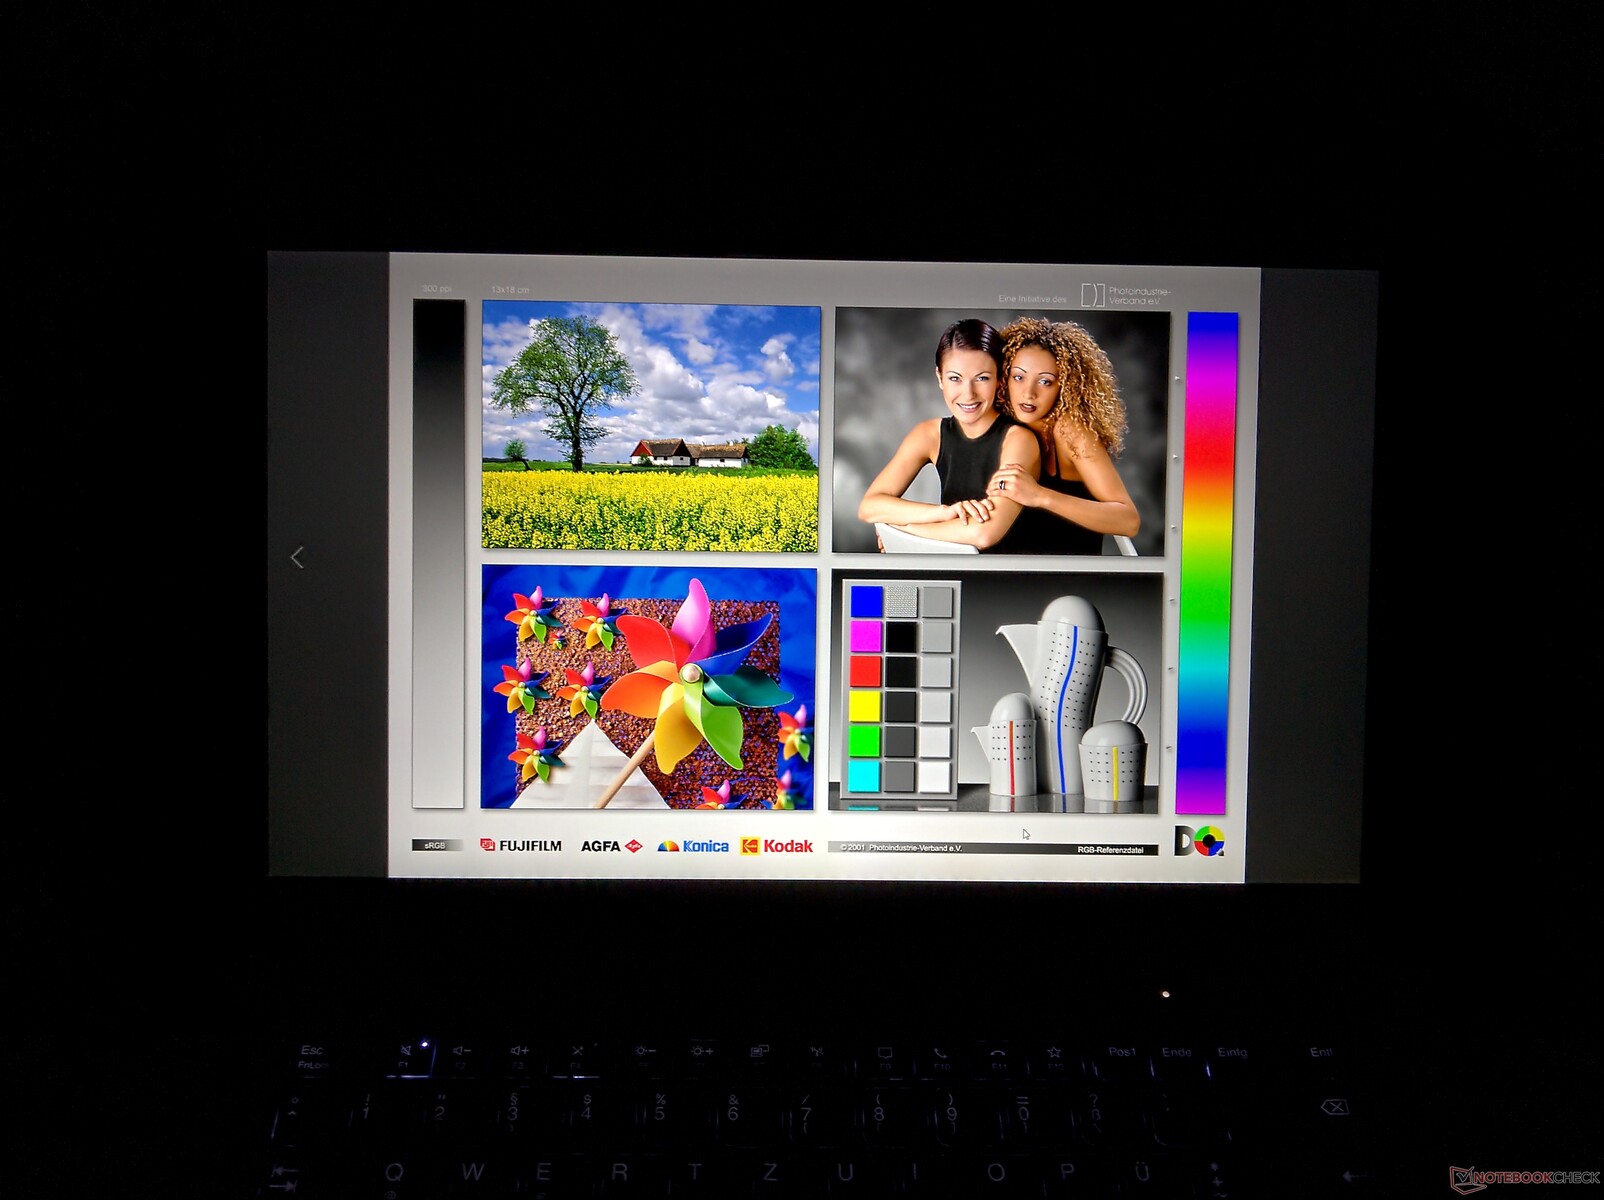
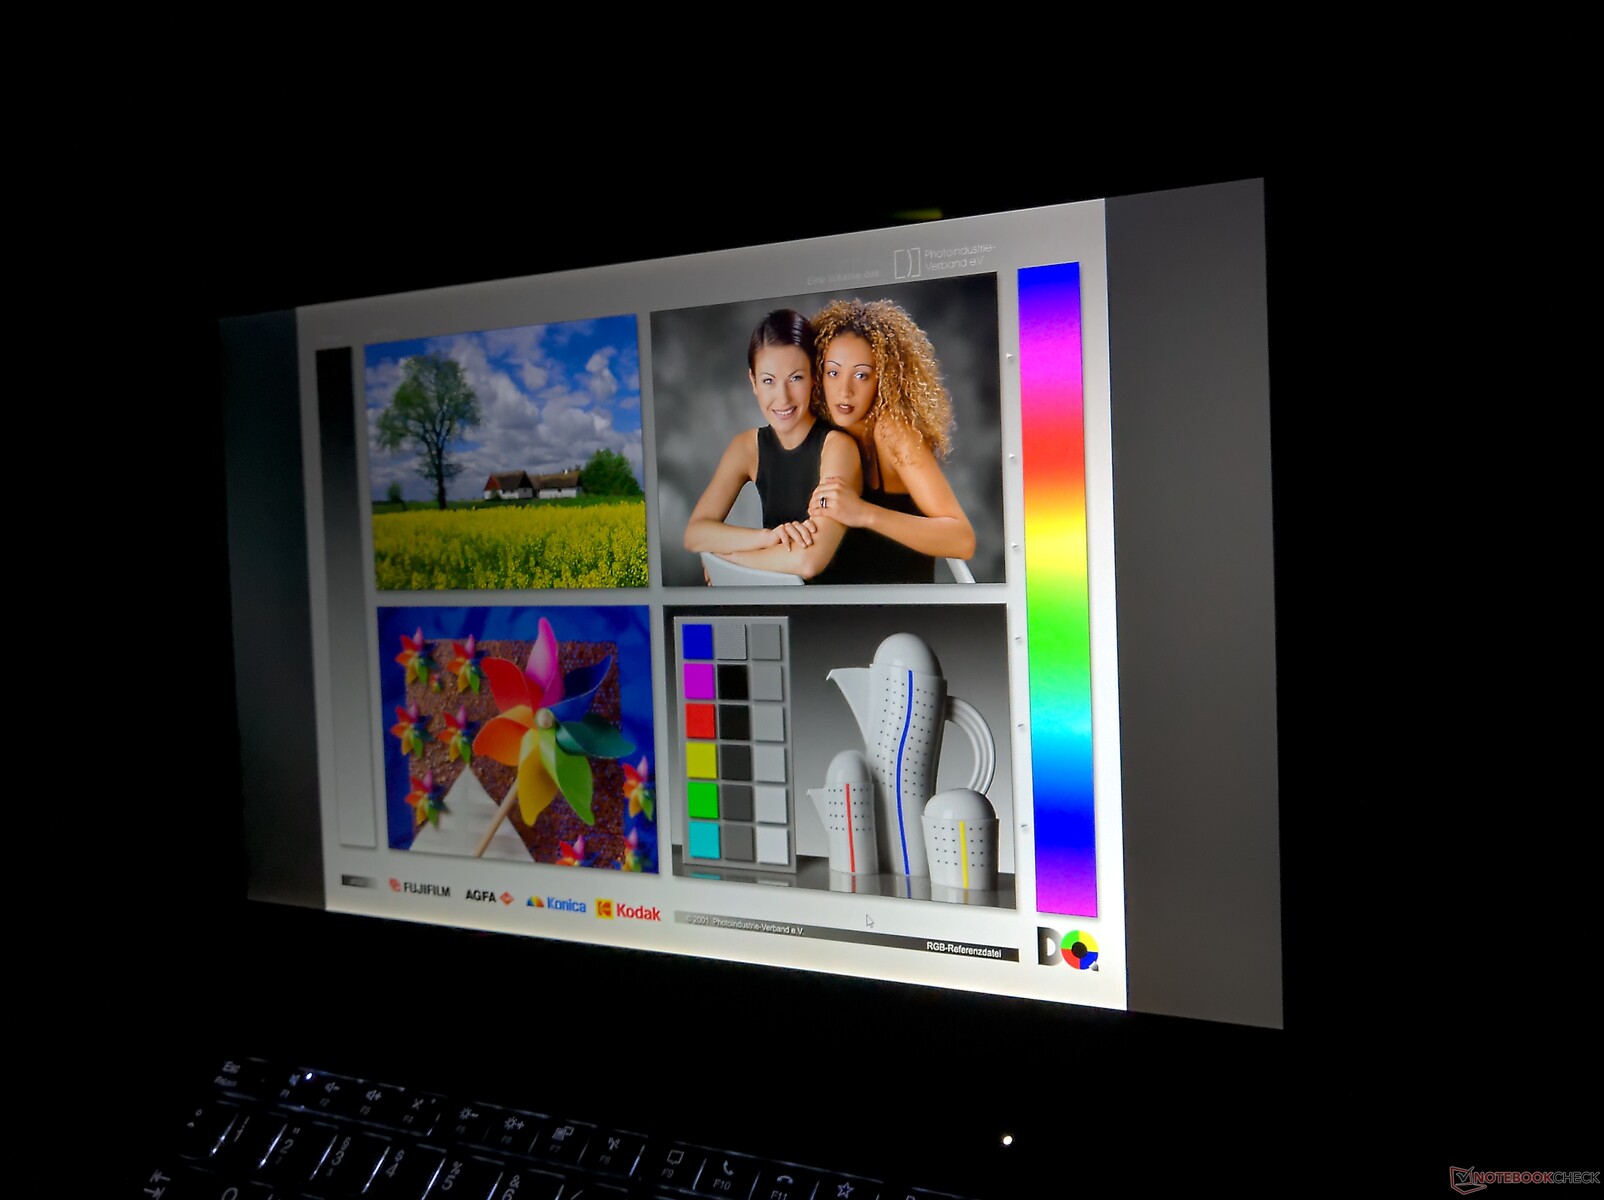
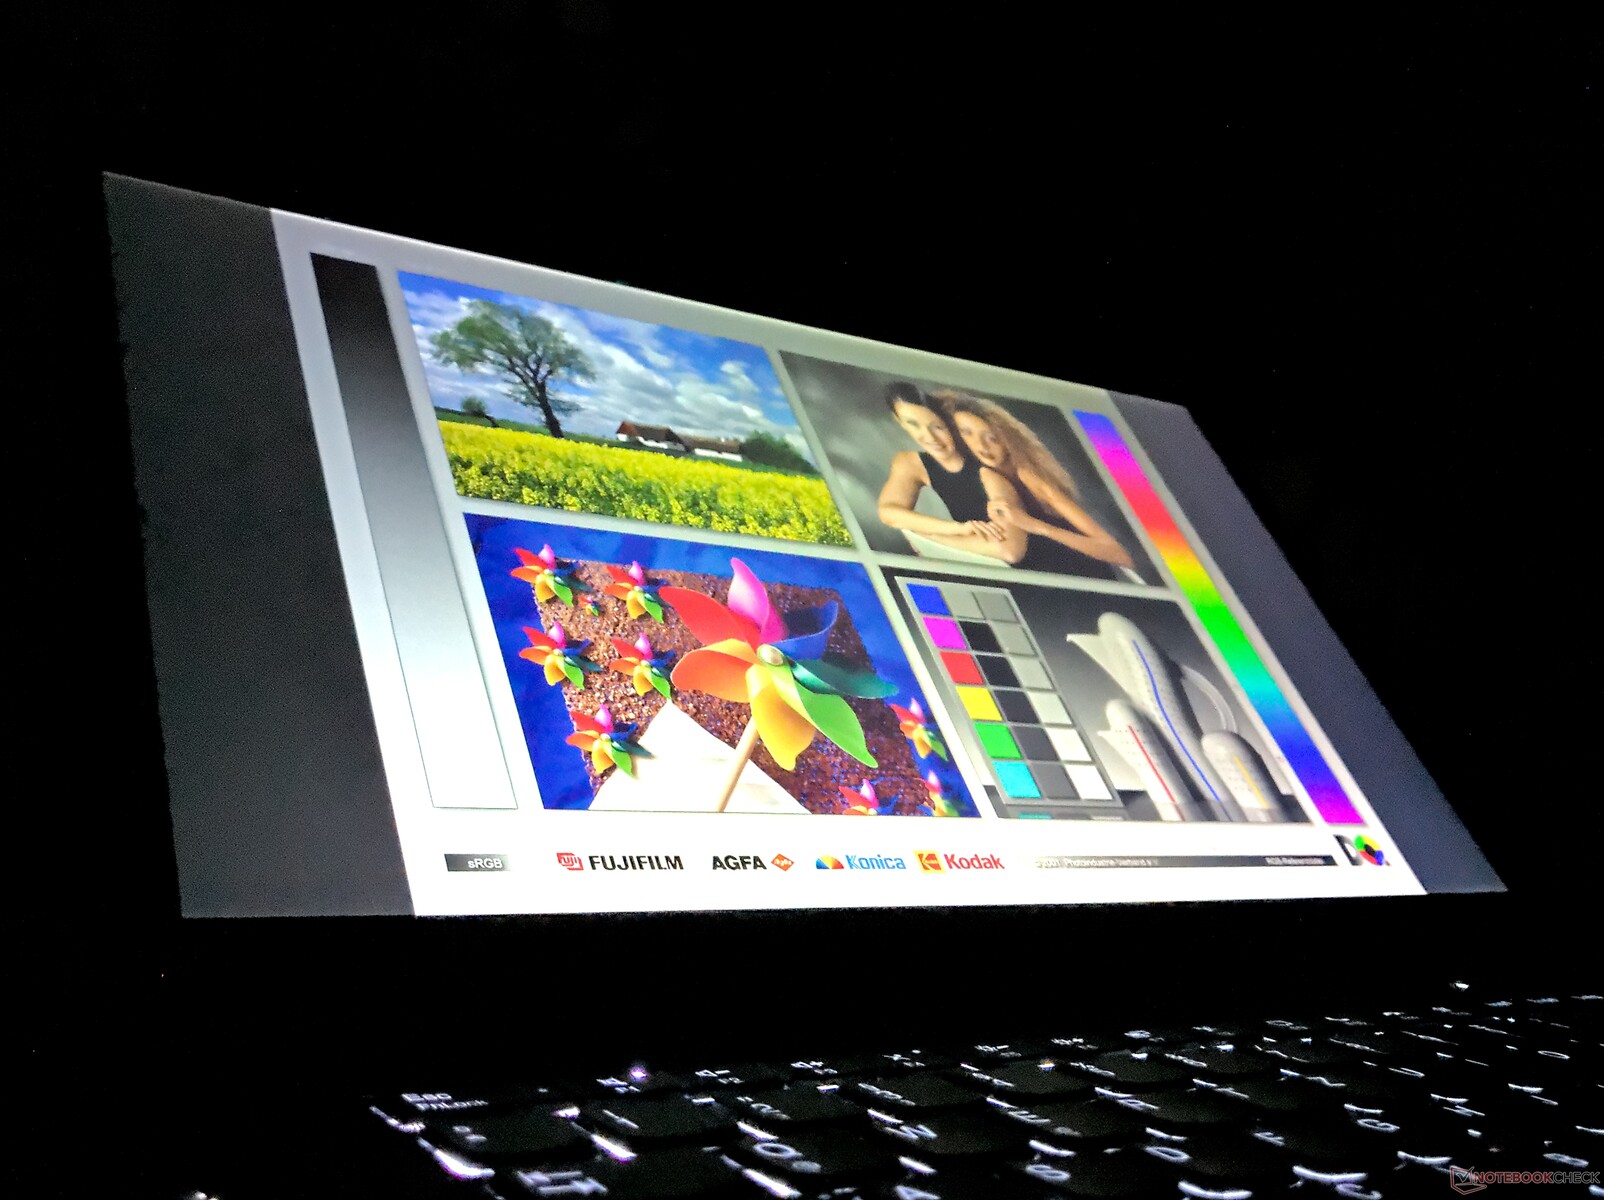
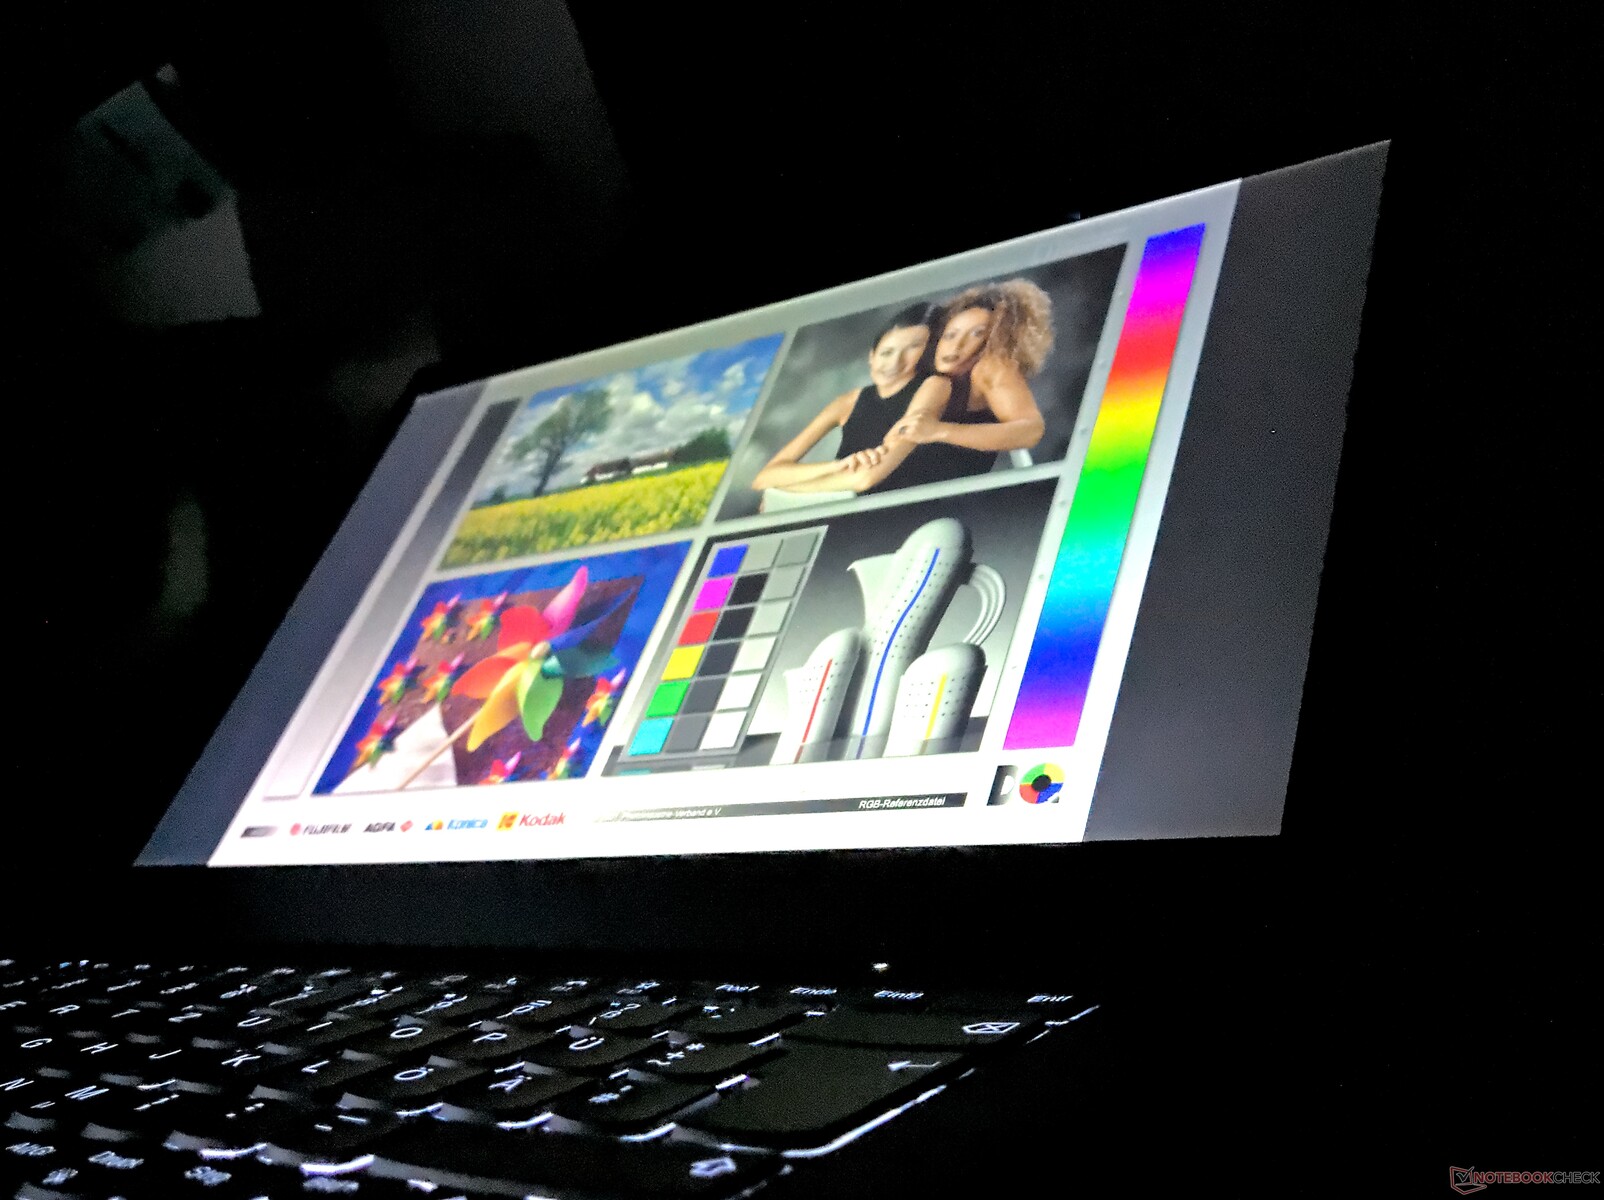
A tela construída em 14 polegadas é uma tela que não testamos em nenhuma outra variante do ThinkPad T14 ou do ThinkPad P14s: A tela de privacidade FHD, que tem um filtro ePrivacy integrado. Outras especificações incluem até 500 cd/m² de brilho, uma superfície fosca, tela tátil e tecnologia IPS.
Por esta razão, a comparação com a tela SureView da HP do ZBookFirefly 14 G7 é especialmente interessante. Essa tela brilha com 937 cd/m² em média. O Lenovo ThinkPad P14s, entretanto, não atinge o valor de brilho prometido. Ao invés disso, medimos 432 cd/m² em média. Isto significa que a tela ainda é mais brilhante do que a tela FHD de baixa potência do Intel P14s. Em contraste com este, o painel ePrivacy tem uma camada de toque na célula e diferente do HP SureView, o LCD ThinkPad PrivacyGuard não sofre de PWM
| |||||||||||||||||||||||||
iluminação: 88 %
iluminação com acumulador: 432 cd/m²
Contraste: 1593:1 (Preto: 0.27 cd/m²)
ΔE ColorChecker Calman: 2.2 | ∀{0.5-29.43 Ø4.71}
calibrated: 0.7
ΔE Greyscale Calman: 3.3 | ∀{0.09-98 Ø4.96}
98.5% sRGB (Argyll 1.6.3 3D)
63% AdobeRGB 1998 (Argyll 1.6.3 3D)
69.4% AdobeRGB 1998 (Argyll 3D)
98.5% sRGB (Argyll 3D)
67.3% Display P3 (Argyll 3D)
Gamma: 2.21
CCT: 6056 K
| Lenovo ThinkPad P14s Gen1-20Y10002GE N140HCR-GL2, a-Si IPS LED, 1920x1080, 14" | Lenovo ThinkPad P14s Gen1 20S40009GE B140HAN05.7, LTPS IPS LED, 1920x1080, 14" | HP ZBook Firefly 14 G7 InfoVision IVO8C78 (X140NVFC R0), IPS, 1920x1080, 14" | Lenovo ThinkPad X1 Extreme Gen3-20TLS0UV00 N156HCE-GN1, IPS, 1920x1080, 15.6" | |
|---|---|---|---|---|
| Display | -3% | 7% | -9% | |
| Display P3 Coverage (%) | 67.3 | 65.5 -3% | 73.8 10% | 61 -9% |
| sRGB Coverage (%) | 98.5 | 96.6 -2% | 99 1% | 89.9 -9% |
| AdobeRGB 1998 Coverage (%) | 69.4 | 66.7 -4% | 75.5 9% | 62.2 -10% |
| Response Times | -45% | -62% | 10% | |
| Response Time Grey 50% / Grey 80% * (ms) | 38.4 ? | 64 ? -67% | 54.8 ? -43% | 33.6 ? 12% |
| Response Time Black / White * (ms) | 24 ? | 29.6 ? -23% | 43.2 ? -80% | 22.4 ? 7% |
| PWM Frequency (Hz) | 284.1 ? | 26040 ? | ||
| Screen | -24% | -21% | -9% | |
| Brightness middle (cd/m²) | 430 | 386 -10% | 934 117% | 518 20% |
| Brightness (cd/m²) | 432 | 379 -12% | 937 117% | 513 19% |
| Brightness Distribution (%) | 88 | 88 0% | 87 -1% | 88 0% |
| Black Level * (cd/m²) | 0.27 | 0.19 30% | 0.37 -37% | 0.38 -41% |
| Contrast (:1) | 1593 | 2032 28% | 2524 58% | 1363 -14% |
| Colorchecker dE 2000 * | 2.2 | 4.4 -100% | 4.7 -114% | 2.1 5% |
| Colorchecker dE 2000 max. * | 4.4 | 7.2 -64% | 10.5 -139% | 4.5 -2% |
| Colorchecker dE 2000 calibrated * | 0.7 | 1.2 -71% | 1.6 -129% | 1.3 -86% |
| Greyscale dE 2000 * | 3.3 | 5.1 -55% | 7.1 -115% | 2.7 18% |
| Gamma | 2.21 100% | 2.5 88% | 2.31 95% | 2.35 94% |
| CCT | 6056 107% | 7464 87% | 6348 102% | 7042 92% |
| Color Space (Percent of AdobeRGB 1998) (%) | 63 | 61.2 -3% | 68.5 9% | 57.7 -8% |
| Color Space (Percent of sRGB) (%) | 98.5 | 96.4 -2% | 98.9 0% | 90.4 -8% |
| Média Total (Programa/Configurações) | -24% /
-22% | -25% /
-21% | -3% /
-7% |
* ... menor é melhor
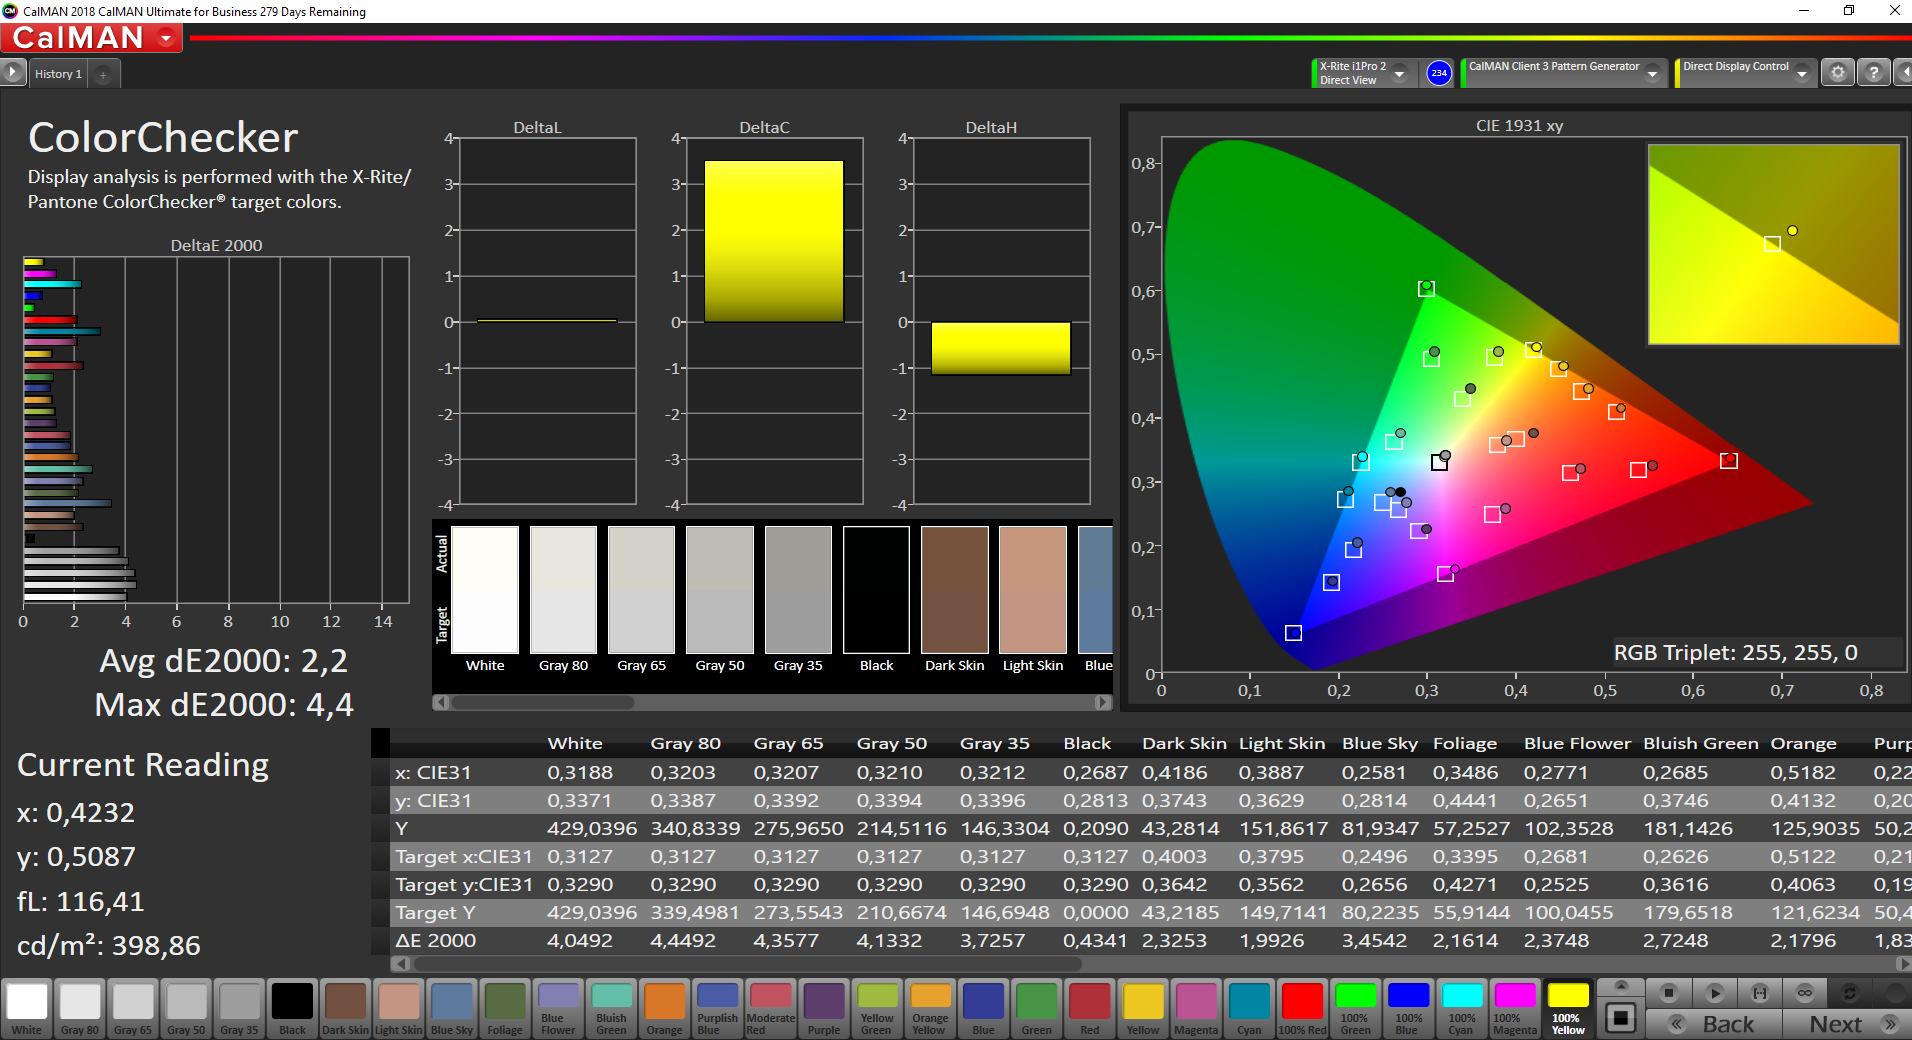
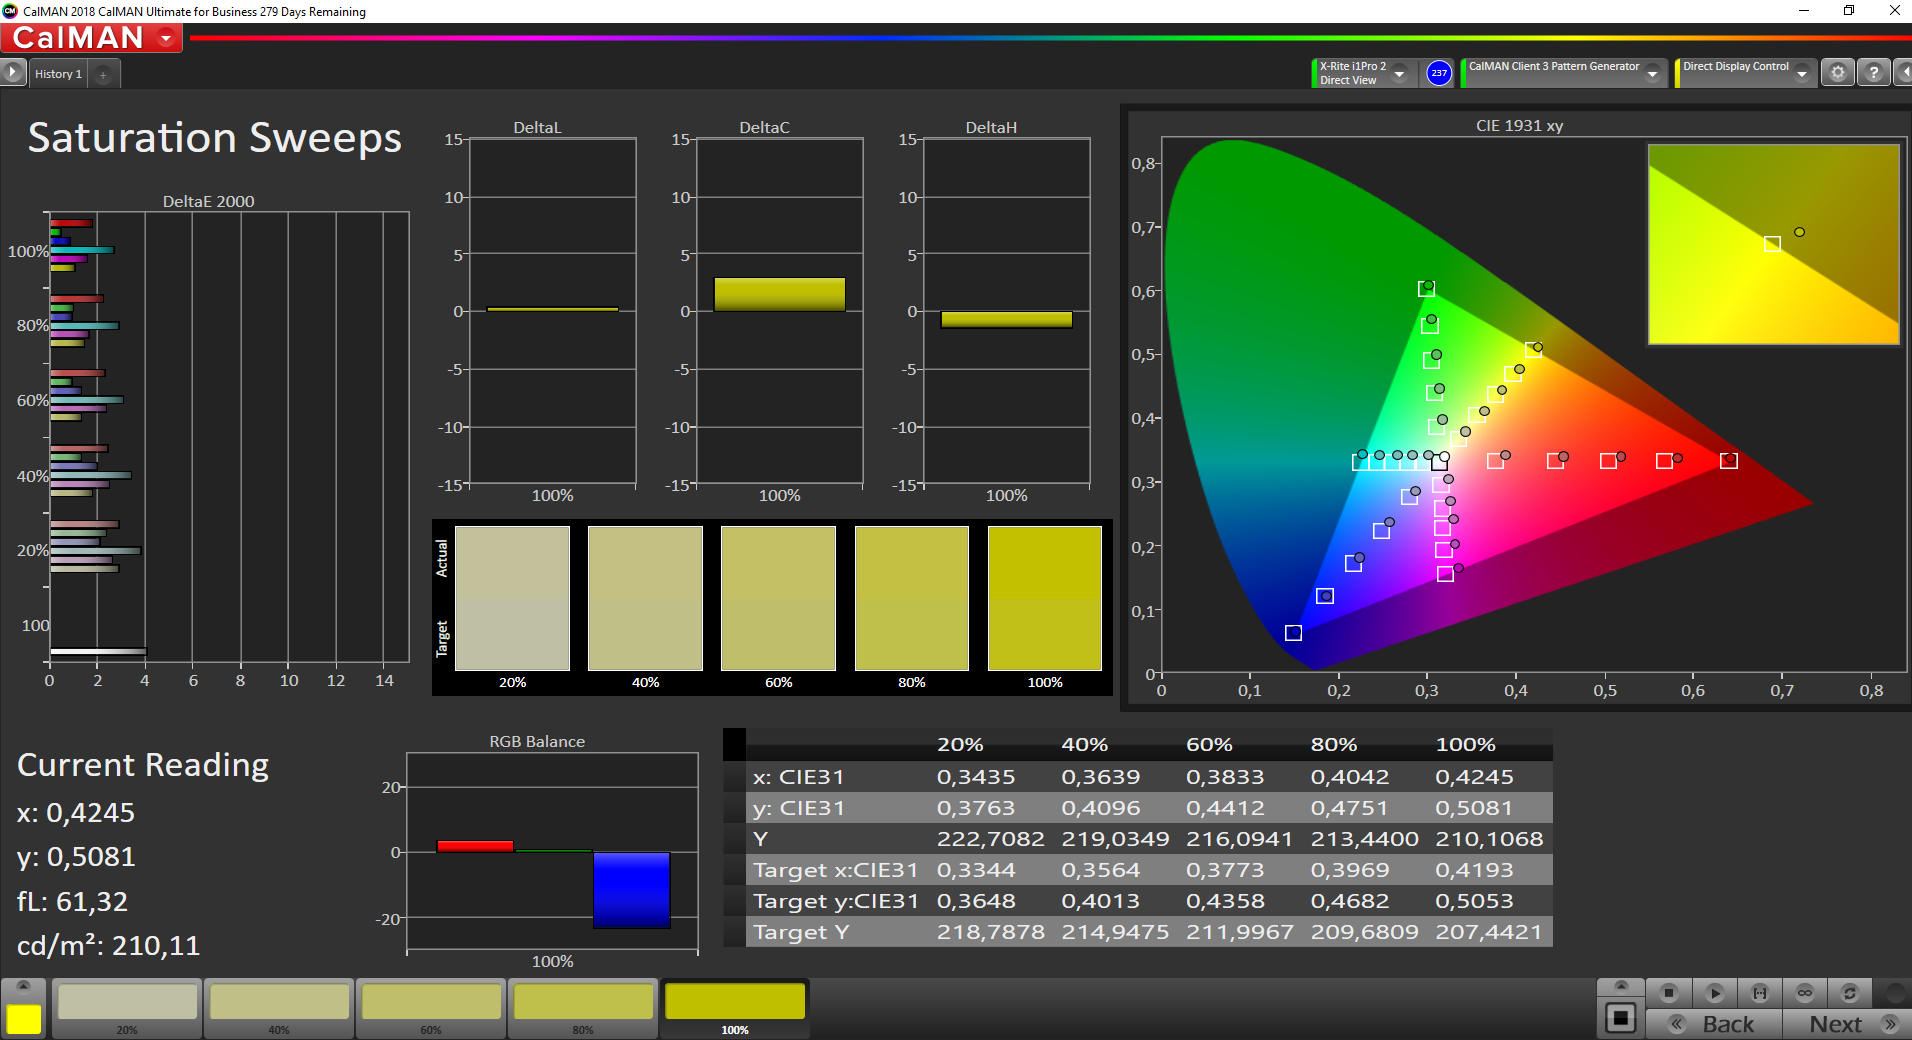
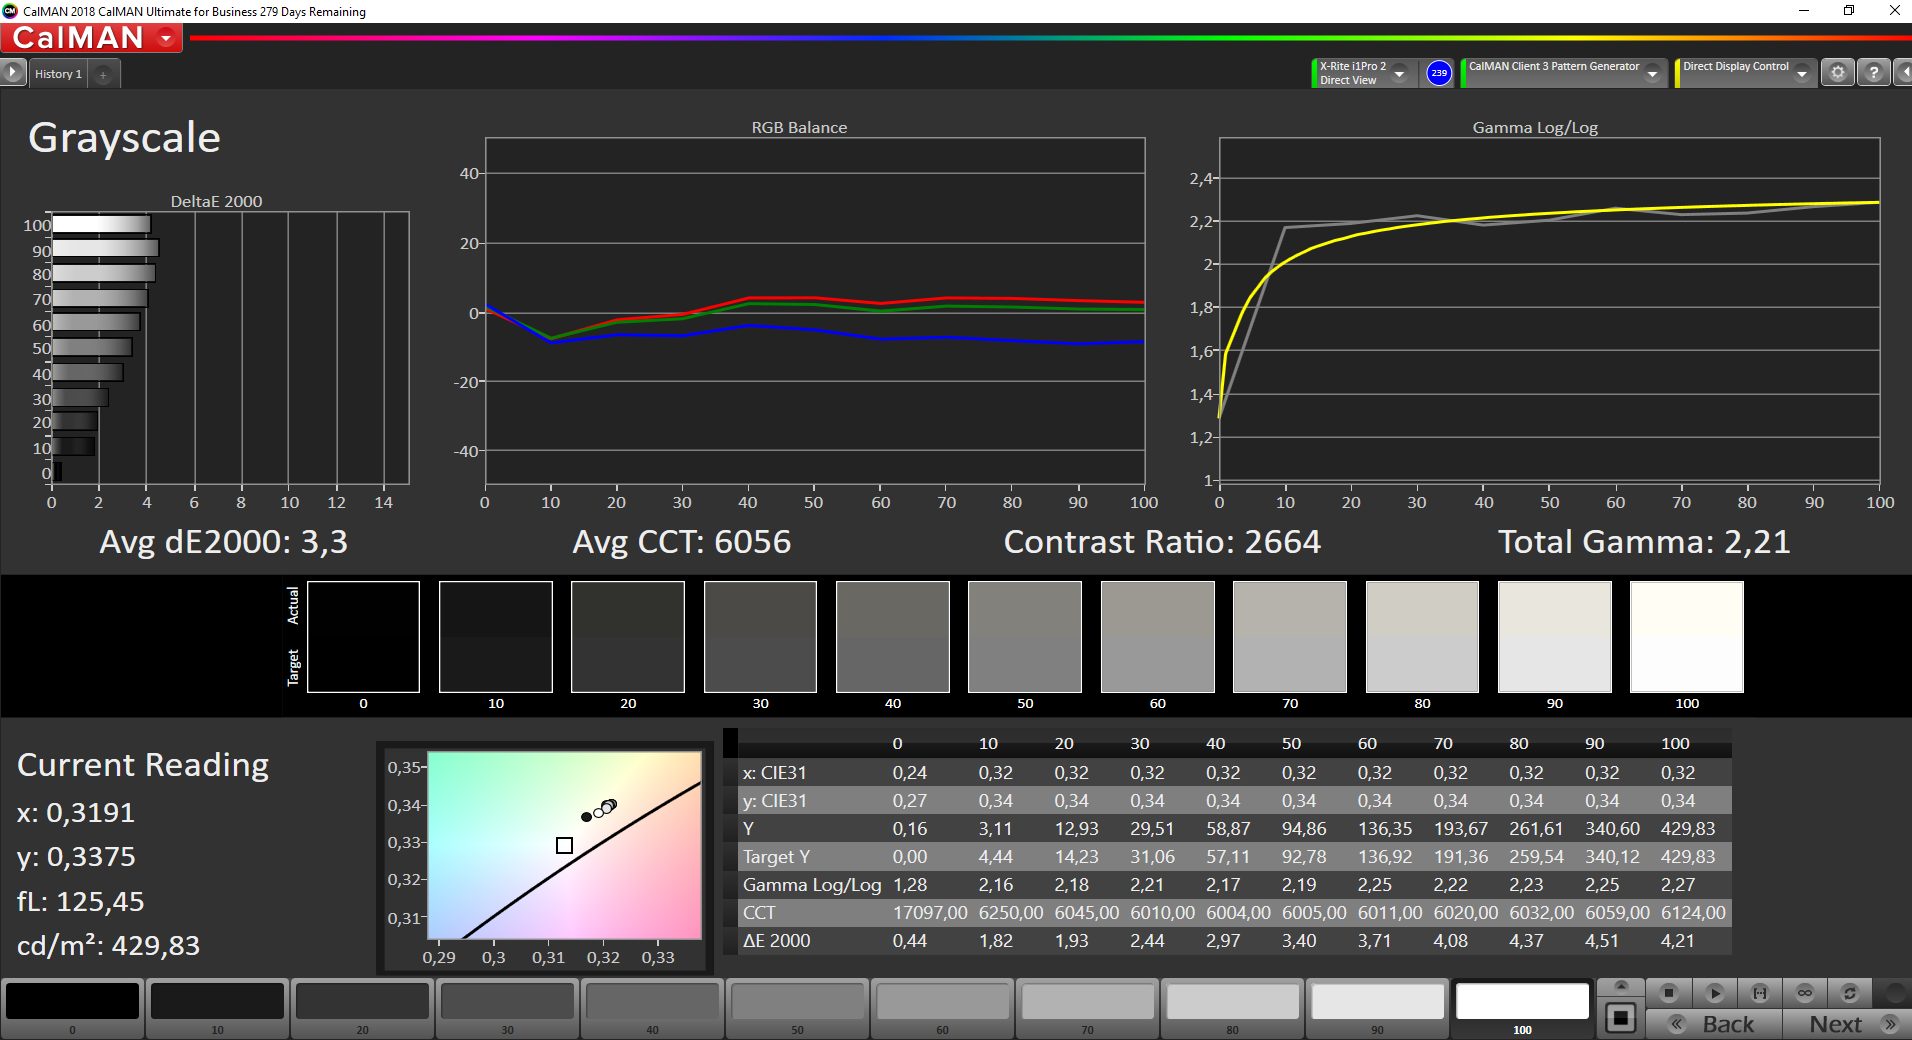
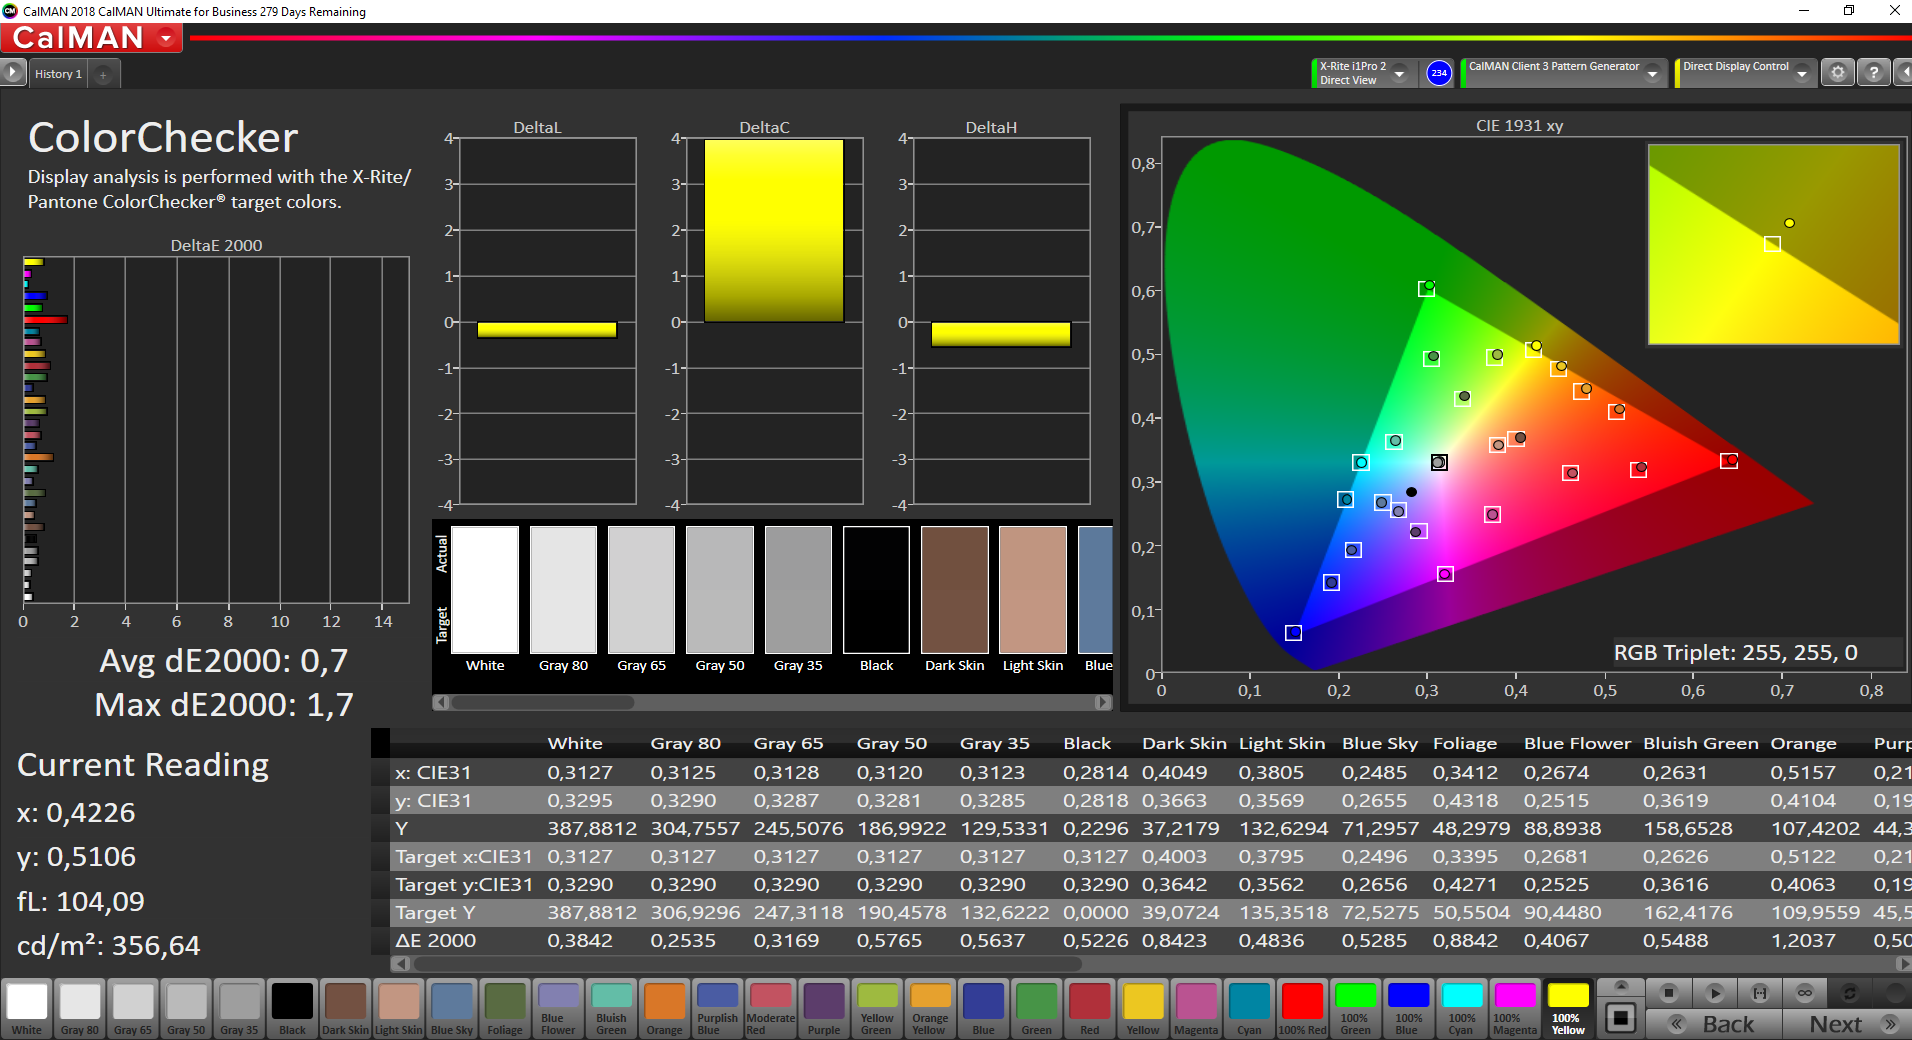
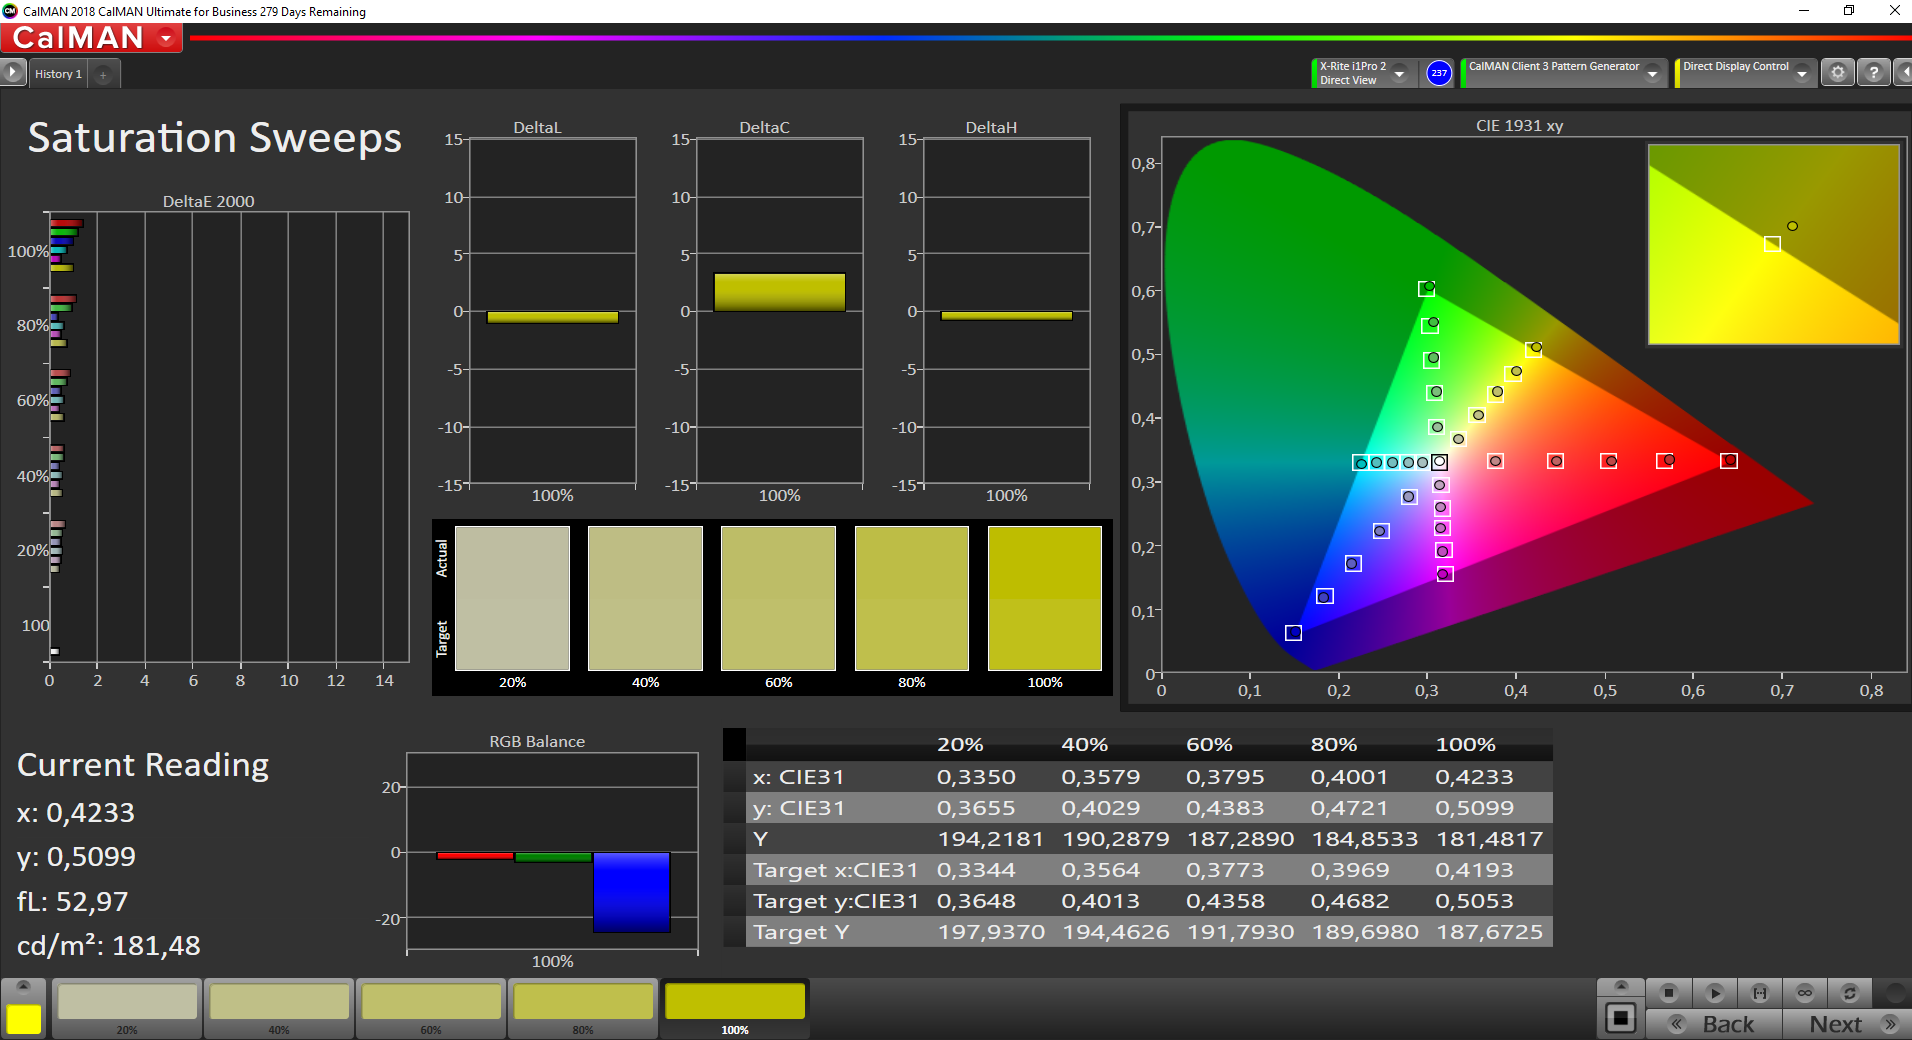
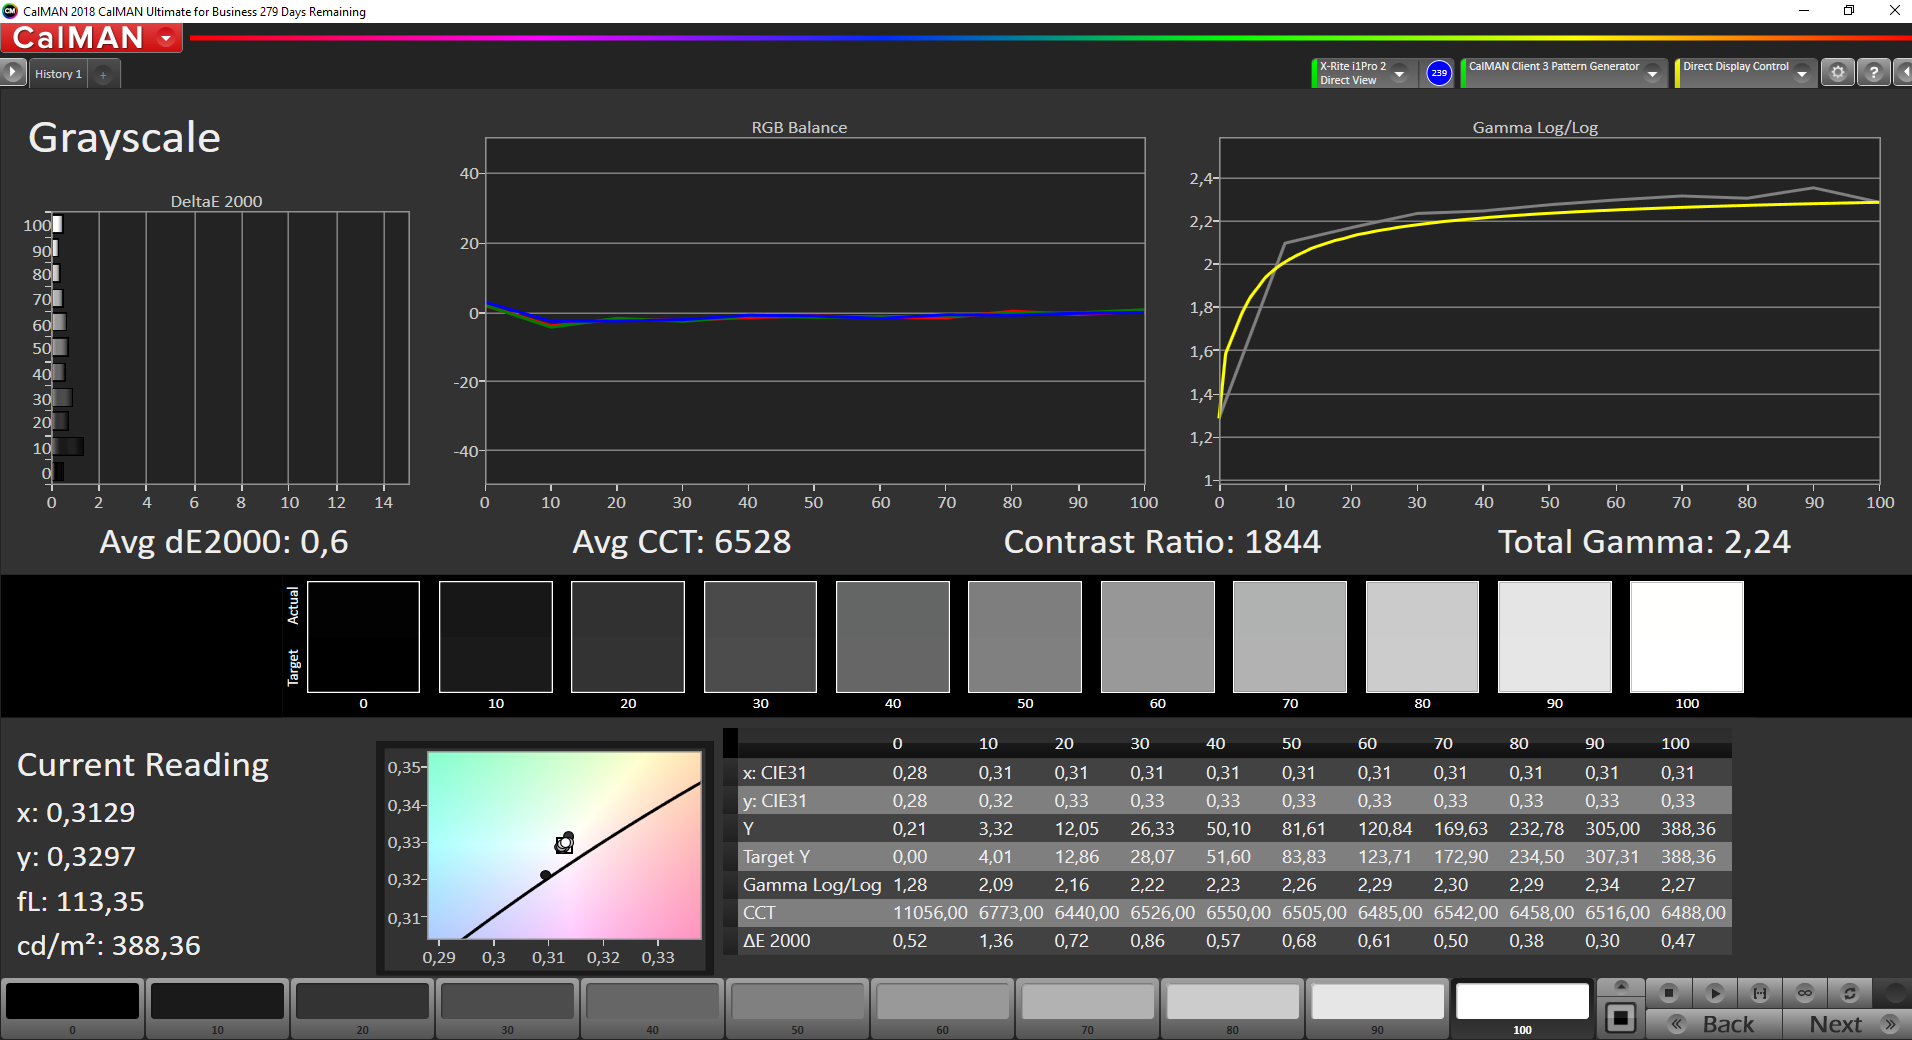
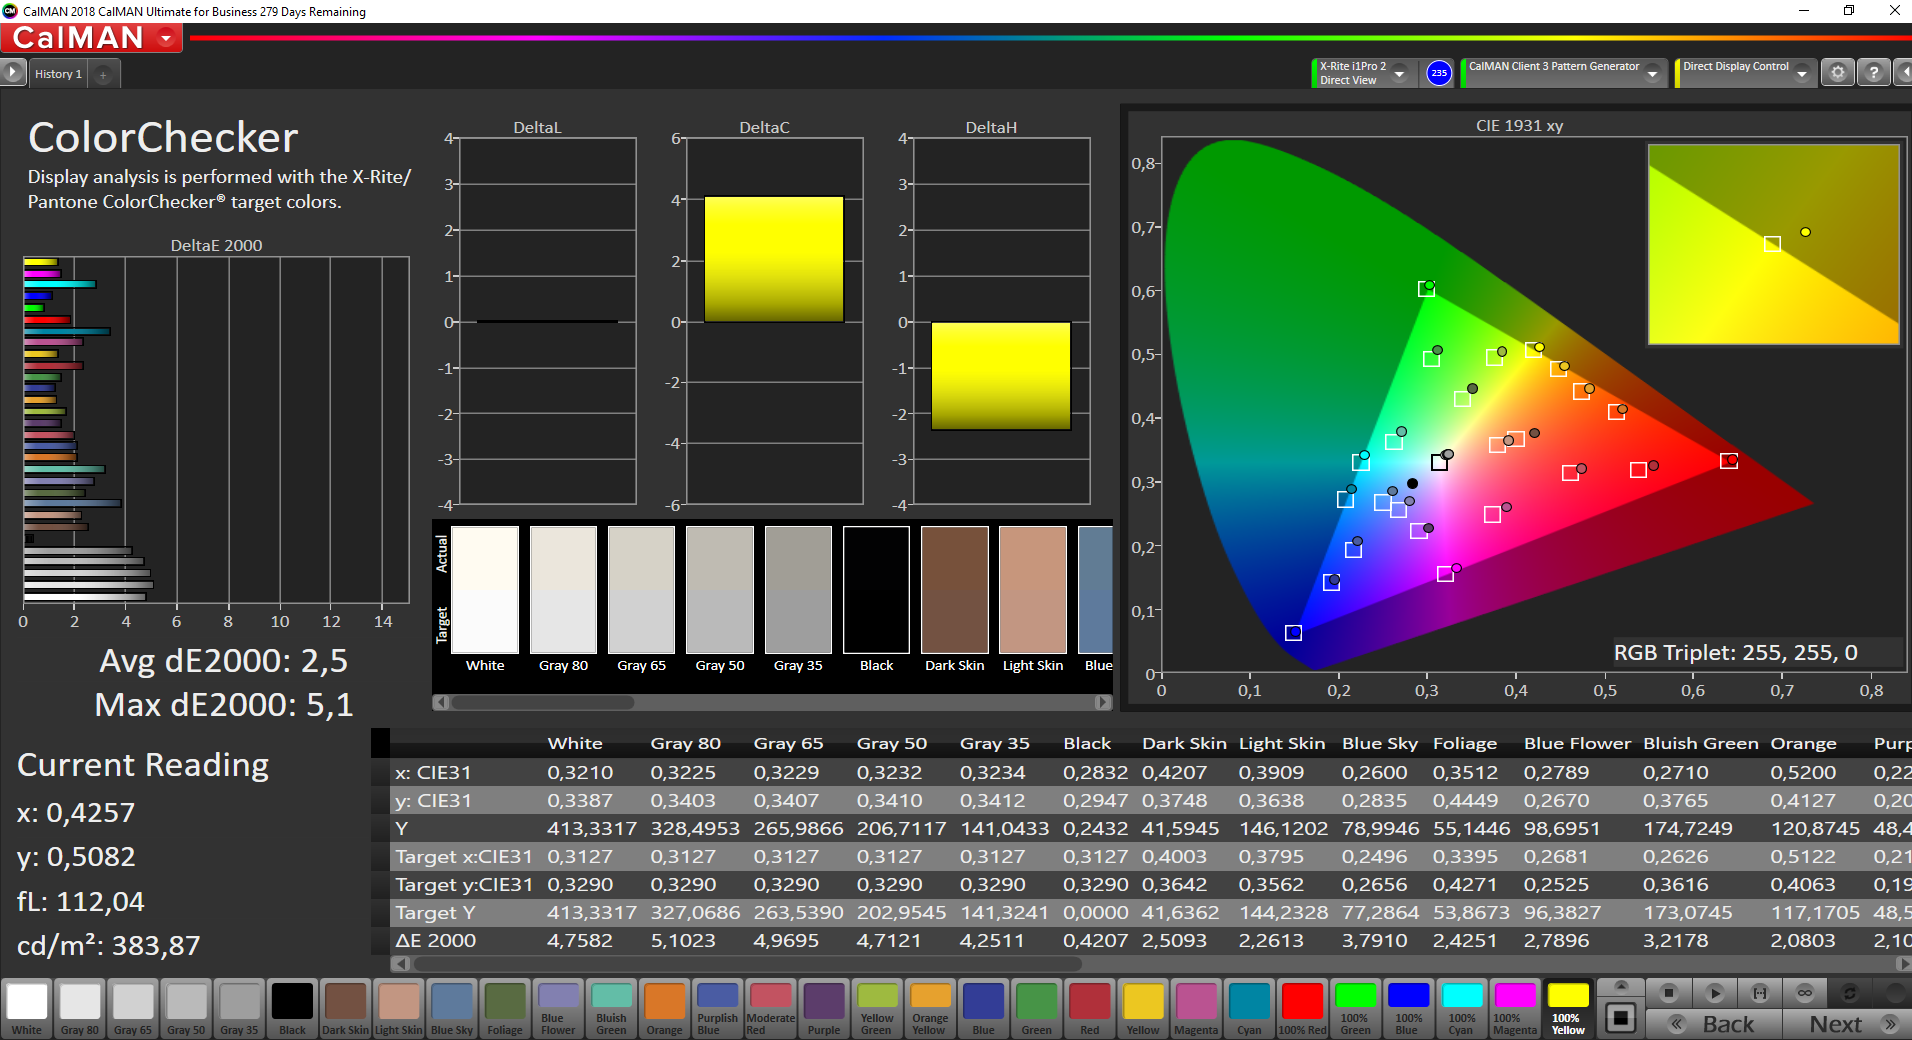


Ex-fábrica, as cores são exibidas muito quentes, que medimos com o calibrador de cores X-Rite i1 Pro 2 e o software CalMan. Com a calibração, as cores eram quase ideais, embora isto não fosse verdade para o modo de privacidade. Em termos de contraste, o painel de privacidade Lenovo ThinkPad P14s não pode competir com o LCD SureView do HP ZBook Firefly 14 G7. Isto é devido à extrema diferença de brilho - o nível de preto do ThinkPad é na verdade mais baixo
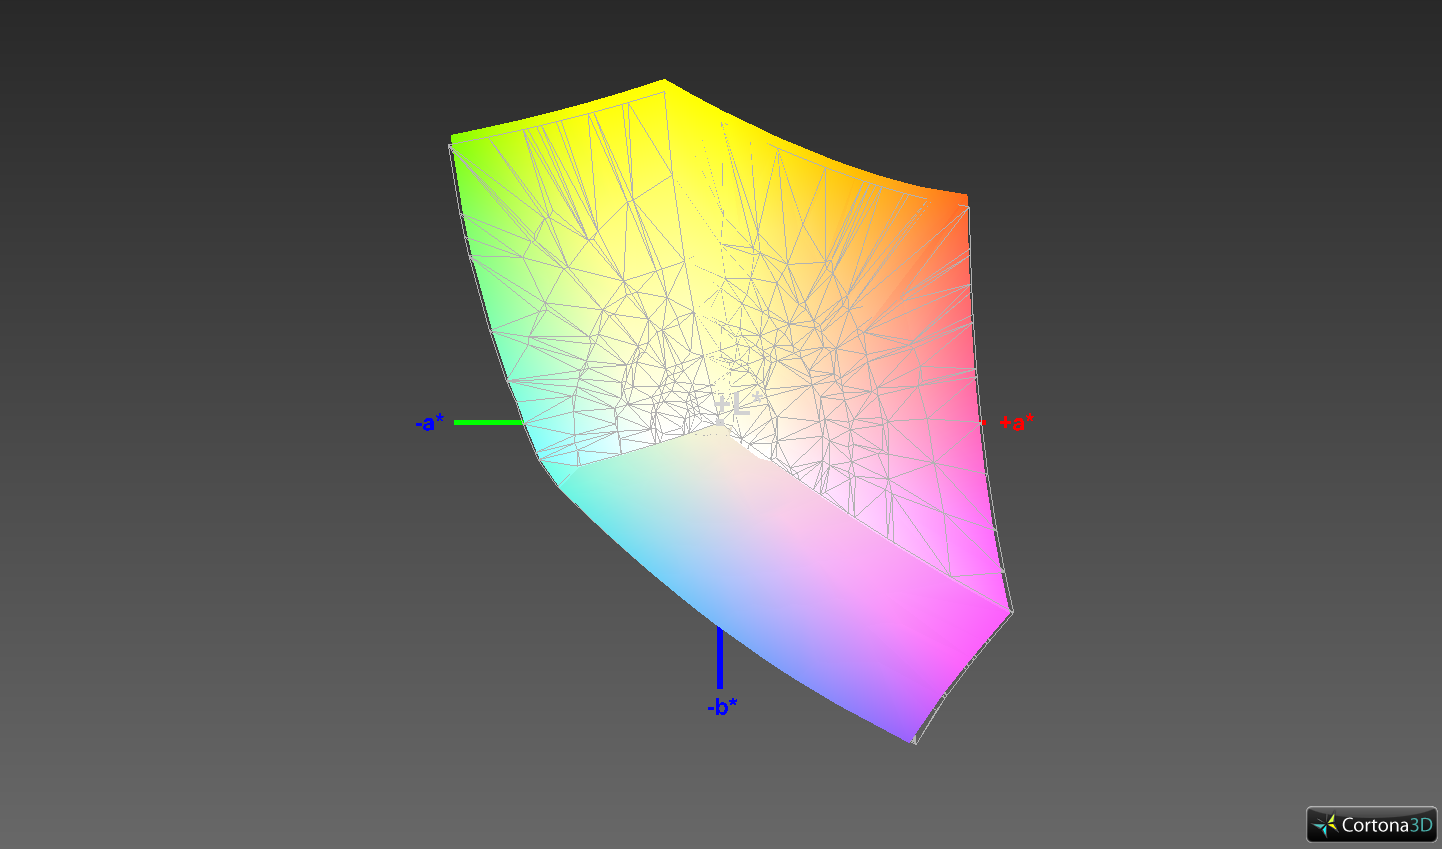
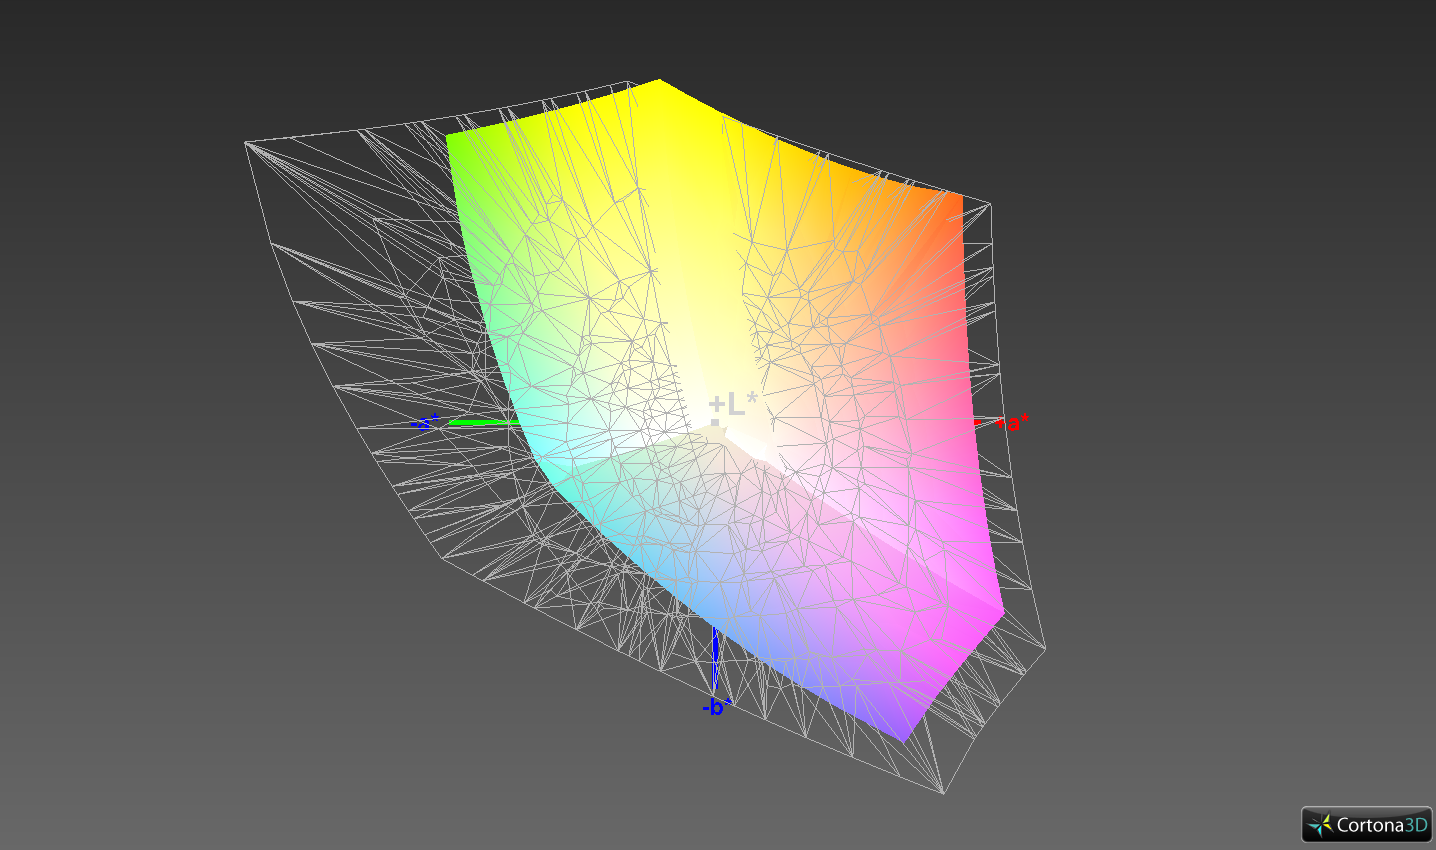
A gama de cores do sRGB é coberta por cerca de 98,5%. Isto significa que a tela pode ser usada para edição de fotos semi-profissionais
A tela do laptop Lenovo pode ser usada ao ar livre, desde que seja evitada a luz direta do sol. Isto é devido à superfície fosca e ao bom brilho
Exibir tempos de resposta
| ↔ Tempo de resposta preto para branco | ||
|---|---|---|
| 24 ms ... ascensão ↗ e queda ↘ combinadas | ↗ 13.2 ms ascensão | 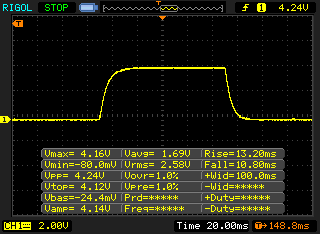 |
| ↘ 10.8 ms queda | ||
| A tela mostra boas taxas de resposta em nossos testes, mas pode ser muito lenta para jogadores competitivos. Em comparação, todos os dispositivos testados variam de 0.1 (mínimo) a 240 (máximo) ms. » 54 % de todos os dispositivos são melhores. Isso significa que o tempo de resposta medido é pior que a média de todos os dispositivos testados (19.8 ms). | ||
| ↔ Tempo de resposta 50% cinza a 80% cinza | ||
| 38.4 ms ... ascensão ↗ e queda ↘ combinadas | ↗ 20.4 ms ascensão | 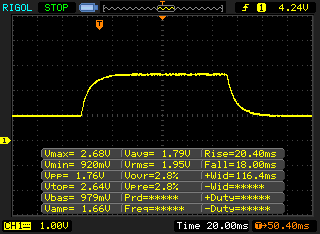 |
| ↘ 18 ms queda | ||
| A tela mostra taxas de resposta lentas em nossos testes e será insatisfatória para os jogadores. Em comparação, todos os dispositivos testados variam de 0.165 (mínimo) a 636 (máximo) ms. » 58 % de todos os dispositivos são melhores. Isso significa que o tempo de resposta medido é pior que a média de todos os dispositivos testados (31 ms). | ||
Cintilação da tela / PWM (modulação por largura de pulso)
| Tela tremeluzindo / PWM não detectado | 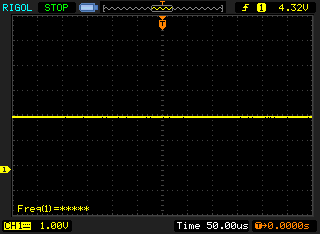 | ||
[pwm_comparison] Em comparação: 52 % de todos os dispositivos testados não usam PWM para escurecer a tela. Se PWM foi detectado, uma média de 7754 (mínimo: 5 - máximo: 343500) Hz foi medida. | |||
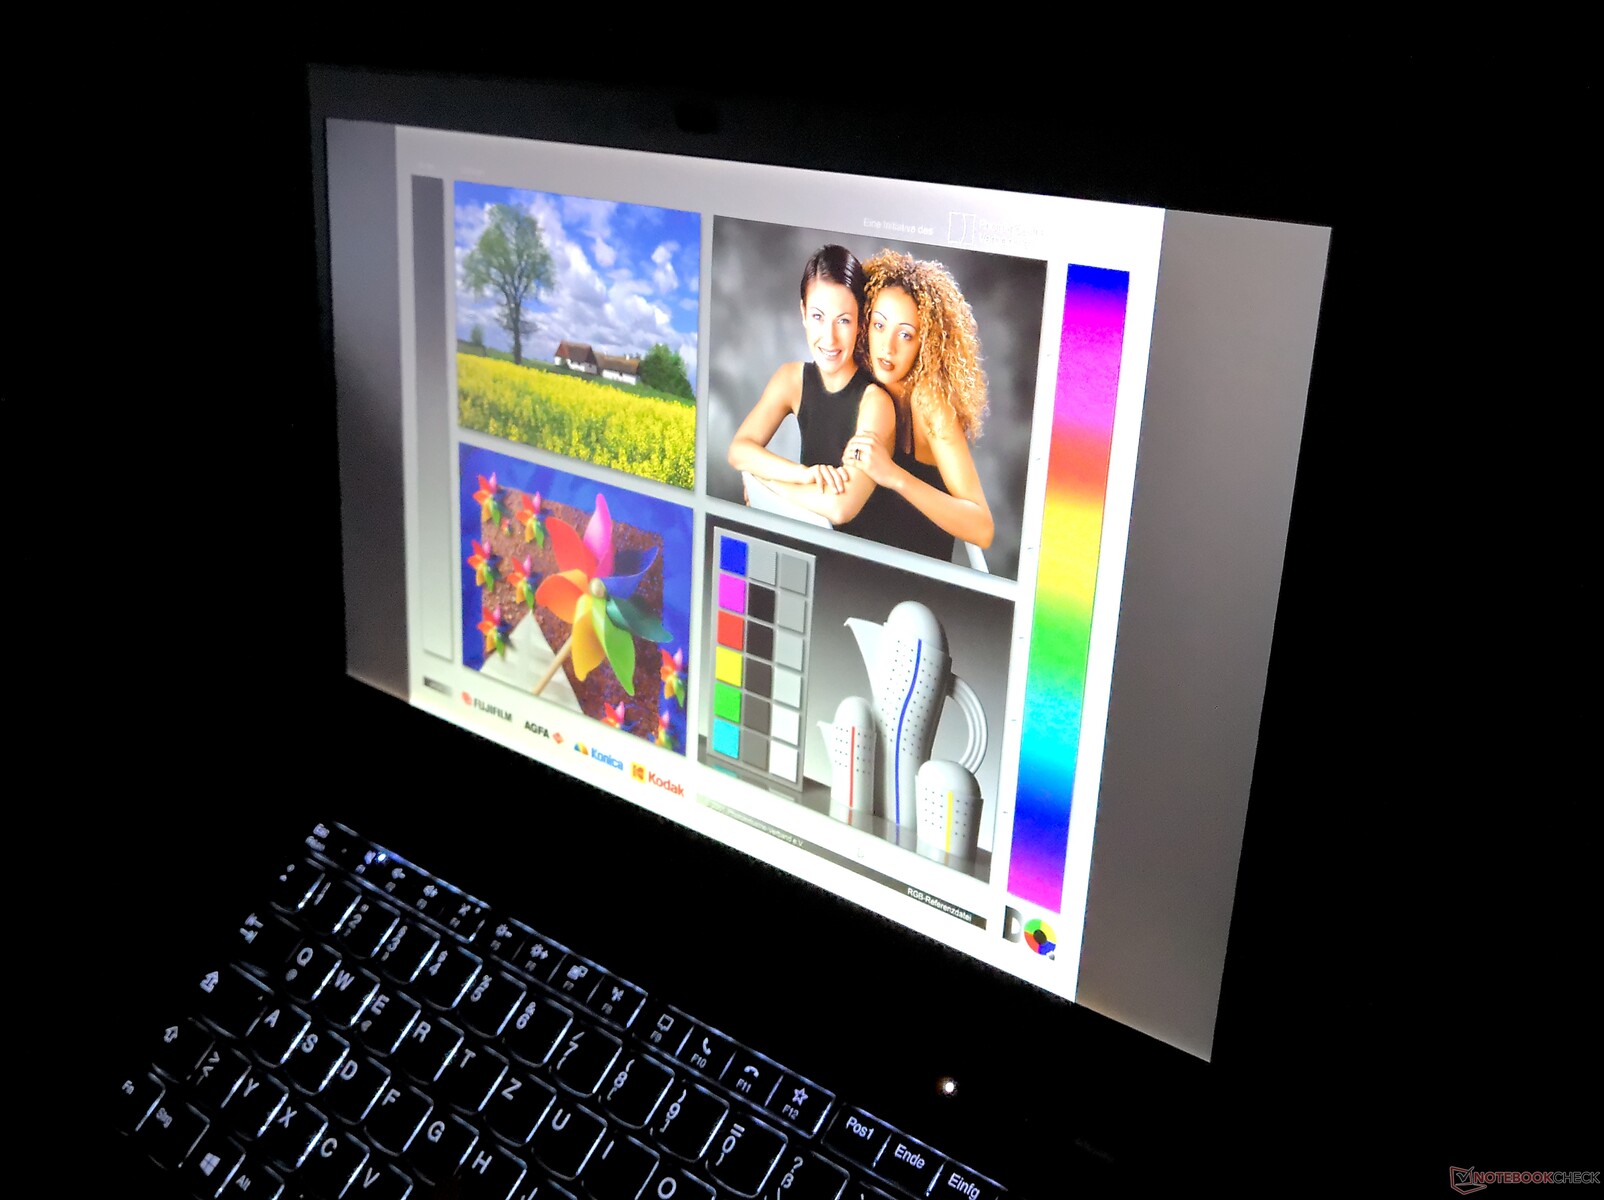
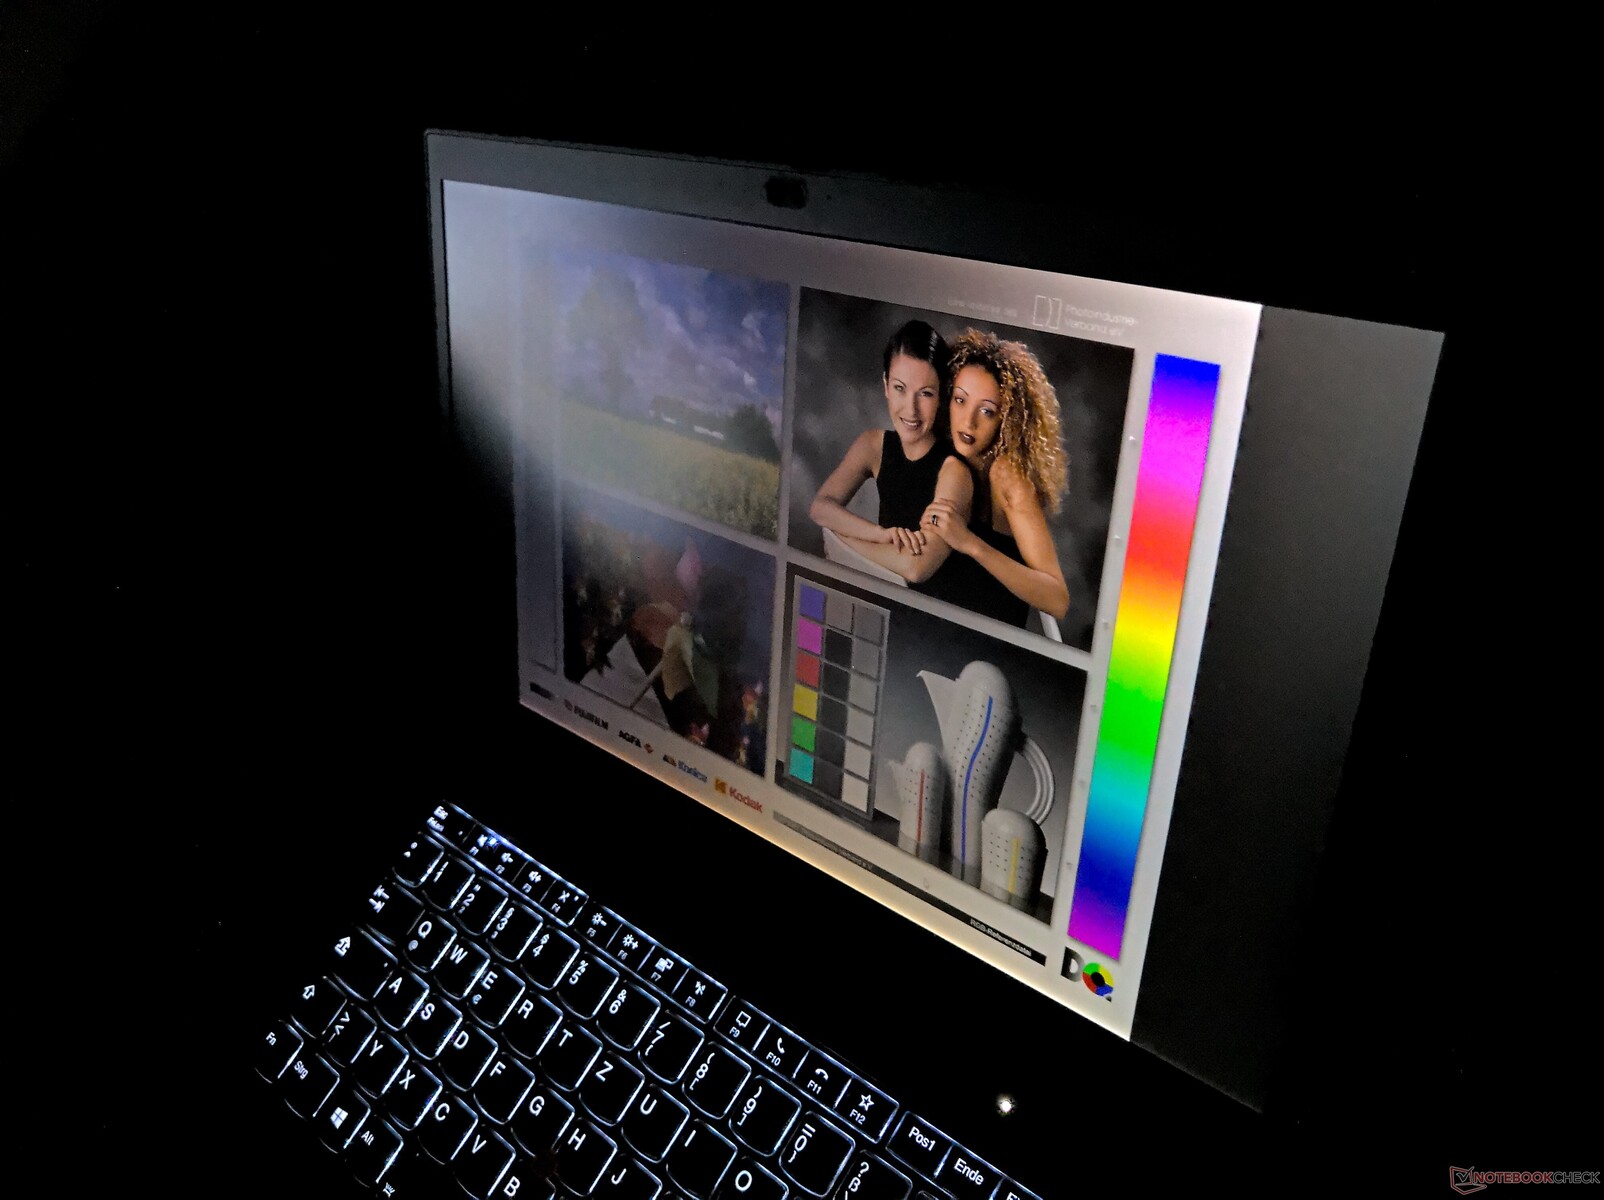
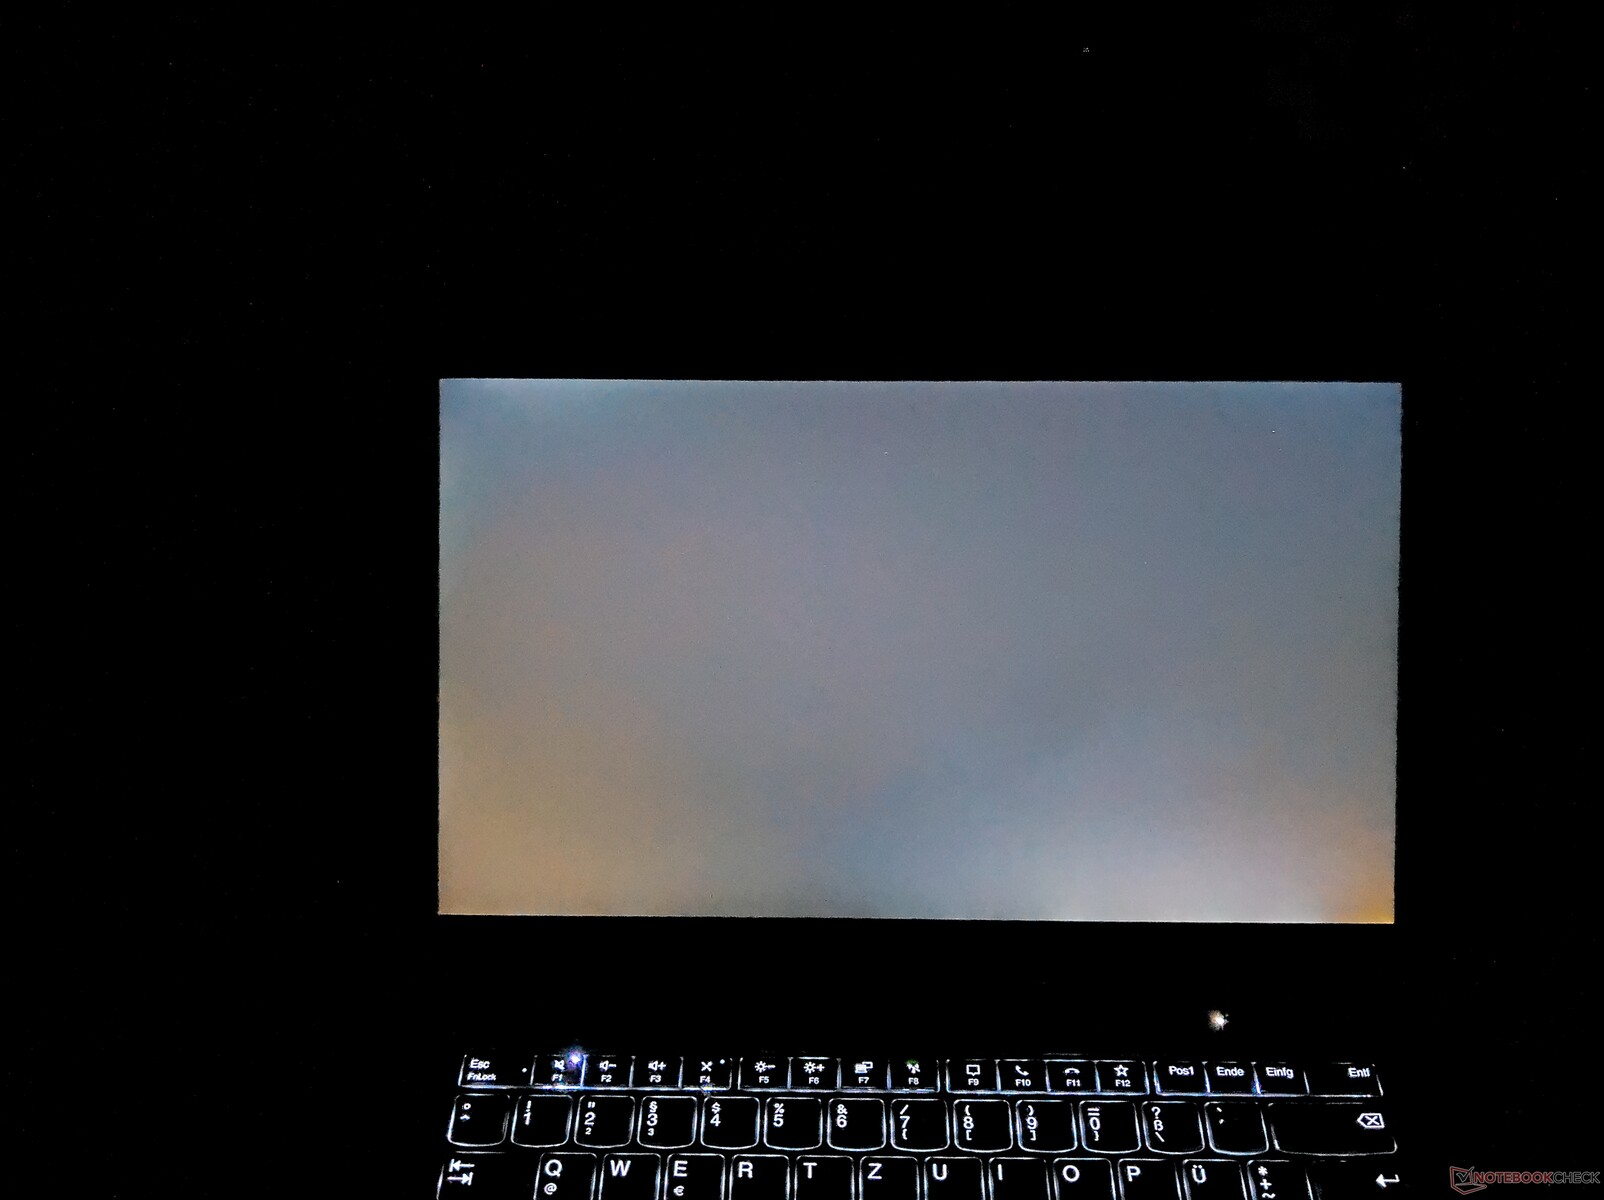
A característica central do LCD do PrivacyGuard é o modo de privacidade. Ativado via FN + D, ele reduz consideravelmente a visibilidade lateral, diminuindo o brilho. Deve-se notar que mesmo com o modo de privacidade desativado, a tela tem uma estabilidade de ângulo de visão pior do que outros LCDs IPS. Se o painel não for visto diretamente da frente, o brilho diminui visivelmente, especialmente no caso de conteúdo branco
Desempenho: AMD Ryzen 4000 alimenta o ThinkPad P14s
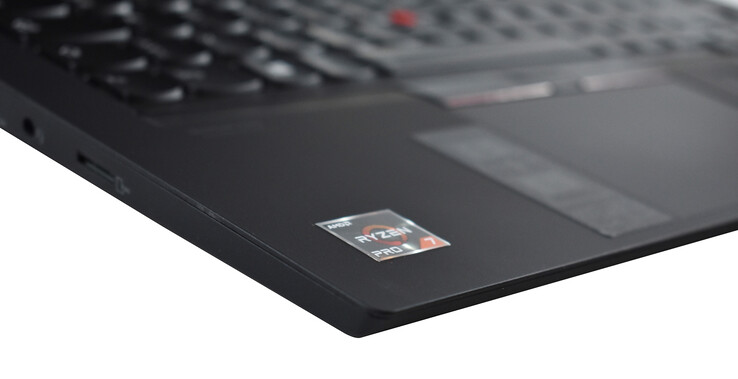
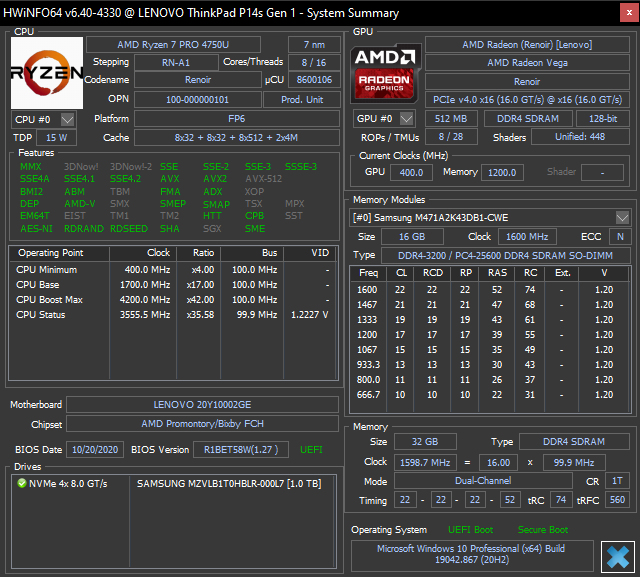
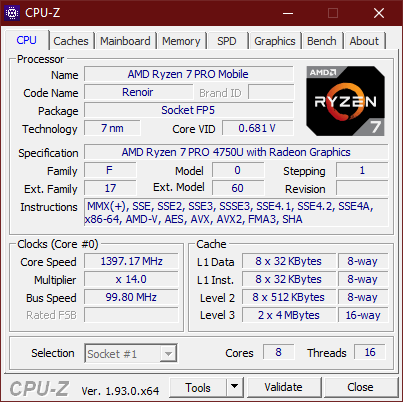
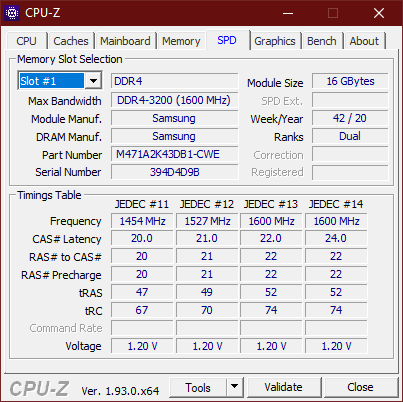
O Lenovo ThinkPad P14s Gen 1 AMD é vendido exclusivamente com o AMD Ryzen 7 Pro 4750U. Diferente do portátil ThinkPad P14s Gen 1 Intel, não há GPU Nvidia. Em vez disso, o AMD P14s AMD só utiliza o AMD Radeon RX Vega 7 integrado, que roda com drivers especiais "Pro". Esta é a razão pela qual ele é designado como "AMD Radeon Pro Graphics" na GPU-Z
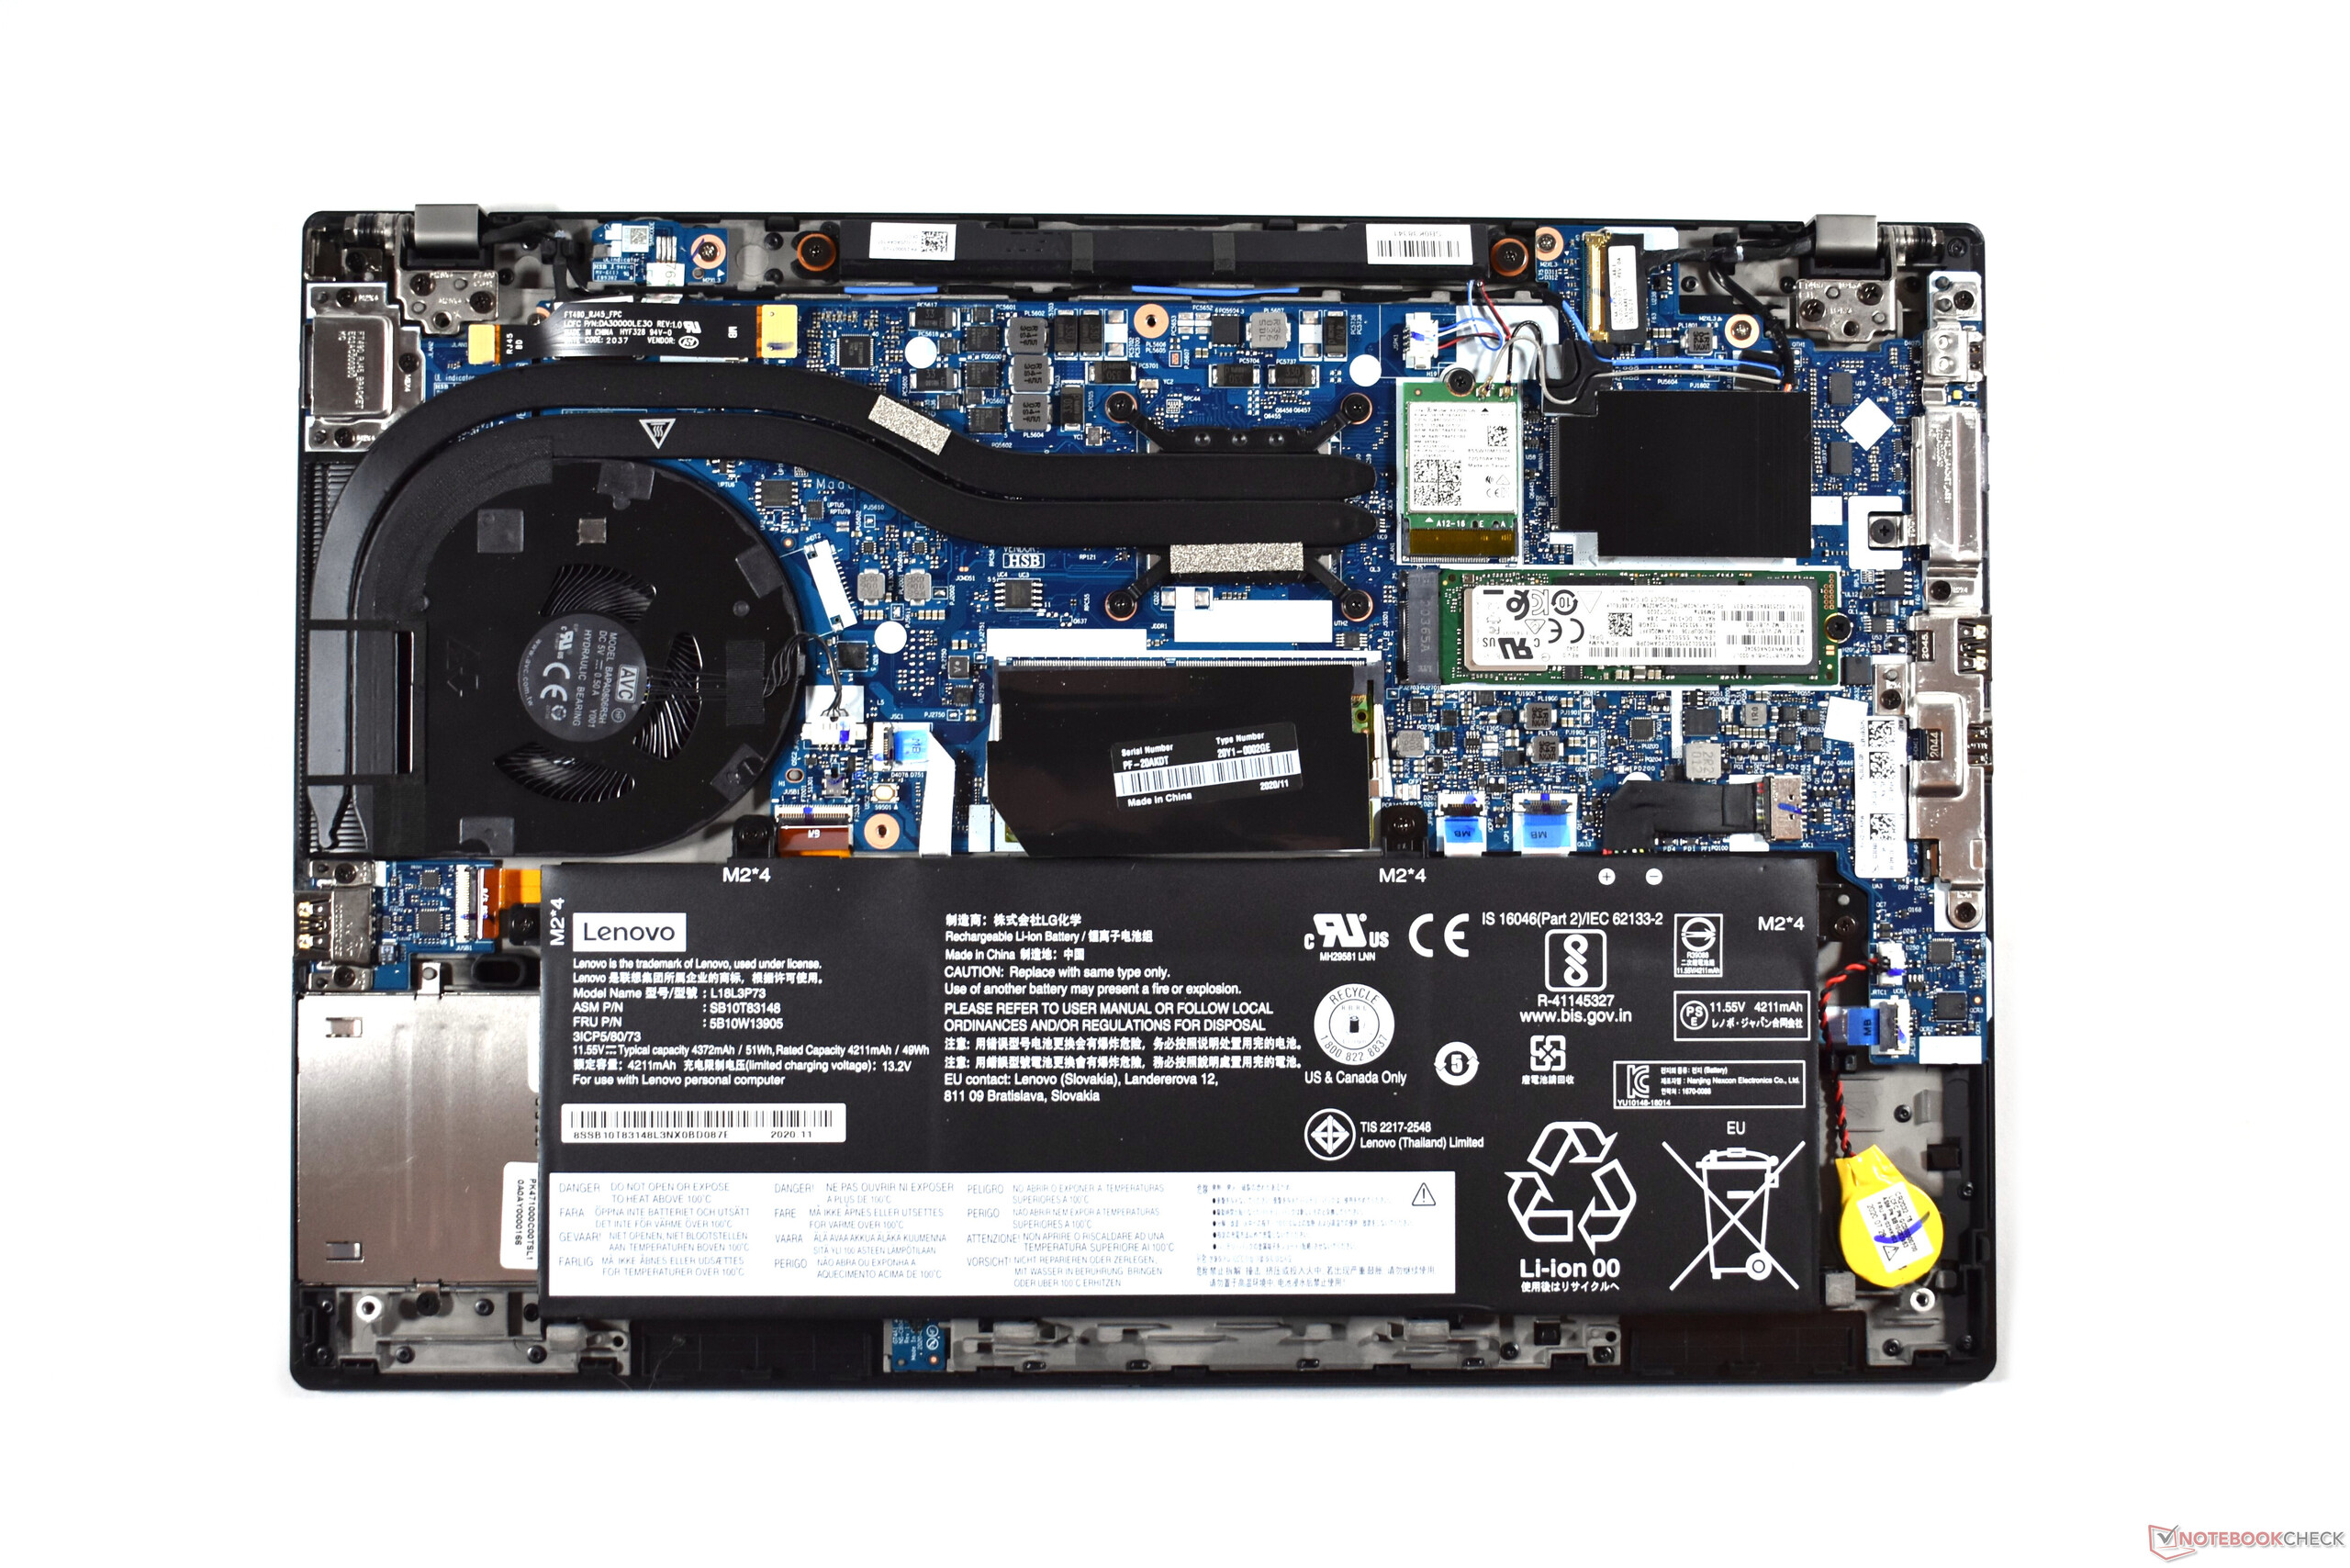
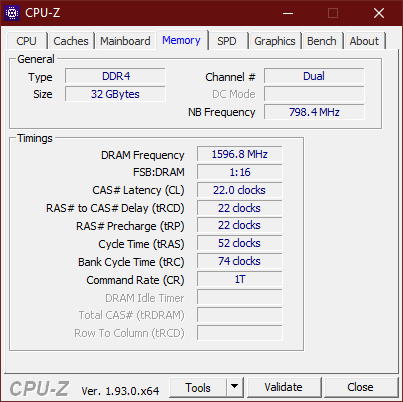
Existem até 48 GB DDR4-3200 RAM - isto só é possível em modelos com memória soldada de 16 GB, como nossa amostra de revisão. Outras variantes têm 8 GB a bordo, o que significa que são possíveis até 40 GB (um slot DIMM). Em termos de armazenamento, a Lenovo oferece um único SSD M.2 2280 com até 1 TB
Processador
O AMD Ryzen7 Pro 4750U é um processador Renoir com oito núcleos e 16 roscas com hyperthreading. O TDP deste chip fica a 15 W, com taxas de relógio de 1,6 a 4,1 GHz. Comparações de referência abrangentes com outras CPUs são habilitadas através de nossa lista de comparação de CPU.
No teste Cinebench multicore, a CPU pode consumir 22,5 W sem qualquer vestígio de estrangulamento. O potencial deste processador é impressionante: O Intel Core i7-10750H do X1Extreme Gen 3, que tem apenas seis núcleos mas pode consumir muito mais, é 10 % mais lento. Em comparação com o Lenovo ThinkPad P14s Gen 1 mit Intel-CPU, o P14s AMD é até duas vezes mais rápido quando todos os núcleos são tributados. As CPUs Intel só são competitivas em termos de desempenho de um único núcleo
Não detectamos nenhuma desaceleração na energia da bateria
Cinebench R15: CPU Single 64Bit | CPU Multi 64Bit
Cinebench R23: Multi Core | Single Core
Blender: v2.79 BMW27 CPU
7-Zip 18.03: 7z b 4 -mmt1 | 7z b 4
Geekbench 5.5: Single-Core | Multi-Core
HWBOT x265 Benchmark v2.2: 4k Preset
LibreOffice : 20 Documents To PDF
R Benchmark 2.5: Overall mean
| Cinebench R20 / CPU (Multi Core) | |
| Média da turma Workstation (5760 - 15043, n=23, últimos 2 anos) | |
| Lenovo ThinkPad P14s Gen1-20Y10002GE | |
| Média AMD Ryzen 7 PRO 4750U (2935 - 3302, n=5) | |
| Lenovo ThinkPad X1 Extreme Gen3-20TLS0UV00 | |
| Lenovo ThinkPad T14-20UES00H00 | |
| HP ZBook Firefly 14 G7 | |
| Lenovo ThinkPad P14s Gen1 20S40009GE | |
| Cinebench R20 / CPU (Single Core) | |
| Média da turma Workstation (671 - 857, n=23, últimos 2 anos) | |
| Lenovo ThinkPad X1 Extreme Gen3-20TLS0UV00 | |
| HP ZBook Firefly 14 G7 | |
| Média AMD Ryzen 7 PRO 4750U (461 - 479, n=5) | |
| Lenovo ThinkPad P14s Gen1-20Y10002GE | |
| Lenovo ThinkPad P14s Gen1 20S40009GE | |
| Lenovo ThinkPad T14-20UES00H00 | |
| Cinebench R15 / CPU Single 64Bit | |
| Média da turma Workstation (191.4 - 328, n=23, últimos 2 anos) | |
| Lenovo ThinkPad X1 Extreme Gen3-20TLS0UV00 | |
| HP ZBook Firefly 14 G7 | |
| Lenovo ThinkPad P14s Gen1 20S40009GE | |
| Média AMD Ryzen 7 PRO 4750U (180 - 184, n=5) | |
| Lenovo ThinkPad P14s Gen1-20Y10002GE | |
| Lenovo ThinkPad T14-20UES00H00 | |
| Cinebench R15 / CPU Multi 64Bit | |
| Média da turma Workstation (2489 - 5810, n=23, últimos 2 anos) | |
| Lenovo ThinkPad P14s Gen1-20Y10002GE | |
| Média AMD Ryzen 7 PRO 4750U (1287 - 1417, n=5) | |
| Lenovo ThinkPad X1 Extreme Gen3-20TLS0UV00 | |
| Lenovo ThinkPad T14-20UES00H00 | |
| HP ZBook Firefly 14 G7 | |
| Lenovo ThinkPad P14s Gen1 20S40009GE | |
| Cinebench R23 / Multi Core | |
| Média da turma Workstation (14621 - 38520, n=23, últimos 2 anos) | |
| Média AMD Ryzen 7 PRO 4750U (8300 - 8359, n=3) | |
| Lenovo ThinkPad P14s Gen1-20Y10002GE | |
| Lenovo ThinkPad X1 Extreme Gen3-20TLS0UV00 | |
| HP ZBook Firefly 14 G7 | |
| Lenovo ThinkPad P14s Gen1 20S40009GE | |
| Cinebench R23 / Single Core | |
| Média da turma Workstation (1712 - 2228, n=23, últimos 2 anos) | |
| HP ZBook Firefly 14 G7 | |
| Lenovo ThinkPad X1 Extreme Gen3-20TLS0UV00 | |
| Lenovo ThinkPad P14s Gen1 20S40009GE | |
| Média AMD Ryzen 7 PRO 4750U (1162 - 1215, n=3) | |
| Lenovo ThinkPad P14s Gen1-20Y10002GE | |
| Blender / v2.79 BMW27 CPU | |
| Lenovo ThinkPad P14s Gen1 20S40009GE | |
| HP ZBook Firefly 14 G7 | |
| Lenovo ThinkPad T14-20UES00H00 | |
| Lenovo ThinkPad X1 Extreme Gen3-20TLS0UV00 | |
| Média AMD Ryzen 7 PRO 4750U (340 - 403, n=5) | |
| Lenovo ThinkPad P14s Gen1-20Y10002GE | |
| Média da turma Workstation (91 - 222, n=23, últimos 2 anos) | |
| 7-Zip 18.03 / 7z b 4 -mmt1 | |
| Média da turma Workstation (5126 - 6960, n=23, últimos 2 anos) | |
| Lenovo ThinkPad X1 Extreme Gen3-20TLS0UV00 | |
| HP ZBook Firefly 14 G7 | |
| Lenovo ThinkPad P14s Gen1 20S40009GE | |
| Média AMD Ryzen 7 PRO 4750U (4413 - 4467, n=5) | |
| Lenovo ThinkPad P14s Gen1-20Y10002GE | |
| Lenovo ThinkPad T14-20UES00H00 | |
| 7-Zip 18.03 / 7z b 4 | |
| Média da turma Workstation (60489 - 116969, n=23, últimos 2 anos) | |
| Lenovo ThinkPad P14s Gen1-20Y10002GE | |
| Média AMD Ryzen 7 PRO 4750U (37081 - 42173, n=5) | |
| Lenovo ThinkPad X1 Extreme Gen3-20TLS0UV00 | |
| Lenovo ThinkPad T14-20UES00H00 | |
| HP ZBook Firefly 14 G7 | |
| Lenovo ThinkPad P14s Gen1 20S40009GE | |
| Geekbench 5.5 / Single-Core | |
| Média da turma Workstation (1783 - 2183, n=23, últimos 2 anos) | |
| Lenovo ThinkPad X1 Extreme Gen3-20TLS0UV00 | |
| HP ZBook Firefly 14 G7 | |
| Lenovo ThinkPad P14s Gen1 20S40009GE | |
| Média AMD Ryzen 7 PRO 4750U (1117 - 1157, n=5) | |
| Lenovo ThinkPad P14s Gen1-20Y10002GE | |
| Lenovo ThinkPad T14-20UES00H00 | |
| Geekbench 5.5 / Multi-Core | |
| Média da turma Workstation (11542 - 25554, n=23, últimos 2 anos) | |
| Lenovo ThinkPad P14s Gen1-20Y10002GE | |
| Média AMD Ryzen 7 PRO 4750U (5456 - 6609, n=5) | |
| Lenovo ThinkPad X1 Extreme Gen3-20TLS0UV00 | |
| Lenovo ThinkPad T14-20UES00H00 | |
| HP ZBook Firefly 14 G7 | |
| Lenovo ThinkPad P14s Gen1 20S40009GE | |
| HWBOT x265 Benchmark v2.2 / 4k Preset | |
| Média da turma Workstation (17.8 - 40.5, n=23, últimos 2 anos) | |
| Lenovo ThinkPad P14s Gen1-20Y10002GE | |
| Lenovo ThinkPad X1 Extreme Gen3-20TLS0UV00 | |
| Média AMD Ryzen 7 PRO 4750U (8.33 - 10.3, n=5) | |
| Lenovo ThinkPad T14-20UES00H00 | |
| HP ZBook Firefly 14 G7 | |
| Lenovo ThinkPad P14s Gen1 20S40009GE | |
| LibreOffice / 20 Documents To PDF | |
| HP ZBook Firefly 14 G7 | |
| Média AMD Ryzen 7 PRO 4750U (58.4 - 73.4, n=5) | |
| Lenovo ThinkPad P14s Gen1-20Y10002GE | |
| Lenovo ThinkPad T14-20UES00H00 | |
| Lenovo ThinkPad P14s Gen1 20S40009GE | |
| Lenovo ThinkPad X1 Extreme Gen3-20TLS0UV00 | |
| Média da turma Workstation (37.1 - 74.7, n=23, últimos 2 anos) | |
| R Benchmark 2.5 / Overall mean | |
| Lenovo ThinkPad P14s Gen1 20S40009GE | |
| Lenovo ThinkPad T14-20UES00H00 | |
| HP ZBook Firefly 14 G7 | |
| Lenovo ThinkPad P14s Gen1-20Y10002GE | |
| Média AMD Ryzen 7 PRO 4750U (0.61 - 0.621, n=5) | |
| Lenovo ThinkPad X1 Extreme Gen3-20TLS0UV00 | |
| Média da turma Workstation (0.3825 - 0.603, n=23, últimos 2 anos) | |
* ... menor é melhor
Desempenho do sistema
O desempenho diário foi excelente. Nosso sentimento subjetivo é reforçado pela boa pontuação PCMark 10
| PCMark 10 Score | 5034 pontos | |
Ajuda | ||
Latência do DPC
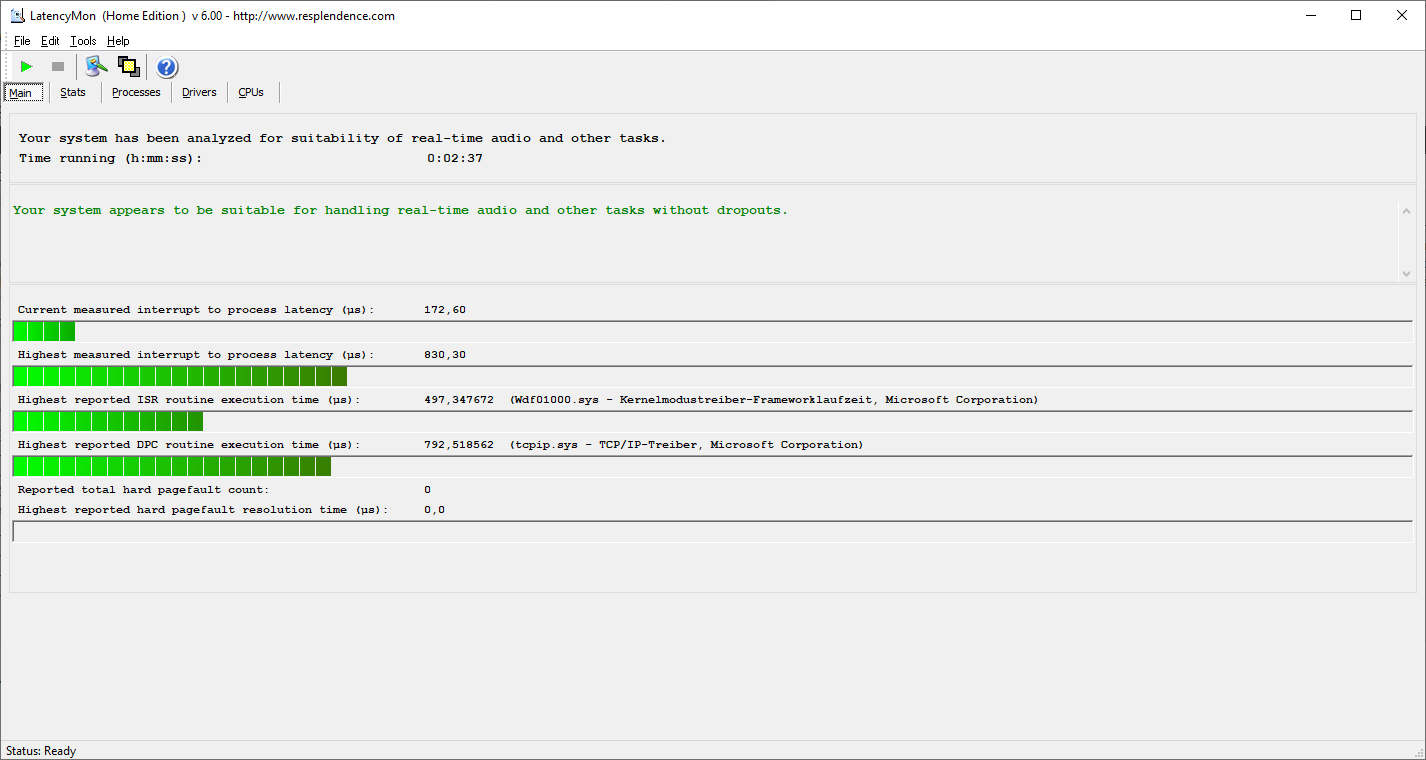

| DPC Latencies / LatencyMon - interrupt to process latency (max), Web, Youtube, Prime95 | |
| Lenovo ThinkPad P14s Gen1-20Y10002GE | |
* ... menor é melhor
Armazenamento
O Samsung PM981a é um NVMe PCIe 3.0 SSD para OEMs. É um SSD M.2 2280 com uma capacidade de 1 TB em nossa unidade de revisão. O SSD funciona de acordo com as expectativas, o que significa: É extremamente rápido
| Lenovo ThinkPad P14s Gen1-20Y10002GE Samsung PM981a MZVLB1T0HBLR | Lenovo ThinkPad P14s Gen1 20S40009GE Samsung SSD PM981a MZVLB512HBJQ | Lenovo ThinkPad T14-20UES00H00 Samsung SSD PM981a MZVLB512HBJQ | HP ZBook Firefly 14 G7 Toshiba XG6 KXG60ZNV512G | Lenovo ThinkPad X1 Extreme Gen3-20TLS0UV00 Toshiba XG6 KXG6AZNV1T02 | Média Samsung PM981a MZVLB1T0HBLR | |
|---|---|---|---|---|---|---|
| CrystalDiskMark 5.2 / 6 | 17% | 2% | -15% | 22% | 18% | |
| Write 4K (MB/s) | 86.3 | 145 68% | 88.1 2% | 98.1 14% | 159.5 85% | 139.7 ? 62% |
| Read 4K (MB/s) | 47.66 | 48.11 1% | 38.28 -20% | 45.16 -5% | 53.1 11% | 49.9 ? 5% |
| Write Seq (MB/s) | 2030 | 2138 5% | 2002 -1% | 1623 -20% | 1723 -15% | 2036 ? 0% |
| Read Seq (MB/s) | 2345 | 2258 -4% | 2153 -8% | 1993 -15% | 2164 -8% | 2014 ? -14% |
| Write 4K Q32T1 (MB/s) | 379.7 | 467.8 23% | 423.7 12% | 311.7 -18% | 469.2 24% | 461 ? 21% |
| Read 4K Q32T1 (MB/s) | 289 | 421.4 46% | 393.2 36% | 289.9 0% | 543 88% | 499 ? 73% |
| Write Seq Q32T1 (MB/s) | 2982 | 2988 0% | 2889 -3% | 853 -71% | 3055 2% | 2903 ? -3% |
| Read Seq Q32T1 (MB/s) | 3567 | 3446 -3% | 3566 0% | 3274 -8% | 3296 -8% | 3479 ? -2% |

Dauerleistung Lesen: DiskSpd Read Loop, Queue Depth 8
GPU
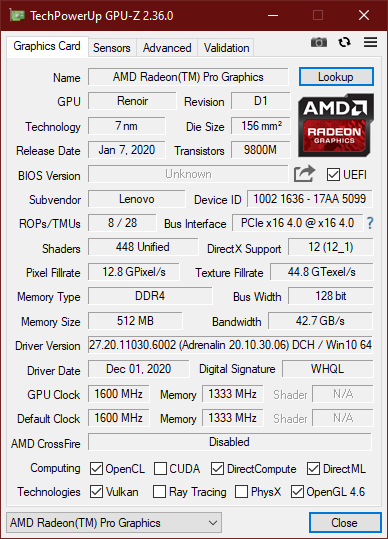
O AMD Radeon RX Vega 7 é uma GPU integrada. Que serve como a única placa gráfica de uma estação de trabalho móvel é muito incomum, especialmente porque a Lenovo normalmente define "estações de trabalho móveis" como laptops com uma GPU Nvidia Quadro.
Por ser "somente" um chip integrado, a Radeon com seus drivers certificados ISV faz bem seu trabalho. Nos benchmarks 3DMark, ela consegue superar o desempenho do Nvidia Quadro P520 do ThinkPad P14s Intel. No conjunto de benchmarks da estação de trabalho SPECviewperf, a GPU AMD é às vezes um pouco mais lenta ou um pouco mais rápida do que a GPU Nvidia, o que praticamente significa um empate. No entanto, a performance permanece limitada, o que é revelado pela comparação com o ThinkPad P15 Gen 1 e o NvidiaQuadro T1000 zeigt.
O ThinkPad P14s AMD não é realmente adequado para jogos, uma vez que os títulos modernos só podem ser jogados em cenários baixos e com resoluções reduzidas.
O desempenho da GPU diminuiu ligeiramente em cerca de 3% quando nenhum carregador foi acoplado
| 3DMark 11 Performance | 5746 pontos | |
| 3DMark Fire Strike Score | 3249 pontos | |
| 3DMark Time Spy Score | 1246 pontos | |
Ajuda | ||
| baixo | média | alto | ultra | |
|---|---|---|---|---|
| The Witcher 3 (2015) | 65.9 | 20.2 | ||
| Dota 2 Reborn (2015) | 100 | 83.8 | 55.6 | 52.4 |
| X-Plane 11.11 (2018) | 41.2 | 31.7 | 28.4 | |
| Shadow of the Tomb Raider (2018) | 50.9 | 19.3 | ||
| Total War: Three Kingdoms (2019) | 59.3 | 17.6 |
Emissões: O ThinkPad P14s AMD permanece mais frio e silencioso que o modelo Intel
Ruído
Quando a máquina está ociosa, o ventilador permanece completamente silencioso. Mesmo quando liga, permanece inaudível com 25,9 dB(a). Medimos 34,6 dB(a) sob carga, o que equivale a um ruído audível, mas não perturbadoramente alto.
Não conseguimos ouvir nenhuma bobina choramingar
Barulho
| Ocioso |
| 24 / 24 / 25.9 dB |
| Carga |
| 34.6 / 34.6 dB |
 | ||
30 dB silencioso 40 dB(A) audível 50 dB(A) ruidosamente alto |
||
min: | ||
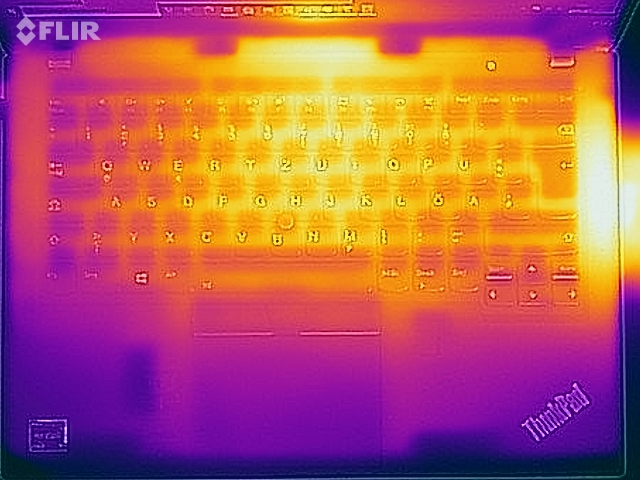
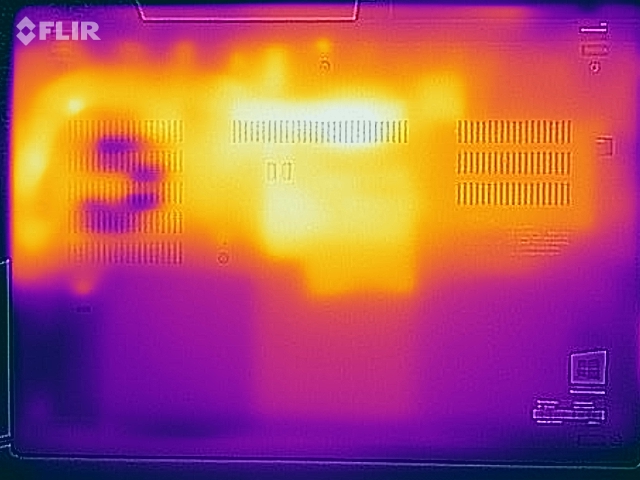
Temperaturas
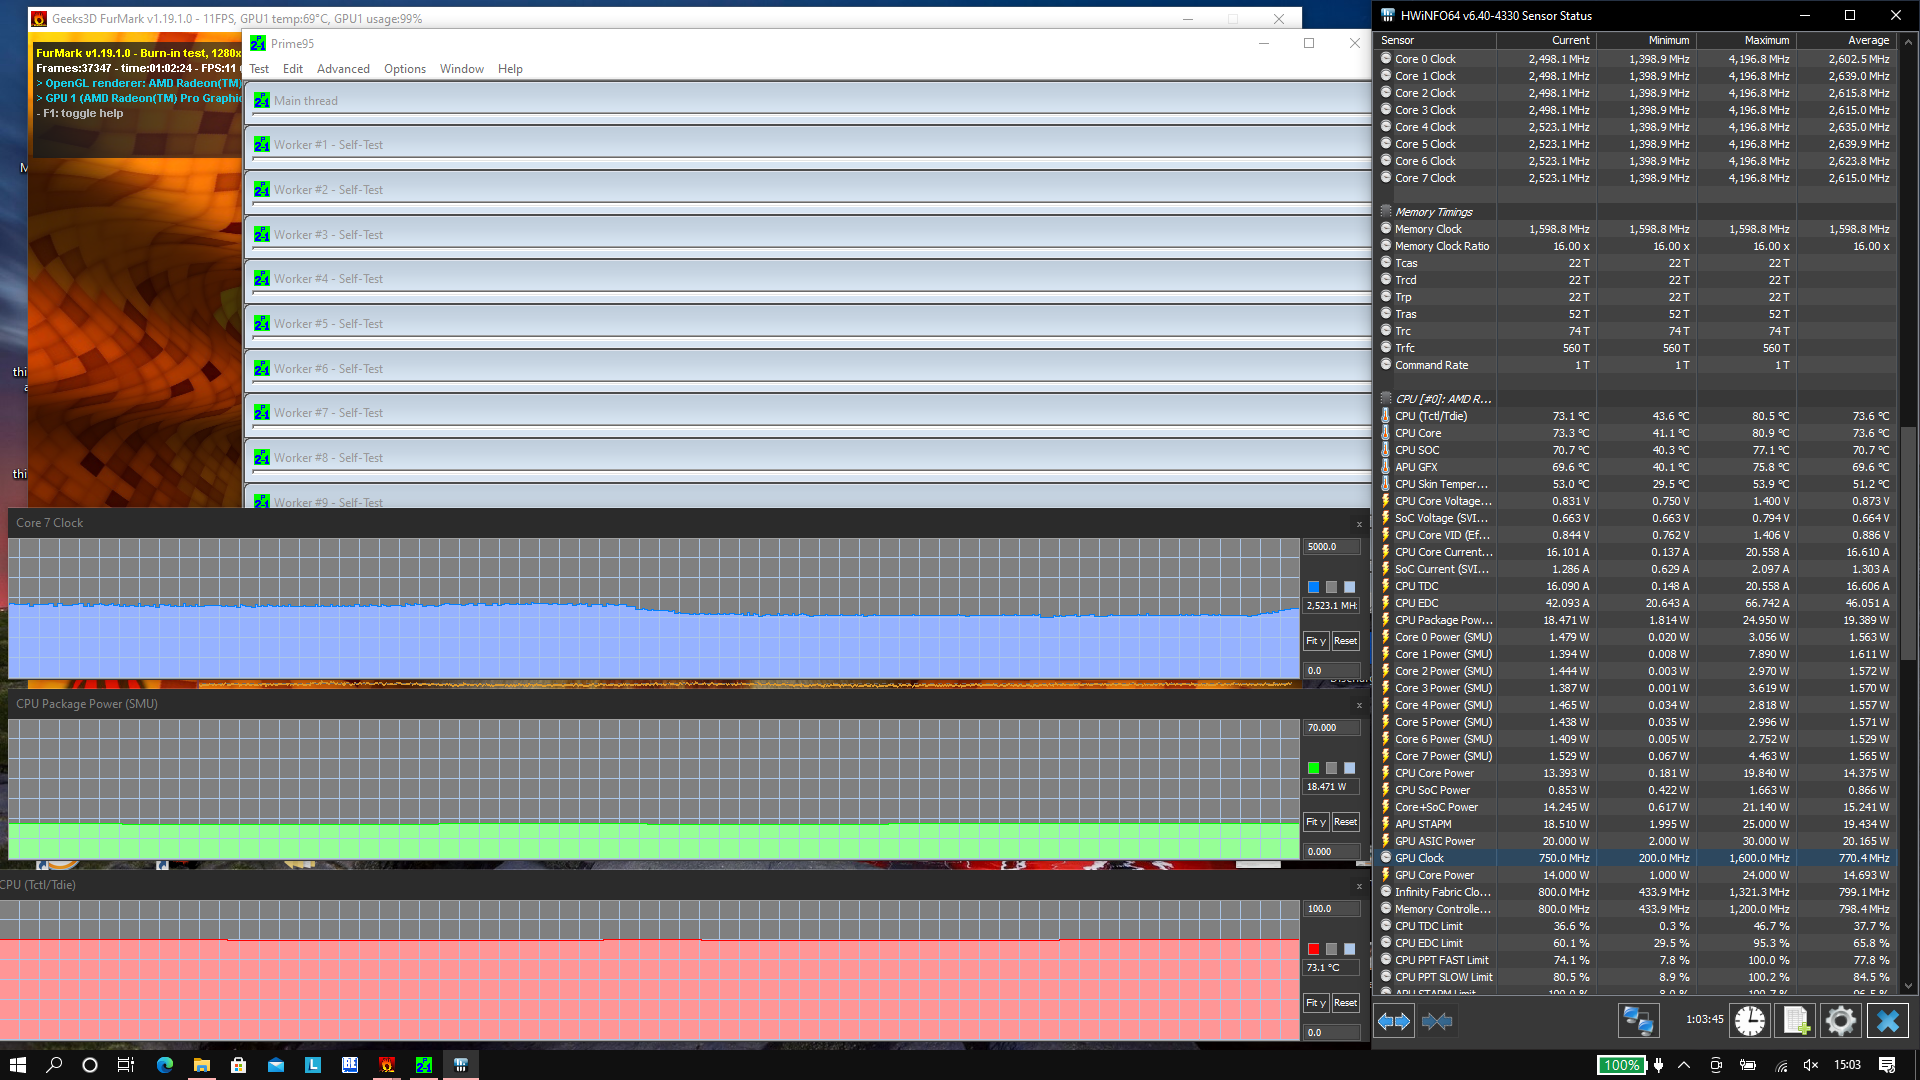
A temperatura máxima do chassi que medimos foi de 52,6 °C / 127 F no centro superior da tampa inferior. Isto significa que o laptop ThinkPad certamente pode sentir-se quente sob carga, mas permanece muito mais frio que o ThinkPad P14s Intel, que atingiu um máximo de 68 °C / 156 F.
No teste de estresse, tanto a CPU quanto a GPU têm que baixar um pouco suas taxas de clock. Isto é lógico, pois ambos têm que compartilhar o mesmo orçamento térmico. O estrangulamento de energia no teste de estresse do cenário extremo não deve ter nenhuma ramificação no uso diário
(-) A temperatura máxima no lado superior é 49.3 °C / 121 F, em comparação com a média de 38.2 °C / 101 F , variando de 22.2 a 69.8 °C para a classe Workstation.
(-) A parte inferior aquece até um máximo de 52.6 °C / 127 F, em comparação com a média de 41.1 °C / 106 F
(+) Em uso inativo, a temperatura média para o lado superior é 25.4 °C / 78 F, em comparação com a média do dispositivo de 32 °C / ### class_avg_f### F.
(+) Os apoios para as mãos e o touchpad estão atingindo a temperatura máxima da pele (33.5 °C / 92.3 F) e, portanto, não estão quentes.
(-) A temperatura média da área do apoio para as mãos de dispositivos semelhantes foi 27.8 °C / 82 F (-5.7 °C / -10.3 F).
Oradores
Os alto-falantes estéreo de disparo para cima acima do teclado produzem um som de serviço. Eles são suficientemente altos para encher uma pequena sala com som e até mesmo conseguiram emitir alguns sons de baixa freqüência
Alternativamente, a porta de 3,5 mm pode ser usada para produzir um áudio perfeitamente bom
Lenovo ThinkPad P14s Gen1-20Y10002GE análise de áudio
(±) | o volume do alto-falante é médio, mas bom (###valor### dB)
Graves 100 - 315Hz
(±) | graves reduzidos - em média 13.7% menor que a mediana
(±) | a linearidade dos graves é média (10.4% delta para a frequência anterior)
Médios 400 - 2.000 Hz
(±) | médios mais altos - em média 6% maior que a mediana
(+) | médios são lineares (5.2% delta para frequência anterior)
Altos 2 - 16 kHz
(+) | agudos equilibrados - apenas 2.7% longe da mediana
(+) | os máximos são lineares (4.3% delta da frequência anterior)
Geral 100 - 16.000 Hz
(±) | a linearidade do som geral é média (16.7% diferença em relação à mediana)
Comparado com a mesma classe
» 46% de todos os dispositivos testados nesta classe foram melhores, 9% semelhantes, 45% piores
» O melhor teve um delta de 7%, a média foi 17%, o pior foi 35%
Comparado com todos os dispositivos testados
» 29% de todos os dispositivos testados foram melhores, 7% semelhantes, 64% piores
» O melhor teve um delta de 4%, a média foi 23%, o pior foi 134%
HP ZBook Firefly 14 G7 análise de áudio
(±) | o volume do alto-falante é médio, mas bom (###valor### dB)
Graves 100 - 315Hz
(±) | graves reduzidos - em média 13.3% menor que a mediana
(±) | a linearidade dos graves é média (13.1% delta para a frequência anterior)
Médios 400 - 2.000 Hz
(+) | médios equilibrados - apenas 2% longe da mediana
(+) | médios são lineares (2.6% delta para frequência anterior)
Altos 2 - 16 kHz
(+) | agudos equilibrados - apenas 3.8% longe da mediana
(±) | a linearidade dos máximos é média (7.4% delta para frequência anterior)
Geral 100 - 16.000 Hz
(±) | a linearidade do som geral é média (17.9% diferença em relação à mediana)
Comparado com a mesma classe
» 56% de todos os dispositivos testados nesta classe foram melhores, 11% semelhantes, 33% piores
» O melhor teve um delta de 7%, a média foi 17%, o pior foi 35%
Comparado com todos os dispositivos testados
» 37% de todos os dispositivos testados foram melhores, 8% semelhantes, 55% piores
» O melhor teve um delta de 4%, a média foi 23%, o pior foi 134%
Gerenciamento de energia: a vida útil da bateria do laptop Lenovo desaponta
Consumo de energia
O Lenovo ThinkPad P14s Gen 1 AMD nos decepciona com altos valores de consumo de energia enquanto está ocioso. O ThinkPad P14s Intel opera com mais eficiência energética, o ThinkPad T14 AMD também consome menos energia. Talvez a tela de privacidade não seja tão eficiente quanto o LCD de baixa potência dos outros modelos.
Para o carregador de 65 W fornecido, o consumo máximo de energia de 50 W não é um obstáculo
| desligado | |
| Ocioso | |
| Carga |
|
Key:
min: | |
| Lenovo ThinkPad P14s Gen1-20Y10002GE R7 PRO 4750U, Vega 7, Samsung PM981a MZVLB1T0HBLR, a-Si IPS LED, 1920x1080, 14" | Lenovo ThinkPad P14s Gen1 20S40009GE i7-10510U, Quadro P520, Samsung SSD PM981a MZVLB512HBJQ, LTPS IPS LED, 1920x1080, 14" | Lenovo ThinkPad T14-20UES00H00 R5 PRO 4650U, Vega 6, Samsung SSD PM981a MZVLB512HBJQ, IPS, 1920x1080, 14" | HP ZBook Firefly 14 G7 i7-10610U, Quadro P520, Toshiba XG6 KXG60ZNV512G, IPS, 1920x1080, 14" | Lenovo ThinkPad X1 Extreme Gen3-20TLS0UV00 i7-10750H, GeForce GTX 1650 Ti Max-Q, Toshiba XG6 KXG6AZNV1T02, IPS, 1920x1080, 15.6" | Média AMD Radeon RX Vega 7 | Média da turma Workstation | |
|---|---|---|---|---|---|---|---|
| Power Consumption | 5% | 4% | -13% | -67% | 9% | -115% | |
| Idle Minimum * (Watt) | 4.8 | 2.92 39% | 5.8 -21% | 3.3 31% | 5 -4% | 4.79 ? -0% | 9.11 ? -90% |
| Idle Average * (Watt) | 8.8 | 5.64 36% | 8.3 6% | 9.3 -6% | 9 -2% | 7.72 ? 12% | 13.8 ? -57% |
| Idle Maximum * (Watt) | 11.4 | 8 30% | 11 4% | 12.1 -6% | 12.2 -7% | 9.12 ? 20% | 17.9 ? -57% |
| Load Average * (Watt) | 45.2 | 64 -42% | 39.5 13% | 59.4 -31% | 94.4 -109% | 38.4 ? 15% | 96 ? -112% |
| Witcher 3 ultra * (Watt) | 42.2 | 52.7 -25% | 89 -111% | ||||
| Load Maximum * (Watt) | 50 | 68.4 -37% | 40.8 18% | 69.4 -39% | 133.9 -168% | 51.7 ? -3% | 180.3 ? -261% |
* ... menor é melhor
Bateria
Apesar da capacidade da bateria interna permanecer inalterada em relação ao ThinkPad P15 da Intel e ao ThinkPad T14, a vida útil da bateria é dramaticamente pior. O ThinkPad P14s nem sequer consegue seis horas no teste Wi-Fi com 150 cd/m² de brilho, um valor inferior à média
| Lenovo ThinkPad P14s Gen1-20Y10002GE R7 PRO 4750U, Vega 7, 50 Wh | Lenovo ThinkPad P14s Gen1 20S40009GE i7-10510U, Quadro P520, 50 Wh | Lenovo ThinkPad T14-20UES00H00 R5 PRO 4650U, Vega 6, 50 Wh | HP ZBook Firefly 14 G7 i7-10610U, Quadro P520, 53 Wh | Lenovo ThinkPad X1 Extreme Gen3-20TLS0UV00 i7-10750H, GeForce GTX 1650 Ti Max-Q, 80 Wh | Média da turma Workstation | |
|---|---|---|---|---|---|---|
| Duração da bateria | 54% | 32% | 54% | 59% | 34% | |
| H.264 (h) | 8.2 | 12.4 51% | 11.6 41% | 12.5 52% | 12.2 49% | 10.1 ? 23% |
| WiFi v1.3 (h) | 5.8 | 10.1 74% | 8.4 45% | 10.1 74% | 11.6 100% | 8.55 ? 47% |
| Load (h) | 1.1 | 1.5 36% | 1.2 9% | 1.5 36% | 1.4 27% | 1.441 ? 31% |
Pro
Contra
Veredicto: ThinkPad P14s AMD é melhor que P14s Intel

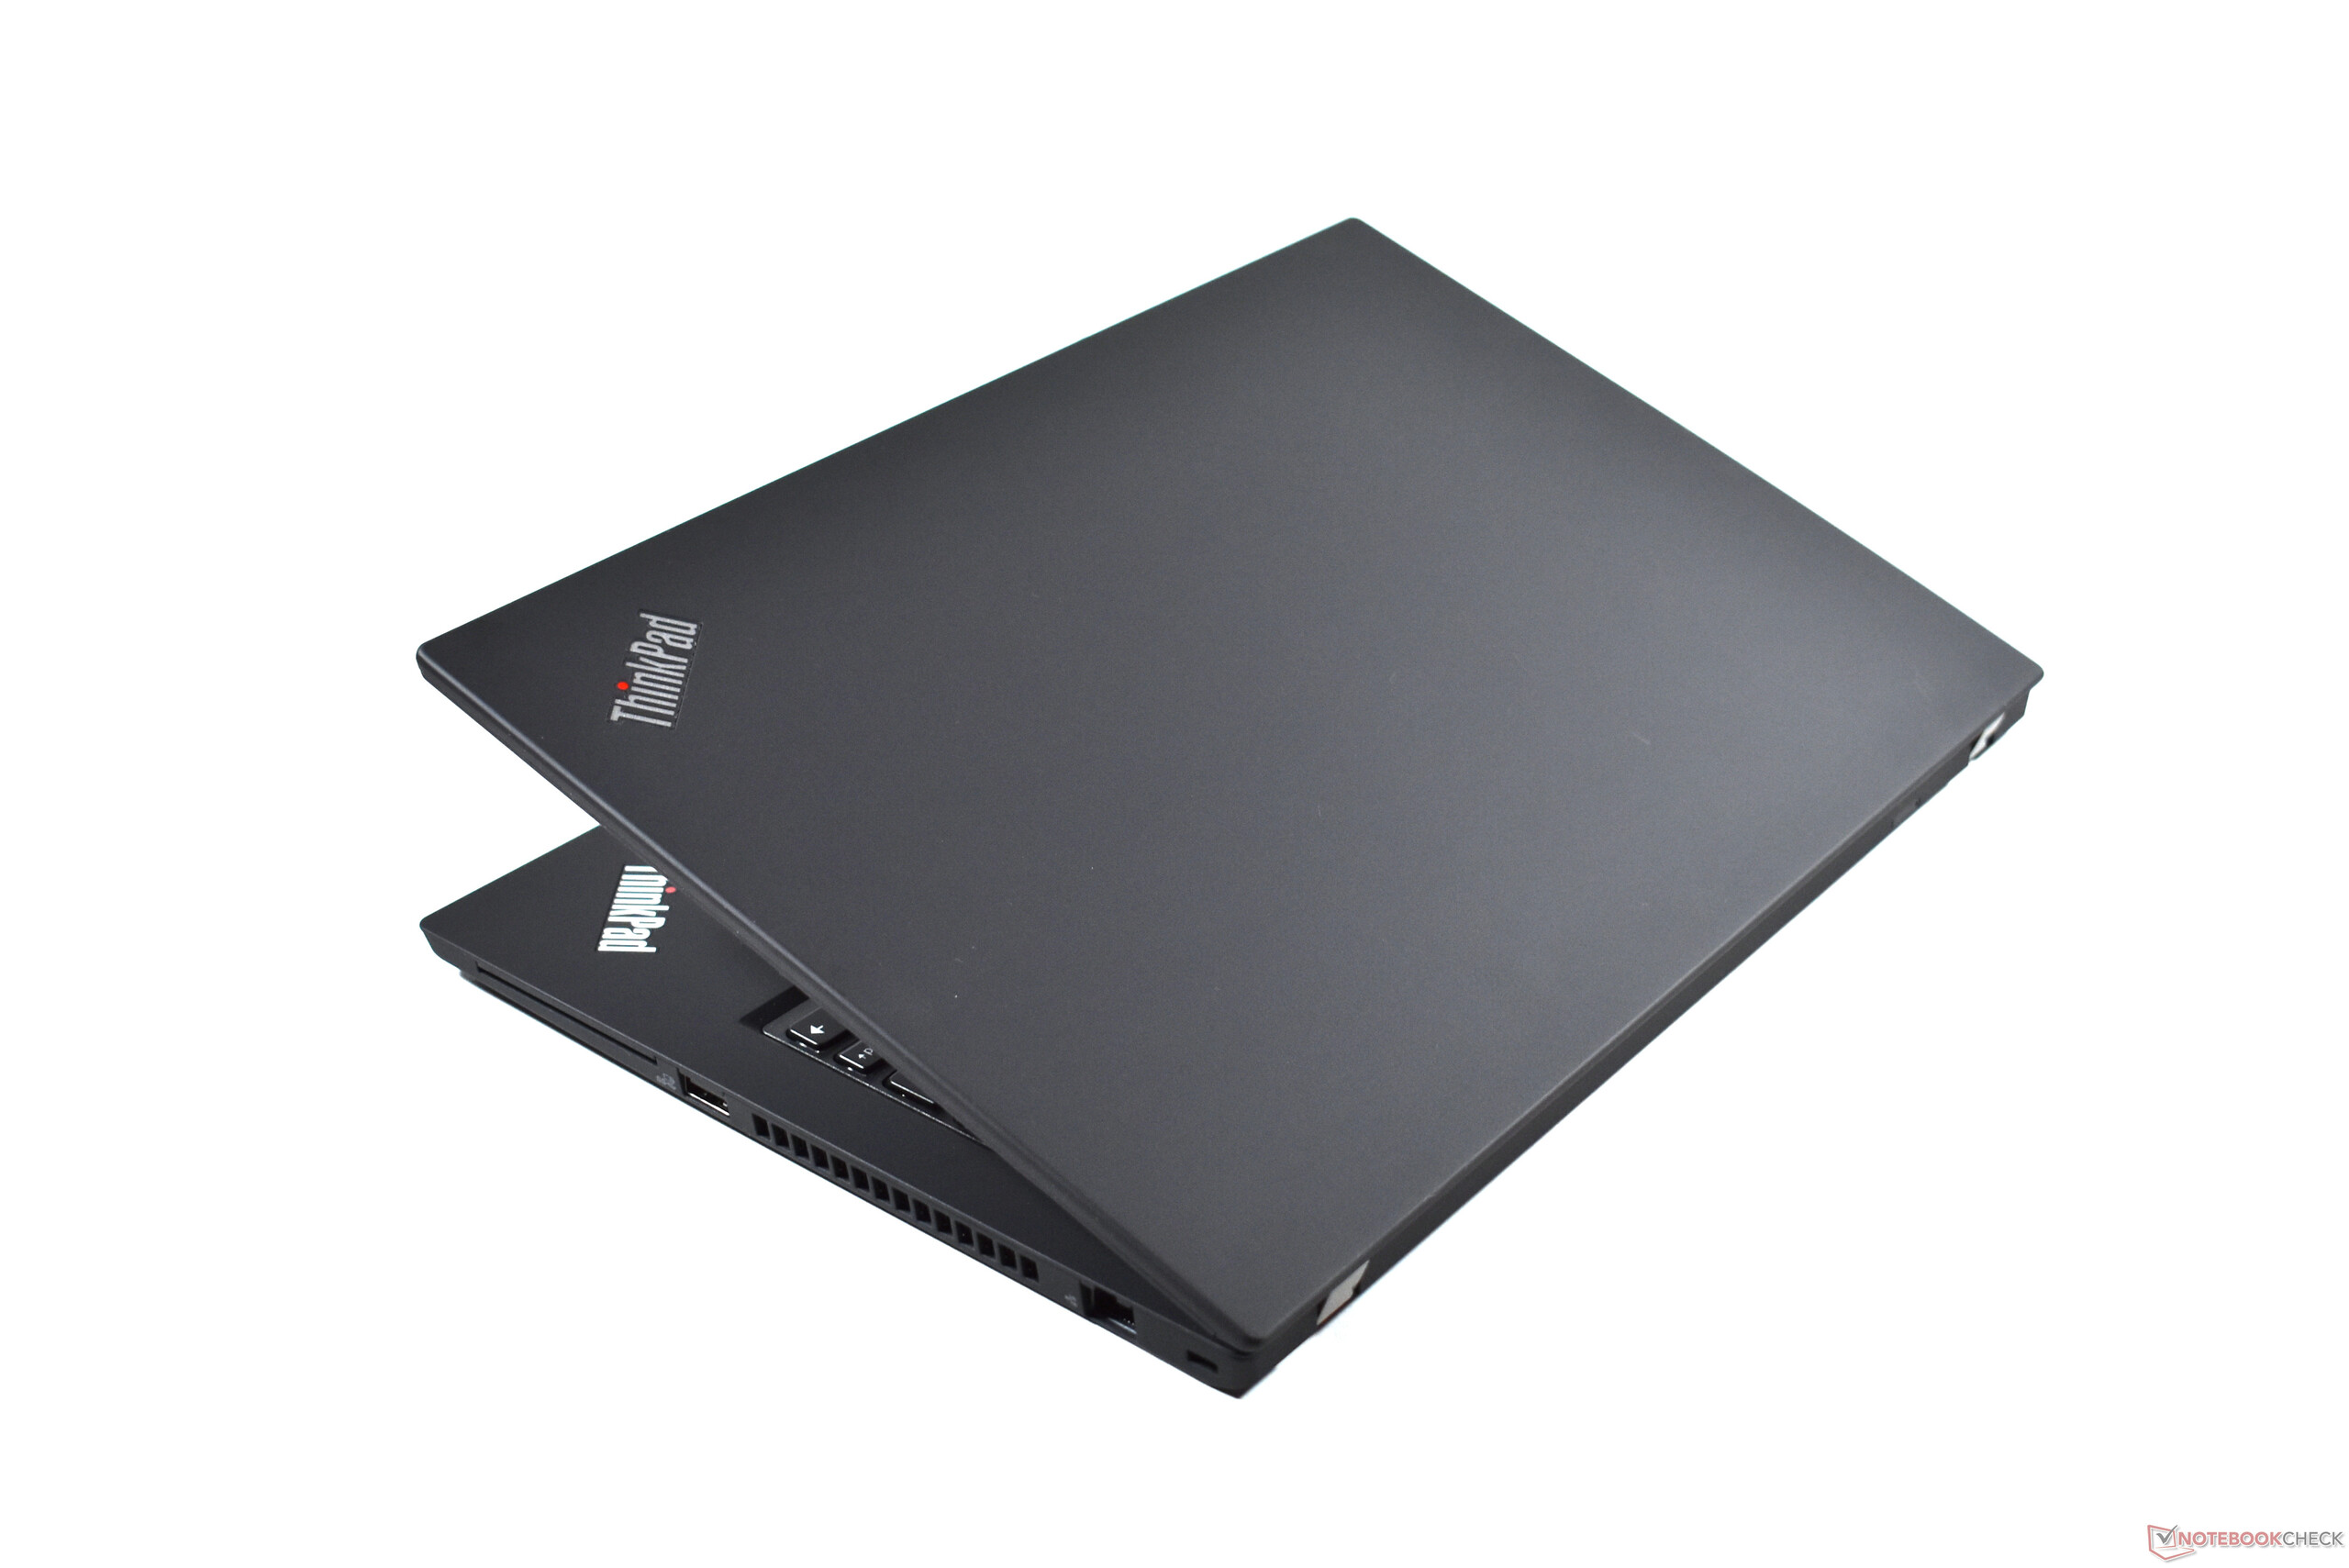
Não é surpreendente que a Lenovo ThinkPad P14s Gen 1 AMD compartilhe muito com sua contraparte Intel. Afinal, as opções de conectividade, o chassi e os dispositivos de entrada são idênticos.
A diferença mais importante está no interior. O processador AMD Ryzen catapultou o laptop Lenovo para um nível de desempenho de CPU completamente diferente. Isto permite que ele possa competir mesmo com estações de trabalho móveis de tamanho normal. O mesmo não acontece com a GPU integrada, embora ela não seja pelo menos mais lenta que a GPU Nvidia da Intel ThinkPad P14s. O modelo AMD também roda mais frio e silencioso.
Nosso veredicto é mais misto para o segundo diferencial mais importante desta configuração específica, a tela PrivacyGuard. É mais brilhante que os outros LCDs FHD oferecidos nos P14s, mas o brilho limitado quando a tela é vista de lado é irritante, já que é pior que outras telas IPS, mesmo com o modo ePrivacy desativado. Também suspeitamos que a tela consome muita energia, o que leva ao único problema real desta versão do Lenovo ThinkPad P14s AMD: A duração da bateria é decepcionante.
AMD top, Flop de tela de privacidade: O ThinkPad P14s Gen 1 AMD seria melhor com a tela de baixa potência
Não recomendamos o Lenovo ThinkPad P14s com a tela de privacidade, exceto para usuários que realmente precisam deste recurso. Para a maioria dos usuários, a tela normal de baixa potência é a melhor escolha. O veredicto para o ThinkPad P14s AMD em um todo é diferente: Além da tela desta configuração específica, o ThinkPad P14s AMD é uma excelente estação de trabalho de nível básico, o que recomendamos de todo o coração.
Preços e disponibilidade
O Lenovo ThinkPad P14s Gen 1 AMD pode ser comprado por US$1.249 no Amazon.com.
Lenovo ThinkPad P14s Gen1-20Y10002GE
- 03/20/2021 v7 (old)
Benjamin Herzig
Price comparison

