MSI GP66 Leopard 11UH barato barem revisão: Jogador com RTX 3080 por menos de 2.000 euros
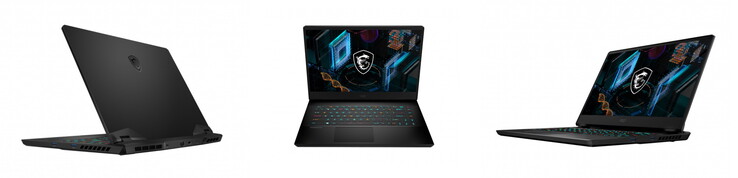
Em abril, revisamos o predecessor MSI GP66 Leopardo 10UG com a CPU da Comet Lake e elogiou o caso redesenhado. O mais novo GP66 Leopard 11UH está agora equipado com uma CPU Tiger Lake e o estojo também mudou. Mas o melhor é que o poderoso gamer já pode ser adquirido por menos de 2.000 Euros na configuração com RTX 3080!
O GP66 11UH também vem com um display QHD ou RTX 3070 como alternativa; nosso modelo de teste é equipado com um rápido display Full HD.
O MSI é aparentemente um dos laptops para jogos mais baratos com RTX 3080, por isso não é fácil encontrar uma concorrência adequada nesta faixa de preços. É por isso que também usamos para comparação modelos um pouco mais caros (até +500 euros) aqui:Aorus 15P YDo ASUS ROG Strix Scar 15o Schenker XMG Neo 15 bem como os consideravelmente mais caros Alienware m15 R6
Possible competitors in comparison
Avaliação | Data | Modelo | Peso | Altura | Size | Resolução | Preço |
|---|---|---|---|---|---|---|---|
| 85.4 % v7 (old) | 12/2021 | MSI GP66 Leopard 11UH-028 i7-11800H, GeForce RTX 3080 Laptop GPU | 2.3 kg | 23.4 mm | 15.60" | 1920x1080 | |
| 84.2 % v7 (old) | 04/2021 | MSI GP66 Leopard 10UG i7-10870H, GeForce RTX 3070 Laptop GPU | 2.3 kg | 23.4 mm | 15.60" | 1920x1080 | |
| 86.4 % v7 (old) | 06/2021 | Aorus 15P YD i7-11800H, GeForce RTX 3080 Laptop GPU | 2.2 kg | 27 mm | 15.60" | 1920x1080 | |
| 86.3 % v7 (old) | 07/2021 | Asus ROG Strix Scar 15 G533QS R9 5900HX, GeForce RTX 3080 Laptop GPU | 2.3 kg | 27.2 mm | 15.60" | 2560x1440 | |
| 87 % v7 (old) | 06/2021 | Schenker XMG Neo 15 Tiger Lake i7-11800H, GeForce RTX 3080 Laptop GPU | 2.2 kg | 26 mm | 15.60" | 2560x1440 | |
| 86.1 % v7 (old) | 11/2021 | Alienware m15 R6, i7-11800H RTX 3080 i7-11800H, GeForce RTX 3080 Laptop GPU | 2.5 kg | 22.85 mm | 15.60" | 1920x1080 |
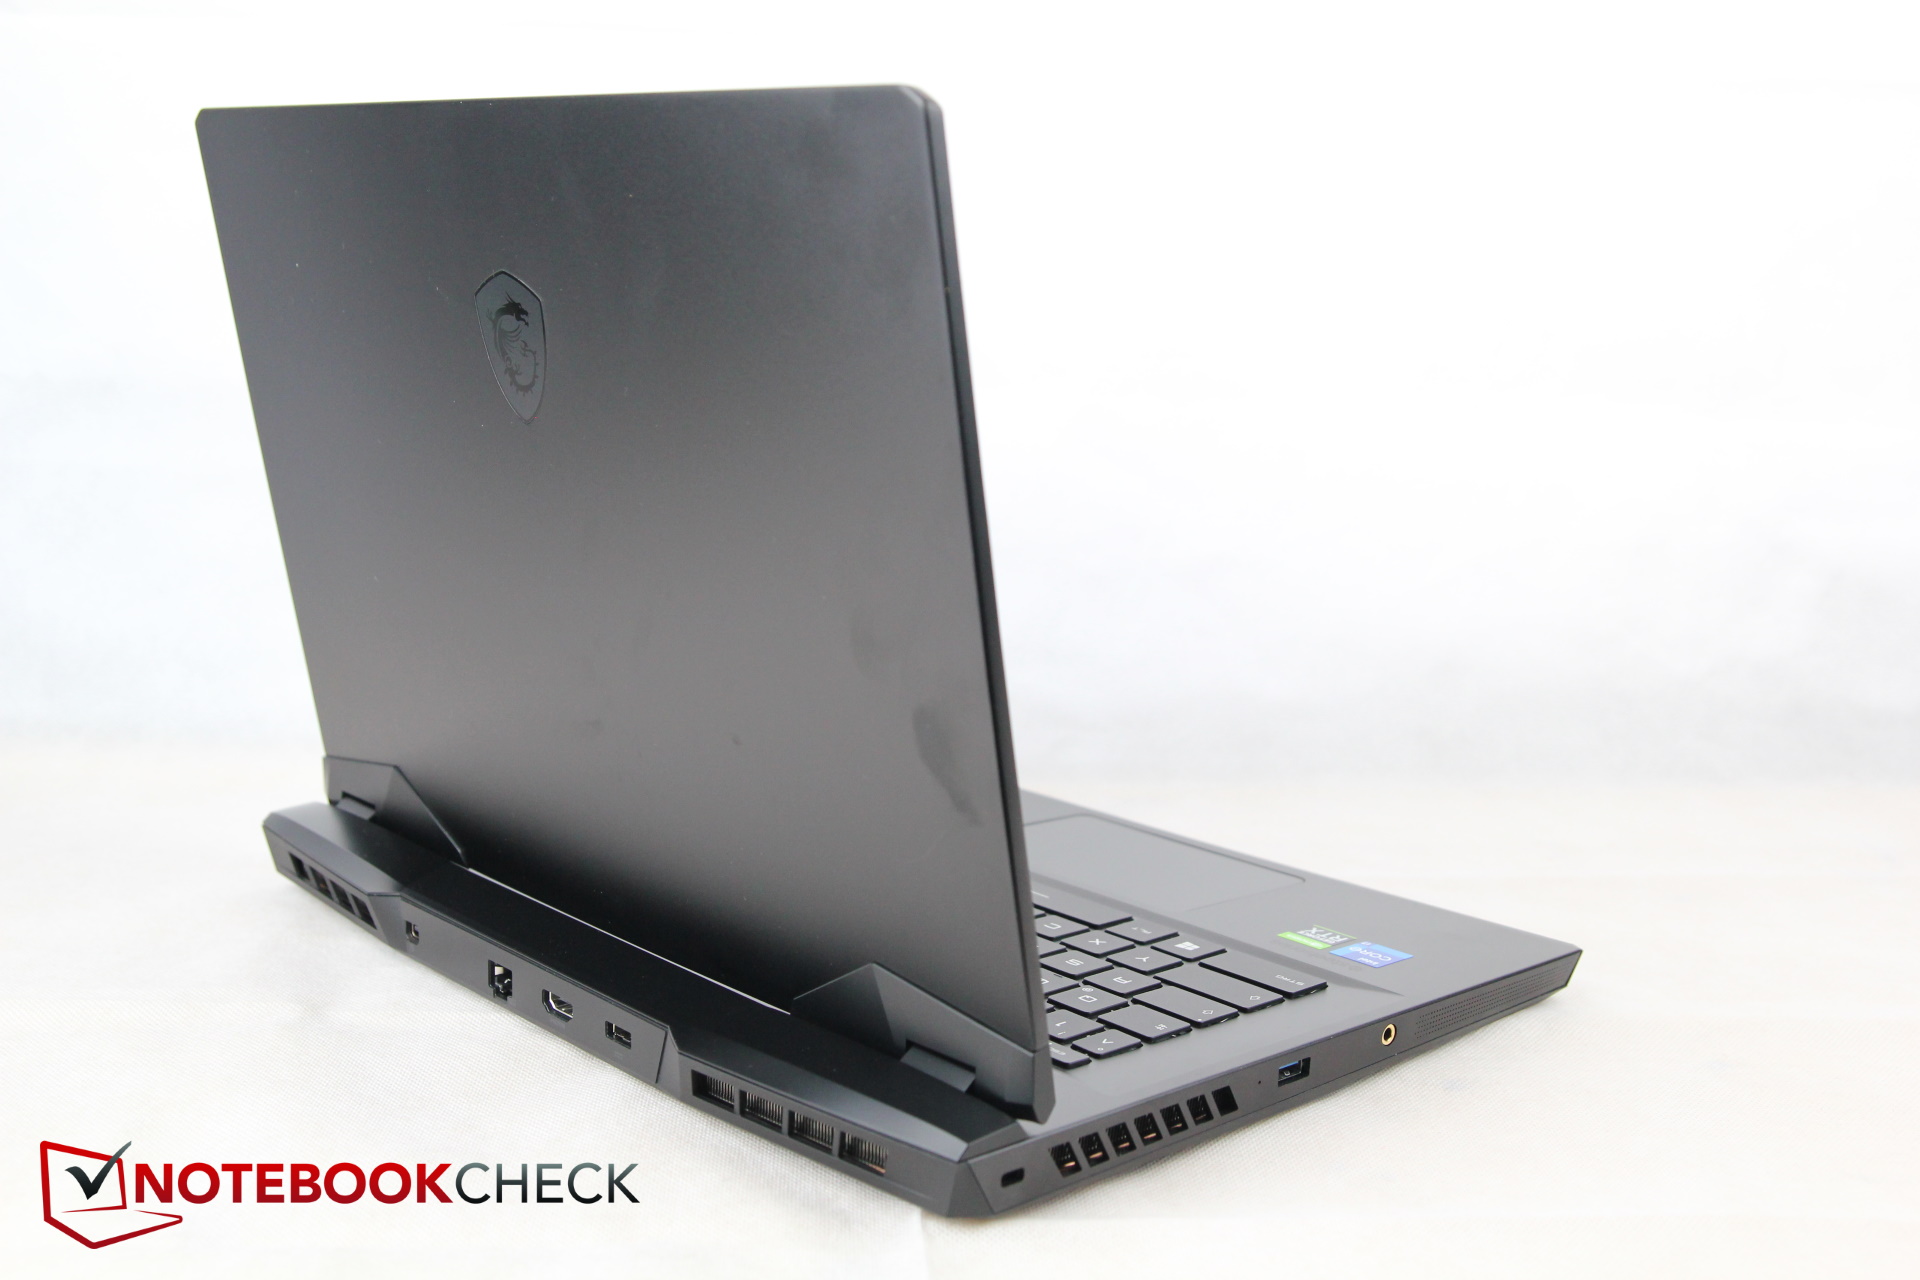
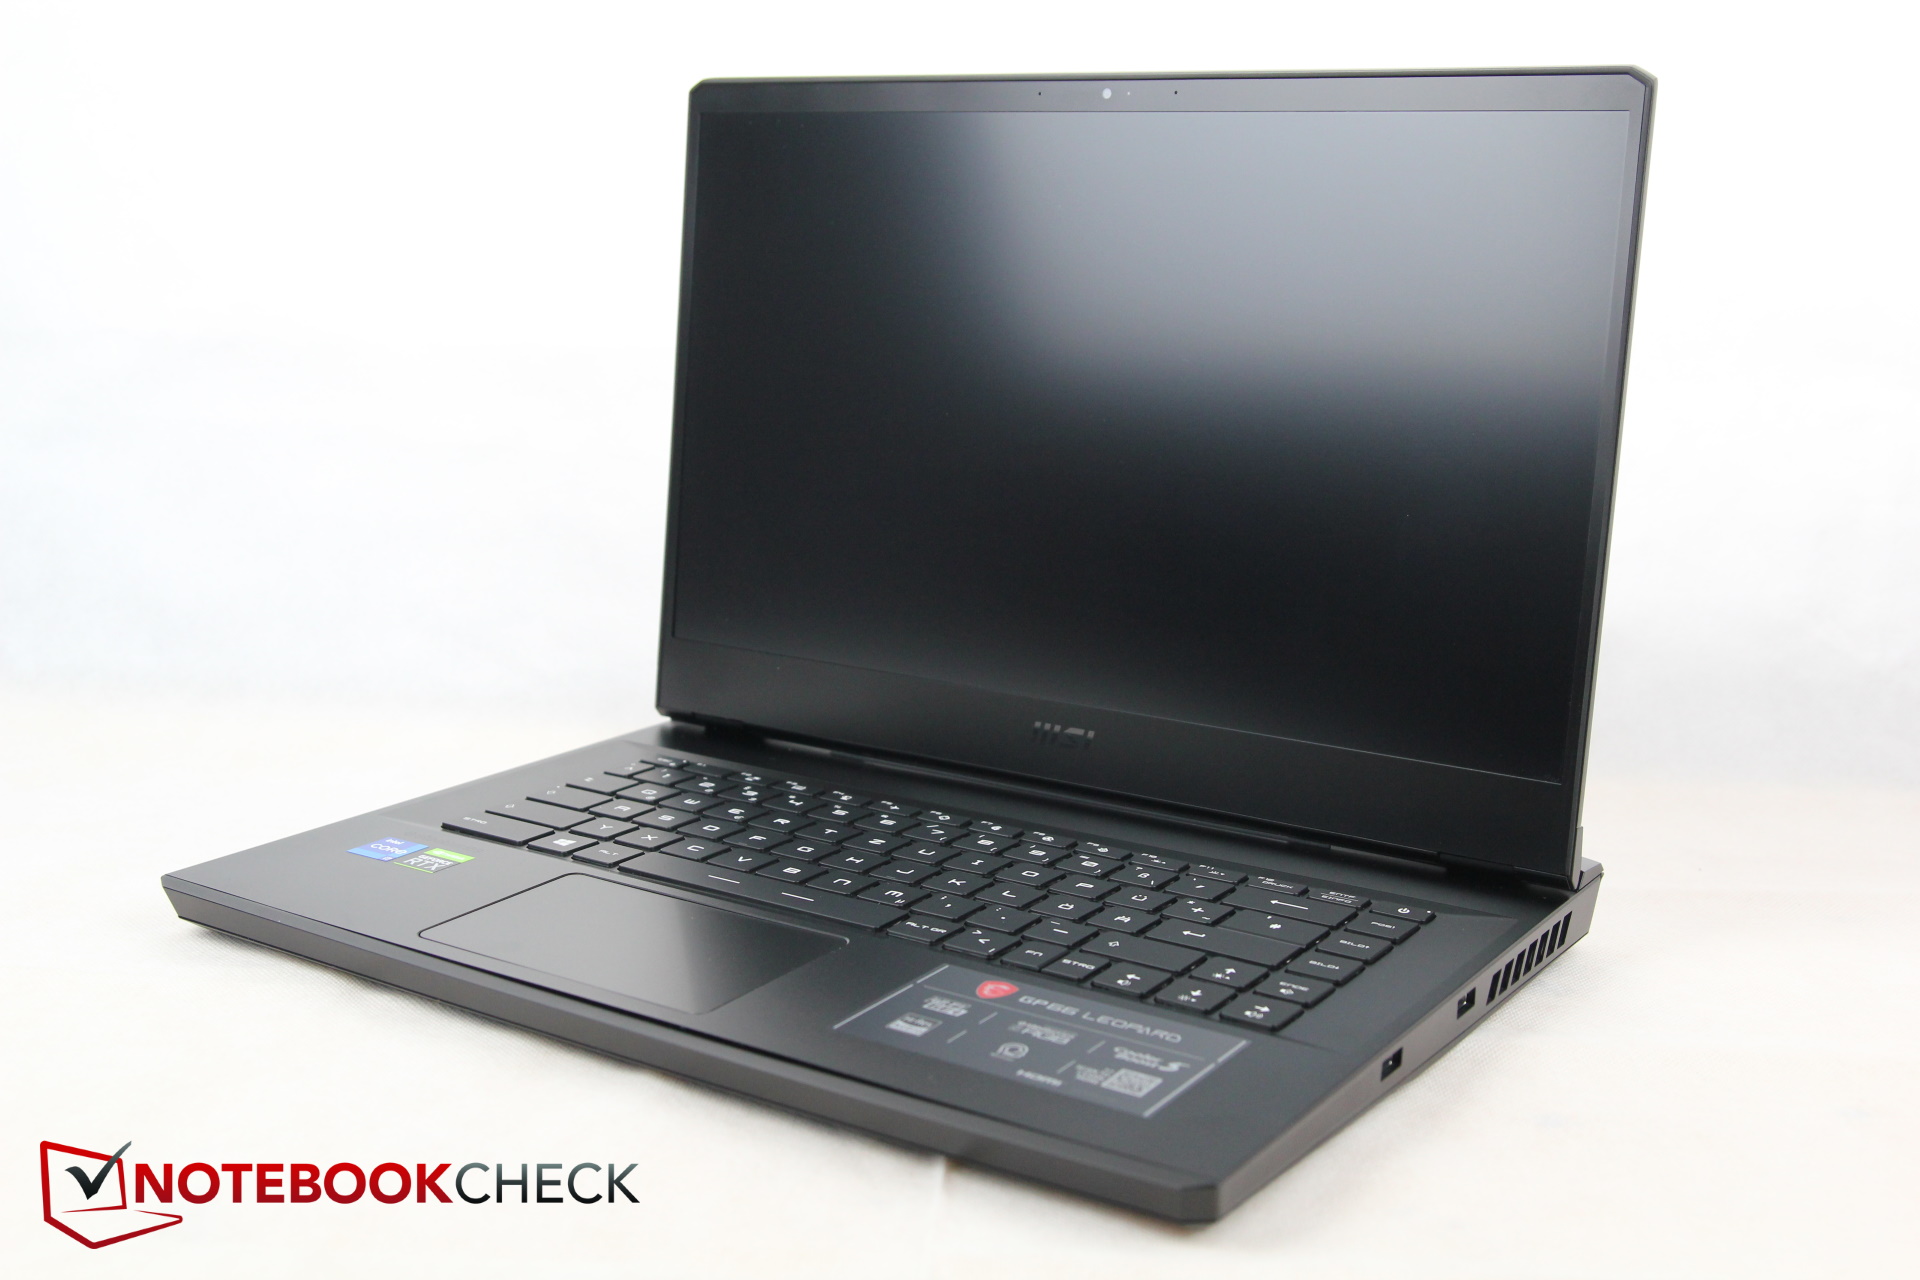
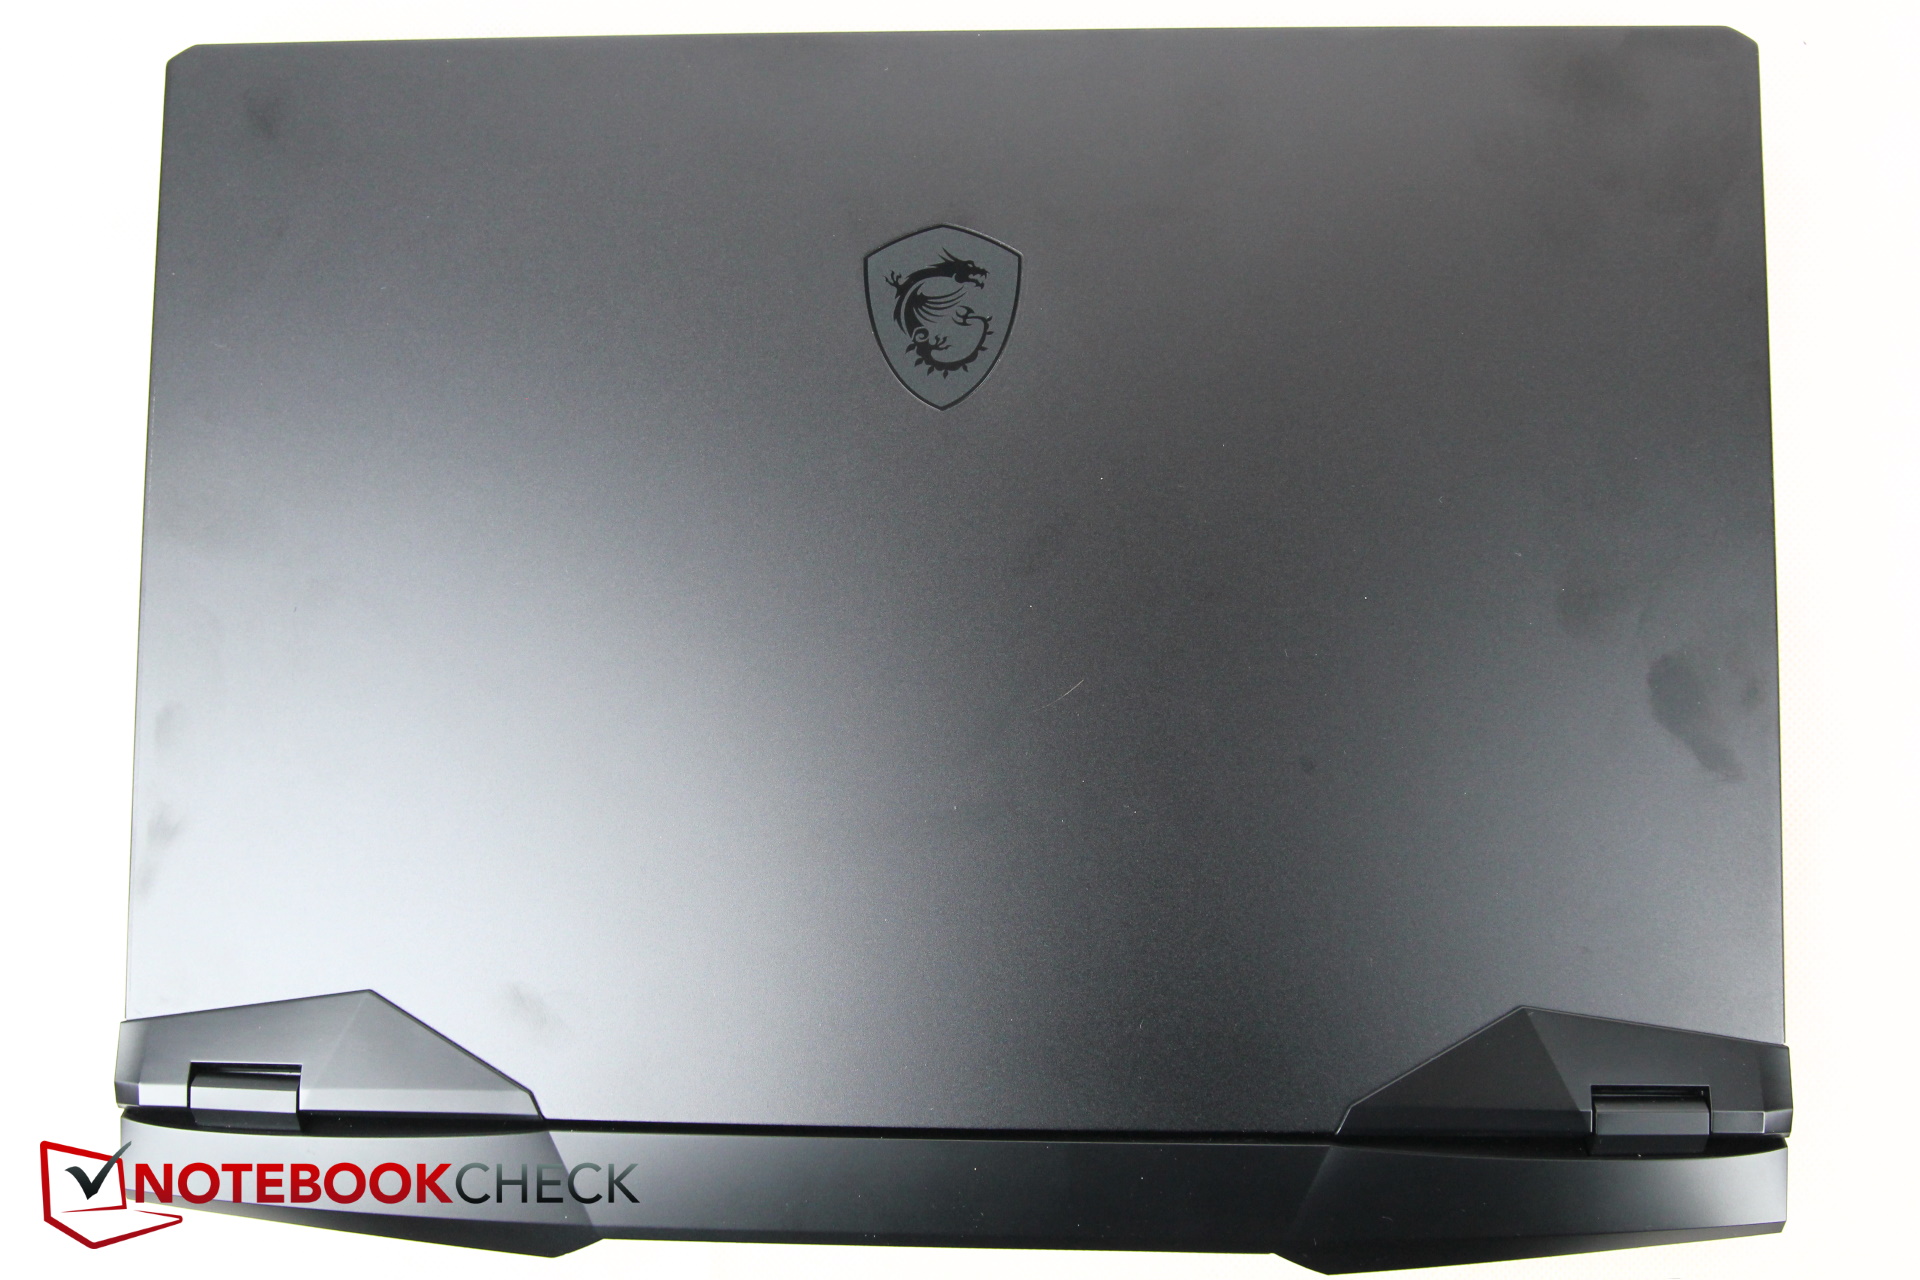
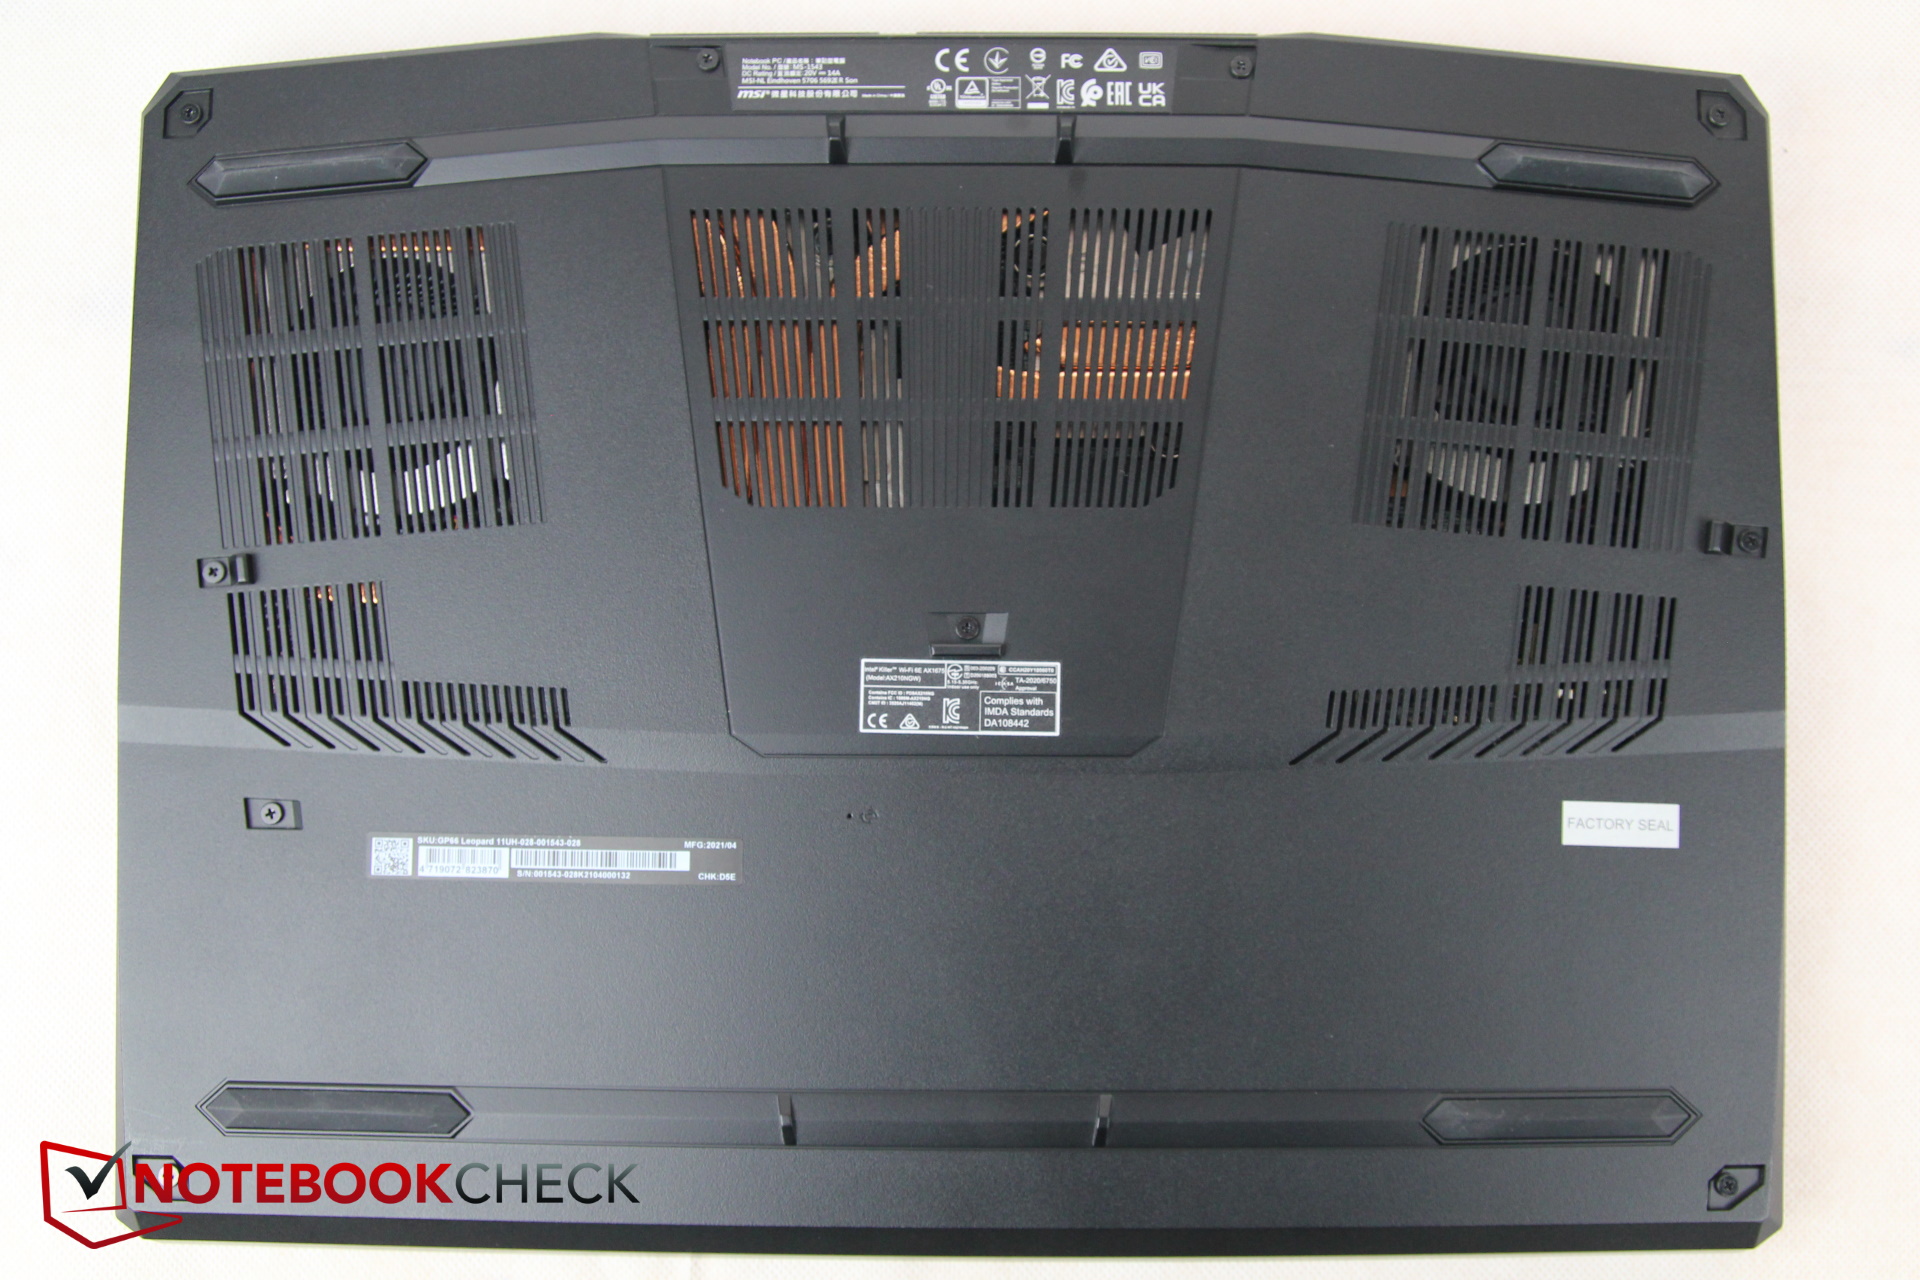
Estojo - As pequenas falhas de fabricação da MSI
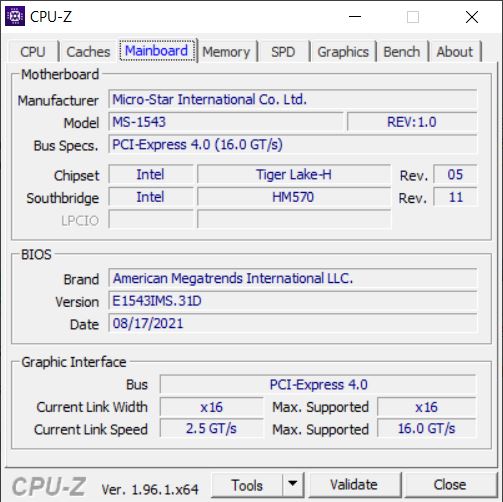
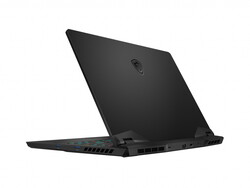
O invólucro em si permanece bastante semelhante, mas há algumas mudanças cruciais nos portos (ver abaixo). A tampa do visor e a base são feitas de metal escuro e liso, enquanto o fundo ainda é feito de plástico. Na parte traseira, o sistema de resfriamento se estende, aumentando a profundidade do laptop, semelhante ao Alienware
A tampa é surpreendentemente robusta, assim como a base em teoria. Entretanto, nossa amostra de teste tem algum problema: quando pressionamos a base à esquerda do touchpad, este último se afasta do touchpad e aparecem grandes aberturas - esta é provavelmente uma razão pela qual o touchpad chocalha
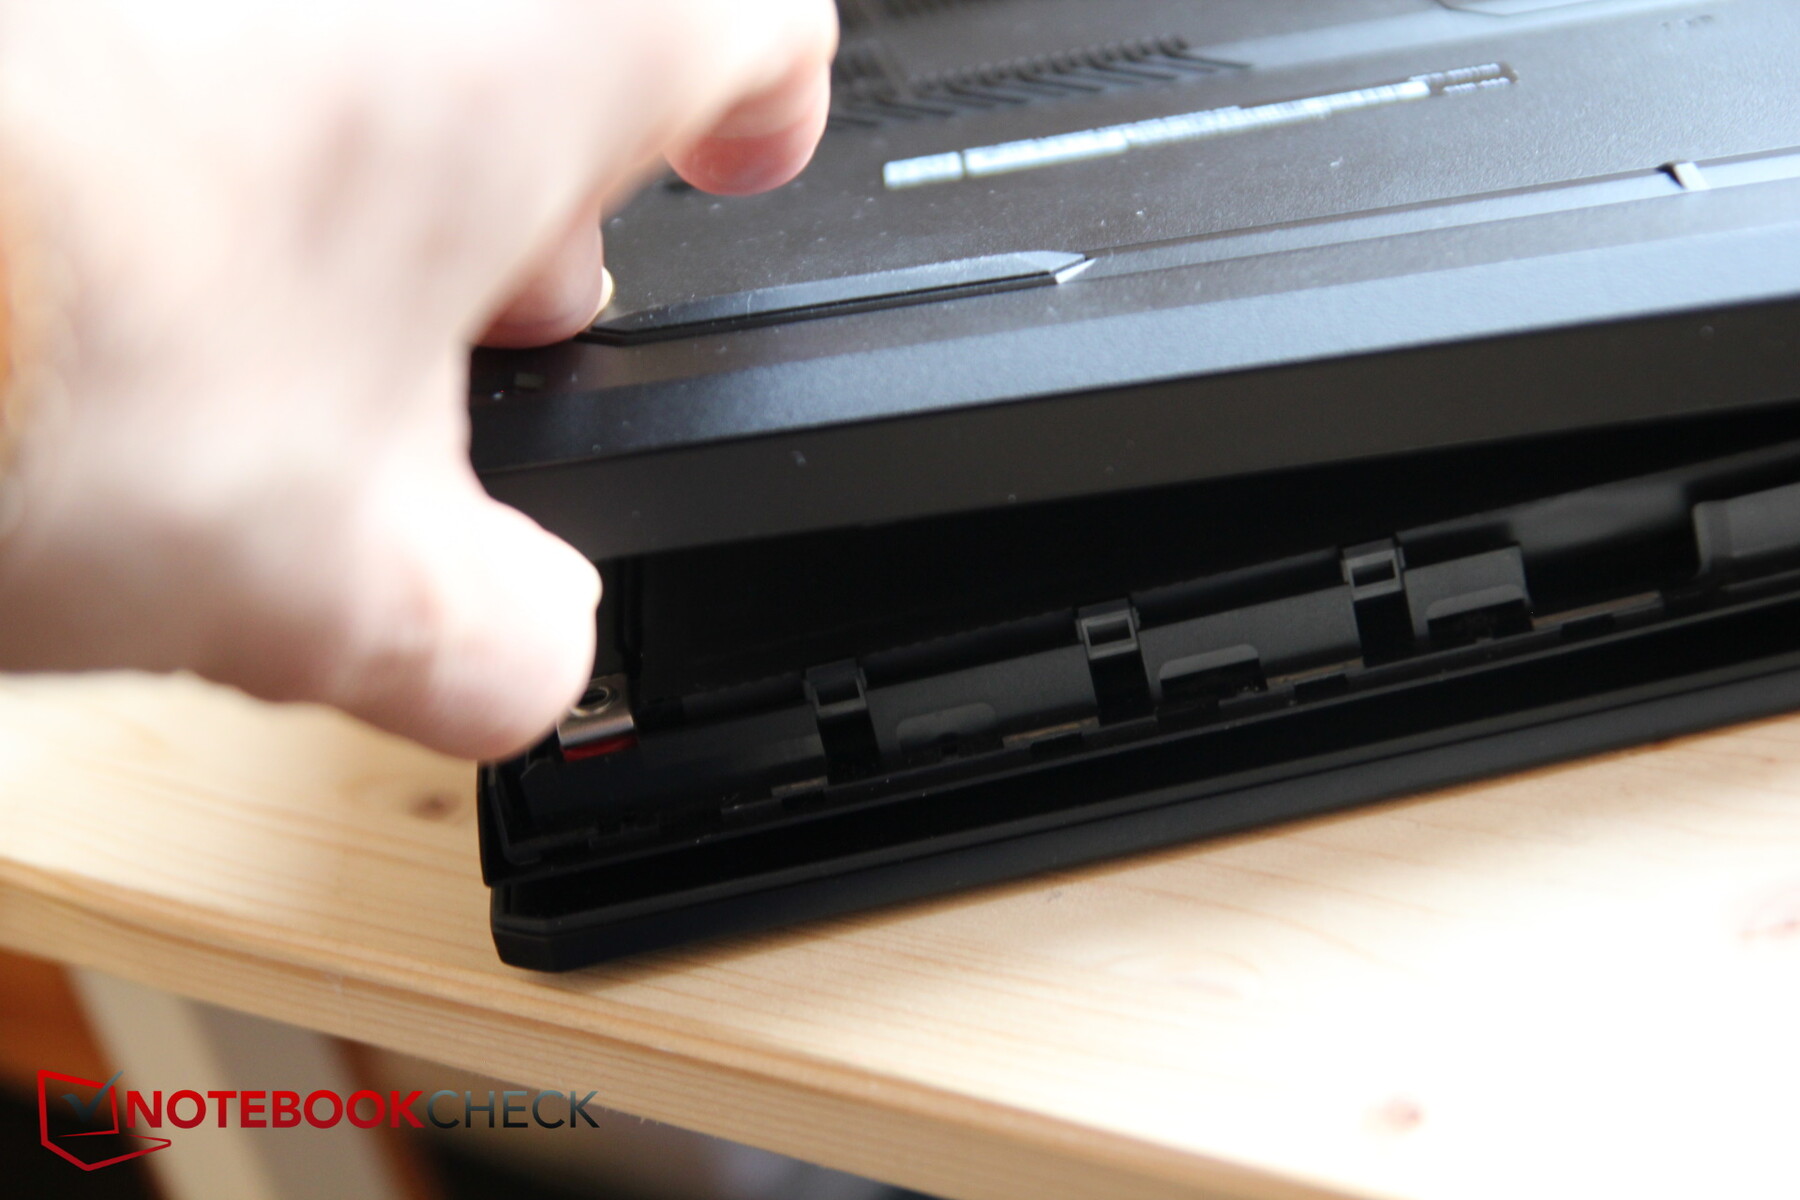
De modo geral, a base parece estar apenas bastante frouxa em relação à superfície, e a borda frontal também sai muito rapidamente, como você também pode ver na foto. Isto deve beneficiar a manutenção, mas por outro lado, não causa uma boa impressão em termos de qualidade de construção. No entanto, a construção em si parece muito robusta, portanto, deve estar tudo bem na unidade não defeituosa.
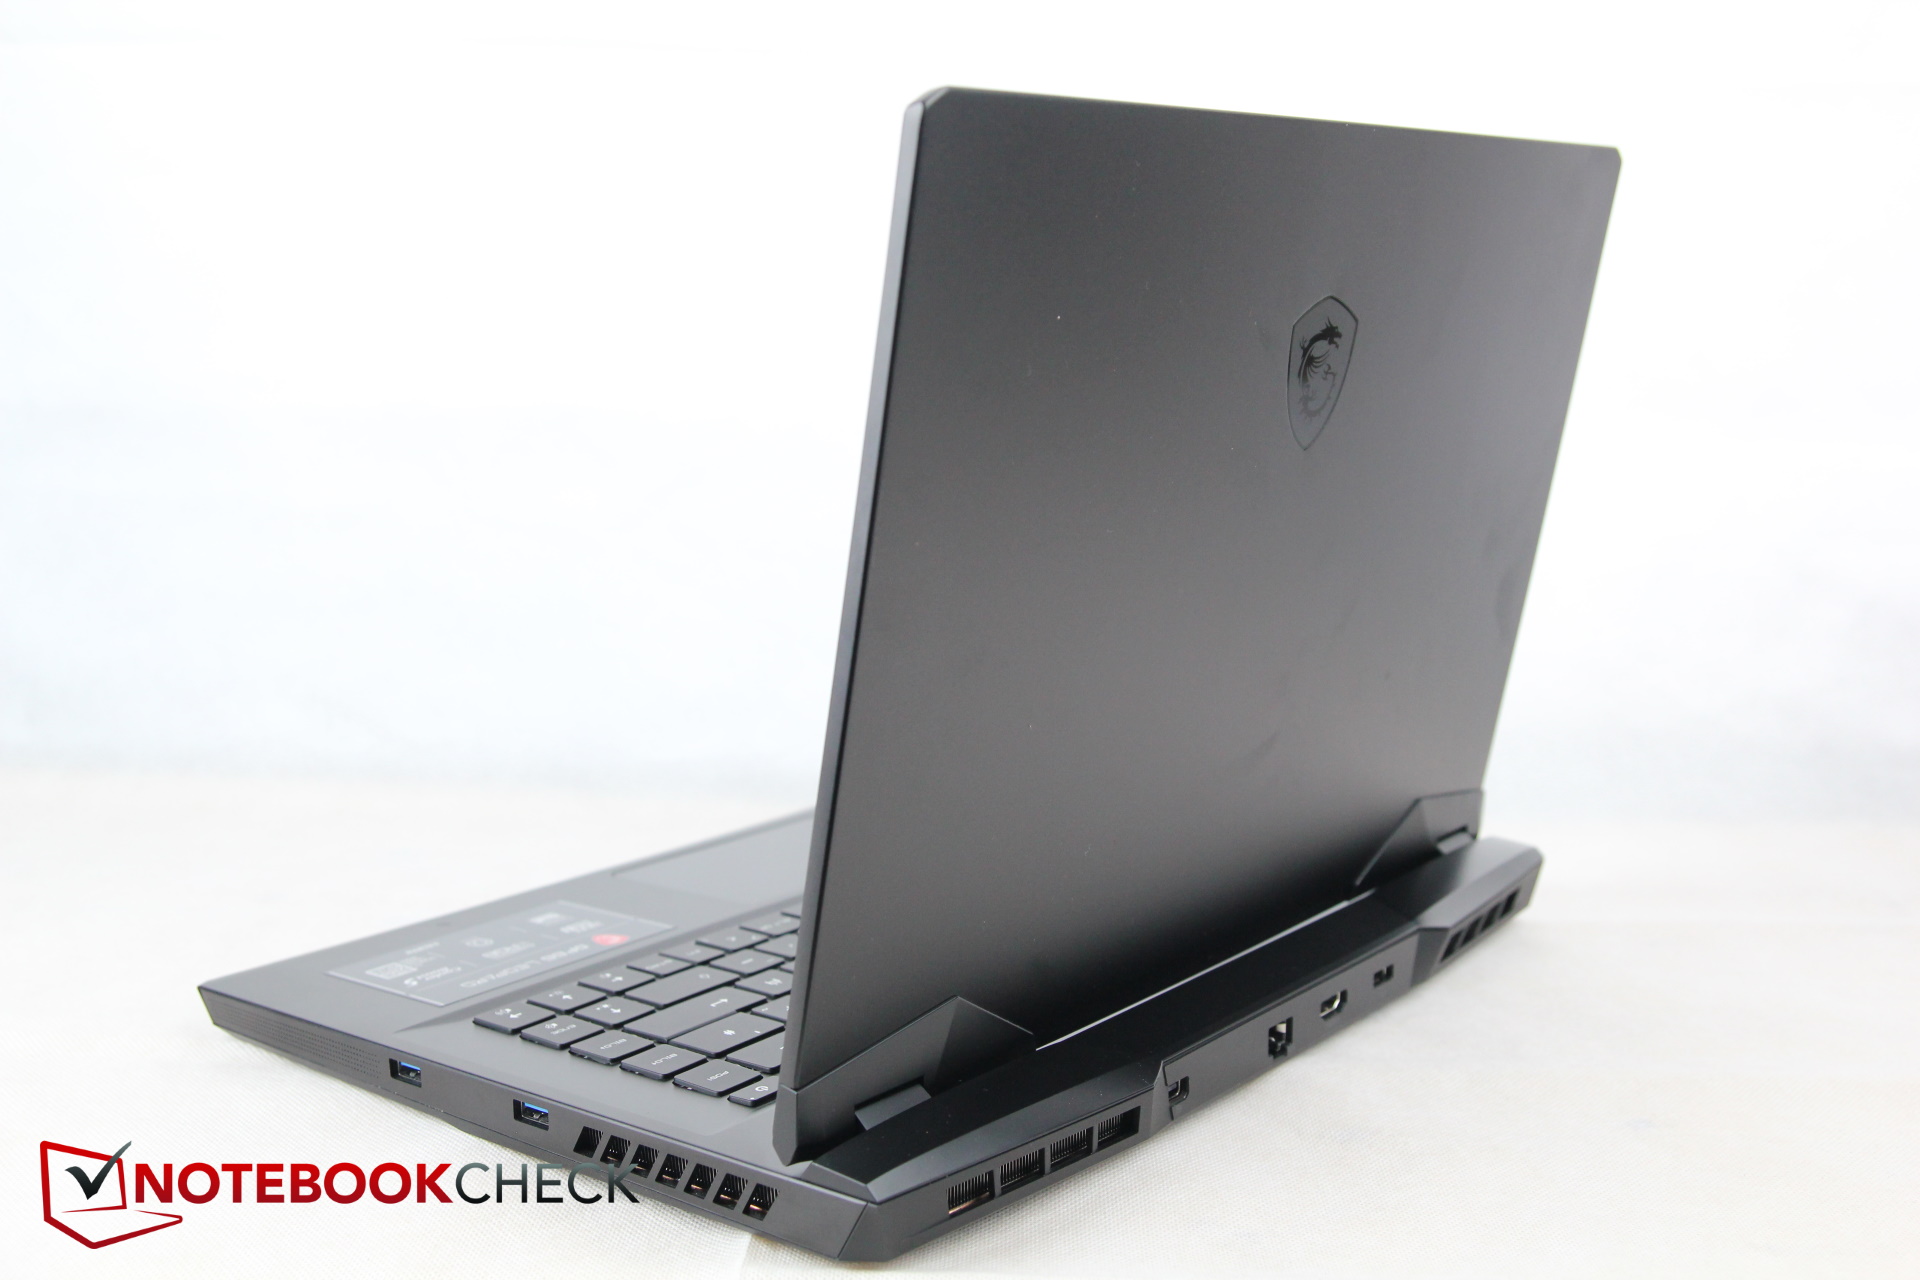
O GP66 é mais profundo que a maioria de seus rivais devido a seu sistema de refrigeração saliente. Assim, ele é muito semelhante ao Alienware, que é mais 5 mm mais profundo. Felizmente, não é tão pesado quanto este último, mas em igualdade com o resto da concorrência. Além disso, ele é um dos dispositivos mais finos na comparação. Novamente, apenas o novo Alienware é um pouco mais fino.
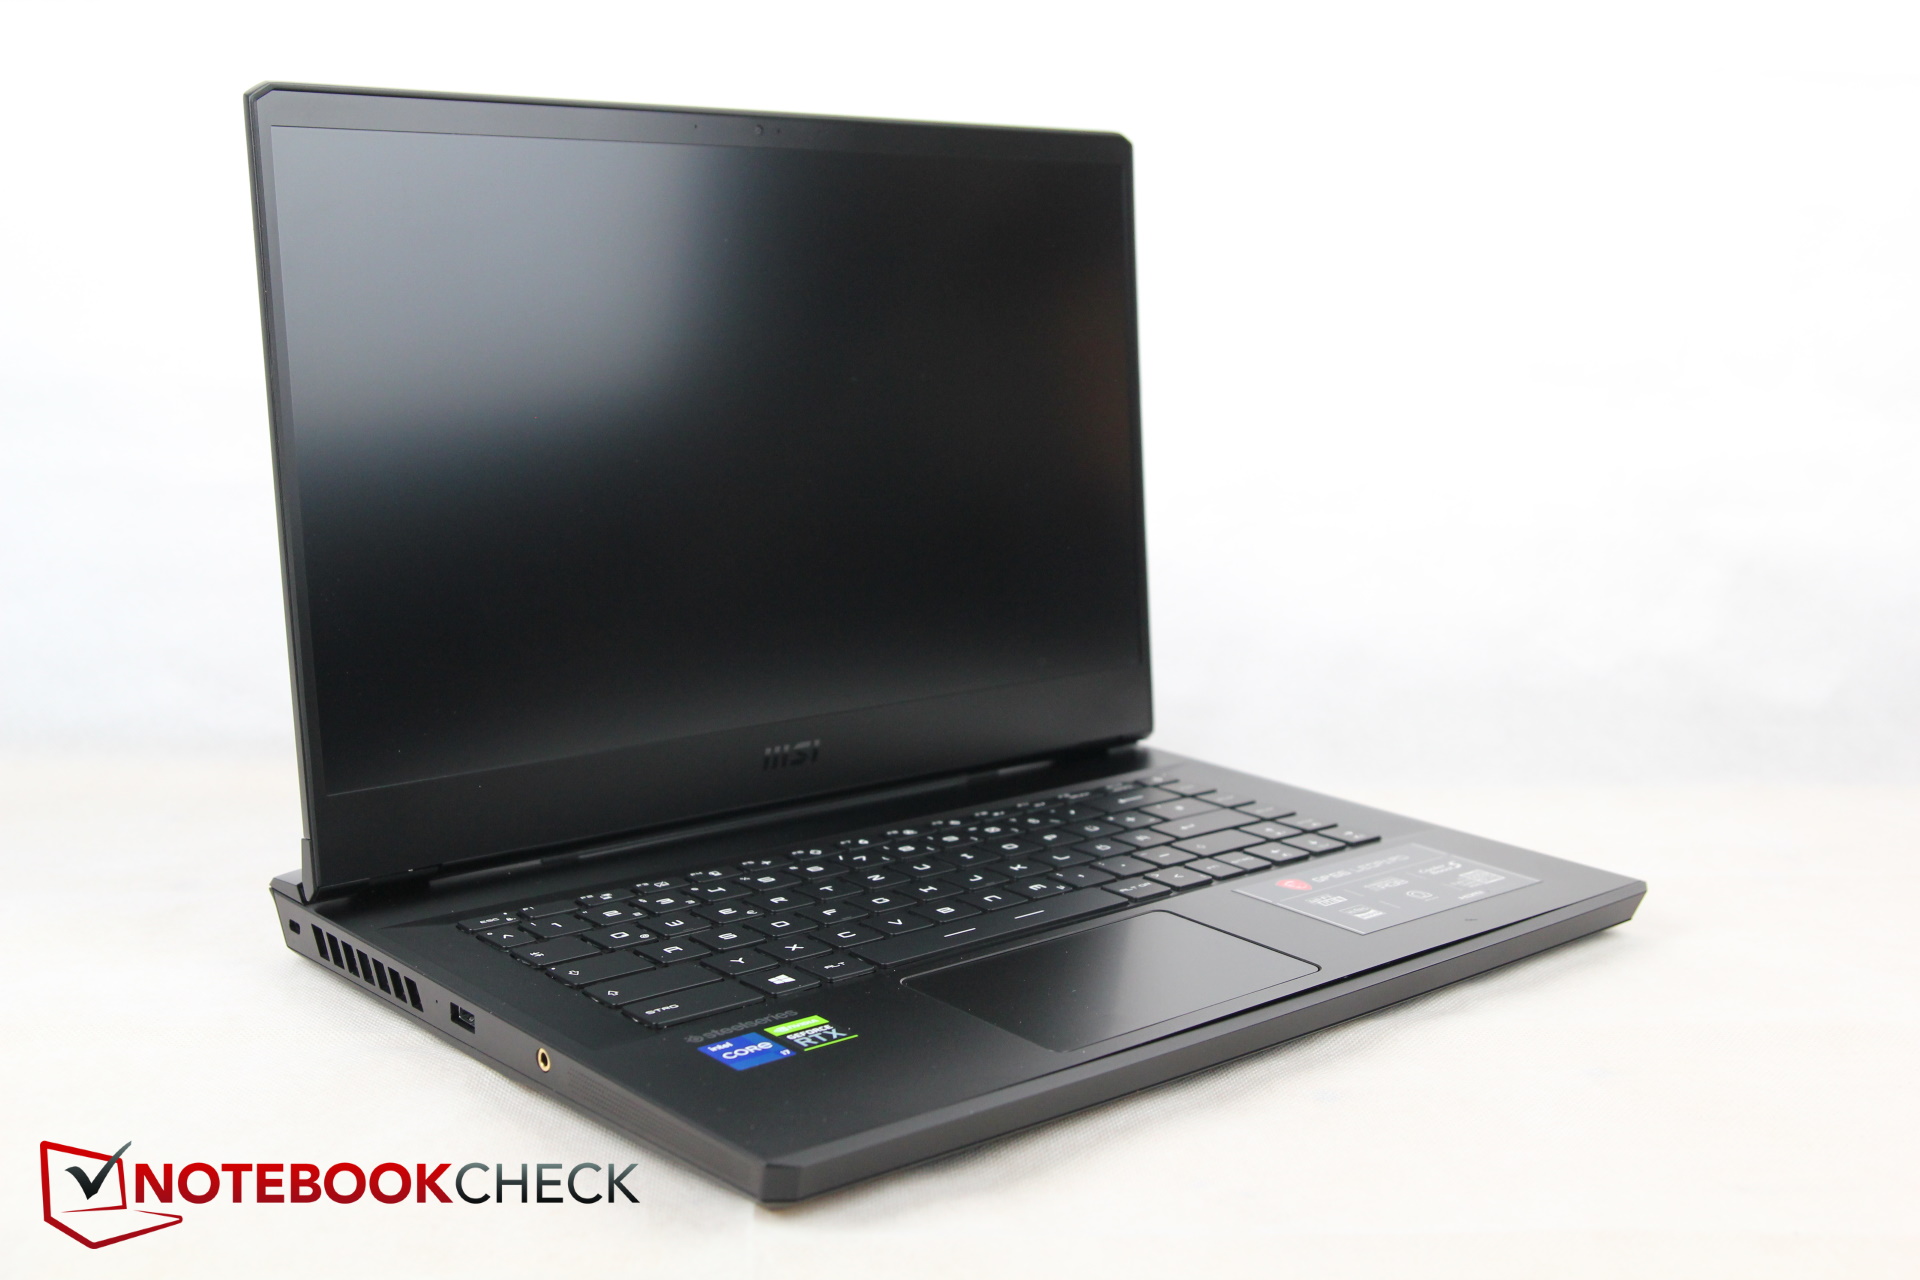
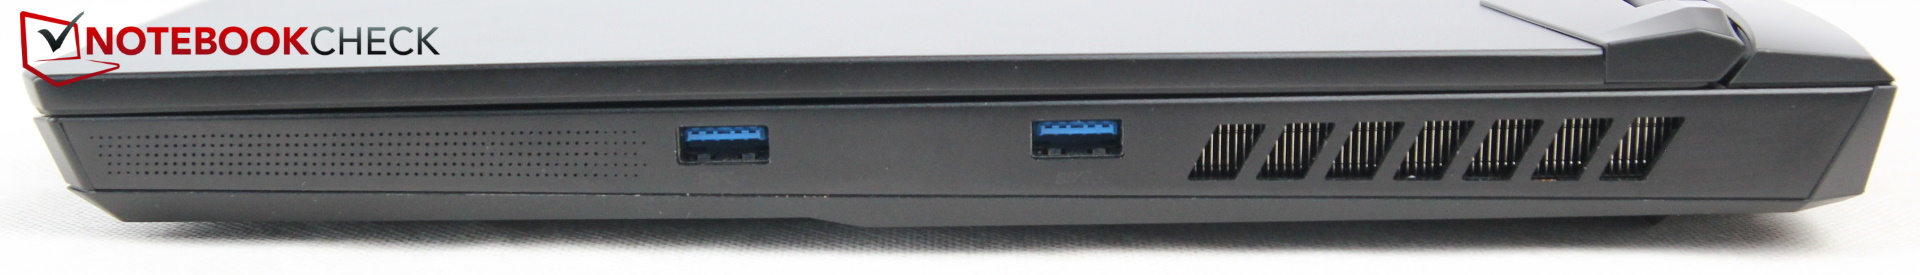
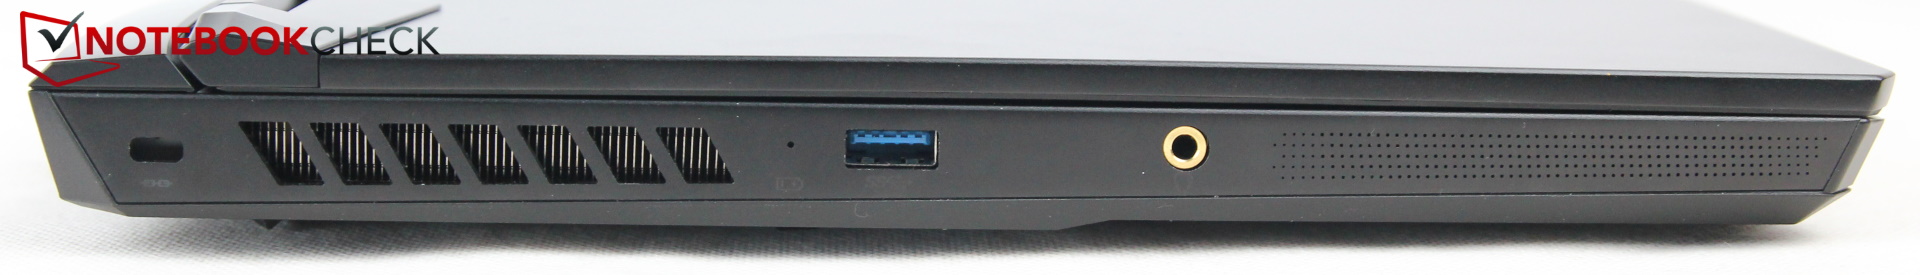
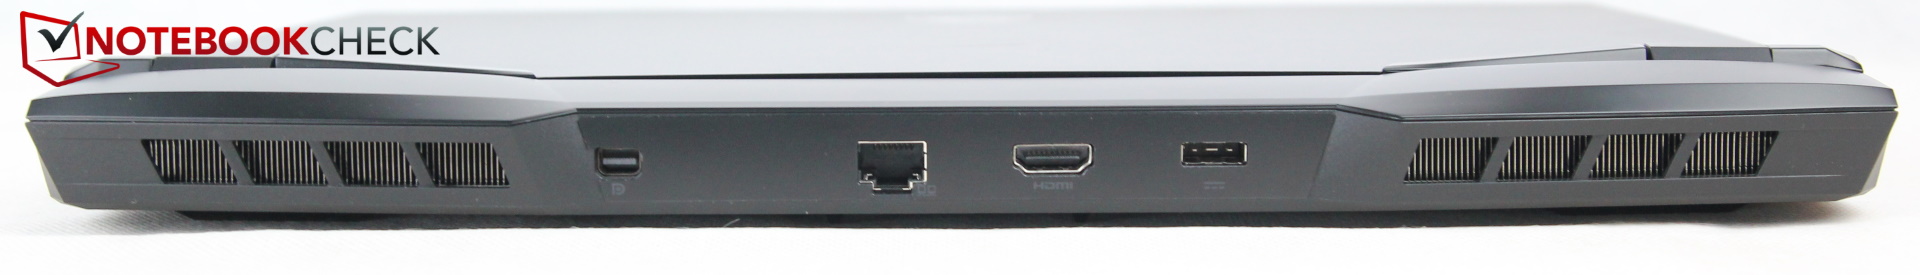
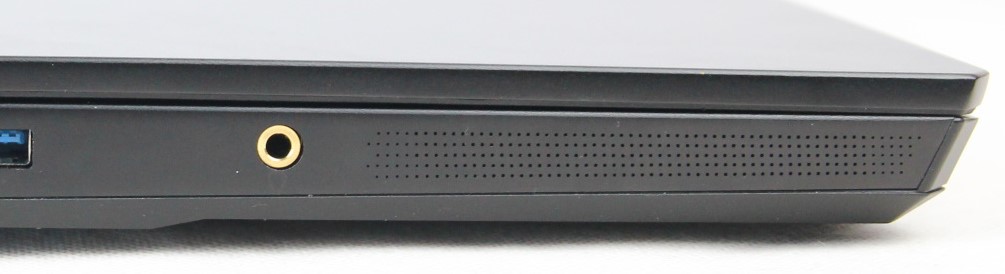
Características - Honestamente MSI, sem USB-C?
Em comparação com seu predecessor, o GP66 10UG, MSI deixou cair a porta MiniDP em favor de uma porta USB-C. Com o GP66 11UH atual, a MSI dá um passo atrás e traz de volta o Mini DisplayPort, o que é um movimento bem-vindo. Mas o fabricante também elimina a porta USB-C! Assim, o GP66 Leopard é o único laptop moderno sem uma porta USB-C! Não sabemos por que a MSI fez isto, já que uma porta USB-C se tornou o padrão absoluto hoje em dia. Portanto, como efeito colateral, o laptop só tem três portas USB. Também não há um leitor SD.
Os poucos portos restantes estão bem distribuídos nos três lados, ou seja, esquerda, direita e traseira da caixa. A MSI realmente tem que ser elogiada aqui, pois há muito espaço entre os vários portos, o que pelo menos coloca as coisas em perspectiva um pouco, tendo em vista a escassa variedade de opções. Todos os cabos potencialmente grossos (HDMI, DP, LAN, alimentação) são encaminhados para a parte traseira, e há apenas USB-A e porta para fones de ouvido nas laterais - muito bom
Comunicação
A MSI substitui o Intel AX201 por um Killer Wi-Fi 6E AX1675 com suporte a Bluetooth 5.2. Isto não faz com que o Wi-Fi seja muito mais rápido. Embora esteja na faixa dos gigabit, ele fica aquém do potencial do módulo. Especialmente a curva de recepção tem uma inclinação descendente, mas a potência de transmissão é bastante constante.
Webcam
Uma webcam HD padrão fornece uma imagem aceitável na melhor das hipóteses em Zoom, Equipes e outras aplicações de conferência. A imagem parece lavada mesmo em boa luz, e os desvios de cor são bastante pronunciados, especialmente nas faixas de cores vermelha e verde.


Segurança
Um porto de Kensington está a bordo, assim como o TPM. Entretanto, não há leitor de impressões digitais ou outra tecnologia de segurança - o que é aceitável para um laptop de jogos.
Manutenção
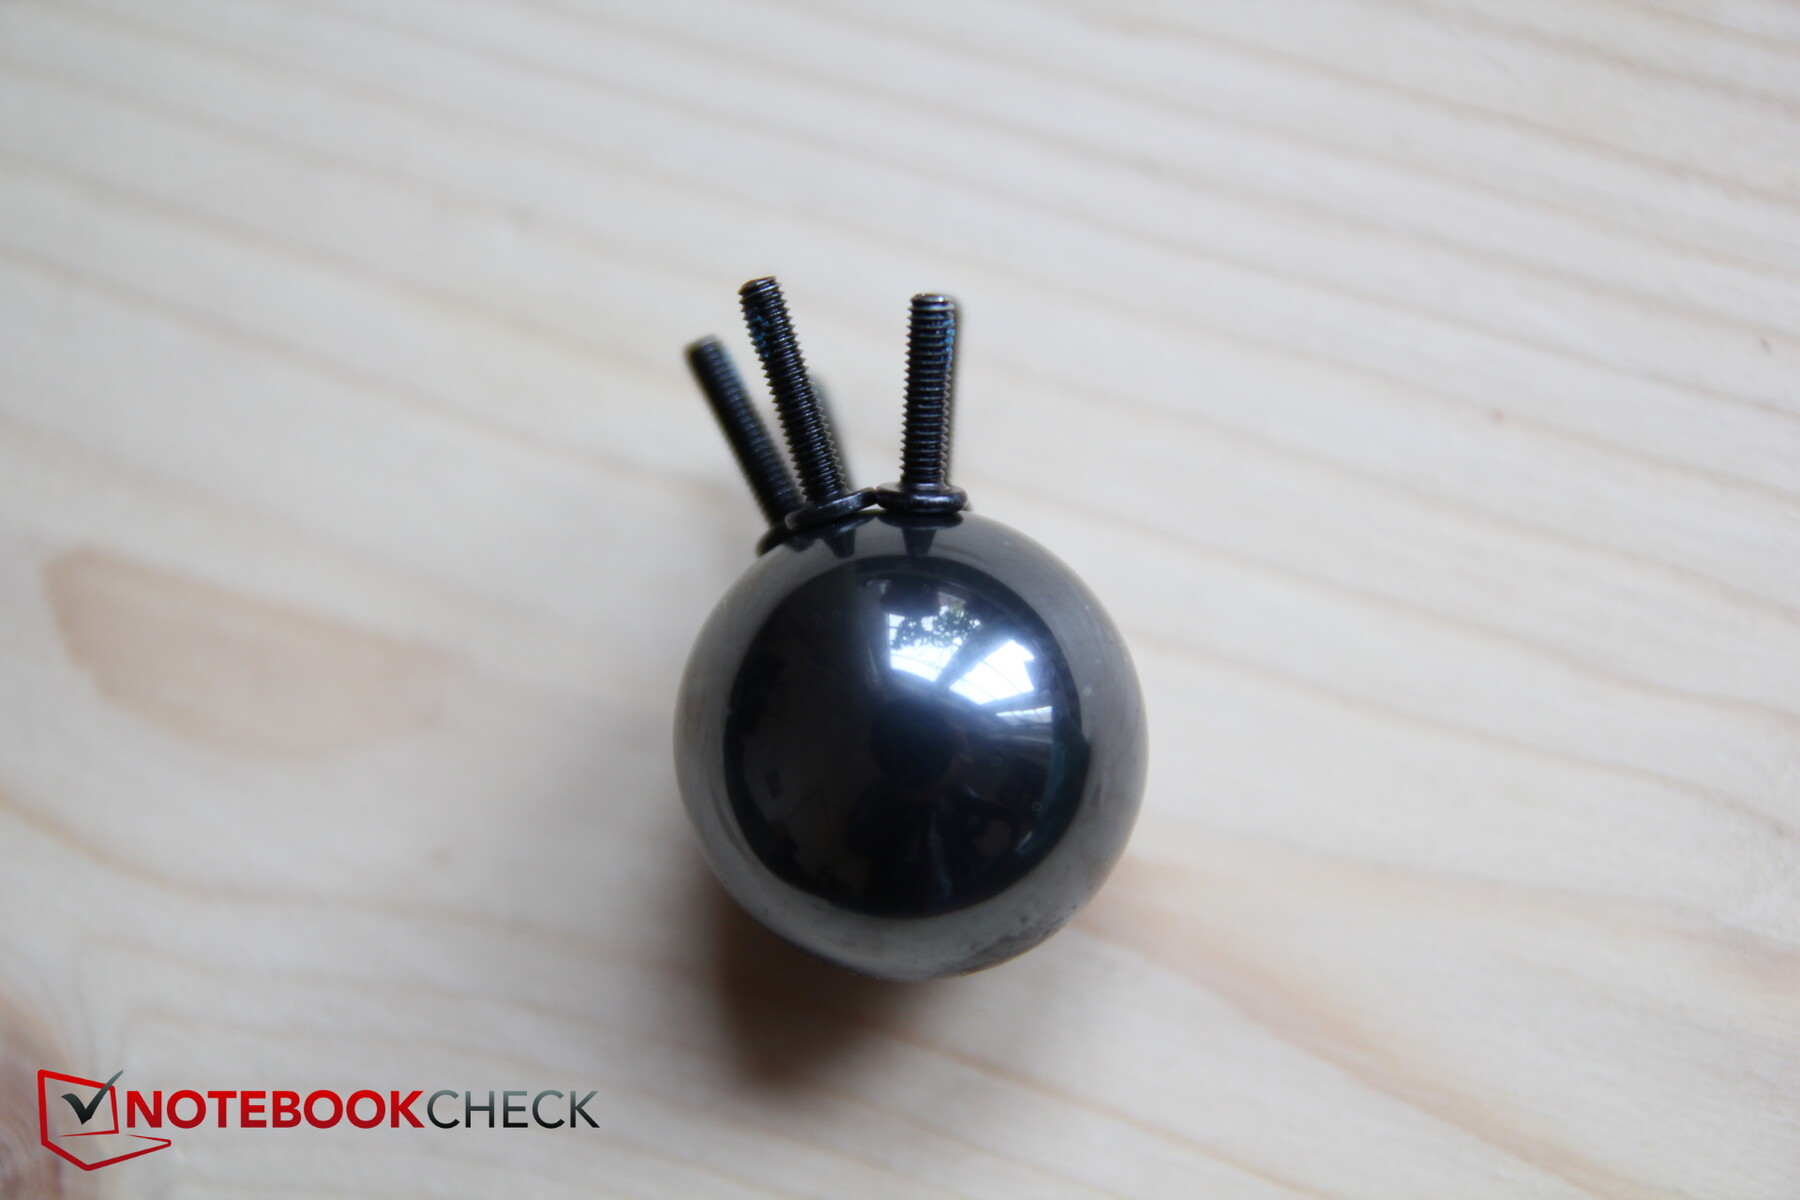
A placa de base é fixada por pelo menos 10 parafusos Phillips (1 mais curto que todos os outros) e várias travas. E embora a borda frontal de nosso modelo já estivesse parcialmente desprendida antes, a manutenção provou ser mais complicada do que o esperado.
A borda dianteira saiu bem, mas as laterais e a borda traseira não se soltaram de forma alguma. Especialmente na área da tomada do fone de ouvido, a placa de base ainda estava tão firmemente travada (não diretamente na borda, mas dentro) que tivemos que abortar a tentativa de abertura apesar da ferramenta de alavanca, devido ao medo de danificar a fina placa de plástico. A borda traseira também não cedeu. Os parafusos ocultos não deveriam ter sido o problema, pelo menos na lateral.
A construção interna deve ser semelhante à MSI GP66 Leopardo 10UG (ver seção de manutenção), mas a sua abertura também foi problemática
Acessórios & Garantia
Além da fonte de alimentação, não há outros acessórios na caixa. Nota: A MSI envia o GP66 Leopard sem um sistema operacional, mas várias lojas devem incluir uma licença Windows.
A MSI oferece uma garantia de 2 anos com serviço de coleta e devolução.
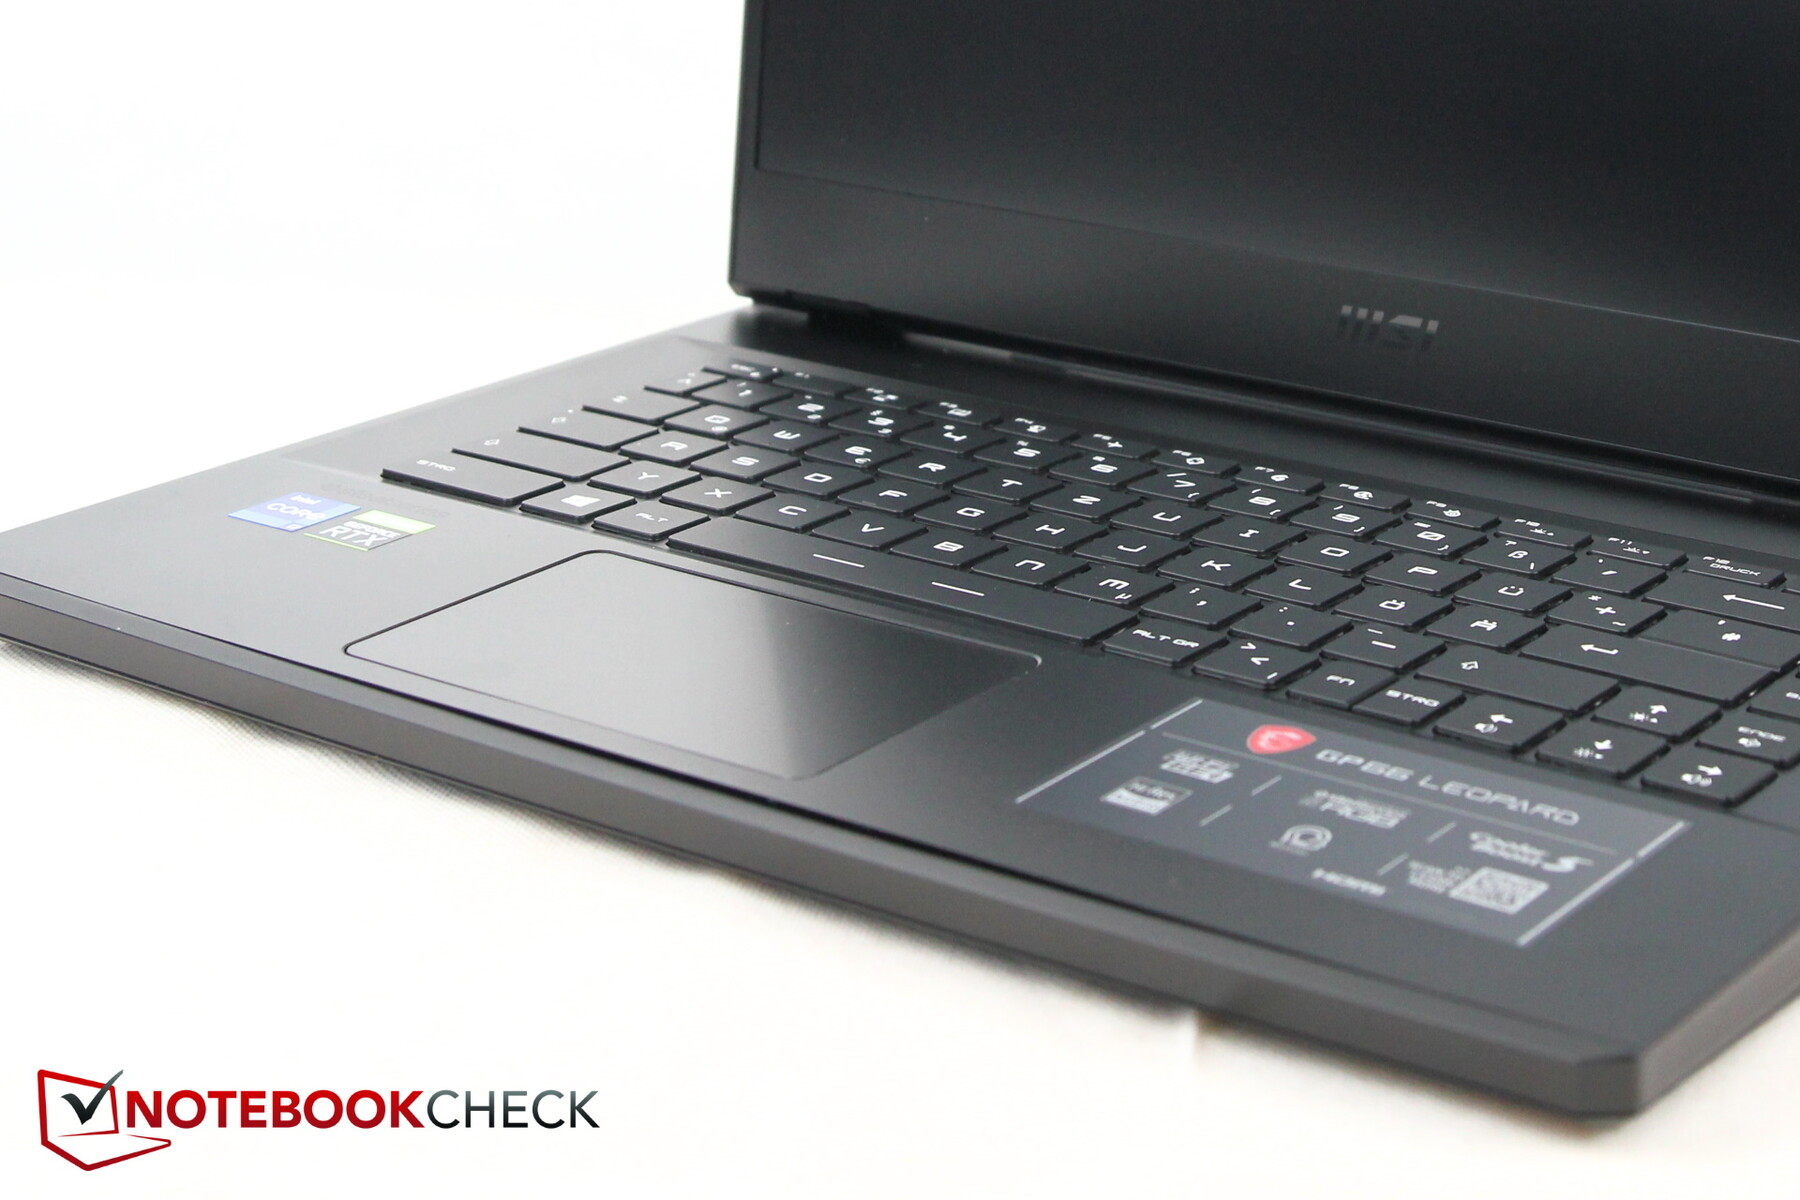
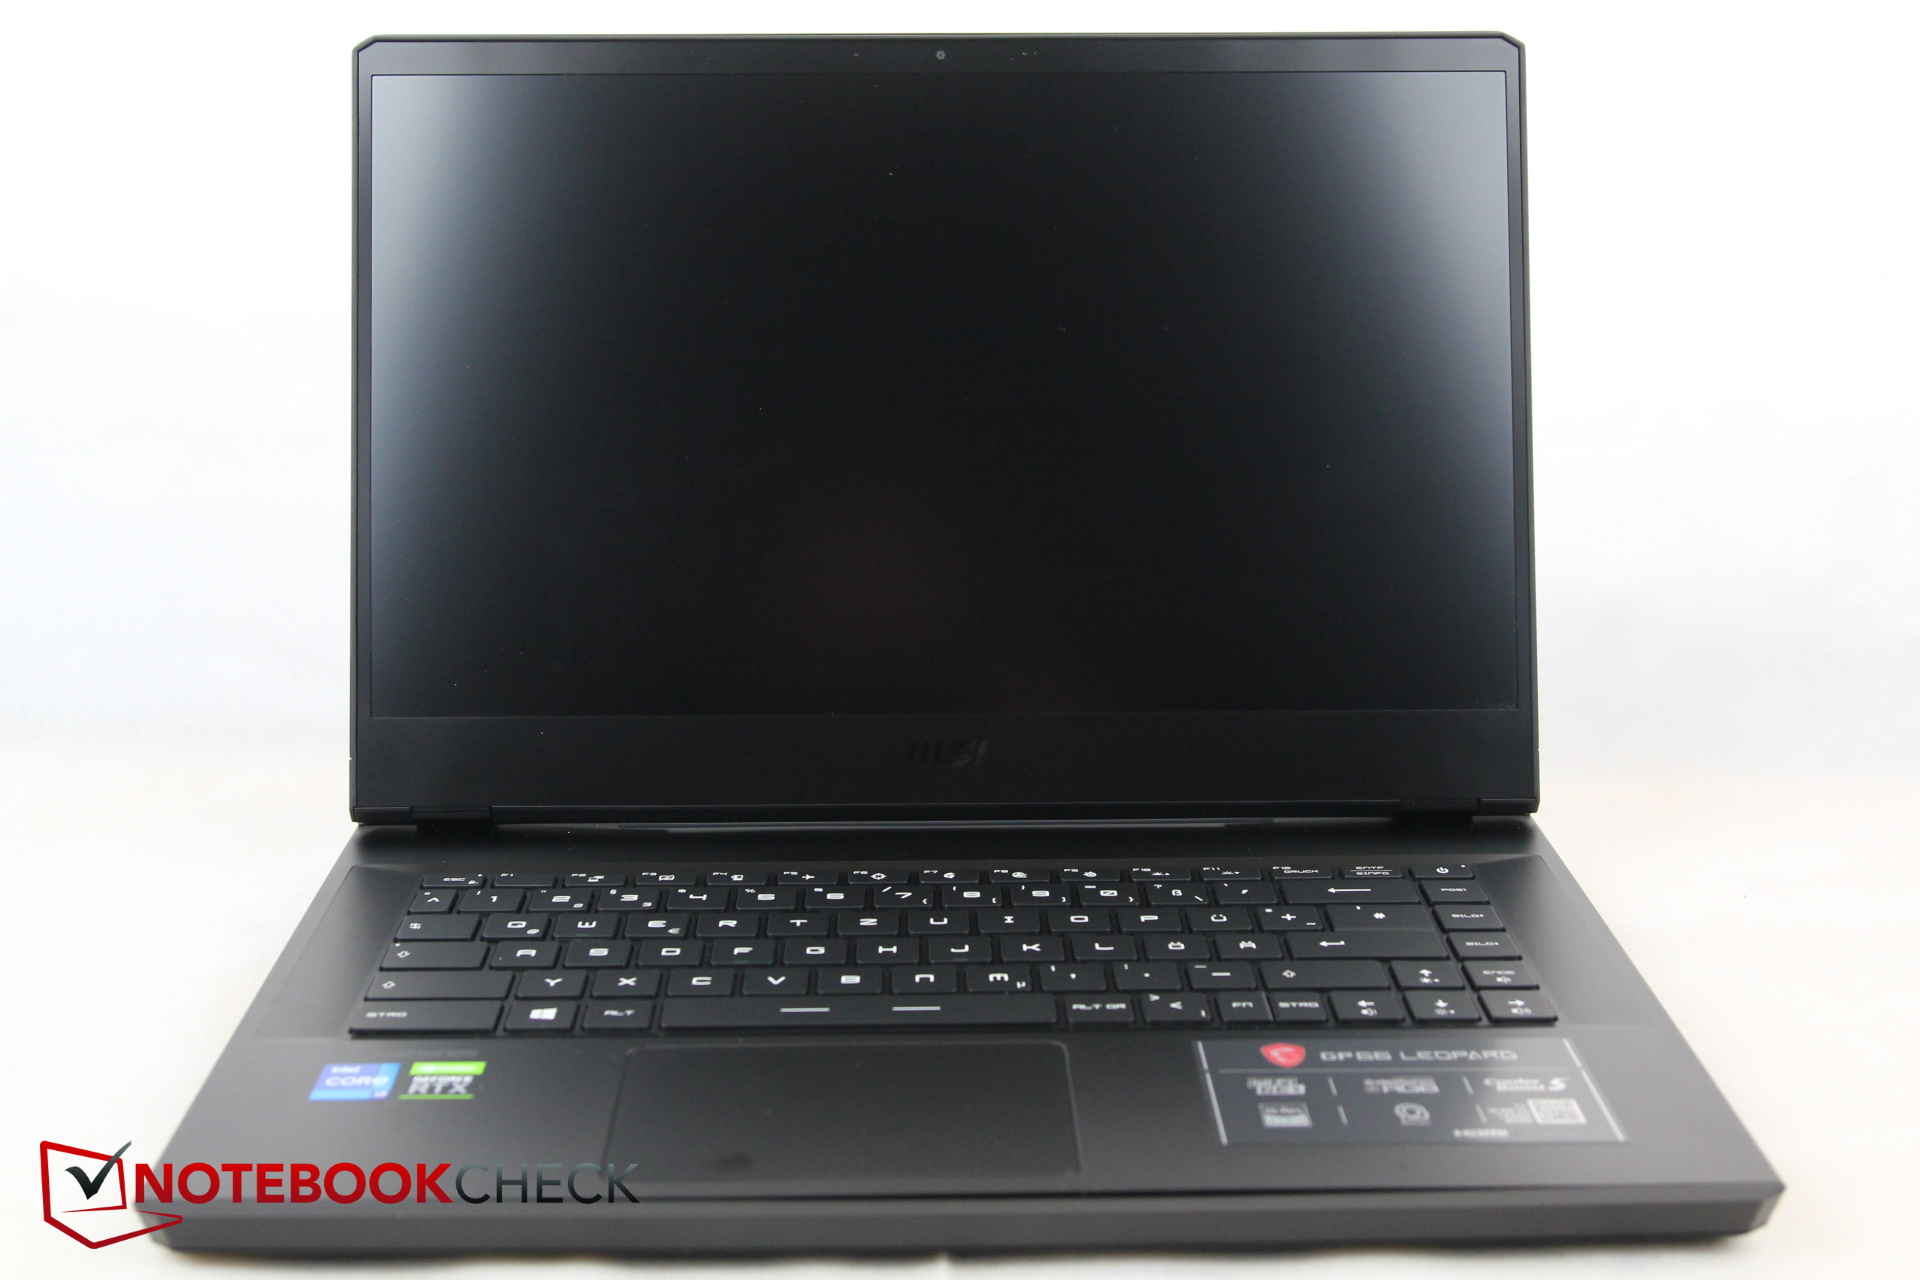
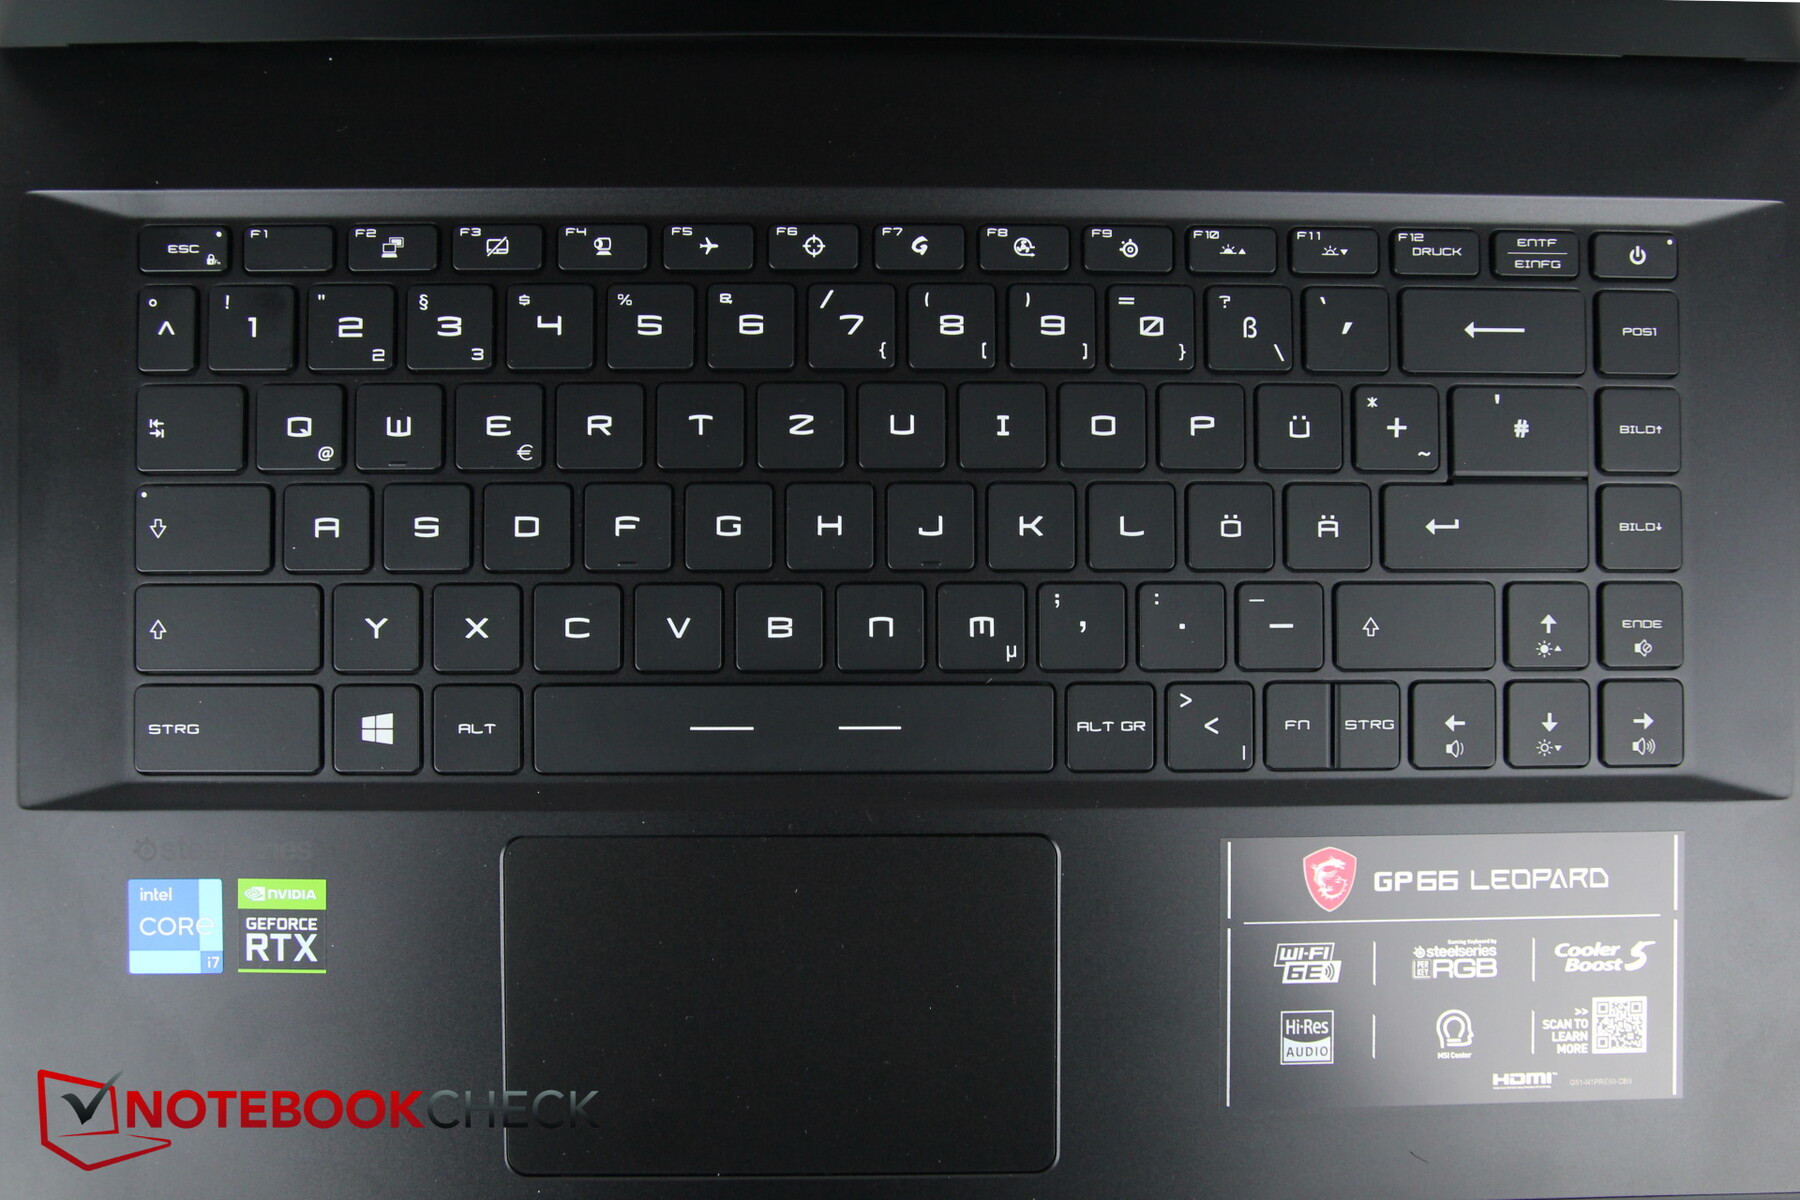
Dispositivos de entrada - Bom teclado, guizos de touchpad
Teclado
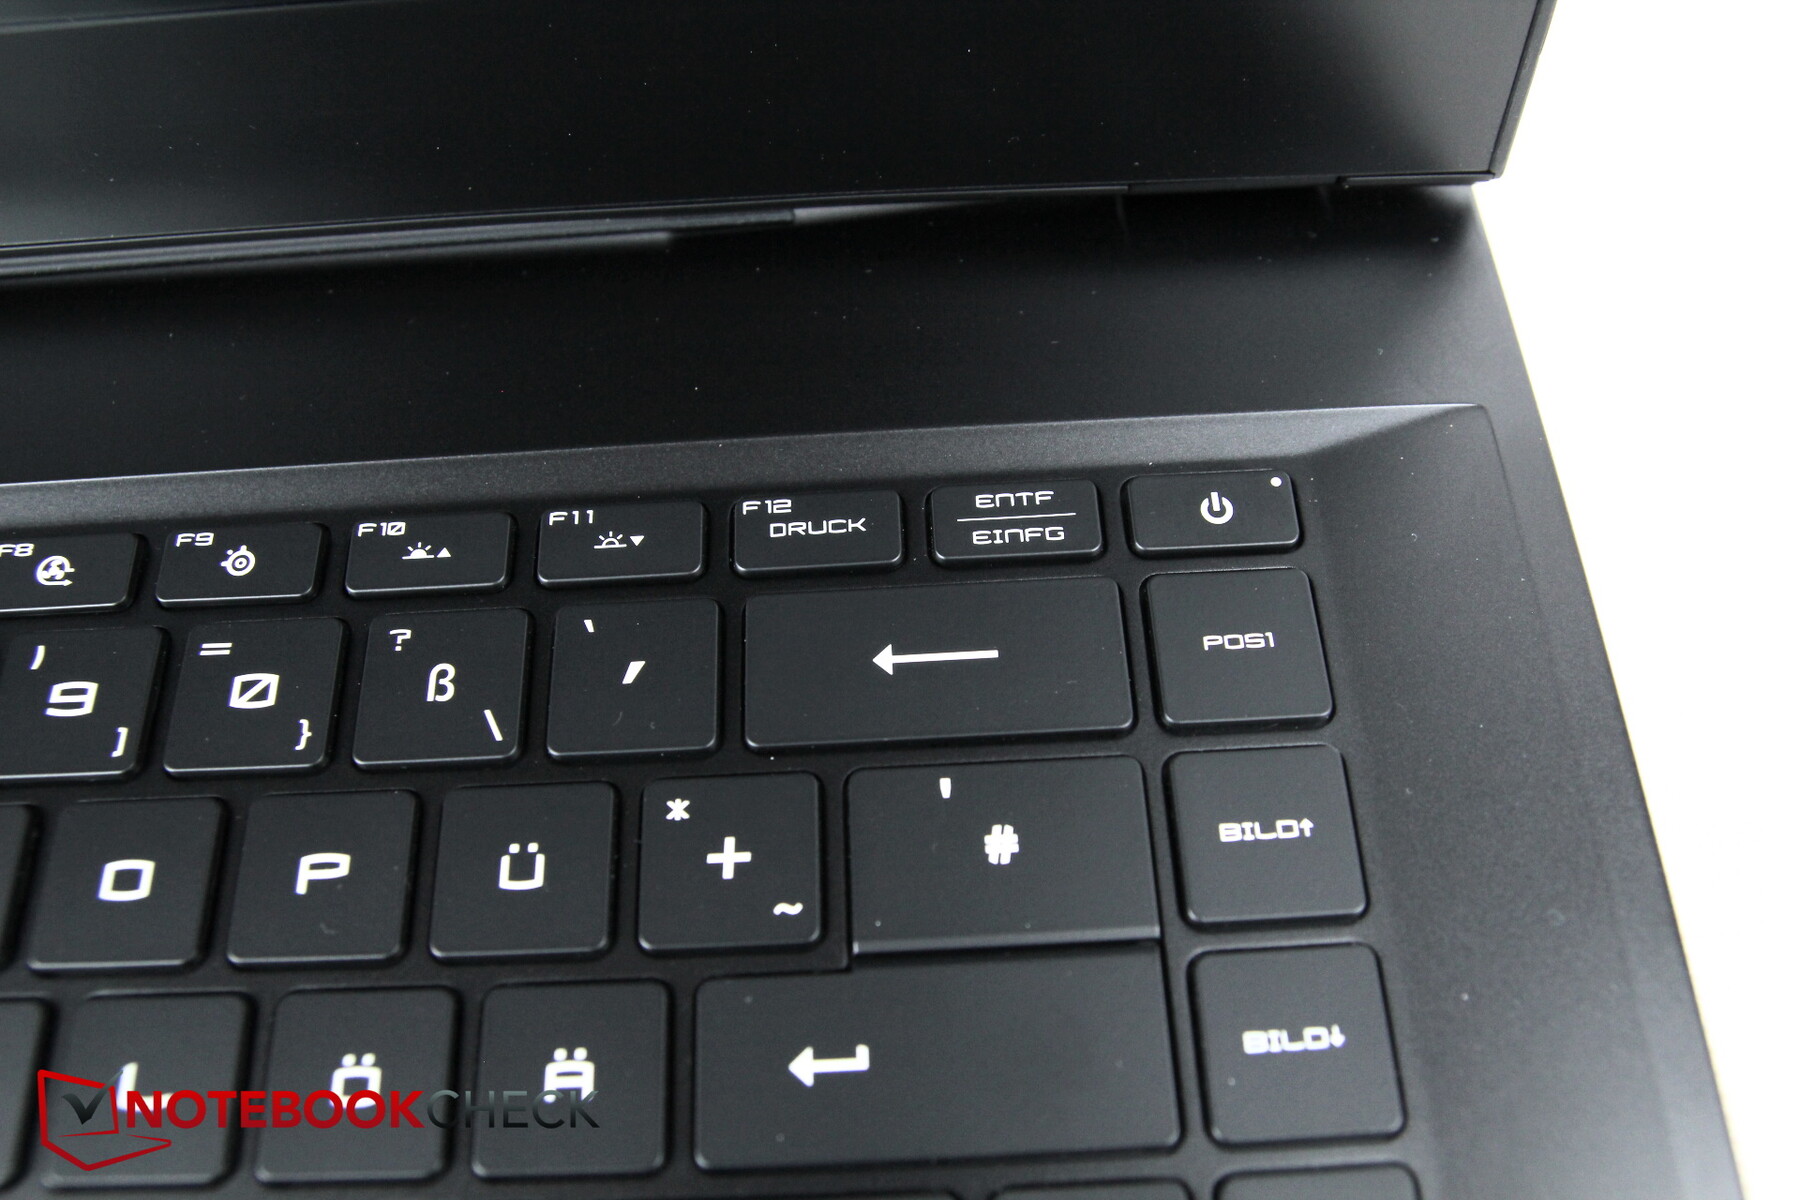
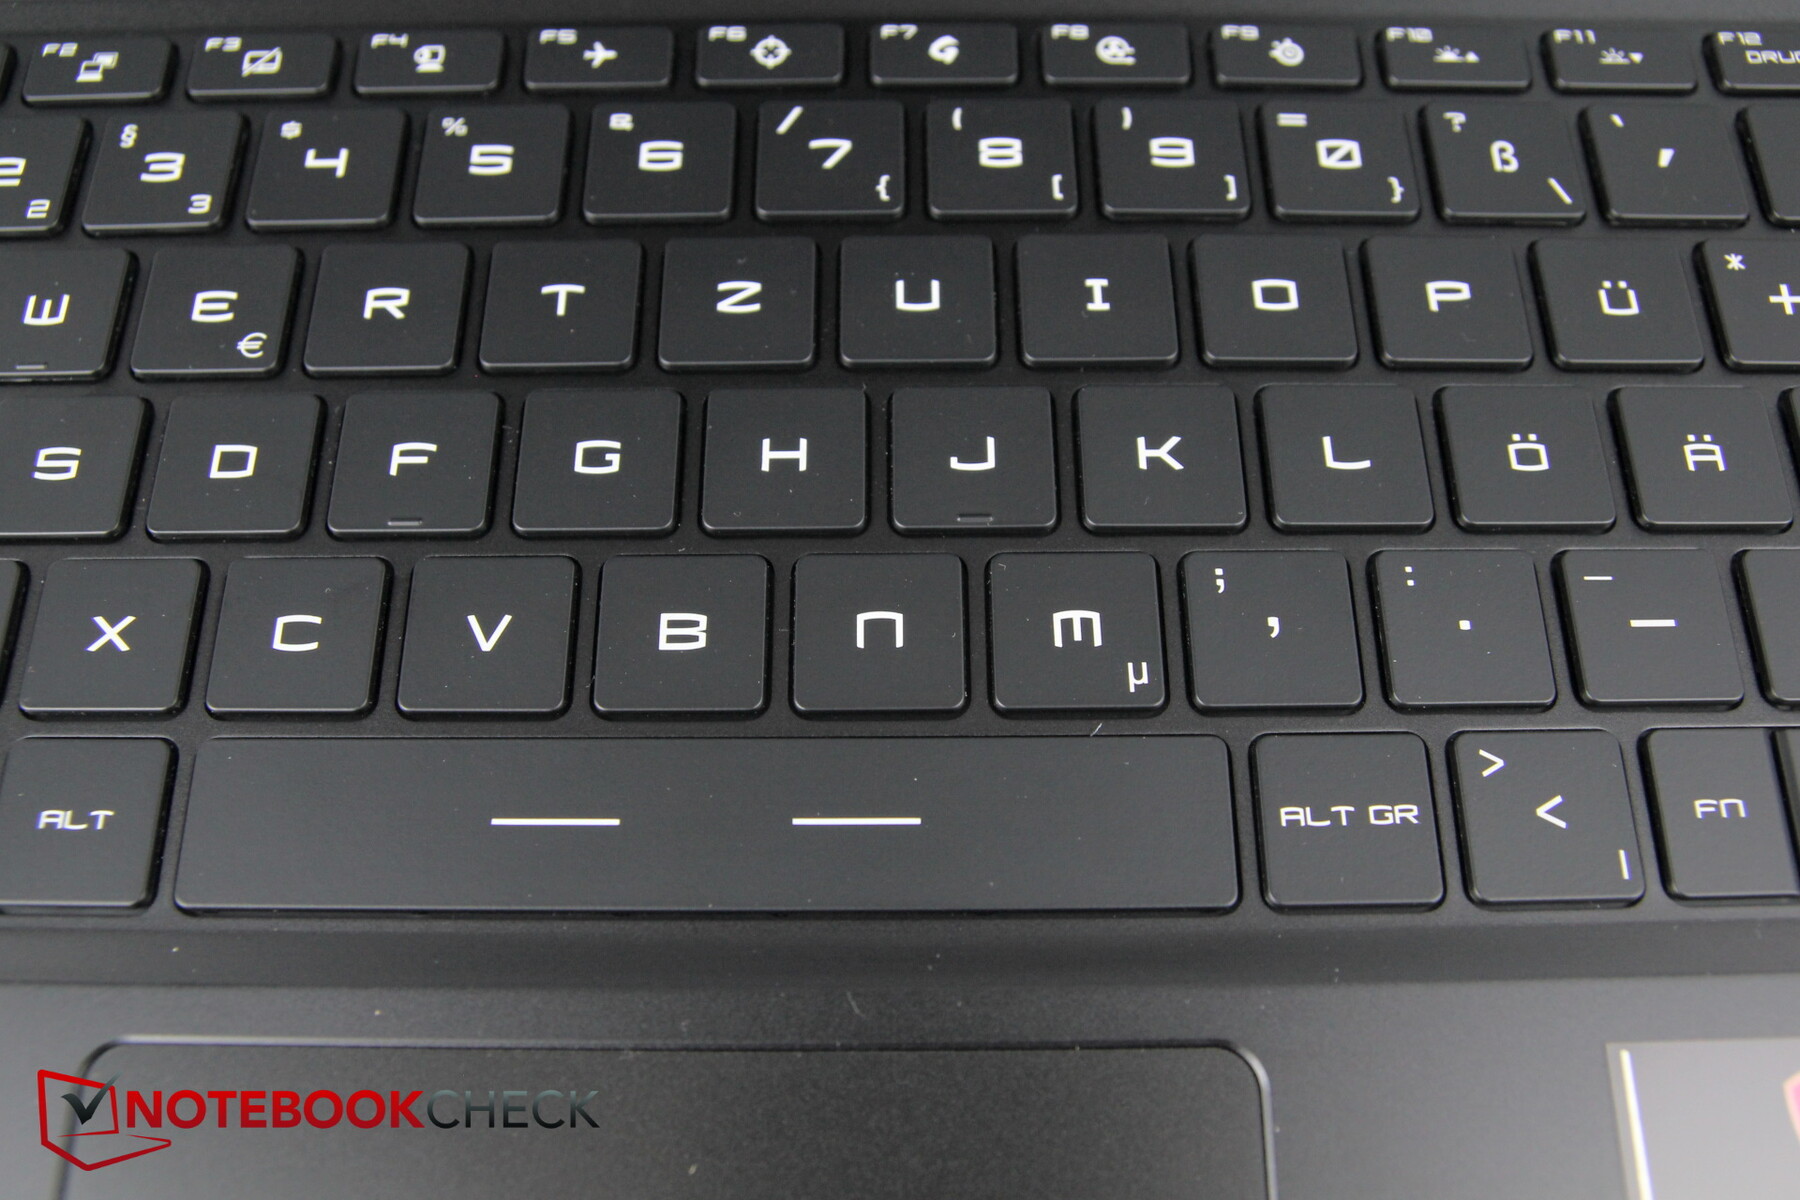
Apesar de seu tamanho de 15,6 polegadas, o Leopardo não tem um NumPad. Por outro lado, isto garante que todas as chaves sejam bastante grandes e também bem espaçadas. As letras são grandes e fáceis de ler, mesmo que a fonte selecionada seja um pouco incomum, o que deve apelar explicitamente para os jogadores. A tecla de alimentação é parte do teclado e está localizada no canto superior direito. Ela pode ser acionada involuntariamente durante o processamento de texto devido à proximidade próxima de "inserir" e "pos1"
O traço é bastante curto, mas o feedback ainda é nítido. O ruído de digitação é muito moderado, apenas a barra de espaço é minimamente mais alta. No geral, a digitação no GP66 é divertida e rápida.
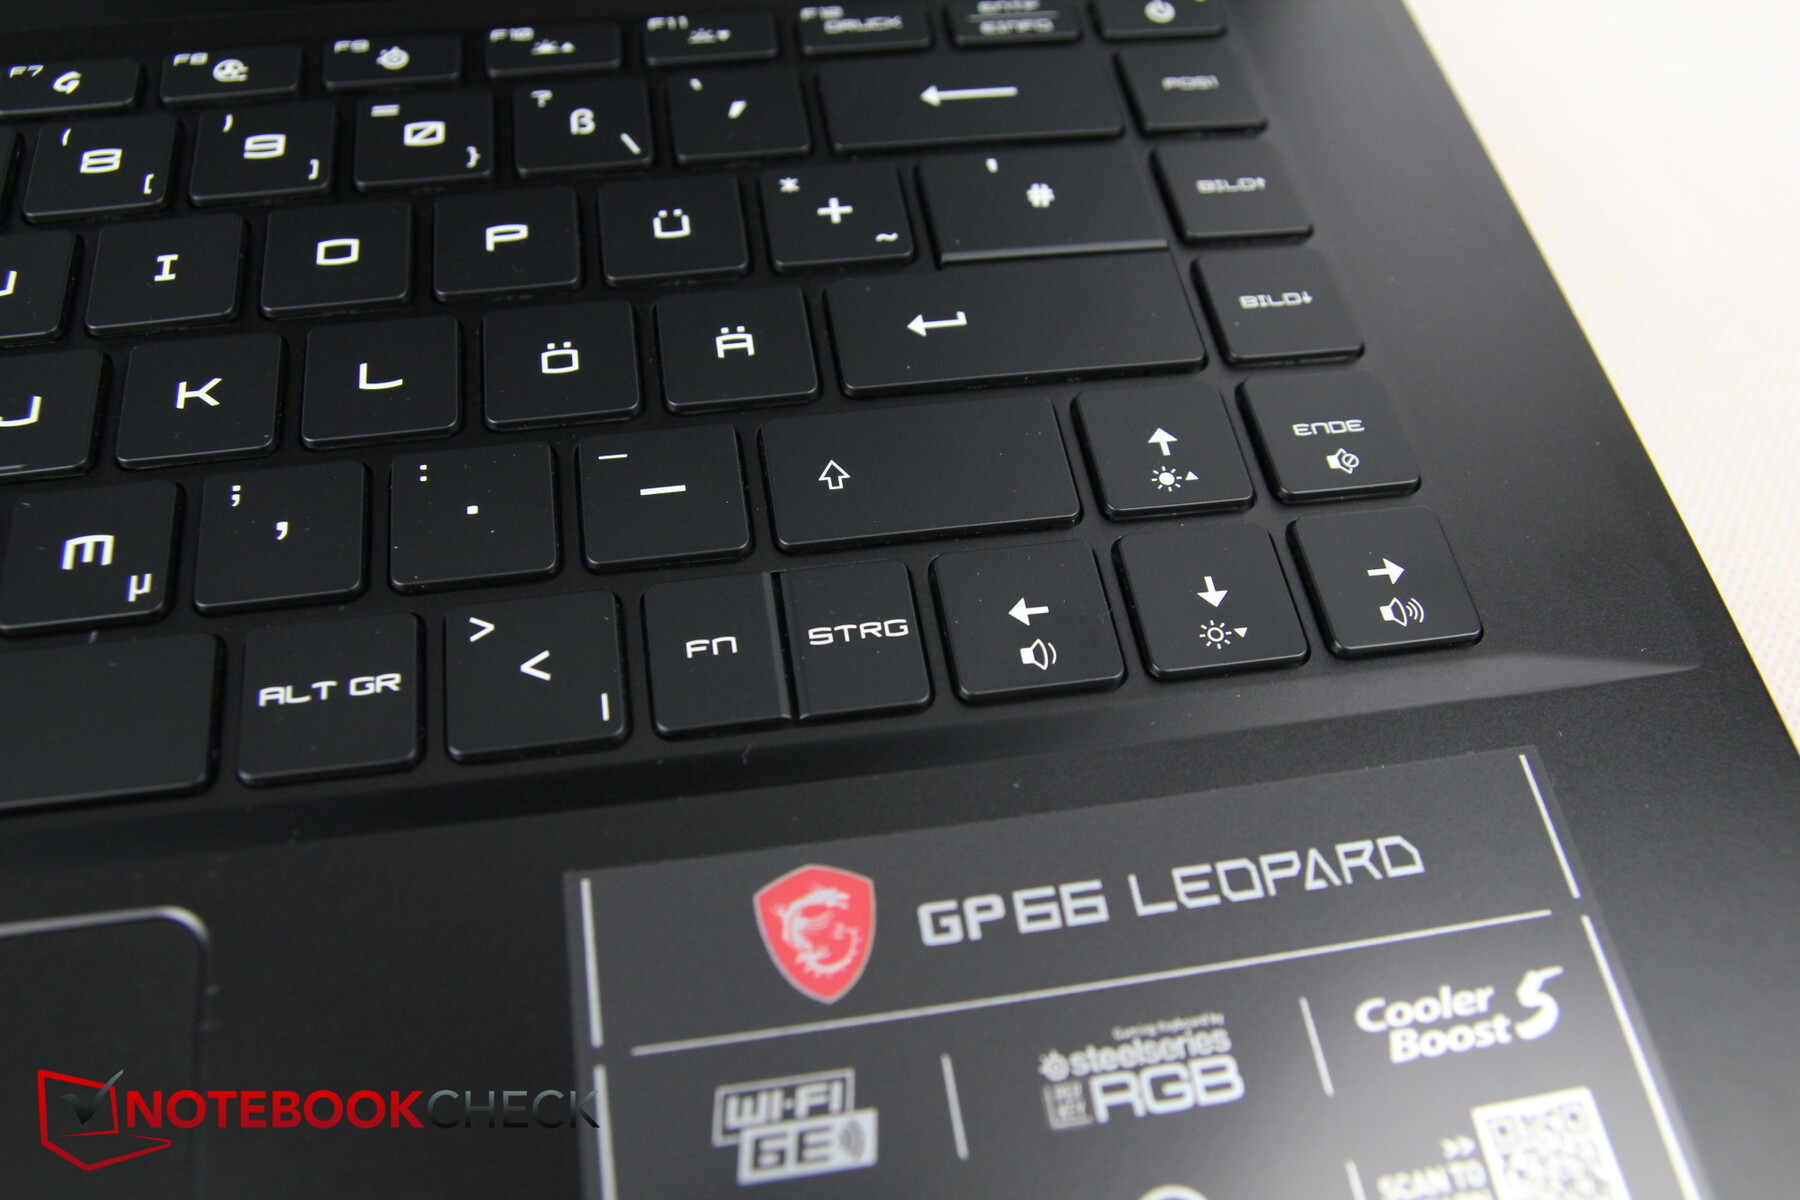
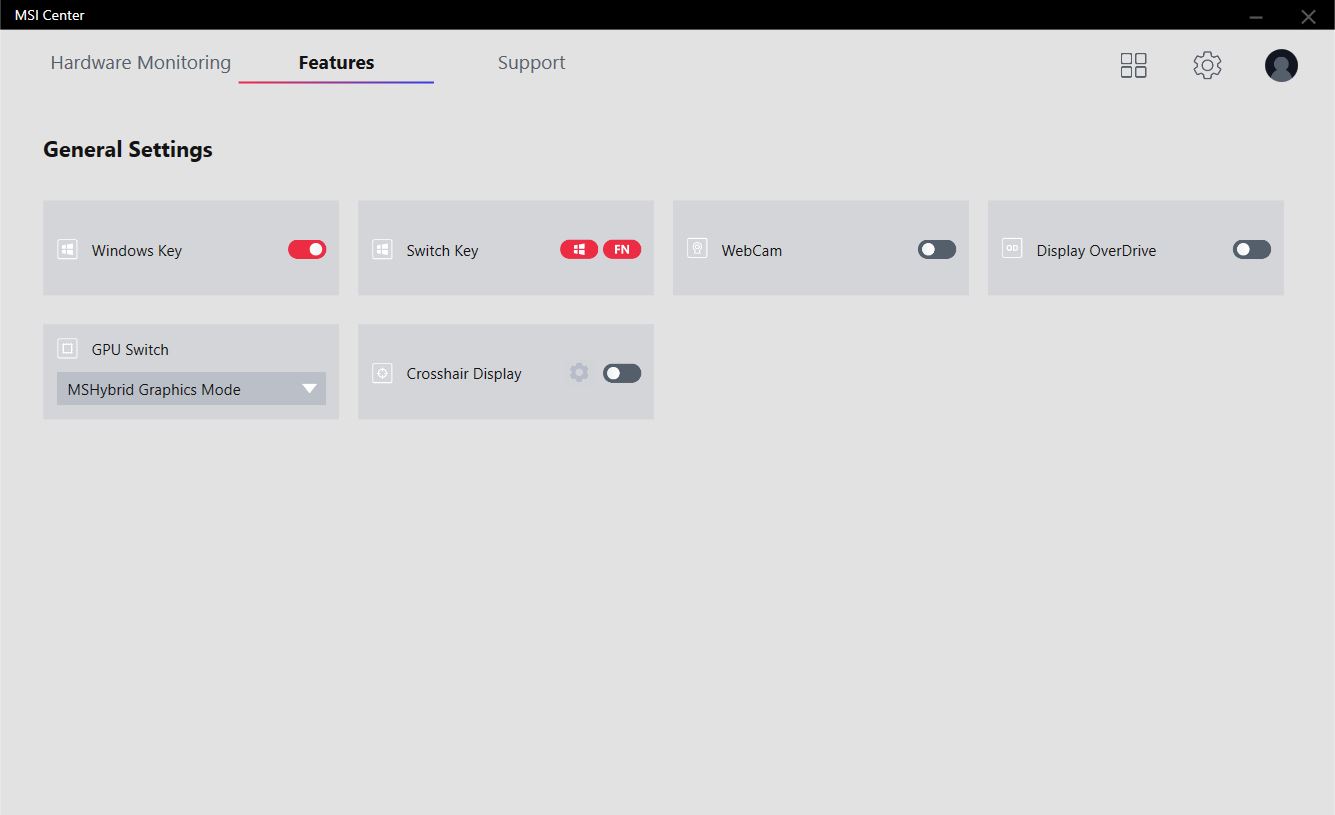
A MSI resolve uma coisa muito pouco convencional: a chave "fn" tão importante não está à esquerda, mas à direita e compartilha seu lugar com a chave Ctrl direita. Por um lado, isto significa que você tem que pensar duas vezes e as combinações de teclas são às vezes bastante embaraçosas porque ou você não pode usar ambas as mãos para combinações de teclas amplamente separadas ou você tem que pressionar a segunda tecla com a mão esquerda. A tecla também é muito estreita, o que é particularmente desfavorável, já que normalmente é pressionada com o polegar direito. Ao menos você também pode trocar a função da tecla fn com a tecla Windows no MSI Center.
Neste contexto, há uma característica legal com um ponto fraco: o teclado tem uma luz de fundo de 3 estágios. Quando a tecla fn é pressionada, a iluminação de todas as outras teclas é temporariamente desligada e somente as funções especiais das teclas F, ou seja, as teclas com as quais a tecla fn pode agora ser combinada, acendem em vermelho. Esta característica tem uma desvantagem, porém, porque se mudarmos o nível de iluminação da luz de fundo, não vemos imediatamente o efeito desta mudança, porque as teclas especiais que se acendem em vermelho não mudam o nível de iluminação, ao contrário das outras teclas.
Touchpad
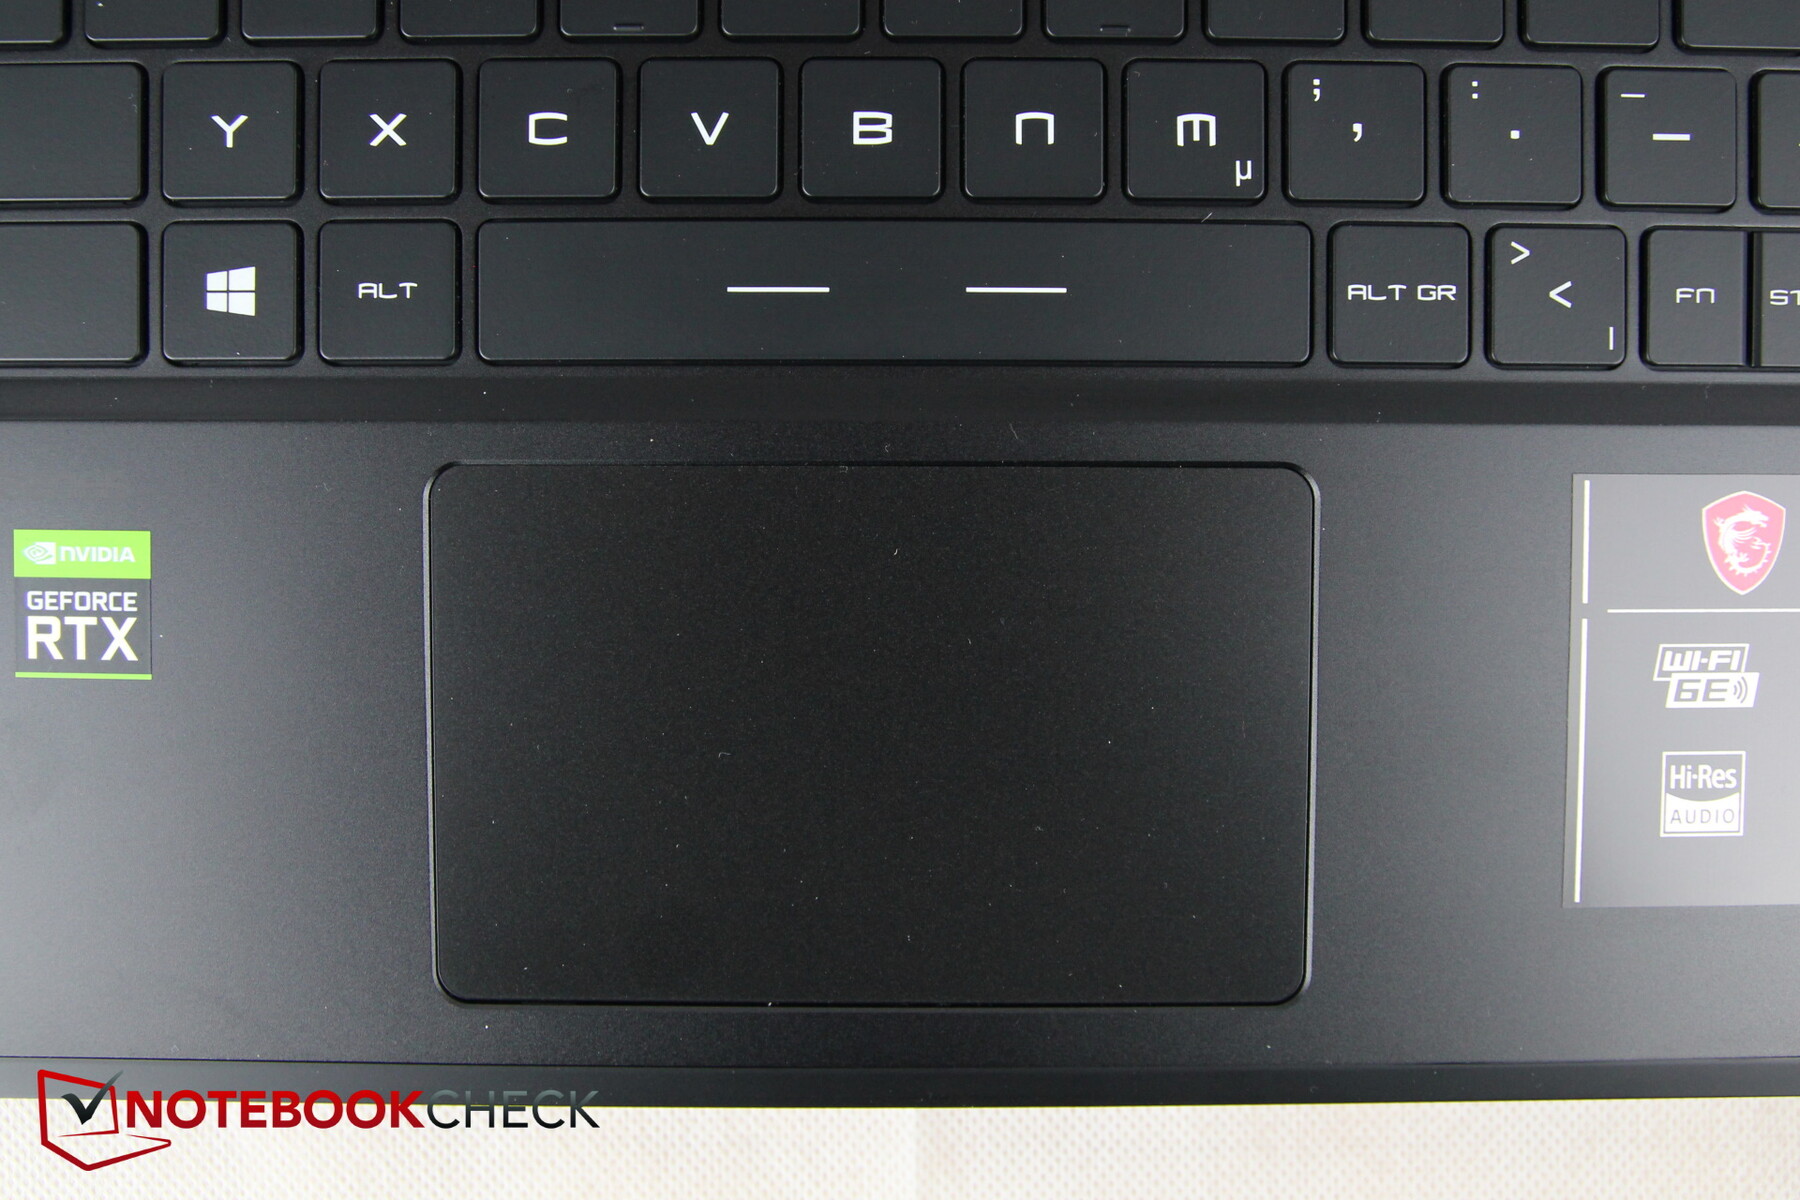
O touchpad mede cerca de 10,5 por 6,5 cm e tem botões internos de clique. A capacidade de deslizamento da superfície é boa, mas ela vacila claramente durante movimentos lentos ou dedos molhados. O tapete também é bastante impreciso nos cantos inferiores.
Como mencionado no início, o touchpad de nosso modelo de teste chocalha quando você o toca levemente com o dedo. Isto é bastante irritante e também bastante alto quando você quer acionar cliques com o toque de um dedo.
O clique das teclas integradas é bastante lento, especialmente os cliques duplos parecem desnecessariamente cansativos, que você prefere acionar com um toque de dedo, onde o barulho do chocalhar vem à tona novamente. No geral, o touchpad, ao contrário do teclado, não corta a melhor figura.
Mostrar
A MSI utiliza um painel IPS Full HD mate da LG Display com 144 Hz. É o mesmo painel que no Schenker XMG Apex 15 NH57E. Sua luminosidade média de cerca de 360 lêndeas é a maior entre as comparações, e sua distribuição de 87 por cento é decente. Alternativamente, o GP66 também está disponível com um painel QHD (2560 x 1440 pixels).
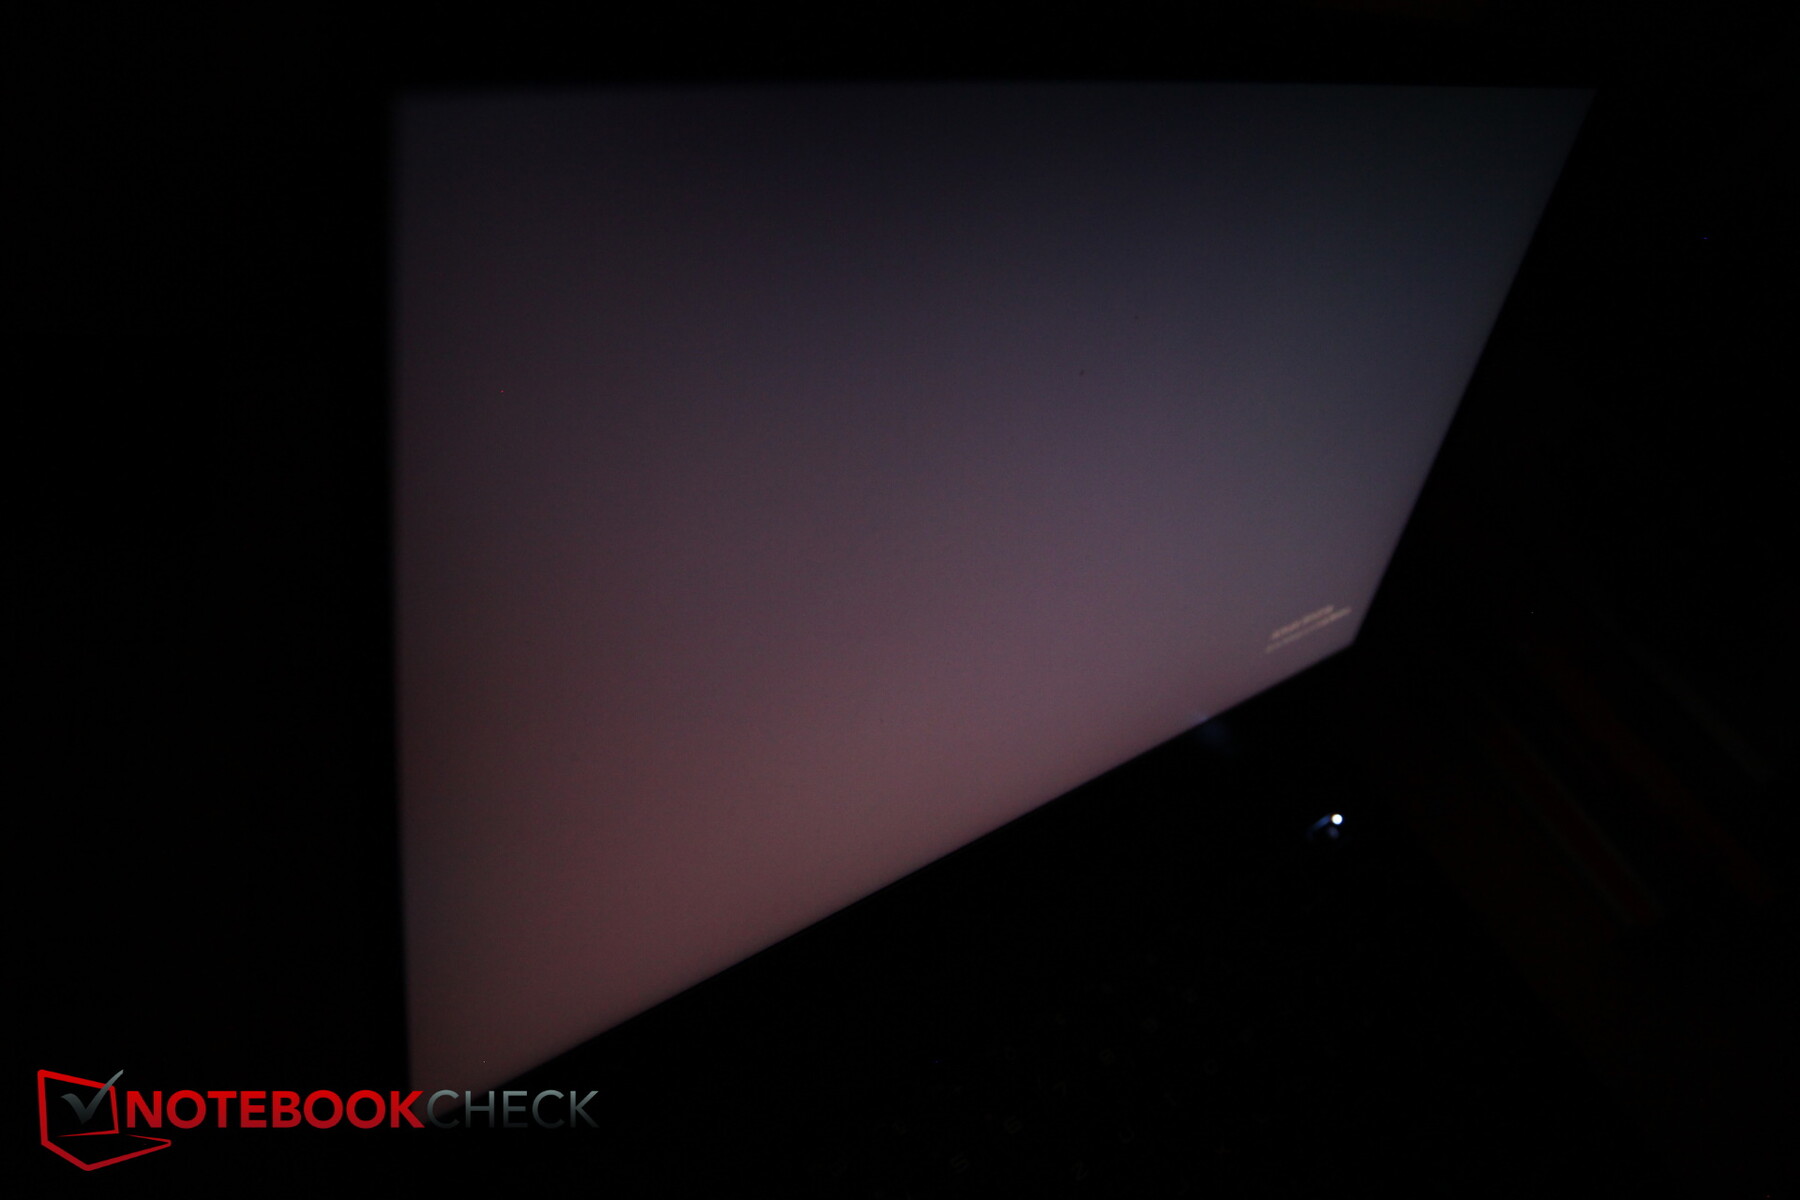
O valor do preto é muito alto, razão pela qual o contraste não produz taxas máximas, mas ainda assim é comparável com a concorrência. Apenas o Schenker XMG Neo é claramente melhor aqui. Quando se olha a tela de lado com uma imagem preta, é possível ver claramente o forte brilho do fundo. O valor do preto melhora naturalmente com brilho reduzido.
O sangramento da tela é pouco significativo em nosso modelo de teste, a grade de pixels é um pouco granulosa devido à superfície fosca. Os tempos de resposta do painel são bons, o PWM não é usado.
| |||||||||||||||||||||||||
iluminação: 87 %
iluminação com acumulador: 390 cd/m²
Contraste: 951:1 (Preto: 0.41 cd/m²)
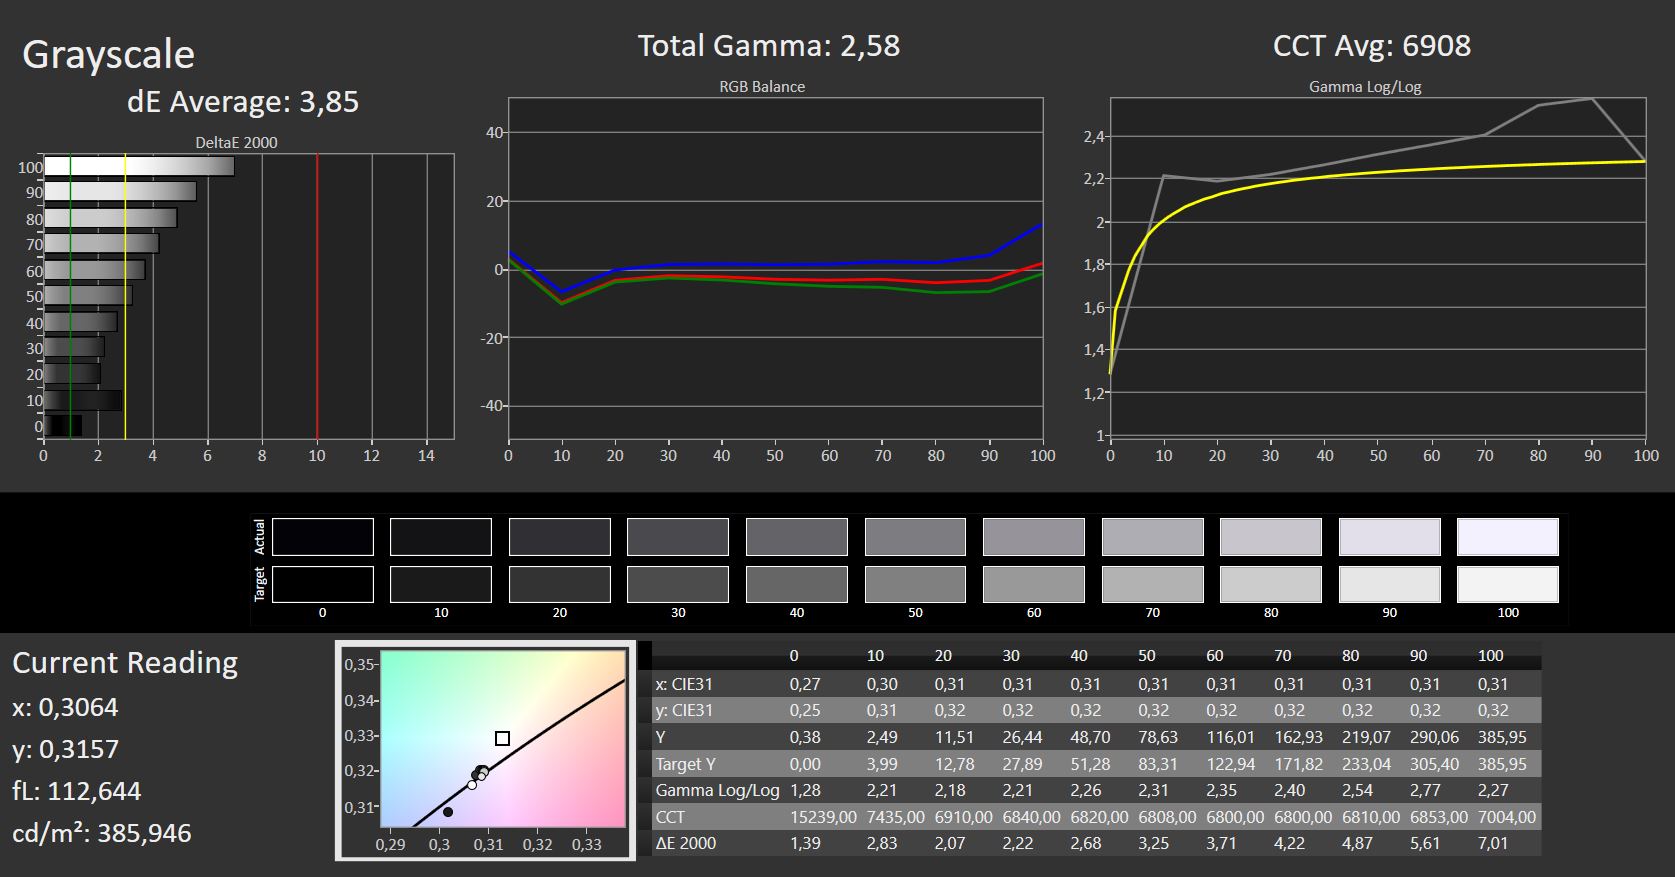
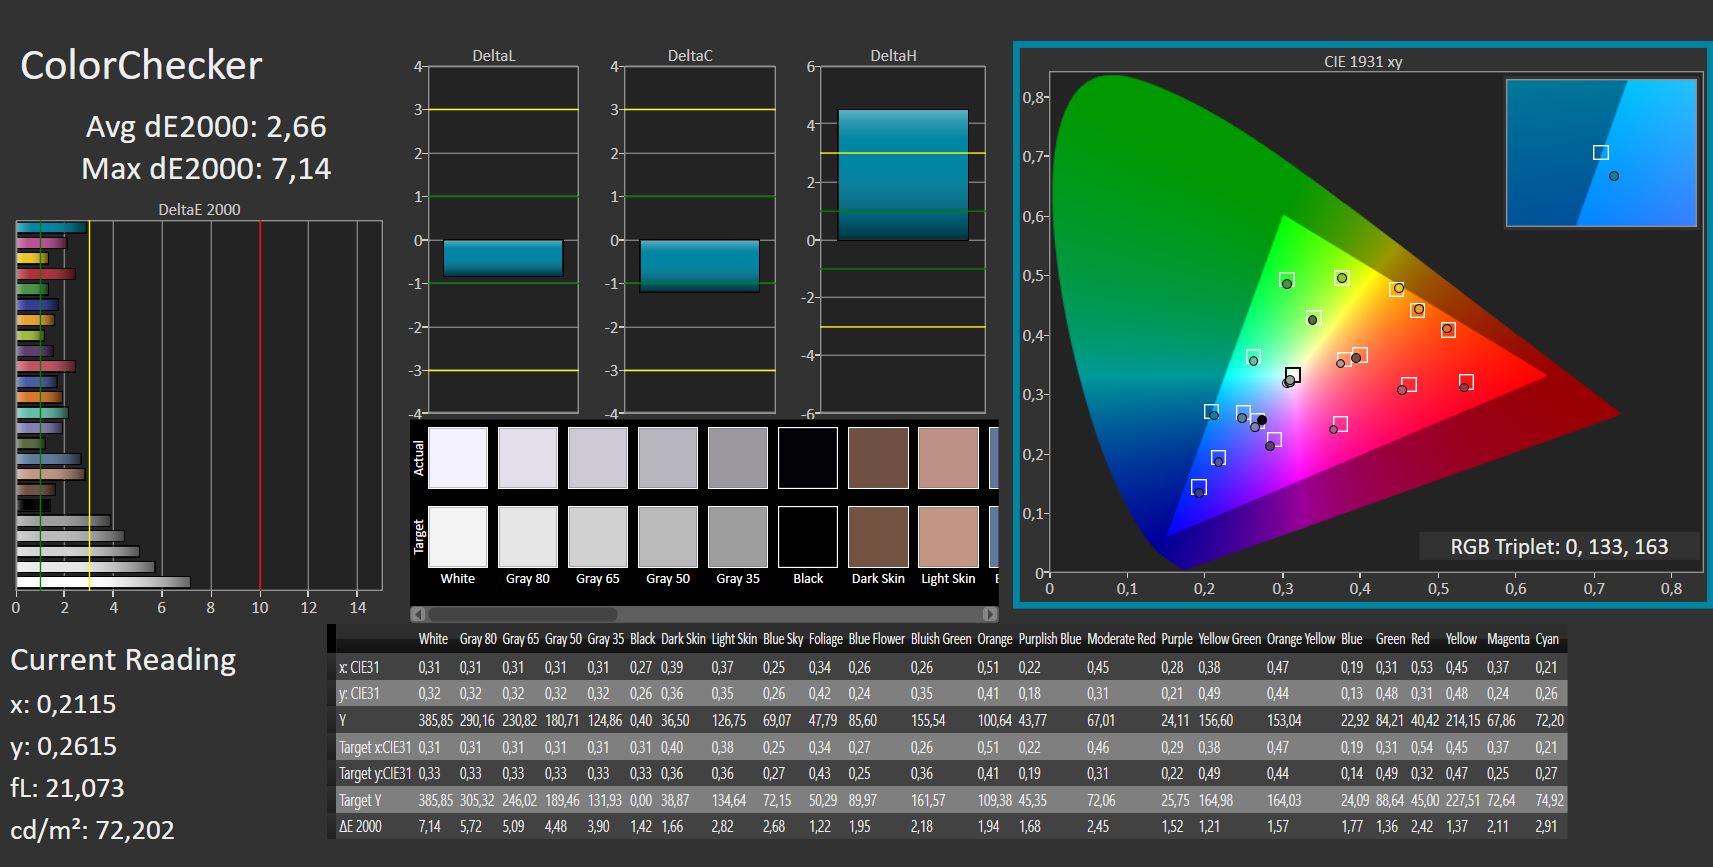
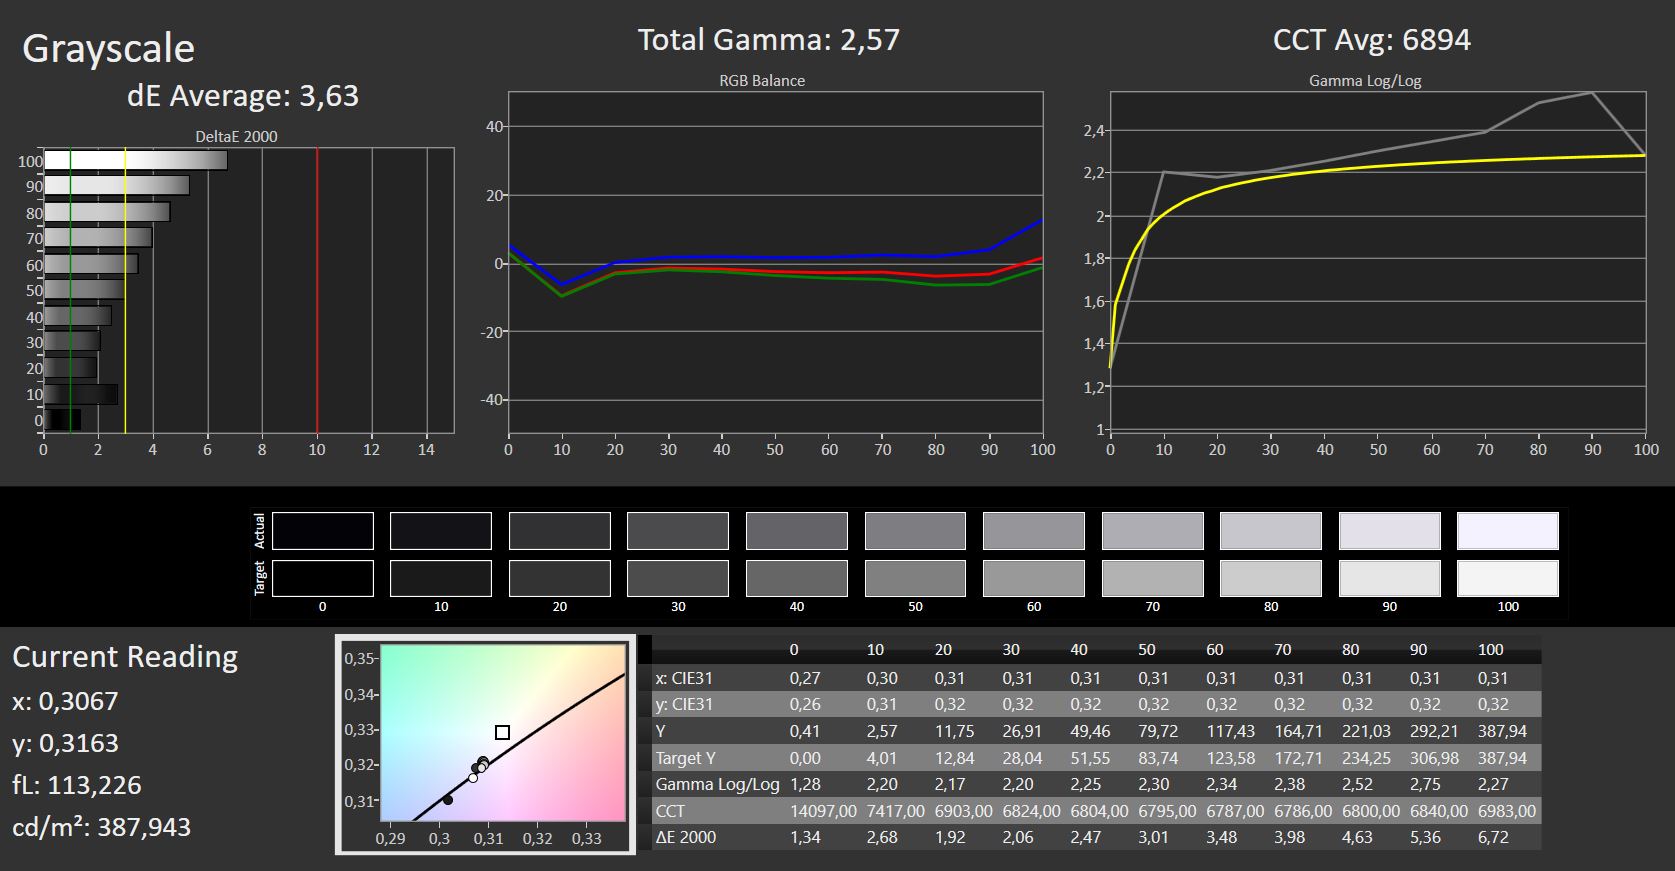
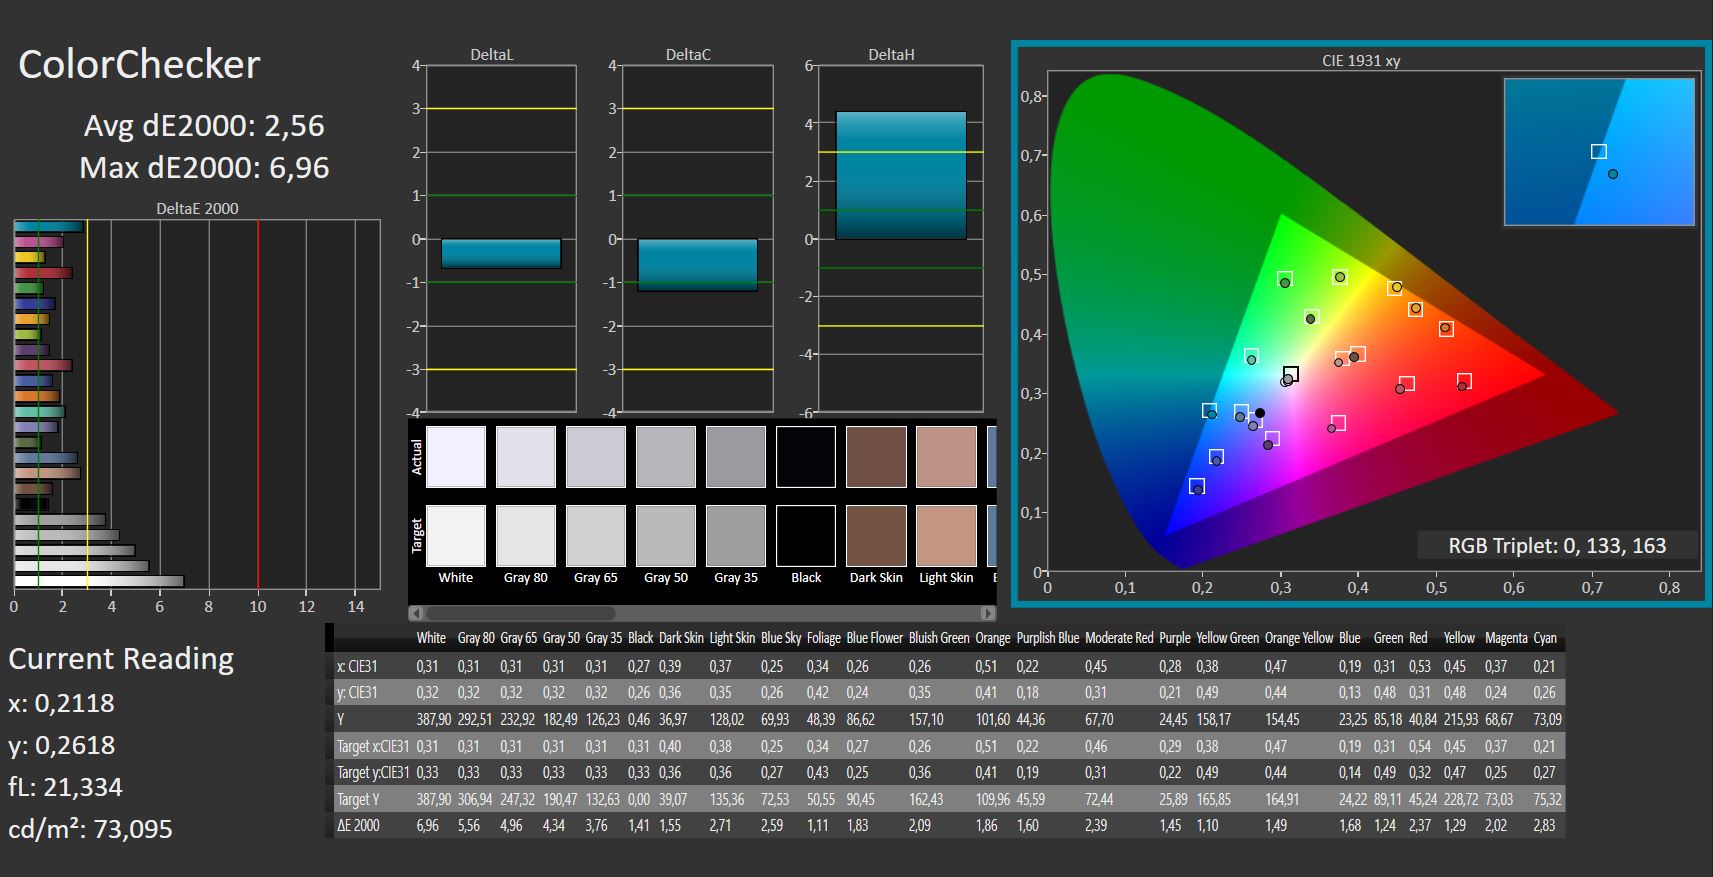
ΔE ColorChecker Calman: 2.66 | ∀{0.5-29.43 Ø4.71}
calibrated: 2.56
ΔE Greyscale Calman: 3.63 | ∀{0.09-98 Ø4.96}
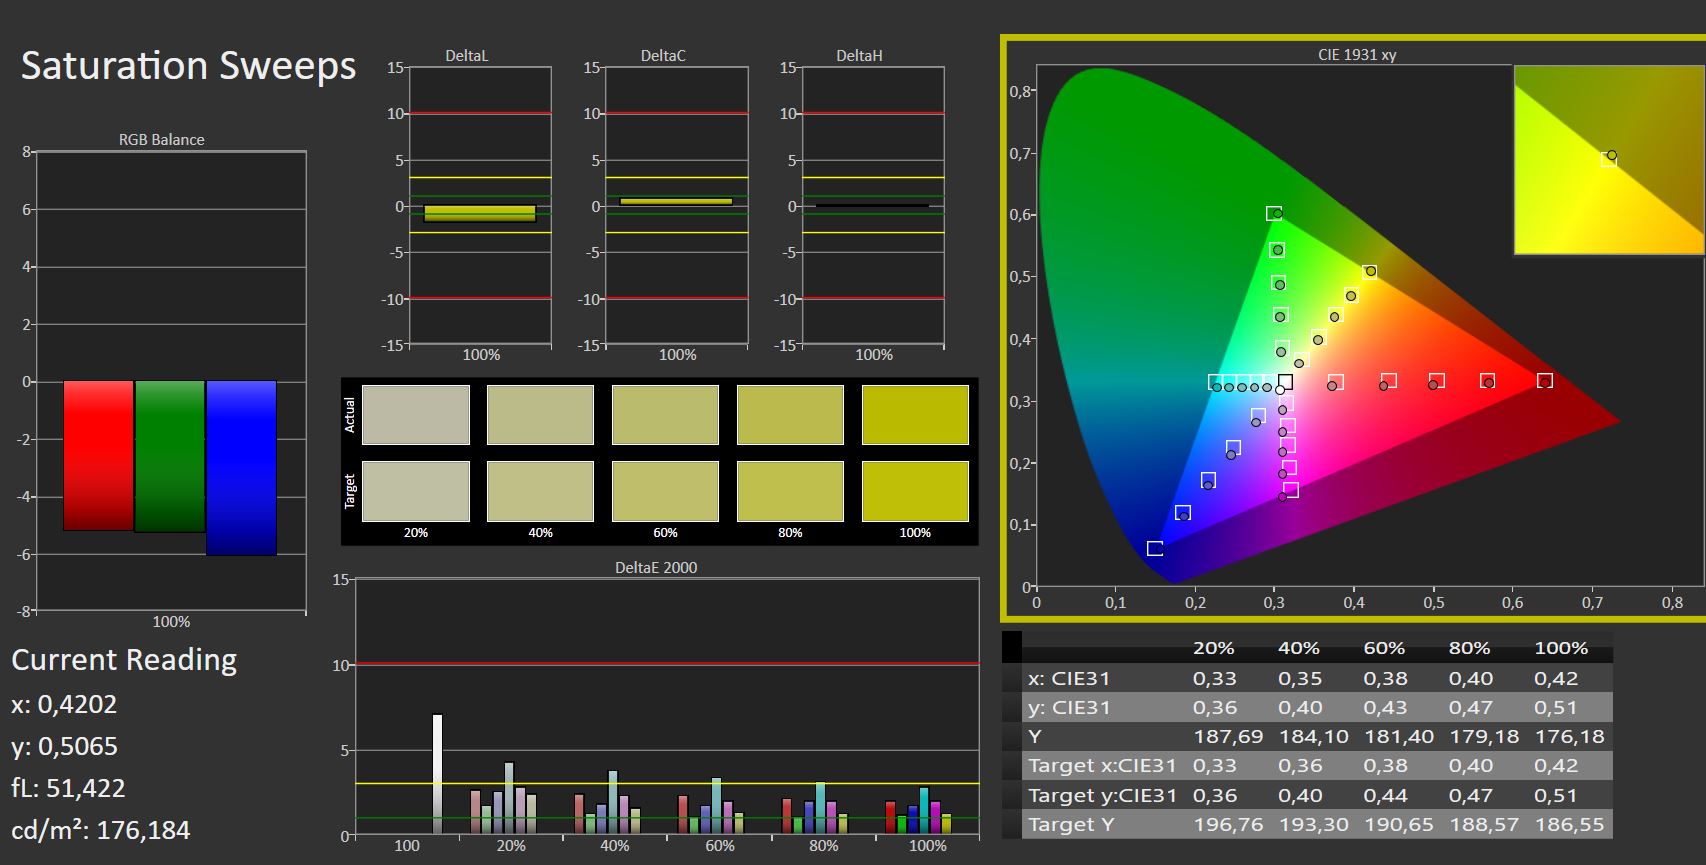
66% AdobeRGB 1998 (Argyll 3D)
95.8% sRGB (Argyll 3D)
65.2% Display P3 (Argyll 3D)
Gamma: 2.57
CCT: 6894 K
| MSI GP66 Leopard 11UH-028 LGD0625 (LP156WFG-SPB3), IPS, 1920x1080, 15.6" | MSI GP66 Leopard 10UG Sharp LQ156M1JW03, IPS, 1920x1080, 15.6" | Aorus 15P YD BOE09B9, IPS, 1920x1080, 15.6" | Asus ROG Strix Scar 15 G533QS BOE CQ NE156QHM-NY1, IPS, 2560x1440, 15.6" | Schenker XMG Neo 15 Tiger Lake BOE CQ NE156QHM-NY2, IPS, 2560x1440, 15.6" | Alienware m15 R6, i7-11800H RTX 3080 AU Optronics AUO9092 (B156HAN), IPS, 1920x1080, 15.6" | |
|---|---|---|---|---|---|---|
| Display | 5% | 7% | 28% | 4% | 11% | |
| Display P3 Coverage (%) | 65.2 | 68.3 5% | 70.2 8% | 97.6 50% | 68.6 5% | 74.1 14% |
| sRGB Coverage (%) | 95.8 | 99.2 4% | 98.5 3% | 99.9 4% | 98.6 3% | 99.5 4% |
| AdobeRGB 1998 Coverage (%) | 66 | 70.4 7% | 72.4 10% | 85.3 29% | 69.3 5% | 75.7 15% |
| Response Times | 7% | 6% | -8% | -13% | 64% | |
| Response Time Grey 50% / Grey 80% * (ms) | 14 ? | 13.6 ? 3% | 14 ? -0% | 14 ? -0% | 16 ? -14% | 2.8 80% |
| Response Time Black / White * (ms) | 10.8 ? | 9.6 ? 11% | 9.6 ? 11% | 12.4 ? -15% | 12 ? -11% | 5.6 48% |
| PWM Frequency (Hz) | 23580 ? | |||||
| Screen | -15% | -7% | -3% | -4% | -1% | |
| Brightness middle (cd/m²) | 390 | 225.9 -42% | 337 -14% | 304.3 -22% | 324 -17% | 359 -8% |
| Brightness (cd/m²) | 362 | 211 -42% | 316 -13% | 286 -21% | 307 -15% | 344 -5% |
| Brightness Distribution (%) | 87 | 83 -5% | 85 -2% | 76 -13% | 91 5% | 85 -2% |
| Black Level * (cd/m²) | 0.41 | 0.23 44% | 0.31 24% | 0.33 20% | 0.27 34% | 0.35 15% |
| Contrast (:1) | 951 | 982 3% | 1087 14% | 922 -3% | 1200 26% | 1026 8% |
| Colorchecker dE 2000 * | 2.66 | 3.98 -50% | 3.87 -45% | 2.76 -4% | 3.36 -26% | 3.3 -24% |
| Colorchecker dE 2000 max. * | 7.14 | 8.95 -25% | 8.09 -13% | 5.57 22% | 9.87 -38% | 4.84 32% |
| Colorchecker dE 2000 calibrated * | 2.56 | 1.15 55% | 1.15 55% | 2.38 7% | 1.23 52% | 3.28 -28% |
| Greyscale dE 2000 * | 3.63 | 6.4 -76% | 6.1 -68% | 4 -10% | 5.8 -60% | 3.66 -1% |
| Gamma | 2.57 86% | 2.25 98% | 2.132 103% | 2.14 103% | 2.311 95% | 2.43 91% |
| CCT | 6894 94% | 6991 93% | 6891 94% | 6844 95% | 7087 92% | 5896 110% |
| Color Space (Percent of AdobeRGB 1998) (%) | 64.5 | 72 | 69 | |||
| Color Space (Percent of sRGB) (%) | 99.3 | 94 | 93 | |||
| Média Total (Programa/Configurações) | -1% /
-8% | 2% /
-2% | 6% /
3% | -4% /
-4% | 25% /
11% |
* ... menor é melhor
A concorrência é apenas ligeiramente melhor em termos de cobertura do espaço de cores. Apenas o Asus ROG está claramente à frente aqui, já que também cobre AdobeRGB quase completamente, enquanto nosso MSI cobre apenas 66% dele. Portanto, o Asus é preferível para a edição de imagens
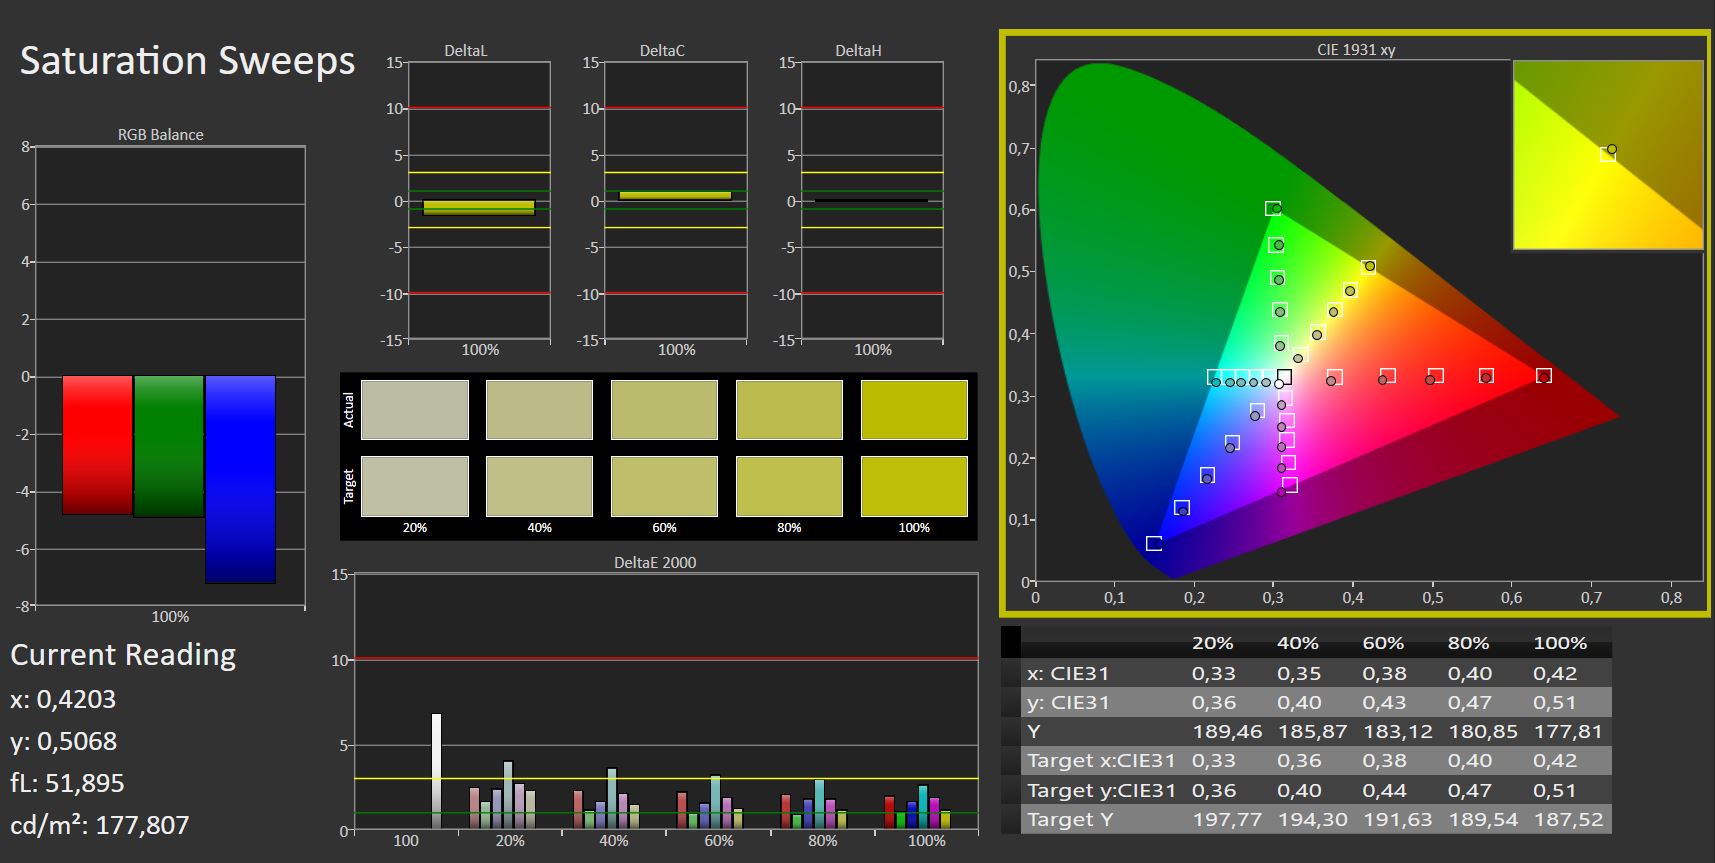
A tela está bem configurada no ex-works, e uma calibração manual não a melhora muito.
Exibir tempos de resposta
| ↔ Tempo de resposta preto para branco | ||
|---|---|---|
| 10.8 ms ... ascensão ↗ e queda ↘ combinadas | ↗ 6.2 ms ascensão | 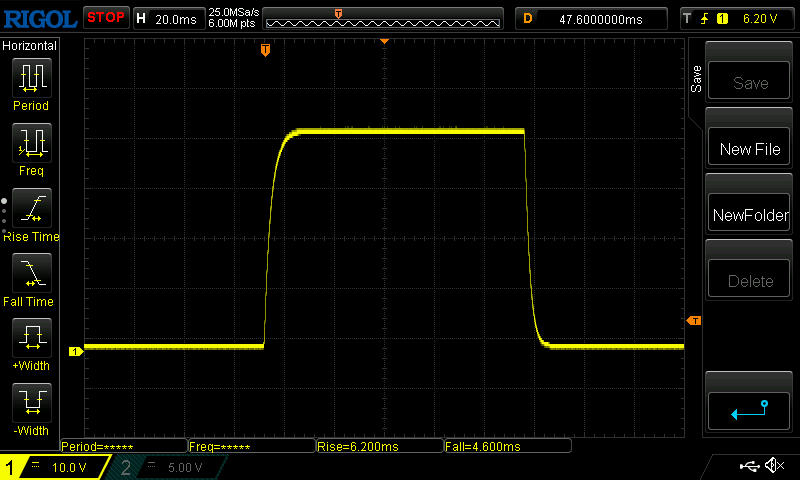 |
| ↘ 4.6 ms queda | ||
| A tela mostra boas taxas de resposta em nossos testes, mas pode ser muito lenta para jogadores competitivos. Em comparação, todos os dispositivos testados variam de 0.1 (mínimo) a 240 (máximo) ms. » 29 % de todos os dispositivos são melhores. Isso significa que o tempo de resposta medido é melhor que a média de todos os dispositivos testados (19.8 ms). | ||
| ↔ Tempo de resposta 50% cinza a 80% cinza | ||
| 14 ms ... ascensão ↗ e queda ↘ combinadas | ↗ 7 ms ascensão | 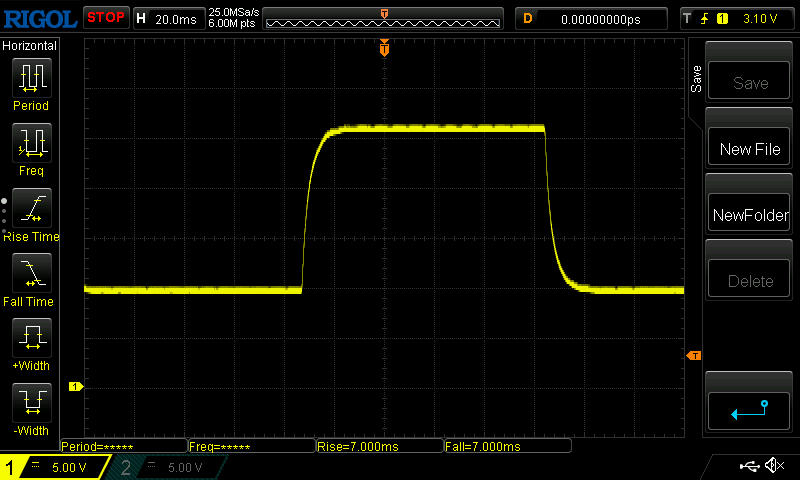 |
| ↘ 7 ms queda | ||
| A tela mostra boas taxas de resposta em nossos testes, mas pode ser muito lenta para jogadores competitivos. Em comparação, todos os dispositivos testados variam de 0.165 (mínimo) a 636 (máximo) ms. » 28 % de todos os dispositivos são melhores. Isso significa que o tempo de resposta medido é melhor que a média de todos os dispositivos testados (31 ms). | ||
Cintilação da tela / PWM (modulação por largura de pulso)
| Tela tremeluzindo / PWM não detectado | 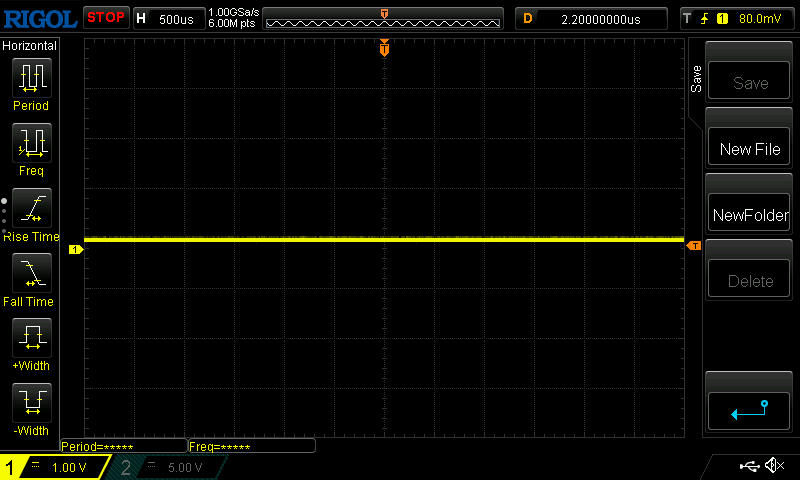 | ||
[pwm_comparison] Em comparação: 52 % de todos os dispositivos testados não usam PWM para escurecer a tela. Se PWM foi detectado, uma média de 7757 (mínimo: 5 - máximo: 343500) Hz foi medida. | |||
Devido ao bom brilho e à superfície fosca, a visibilidade ao ar livre é boa - pelo menos na sombra e com vista direta para o topo. A luz direta do sol, bem como os ângulos de visão oblíquos, devem ser evitados.
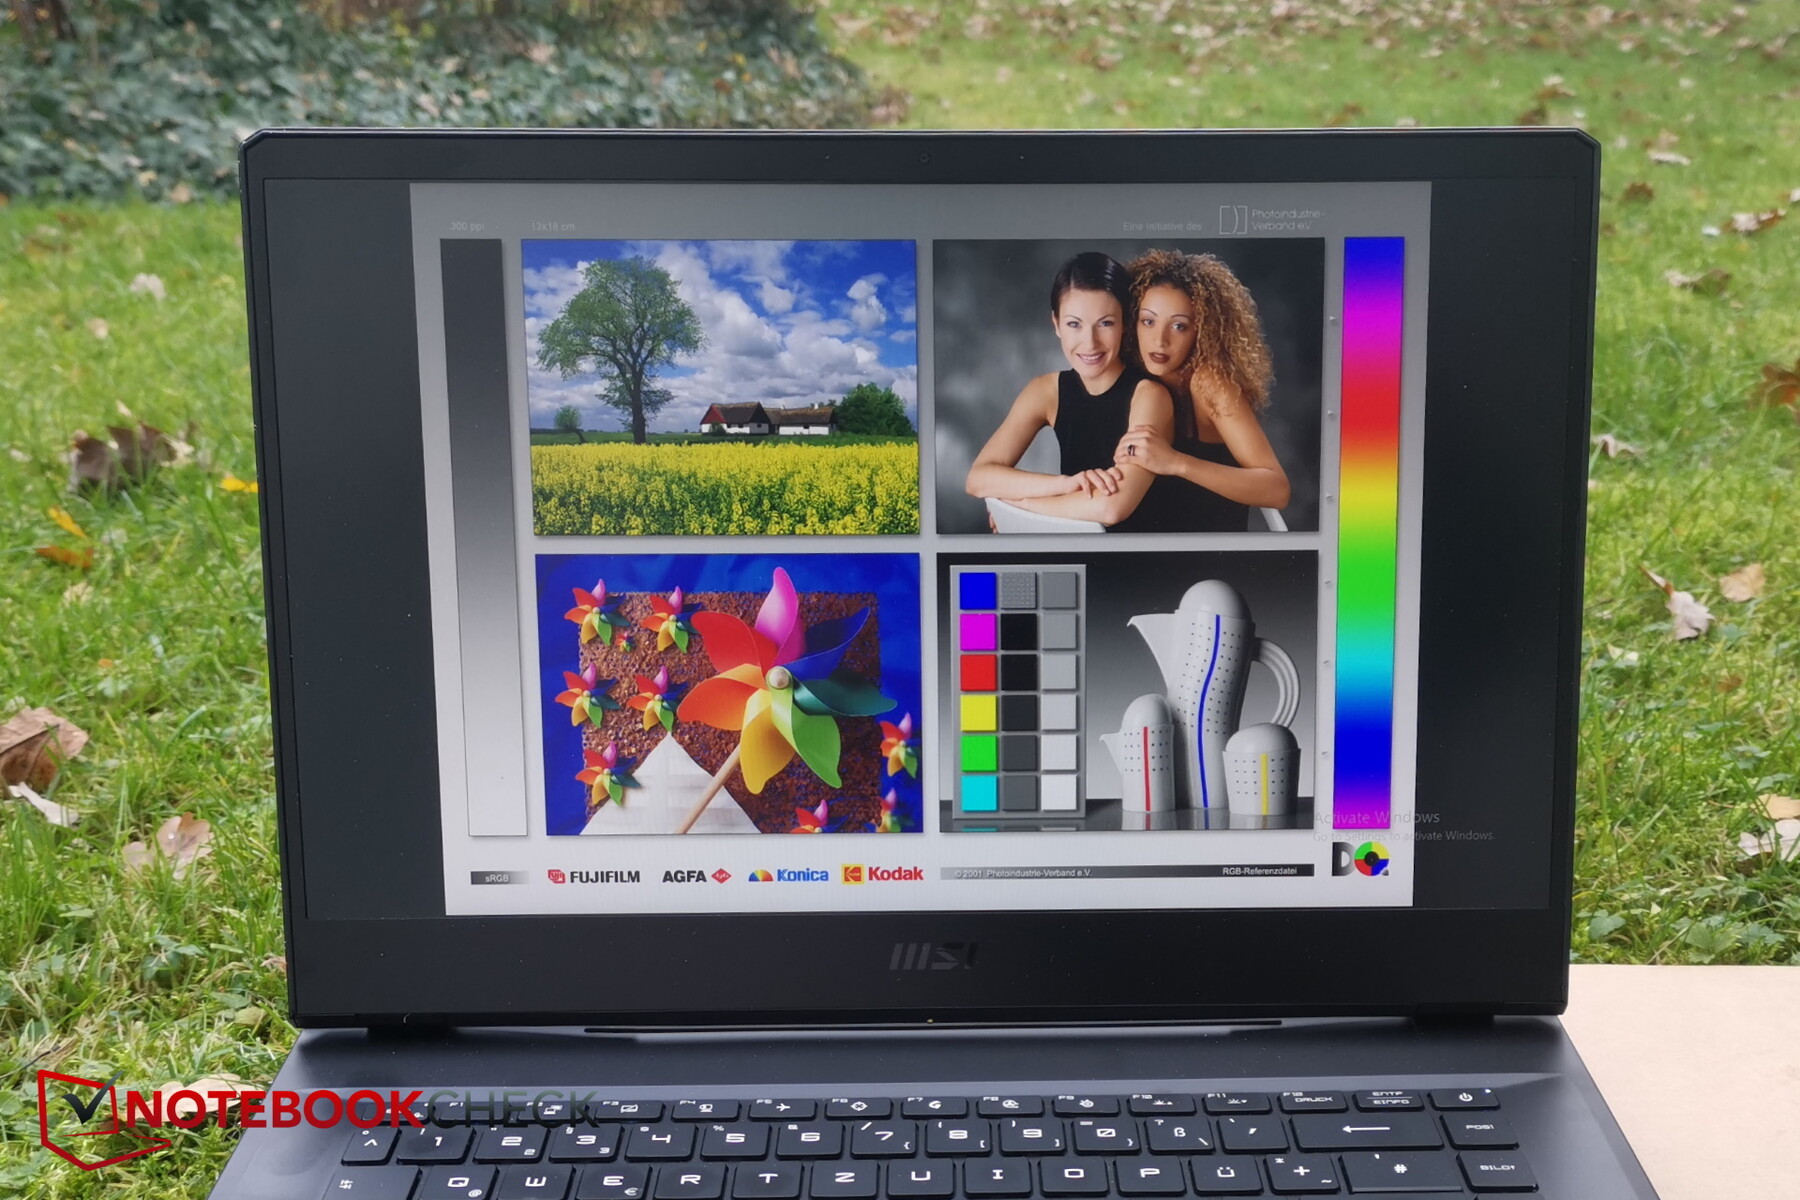
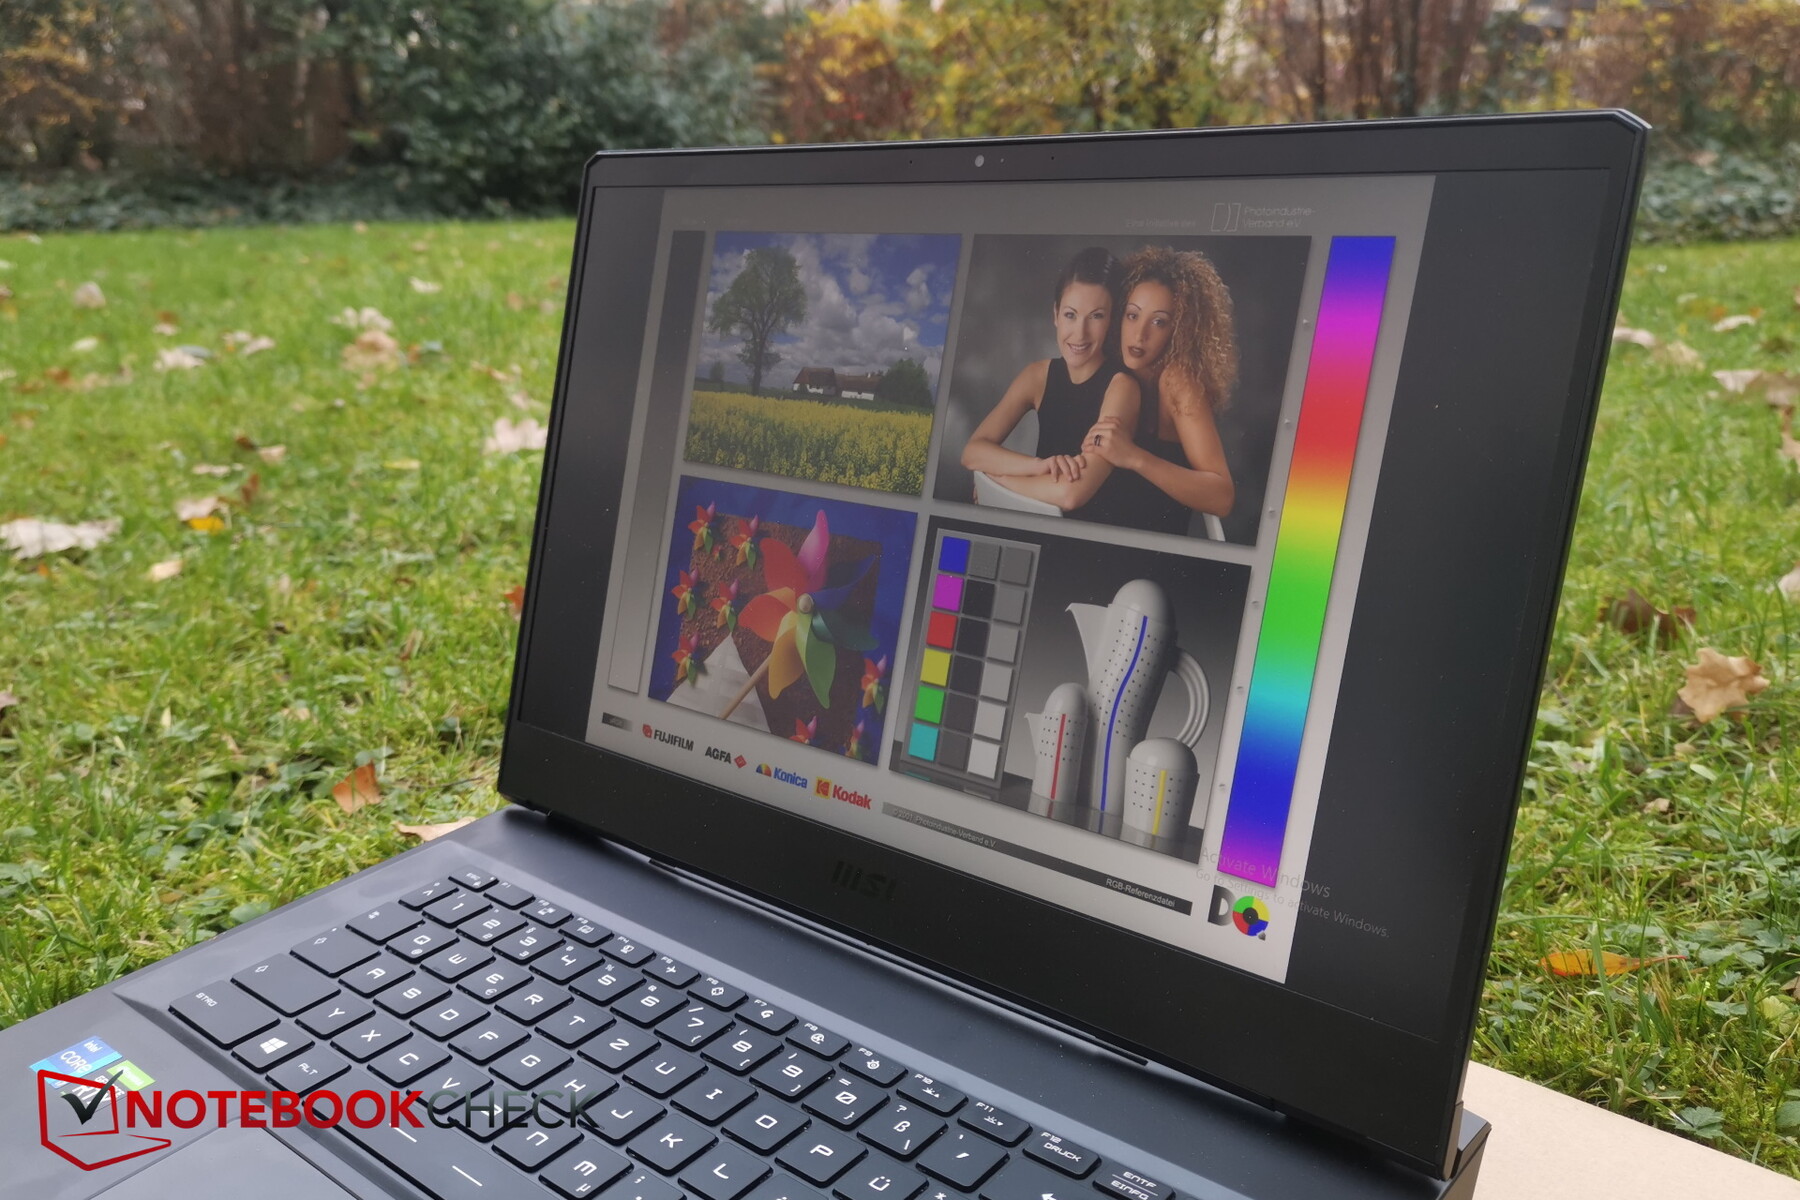
Ao visualizar de ângulos extremos, perde-se algum brilho em particular, mas apenas muito pouco, como é típico do IPS, e o conteúdo ainda pode ser bem reconhecido

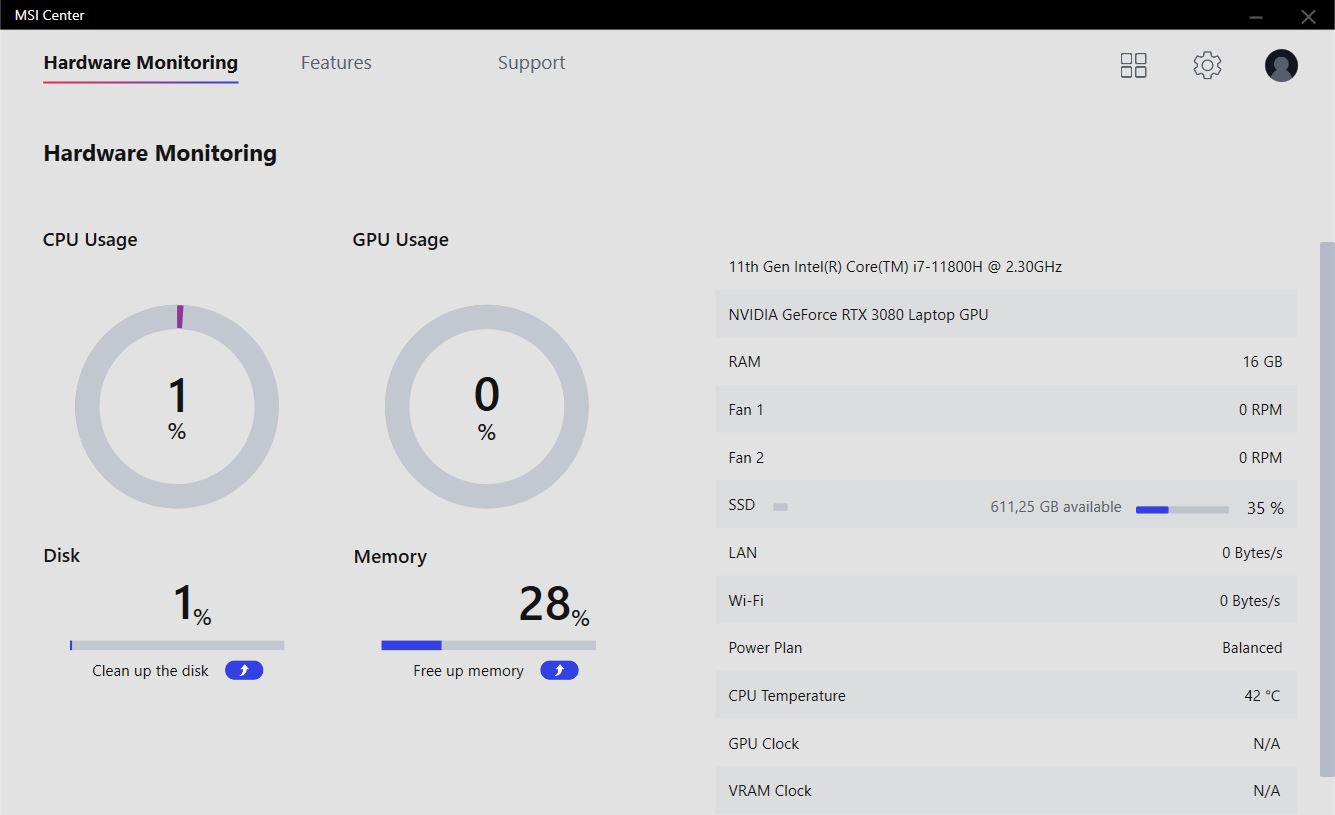
Desempenho - Somente a CPU se beneficia do MSI Center
O Leopard da MSI é um laptop para jogos, que é indicado pelo RTX 3080. Teoricamente, o laptop deve ser capaz de renderizar todos os jogos atuais suavemente na resolução nativa e também ter reservas suficientes para resoluções de 4K
Condições de teste
Realizamos todos os benchmarks quando o MSI Center ainda não estava instalado. Afinal, o GP66 só é enviado oficialmente com o FreeDOS e não com uma licença Windows. O indicador de desempenho Windows de nossa unidade de teste foi sempre definido como "Melhor Desempenho" para os benchmarks de desempenho.
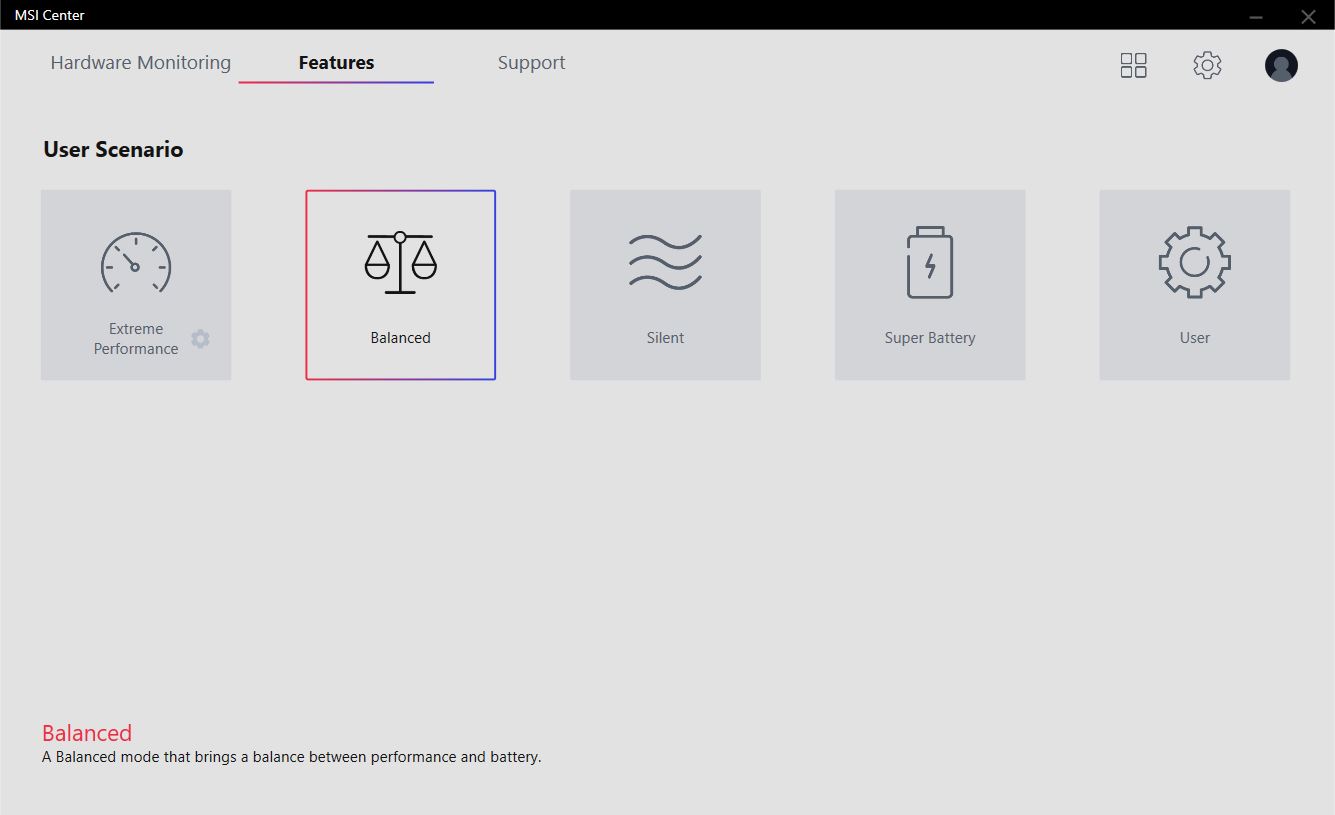
O MSI Center, por outro lado, usa outros modos de desempenho, que estão ocultos no "Cenário do Usuário". Entraremos nas diferenças para o modo Windows nas seções de desempenho. Nas configurações do MSI, você também pode escolher entre o modo gráfico híbrido ou apenas GPU discreto.
Processador
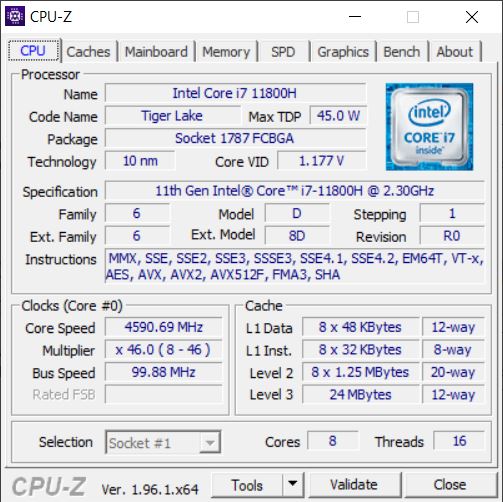
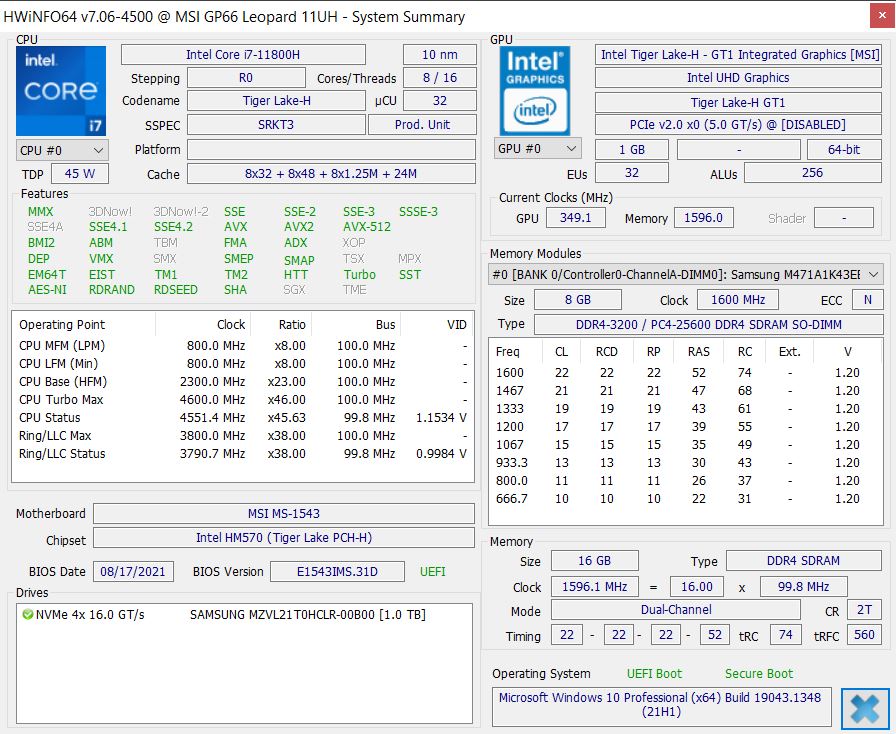
Como muitos dos atuais laptops para jogos Intel, o MSI Leopard está equipado com um Intel Core i7-11800H processador. Ele tem oito núcleos, que regram de 2,3 a 4,6 GHz individualmente. Um relógio máximo de 4,2 GHz é possível quando todos os núcleos estão sob carga.
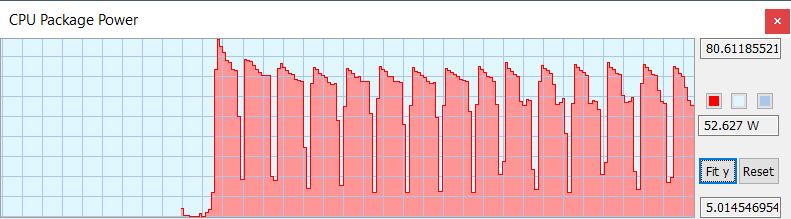
Em nosso Cinebench loop performance só diminui minimamente e de modo geral, o GP 66 11UH é cerca de 25% mais rápido do que seu predecessor. Através do HWinfo, podemos ver que a CPU se permite 80 W no início, mas as execuções seguintes começam em 75 W e terminam em 53 W. No entanto, os resultados só superam os do Aorus com a mesma CPU.
O modo "Extreme Performance" beneficia particularmente a potência da CPU. Em vez de 75 W antes, a CPU pode até se permitir 90 W por um curto período de tempo, o que rapidamente volta a 74 W em vez de 53 W em uma única execução. Entretanto, mesmo no modo Extremo, o GP66 não alcança o desempenho do desenfreado XMG Neo ou do Asus ROG com uma CPU AMD.
O desempenho cai significativamente com a energia da bateria: dos cerca de 2.000 pontos anteriores, restam apenas 1.178 pontos.
Cinebench R15 Multi endurance test
Cinebench R23: Multi Core | Single Core
Cinebench R20: CPU (Multi Core) | CPU (Single Core)
Cinebench R15: CPU Multi 64Bit | CPU Single 64Bit
Blender: v2.79 BMW27 CPU
7-Zip 18.03: 7z b 4 | 7z b 4 -mmt1
Geekbench 5.5: Multi-Core | Single-Core
HWBOT x265 Benchmark v2.2: 4k Preset
LibreOffice : 20 Documents To PDF
R Benchmark 2.5: Overall mean
| CPU Performance rating | |
| Média da turma Gaming | |
| Schenker XMG Neo 15 Tiger Lake | |
| MSI GP66 Leopard 11UH-028 | |
| Asus ROG Strix Scar 15 G533QS -2! | |
| Alienware m15 R6, i7-11800H RTX 3080 | |
| Média Intel Core i7-11800H | |
| Aorus 15P YD -2! | |
| MSI GP66 Leopard 10UG | |
| Cinebench R23 / Multi Core | |
| Média da turma Gaming (10488 - 42661, n=107, últimos 2 anos) | |
| Schenker XMG Neo 15 Tiger Lake | |
| Asus ROG Strix Scar 15 G533QS | |
| Alienware m15 R6, i7-11800H RTX 3080 | |
| MSI GP66 Leopard 11UH-028 | |
| Média Intel Core i7-11800H (6508 - 14088, n=48) | |
| MSI GP66 Leopard 10UG | |
| Cinebench R23 / Single Core | |
| Média da turma Gaming (1166 - 2415, n=107, últimos 2 anos) | |
| MSI GP66 Leopard 11UH-028 | |
| Schenker XMG Neo 15 Tiger Lake | |
| Média Intel Core i7-11800H (1386 - 1522, n=45) | |
| Alienware m15 R6, i7-11800H RTX 3080 | |
| Asus ROG Strix Scar 15 G533QS | |
| MSI GP66 Leopard 10UG | |
| Cinebench R20 / CPU (Multi Core) | |
| Média da turma Gaming (4029 - 16433, n=106, últimos 2 anos) | |
| Schenker XMG Neo 15 Tiger Lake | |
| Asus ROG Strix Scar 15 G533QS | |
| Aorus 15P YD | |
| MSI GP66 Leopard 11UH-028 | |
| Alienware m15 R6, i7-11800H RTX 3080 | |
| Média Intel Core i7-11800H (2498 - 5408, n=50) | |
| MSI GP66 Leopard 10UG | |
| Cinebench R20 / CPU (Single Core) | |
| Média da turma Gaming (442 - 913, n=106, últimos 2 anos) | |
| Aorus 15P YD | |
| MSI GP66 Leopard 11UH-028 | |
| Schenker XMG Neo 15 Tiger Lake | |
| Alienware m15 R6, i7-11800H RTX 3080 | |
| Média Intel Core i7-11800H (520 - 586, n=47) | |
| Asus ROG Strix Scar 15 G533QS | |
| MSI GP66 Leopard 10UG | |
| Cinebench R15 / CPU Multi 64Bit | |
| Média da turma Gaming (1578 - 6330, n=105, últimos 2 anos) | |
| Asus ROG Strix Scar 15 G533QS | |
| Schenker XMG Neo 15 Tiger Lake | |
| Alienware m15 R6, i7-11800H RTX 3080 | |
| MSI GP66 Leopard 11UH-028 | |
| Aorus 15P YD | |
| Média Intel Core i7-11800H (1342 - 2173, n=50) | |
| MSI GP66 Leopard 10UG | |
| Cinebench R15 / CPU Single 64Bit | |
| Média da turma Gaming (188.8 - 350, n=106, últimos 2 anos) | |
| Asus ROG Strix Scar 15 G533QS | |
| Aorus 15P YD | |
| Schenker XMG Neo 15 Tiger Lake | |
| MSI GP66 Leopard 11UH-028 | |
| Alienware m15 R6, i7-11800H RTX 3080 | |
| Média Intel Core i7-11800H (201 - 231, n=46) | |
| MSI GP66 Leopard 10UG | |
| Blender / v2.79 BMW27 CPU | |
| Aorus 15P YD | |
| MSI GP66 Leopard 10UG | |
| Média Intel Core i7-11800H (217 - 454, n=46) | |
| Alienware m15 R6, i7-11800H RTX 3080 | |
| MSI GP66 Leopard 11UH-028 | |
| Asus ROG Strix Scar 15 G533QS | |
| Schenker XMG Neo 15 Tiger Lake | |
| Média da turma Gaming (79 - 330, n=104, últimos 2 anos) | |
| 7-Zip 18.03 / 7z b 4 | |
| Média da turma Gaming (33491 - 148086, n=105, últimos 2 anos) | |
| Asus ROG Strix Scar 15 G533QS | |
| Schenker XMG Neo 15 Tiger Lake | |
| MSI GP66 Leopard 11UH-028 | |
| Alienware m15 R6, i7-11800H RTX 3080 | |
| Média Intel Core i7-11800H (33718 - 56758, n=46) | |
| Aorus 15P YD | |
| MSI GP66 Leopard 10UG | |
| 7-Zip 18.03 / 7z b 4 -mmt1 | |
| Média da turma Gaming (4199 - 7436, n=105, últimos 2 anos) | |
| Schenker XMG Neo 15 Tiger Lake | |
| Aorus 15P YD | |
| MSI GP66 Leopard 11UH-028 | |
| Asus ROG Strix Scar 15 G533QS | |
| Média Intel Core i7-11800H (5138 - 5732, n=46) | |
| Alienware m15 R6, i7-11800H RTX 3080 | |
| MSI GP66 Leopard 10UG | |
| Geekbench 5.5 / Multi-Core | |
| Média da turma Gaming (6460 - 28263, n=105, últimos 2 anos) | |
| Schenker XMG Neo 15 Tiger Lake | |
| Alienware m15 R6, i7-11800H RTX 3080 | |
| MSI GP66 Leopard 11UH-028 | |
| Aorus 15P YD | |
| Média Intel Core i7-11800H (4655 - 9851, n=40) | |
| MSI GP66 Leopard 10UG | |
| Geekbench 5.5 / Single-Core | |
| Média da turma Gaming (986 - 2474, n=105, últimos 2 anos) | |
| Schenker XMG Neo 15 Tiger Lake | |
| Aorus 15P YD | |
| MSI GP66 Leopard 11UH-028 | |
| Alienware m15 R6, i7-11800H RTX 3080 | |
| Média Intel Core i7-11800H (1429 - 1625, n=40) | |
| MSI GP66 Leopard 10UG | |
| HWBOT x265 Benchmark v2.2 / 4k Preset | |
| Média da turma Gaming (11.5 - 44.4, n=105, últimos 2 anos) | |
| Schenker XMG Neo 15 Tiger Lake | |
| Asus ROG Strix Scar 15 G533QS | |
| MSI GP66 Leopard 11UH-028 | |
| Média Intel Core i7-11800H (7.38 - 17.4, n=46) | |
| Alienware m15 R6, i7-11800H RTX 3080 | |
| MSI GP66 Leopard 10UG | |
| Aorus 15P YD | |
| LibreOffice / 20 Documents To PDF | |
| Asus ROG Strix Scar 15 G533QS | |
| Média da turma Gaming (33.2 - 88.8, n=105, últimos 2 anos) | |
| MSI GP66 Leopard 10UG | |
| MSI GP66 Leopard 11UH-028 | |
| Schenker XMG Neo 15 Tiger Lake | |
| Média Intel Core i7-11800H (38.6 - 59.9, n=45) | |
| Alienware m15 R6, i7-11800H RTX 3080 | |
| Aorus 15P YD | |
| R Benchmark 2.5 / Overall mean | |
| MSI GP66 Leopard 10UG | |
| MSI GP66 Leopard 11UH-028 | |
| Média Intel Core i7-11800H (0.548 - 0.615, n=46) | |
| Aorus 15P YD | |
| Alienware m15 R6, i7-11800H RTX 3080 | |
| Schenker XMG Neo 15 Tiger Lake | |
| Asus ROG Strix Scar 15 G533QS | |
| Média da turma Gaming (0.3439 - 0.759, n=106, últimos 2 anos) | |
* ... menor é melhor
AIDA64: FP32 Ray-Trace | FPU Julia | CPU SHA3 | CPU Queen | FPU SinJulia | FPU Mandel | CPU AES | CPU ZLib | FP64 Ray-Trace | CPU PhotoWorxx
| Performance rating | |
| Média da turma Gaming | |
| Asus ROG Strix Scar 15 G533QS | |
| Alienware m15 R6, i7-11800H RTX 3080 | |
| MSI GP66 Leopard 11UH-028 | |
| Média Intel Core i7-11800H | |
| MSI GP66 Leopard 10UG | |
| AIDA64 / FP32 Ray-Trace | |
| Média da turma Gaming (10227 - 85542, n=105, últimos 2 anos) | |
| Alienware m15 R6, i7-11800H RTX 3080 | |
| Asus ROG Strix Scar 15 G533QS | |
| MSI GP66 Leopard 11UH-028 | |
| Média Intel Core i7-11800H (8772 - 15961, n=20) | |
| MSI GP66 Leopard 10UG | |
| AIDA64 / FPU Julia | |
| Média da turma Gaming (51376 - 238426, n=105, últimos 2 anos) | |
| Asus ROG Strix Scar 15 G533QS | |
| Alienware m15 R6, i7-11800H RTX 3080 | |
| MSI GP66 Leopard 11UH-028 | |
| MSI GP66 Leopard 10UG | |
| Média Intel Core i7-11800H (39404 - 65636, n=20) | |
| AIDA64 / CPU SHA3 | |
| Média da turma Gaming (2180 - 10115, n=105, últimos 2 anos) | |
| Alienware m15 R6, i7-11800H RTX 3080 | |
| MSI GP66 Leopard 11UH-028 | |
| Média Intel Core i7-11800H (2599 - 4439, n=20) | |
| Asus ROG Strix Scar 15 G533QS | |
| MSI GP66 Leopard 10UG | |
| AIDA64 / CPU Queen | |
| Média da turma Gaming (49785 - 173351, n=90, últimos 2 anos) | |
| Asus ROG Strix Scar 15 G533QS | |
| MSI GP66 Leopard 11UH-028 | |
| Alienware m15 R6, i7-11800H RTX 3080 | |
| Média Intel Core i7-11800H (85233 - 91941, n=20) | |
| MSI GP66 Leopard 10UG | |
| AIDA64 / FPU SinJulia | |
| Média da turma Gaming (4424 - 33636, n=105, últimos 2 anos) | |
| Asus ROG Strix Scar 15 G533QS | |
| MSI GP66 Leopard 11UH-028 | |
| Alienware m15 R6, i7-11800H RTX 3080 | |
| MSI GP66 Leopard 10UG | |
| Média Intel Core i7-11800H (6420 - 9792, n=20) | |
| AIDA64 / FPU Mandel | |
| Média da turma Gaming (25115 - 128721, n=105, últimos 2 anos) | |
| Asus ROG Strix Scar 15 G533QS | |
| Alienware m15 R6, i7-11800H RTX 3080 | |
| MSI GP66 Leopard 11UH-028 | |
| Média Intel Core i7-11800H (23365 - 39464, n=20) | |
| MSI GP66 Leopard 10UG | |
| AIDA64 / CPU AES | |
| Alienware m15 R6, i7-11800H RTX 3080 | |
| MSI GP66 Leopard 11UH-028 | |
| Asus ROG Strix Scar 15 G533QS | |
| Média Intel Core i7-11800H (74617 - 149388, n=20) | |
| Média da turma Gaming (39258 - 247074, n=105, últimos 2 anos) | |
| MSI GP66 Leopard 10UG | |
| AIDA64 / CPU ZLib | |
| Média da turma Gaming (574 - 2531, n=105, últimos 2 anos) | |
| Asus ROG Strix Scar 15 G533QS | |
| Alienware m15 R6, i7-11800H RTX 3080 | |
| MSI GP66 Leopard 11UH-028 | |
| MSI GP66 Leopard 10UG | |
| Média Intel Core i7-11800H (461 - 830, n=43) | |
| AIDA64 / FP64 Ray-Trace | |
| Média da turma Gaming (5509 - 45446, n=105, últimos 2 anos) | |
| Alienware m15 R6, i7-11800H RTX 3080 | |
| Asus ROG Strix Scar 15 G533QS | |
| MSI GP66 Leopard 11UH-028 | |
| Média Intel Core i7-11800H (4545 - 8717, n=21) | |
| MSI GP66 Leopard 10UG | |
| AIDA64 / CPU PhotoWorxx | |
| Média da turma Gaming (12271 - 89891, n=105, últimos 2 anos) | |
| Asus ROG Strix Scar 15 G533QS | |
| Alienware m15 R6, i7-11800H RTX 3080 | |
| MSI GP66 Leopard 11UH-028 | |
| MSI GP66 Leopard 10UG | |
| Média Intel Core i7-11800H (11898 - 26757, n=21) | |
Desempenho do sistema
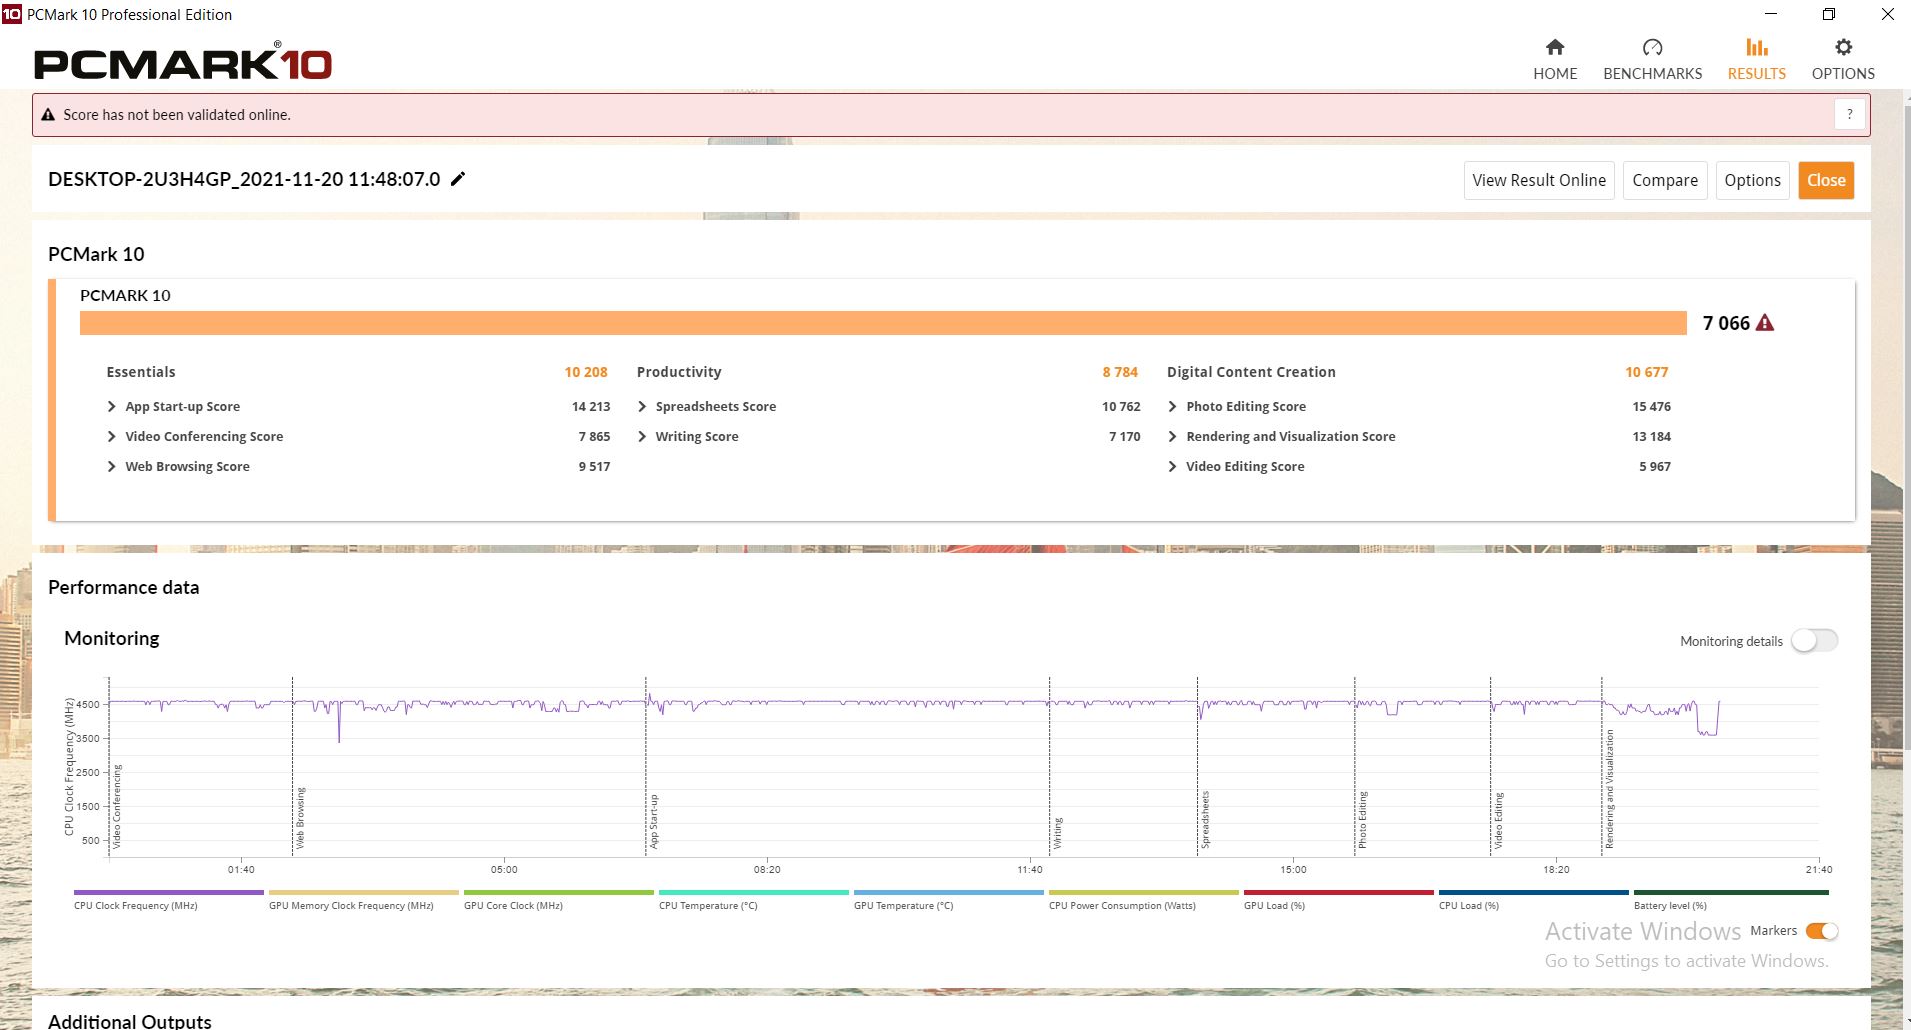
O Leopardo tem um desempenho aproximadamente no nível esperado no PCMark 10. No entanto, os rivais são muitas vezes um pouco melhores, mas isto é mais provável que seja devido à precisão de medição.
| PCMark 10 / Score | |
| Média da turma Gaming (5828 - 12414, n=93, últimos 2 anos) | |
| Asus ROG Strix Scar 15 G533QS | |
| Aorus 15P YD | |
| Schenker XMG Neo 15 Tiger Lake | |
| Alienware m15 R6, i7-11800H RTX 3080 | |
| Média Intel Core i7-11800H, NVIDIA GeForce RTX 3080 Laptop GPU (6673 - 7470, n=11) | |
| MSI GP66 Leopard 11UH-028 | |
| MSI GP66 Leopard 10UG | |
| PCMark 10 / Essentials | |
| Média da turma Gaming (8810 - 11935, n=97, últimos 2 anos) | |
| Aorus 15P YD | |
| Média Intel Core i7-11800H, NVIDIA GeForce RTX 3080 Laptop GPU (9862 - 11064, n=11) | |
| Schenker XMG Neo 15 Tiger Lake | |
| Asus ROG Strix Scar 15 G533QS | |
| MSI GP66 Leopard 11UH-028 | |
| Alienware m15 R6, i7-11800H RTX 3080 | |
| MSI GP66 Leopard 10UG | |
| PCMark 10 / Productivity | |
| Média da turma Gaming (6845 - 25323, n=95, últimos 2 anos) | |
| Asus ROG Strix Scar 15 G533QS | |
| Alienware m15 R6, i7-11800H RTX 3080 | |
| Aorus 15P YD | |
| Média Intel Core i7-11800H, NVIDIA GeForce RTX 3080 Laptop GPU (8278 - 9803, n=11) | |
| Schenker XMG Neo 15 Tiger Lake | |
| MSI GP66 Leopard 11UH-028 | |
| MSI GP66 Leopard 10UG | |
| PCMark 10 / Digital Content Creation | |
| Média da turma Gaming (7602 - 19954, n=95, últimos 2 anos) | |
| Schenker XMG Neo 15 Tiger Lake | |
| Alienware m15 R6, i7-11800H RTX 3080 | |
| MSI GP66 Leopard 11UH-028 | |
| Média Intel Core i7-11800H, NVIDIA GeForce RTX 3080 Laptop GPU (9881 - 11323, n=11) | |
| Aorus 15P YD | |
| MSI GP66 Leopard 10UG | |
| Asus ROG Strix Scar 15 G533QS | |
| PCMark 10 Score | 7066 pontos | |
Ajuda | ||
| AIDA64 / Memory Copy | |
| Média da turma Gaming (21750 - 129946, n=105, últimos 2 anos) | |
| MSI GP66 Leopard 11UH-028 | |
| Alienware m15 R6, i7-11800H RTX 3080 | |
| Asus ROG Strix Scar 15 G533QS | |
| Média Intel Core i7-11800H (24508 - 48144, n=21) | |
| MSI GP66 Leopard 10UG | |
| AIDA64 / Memory Read | |
| Média da turma Gaming (22956 - 118858, n=105, últimos 2 anos) | |
| MSI GP66 Leopard 11UH-028 | |
| Alienware m15 R6, i7-11800H RTX 3080 | |
| Asus ROG Strix Scar 15 G533QS | |
| Média Intel Core i7-11800H (25882 - 50365, n=20) | |
| MSI GP66 Leopard 10UG | |
| AIDA64 / Memory Write | |
| Média da turma Gaming (22297 - 135096, n=105, últimos 2 anos) | |
| MSI GP66 Leopard 10UG | |
| Asus ROG Strix Scar 15 G533QS | |
| MSI GP66 Leopard 11UH-028 | |
| Alienware m15 R6, i7-11800H RTX 3080 | |
| Média Intel Core i7-11800H (22240 - 46214, n=20) | |
| AIDA64 / Memory Latency | |
| Média da turma Gaming (75.3 - 259, n=105, últimos 2 anos) | |
| Alienware m15 R6, i7-11800H RTX 3080 | |
| MSI GP66 Leopard 11UH-028 | |
| Asus ROG Strix Scar 15 G533QS | |
| MSI GP66 Leopard 10UG | |
| Média Intel Core i7-11800H (71.9 - 104.1, n=44) | |
| Aorus 15P YD | |
| Schenker XMG Neo 15 Tiger Lake | |
* ... menor é melhor
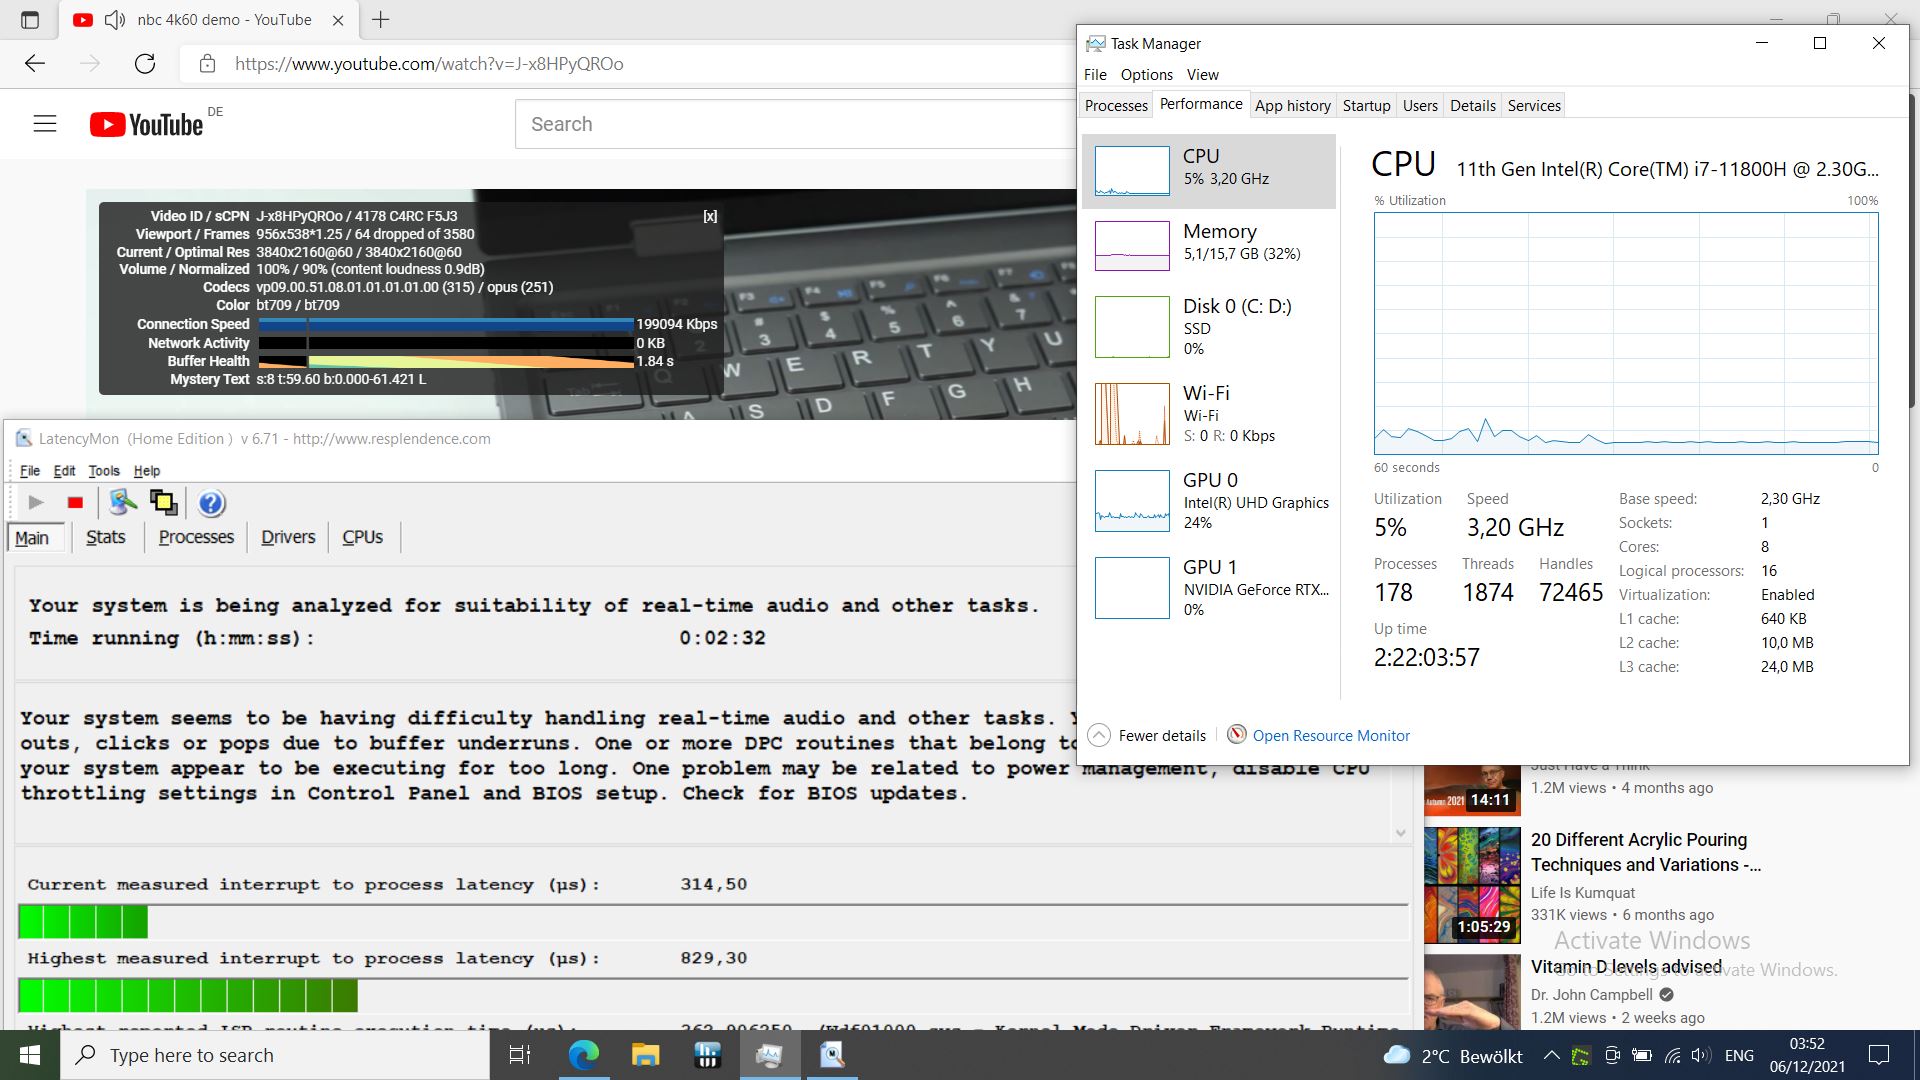
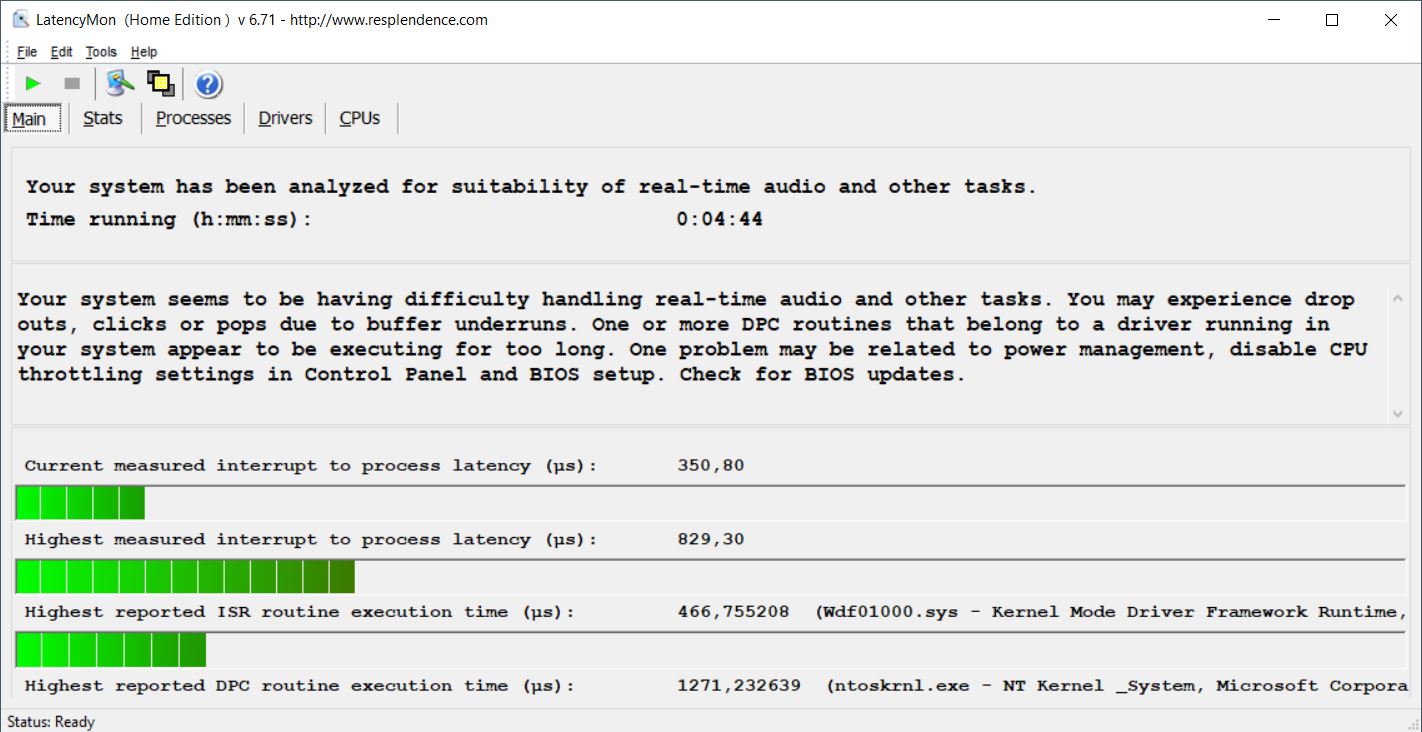
Latências DPC
O GP66 tem problemas de latência com várias abas do navegador abertas ou com nosso vídeo 4K/60 fps no YouTube. O Leopardo recolheu quadros perdidos a cada segundo no vídeo de teste, 64 no final. Entre outras coisas, a culpa é do kernel NT e do driver do sistema. A concorrência tem taxas de latência similarmente altas, mas consegue melhor com a reprodução do vídeo, exceto no caso do Alienware.
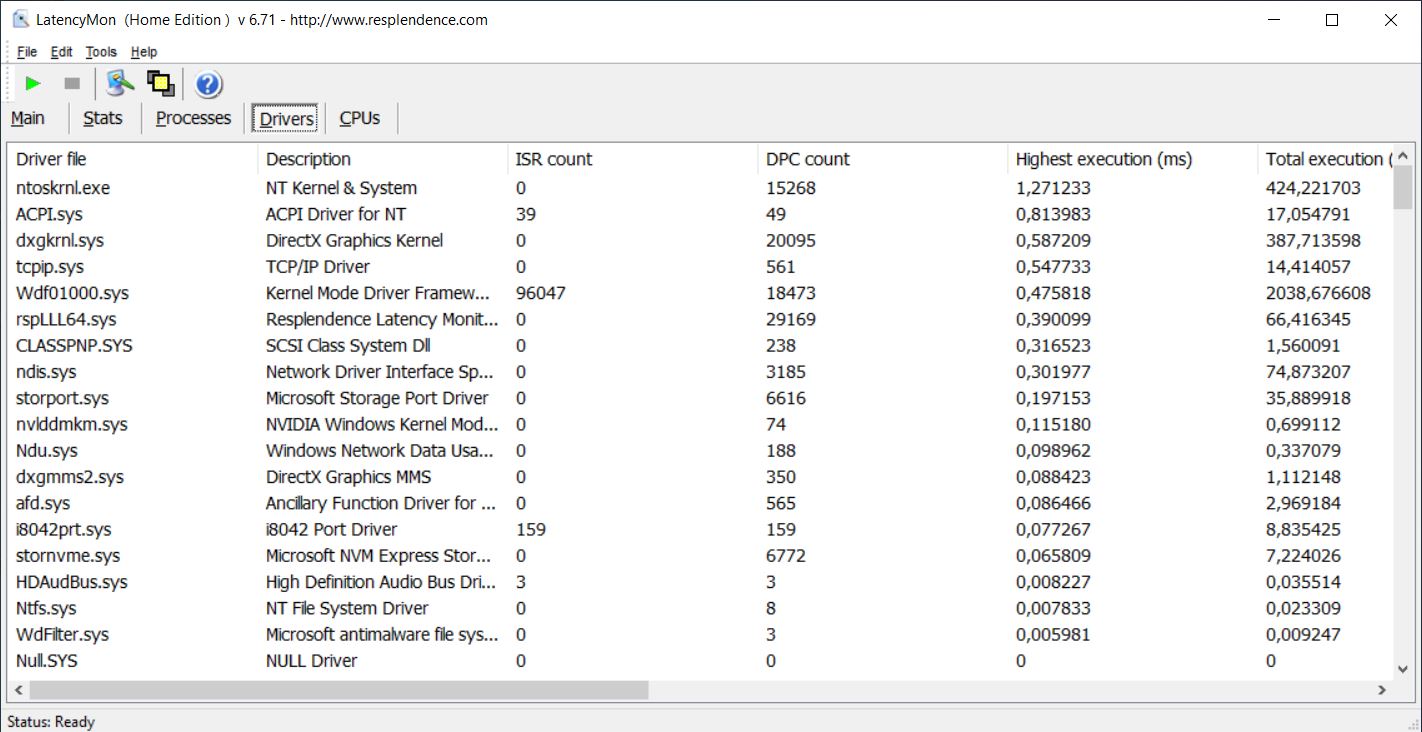
| DPC Latencies / LatencyMon - interrupt to process latency (max), Web, Youtube, Prime95 | |
| Asus ROG Strix Scar 15 G533QS | |
| Alienware m15 R6, i7-11800H RTX 3080 | |
| MSI GP66 Leopard 11UH-028 | |
| Aorus 15P YD | |
| Schenker XMG Neo 15 Tiger Lake | |
| MSI GP66 Leopard 10UG | |
* ... menor é melhor
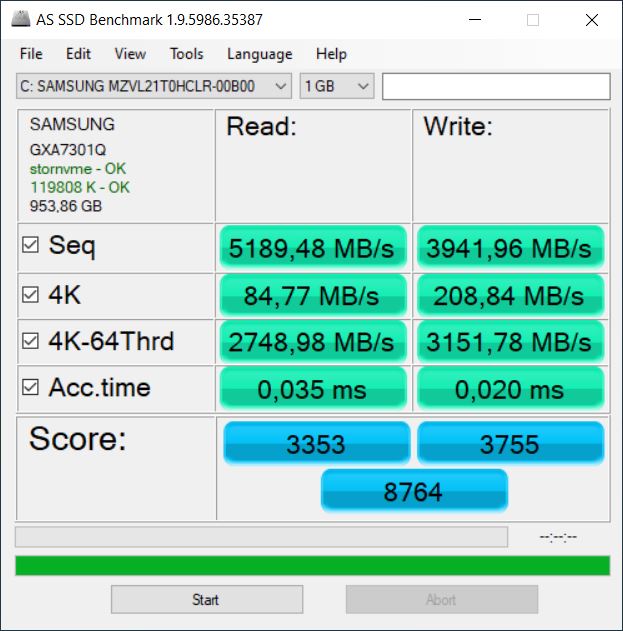
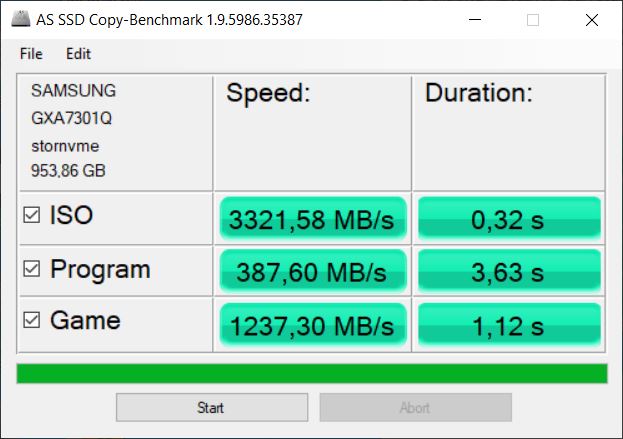
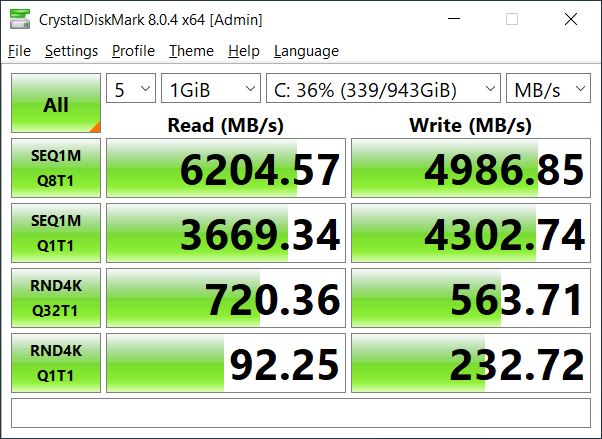
Armazenamento
O SSD NVMe instalado da Samsung com 1 TB de armazenamento é muito rápido (A melhor lista de SSD/HDD) no entanto, seu desempenho superior cai mais da metade no teste de resistência. Isto dificilmente deve ser notado no uso diário, e o desempenho de resistência restante ainda é relativamente alto.

* ... menor é melhor
Continuous load read: DiskSpd Read Loop, Queue Depth 8
Placa gráfica
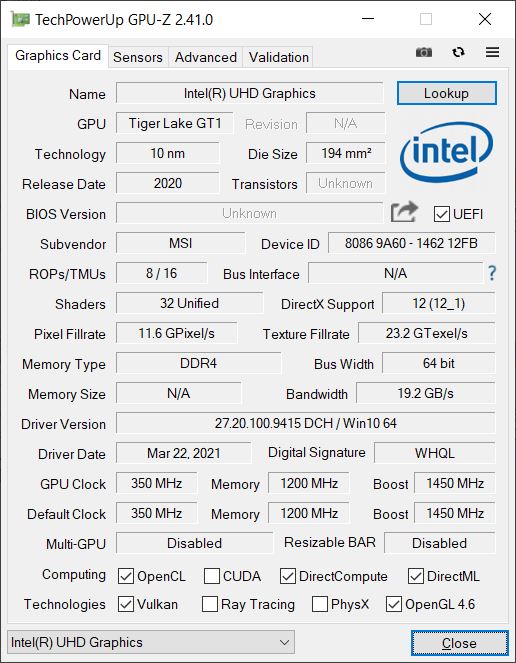
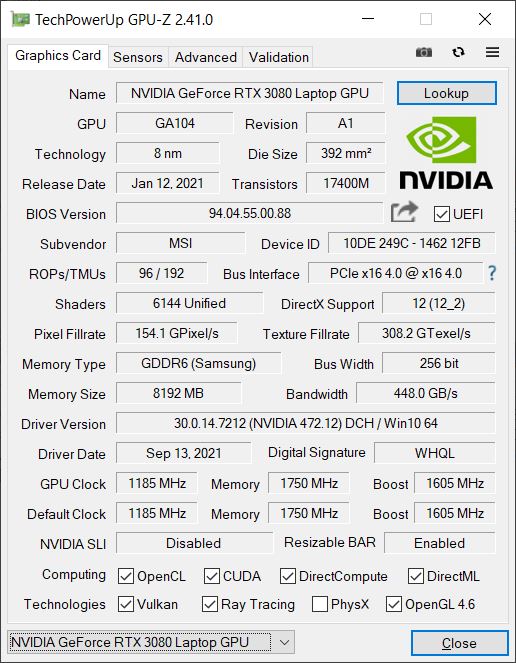
Além da CPU-integradaIntel UHD Graphics Xe (32EUs)o laptop tem um NVIDIA GeForce GPU para laptop RTX 3080que garante taxas de moldura suaves. A GPU pode consumir 140 W incluindo o Dynamic Boost, enquanto a mesma placa no Schenker XMG Neo permite-se a si mesma a 165 W completa. Outras variantes do GP66 também estão disponíveis com RTX 3070 equipado.
Assim, o Schenker está frequentemente alguns pontos percentuais à frente nos 3DMarks, mas o Leopardo pode liderar o resto da competição.
O desempenho gráfico cai consideravelmente com a energia da bateria, em um total de 65% no 3DMark 11. NoWitcher 3(Ultra), a taxa de quadros caiu espontaneamente de um bom 120 fps para apenas 11 fps inutilizáveis! Assim, os jogos móveis só são possíveis com sacrifícios muito grandes.
| 3DMark 11 Performance | 30689 pontos | |
| 3DMark Cloud Gate Standard Score | 51452 pontos | |
| 3DMark Fire Strike Score | 24909 pontos | |
| 3DMark Time Spy Score | 11030 pontos | |
Ajuda | ||
Desempenho do jogo
A MSI exibe todos os jogos testados em Full HD, mesmo em configurações ultra-rápidas, a cerca de 100 fps. Assim, ainda há espaço suficiente para exibir o conteúdo de 4K.
O Leopard se sai bastante bem em comparação, mas as diferenças entre os concorrentes com RTX 3080 são bastante pequenas. Somente o XMG Neo com RTX 165 W pode ter um desempenho ligeiramente superior ao MSI, dependendo do jogo.
No modo de desempenho extremo, alcançamos um ganho de pouco menos de 5% no The Witcher 3(Ultra). A GPU é claramente mais decisiva do que a CPU que se beneficia do modo.
| New World | |
| 1920x1080 Medium Video Quality | |
| MSI GP66 Leopard 11UH-028 | |
| Alienware m15 R6, i7-11800H RTX 3080 | |
| Média NVIDIA GeForce RTX 3080 Laptop GPU (80.8 - 105.4, n=4) | |
| 1920x1080 High Video Quality | |
| MSI GP66 Leopard 11UH-028 | |
| Alienware m15 R6, i7-11800H RTX 3080 | |
| Média NVIDIA GeForce RTX 3080 Laptop GPU (75.1 - 96.7, n=4) | |
| 1920x1080 Very High Video Quality | |
| MSI GP66 Leopard 11UH-028 | |
| Alienware m15 R6, i7-11800H RTX 3080 | |
| Média NVIDIA GeForce RTX 3080 Laptop GPU (71.5 - 90.4, n=4) | |
O Witcher 3 começa em cerca de 120 fps no GP66. Após os primeiros minutos, este valor desce e se estabiliza a 110 fps bastante constantes, e este valor ainda é mantido após uma hora. A este respeito, o laptop perde apenas uma parte insignificante do desempenho ao longo do tempo.
Witcher 3 FPS Diagramm
| baixo | média | alto | ultra | |
|---|---|---|---|---|
| GTA V (2015) | 184 | 177 | 166 | 103 |
| The Witcher 3 (2015) | 344.8 | 300 | 196.5 | 110.2 |
| Dota 2 Reborn (2015) | 168 | 151 | 143 | 135 |
| Final Fantasy XV Benchmark (2018) | 136 | |||
| X-Plane 11.11 (2018) | 121 | 107 | 85.7 | |
| Far Cry 5 (2018) | 152 | 123 | 119 | 111 |
| Strange Brigade (2018) | 492 | 267 | 223 | 197 |
| New World (2021) | 132.7 | 105.4 | 96.7 | 90.4 |
Emissões - Comportamento exemplar dos ventiladores
Emissões sonoras
Os ventiladores são frequentemente silenciosos quando ociosos e nós geralmente gostamos do comportamento adaptativo dos ventiladores porque os ventiladores se acalmam muito rapidamente mesmo após uma carga pesada. Mesmo após uma hora inteira noThe Witcher 3
, os ventiladores se acalmam consideravelmente cerca de 30 segundos depois e ronronam em silêncio enquanto estão ociosos.Os ventiladores também permanecem desligados durante a maior parte do tempo em modo de extremo desempenho durante ociosos e se acalmam muito rapidamente mesmo após cargas pesadas. Entretanto, se você ativar adicionalmente o "Cooler Boost", os ventiladores saltam repentinamente para a velocidade máxima com o ruído de 58 dB.
A variação de desempenho entre Balanced, Extreme Performance e Extreme Performance plus Cooler Boost é interessante - ela é praticamente inexistente ou quase inexistente! Por outro lado, há diferenças significativas no nível de ruído. Medimos cerca de 47 dB sob Equilíbrio, cerca de 53 dB sob Desempenho Extremo (inserido aqui como o valor máximo) e os já mencionados 58 dB com Cooler Boost!
Assim, o GP66 é um dos portáteis mais silenciosos em modo balanceado, e um dos mais barulhentos com Cooler Boost. Não detectamos nenhum ruído eletrônico
Barulho
| Ocioso |
| 23 / 23 / 30.11 dB |
| Carga |
| 41.86 / 53 dB |
 | ||
30 dB silencioso 40 dB(A) audível 50 dB(A) ruidosamente alto |
||
min: | ||
| MSI GP66 Leopard 11UH-028 GeForce RTX 3080 Laptop GPU, i7-11800H, Samsung PM9A1 MZVL21T0HCLR | MSI GP66 Leopard 10UG GeForce RTX 3070 Laptop GPU, i7-10870H, Kingston OM8PCP31024F | Aorus 15P YD GeForce RTX 3080 Laptop GPU, i7-11800H, Samsung PM9A1 MZVL21T0HCLR | Asus ROG Strix Scar 15 G533QS GeForce RTX 3080 Laptop GPU, R9 5900HX, ADATA Swordfish 2 TB | Schenker XMG Neo 15 Tiger Lake GeForce RTX 3080 Laptop GPU, i7-11800H, Samsung SSD 980 Pro 1TB MZ-V8P1T0BW | Alienware m15 R6, i7-11800H RTX 3080 GeForce RTX 3080 Laptop GPU, i7-11800H, Samsung PM9A1 MZVL21T0HCLR | |
|---|---|---|---|---|---|---|
| Noise | -5% | -12% | -8% | -12% | -2% | |
| desligado / ambiente * (dB) | 23 | 24.7 -7% | 25 -9% | 25.5 -11% | 25 -9% | 23 -0% |
| Idle Minimum * (dB) | 23 | 26.8 -17% | 26 -13% | 25.5 -11% | 27 -17% | 23 -0% |
| Idle Average * (dB) | 23 | 26.8 -17% | 30 -30% | 25.5 -11% | 30 -30% | 23 -0% |
| Idle Maximum * (dB) | 30.11 | 26.8 11% | 34 -13% | 37.1 -23% | 32 -6% | 30 -0% |
| Load Average * (dB) | 41.86 | 40.4 3% | 43 -3% | 39.2 6% | 46 -10% | 41.26 1% |
| Witcher 3 ultra * (dB) | 47.79 | 48.8 -2% | 50 -5% | 50.5 -6% | 52 -9% | 53.4 -12% |
| Load Maximum * (dB) | 53 | 57.2 -8% | 57 -8% | 51.8 2% | 55 -4% | 53.37 -1% |
* ... menor é melhor
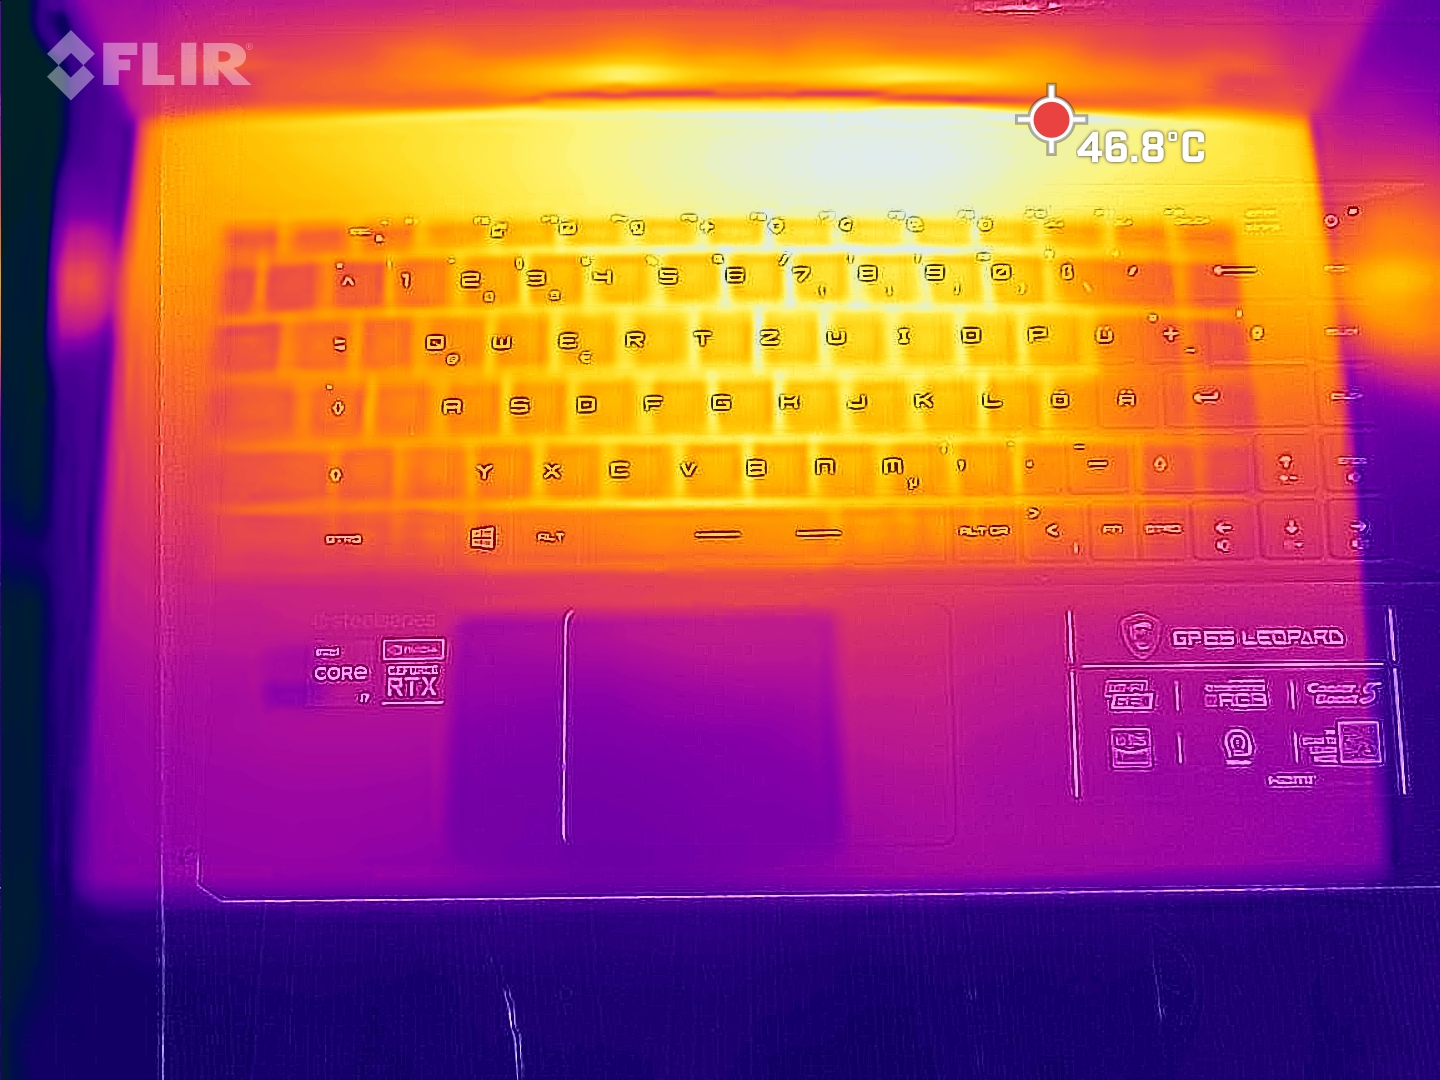
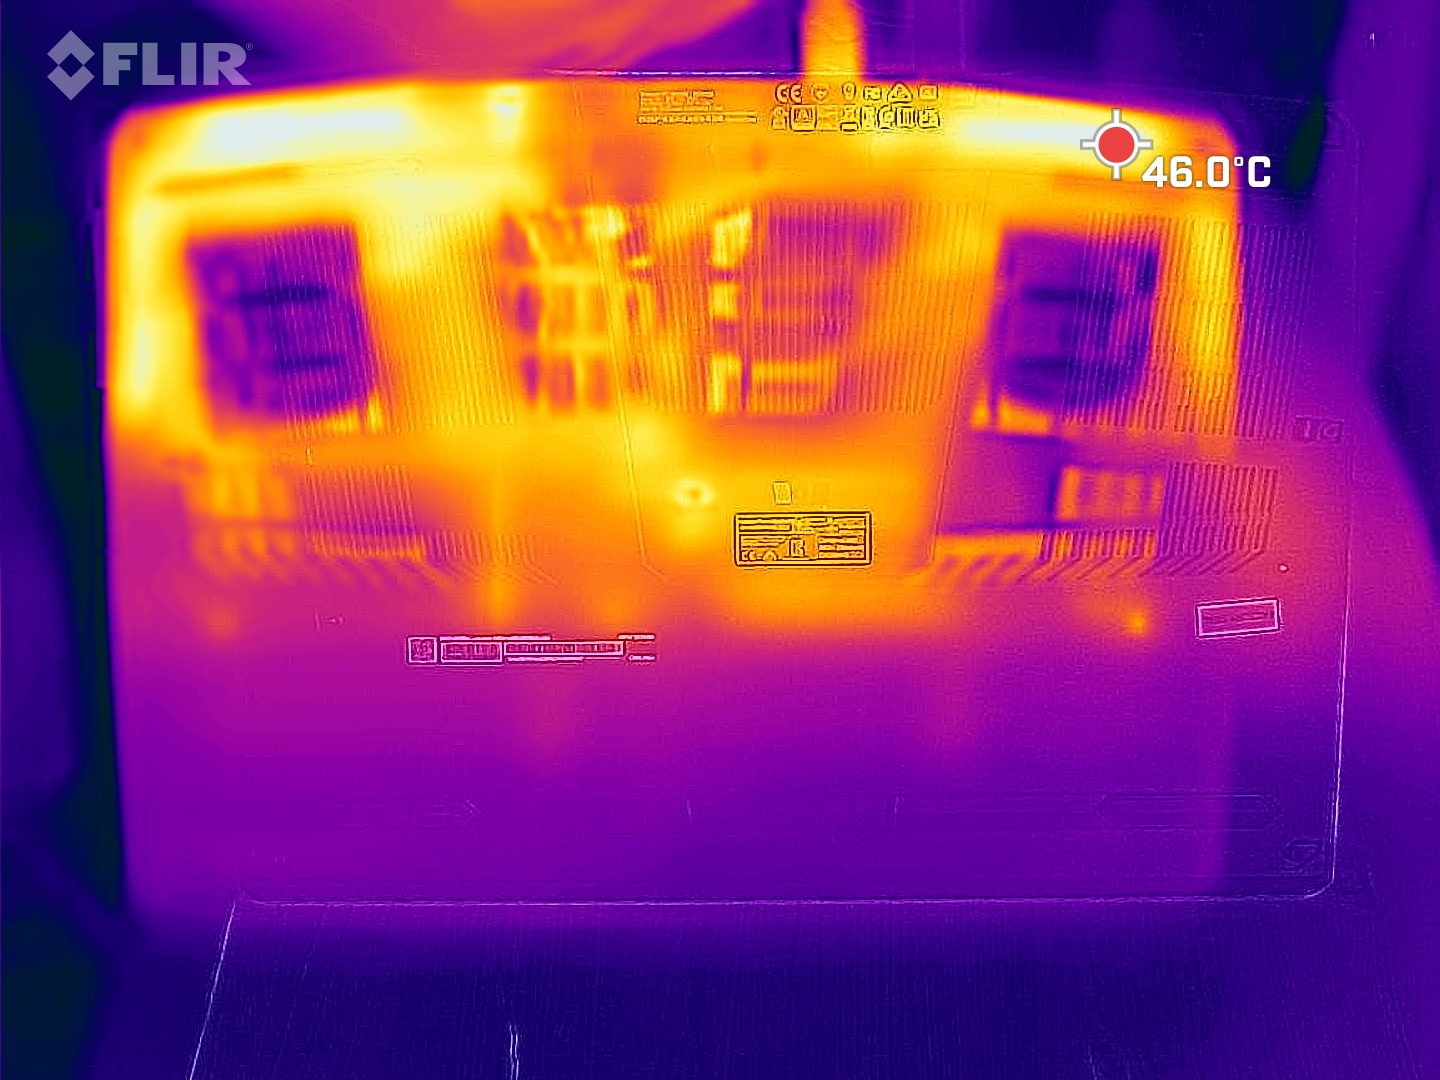
Temperatura
Os pontos quentes na parte superior e inferior atingem até 54 °C durante os jogos, o que coloca o jogador no meio da competição. O Alienware e o Aorus ficam mais quentes, enquanto o Asus e o XMG permanecem mais frios, mas têm o sistema de resfriamento mais alto
Todas as medidas mencionadas acima foram tomadas no modo Balanceado. Como o desempenho não aumenta muito nos modos mais altos, pelo menos não nos jogos, as temperaturas provavelmente cairão ainda mais devido aos ventiladores de giro mais rápido
(-) A temperatura máxima no lado superior é 49 °C / 120 F, em comparação com a média de 40.4 °C / 105 F , variando de 21.2 a 68.8 °C para a classe Gaming.
(-) A parte inferior aquece até um máximo de 47 °C / 117 F, em comparação com a média de 43.2 °C / 110 F
(+) Em uso inativo, a temperatura média para o lado superior é 26.7 °C / 80 F, em comparação com a média do dispositivo de 33.9 °C / ### class_avg_f### F.
(-) Jogando The Witcher 3, a temperatura média para o lado superior é 43.9 °C / 111 F, em comparação com a média do dispositivo de 33.9 °C / ## #class_avg_f### F.
(+) Os apoios para as mãos e o touchpad estão atingindo a temperatura máxima da pele (32 °C / 89.6 F) e, portanto, não estão quentes.
(-) A temperatura média da área do apoio para as mãos de dispositivos semelhantes foi 28.8 °C / 83.8 F (-3.2 °C / -5.8 F).
| MSI GP66 Leopard 11UH-028 Intel Core i7-11800H, NVIDIA GeForce RTX 3080 Laptop GPU | MSI GP66 Leopard 10UG Intel Core i7-10870H, NVIDIA GeForce RTX 3070 Laptop GPU | Aorus 15P YD Intel Core i7-11800H, NVIDIA GeForce RTX 3080 Laptop GPU | Asus ROG Strix Scar 15 G533QS AMD Ryzen 9 5900HX, NVIDIA GeForce RTX 3080 Laptop GPU | Schenker XMG Neo 15 Tiger Lake Intel Core i7-11800H, NVIDIA GeForce RTX 3080 Laptop GPU | Alienware m15 R6, i7-11800H RTX 3080 Intel Core i7-11800H, NVIDIA GeForce RTX 3080 Laptop GPU | |
|---|---|---|---|---|---|---|
| Heat | 3% | -9% | -5% | -2% | -20% | |
| Maximum Upper Side * (°C) | 49 | 42.8 13% | 49 -0% | 43.4 11% | 39 20% | 61 -24% |
| Maximum Bottom * (°C) | 47 | 50 -6% | 57 -21% | 48.2 -3% | 50 -6% | 58 -23% |
| Idle Upper Side * (°C) | 31 | 33 -6% | 33 -6% | 35.2 -14% | 34 -10% | 38 -23% |
| Idle Bottom * (°C) | 33 | 29 12% | 36 -9% | 37 -12% | 37 -12% | 36 -9% |
* ... menor é melhor
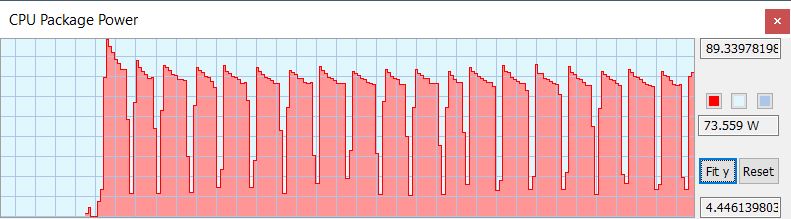
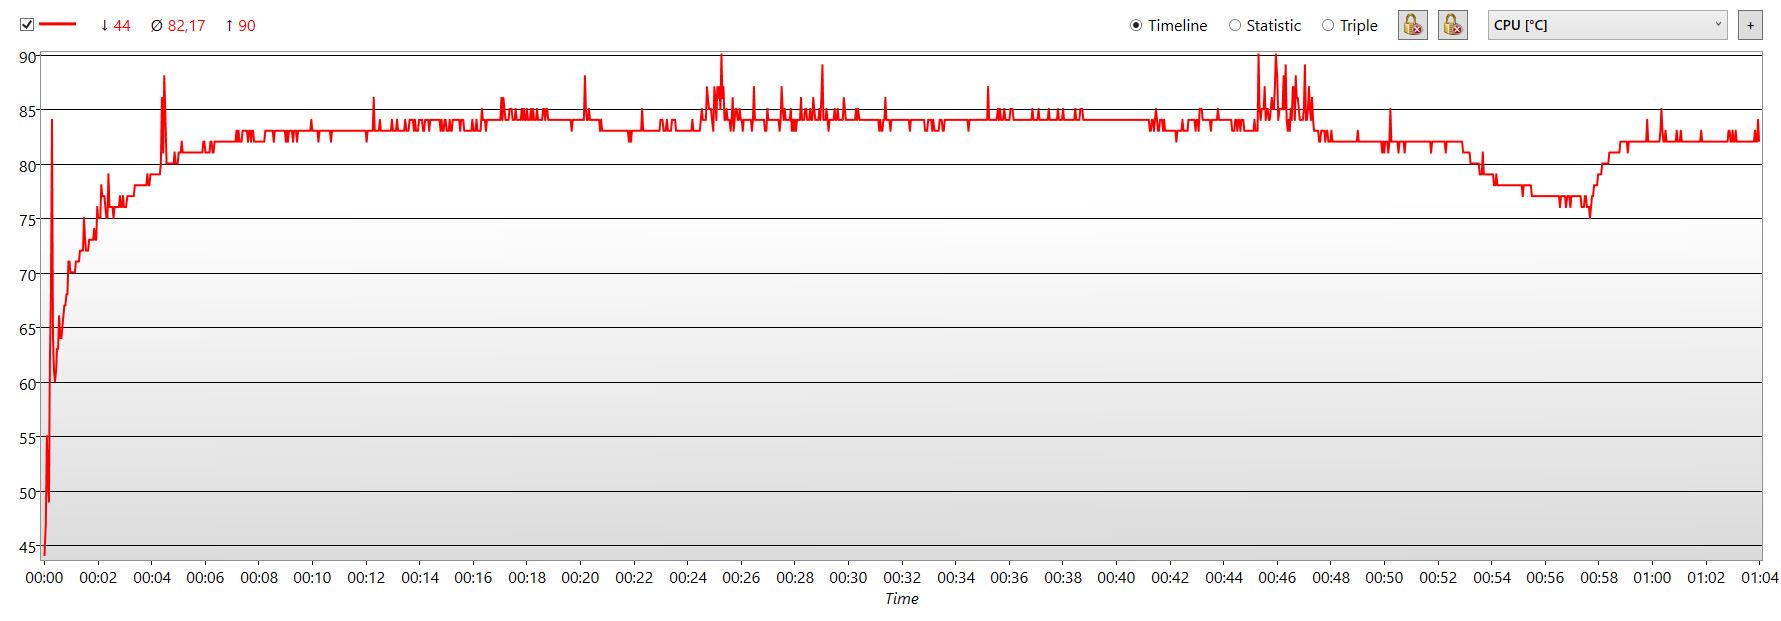
Teste de estresse
Os 8 núcleos da CPU começam nosso teste de estresse com cerca de 4,2 GHz. Entretanto, após a temperatura do núcleo atingir 96 °C em cerca de um minuto, a velocidade do relógio é acelerada. Ela cai brevemente abaixo de 3 GHz, mas mais tarde ultrapassa este limite novamente. Medimos cerca de 3,3 GHz depois de uma hora, e os níveis de temperatura saem entre 82 e 86 °C, dependendo das taxas de relógio.
O relógio GPU flutua entre 1,3 e 1,7 GHz ao longo de todo o período de teste. Os núcleos da GPU atingem temperaturas de até 76 °C.
O sistema se acalma rapidamente novamente após o teste de esforço. Outro 3DMark 11 funciona diretamente após o final do teste de estresse e obteve aproximadamente a mesma pontuação de antes
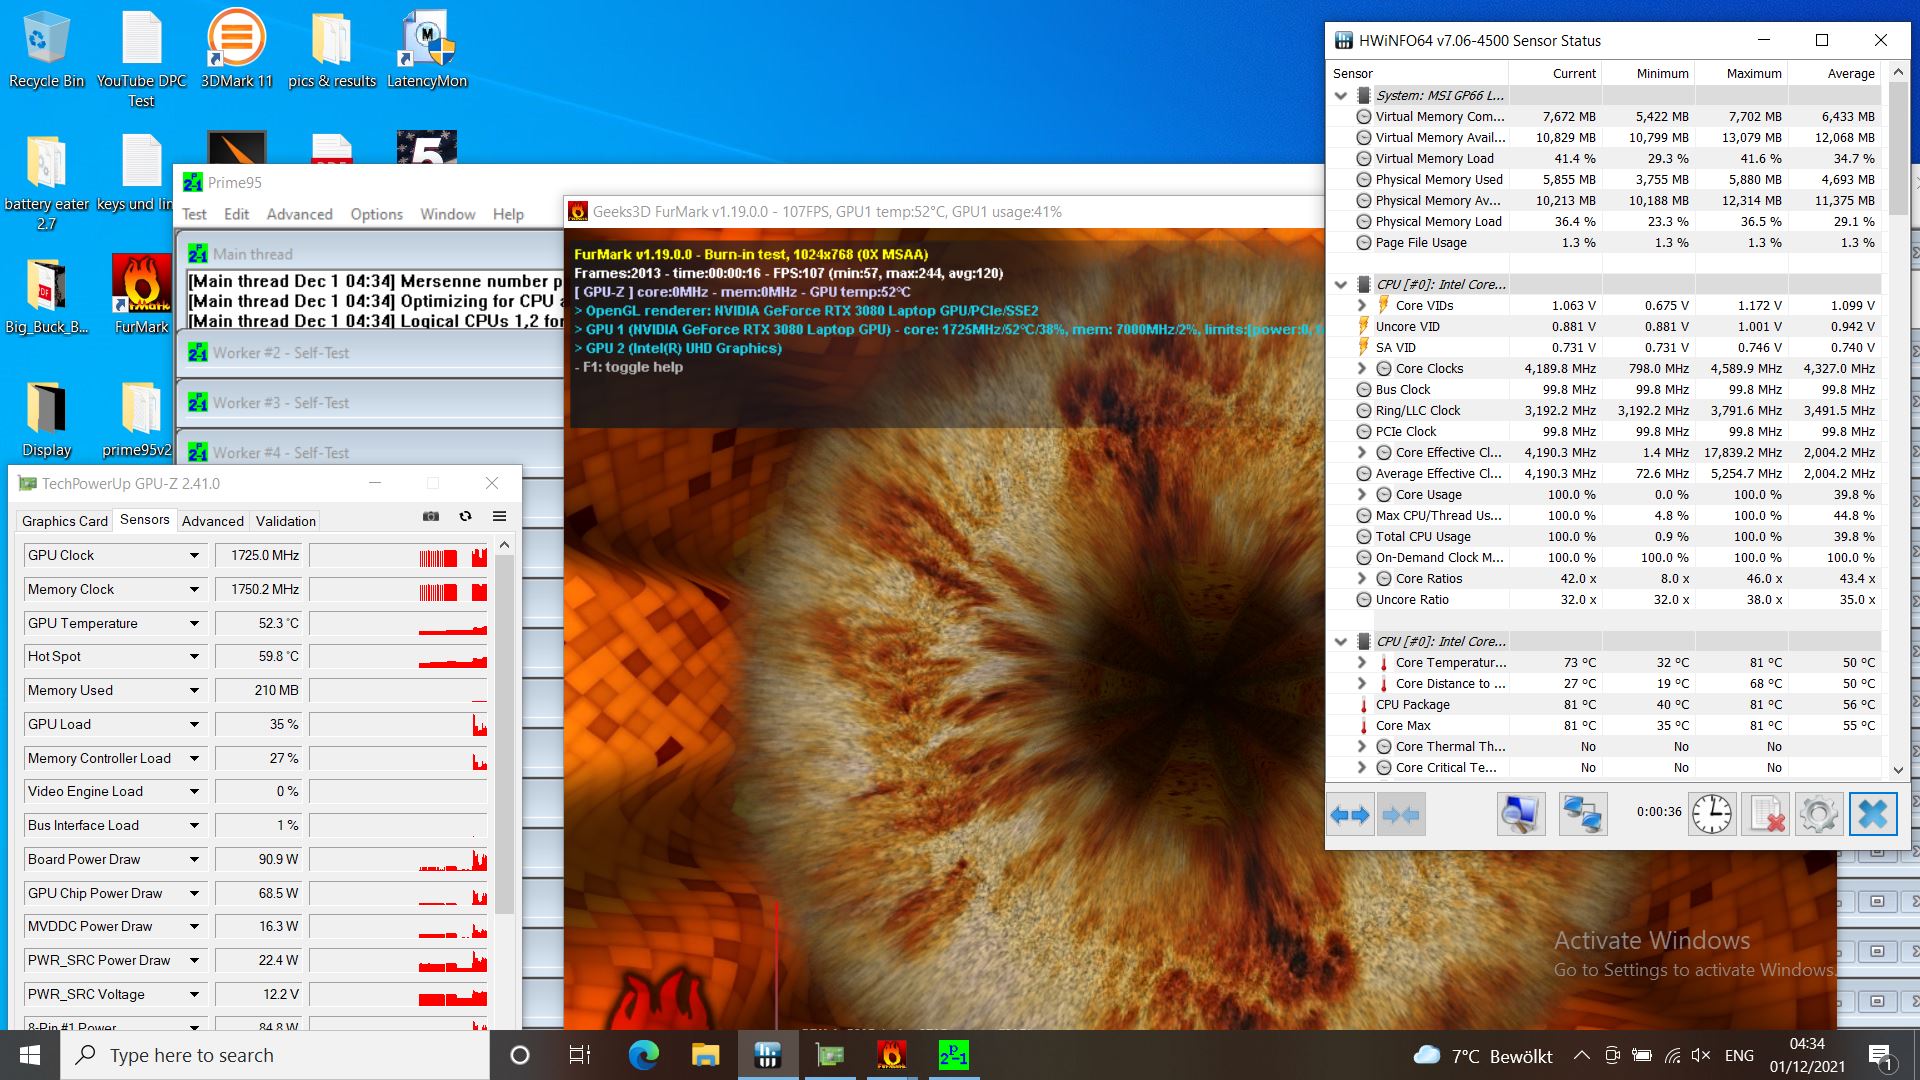
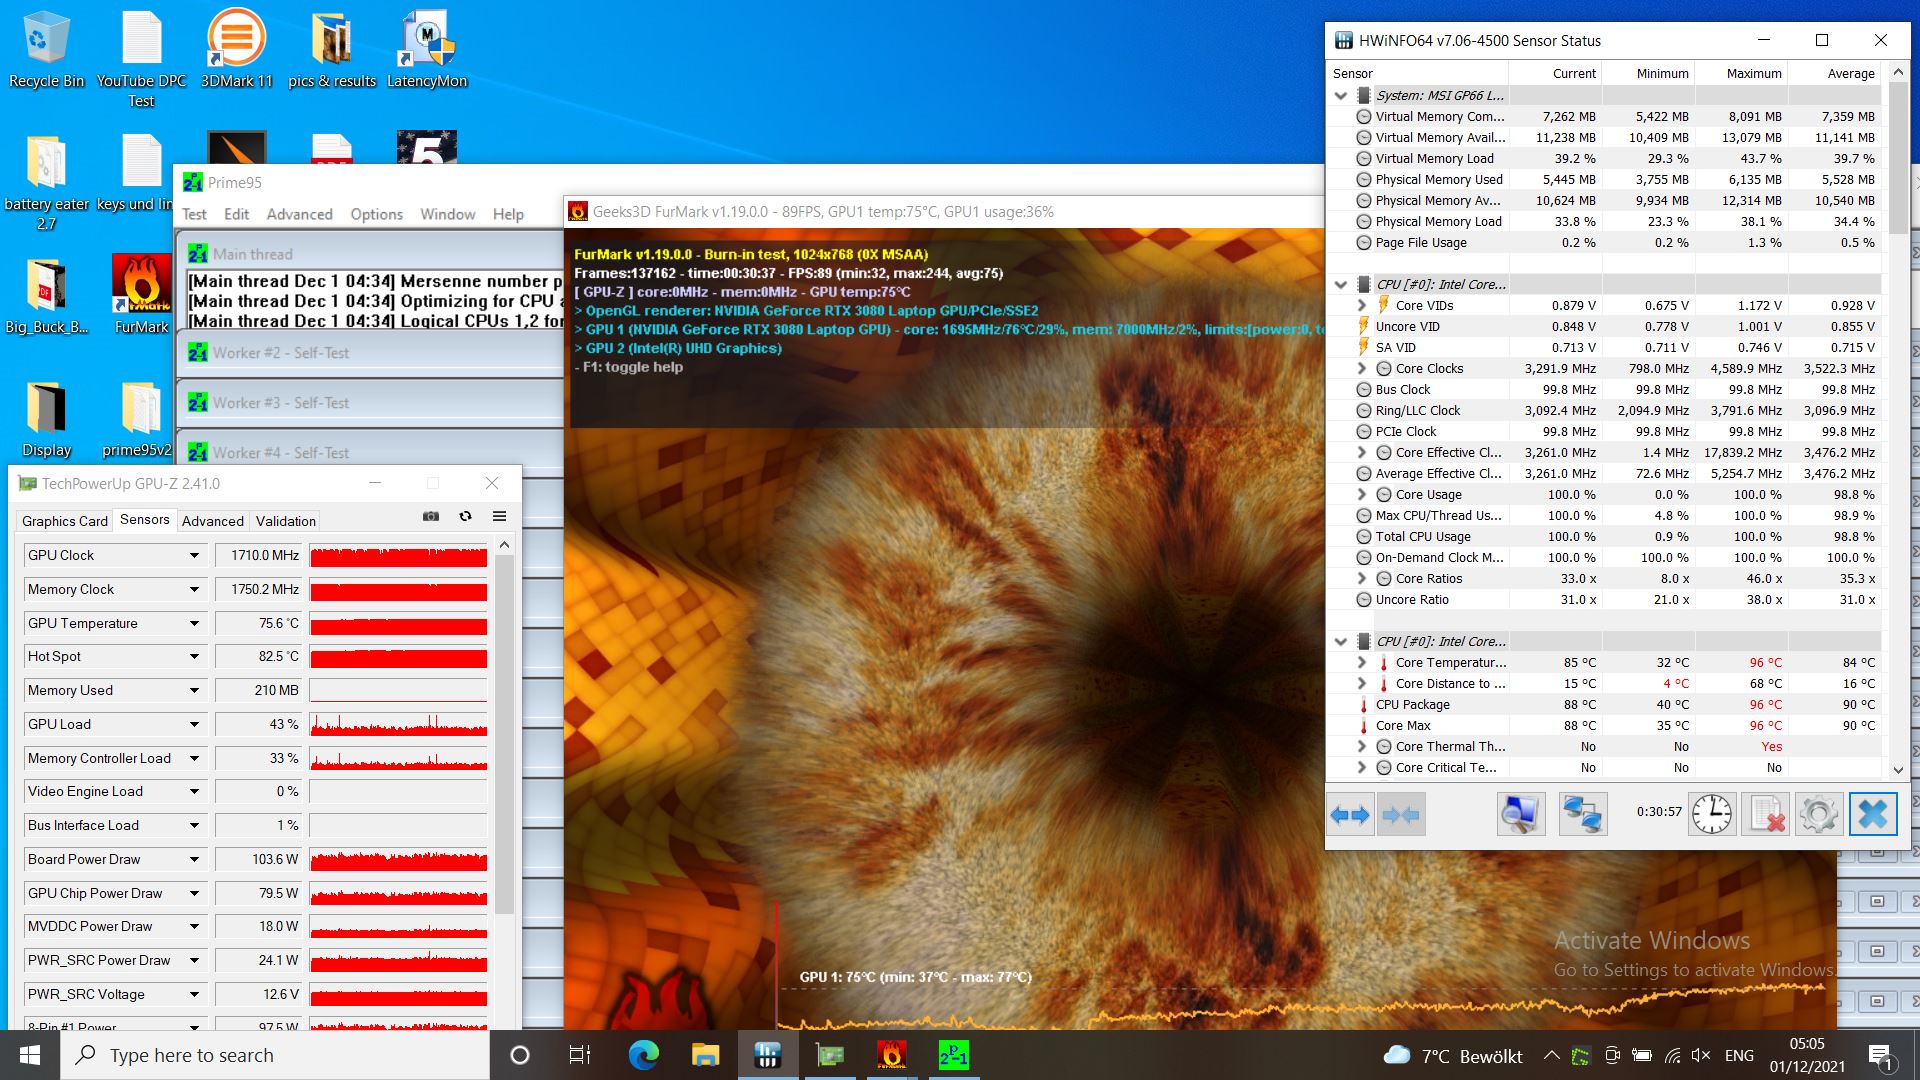
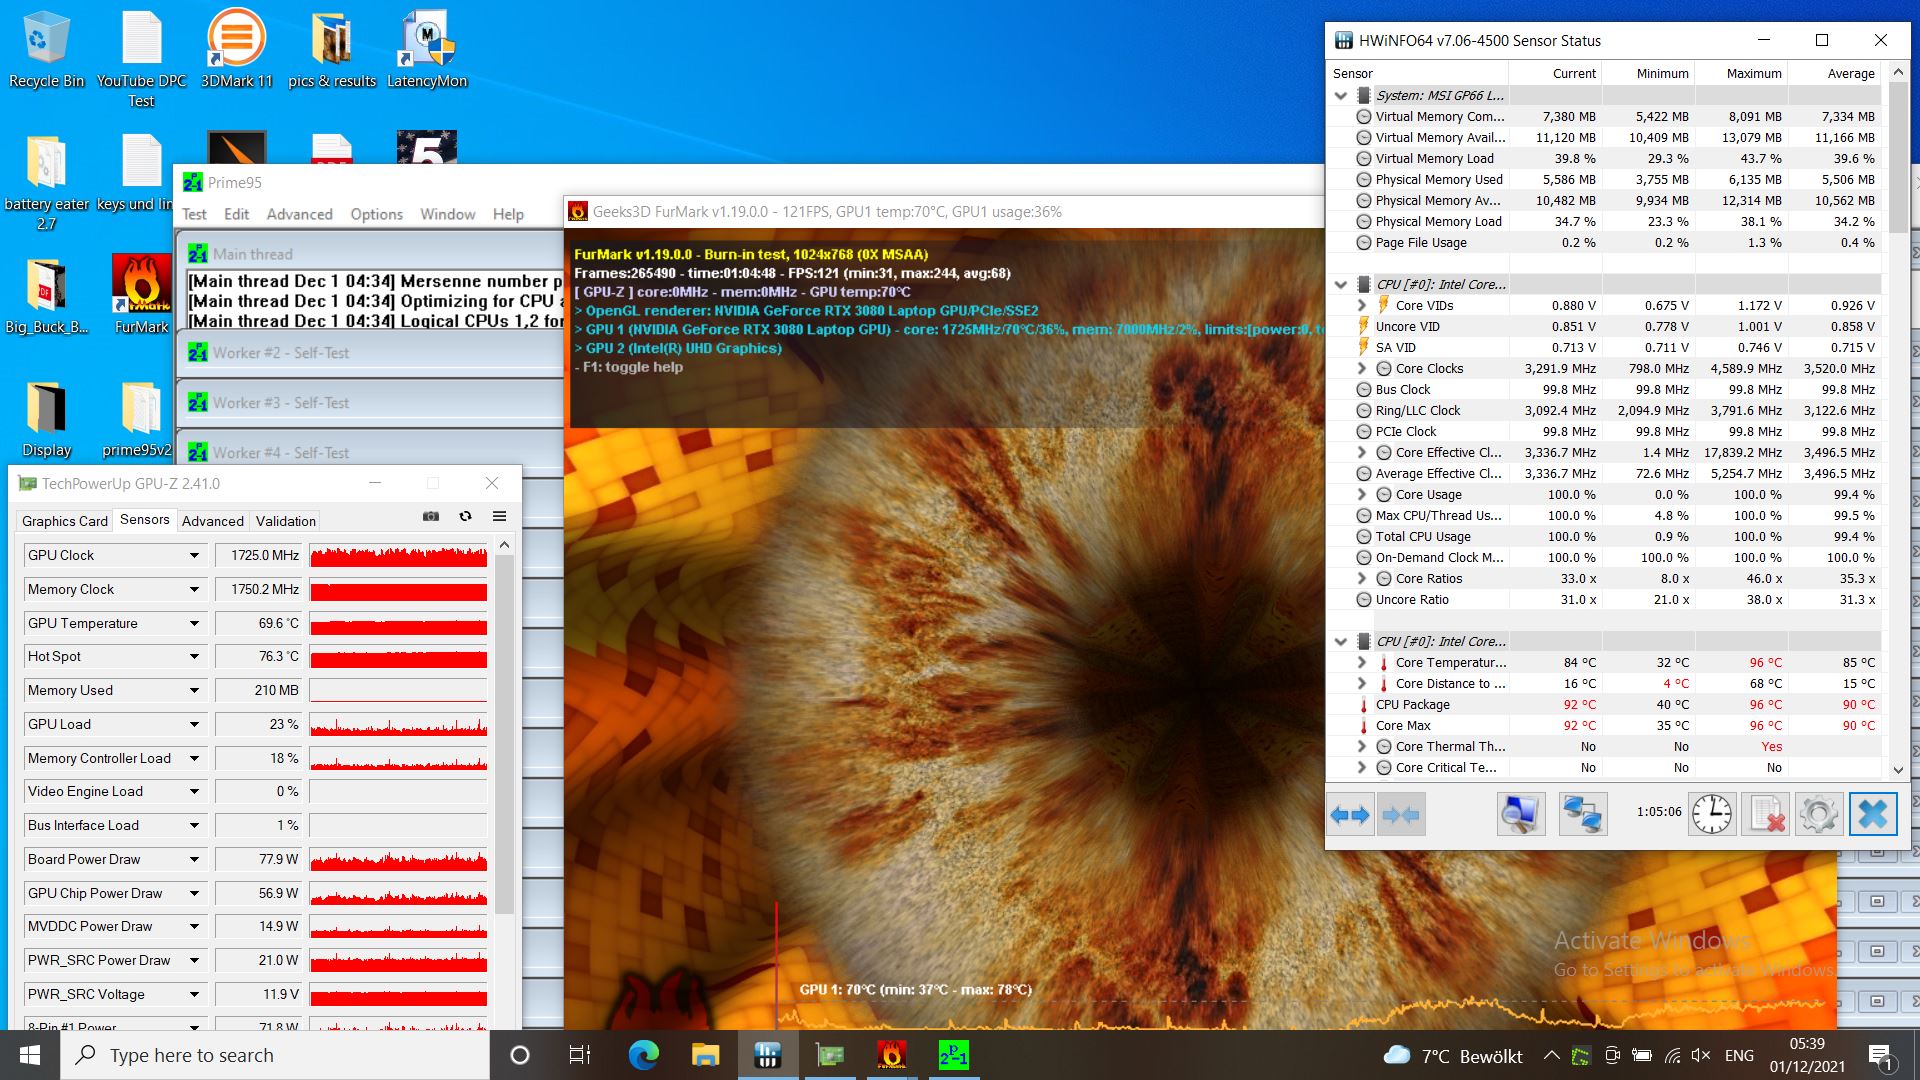
| RelógioCPU(GHz) | GPUClock | MédiaTemperaturaCPU (°C) | MédiaTemperaturaGPU (°C) | |
| Sistema ocioso | 4,5 GHz | 350 MHz | 35 | 32 |
| Prime95 + FurMark Stress | 2,8 - 3,3 GHz | 1,3 - 1,7 GHz | 85 | 76 |
| Witcher 3 Stress | 4,2 GHz | 1,3 - 1,7 GHz | 85 | 76 |
Alto-falante
No lado positivo, os alto-falantes podem tocar bem alto, e os médios e triplos parecem bastante equilibrados. No entanto, eles naturalmente sofrem com a queixa comum de todos os alto-falantes convencionais para laptops - a falta de graves. Dispositivos de áudio externos, tais como fones de ouvido, podem ser conectados através da porta analógica de fones de ouvido minijack dourados.
MSI GP66 Leopard 11UH-028 análise de áudio
(+) | os alto-falantes podem tocar relativamente alto (###valor### dB)
Graves 100 - 315Hz
(-) | quase nenhum baixo - em média 22.9% menor que a mediana
(±) | a linearidade dos graves é média (8.9% delta para a frequência anterior)
Médios 400 - 2.000 Hz
(+) | médios equilibrados - apenas 2.8% longe da mediana
(+) | médios são lineares (3.9% delta para frequência anterior)
Altos 2 - 16 kHz
(+) | agudos equilibrados - apenas 4.6% longe da mediana
(+) | os máximos são lineares (6.6% delta da frequência anterior)
Geral 100 - 16.000 Hz
(±) | a linearidade do som geral é média (16.9% diferença em relação à mediana)
Comparado com a mesma classe
» 44% de todos os dispositivos testados nesta classe foram melhores, 11% semelhantes, 44% piores
» O melhor teve um delta de 6%, a média foi 18%, o pior foi 132%
Comparado com todos os dispositivos testados
» 30% de todos os dispositivos testados foram melhores, 8% semelhantes, 62% piores
» O melhor teve um delta de 4%, a média foi 23%, o pior foi 134%
Schenker XMG Neo 15 Tiger Lake análise de áudio
(±) | o volume do alto-falante é médio, mas bom (###valor### dB)
Graves 100 - 315Hz
(-) | quase nenhum baixo - em média 22.6% menor que a mediana
(±) | a linearidade dos graves é média (9.5% delta para a frequência anterior)
Médios 400 - 2.000 Hz
(+) | médios equilibrados - apenas 4.7% longe da mediana
(±) | a linearidade dos médios é média (9.1% delta para frequência anterior)
Altos 2 - 16 kHz
(+) | agudos equilibrados - apenas 4.1% longe da mediana
(+) | os máximos são lineares (5.3% delta da frequência anterior)
Geral 100 - 16.000 Hz
(±) | a linearidade do som geral é média (19.4% diferença em relação à mediana)
Comparado com a mesma classe
» 67% de todos os dispositivos testados nesta classe foram melhores, 7% semelhantes, 26% piores
» O melhor teve um delta de 6%, a média foi 18%, o pior foi 132%
Comparado com todos os dispositivos testados
» 48% de todos os dispositivos testados foram melhores, 7% semelhantes, 45% piores
» O melhor teve um delta de 4%, a média foi 23%, o pior foi 134%
Gerenciamento de energia - Leopardo com mini bateria
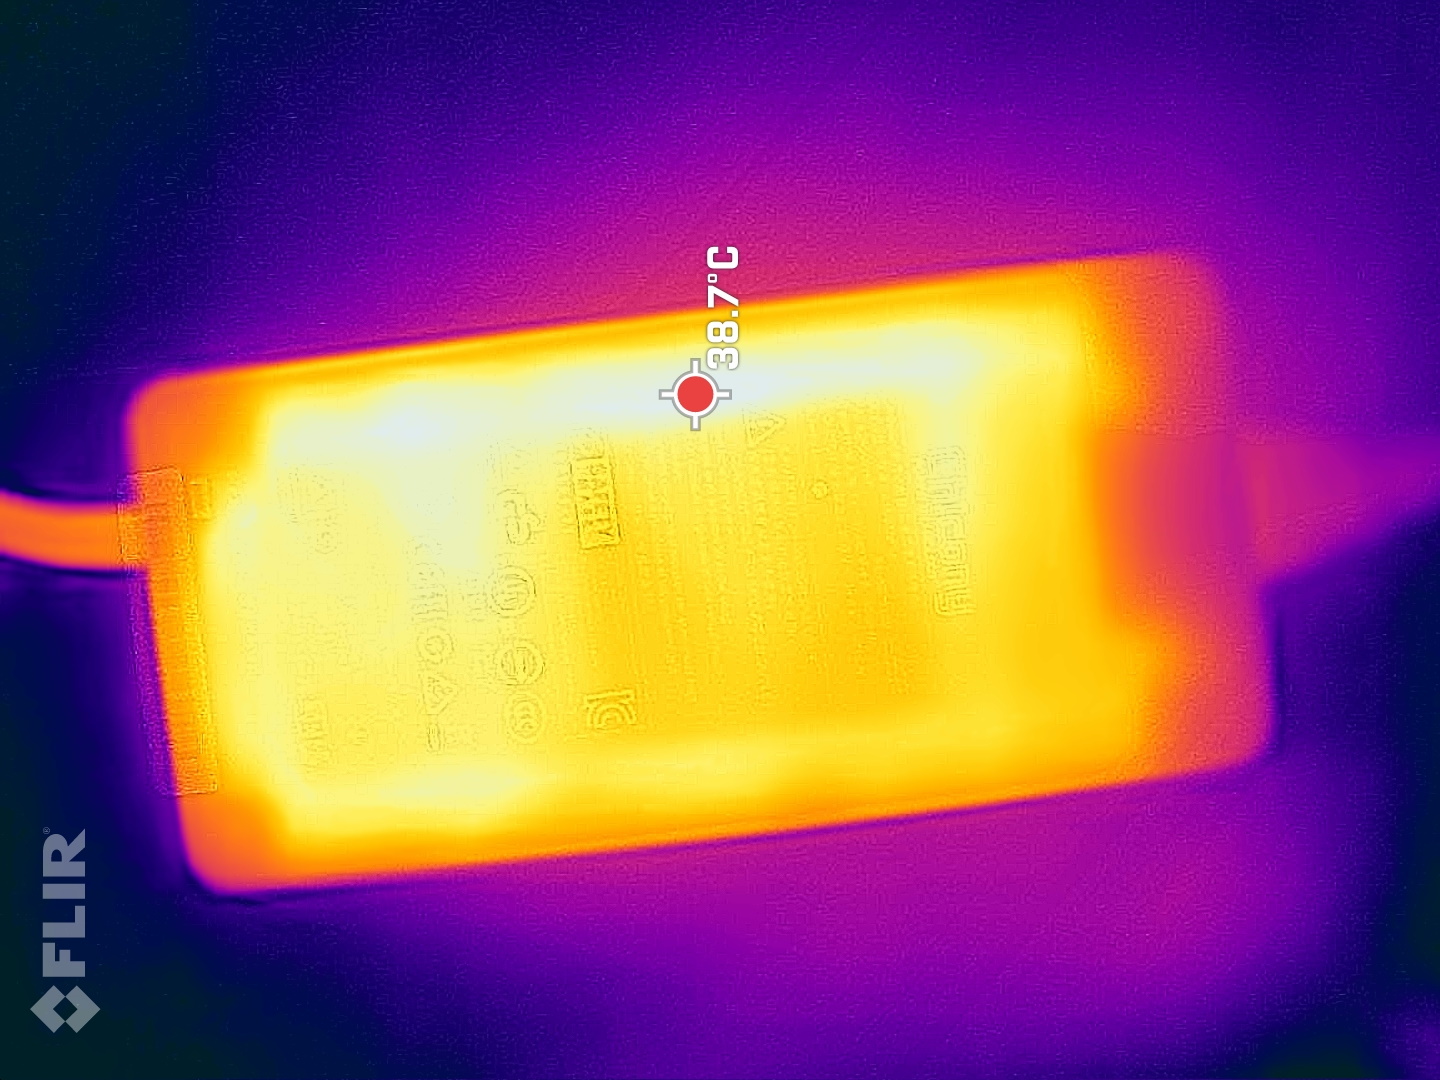
Absorção de energia
Medimos um consumo médio de 207 W quando jogamos The Witcher 3, que é um pouco mais do que a concorrência precisa. O máximo é de 223 W, que está entre os principais consumidores Aorus e Alienware e os outros concorrentes mais frugalistas.
A fonte de alimentação é generosamente dimensionada com 280 W e não deve ter nenhum problema de carregamento
| Ocioso | |
| Carga |
|
Key:
min: | |
| MSI GP66 Leopard 11UH-028 i7-11800H, GeForce RTX 3080 Laptop GPU, Samsung PM9A1 MZVL21T0HCLR, IPS, 1920x1080, 15.6" | MSI GP66 Leopard 10UG i7-10870H, GeForce RTX 3070 Laptop GPU, Kingston OM8PCP31024F, IPS, 1920x1080, 15.6" | Aorus 15P YD i7-11800H, GeForce RTX 3080 Laptop GPU, Samsung PM9A1 MZVL21T0HCLR, IPS, 1920x1080, 15.6" | Asus ROG Strix Scar 15 G533QS R9 5900HX, GeForce RTX 3080 Laptop GPU, ADATA Swordfish 2 TB, IPS, 2560x1440, 15.6" | Schenker XMG Neo 15 Tiger Lake i7-11800H, GeForce RTX 3080 Laptop GPU, Samsung SSD 980 Pro 1TB MZ-V8P1T0BW, IPS, 2560x1440, 15.6" | Alienware m15 R6, i7-11800H RTX 3080 i7-11800H, GeForce RTX 3080 Laptop GPU, Samsung PM9A1 MZVL21T0HCLR, IPS, 1920x1080, 15.6" | Média NVIDIA GeForce RTX 3080 Laptop GPU | Média da turma Gaming | |
|---|---|---|---|---|---|---|---|---|
| Power Consumption | -7% | -40% | -7% | -7% | -9% | -39% | -16% | |
| Idle Minimum * (Watt) | 13 | 15.3 -18% | 23 -77% | 11.2 14% | 15 -15% | 14 -8% | 19.8 ? -52% | 13 ? -0% |
| Idle Average * (Watt) | 17 | 21.2 -25% | 25 -47% | 16.4 4% | 17 -0% | 18 -6% | 24.3 ? -43% | 19 ? -12% |
| Idle Maximum * (Watt) | 18 | 22.3 -24% | 35 -94% | 29.4 -63% | 22 -22% | 29 -61% | 33.3 ? -85% | 24.6 ? -37% |
| Load Average * (Watt) | 96 | 82.3 14% | 101 -5% | 106.2 -11% | 101 -5% | 93 3% | 108.1 ? -13% | 110.7 ? -15% |
| Witcher 3 ultra * (Watt) | 207 | 191.2 8% | 190 8% | 189 9% | 195 6% | 190 8% | ||
| Load Maximum * (Watt) | 223 | 216.6 3% | 280 -26% | 213.6 4% | 230 -3% | 203 9% | 230 ? -3% | 259 ? -16% |
* ... menor é melhor
Power consumption Witcher 3 / Stress test
Duração da bateria
A MSI usa uma bateria de 65 Wh, que é muito pequena para um laptop para jogos com RTX 3080. A concorrência tem baterias com 84 ou 90 Wh e mais!
Por conseguinte, os tempos de execução são baixos longe do soquete, e o preço do orçamento do Leopard é notado aqui. Apenas 3,5 horas de surfe ou assistindo vídeos são decepcionantemente baixas, a competição dura de 40 a 100 por cento a mais (Asus ROG). O laptop só pode oferecer três quartos de hora para jogos(The Witcher 3)
| MSI GP66 Leopard 11UH-028 i7-11800H, GeForce RTX 3080 Laptop GPU, 65 Wh | MSI GP66 Leopard 10UG i7-10870H, GeForce RTX 3070 Laptop GPU, 65 Wh | Aorus 15P YD i7-11800H, GeForce RTX 3080 Laptop GPU, 99 Wh | Asus ROG Strix Scar 15 G533QS R9 5900HX, GeForce RTX 3080 Laptop GPU, 90 Wh | Schenker XMG Neo 15 Tiger Lake i7-11800H, GeForce RTX 3080 Laptop GPU, 93 Wh | Alienware m15 R6, i7-11800H RTX 3080 i7-11800H, GeForce RTX 3080 Laptop GPU, 84 Wh | Média da turma Gaming | |
|---|---|---|---|---|---|---|---|
| Duração da bateria | 13% | 61% | 60% | 83% | 44% | 87% | |
| H.264 (h) | 3.5 | 5.9 69% | 5.6 60% | 8.32 ? 138% | |||
| WiFi v1.3 (h) | 3.6 | 5.1 42% | 5.3 47% | 7.3 103% | 5.6 56% | 5 39% | 7.11 ? 98% |
| Witcher 3 ultra (h) | 0.8 | ||||||
| Load (h) | 1.2 | 1 -17% | 2.1 75% | 1.4 17% | 2.7 125% | 1.6 33% | 1.502 ? 25% |
| Reader / Idle (h) | 6.6 | 7.5 | 11.1 | 8.27 ? |
Pro
Contra
Veredicto - Jogador de alto desempenho de bom orçamento
Um laptop para jogos moderno com um Nvidia RTX 3080 e um desempenho competitivo correspondente por menos de 2.000 euros é provavelmente uma raridade hoje em dia. O MSI também faz muito fora do desempenho puro, apesar do seu baixo preço. Por exemplo, o sistema de refrigeração adaptável realmente nos surpreendeu positivamente, mesmo no Modo de Desempenho Extremo - concorrentes muito mais caros como os Alienwares podem tirar uma folha deste livro. E a tela também não é um painel de orçamento, mas pelo menos supera a concorrência em termos de brilho.
Naturalmente, você também tem que aceitar alguns compromissos nesta categoria de preço. Estes incluem os tempos de funcionamento da bateria do Leopard e a qualidade de construção menos que ótima, o que também é perceptível na manutenção mais complicada. Estamos quase chocados que o novo modelo GP66 não tenha mais uma porta USB-C, que não está mais atualizada no final de 2021! Se você conseguir superar isso, dificilmente conseguirá um jogador RTX 3080 mais barato no momento que ainda faz tanta coisa bem ao mesmo tempo.
O Leopard GP66 11UH é um laptop para jogos de baixo custo que faz até mesmo os modelos high-end parecerem pálidos em alguns lugares. É claro que há inconvenientes como a falta de USB-C ou o baixo tempo de funcionamento da bateria, mas o desempenho, resfriamento e exibição também se encaixam em categorias superiores.
A concorrência é rara nesta faixa de preços com estas especificações. E mesmo os rivais mais caros não fazem tudo melhor, veja o sistema de resfriamento. Os dispositivos de comparação no teste são todos mais caros, mas são tudo menos superiores em termos de desempenho, exibição e, especialmente, o sistema de refrigeração. No entanto, é preciso pagar mais por USB-C ou tempo de funcionamento da bateria mais longo. Alternativamente, recomendamos dar uma olhada em nosso A lista mais barata de laptops para jogos baratos.
Preço e disponibilidade
Nosso modelo de teste é atualmente o mais barato em Computeruniverse, onde o laptop custa atualmente 1.899 euros (~$2.140). Mas nossa configuração também está disponível em Cyberport para pouco menos deeuros2.000 (~$2.253)para se apoderar de.
MSI GP66 Leopard 11UH-028
- 12/08/2021 v7 (old)
Christian Hintze
Price comparison
