MSI GP66 Leopard 10UG Laptop Review: Uma revisão completa da série
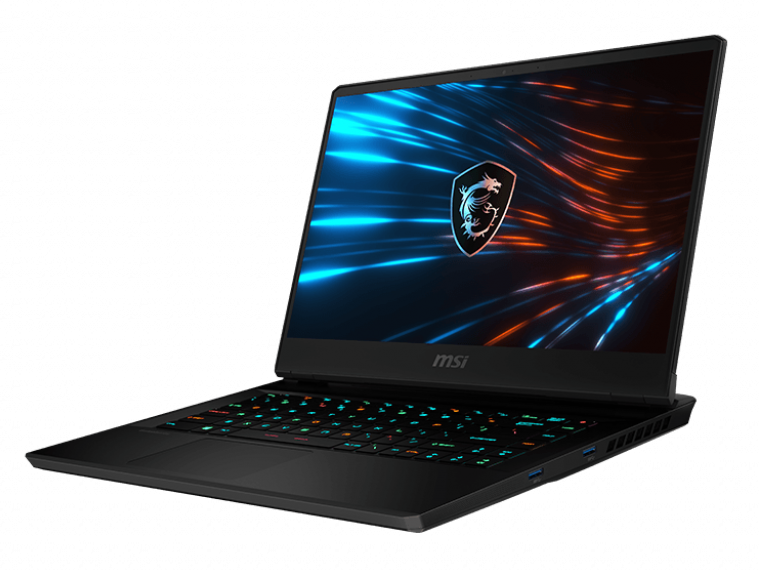
Revelado no início deste ano, juntamente com a série móvel Nvidia Ampere, a GP66 apresenta um novo design sobre a GP65 mais antiga. Quase tudo mudou do teclado para a solução de resfriamento para representar o início de uma nova geração para a família GP. Para aqueles não familiarizados, a série GP é o lar dos laptops para jogos de gama média da MSI acima das séries GL e GF mais baratas e abaixo das séries GE e GT mais caras.
As SKUs vão desde uma CPU Intel 10ª geração Core-i7 10870H com GeForce RTX 3060 gráficos até o Core i7-10875H com RTX 3080. Nossa configuração de revisão é uma configuração intermediária com o i7-10870H e RTX 3070 por cerca de $2500 USD, dependendo da RAM e do armazenamento.
Os modelos concorrentes incluem outros laptops para jogos de 15,6 polegadas de gama média superior, como o Gigabyte Aorus 15P, Asus ROG Zephyrus G15ou Lenovo Legion 7.
Mais revisões MSI:
potential competitors in comparison
Avaliação | Data | Modelo | Peso | Altura | Size | Resolução | Preço |
|---|---|---|---|---|---|---|---|
| 84.2 % v7 (old) | 04/2021 | MSI GP66 Leopard 10UG i7-10870H, GeForce RTX 3070 Laptop GPU | 2.3 kg | 23.4 mm | 15.60" | 1920x1080 | |
| 83.2 % v7 (old) | 05/2020 | MSI GP65 10SFK-047US i7-10750H, GeForce RTX 2070 Mobile | 2.3 kg | 27.5 mm | 15.60" | 1920x1080 | |
| 85.4 % v7 (old) | 04/2021 | Alienware m15 R4 i9-10980HK, GeForce RTX 3070 Laptop GPU | 2.3 kg | 20 mm | 15.60" | 1920x1080 | |
| 86.1 % v7 (old) | 02/2021 | Aorus 15P XC i7-10870H, GeForce RTX 3070 Laptop GPU | 2.2 kg | 27 mm | 15.60" | 1920x1080 | |
| 83.8 % v7 (old) | 02/2021 | Asus ROG Zephyrus G15 GA503Q R9 5900HS, GeForce RTX 3080 Laptop GPU | 2 kg | 20 mm | 15.60" | 2560x1440 | |
| 80.4 % v7 (old) | 03/2021 | MSI GF65 Thin 10UE i7-10750H, GeForce RTX 3060 Laptop GPU | 1.9 kg | 21.7 mm | 15.60" | 1920x1080 |
Caso
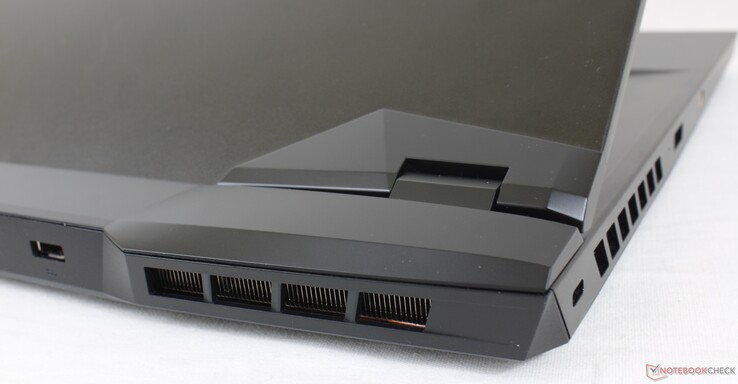
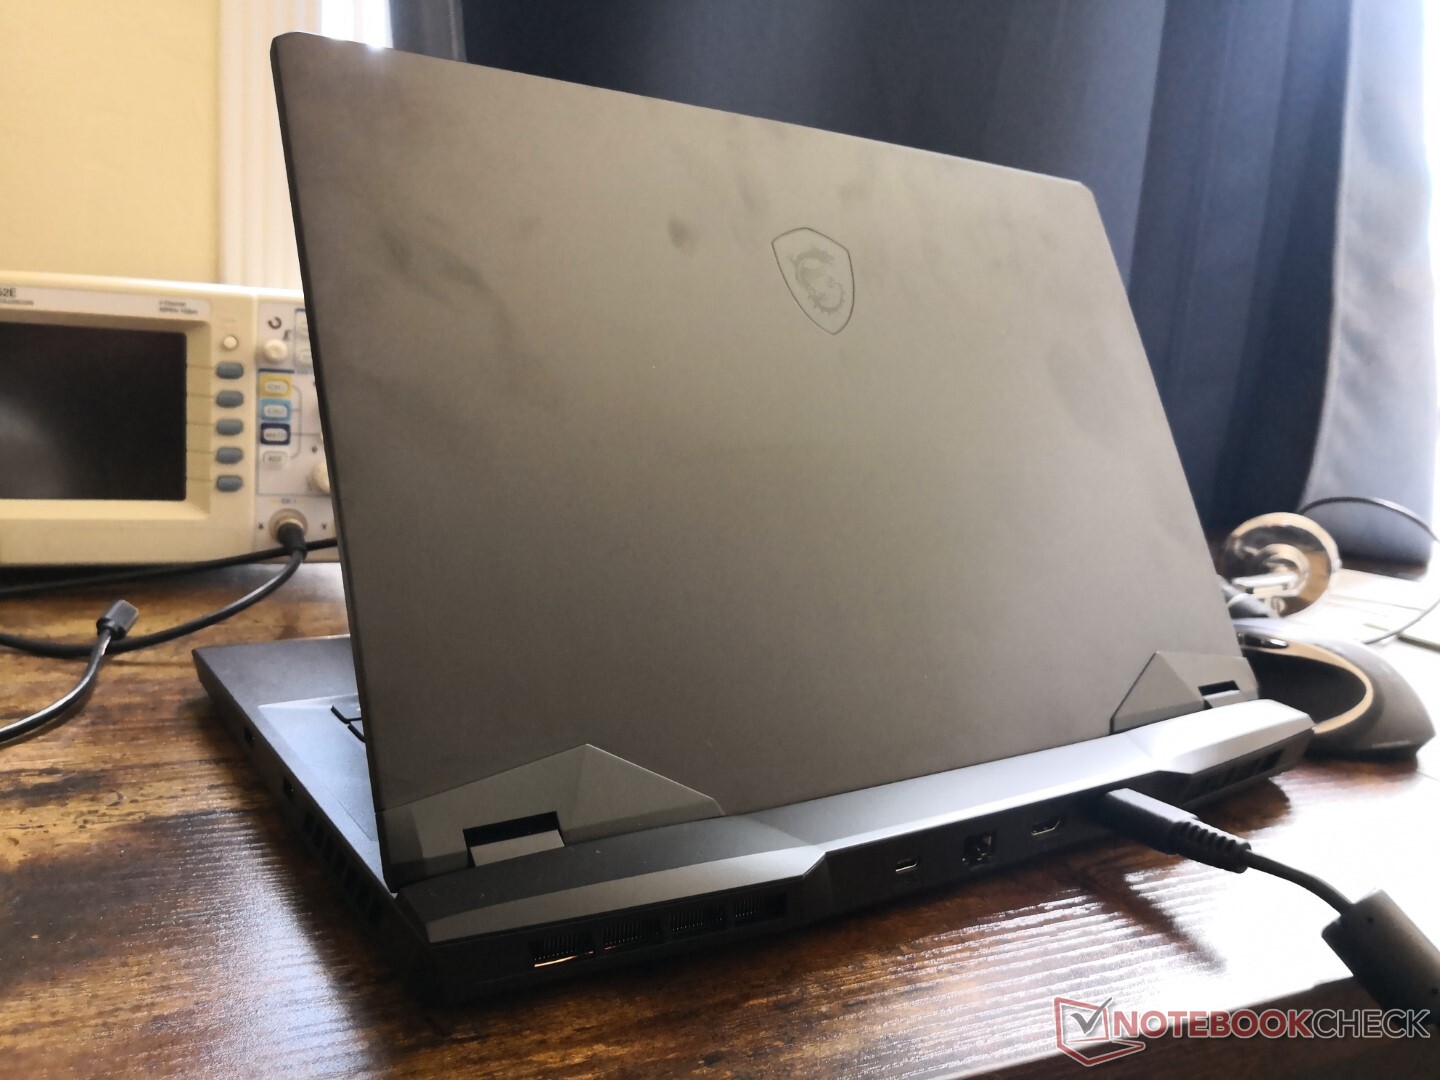
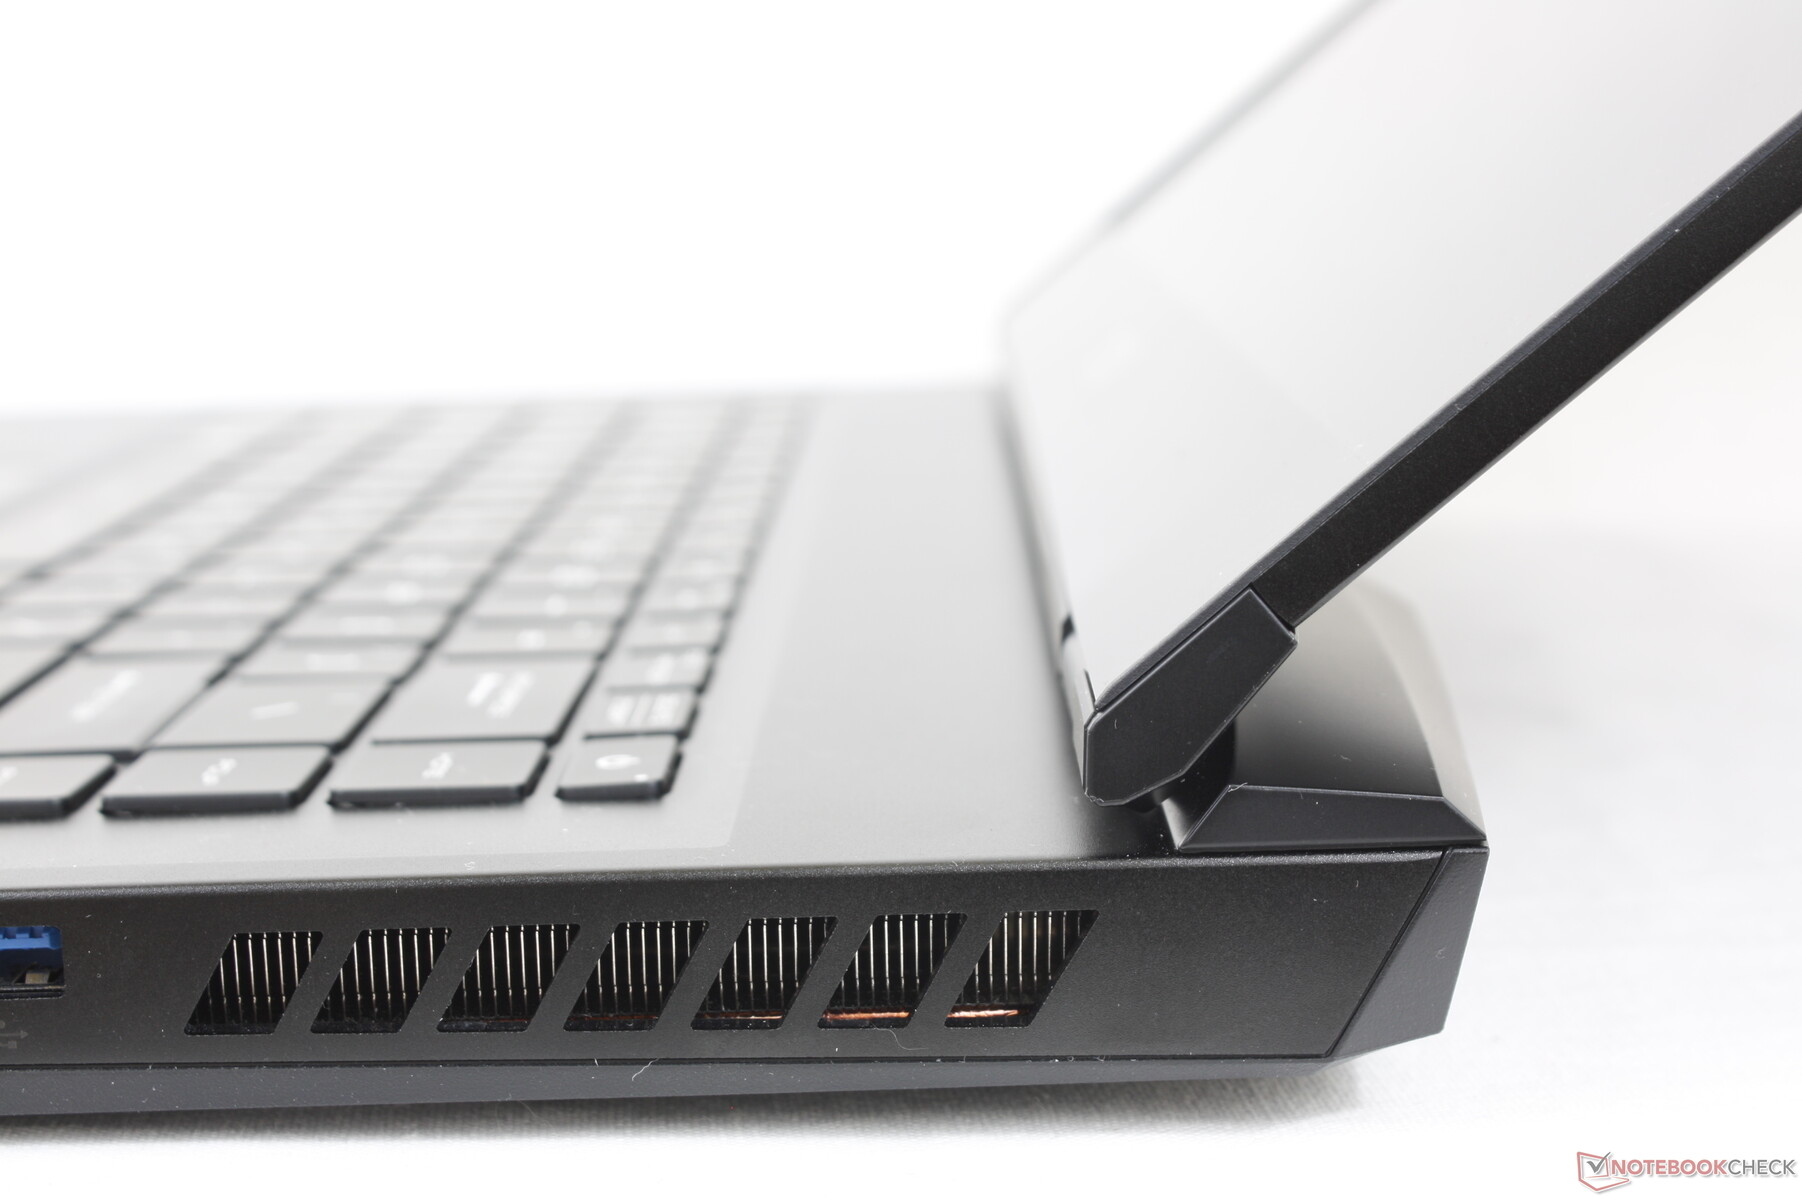
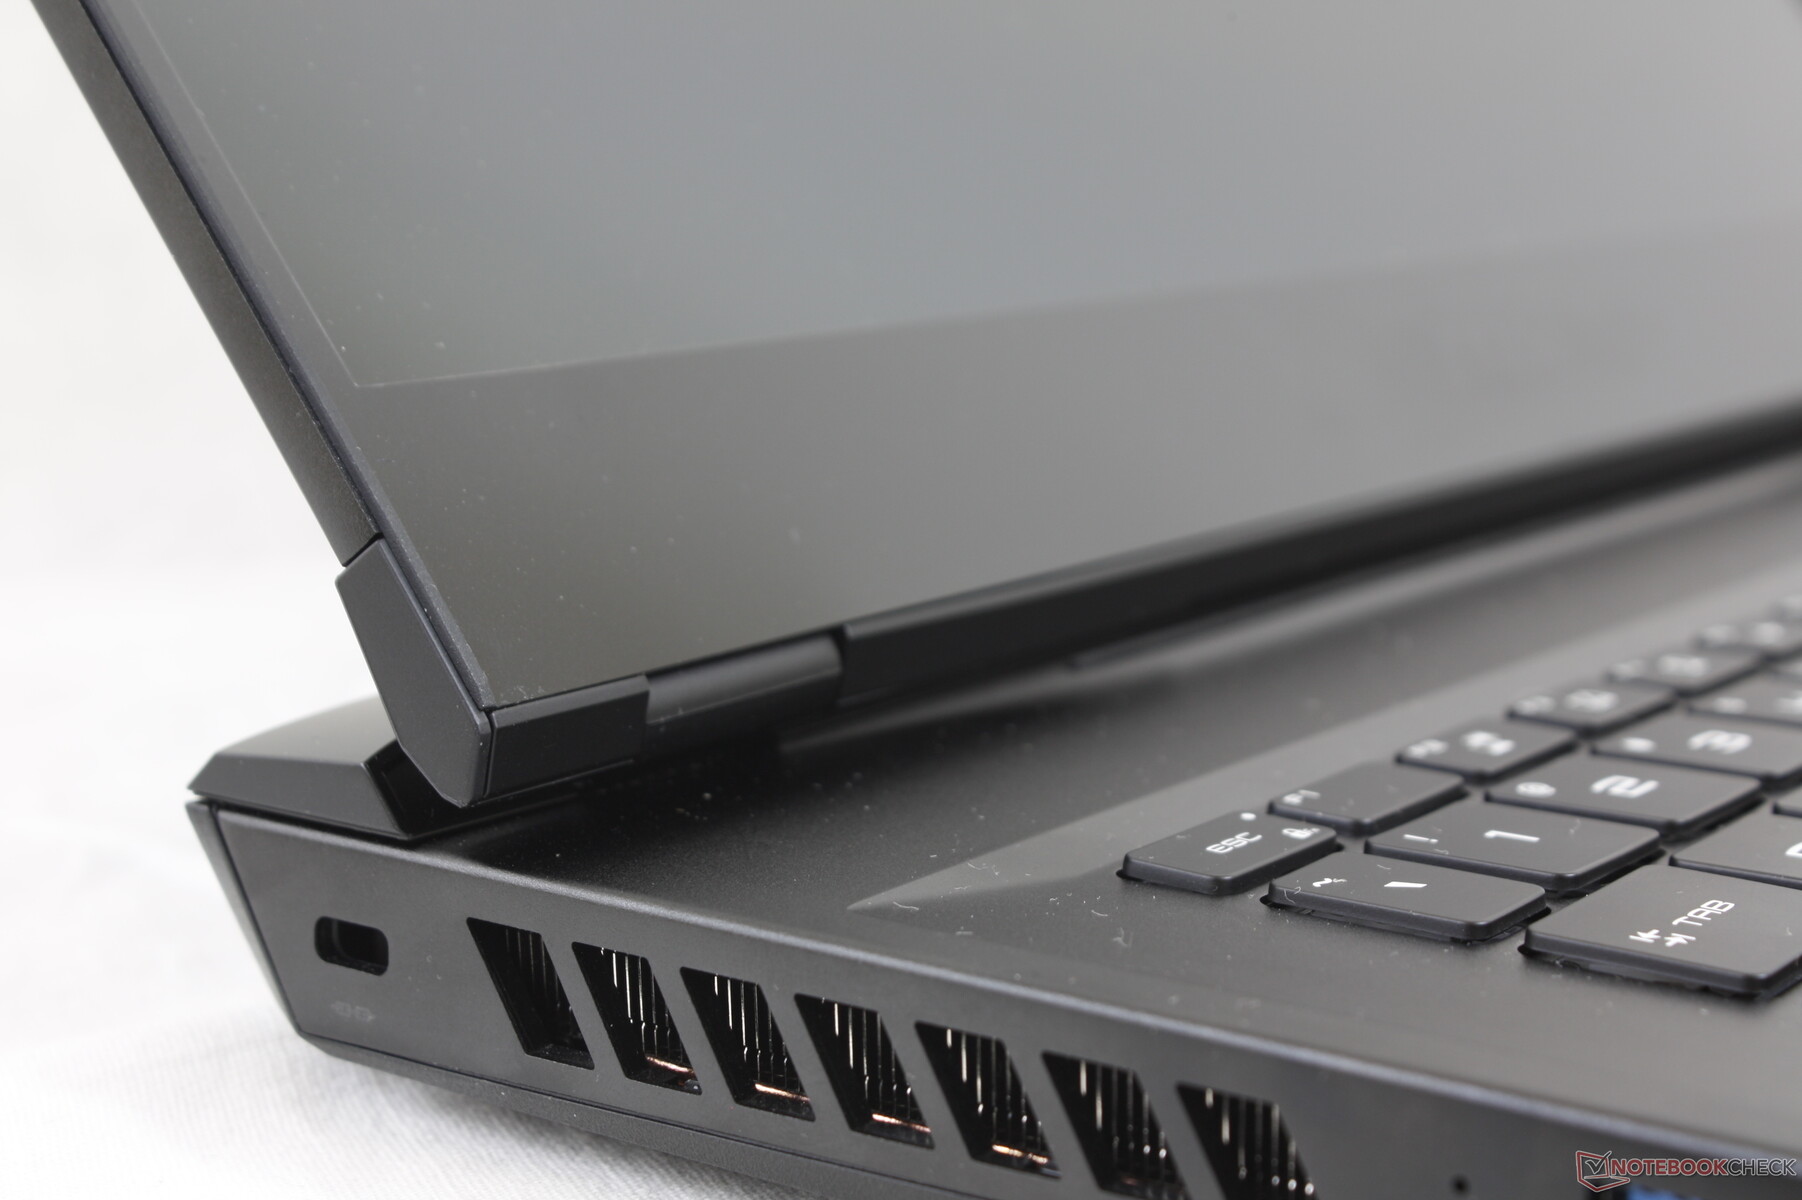
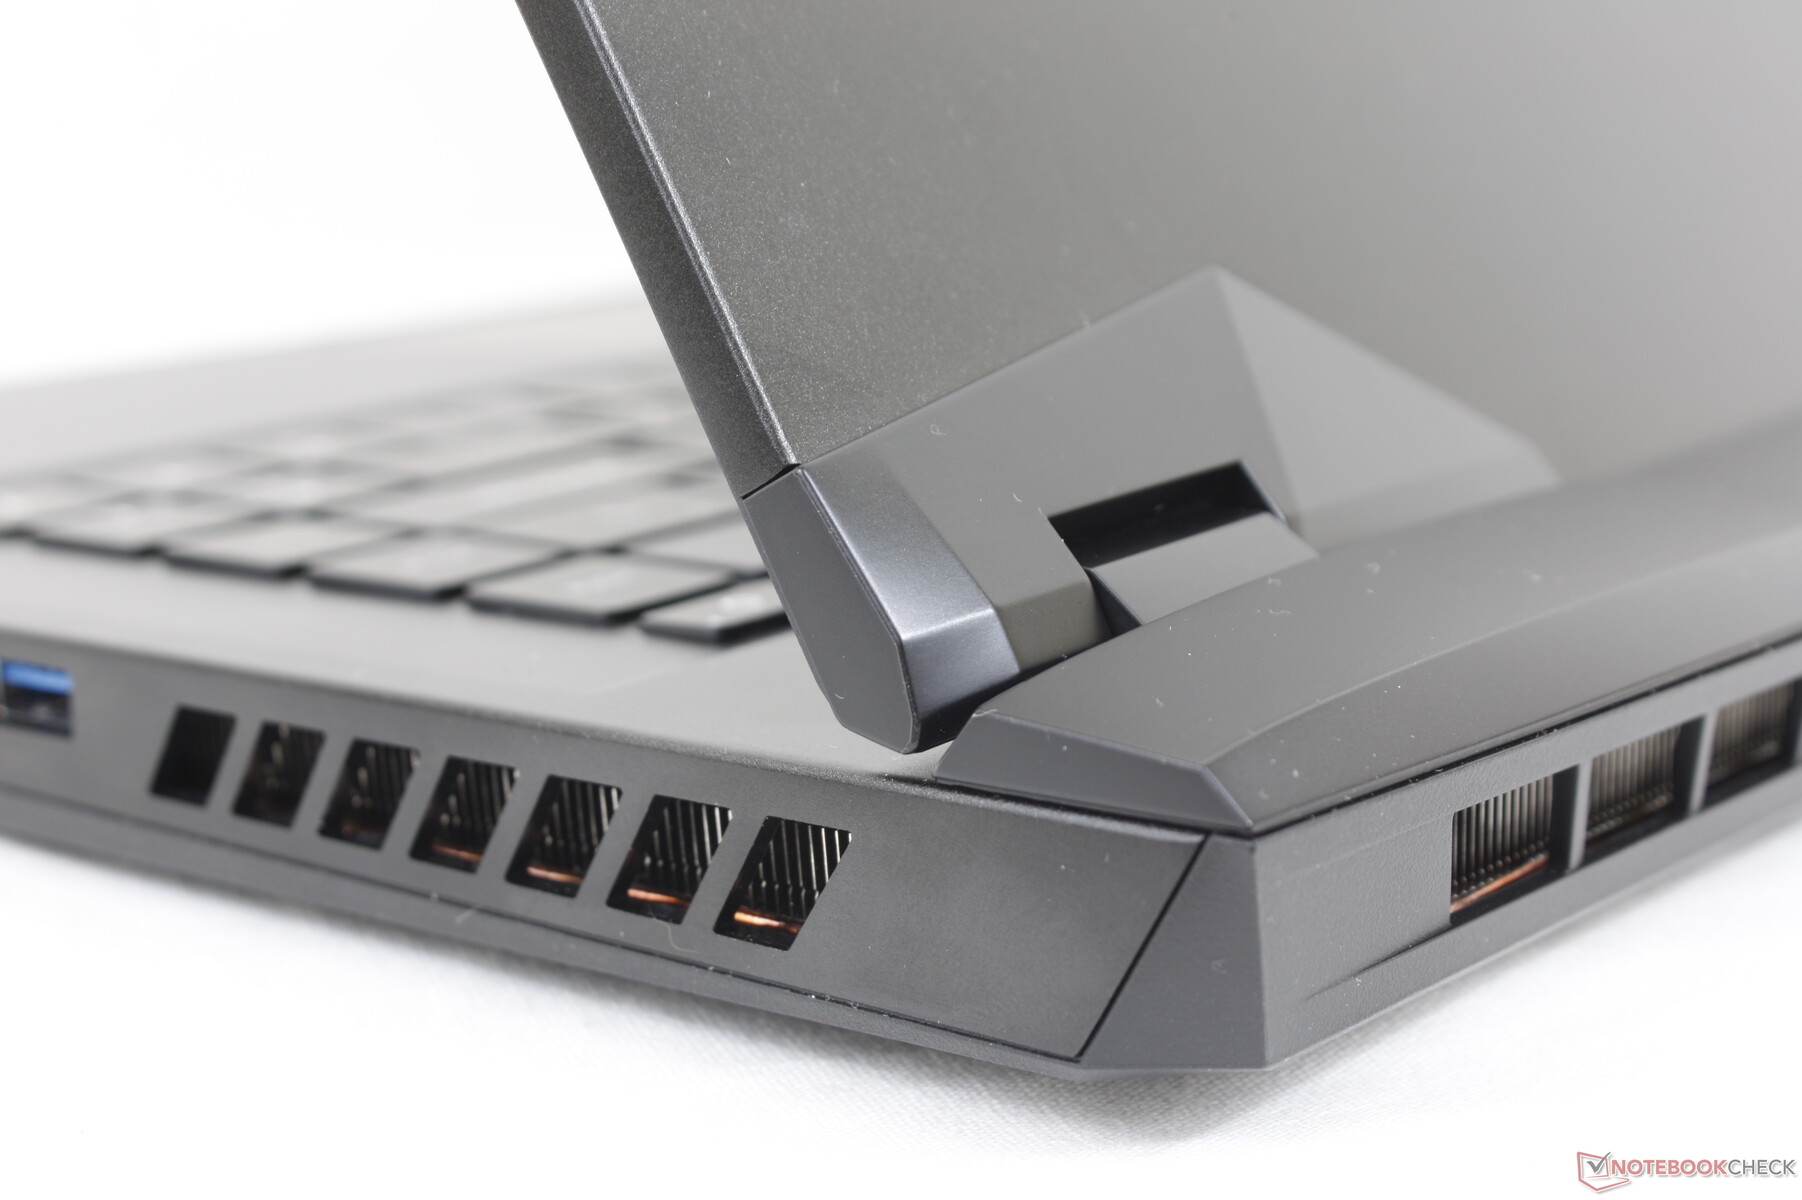
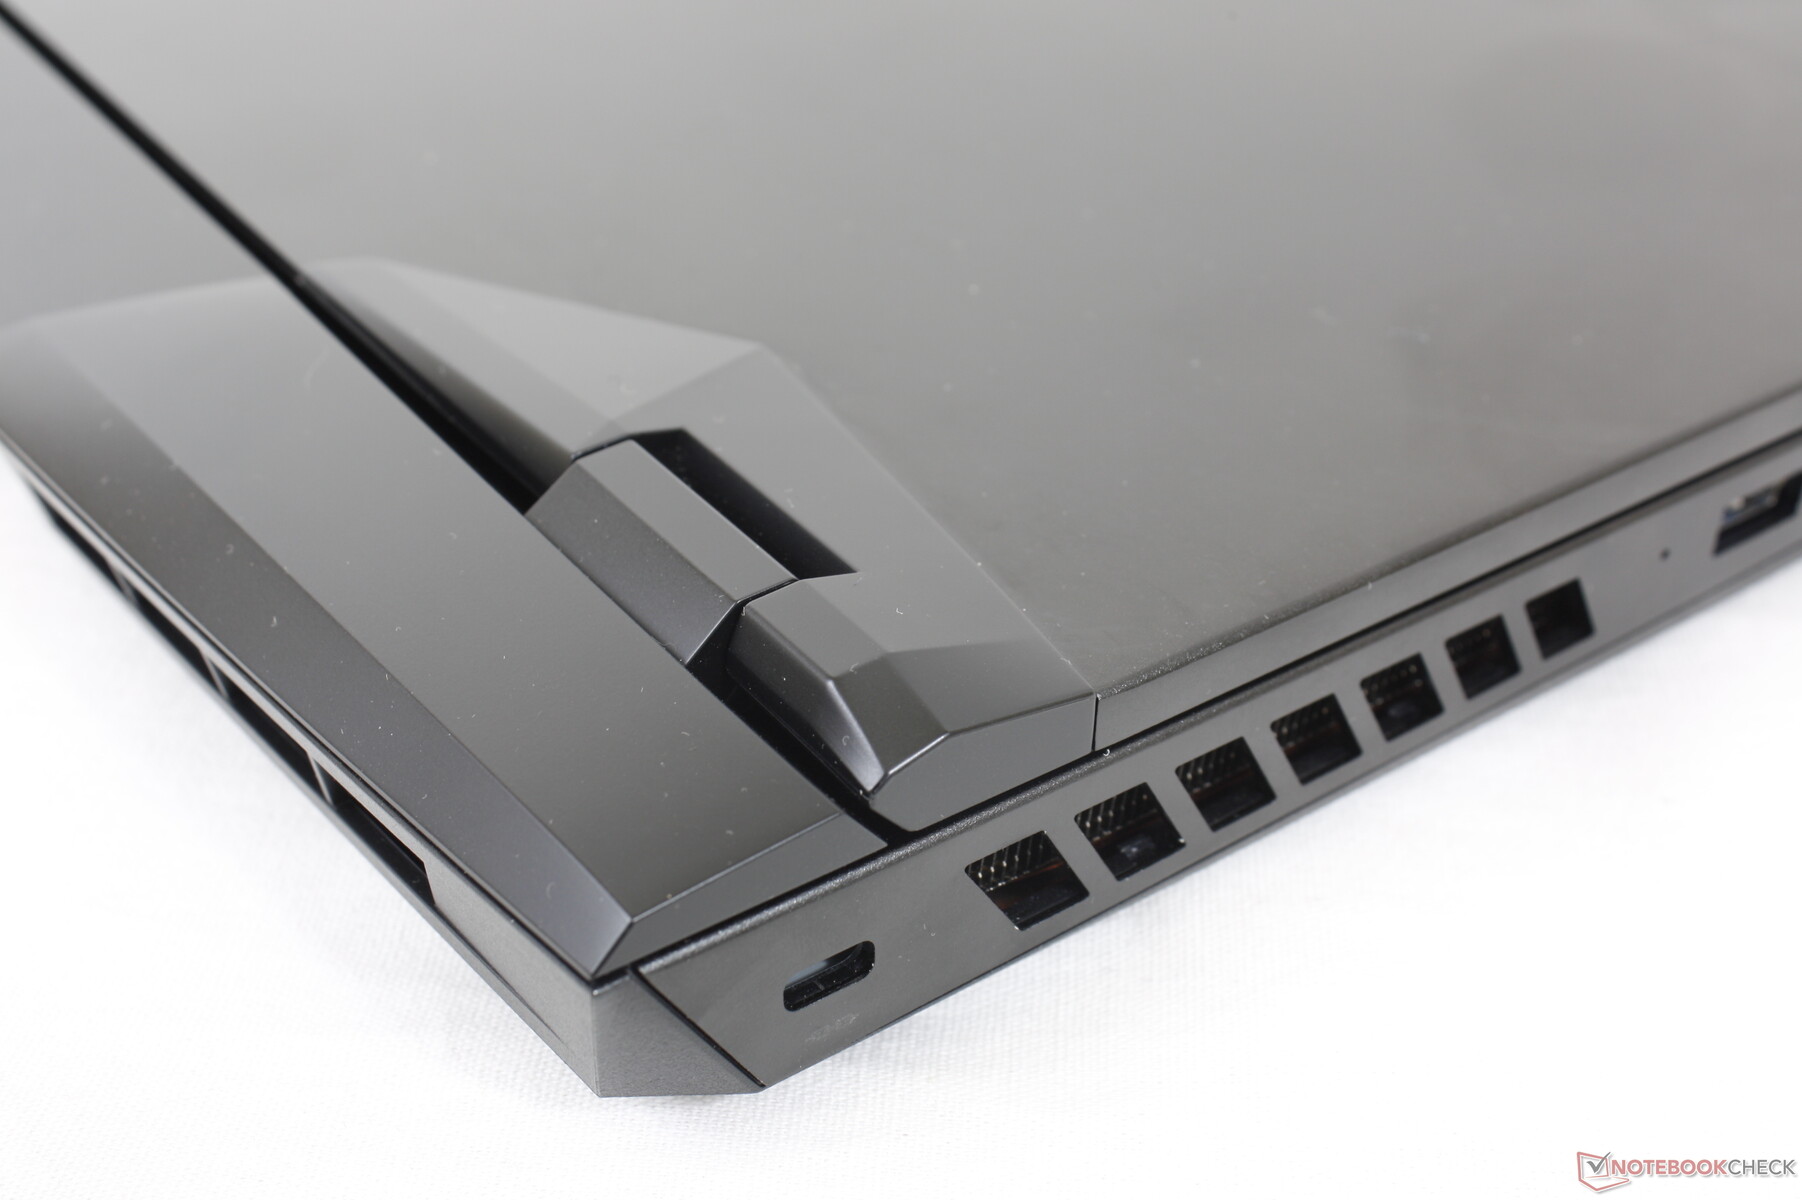
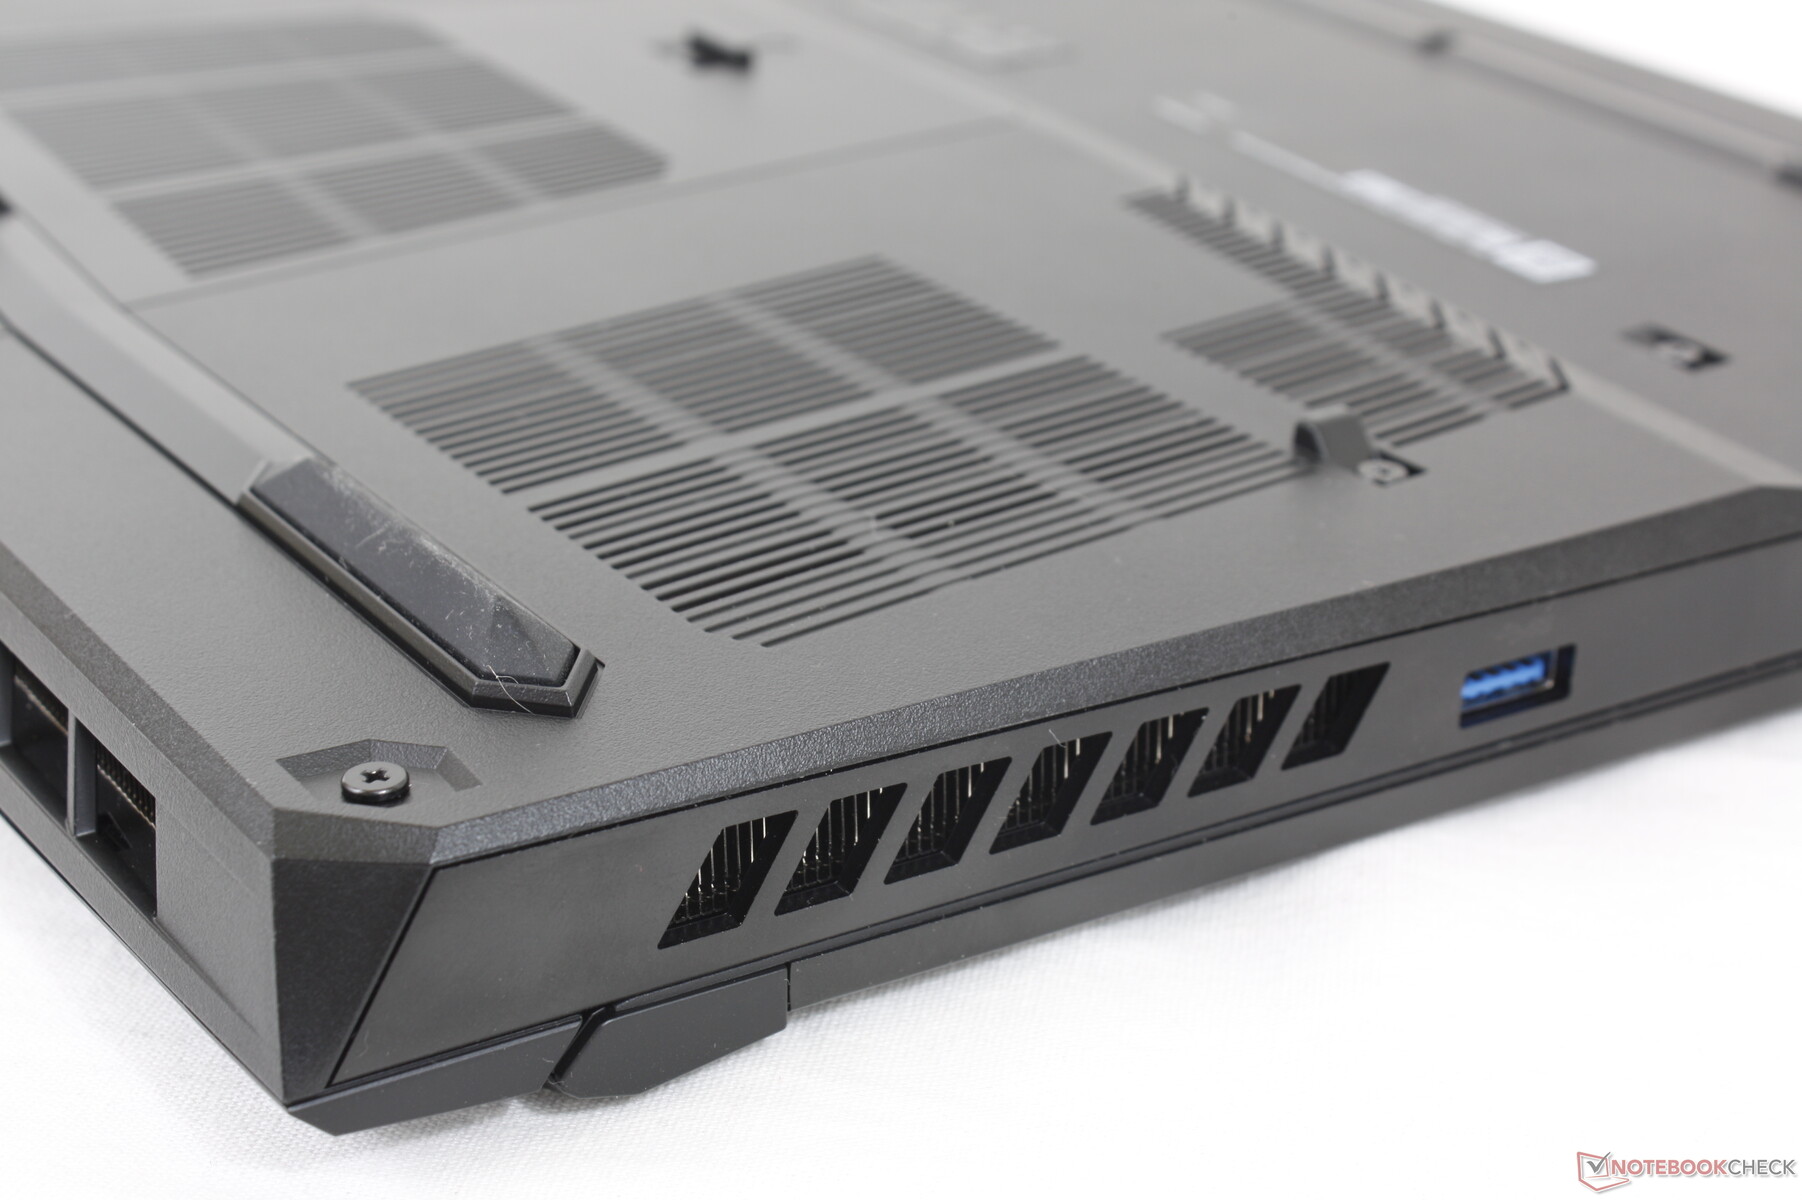
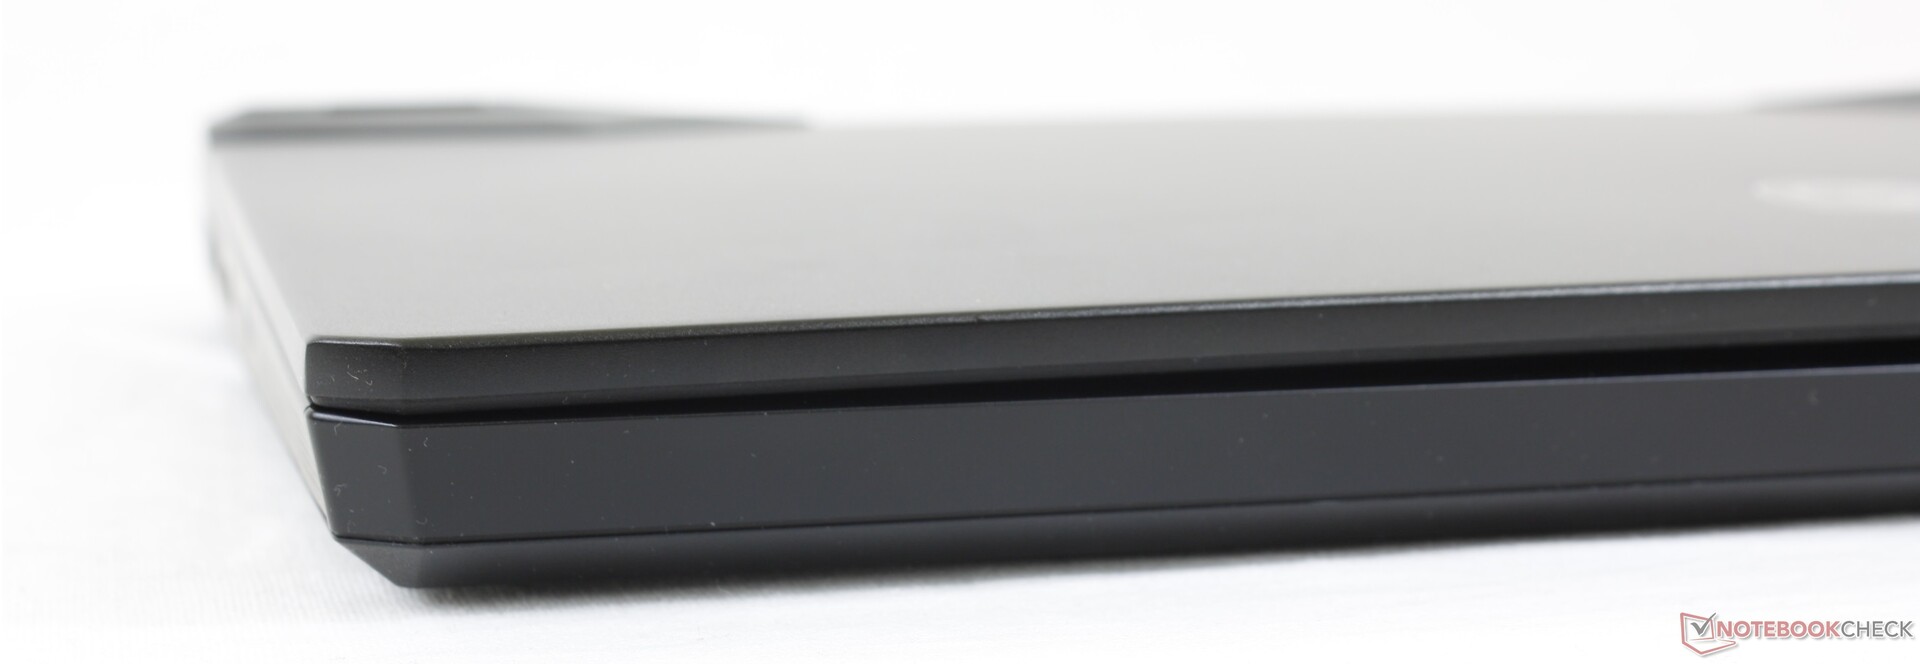
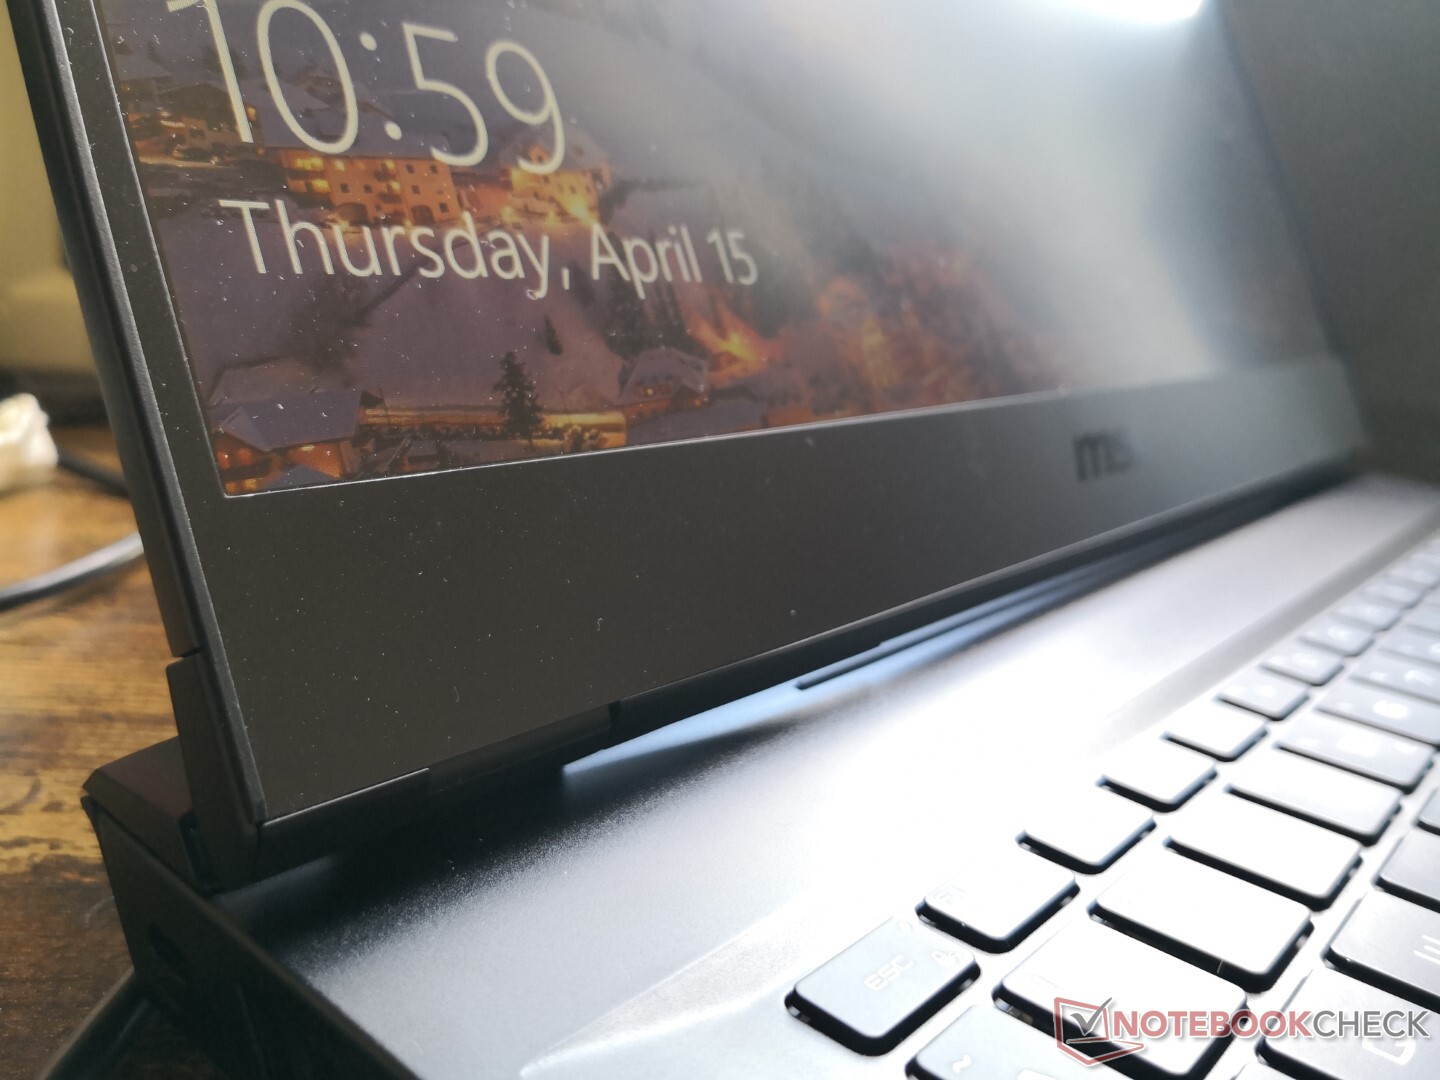
A maior mudança física do GP65 para o GP66 é a maior parte traseira, a fim de acomodar uma solução de resfriamento mais potente. O projeto visual geral pode ser melhor descrito como um projeto tonificado para baixo GE66 com suas tampas externas de metal lisas similares, mas com um esquema de cor preta mais escura. A barra de luz RGB ao longo da borda frontal do GE66 não está presente no GP66 enquanto a iluminação por tecla do teclado RGB permanece.
A qualidade de construção é excelente especialmente para a base. O teclado exibe apenas um mínimo de flexão e rangido ao dobrar ou torcer seus cantos dianteiros. A tampa, no entanto, poderia ter sido mais rígida, já que as dobradiças tendem a trespassar ao ajustar os ângulos. A tampa externa também flexiona mais prontamente do que na Asus ROG Strix G15 ao aplicar pressão em seu centro.
O novo projeto é visivelmente mais longo que o antigo GP65 em comprimento por causa do novo "motor a jato" traseiro. Caso contrário, o peso permanece quase o mesmo de gênero a gênero a 2,3 kg e o sistema é na verdade mais fino desta vez em cerca de 4 mm. Os concorrentes Alienware m15 R4 é ainda maior enquanto o Asus Zephyrus G15 GA503Q é tanto mais leve quanto menor.
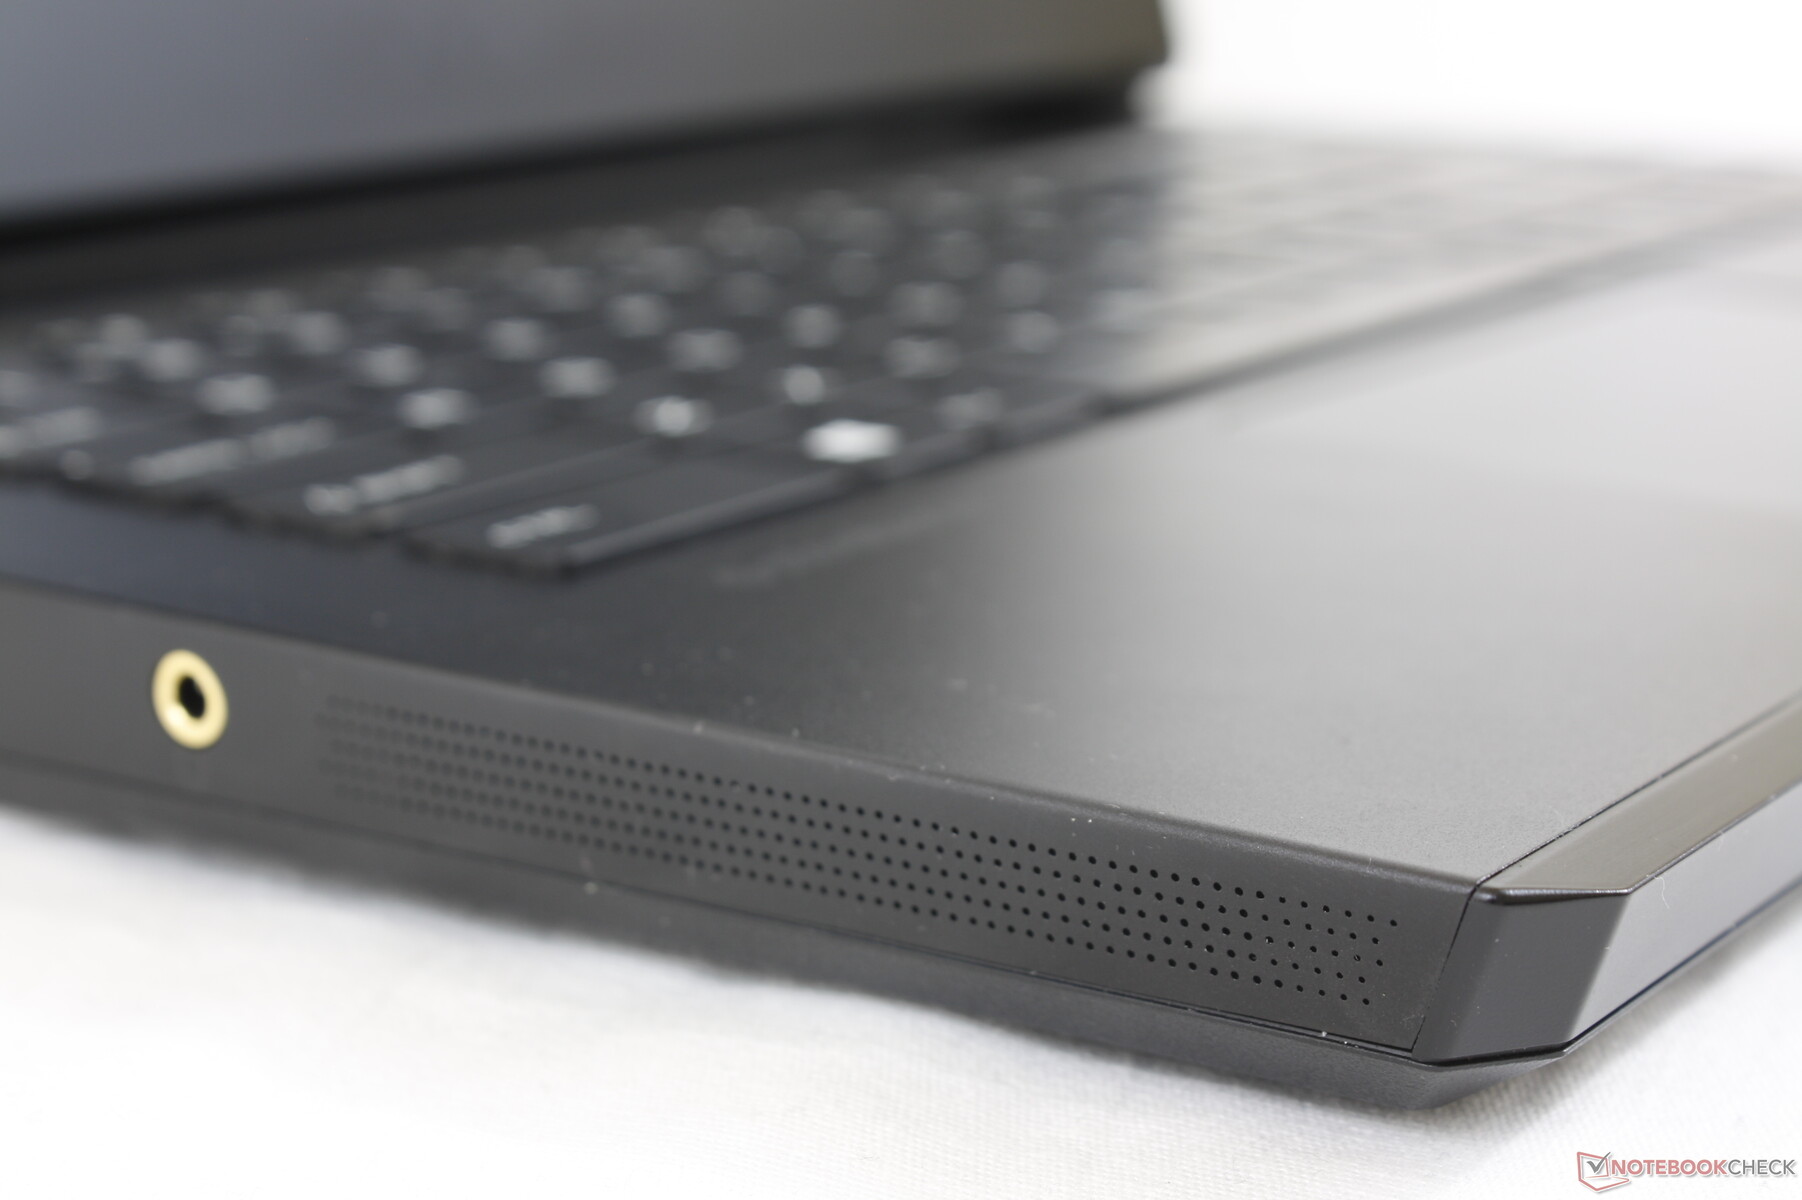
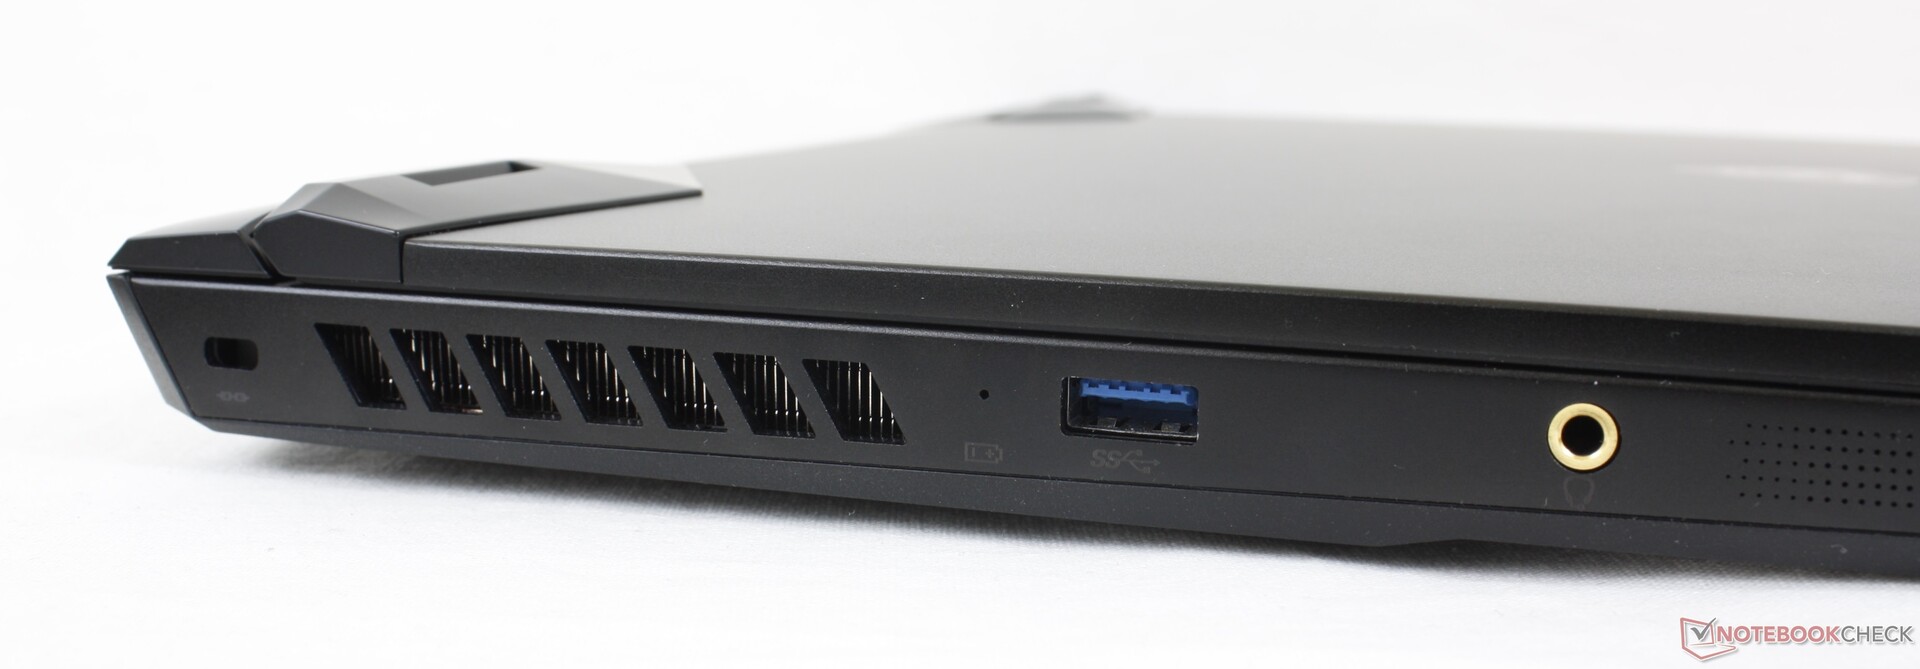
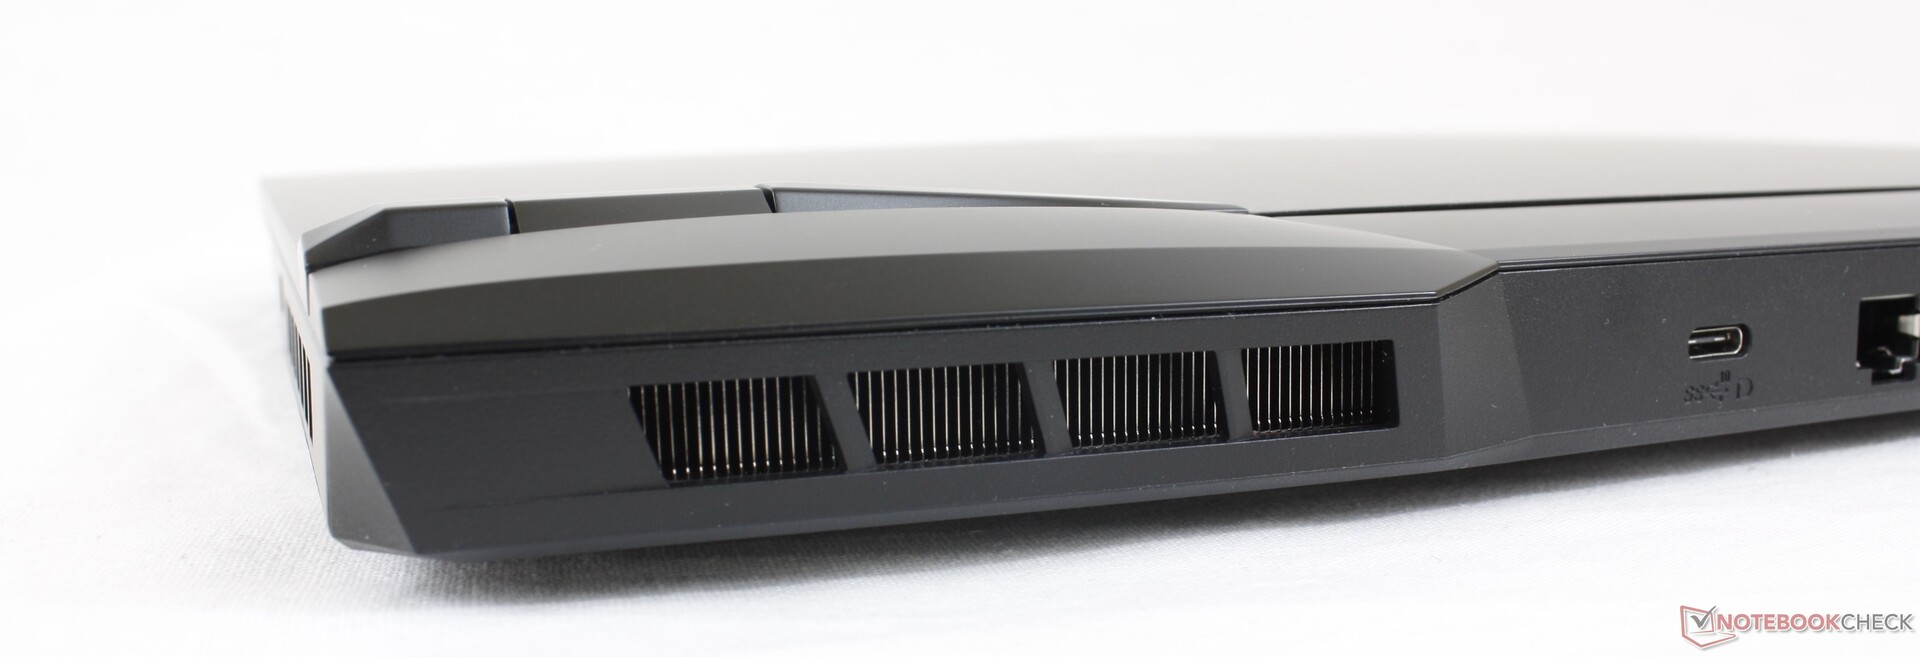
Conectividade
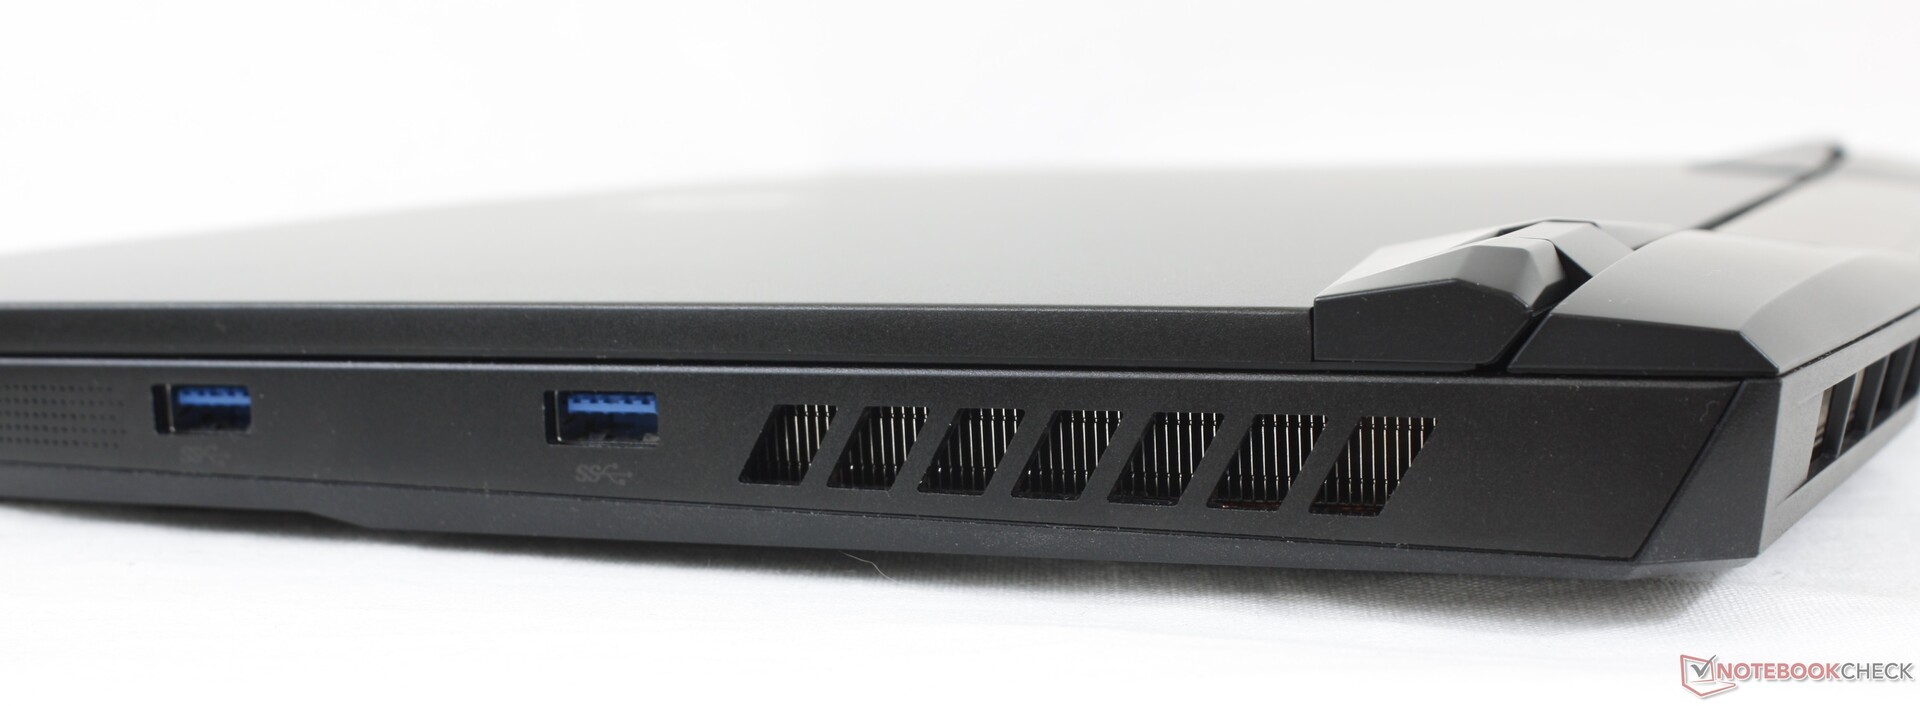
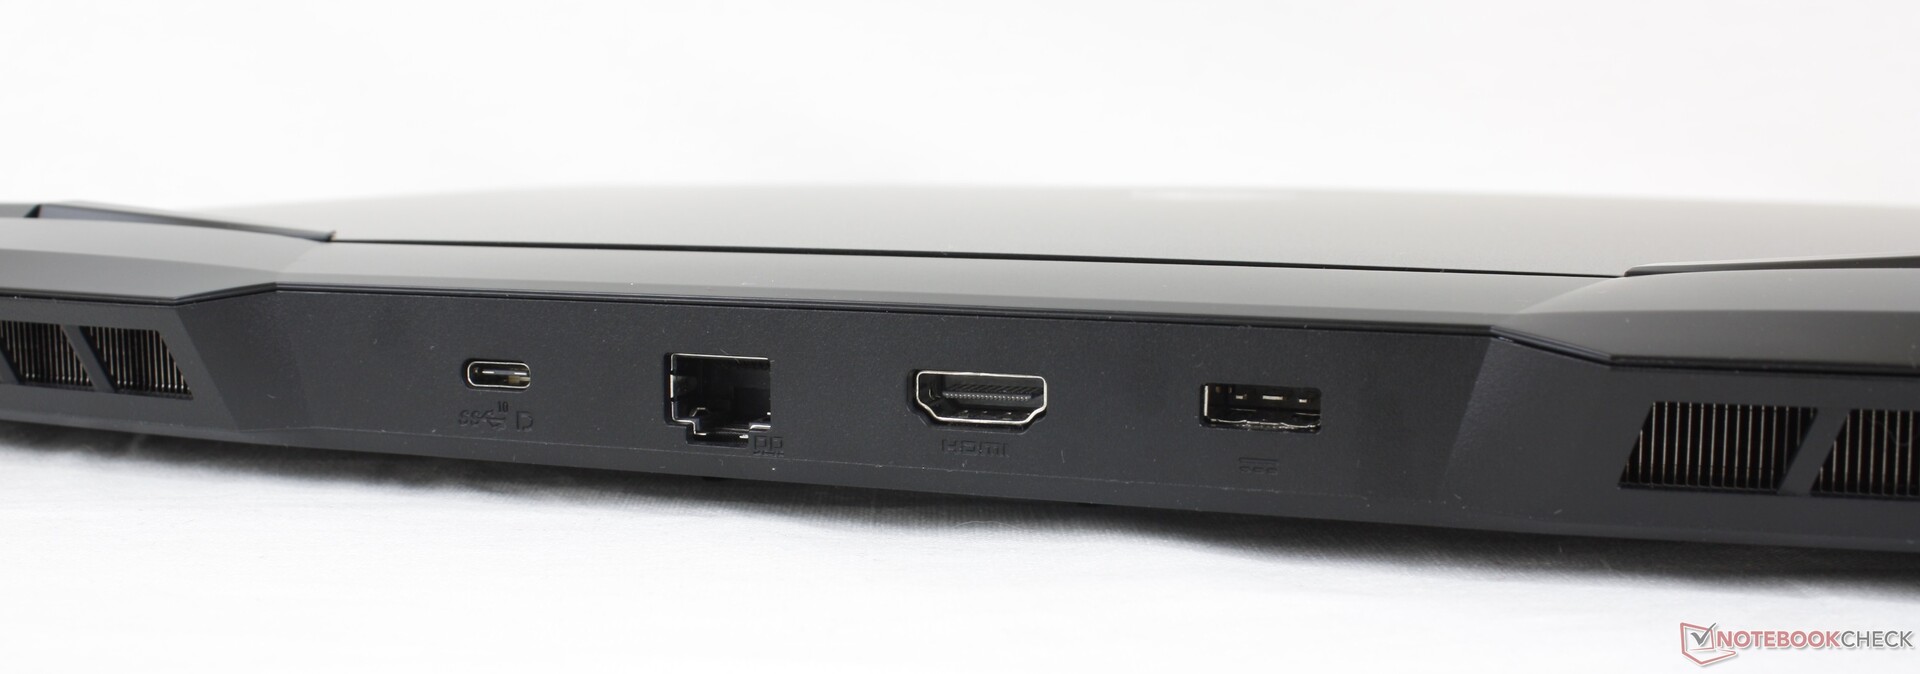
As opções de porta e posicionamento mudaram significativamente em relação à GP65. Para um, as portas estão agora distribuídas de forma mais uniforme ao longo das bordas esquerda, direita e traseira, enquanto que todas elas foram agrupadas na GP65. Em segundo lugar, tanto o microfone de 3,5 mm quanto as portas do mini-DisplayPort agora se foram em favor do DisplayPort-over-USB-C. O HDMI foi atualizado de 1,4 para 2,0 para suporte 4K60 e há uma porta USB-A extra para três no total.
Tenha em mente que o Thunderbolt e o USB-C Power Delivery não são suportados. Assim, os usuários não podem recarregar o GP66 com adaptadores USB-C, ao contrário do que acontece com o Lâmina Razer 15 ou Alienware m15.
Comunicação
Webcam


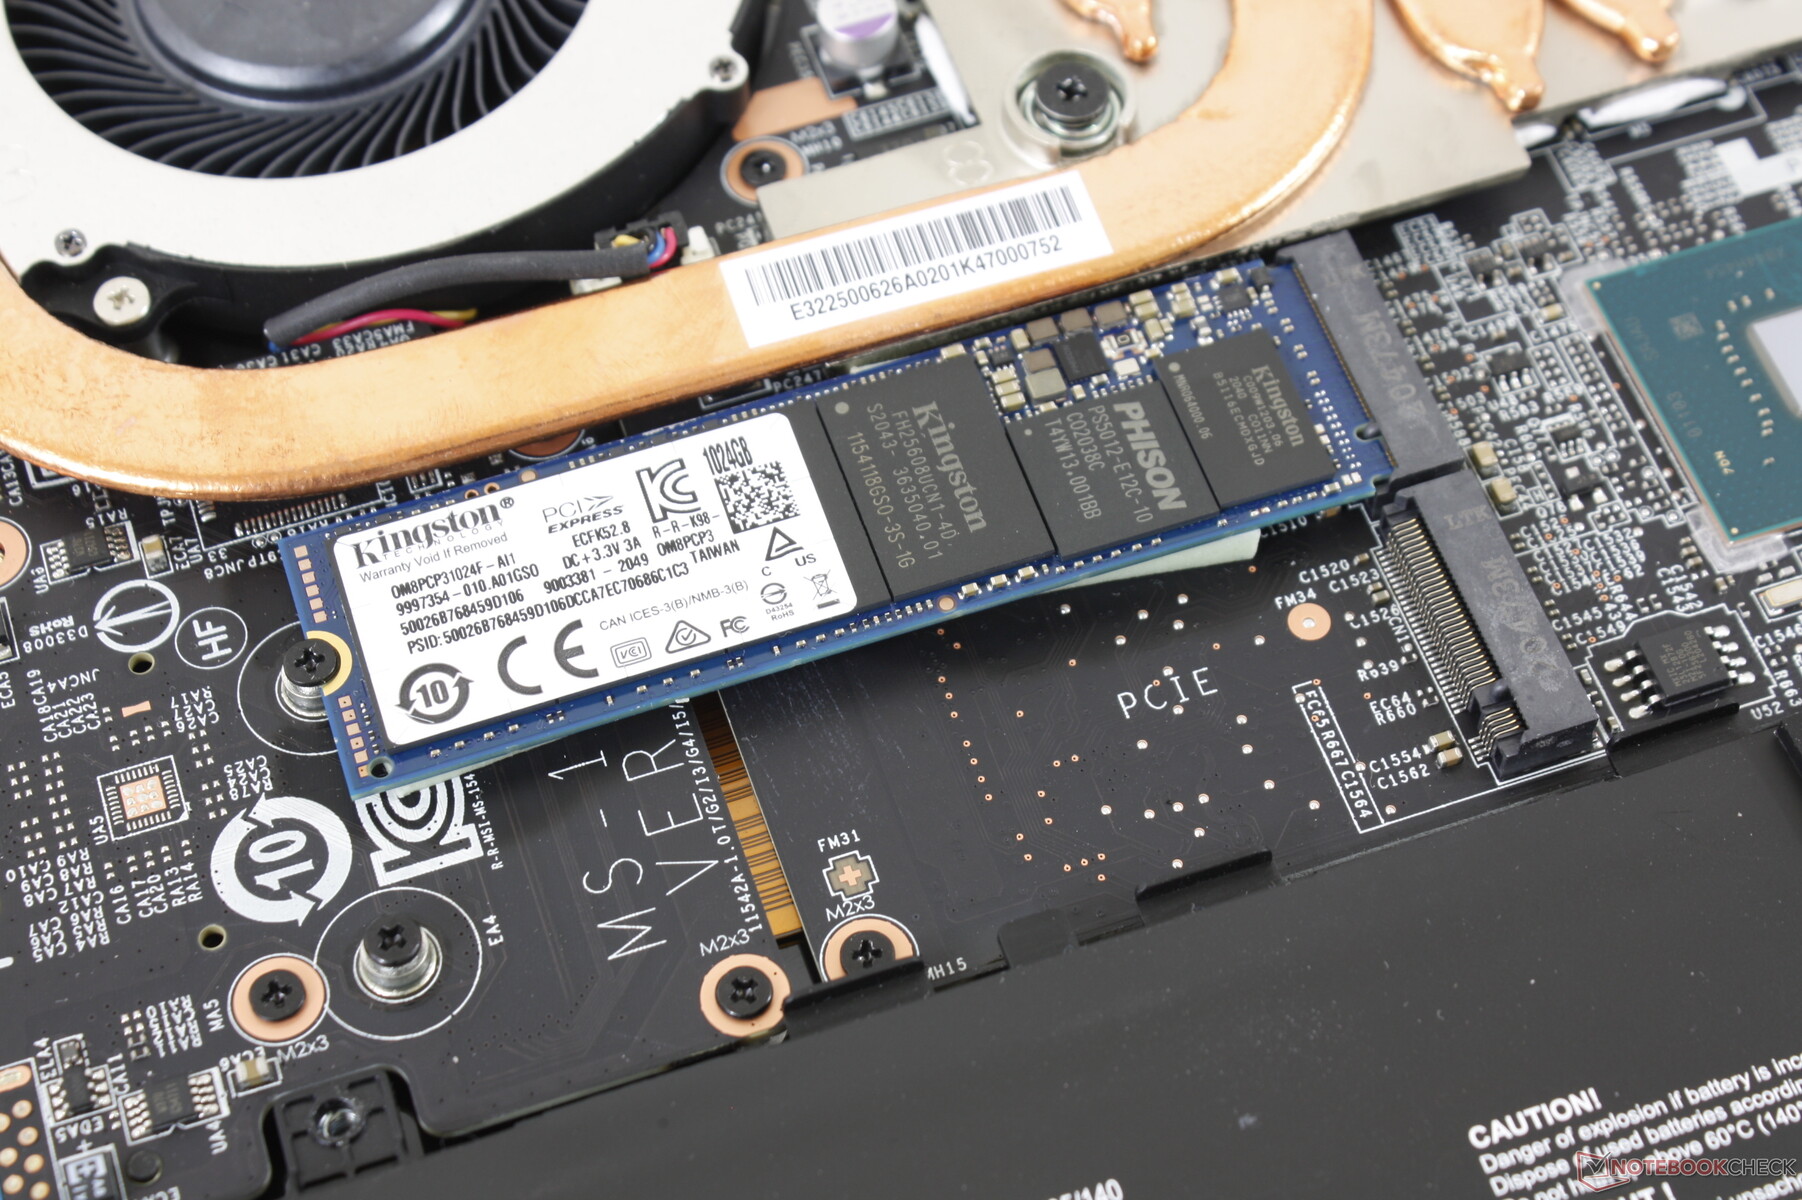
Manutenção
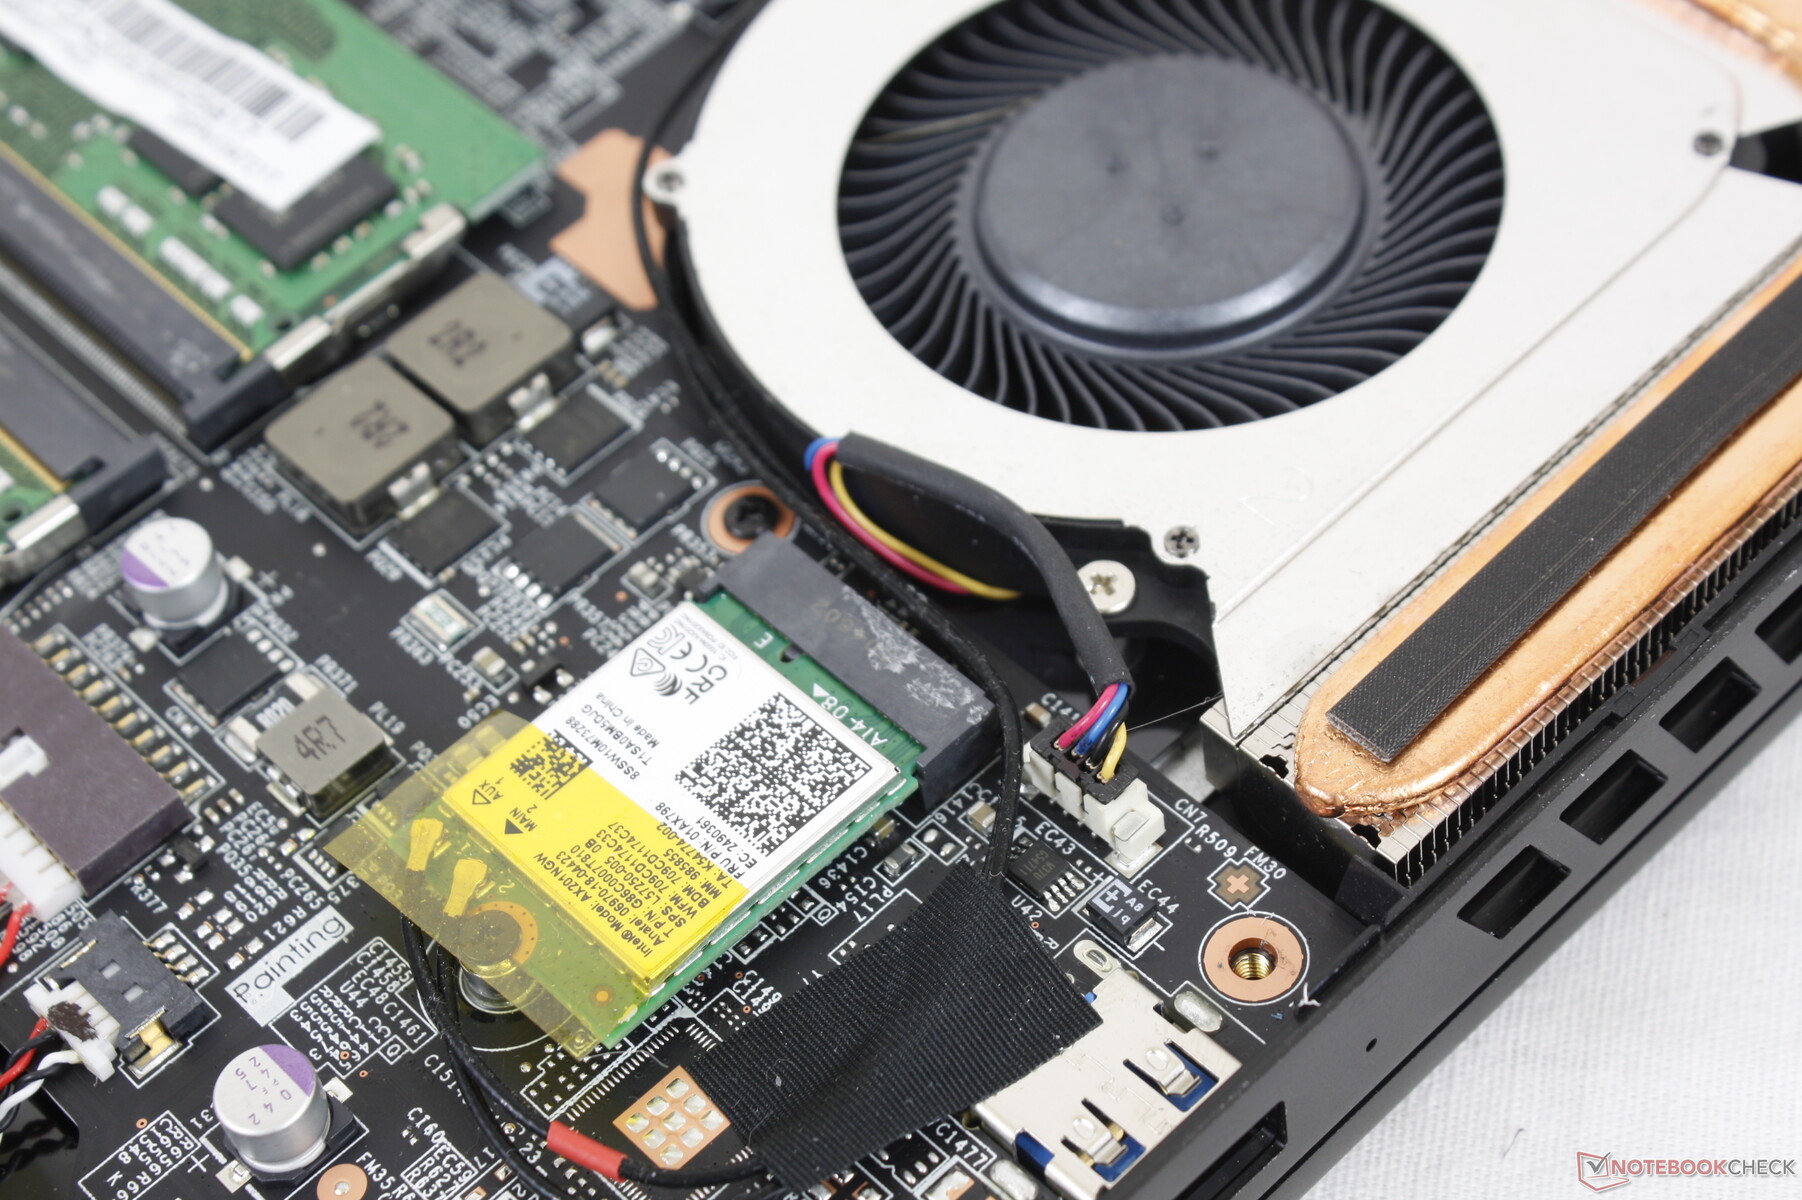
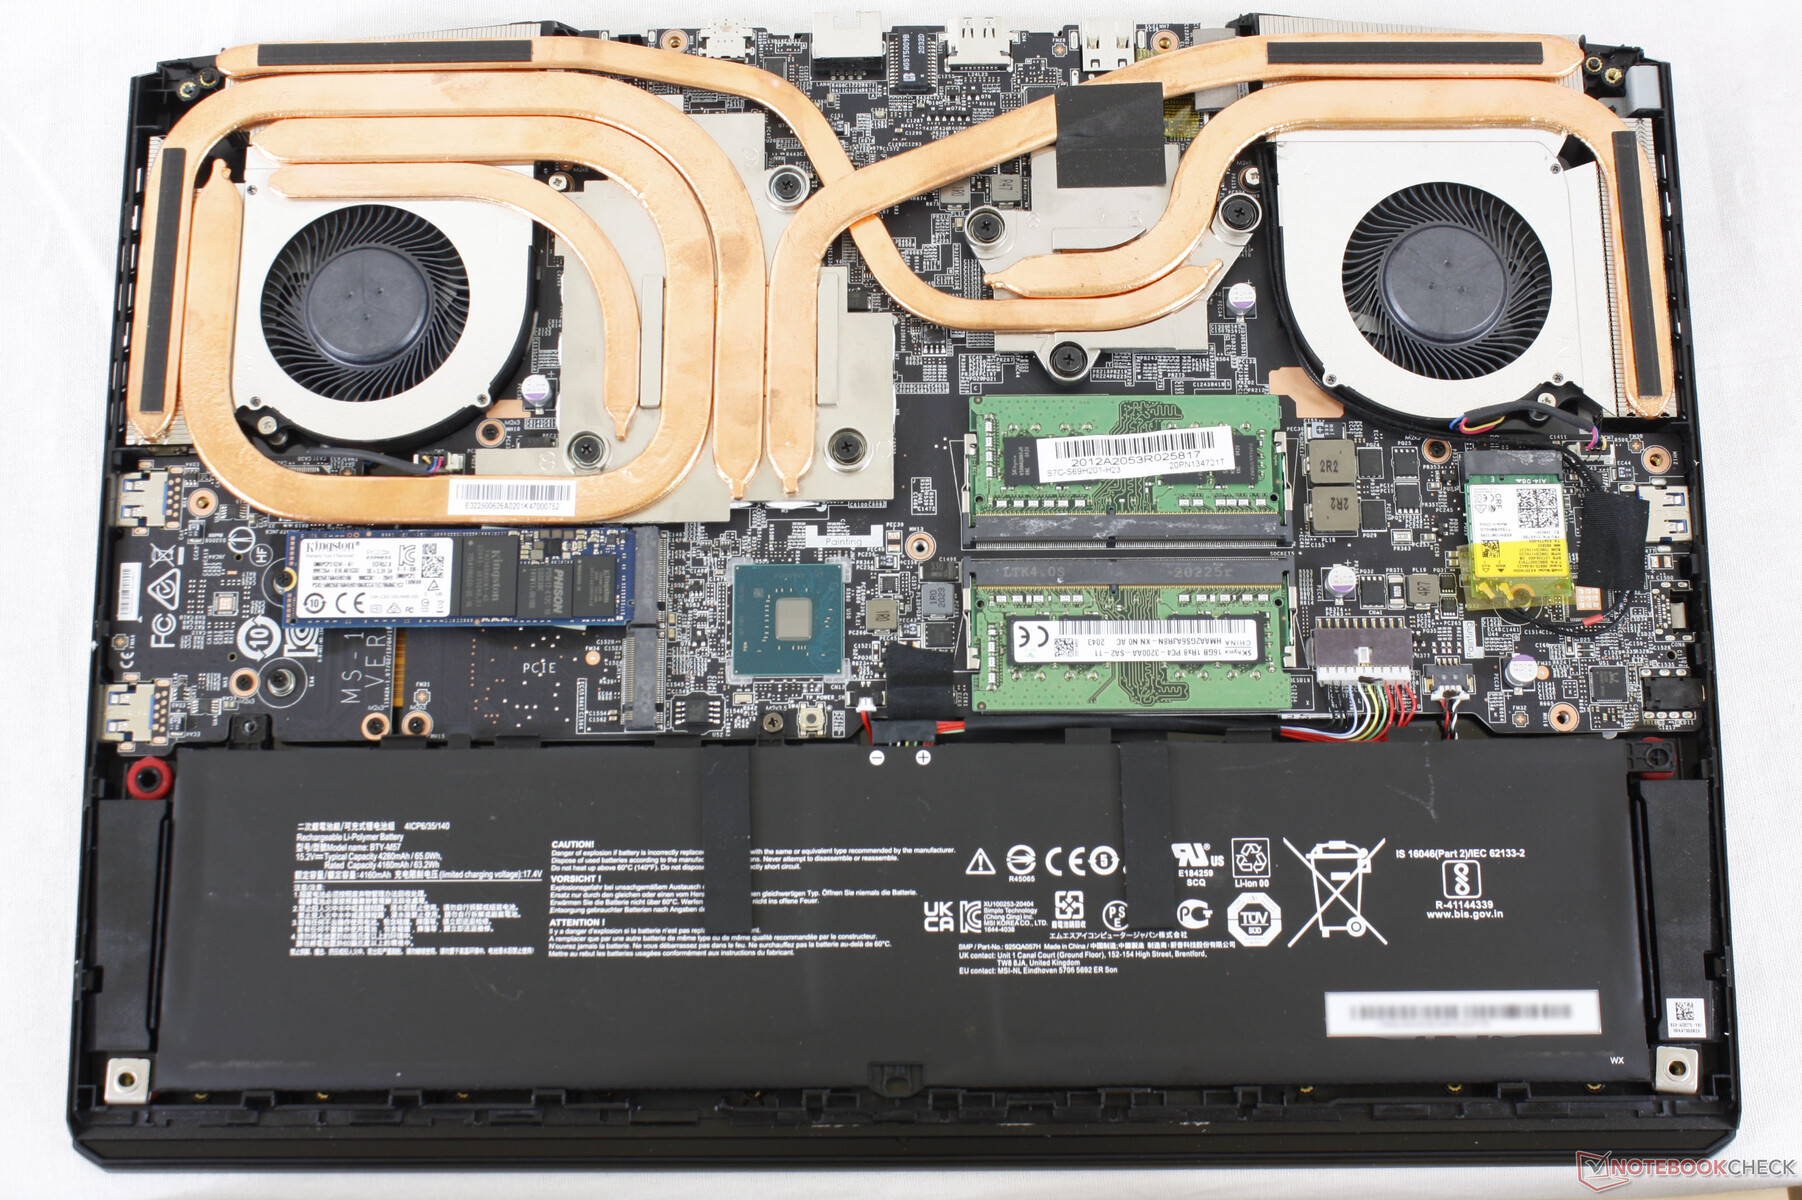
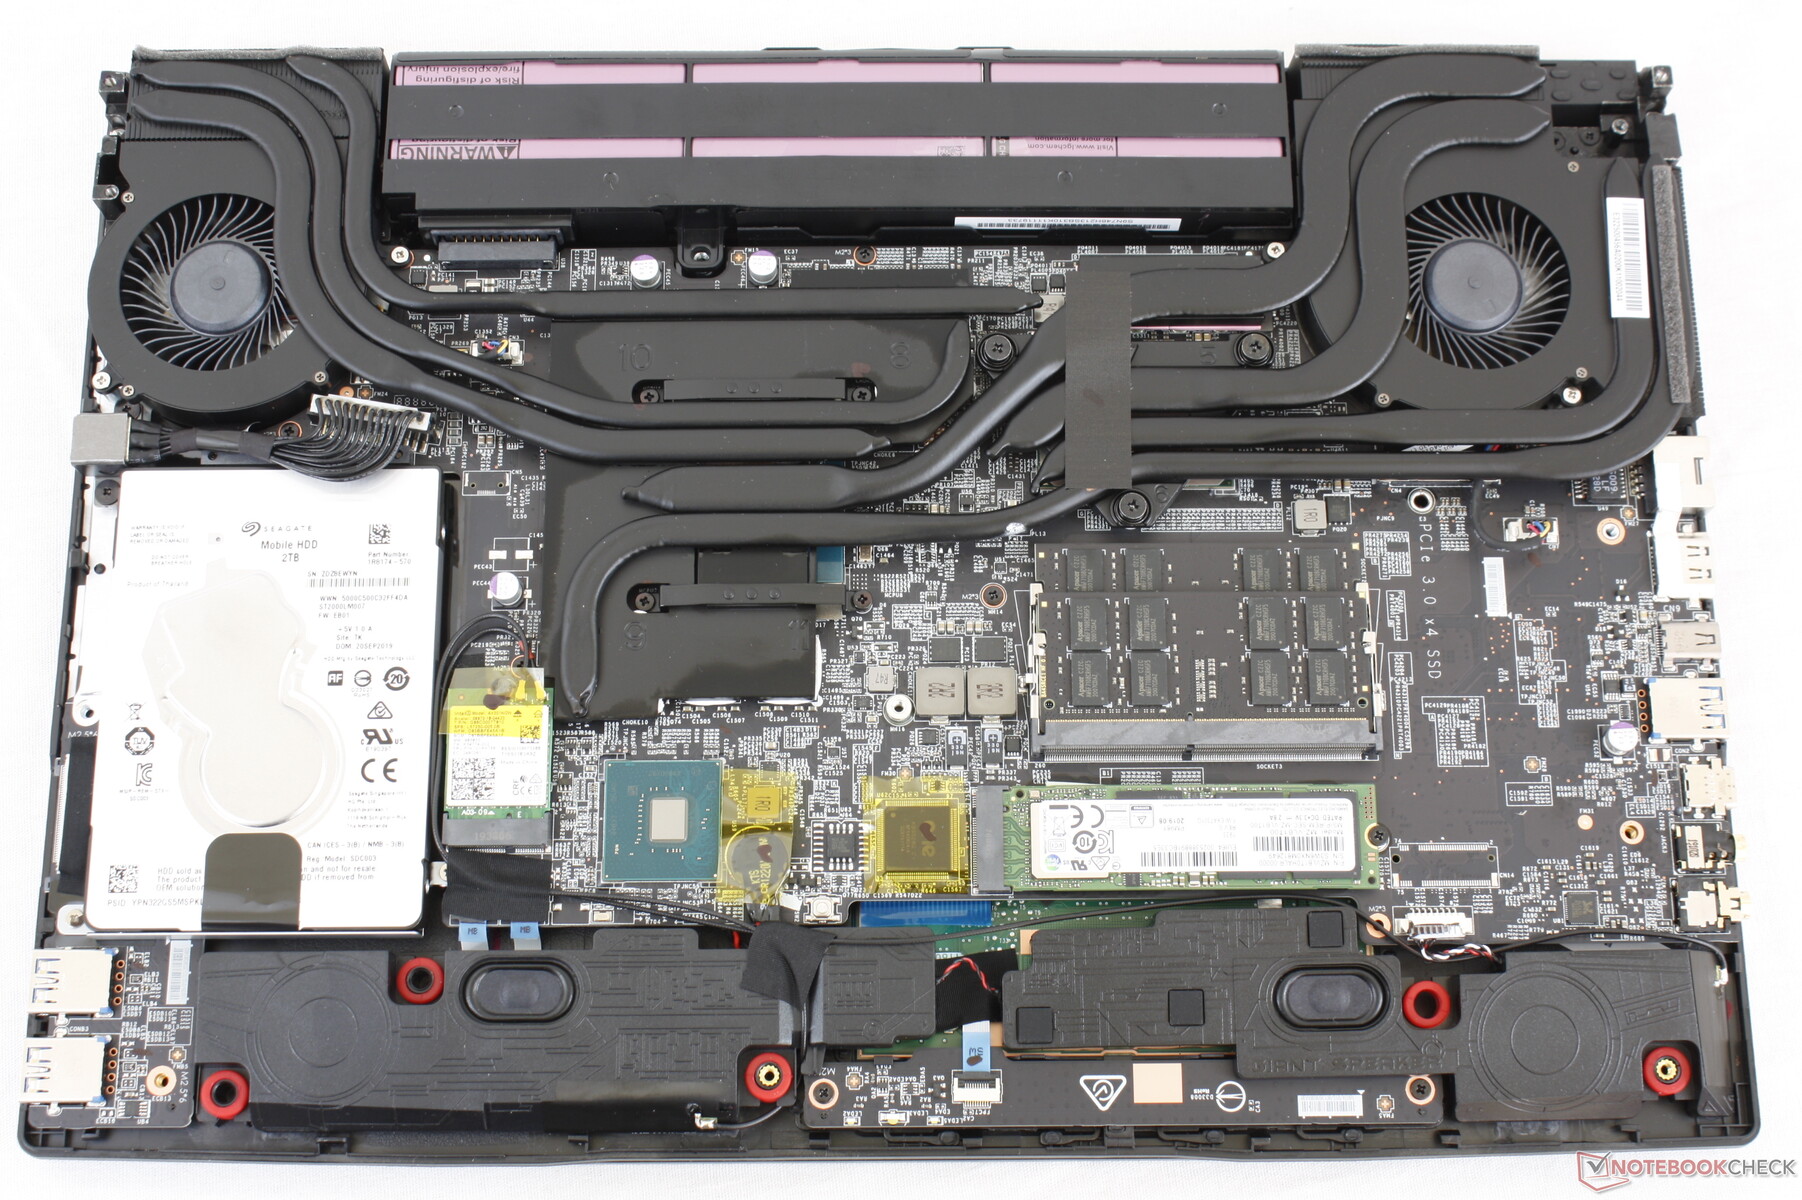
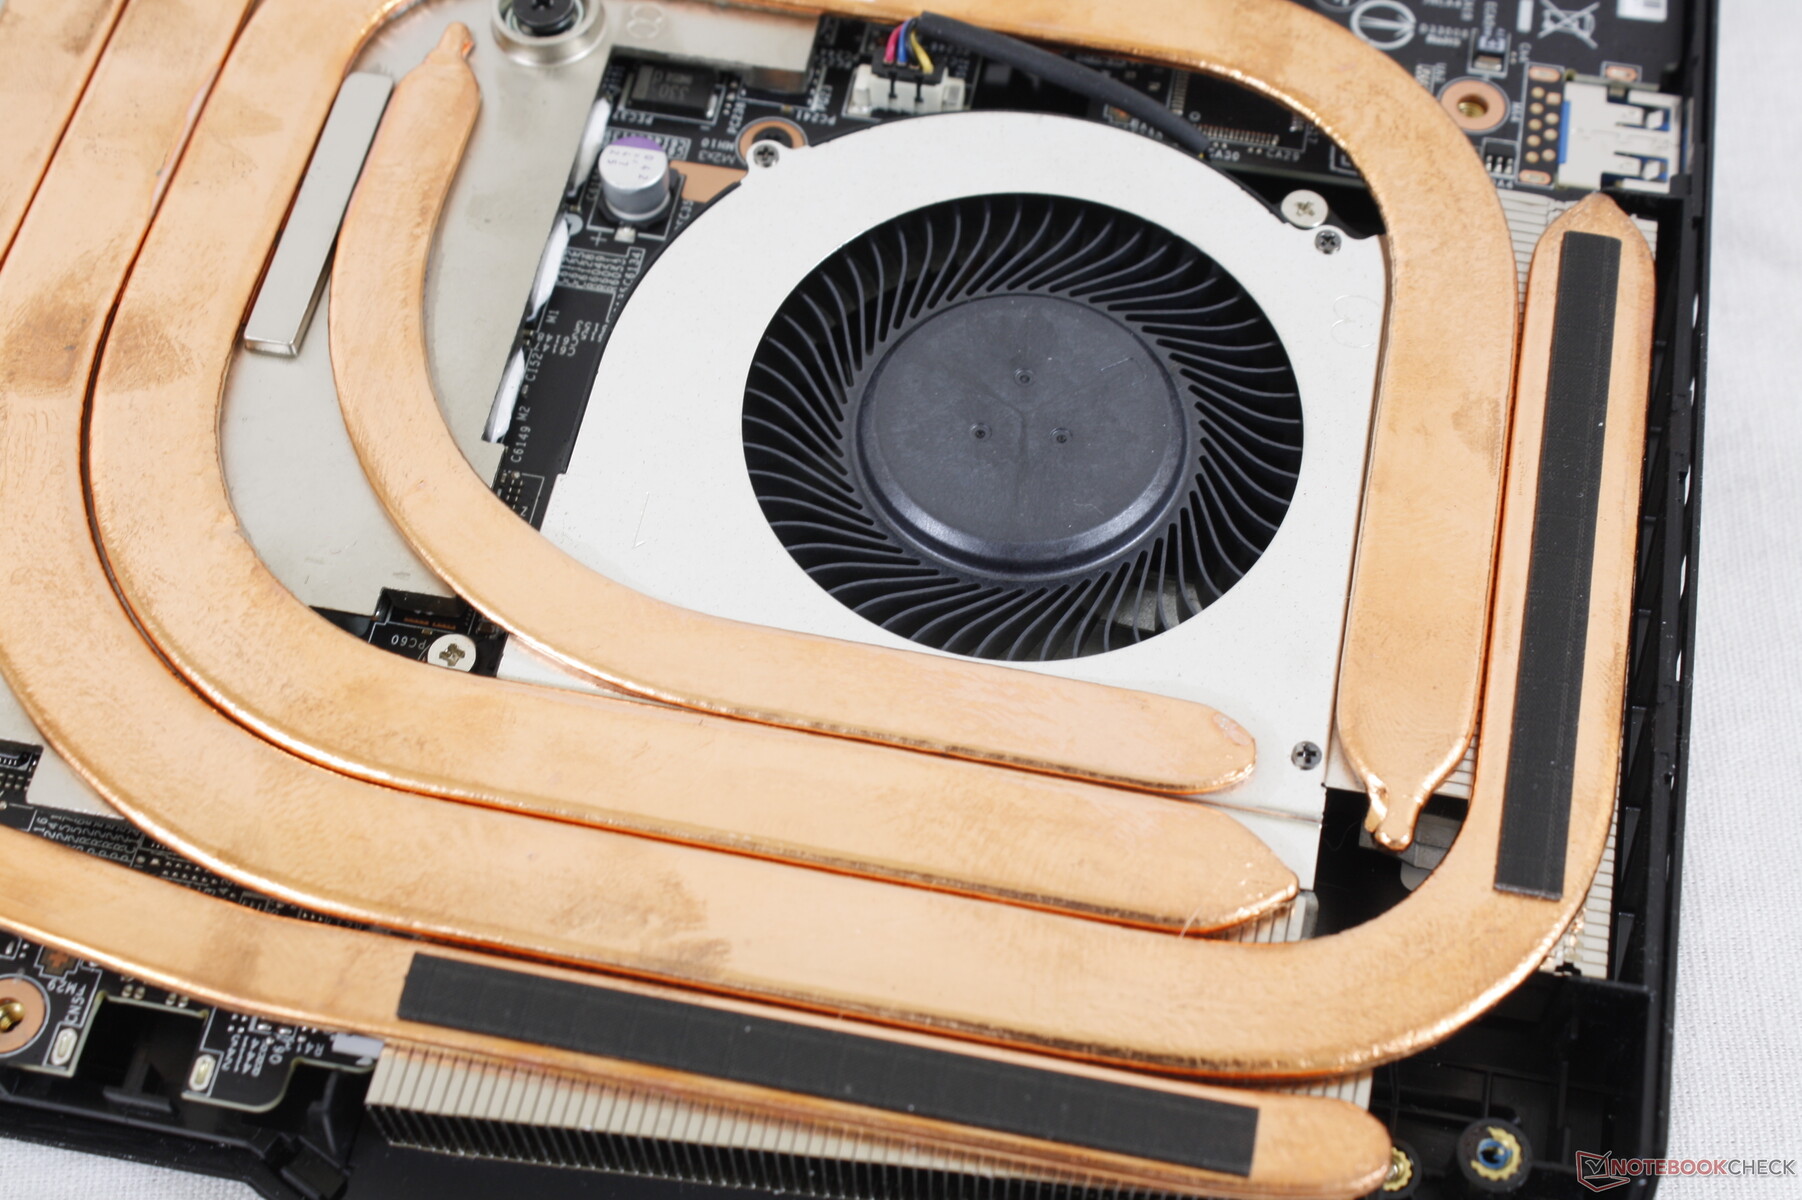
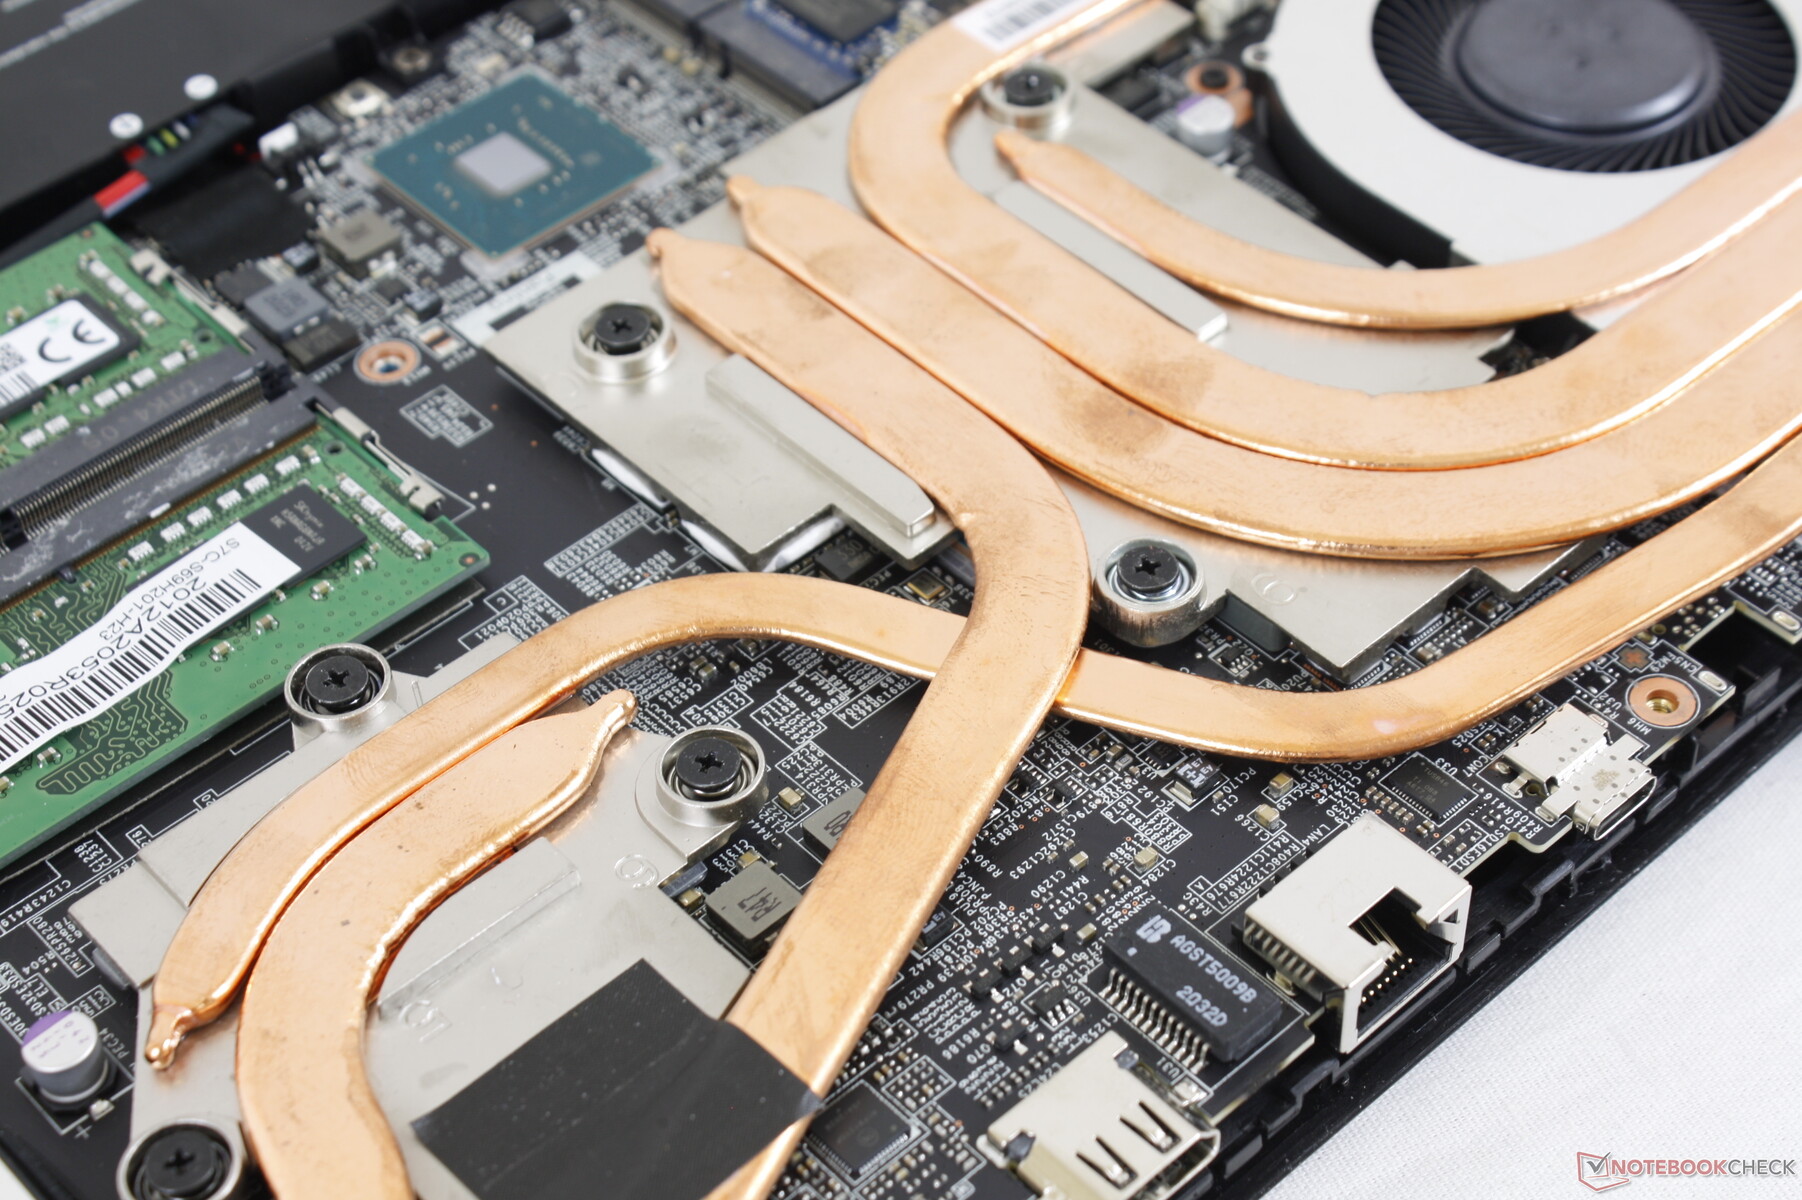
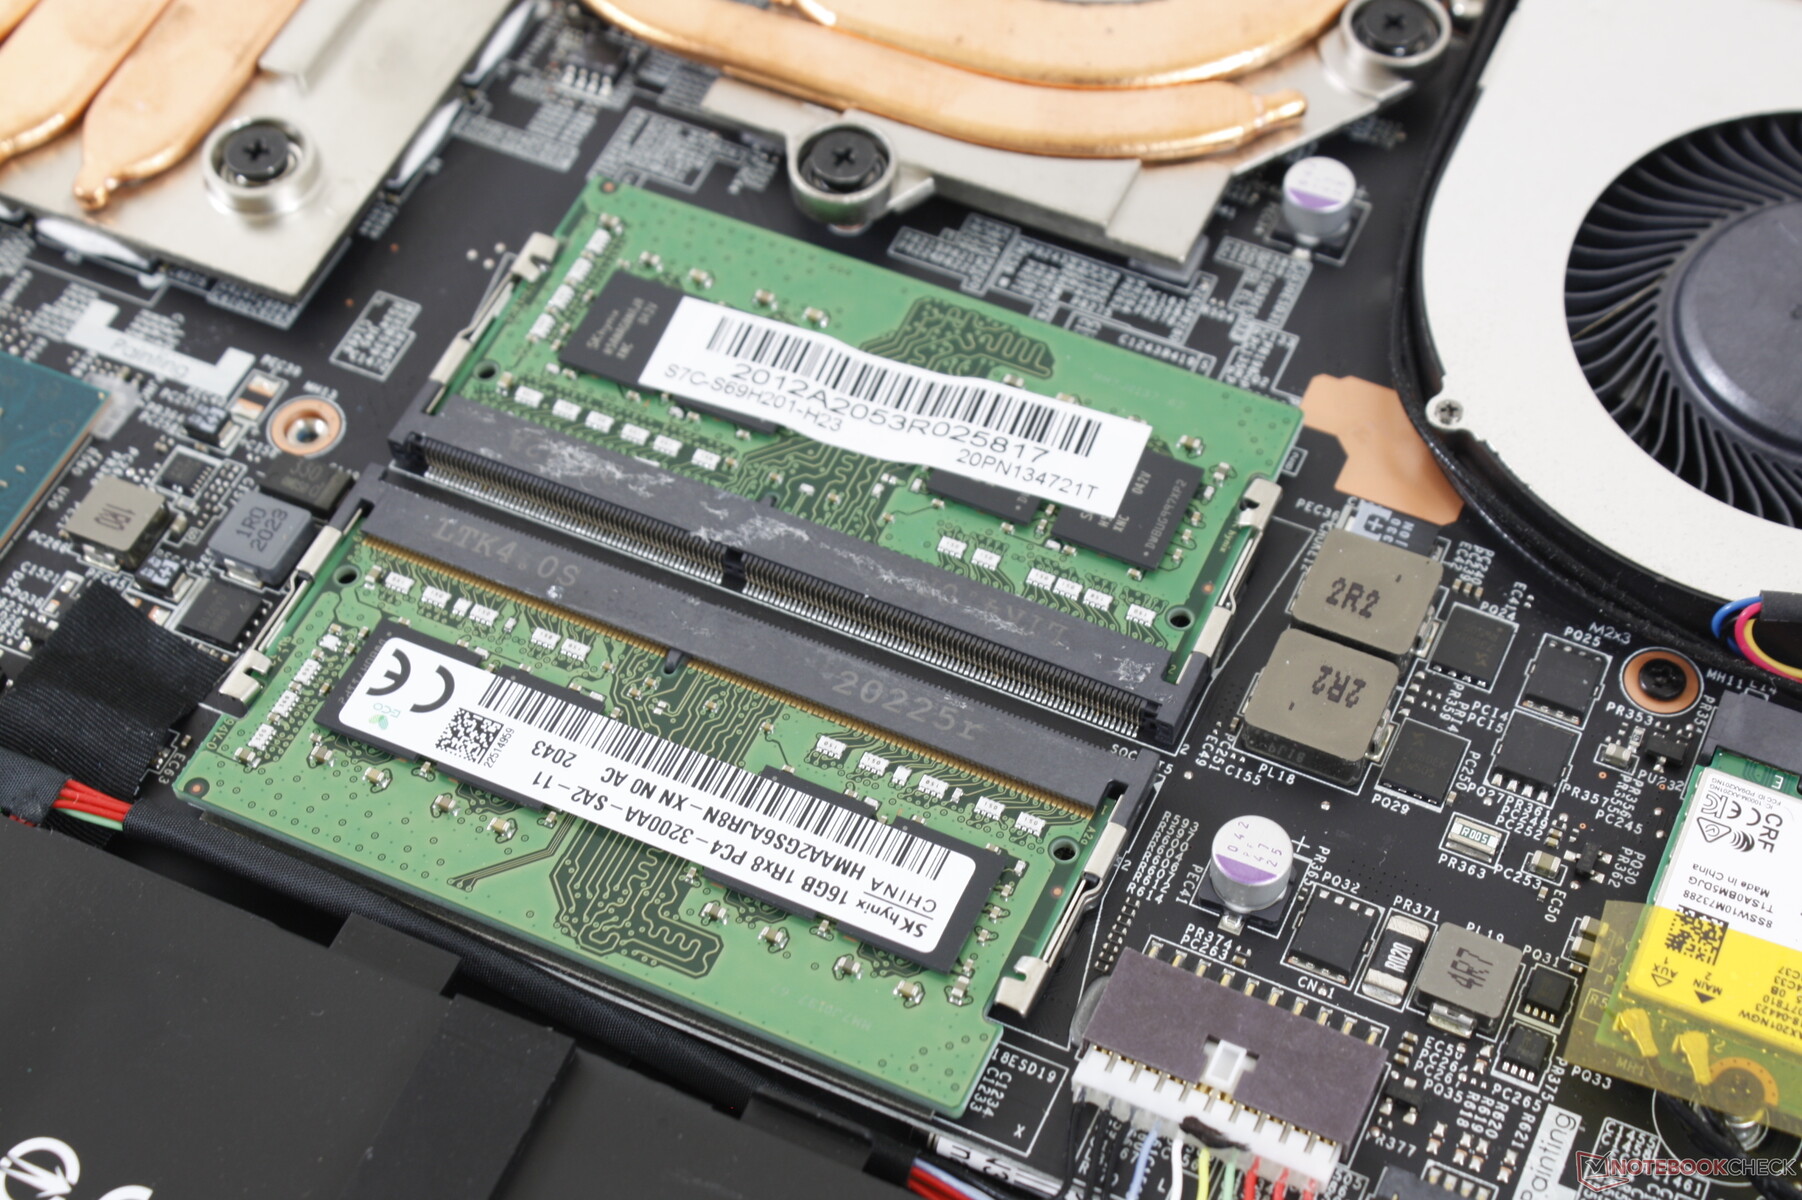
A manutenção é mais difícil do que na GP65 porque o painel inferior da GP66 é muito mais apertado em torno das bordas e cantos. Uma borda afiada e uma mão cuidadosa são necessárias para remover o painel com segurança. Uma vez dentro, os usuários terão acesso direto a 2x M.2 2280 slots, 2x SODIMM, bateria, e ao módulo WLAN.
Acessórios e Garantia
Não há extras na caixa além do adaptador AC e da papelada. O pano de limpeza de veludo que acompanha os laptops das séries GS e GT não está incluído aqui.
Aplica-se a garantia padrão limitada de um ano do fabricante.
Dispositivos de entrada
Teclado
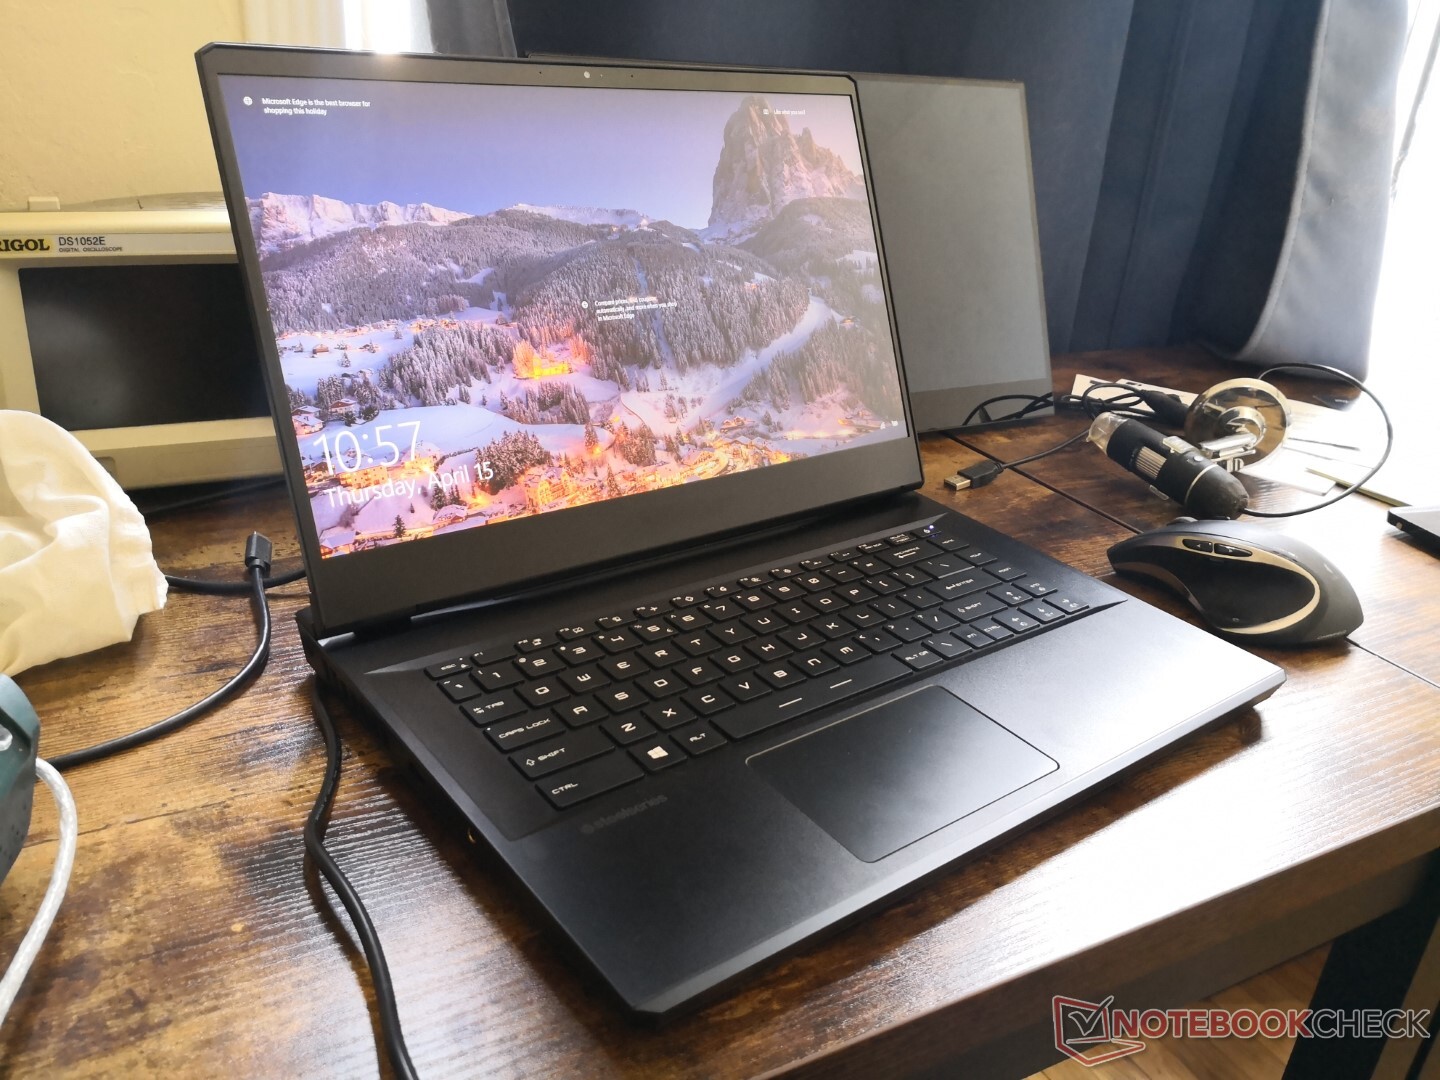
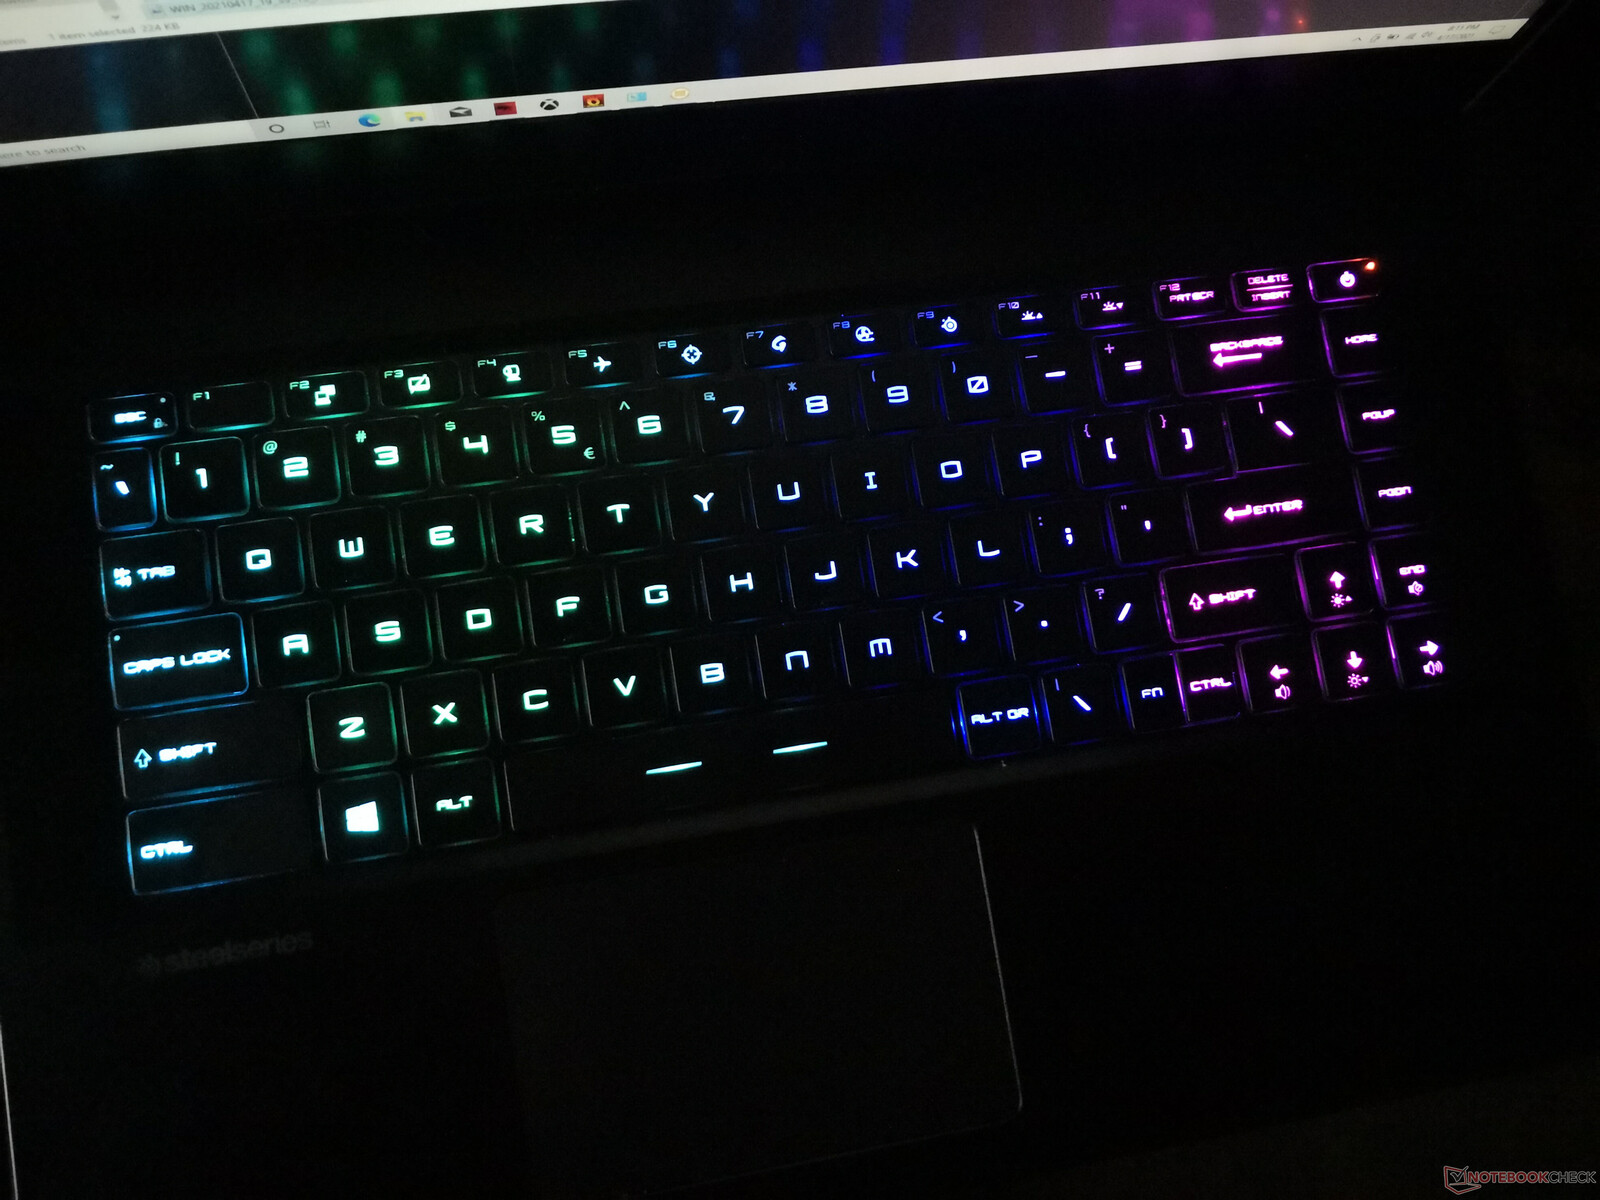
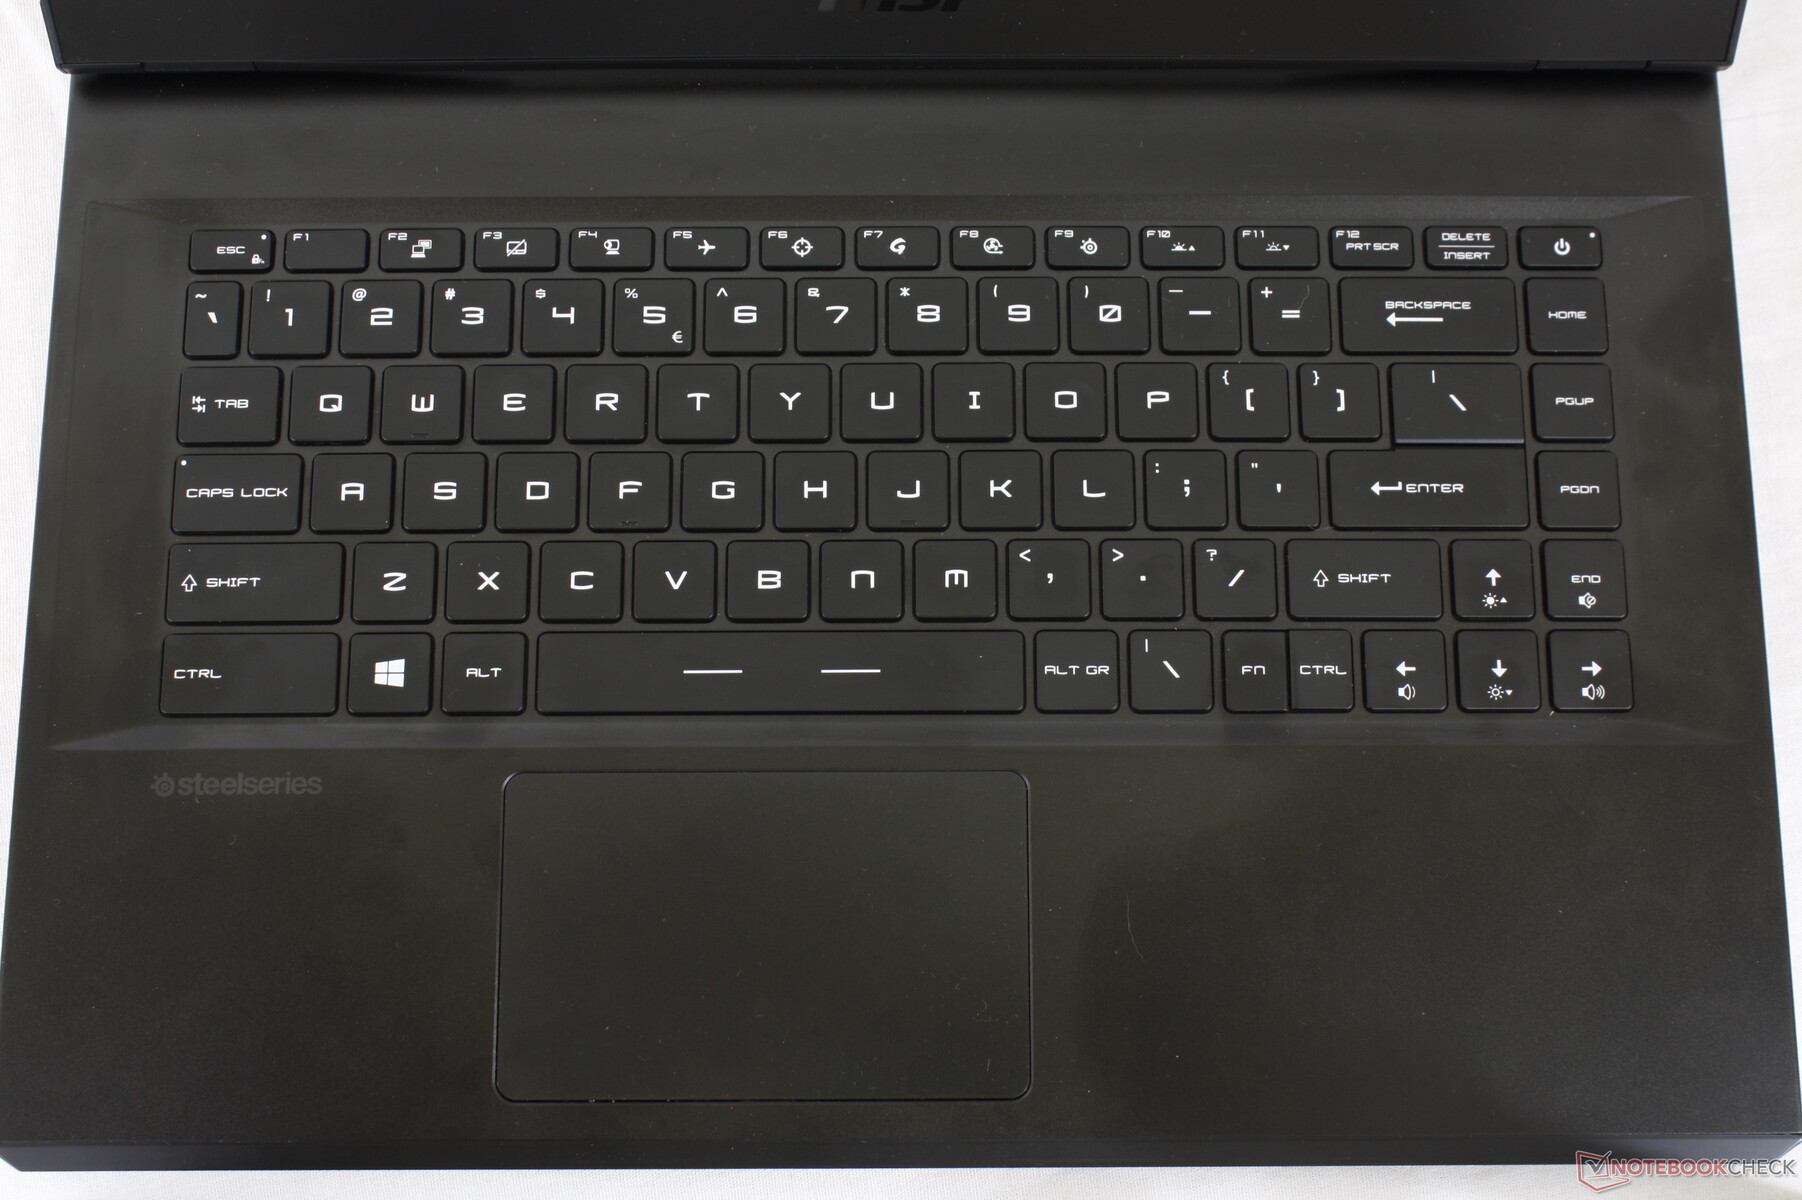
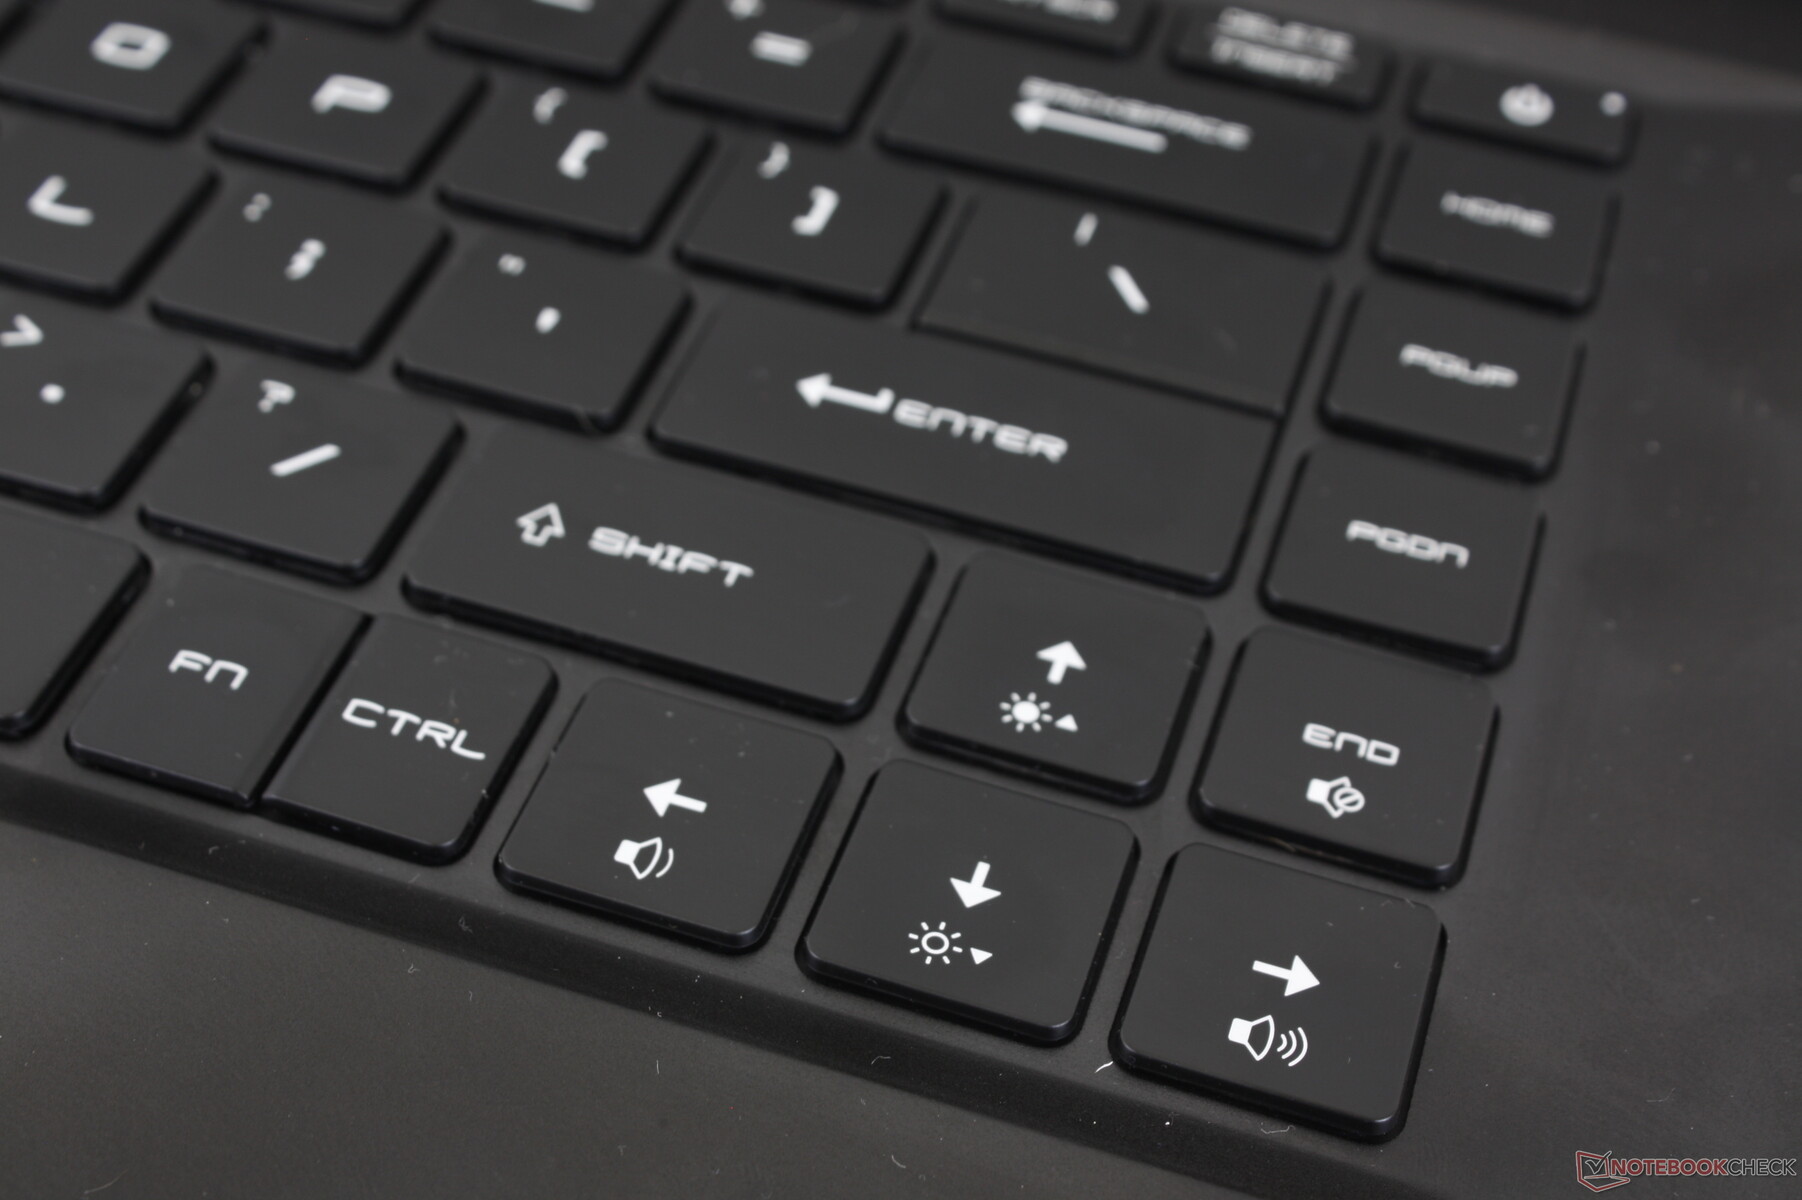
O teclado é idêntico ao teclado do GE66 e uma enorme saída do GP65. O NumPad, por exemplo, agora se foi e as viagens parecem mais curtas com um feedback mais nítido em troca. O clatter também é ligeiramente mais alto e mais agudo do que antes, especialmente no que diz respeito às teclas Space e Enter
A iluminação por tecla RGB retorna. A iluminação poderia ser mais uniforme, porém, uma vez que os símbolos secundários das teclas (isto é, !, @, #, etc.) não brilham tão bem quanto os símbolos principais (1, 2, 3, etc.).
Touchpad
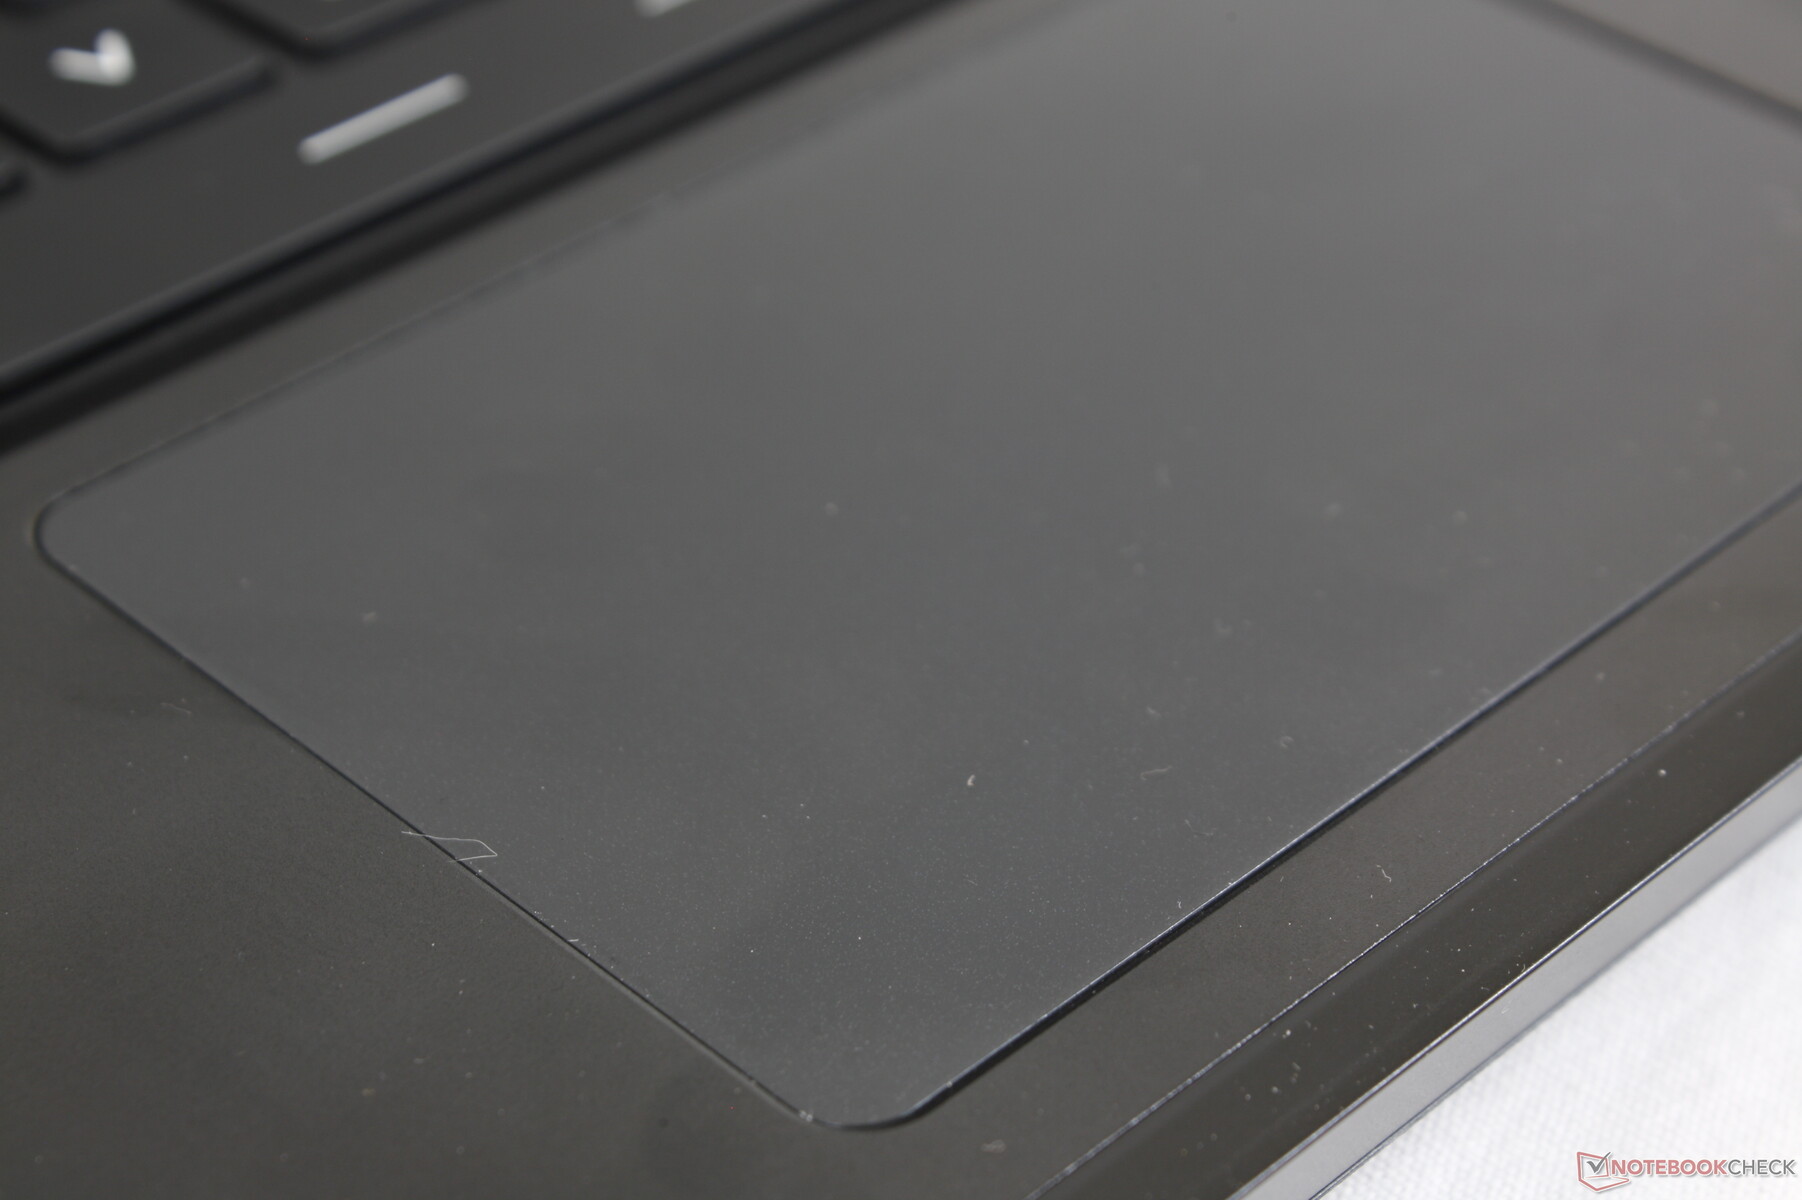
O clickpad plástico é relativamente pequeno (10,5 x 6,5 cm) com um deslizamento suave a velocidades médias-rápidas e apenas um pouco de aderência a velocidades mais lentaspara cliques mais precisos. Suas teclas de clique integradas são esponjosas e requerem mais força do que o normal para registrar, o que pode se tornar cansativo se você não tiver um mouse externo. Embora o novo clickpad seja útil, sentimos falta dos botões dedicados do mouse e de um clickpad mais firme no GP65 mais antigo.

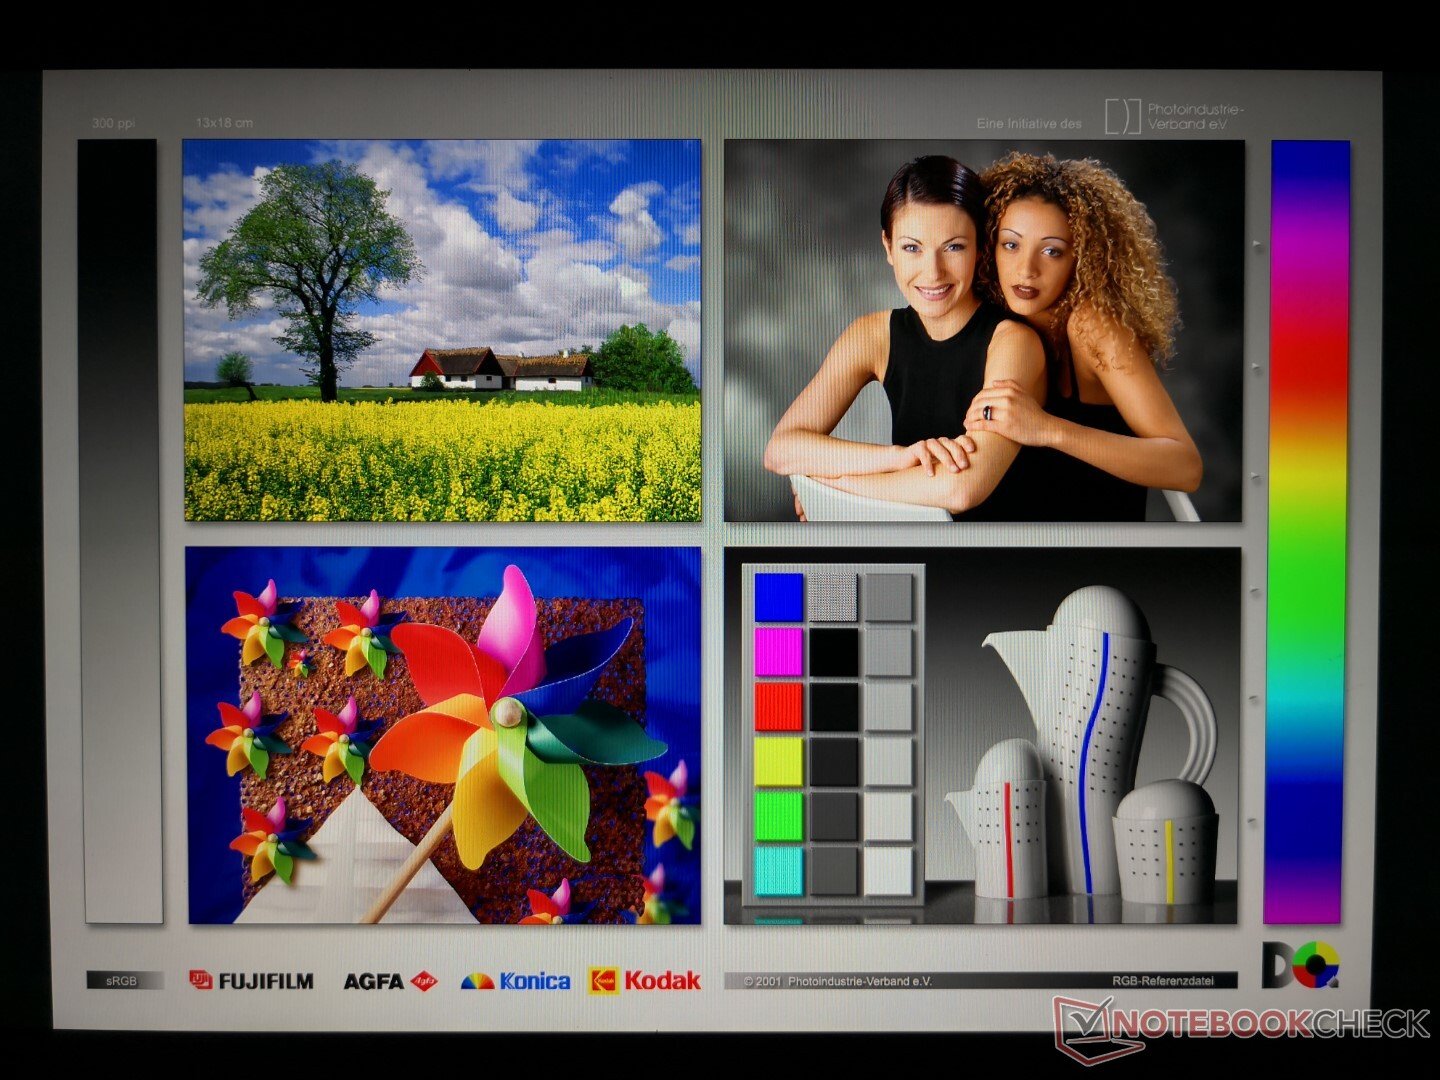
Mostrar
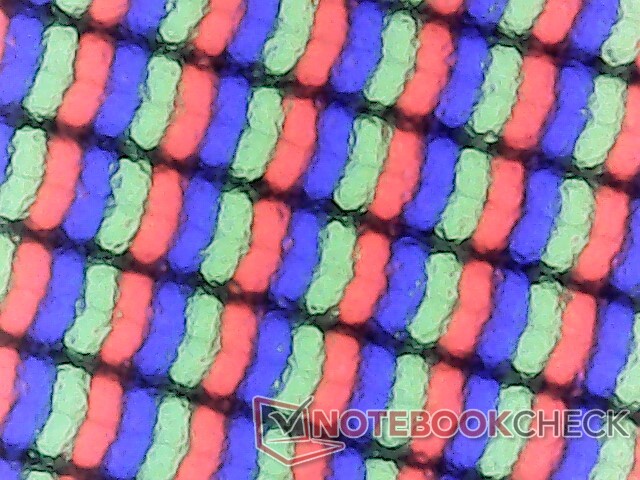
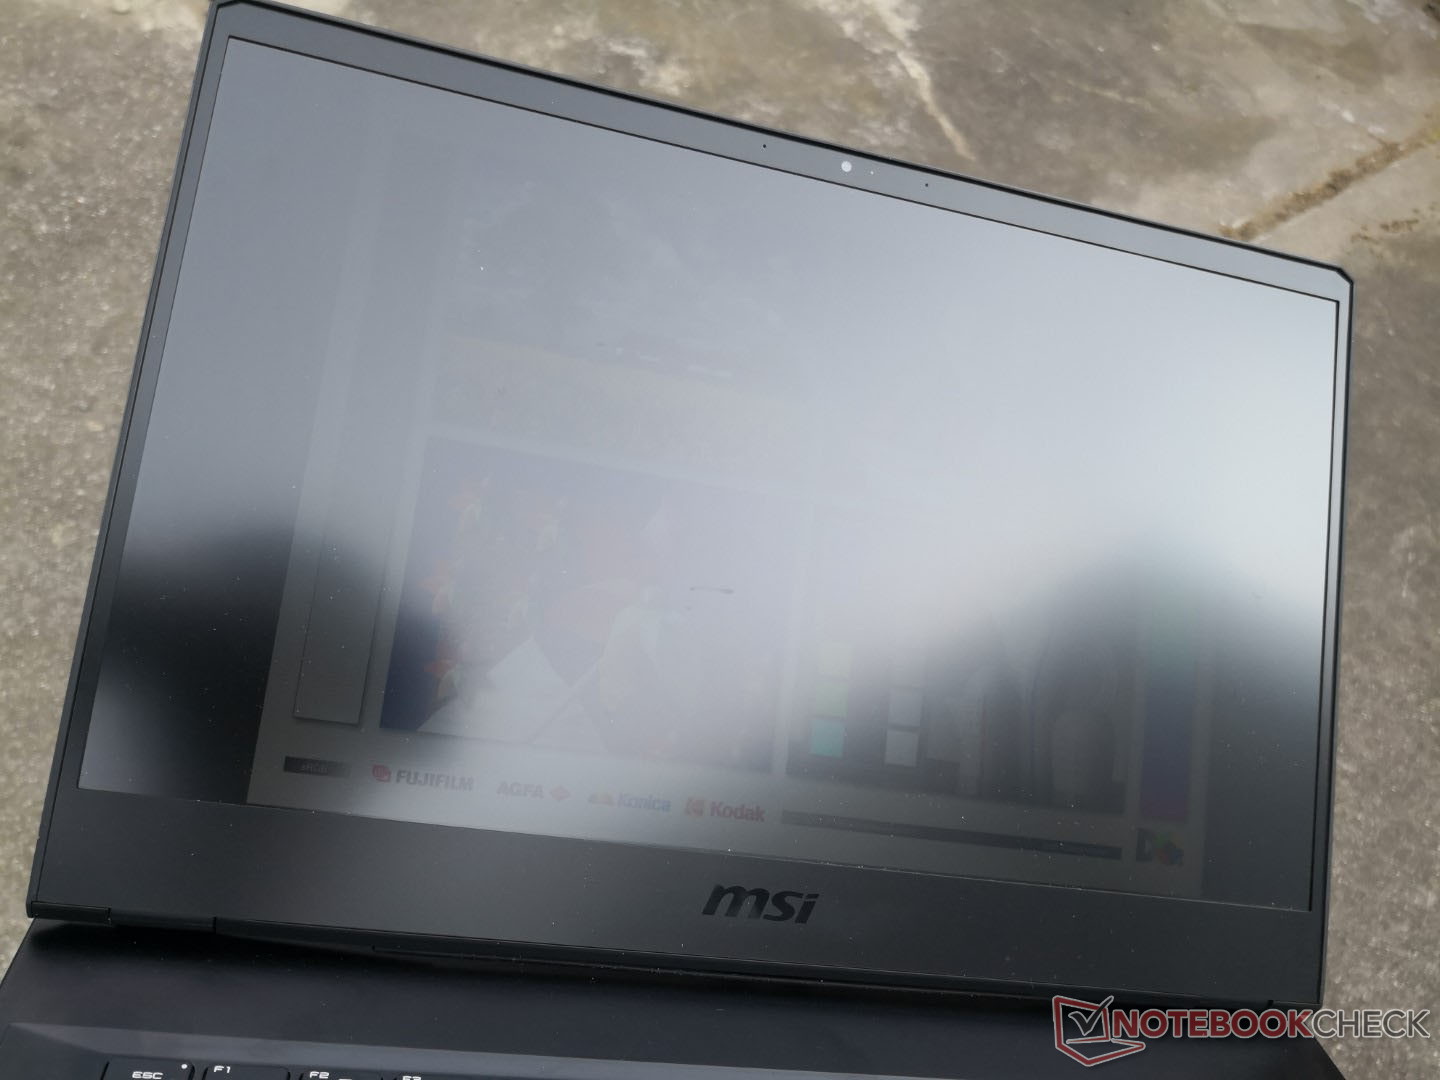
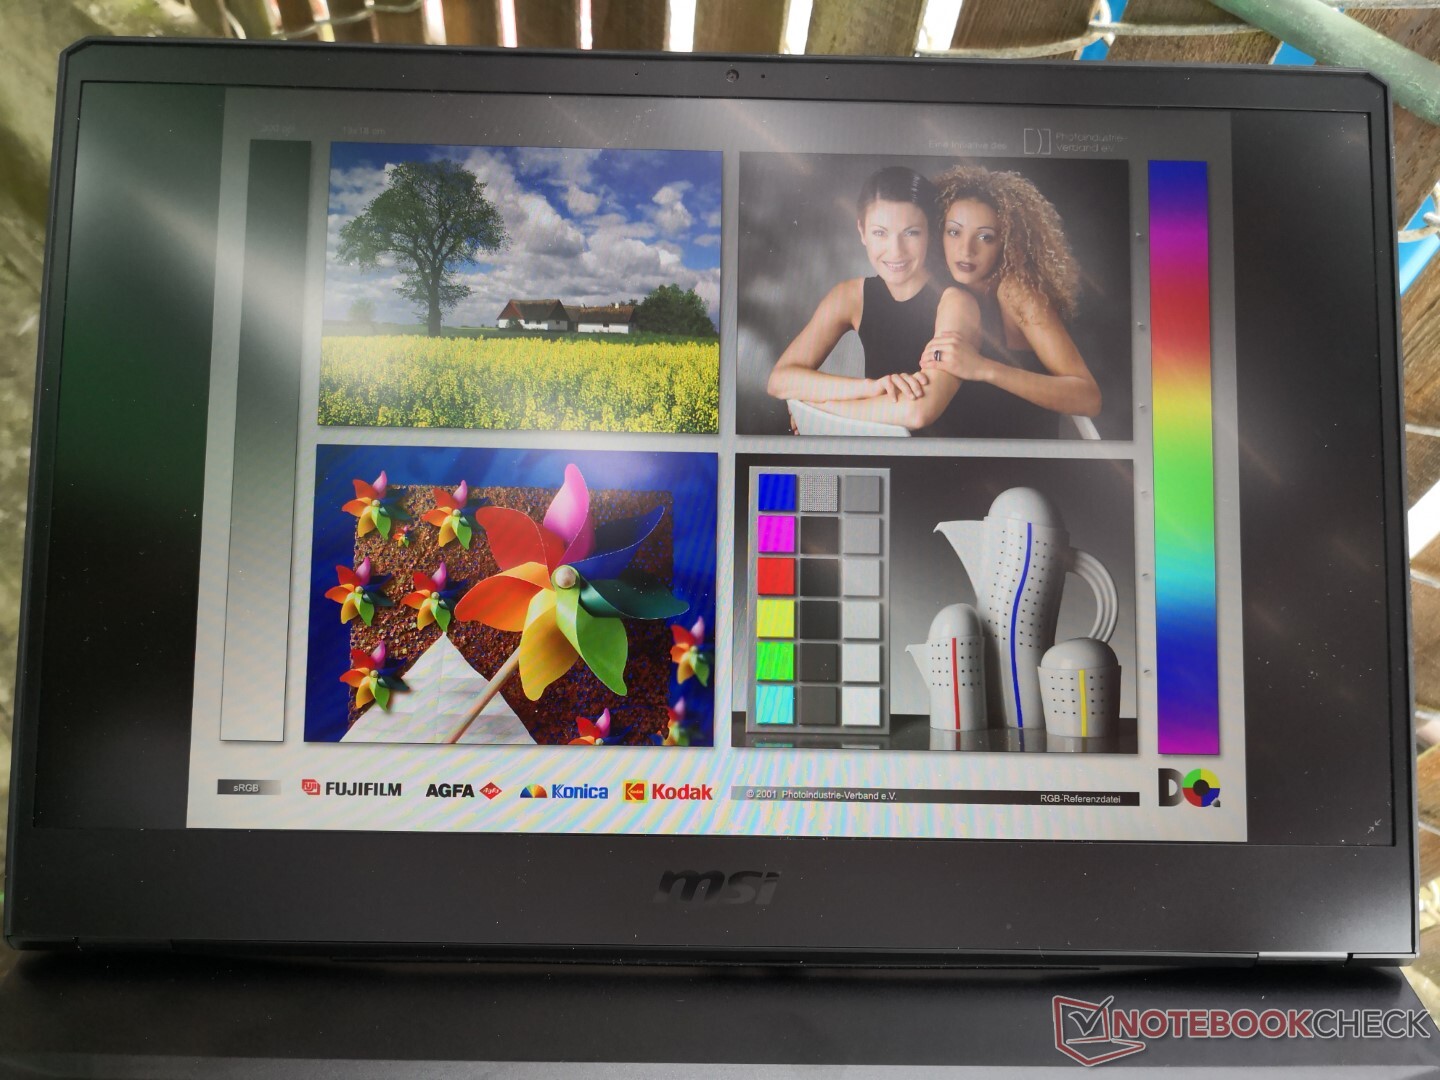
Nossa configuração GP66 10UG usa o mesmo painel LQ156M1JW03 Sharp de 240 Hz encontrado no GE66 10SFS, GS65 Stealth 9SGRazer Blade 15, e Aorus 15P XC. Cores, contraste e tempos de resposta são, portanto, semelhantes entre todos esses laptops, o que é uma coisa boa, uma vez que muitos desses modelos são sistemas de jogos de alto nível.
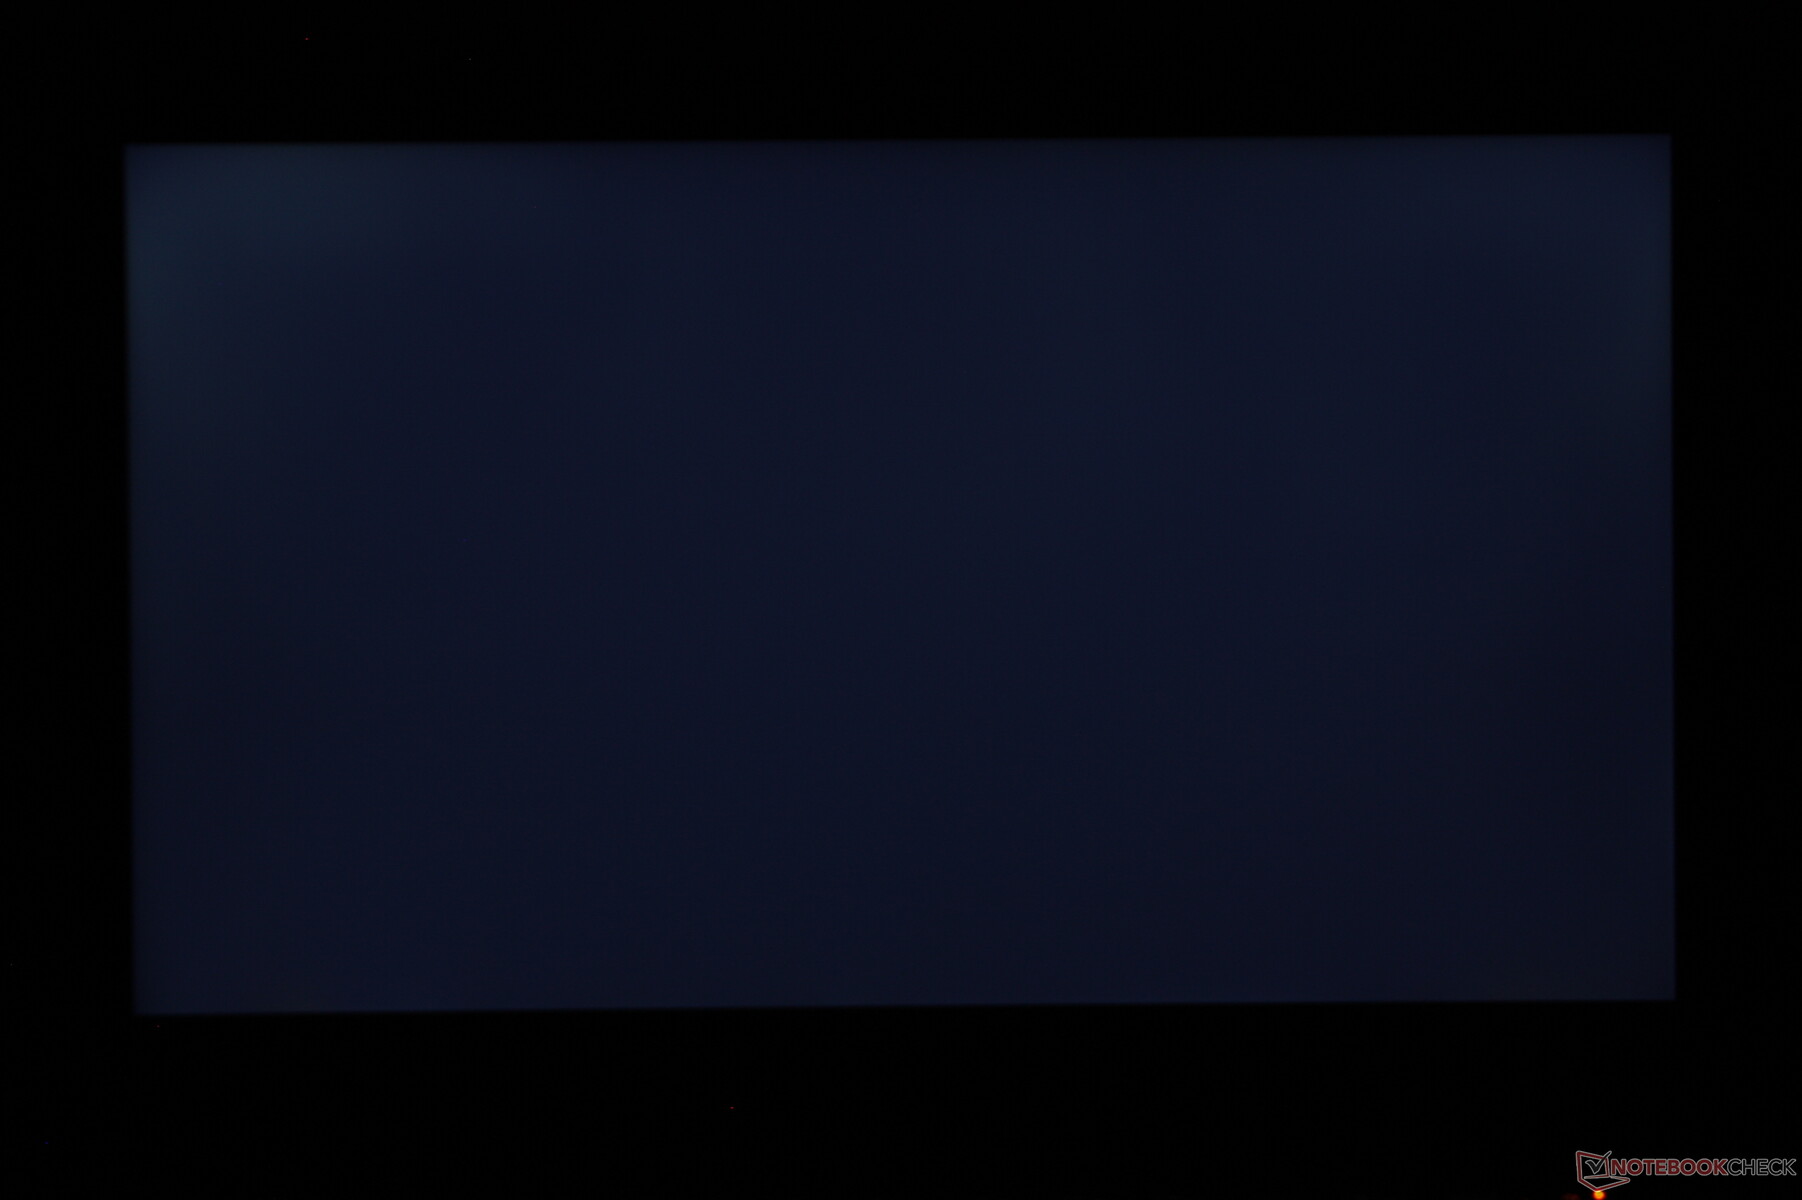
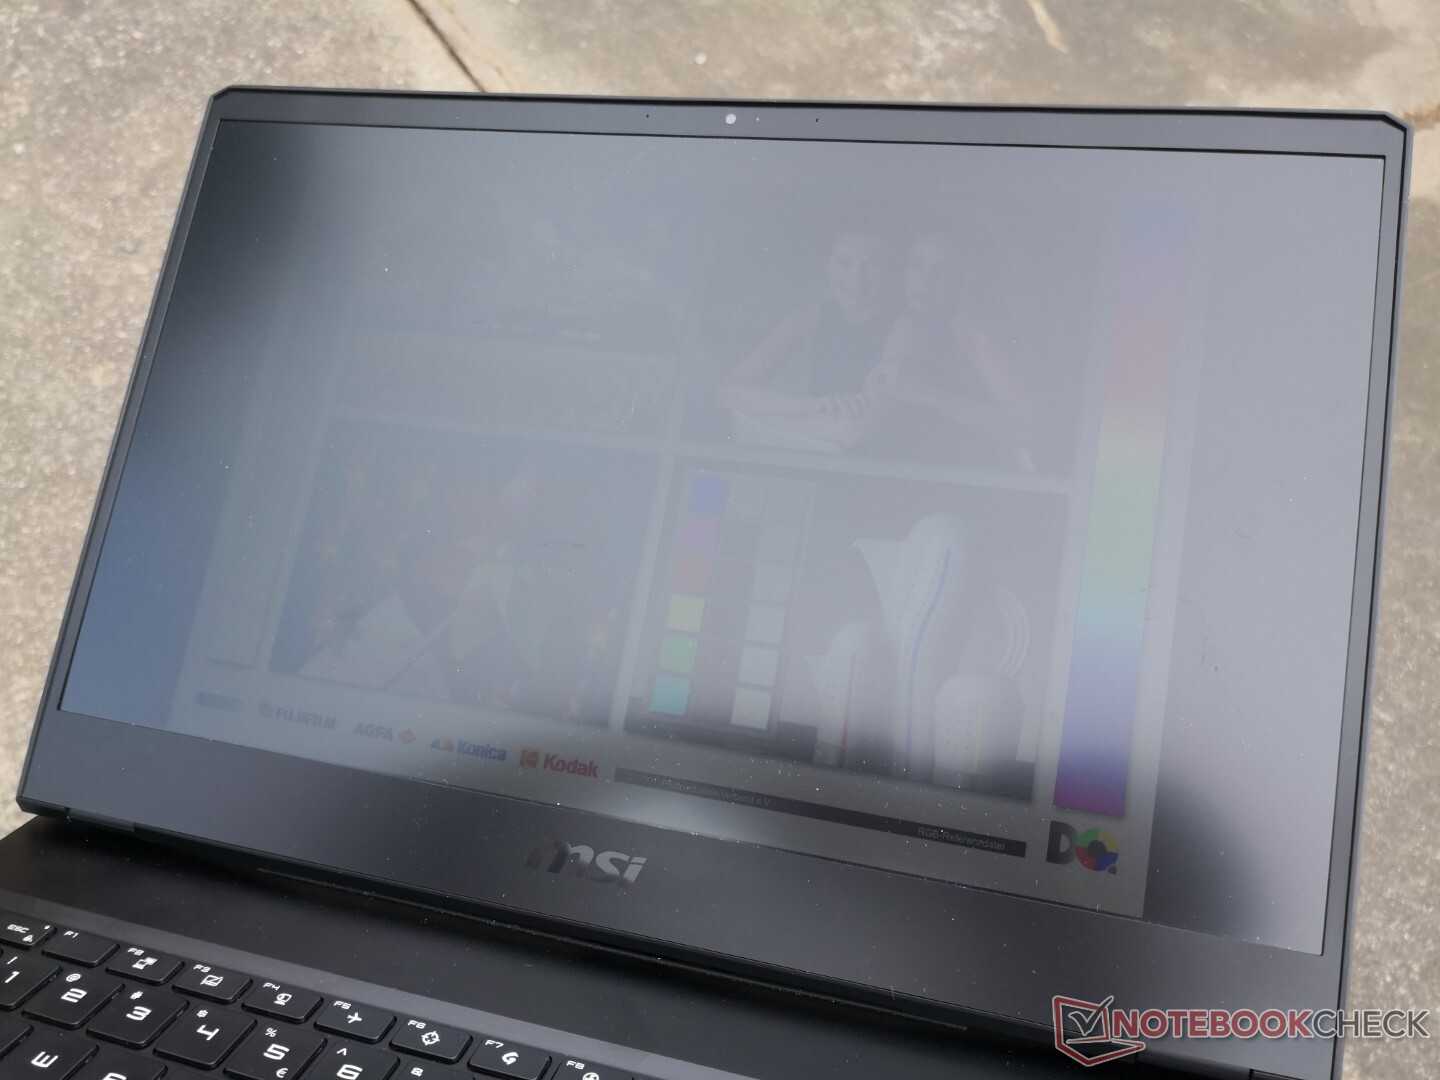
Uma diferença fundamental no visor GP66 quando comparado com os laptops acima mencionados é que ele é visivelmente mais escuro. O brilho máximo é de cerca de 210 lêndeas, enquanto a maioria dos outros laptops para jogos são 300 lêndeas ou mais brilhantes.
| |||||||||||||||||||||||||
iluminação: 83 %
iluminação com acumulador: 225.9 cd/m²
Contraste: 982:1 (Preto: 0.23 cd/m²)
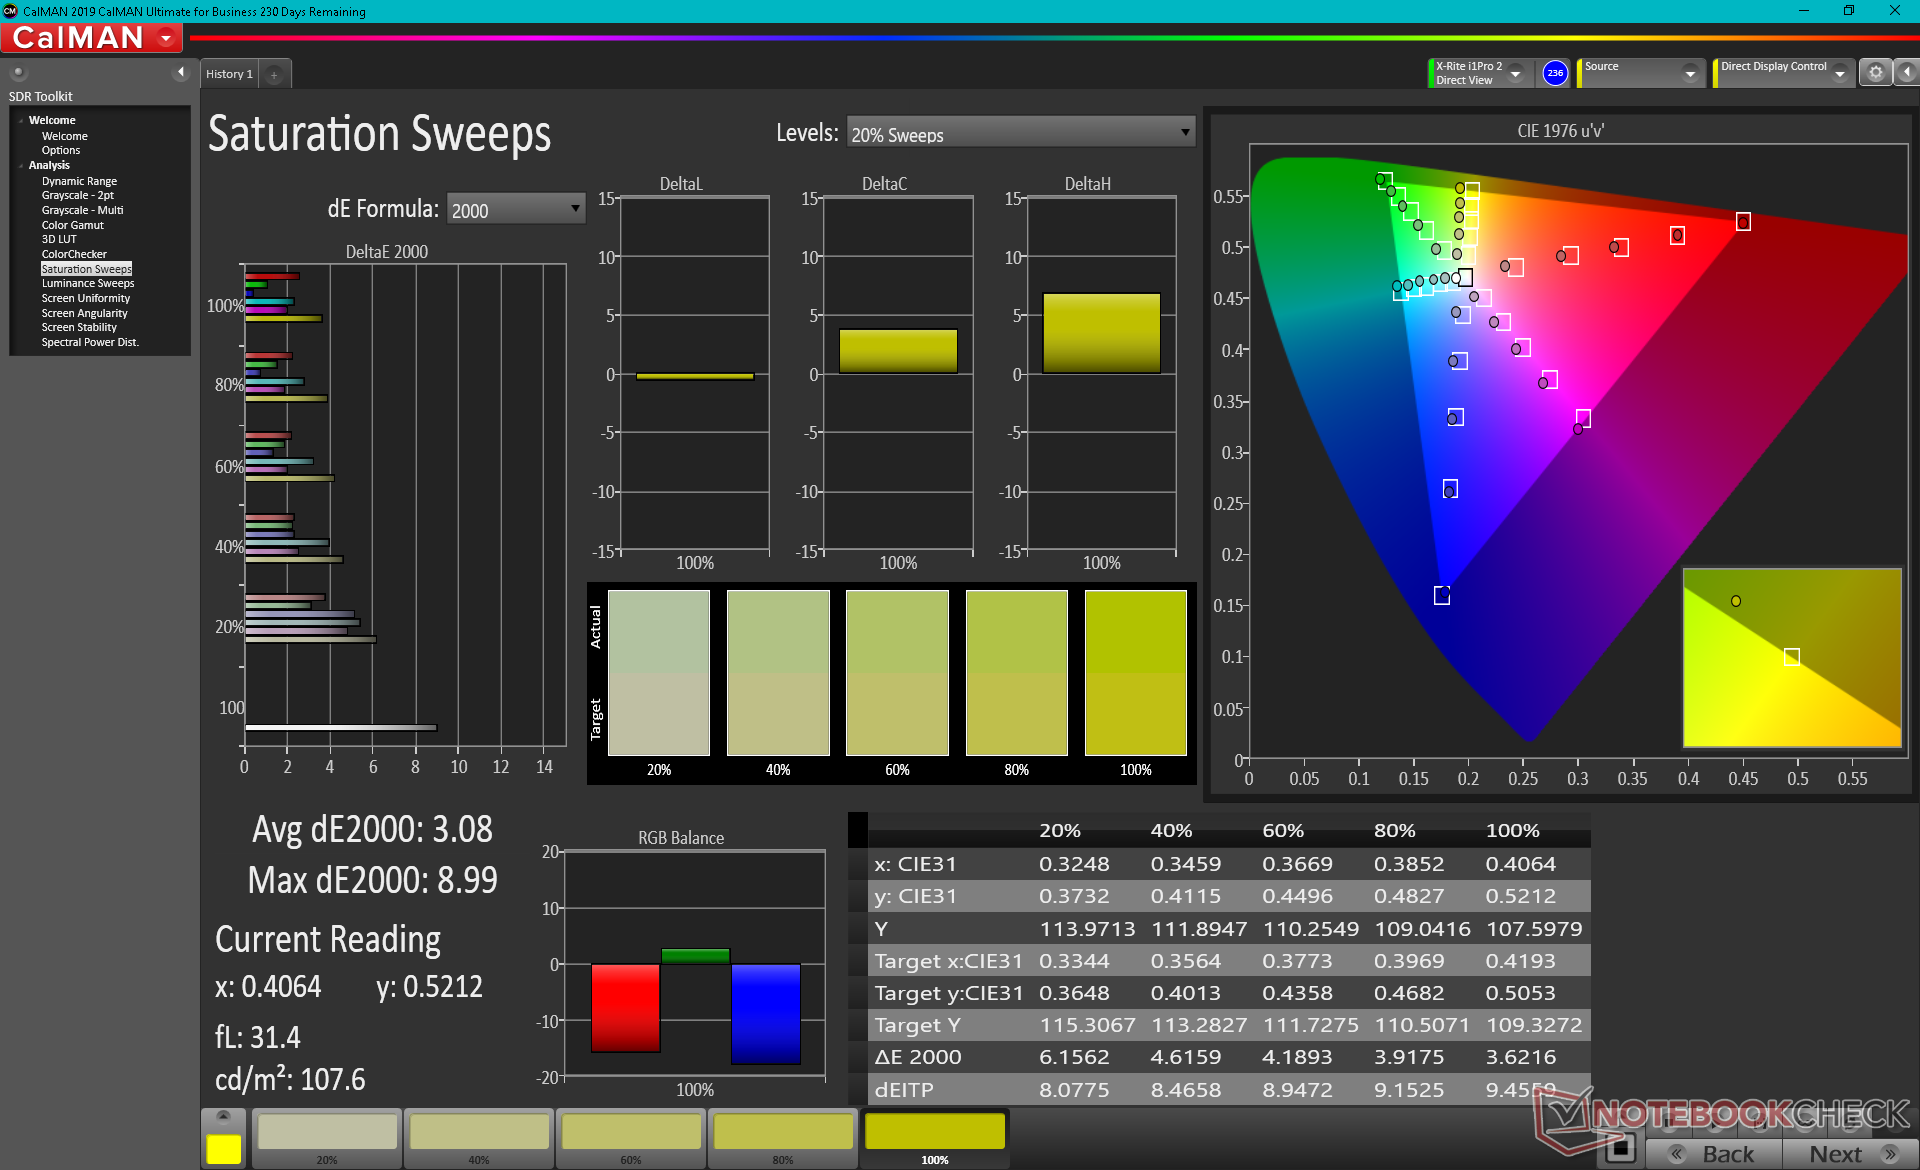
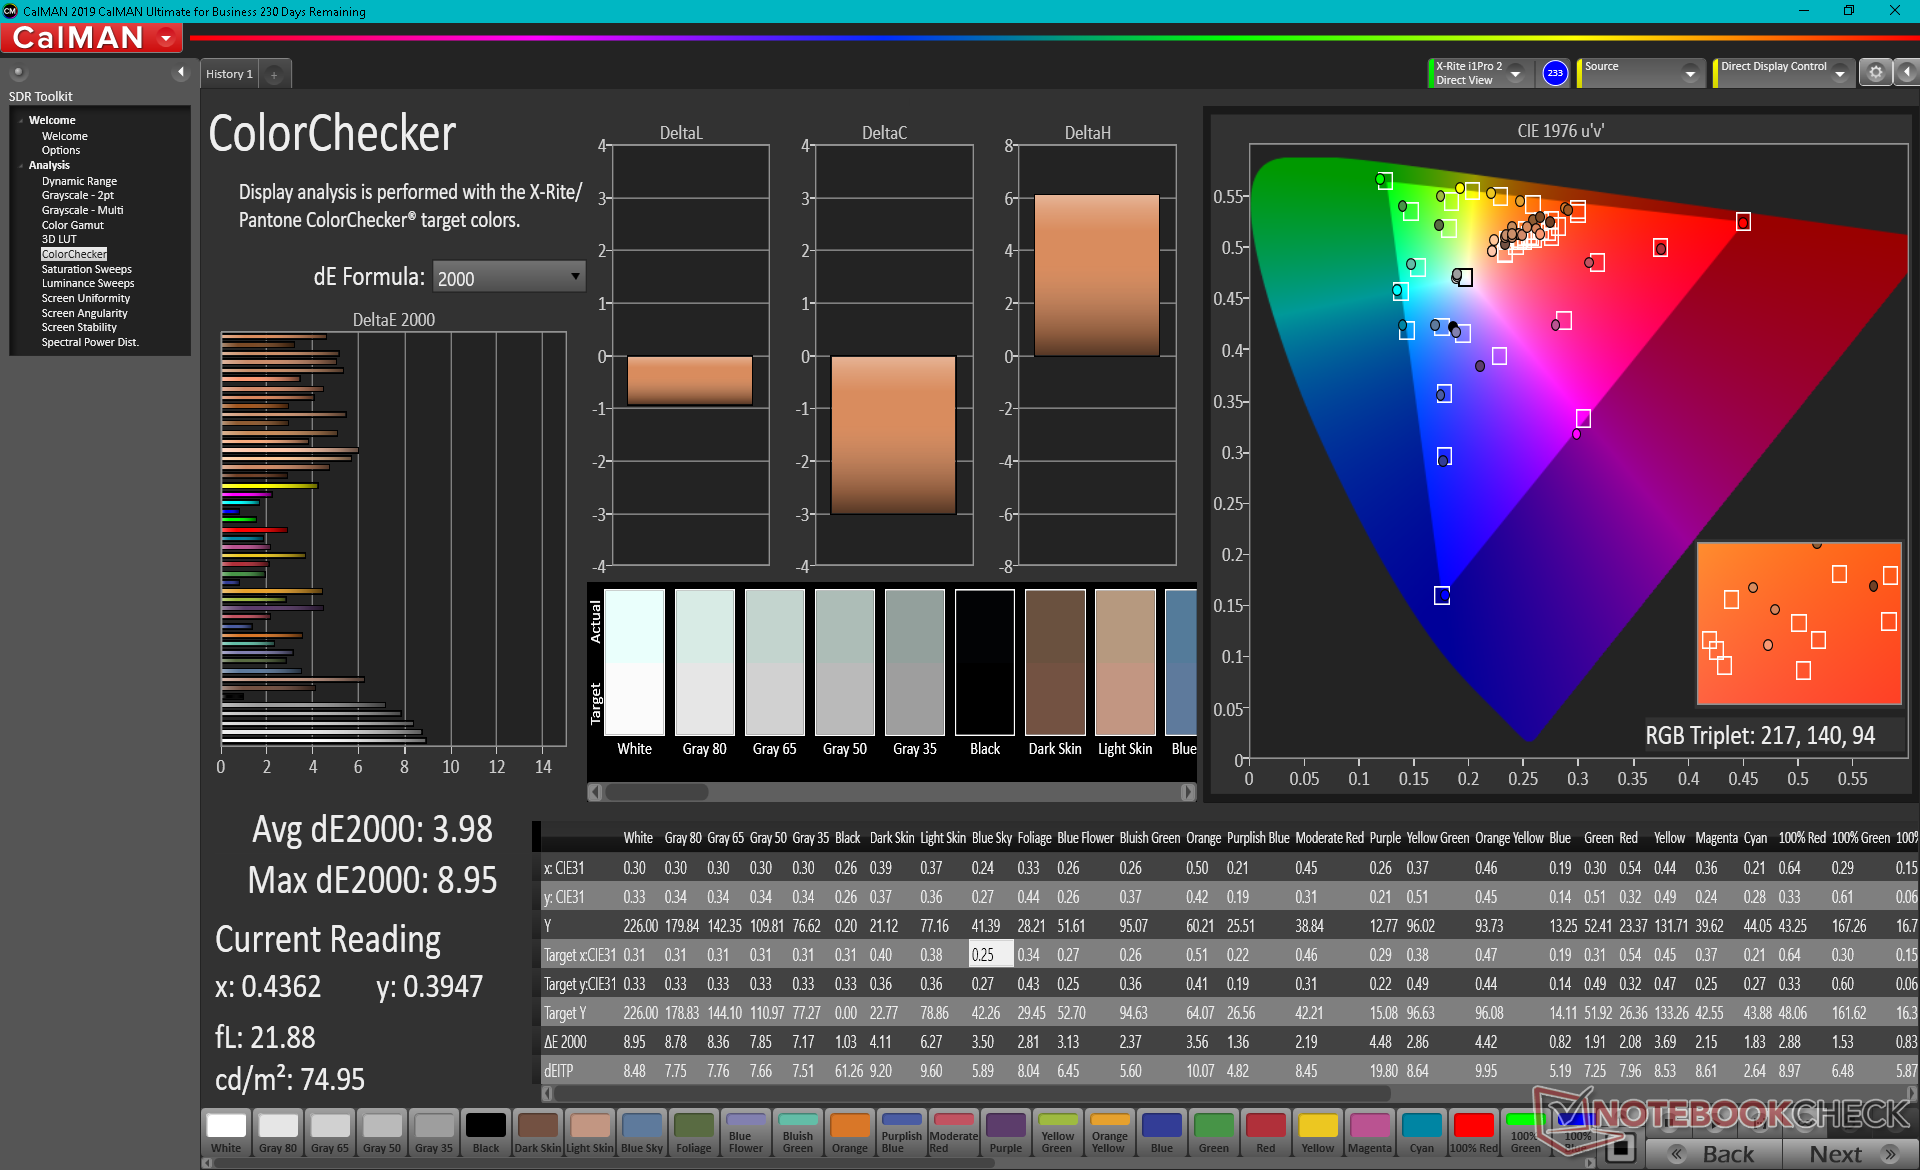
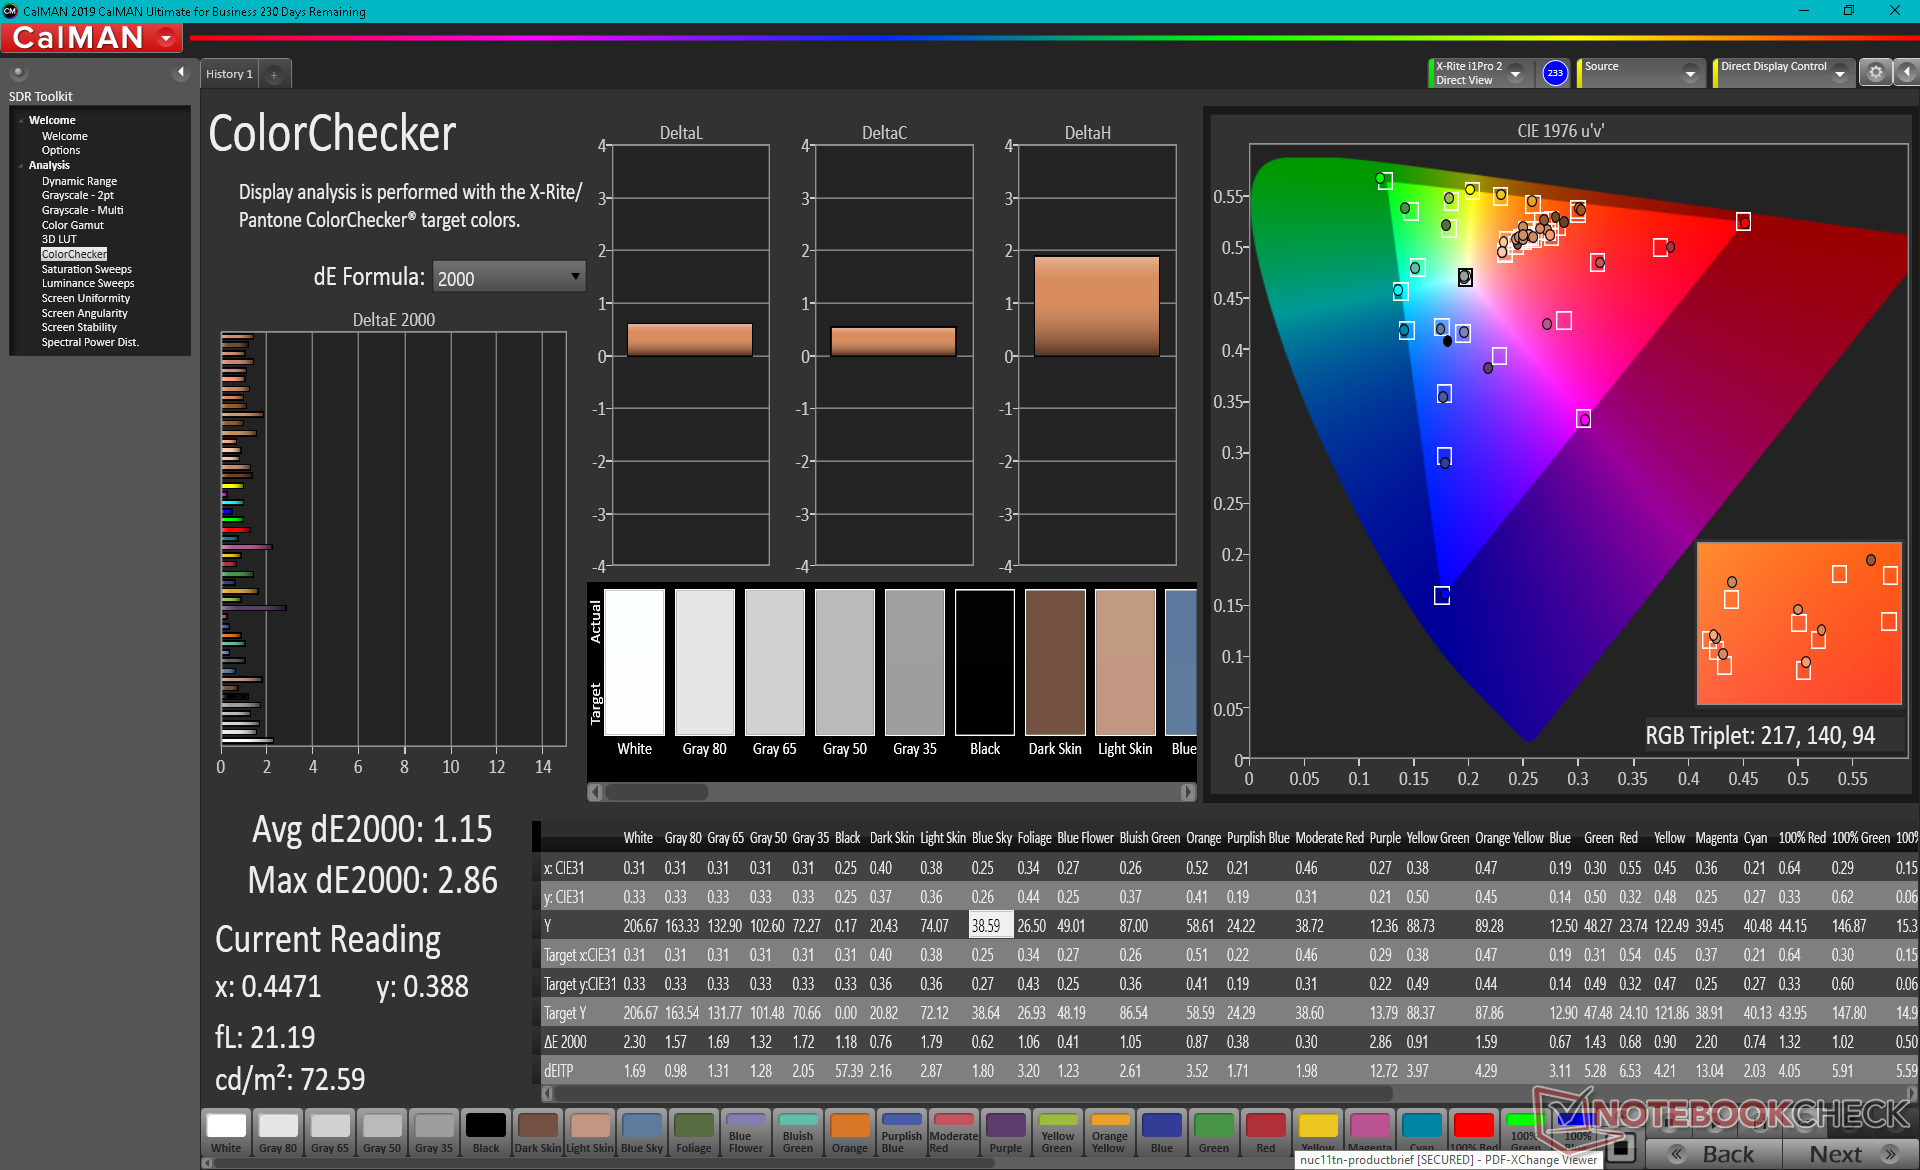
ΔE ColorChecker Calman: 3.98 | ∀{0.5-29.43 Ø4.71}
calibrated: 1.15
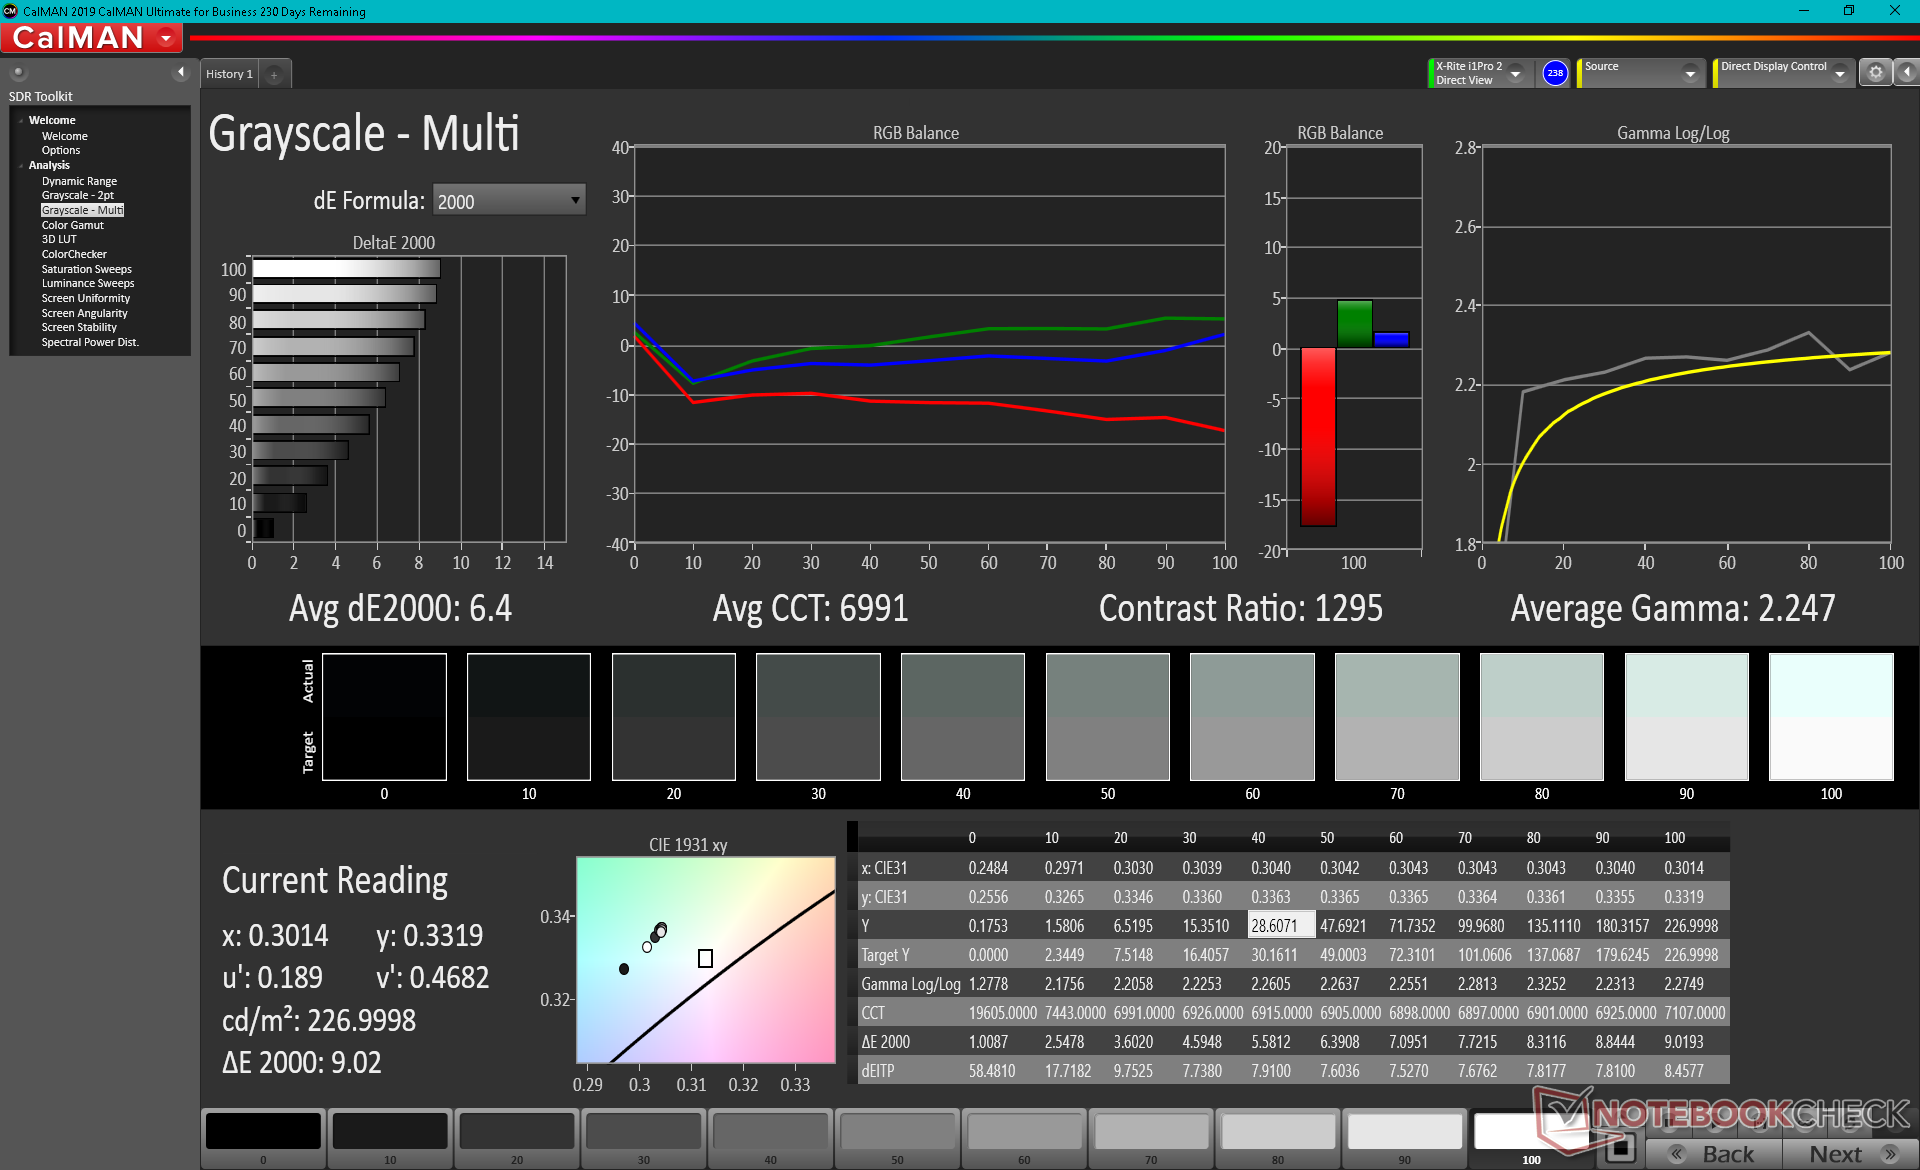
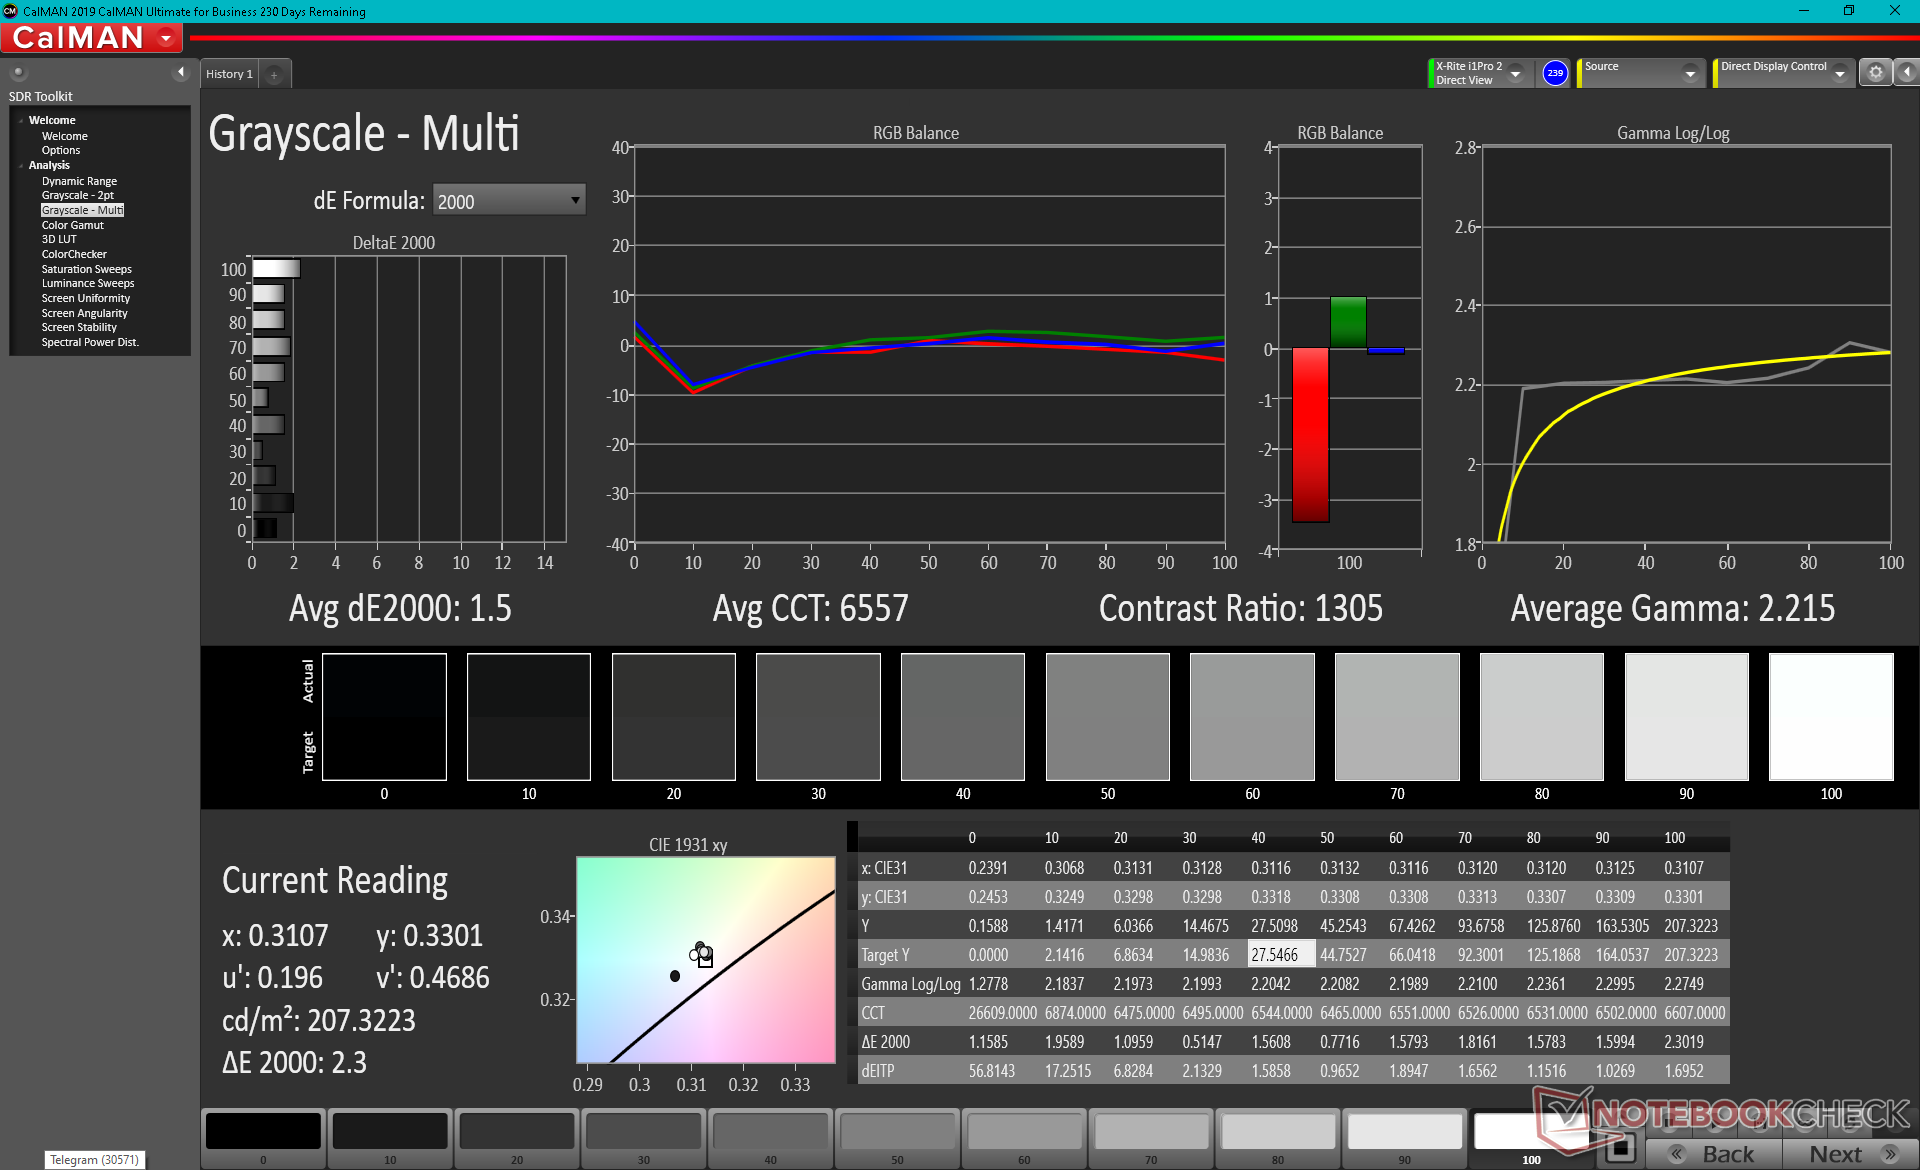
ΔE Greyscale Calman: 6.4 | ∀{0.09-98 Ø4.96}
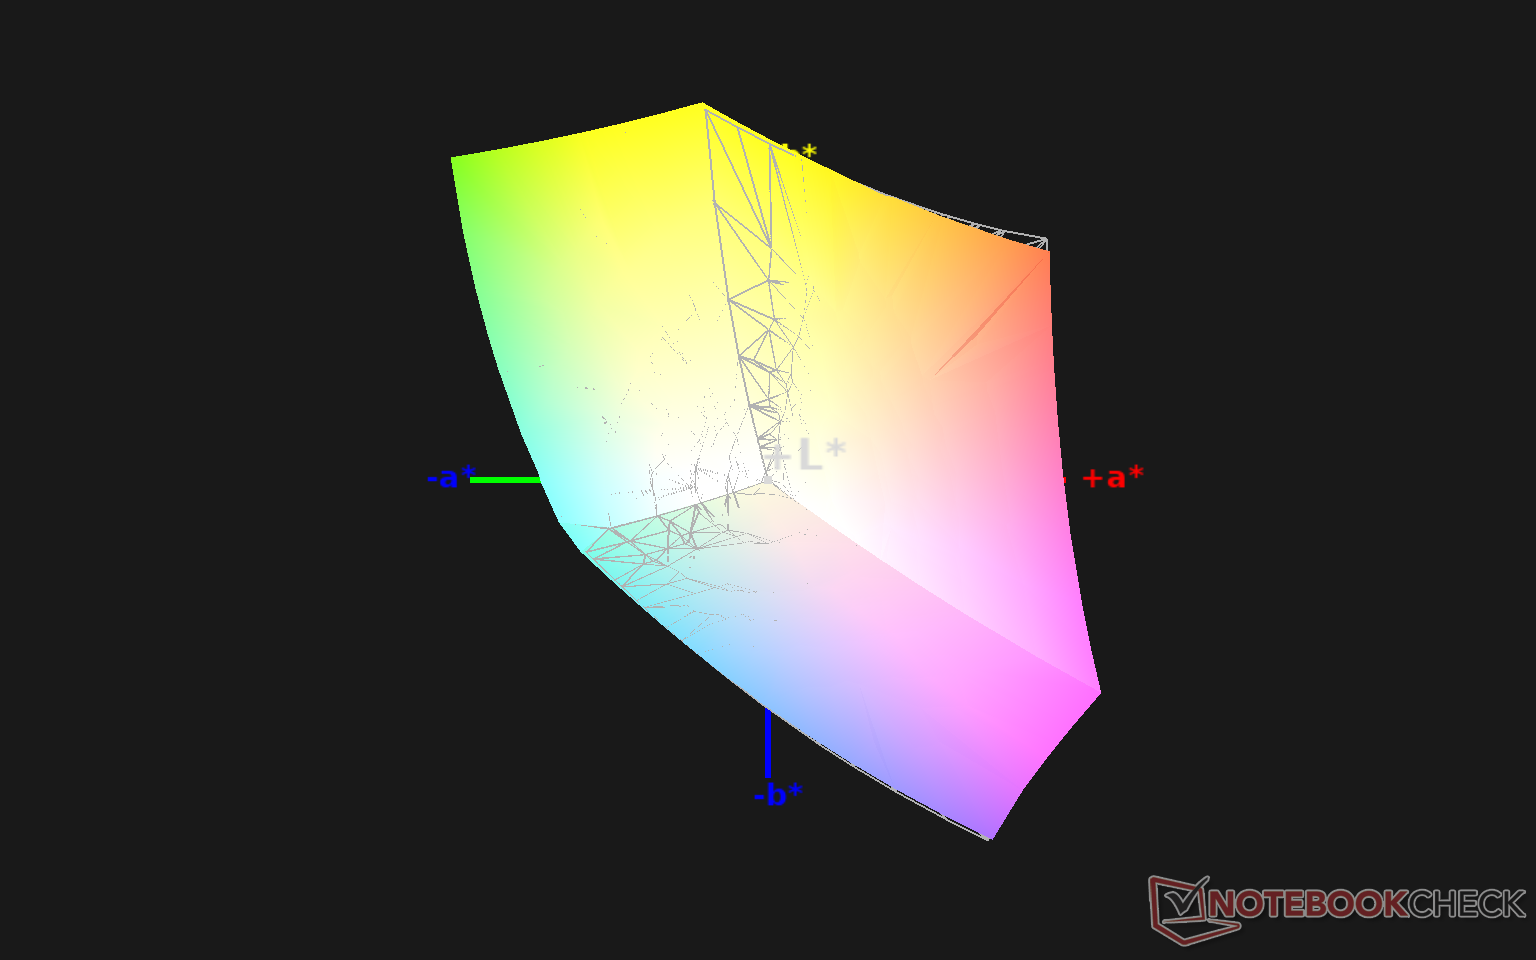
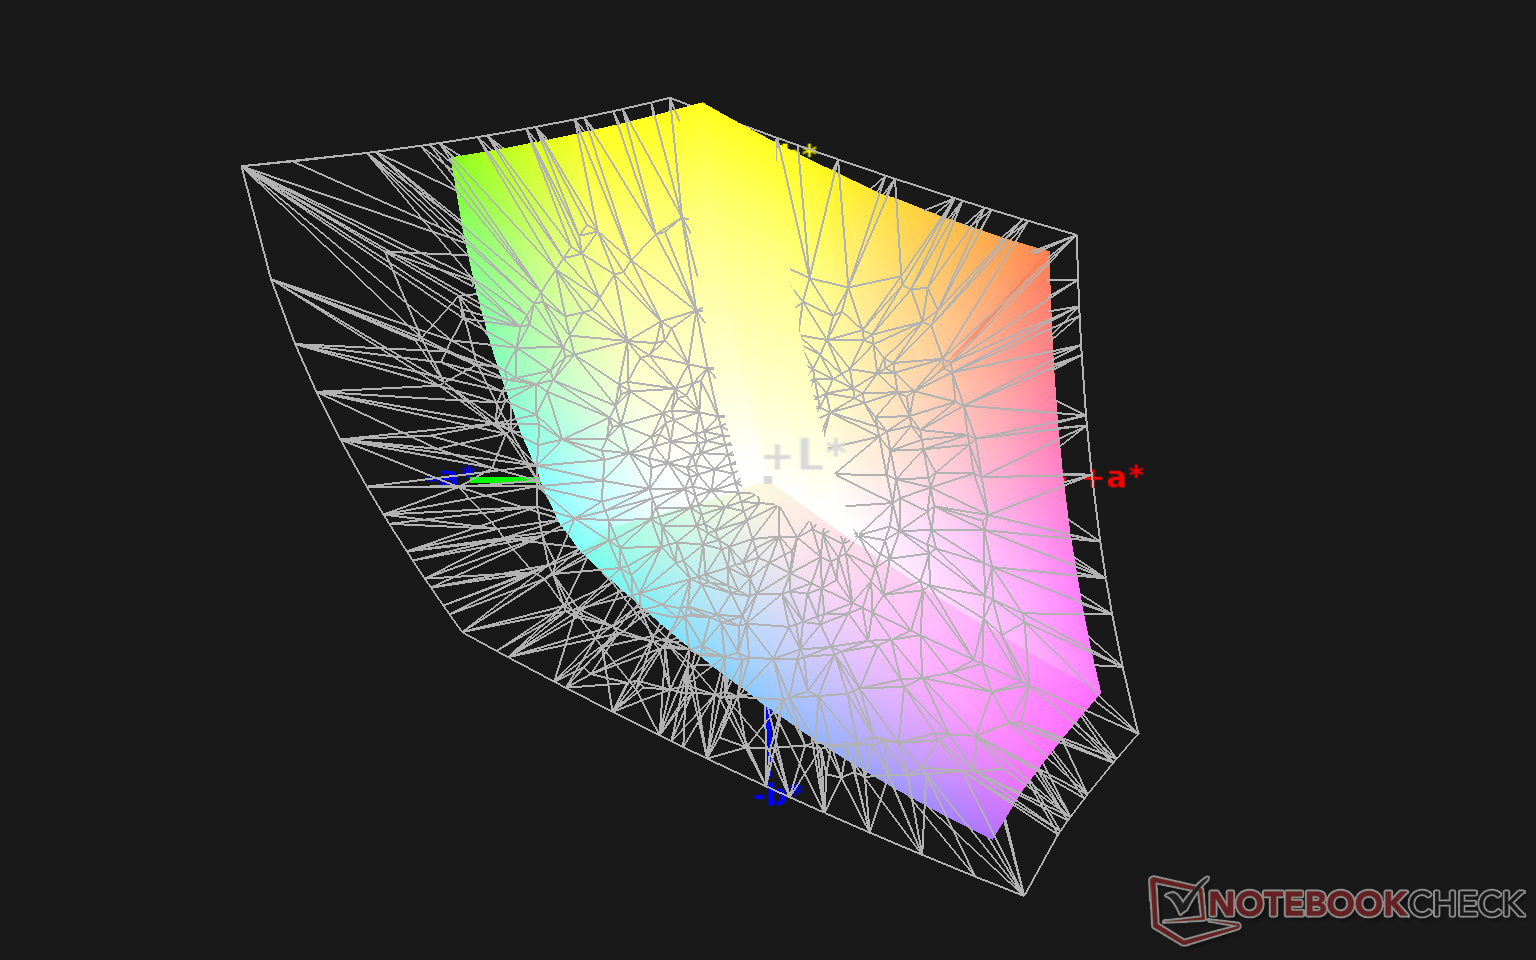
99.3% sRGB (Argyll 1.6.3 3D)
64.5% AdobeRGB 1998 (Argyll 1.6.3 3D)
70.4% AdobeRGB 1998 (Argyll 3D)
99.2% sRGB (Argyll 3D)
68.3% Display P3 (Argyll 3D)
Gamma: 2.25
CCT: 6991 K
| MSI GP66 Leopard 10UG Sharp LQ156M1JW03, IPS, 15.6", 1920x1080 | MSI GP65 10SFK-047US LG Philips LP156WFG-SPB3, IPS, 15.6", 1920x1080 | Alienware m15 R4 LG Philips LGD066E, IPS, 15.6", 1920x1080 | Aorus 15P XC Sharp LQ156M1JW03, IPS, 15.6", 1920x1080 | Asus ROG Zephyrus G15 GA503Q CMN N156KME-GNA (CMN152A), IPS-Level, 15.6", 2560x1440 | MSI GF65 Thin 10UE AU Optronics B156HAN08.4, IPS, 15.6", 1920x1080 | |
|---|---|---|---|---|---|---|
| Display | -7% | 1% | -2% | 22% | -44% | |
| Display P3 Coverage (%) | 68.3 | 63.5 -7% | 69.4 2% | 67.2 -2% | 97.3 42% | 37.65 -45% |
| sRGB Coverage (%) | 99.2 | 94.4 -5% | 99 0% | 98.7 -1% | 99.9 1% | 56.3 -43% |
| AdobeRGB 1998 Coverage (%) | 70.4 | 65.1 -8% | 70.5 0% | 68.6 -3% | 86.2 22% | 38.9 -45% |
| Response Times | -1% | 21% | 9% | 9% | -200% | |
| Response Time Grey 50% / Grey 80% * (ms) | 13.6 ? | 10.4 ? 24% | 7.4 ? 46% | 11.2 ? 18% | 8.8 ? 35% | 36.8 ? -171% |
| Response Time Black / White * (ms) | 9.6 ? | 12 ? -25% | 10 ? -4% | 9.6 ? -0% | 11.2 ? -17% | 31.6 ? -229% |
| PWM Frequency (Hz) | 23580 ? | 24040 ? | ||||
| Screen | -3% | 24% | 27% | 2% | -32% | |
| Brightness middle (cd/m²) | 225.9 | 384.9 70% | 333 47% | 298 32% | 327 45% | 266.5 18% |
| Brightness (cd/m²) | 211 | 358 70% | 303 44% | 278 32% | 309 46% | 262 24% |
| Brightness Distribution (%) | 83 | 87 5% | 86 4% | 88 6% | 89 7% | 91 10% |
| Black Level * (cd/m²) | 0.23 | 0.67 -191% | 0.29 -26% | 0.29 -26% | 0.33 -43% | 0.18 22% |
| Contrast (:1) | 982 | 574 -42% | 1148 17% | 1028 5% | 991 1% | 1481 51% |
| Colorchecker dE 2000 * | 3.98 | 2.43 39% | 1.8 55% | 0.96 76% | 4.49 -13% | 5.33 -34% |
| Colorchecker dE 2000 max. * | 8.95 | 4.58 49% | 4.49 50% | 3.22 64% | 8.42 6% | 18.28 -104% |
| Colorchecker dE 2000 calibrated * | 1.15 | 2.03 -77% | 1.13 2% | 0.83 28% | 2.27 -97% | 4.36 -279% |
| Greyscale dE 2000 * | 6.4 | 2.6 59% | 1.9 70% | 1.3 80% | 4.2 34% | 4.5 30% |
| Gamma | 2.25 98% | 2.2 100% | 2.265 97% | 2.242 98% | 2.173 101% | 2.35 94% |
| CCT | 6991 93% | 6981 93% | 6840 95% | 6519 100% | 7014 93% | 6289 103% |
| Color Space (Percent of AdobeRGB 1998) (%) | 64.5 | 59.7 -7% | 71 10% | 69 7% | 86 33% | 35.6 -45% |
| Color Space (Percent of sRGB) (%) | 99.3 | 93.9 -5% | 93 -6% | 91 -8% | 99 0% | 55.8 -44% |
| Média Total (Programa/Configurações) | -4% /
-3% | 15% /
19% | 11% /
19% | 11% /
6% | -92% /
-55% |
* ... menor é melhor
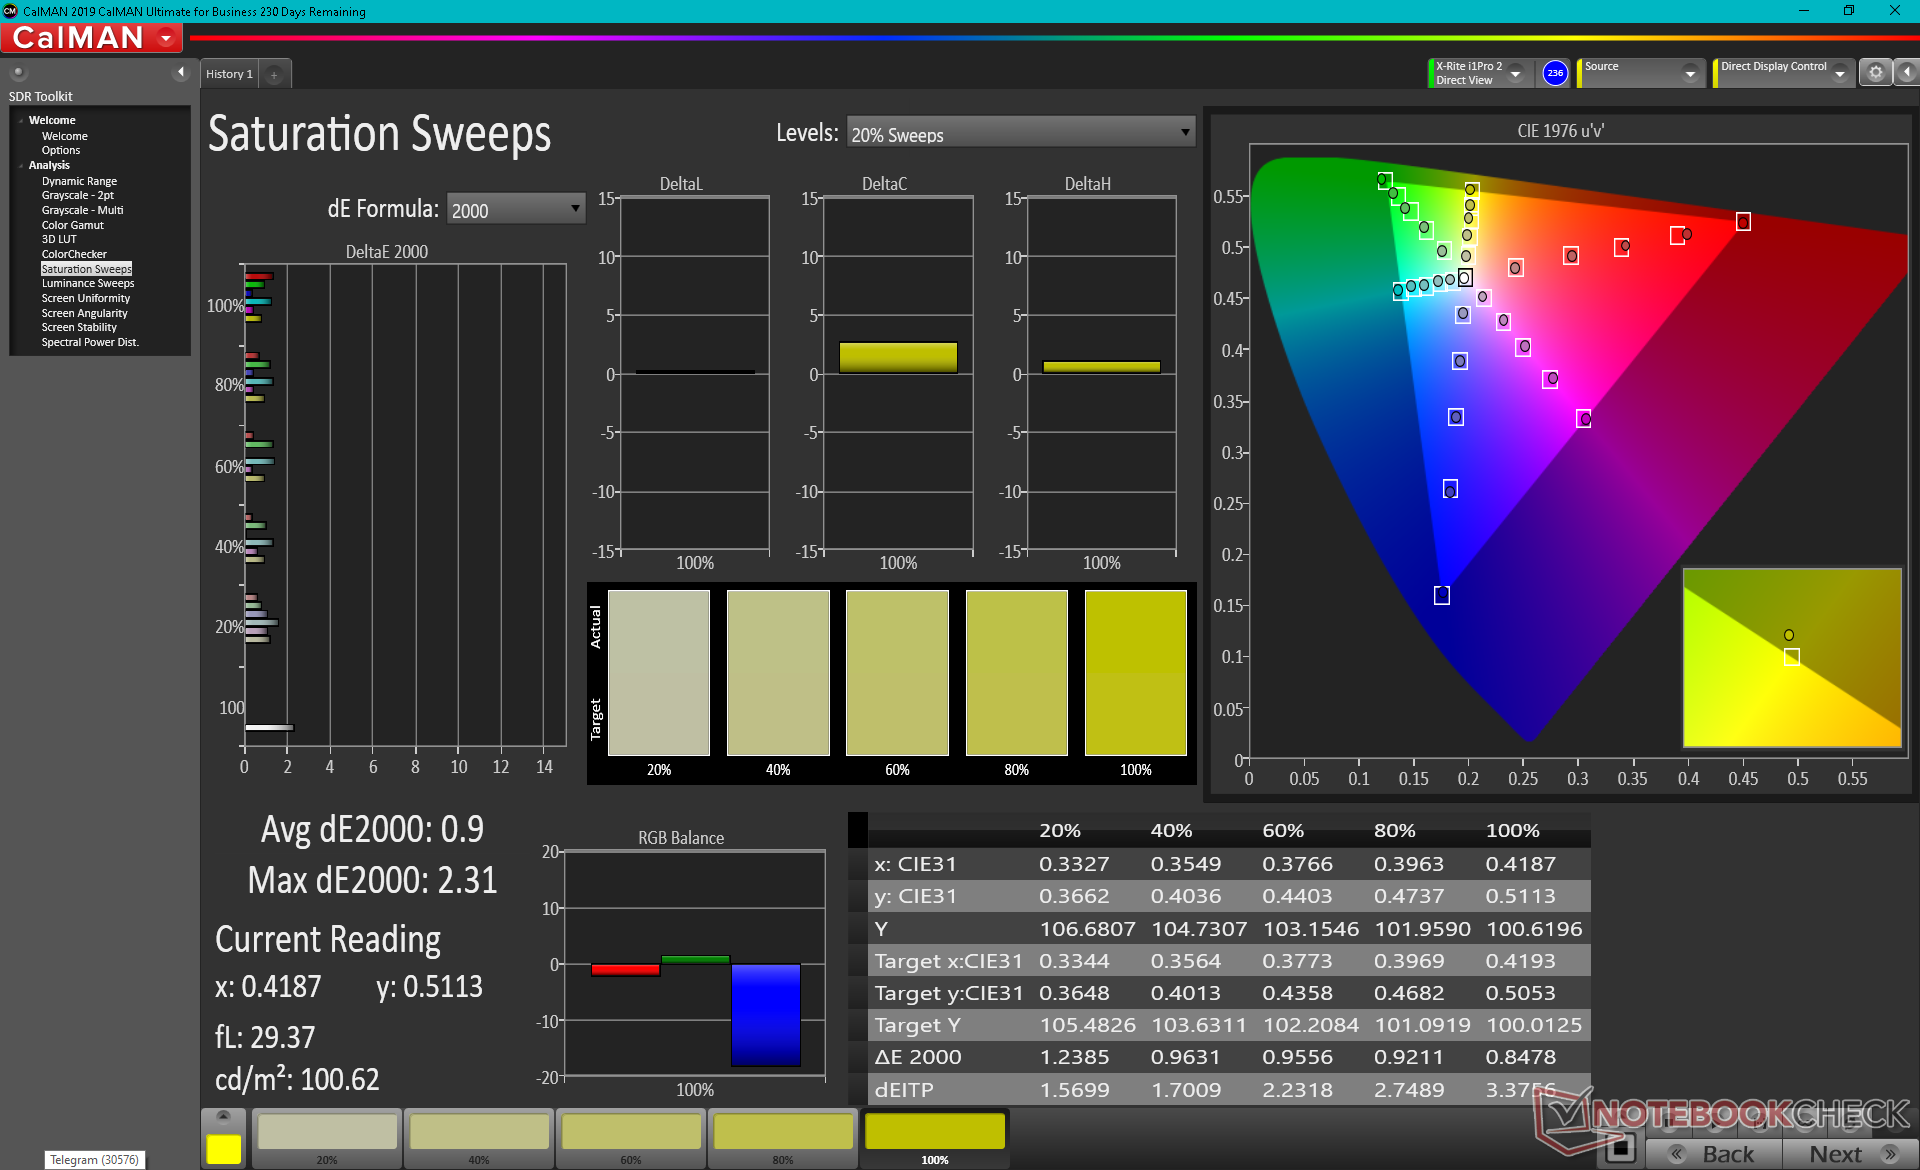
O espaço de cores cobre todo o sRGB para ser comparável à maioria dos laptops de jogos de alta qualidade. Estamos felizes que a MSI não esteja usando um desses painéis Panda baratos que normalmente têm cores muito mais pobres.
As medidas do colorímetro X-Rite mostram um display não calibrado fora da caixa, o que é de se esperar, uma vez que o GP66 não é um laptop laptop de jogos calibrado pela Pantone. A temperatura da cor é muito fria e a precisão da cor sofre como resultado. As cores melhoram significativamente uma vez devidamente calibradas com valores finais de escala de cinza e deltaE de cor de apenas 1,5 e 1,15, respectivamente. Recomendamos aplicar nosso perfil de ICM acima para obter o máximo do visor se você não tiver acesso a um colorímetro.
Exibir tempos de resposta
| ↔ Tempo de resposta preto para branco | ||
|---|---|---|
| 9.6 ms ... ascensão ↗ e queda ↘ combinadas | ↗ 5.2 ms ascensão | 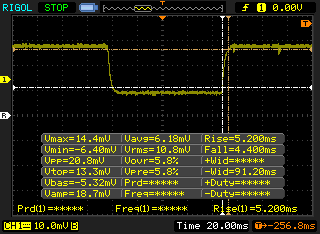 |
| ↘ 4.4 ms queda | ||
| A tela mostra taxas de resposta rápidas em nossos testes e deve ser adequada para jogos. Em comparação, todos os dispositivos testados variam de 0.1 (mínimo) a 240 (máximo) ms. » 26 % de todos os dispositivos são melhores. Isso significa que o tempo de resposta medido é melhor que a média de todos os dispositivos testados (19.8 ms). | ||
| ↔ Tempo de resposta 50% cinza a 80% cinza | ||
| 13.6 ms ... ascensão ↗ e queda ↘ combinadas | ↗ 7.6 ms ascensão | 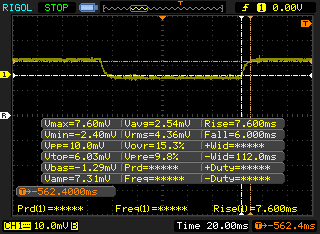 |
| ↘ 6 ms queda | ||
| A tela mostra boas taxas de resposta em nossos testes, mas pode ser muito lenta para jogadores competitivos. Em comparação, todos os dispositivos testados variam de 0.165 (mínimo) a 636 (máximo) ms. » 27 % de todos os dispositivos são melhores. Isso significa que o tempo de resposta medido é melhor que a média de todos os dispositivos testados (30.9 ms). | ||
Cintilação da tela / PWM (modulação por largura de pulso)
| Tela tremeluzindo/PWM detectado | 23580 Hz | ≤ 34 % configuração de brilho | 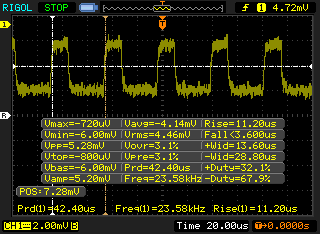 |
A luz de fundo da tela pisca em 23580 Hz (pior caso, por exemplo, utilizando PWM) Cintilação detectada em uma configuração de brilho de 34 % e abaixo. Não deve haver cintilação ou PWM acima desta configuração de brilho. A frequência de 23580 Hz é bastante alta, então a maioria dos usuários sensíveis ao PWM não deve notar nenhuma oscilação. [pwm_comparison] Em comparação: 52 % de todos os dispositivos testados não usam PWM para escurecer a tela. Se PWM foi detectado, uma média de 7748 (mínimo: 5 - máximo: 343500) Hz foi medida. | |||
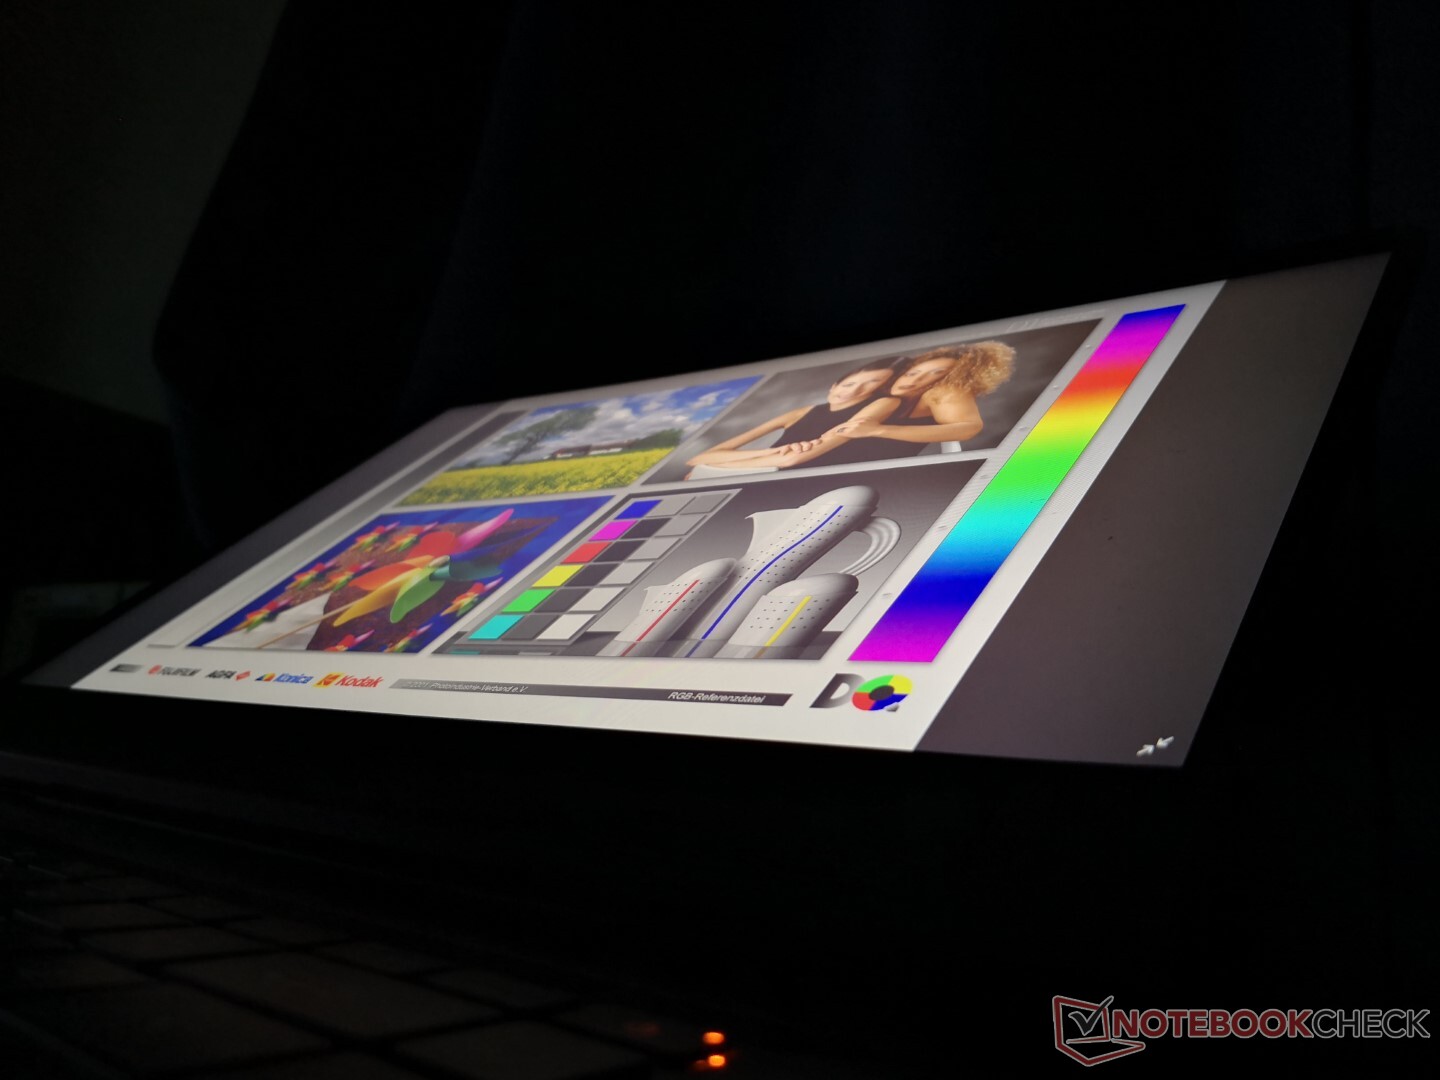
A visibilidade ao ar livre é fraca, pois o visor não é tão brilhante. O brilho é perceptível na maioria das condições e mesmo que pudesse ser reduzido, o conteúdo da tela aparecerá lavado de qualquer forma.
Desempenho
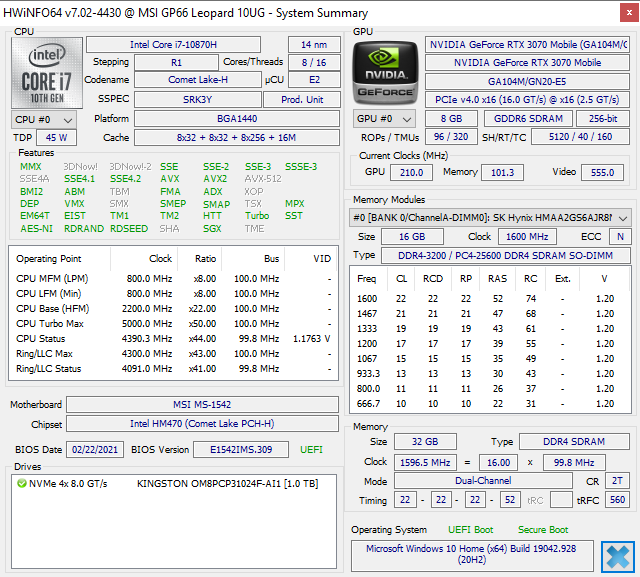
A MSI está oferecendo apenas as opções Comet Lake-H Core i7-10870H e Core i7-10875H do 10º gênero no momento, sem mais nada. Entretanto, teríamos ficado bem com apenas uma dessas opções apenas, pois quaisquer diferenças entre o i7-10870H e o i7-10875H são incrivelmente pequenas. Os usuários terão que olhar para as opções mais baratas Bravo ou Alfa série para opções AMD.
Os gráficos variam de GeForce RTX 3060 a 3080 a 130 W TGP cada um. Tanto a comutação automática como manual dos gráficos estão disponíveis através do software Dragon Center. Recomendamos aos proprietários que se familiarizem com o Dragon Center, pois as principais características são comutadas aqui.
Tínhamos definido nossa unidade para o modo Extreme Performance com a GPU Nvidia ativa antes de executar quaisquer benchmarks de performance abaixo.
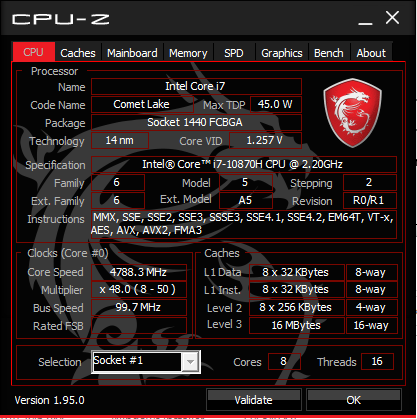
Processador
O desempenho da CPU é excelente com a sustentabilidade decente do Turbo Boost, conforme demonstrado pelos resultados de nosso loop do CineBench R15 xT abaixo. O desempenho é ainda tão rápido quanto o mais caro Núcleo i9-10980HK no Alienware m15 R4. Diferenças entre os Núcleo i7-10875H e Núcleo i7-10870H estão dentro de apenas alguns pontos percentuais.
Cinebench R15: CPU Multi 64Bit | CPU Single 64Bit
Blender: v2.79 BMW27 CPU
7-Zip 18.03: 7z b 4 -mmt1 | 7z b 4
Geekbench 5.5: Single-Core | Multi-Core
HWBOT x265 Benchmark v2.2: 4k Preset
LibreOffice : 20 Documents To PDF
R Benchmark 2.5: Overall mean
| LibreOffice / 20 Documents To PDF | |
| HP Pavilion Gaming 15-ec1206ng | |
| Schenker XMG Core 15 Ampere | |
| Média Intel Core i7-10870H (46 - 64.4, n=12) | |
| Alienware m15 R4 | |
| MSI GP66 Leopard 10UG | |
| Razer Blade 15 Base Edition 2021, i7-10750H RTX 3060 | |
| Asus Zephyrus S15 GX502L | |
| MSI GT76 Titan DT 10SGS | |
| Asus ROG Zephyrus Duo 15 SE GX551QS | |
* ... menor é melhor
Desempenho do sistema
Os resultados da PCMark estão onde esperamos que sejam relativos a outros laptops com a mesma CPU e GPU. As pontuações são consistentemente mais altas do que o GP65 exceto no benchmark Essentials, provavelmente devido ao SSD NVMe mais lento em nossa unidade de teste GP66.
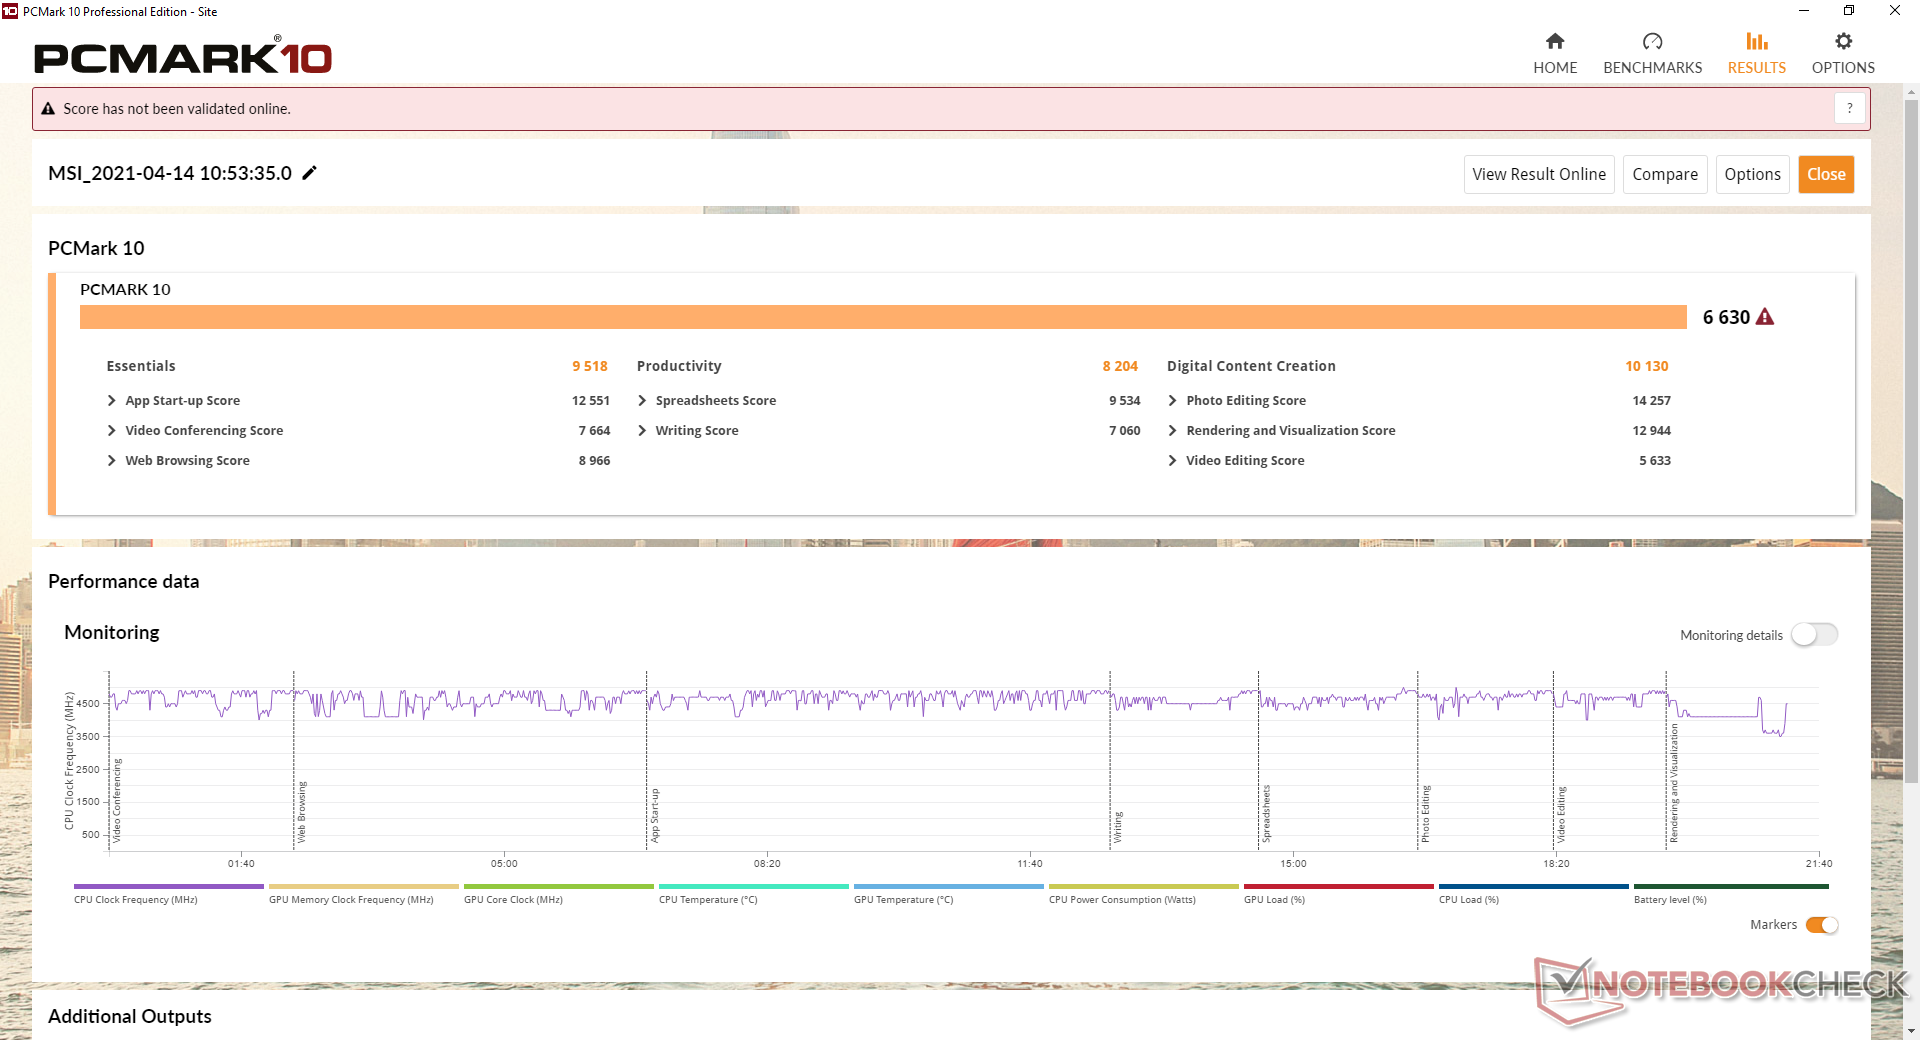
| PCMark 10 Score | 6630 pontos | |
Ajuda | ||
Latência do DPC
LatencyMon não mostra problemas de latência DPC ao abrir várias abas do navegador em nossa página inicial. A reprodução de vídeo de 4K a 60 FPS é suave e sem queda de quadros, como seria de esperar de qualquer laptop de jogos.
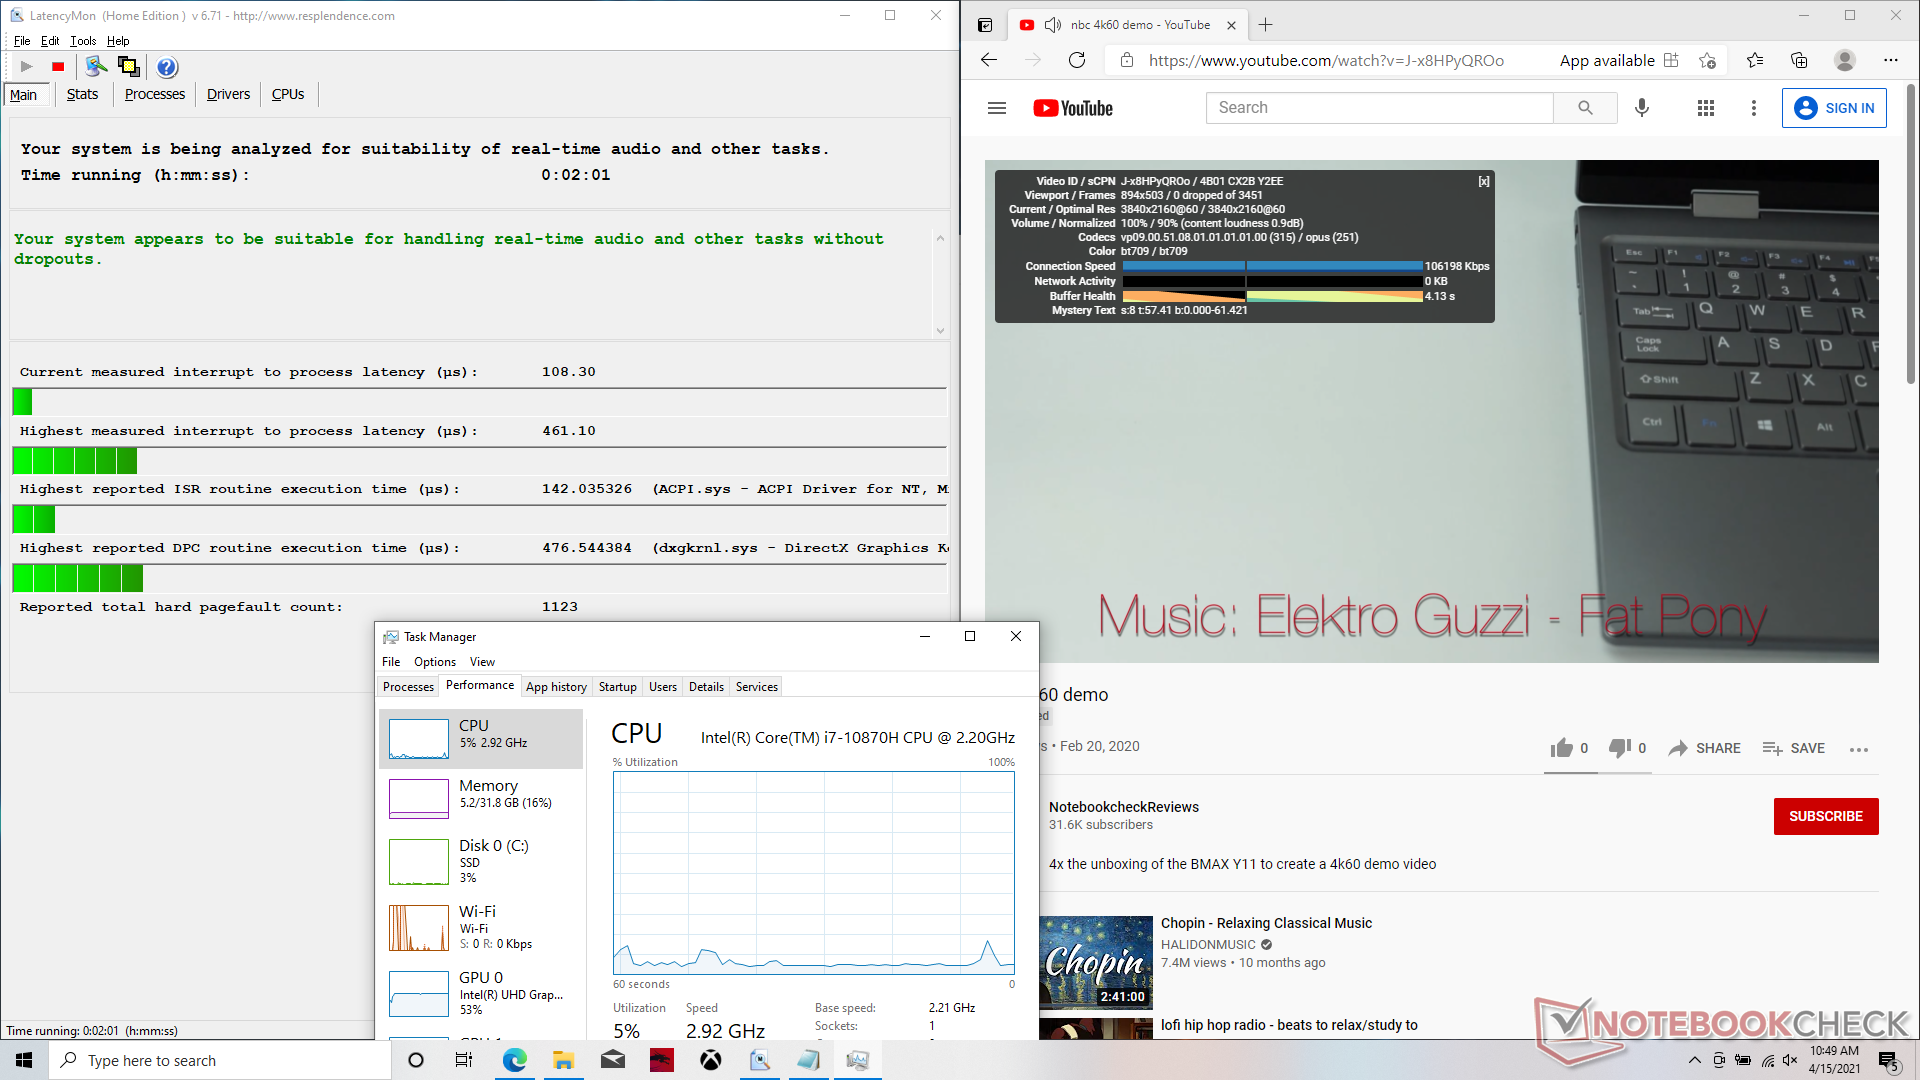
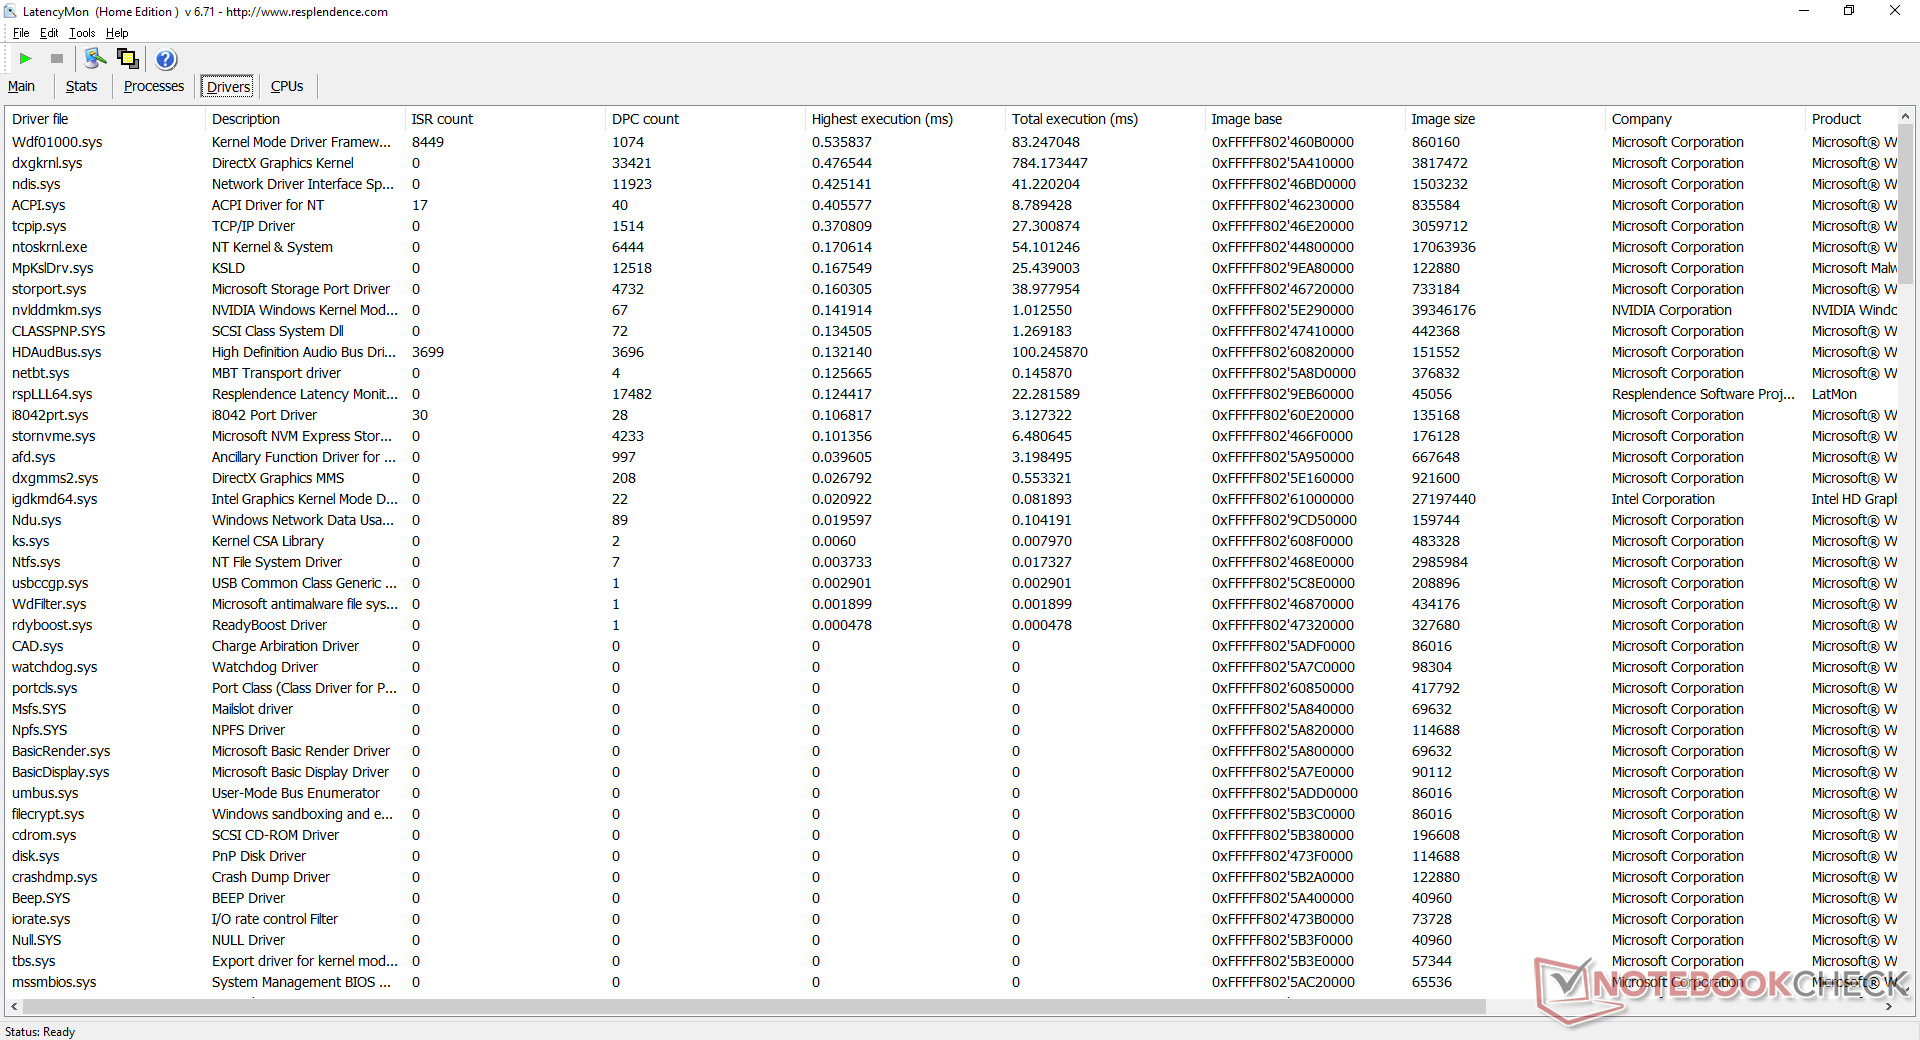
| DPC Latencies / LatencyMon - interrupt to process latency (max), Web, Youtube, Prime95 | |
| Alienware m15 R4 | |
| Aorus 15P XC | |
| MSI GP65 10SFK-047US | |
| MSI GF65 Thin 10UE | |
| MSI GP66 Leopard 10UG | |
| Asus ROG Zephyrus G15 GA503Q | |
* ... menor é melhor
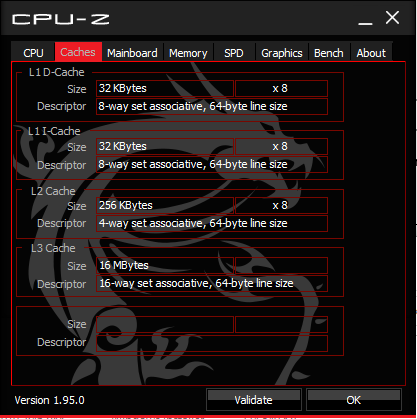
Dispositivos de armazenamento
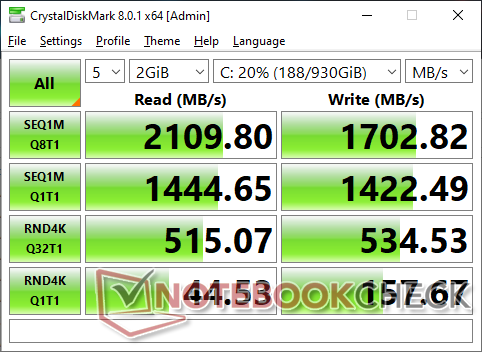
Enquanto o GP65 pode suportar até três drives internos (2x M.2, 1x SATA III de 2,5 polegadas), o GP66 pode suportar até 2x drives M.2 somente. O 1 TB Kingston OM8PCP31024F em nossa unidade é um drive NVMe de médio alcance que é mais lento que o Samsung PM981 e o Micron 2300
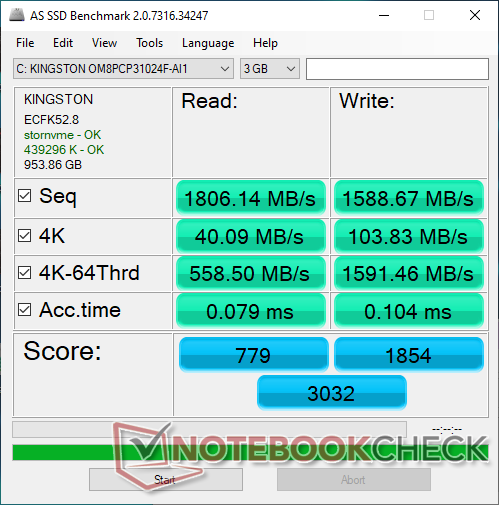
| MSI GP66 Leopard 10UG Kingston OM8PCP31024F | MSI GP65 10SFK-047US Samsung SSD PM981 MZVLB1T0HALR | Alienware m15 R4 Micron 2300 1TB MTFDHBA1T0TDV | Aorus 15P XC ESR512GTLCG-EAC-4 | Asus ROG Zephyrus G15 GA503Q SK Hynix HFM001TD3JX013N | MSI GF65 Thin 10UE Samsung SSD PM981 MZVLB1T0HALR | |
|---|---|---|---|---|---|---|
| AS SSD | 50% | 38% | 45% | 58% | 50% | |
| Seq Read (MB/s) | 1806 | 2066 14% | 2658 47% | 2694 49% | 2950 63% | 3002 66% |
| Seq Write (MB/s) | 1589 | 2418 52% | 2769 74% | 2327 46% | 1600 1% | 2420 52% |
| 4K Read (MB/s) | 40.09 | 54.2 35% | 46.07 15% | 47.77 19% | 53.6 34% | 48.46 21% |
| 4K Write (MB/s) | 103.8 | 129 24% | 87.2 -16% | 98.8 -5% | 126.8 22% | 114.3 10% |
| 4K-64 Read (MB/s) | 559 | 1865 234% | 1372 145% | 1746 212% | 1429 156% | 1873 235% |
| 4K-64 Write (MB/s) | 1591 | 1878 18% | 1247 -22% | 2267 42% | 2177 37% | 1882 18% |
| Access Time Read * (ms) | 0.079 | 0.042 47% | 0.052 34% | 0.079 -0% | 0.064 19% | 0.045 43% |
| Access Time Write * (ms) | 0.104 | 0.091 12% | 0.098 6% | 0.039 62% | 0.029 72% | 0.101 3% |
| Score Read (Points) | 779 | 2126 173% | 1684 116% | 2063 165% | 1778 128% | 2221 185% |
| Score Write (Points) | 1854 | 2249 21% | 1611 -13% | 2598 40% | 2464 33% | 2238 21% |
| Score Total (Points) | 3032 | 5482 81% | 4166 37% | 5698 88% | 5090 68% | 5565 84% |
| Copy ISO MB/s (MB/s) | 2674 | 2927 9% | 1877 -30% | 2421 -9% | ||
| Copy Program MB/s (MB/s) | 895 | 728 -19% | 555 -38% | 705 -21% | ||
| Copy Game MB/s (MB/s) | 1596 | 1614 1% | 1201 -25% | 1490 -7% | ||
| CrystalDiskMark 5.2 / 6 | 31% | 41% | 28% | 42% | 30% | |
| Write 4K (MB/s) | 153.2 | 145 -5% | 93.7 -39% | 130.2 -15% | 156.4 2% | 157.3 3% |
| Read 4K (MB/s) | 43.98 | 46.84 7% | 48.1 9% | 45.47 3% | 66.7 52% | 46.69 6% |
| Write Seq (MB/s) | 1527 | 2377 56% | 2785 82% | 2269 49% | 2318 52% | 2389 56% |
| Read Seq (MB/s) | 1112 | 2185 96% | 2598 134% | 1643 48% | 2151 93% | 2196 97% |
| Write 4K Q32T1 (MB/s) | 520 | 463.5 -11% | 481.9 -7% | 547 5% | 525 1% | 407.6 -22% |
| Read 4K Q32T1 (MB/s) | 516 | 527 2% | 521 1% | 654 27% | 452.1 -12% | 519 1% |
| Write Seq Q32T1 (MB/s) | 1697 | 2395 41% | 3362 98% | 2512 48% | 3055 80% | 2401 41% |
| Read Seq Q32T1 (MB/s) | 2110 | 3470 64% | 3200 52% | 3382 60% | 3607 71% | 3344 58% |
| Média Total (Programa/Configurações) | 41% /
43% | 40% /
40% | 37% /
39% | 50% /
51% | 40% /
43% |
* ... menor é melhor

Disk Throttling: DiskSpd Read Loop, Queue Depth 8
Desempenho da GPU
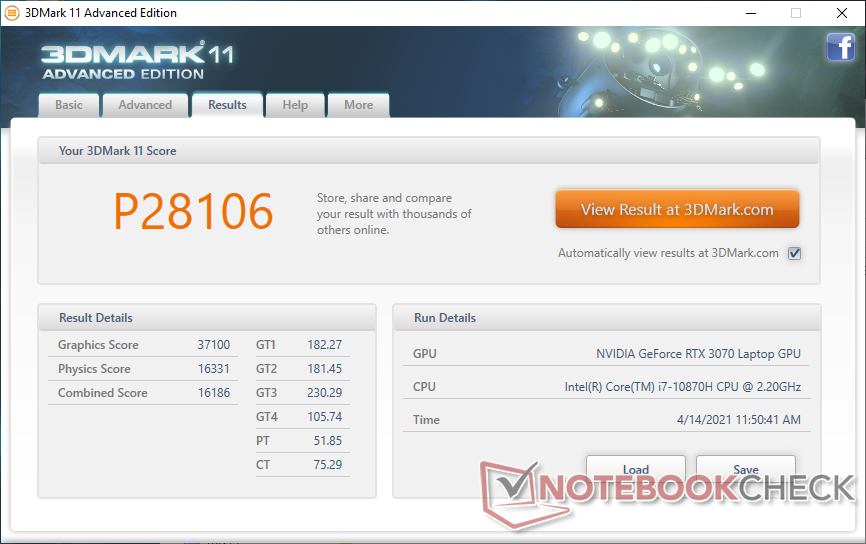
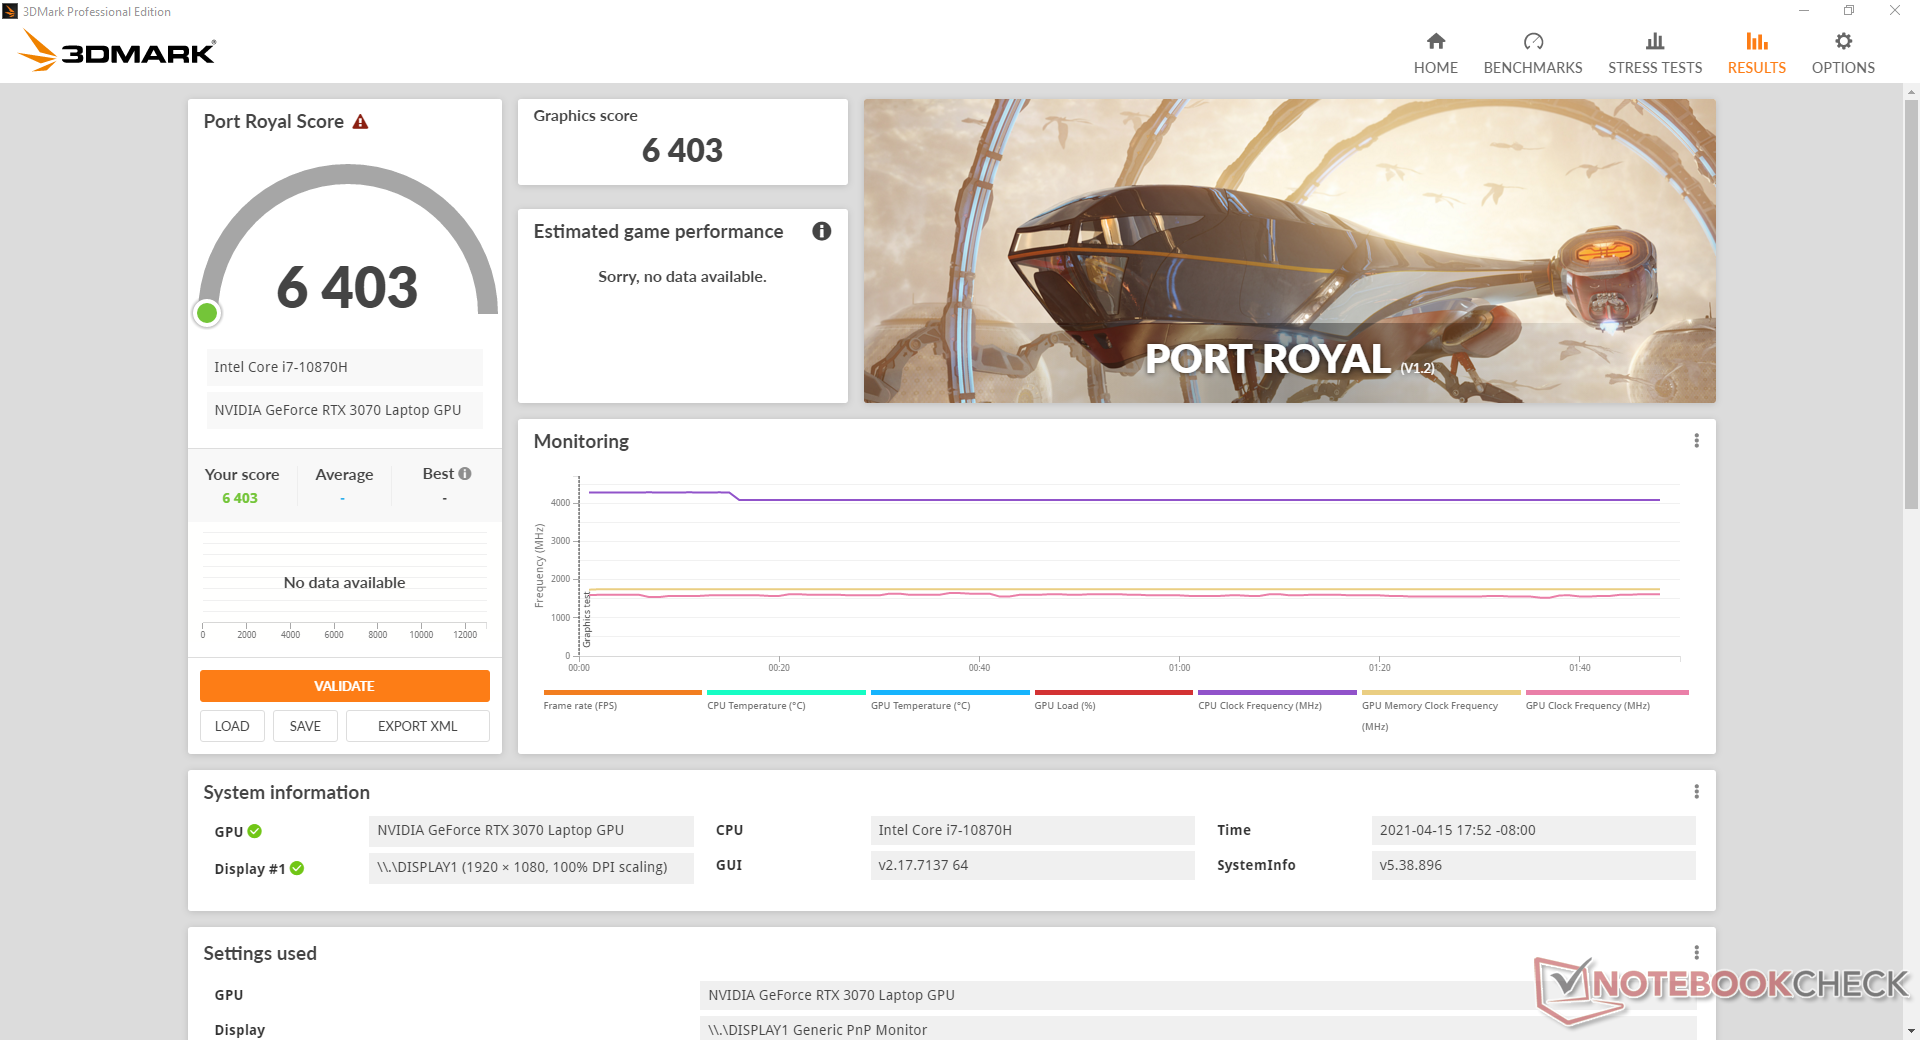
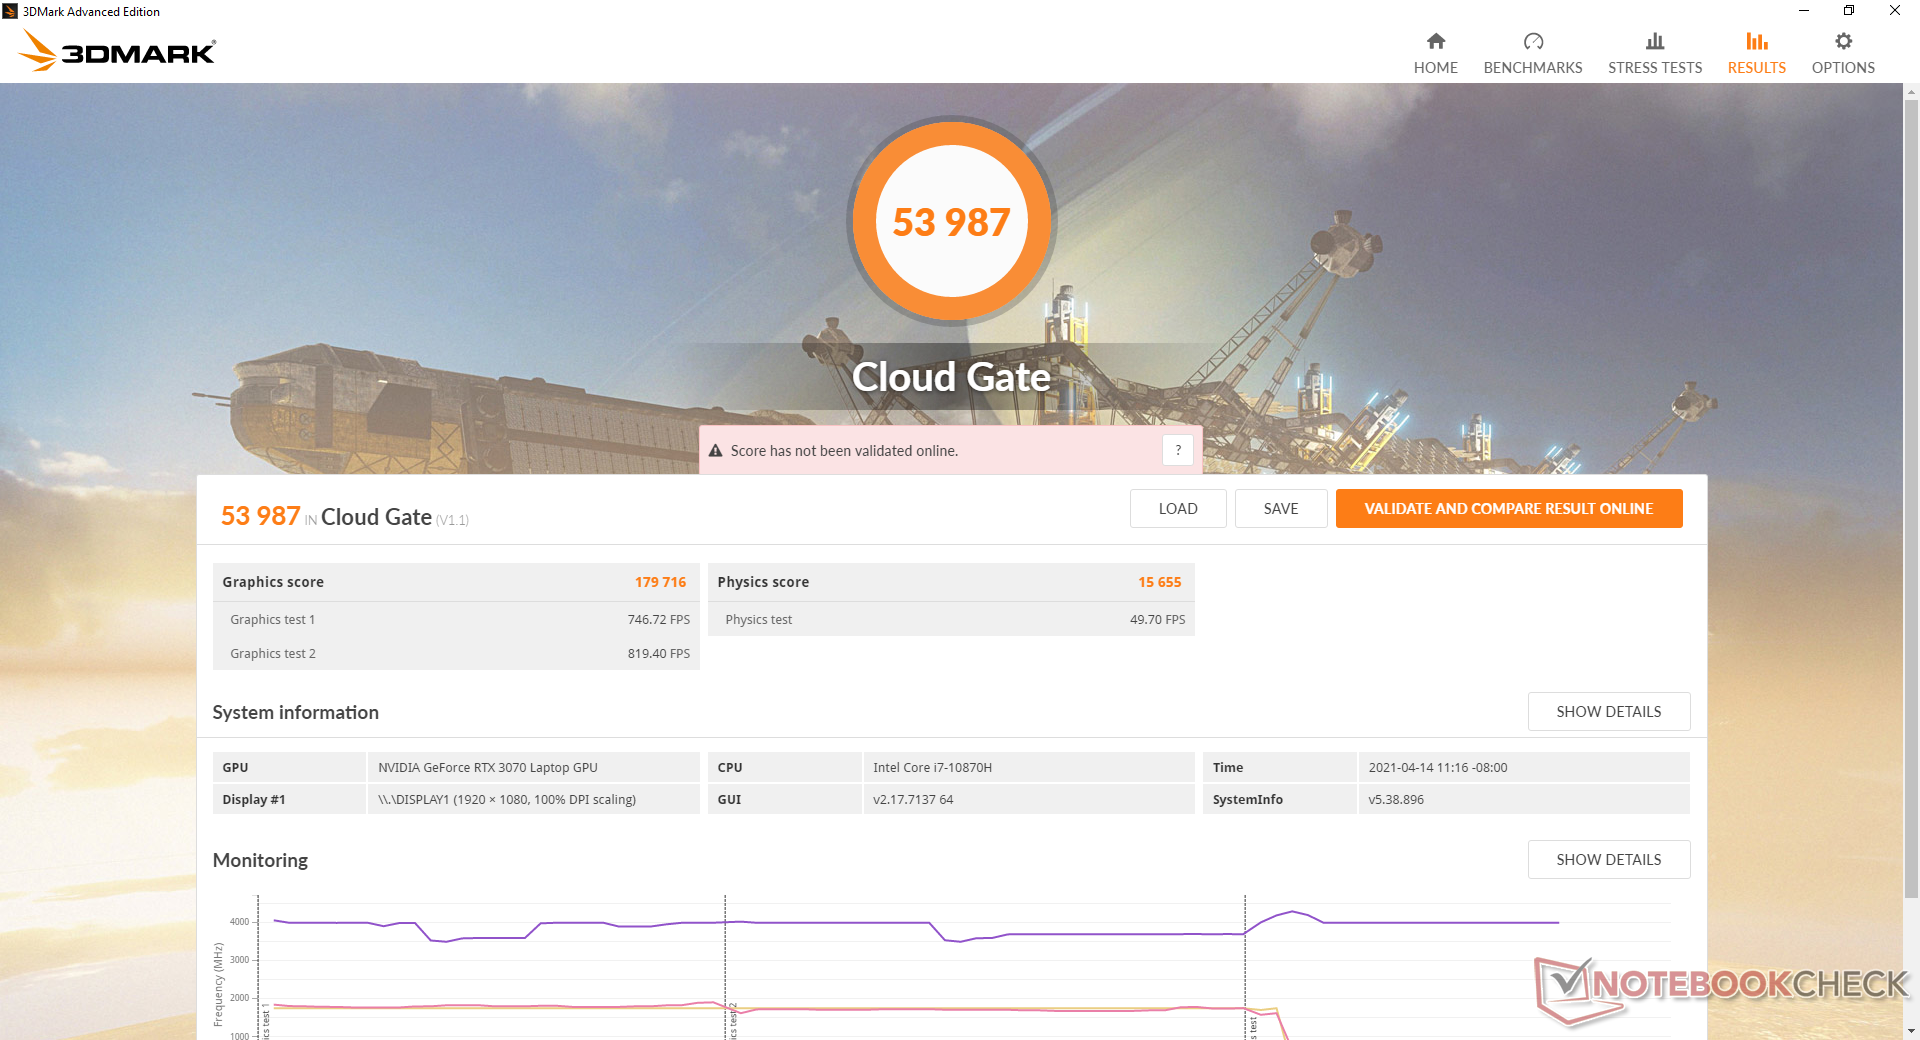
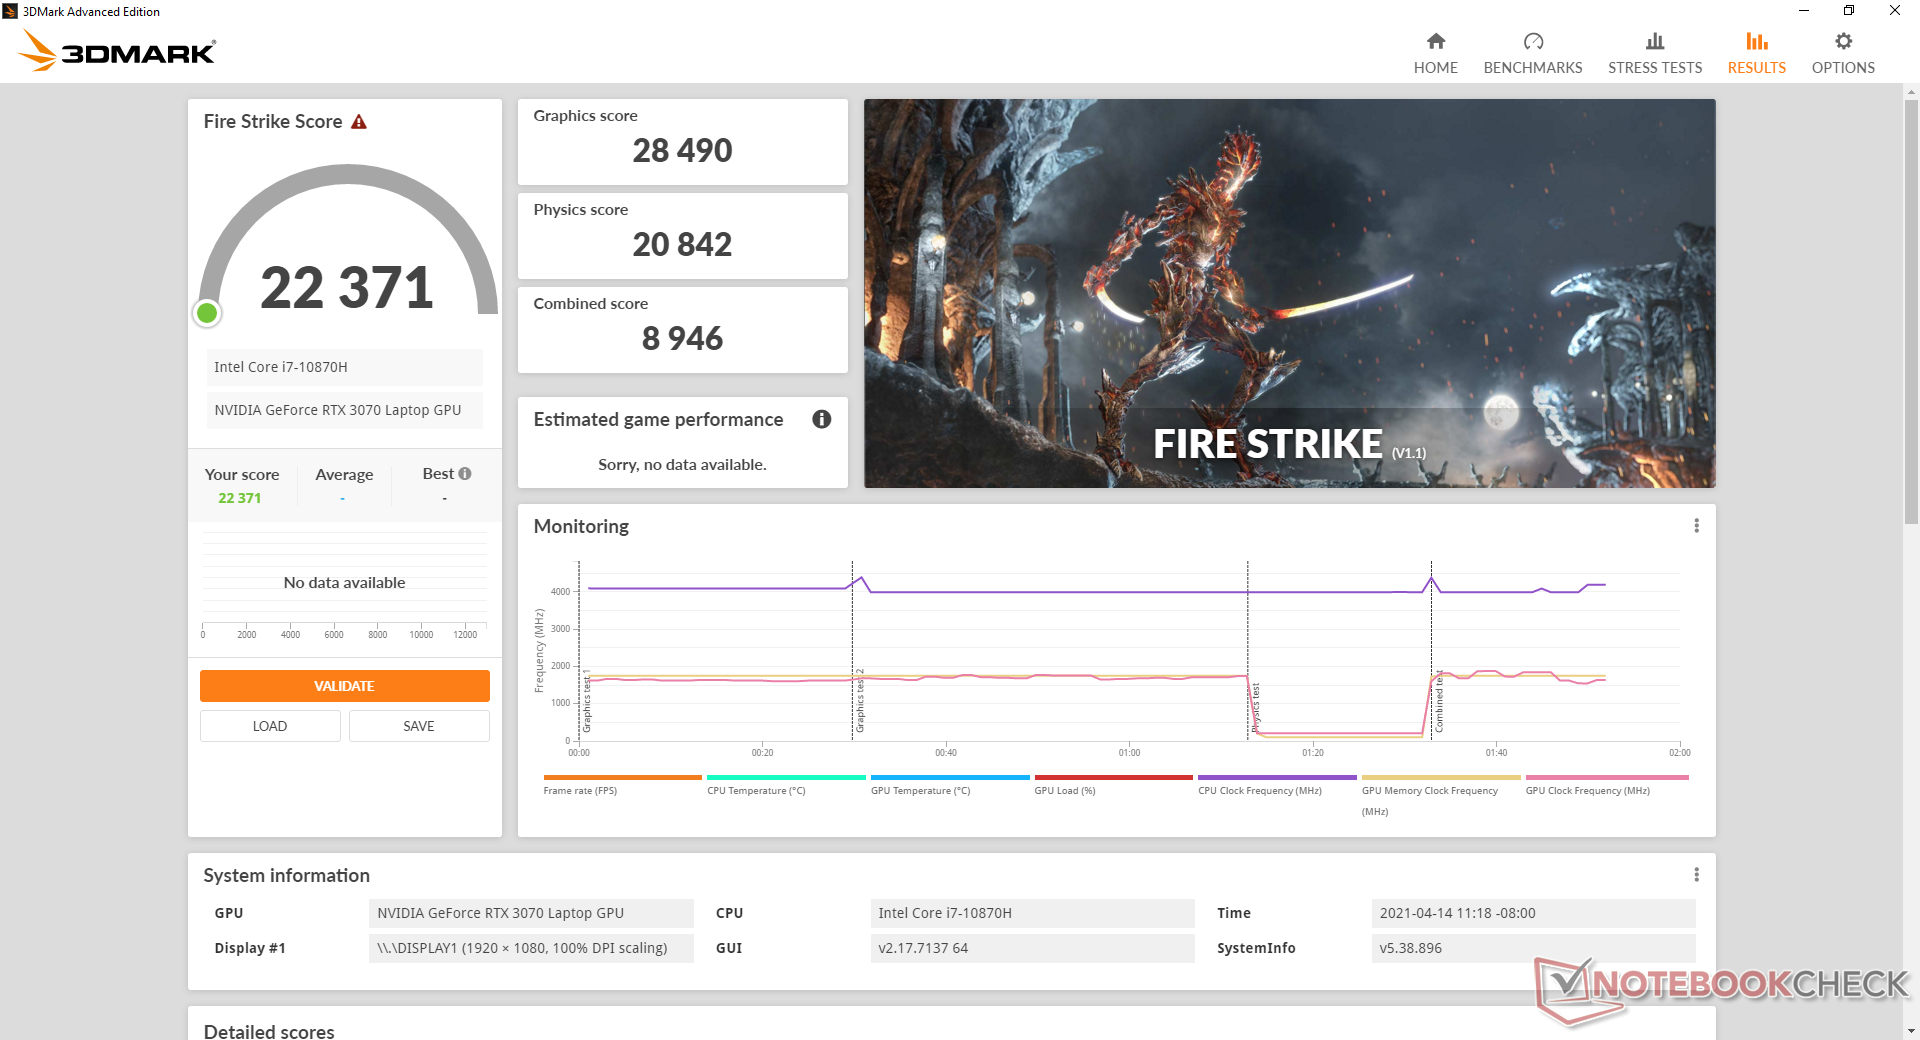
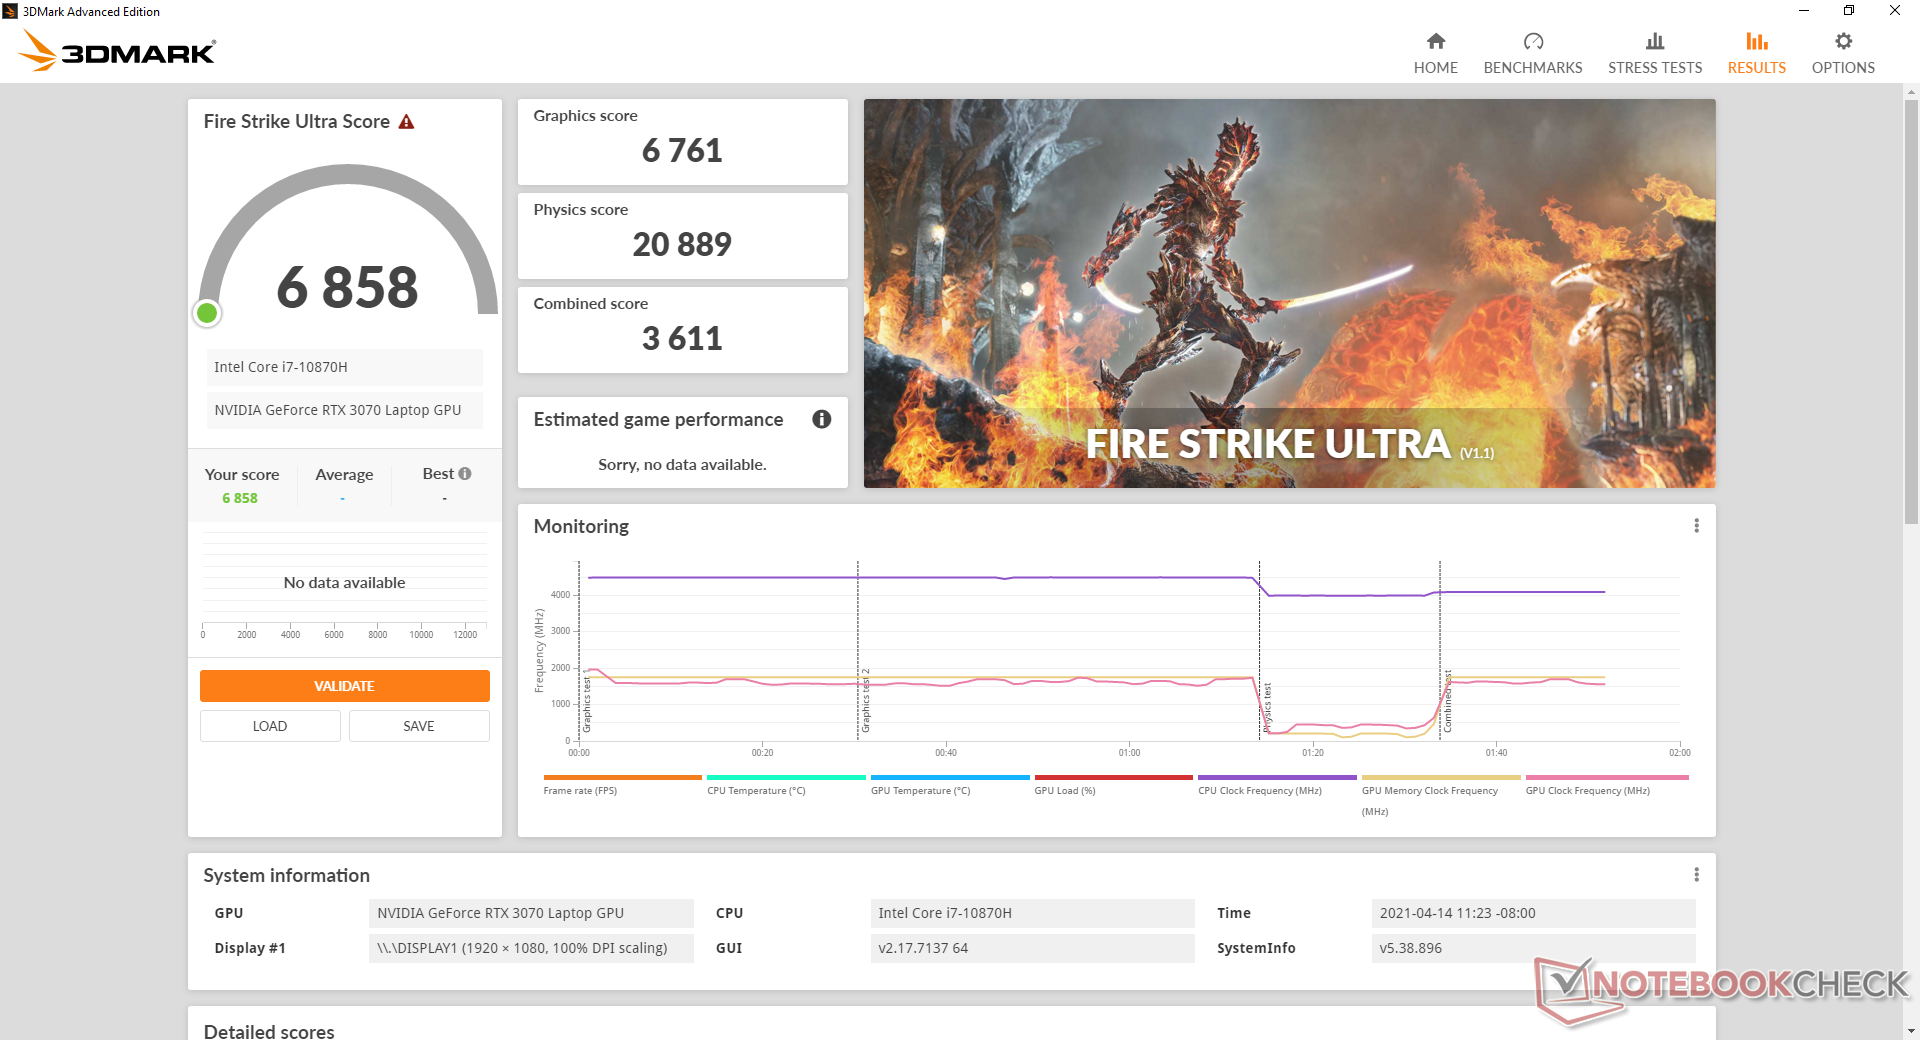
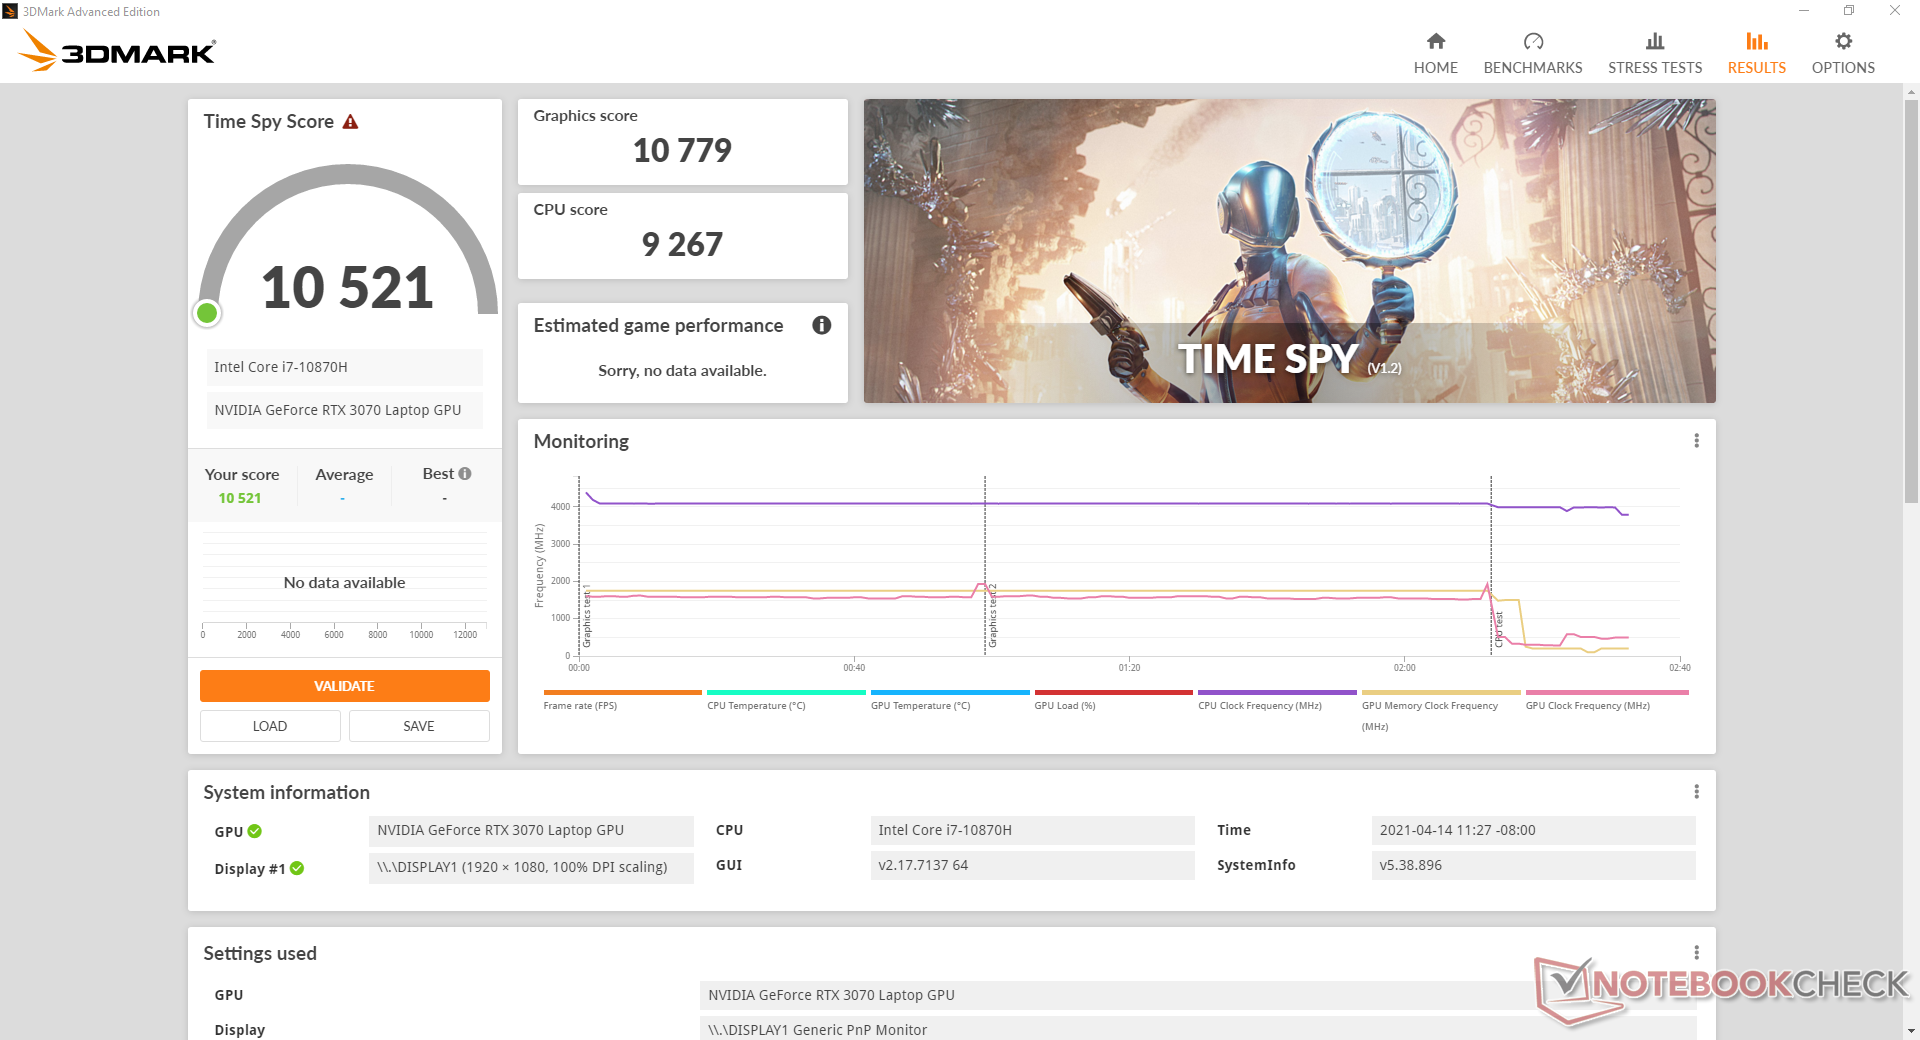
O desempenho gráfico bruto é apenas 6 a 9% mais lento que o dos 130 W GeForce RTX 3080 no Asus Zephyrus Duo 15 SE de acordo com os padrões de referência 3DMark. Usuários atualizando de um RTX 2070 laptop verá ganhos notáveis de até 35 a 40 por cento. No entanto, um PC desktop com um "próprio" GeForce RTX 3070 placa gráfica ainda é cerca de 20% mais rápida do que a nossa Versão móvel RTX 3070.
| 3DMark 11 | |
| 1280x720 Performance GPU | |
| MSI GeForce RTX 3070 Gaming X Trio | |
| Asus ROG Zephyrus Duo 15 SE GX551QS | |
| MSI GP66 Leopard 10UG | |
| Eurocom Sky X4C i9-9900KS | |
| Média NVIDIA GeForce RTX 3070 Laptop GPU (12535 - 38275, n=54) | |
| MSI RTX 2060 Gaming Z 6G | |
| Razer Blade 15 Base Edition 2021, i7-10750H RTX 3060 | |
| Alienware m15 R3 P87F | |
| Asus ROG Zephyrus M15 GU502LU-BI7N4 | |
| HP Omen 15-en0375ng | |
| 1280x720 Performance Combined | |
| Eurocom Sky X4C i9-9900KS | |
| MSI GP66 Leopard 10UG | |
| Asus ROG Zephyrus Duo 15 SE GX551QS | |
| Média NVIDIA GeForce RTX 3070 Laptop GPU (3715 - 22517, n=53) | |
| MSI GeForce RTX 3070 Gaming X Trio | |
| HP Omen 15-en0375ng | |
| MSI RTX 2060 Gaming Z 6G | |
| Alienware m15 R3 P87F | |
| Asus ROG Zephyrus M15 GU502LU-BI7N4 | |
| Razer Blade 15 Base Edition 2021, i7-10750H RTX 3060 | |
| 3DMark 11 Performance | 28106 pontos | |
| 3DMark Cloud Gate Standard Score | 53987 pontos | |
| 3DMark Fire Strike Score | 22371 pontos | |
| 3DMark Time Spy Score | 10521 pontos | |
Ajuda | ||
| baixo | média | alto | ultra | |
|---|---|---|---|---|
| GTA V (2015) | 181 | 166 | 96.6 | |
| The Witcher 3 (2015) | 362.7 | 298.1 | 206.9 | 107.9 |
| Dota 2 Reborn (2015) | 156 | 141 | 141 | 135 |
| Final Fantasy XV Benchmark (2018) | 175 | 142 | 103 | |
| X-Plane 11.11 (2018) | 116 | 104 | 85.7 | |
| Strange Brigade (2018) | 399 | 279 | 225 | 194 |
Emissions
Ruído do sistema
Os ventiladores ficarão ociosos quando o laptop estiver ocioso no desktop, sem outros programas ativos. No entanto, mesmo um ligeiro aumento na utilização da CPU dará o pontapé inicial no ventilador da CPU e, portanto, o laptop não ficará verdadeiramente silencioso na maioria dos cenários do mundo real. Somos capazes de gravar um ruído de 32,8 dB(A) quando navegando na web ou em fluxo de vídeo contra um fundo silencioso de 24,7 dB(A). É o suficiente para ser perceptível, mas não particularmente incômodo.
O ruído dos ventiladores quando os jogos ficam em torno de 48,8 dB(A) sem pulsação ou comportamento errático de RPM. Isto é mais silencioso do que o que gravamos no GP65 mais antigo enquanto estávamos no mesmo nível do último Alienware m15 R4, Aorus 15P, e Asus ROG Zephyrus G15 cada um com gráficos RTX 30.
Se o Cooler Boost (isto é, modo de ventilador máximo) estiver ativado, o ruído do ventilador saltará imediatamente para 57,2 dB(A), independentemente da carga na tela. É um aumento maciço no ruído do ventilador para não se obter tanto ganho de desempenho como nossa seção de Teste de Estresse abaixo detalha.
Nossa unidade de teste exibe um ligeiro lamento da bobina de 26,8 dB(A) contra um fundo de 24,7 dB(A).

| MSI GP66 Leopard 10UG GeForce RTX 3070 Laptop GPU, i7-10870H, Kingston OM8PCP31024F | MSI GP65 10SFK-047US GeForce RTX 2070 Mobile, i7-10750H, Samsung SSD PM981 MZVLB1T0HALR | Alienware m15 R4 GeForce RTX 3070 Laptop GPU, i9-10980HK, Micron 2300 1TB MTFDHBA1T0TDV | Aorus 15P XC GeForce RTX 3070 Laptop GPU, i7-10870H, ESR512GTLCG-EAC-4 | Asus ROG Zephyrus G15 GA503Q GeForce RTX 3080 Laptop GPU, R9 5900HS, SK Hynix HFM001TD3JX013N | MSI GF65 Thin 10UE GeForce RTX 3060 Laptop GPU, i7-10750H, Samsung SSD PM981 MZVLB1T0HALR | |
|---|---|---|---|---|---|---|
| Noise | -15% | -4% | -4% | -4% | -9% | |
| desligado / ambiente * (dB) | 24.7 | 29.3 -19% | 24 3% | 24 3% | 25 -1% | 24.7 -0% |
| Idle Minimum * (dB) | 26.8 | 31.9 -19% | 25 7% | 25 7% | 26 3% | 33.1 -24% |
| Idle Average * (dB) | 26.8 | 31.9 -19% | 26 3% | 29 -8% | 27 -1% | 33.1 -24% |
| Idle Maximum * (dB) | 26.8 | 33.5 -25% | 37 -38% | 34 -27% | 31 -16% | 33.1 -24% |
| Load Average * (dB) | 40.4 | 47 -16% | 48 -19% | 44 -9% | 49 -21% | 42.7 -6% |
| Witcher 3 ultra * (dB) | 48.8 | 53.8 -10% | 47 4% | 49 -0% | 49 -0% | 40.6 17% |
| Load Maximum * (dB) | 57.2 | 56.7 1% | 49 14% | 53 7% | 51 11% | 59.4 -4% |
* ... menor é melhor
Barulho
| Ocioso |
| 26.8 / 26.8 / 26.8 dB |
| Carga |
| 40.4 / 57.2 dB |
 | ||
30 dB silencioso 40 dB(A) audível 50 dB(A) ruidosamente alto |
||
min: | ||
Temperatura
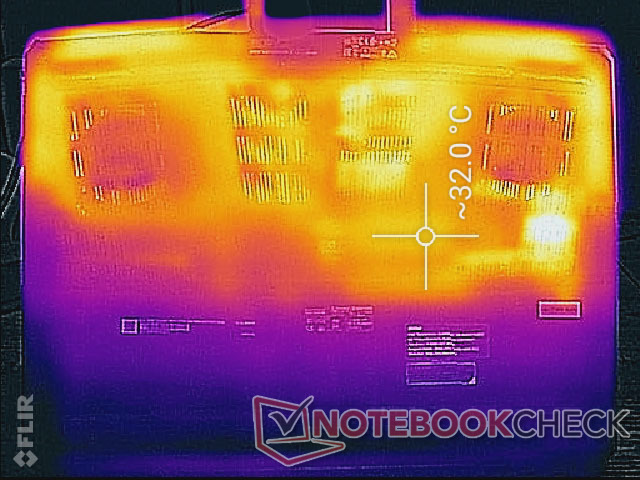
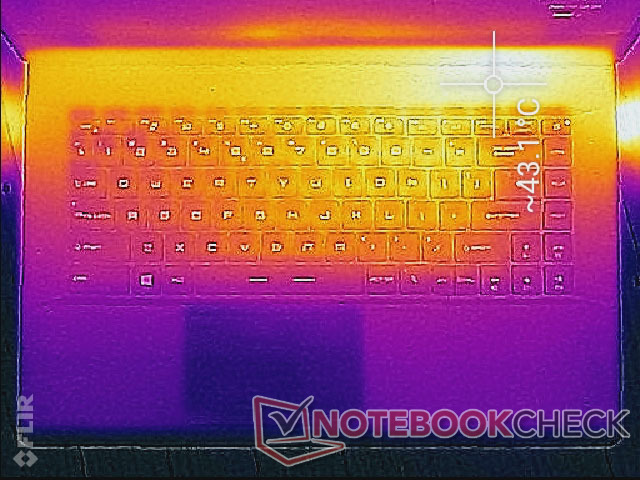
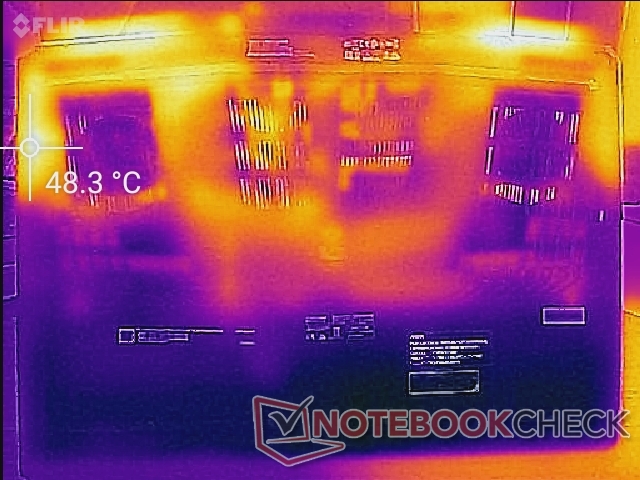
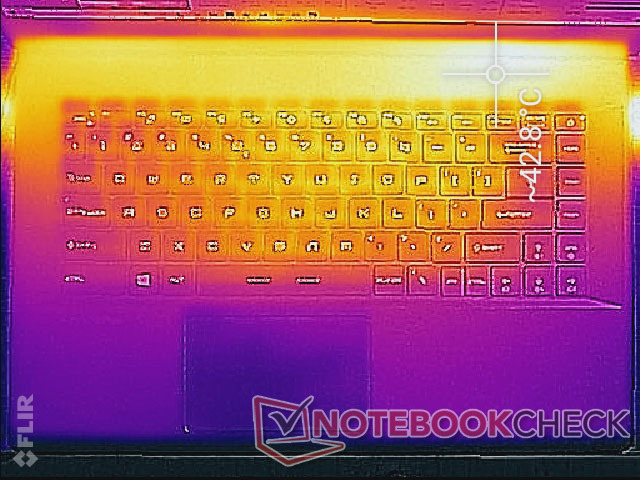
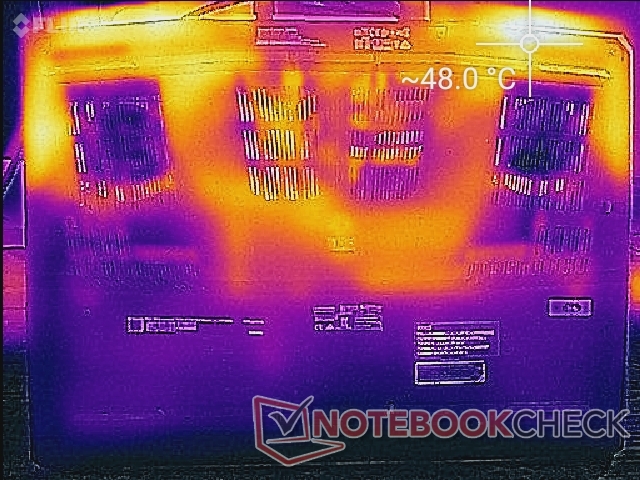
As temperaturas superficiais são ligeiramente mais frias do que na GP65. Ao jogar, os pontos quentes na GP66 alcançariam 43 C e 48 C na parte superior e inferior da base, respectivamente, em comparação com 46 C a 50 C na GP65. Além disso, os pontos quentes estão agora localizados acima da primeira linha de teclas do teclado para uma experiência de digitação mais fria, enquanto que os pontos quentes no GP65 e até mesmo os pontos quentes no GP65 são mais frios do que os pontos quentes no GP65 GS66 estão mais perto de seus centros de teclado.
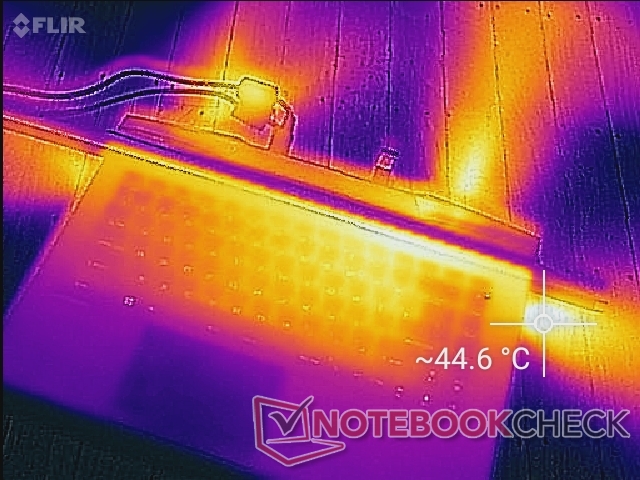
(±) A temperatura máxima no lado superior é 42.8 °C / 109 F, em comparação com a média de 40.4 °C / 105 F , variando de 21.2 a 68.8 °C para a classe Gaming.
(-) A parte inferior aquece até um máximo de 50 °C / 122 F, em comparação com a média de 43.2 °C / 110 F
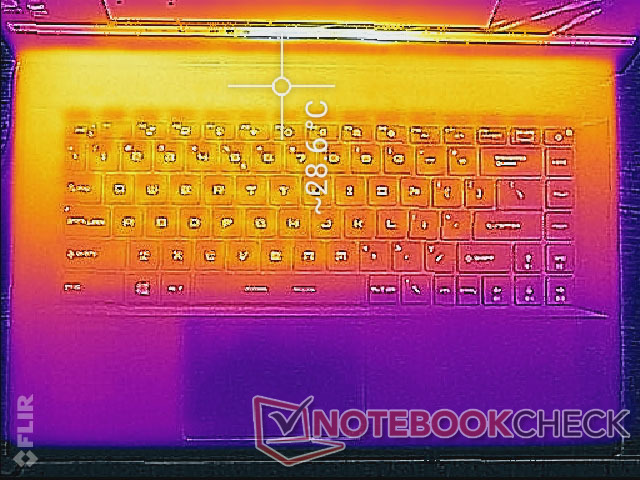
(+) Em uso inativo, a temperatura média para o lado superior é 29.4 °C / 85 F, em comparação com a média do dispositivo de 33.9 °C / ### class_avg_f### F.
(±) Jogando The Witcher 3, a temperatura média para o lado superior é 33.4 °C / 92 F, em comparação com a média do dispositivo de 33.9 °C / ## #class_avg_f### F.
(+) Os apoios para as mãos e o touchpad são mais frios que a temperatura da pele, com um máximo de 25.8 °C / 78.4 F e, portanto, são frios ao toque.
(+) A temperatura média da área do apoio para as mãos de dispositivos semelhantes foi 28.8 °C / 83.8 F (+3 °C / 5.4 F).
Teste de estresse
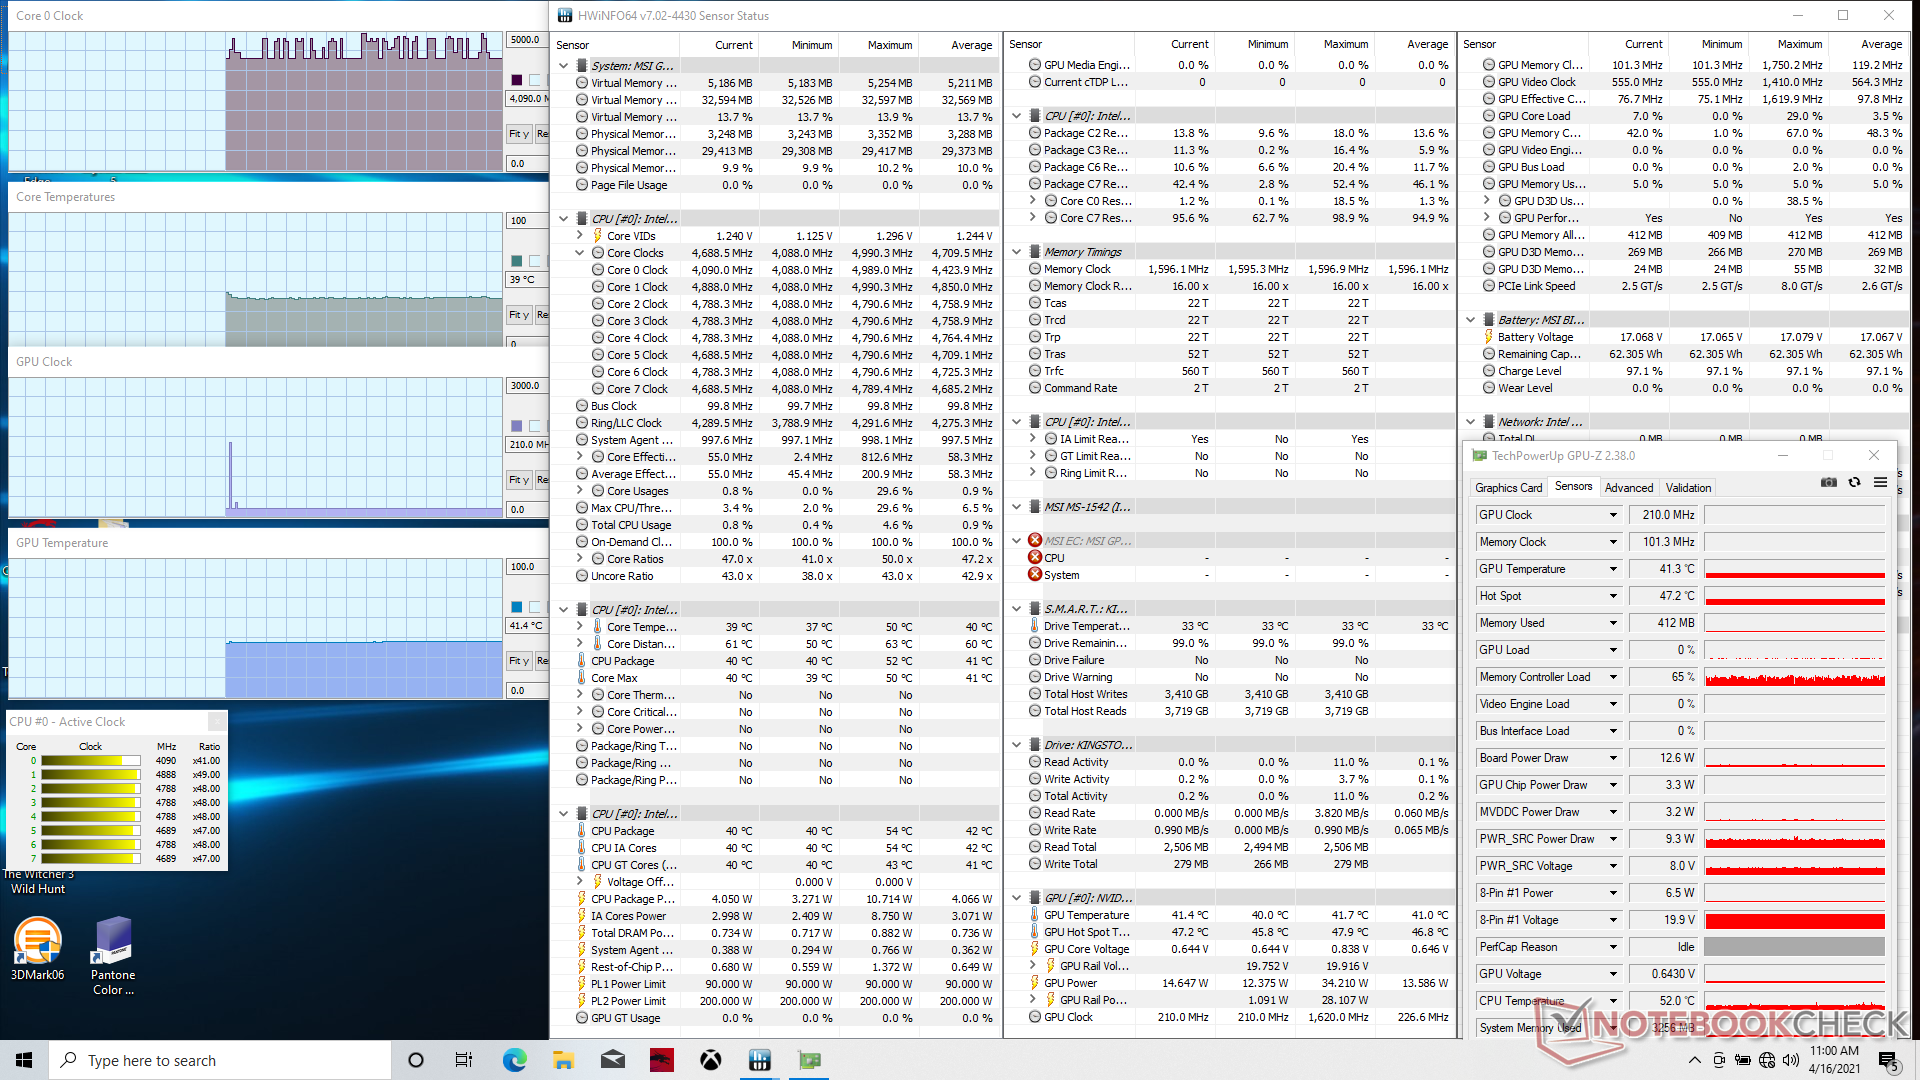
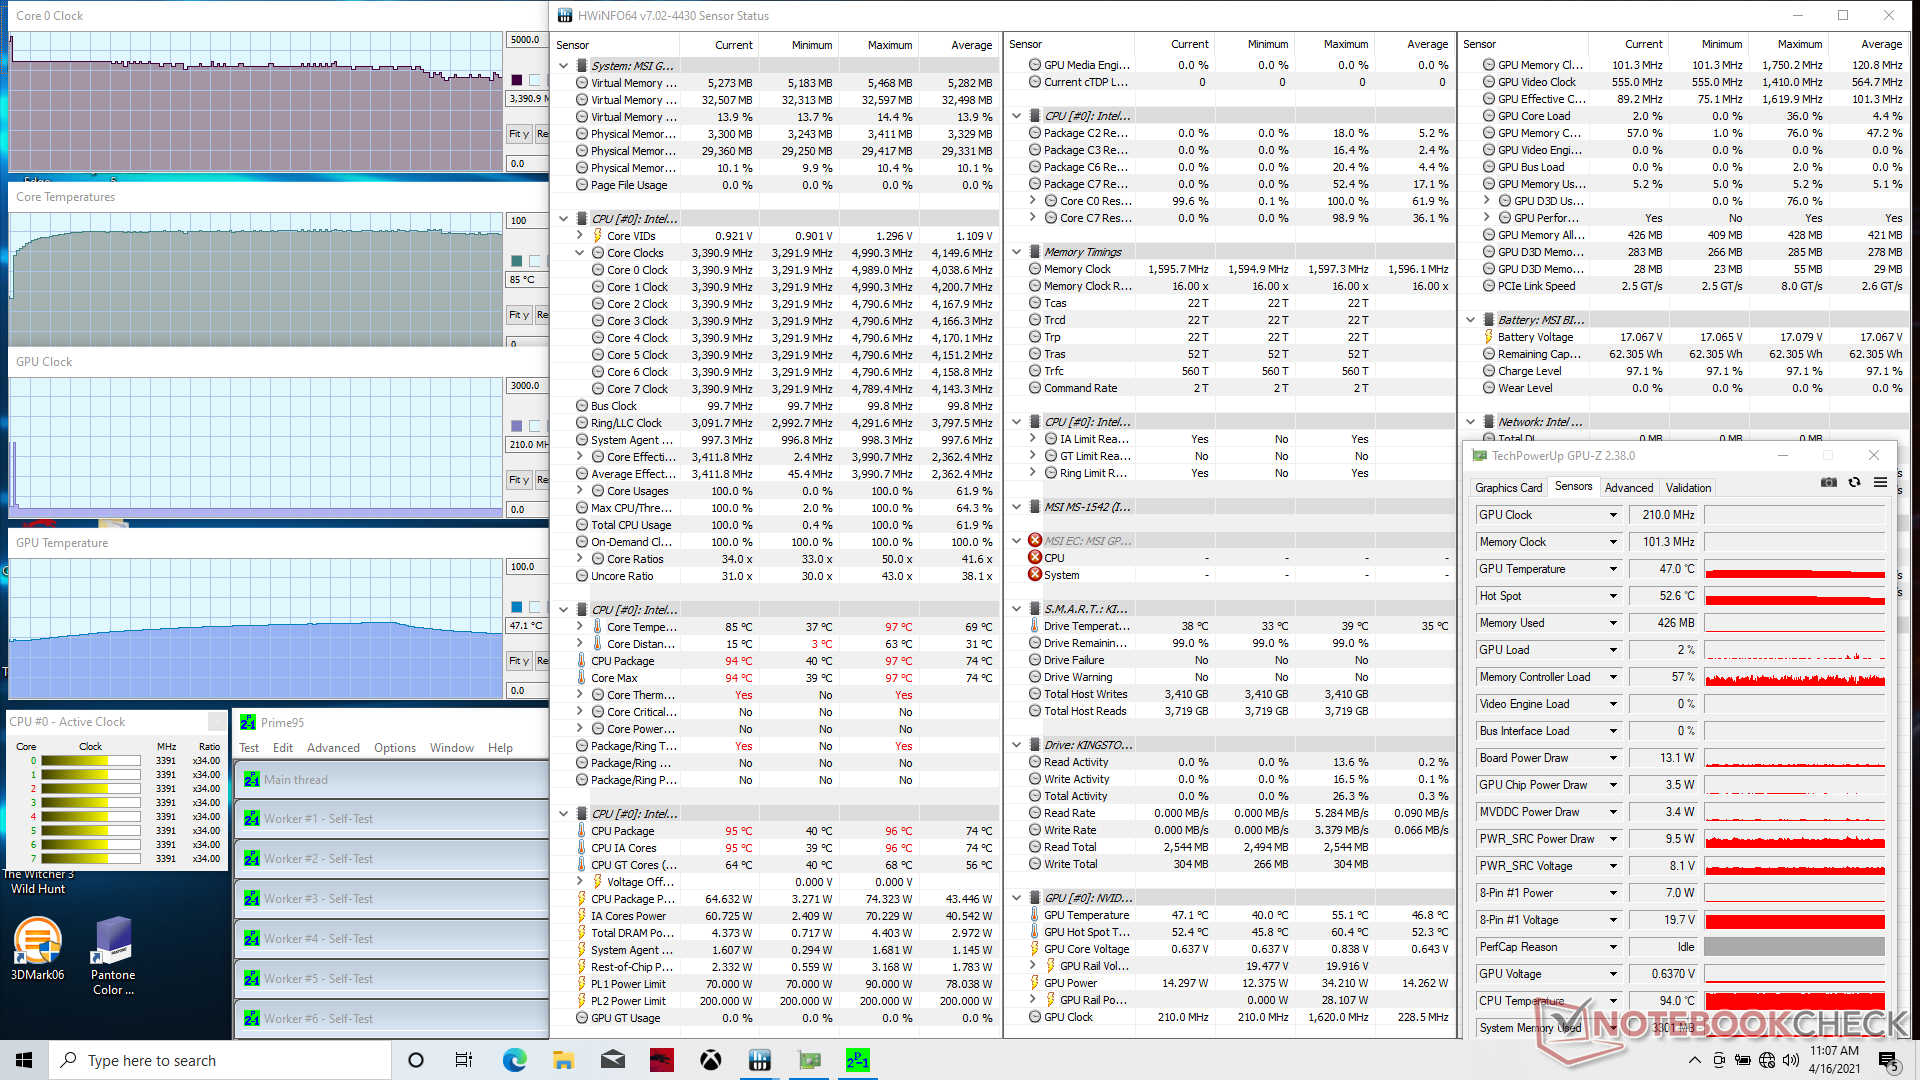
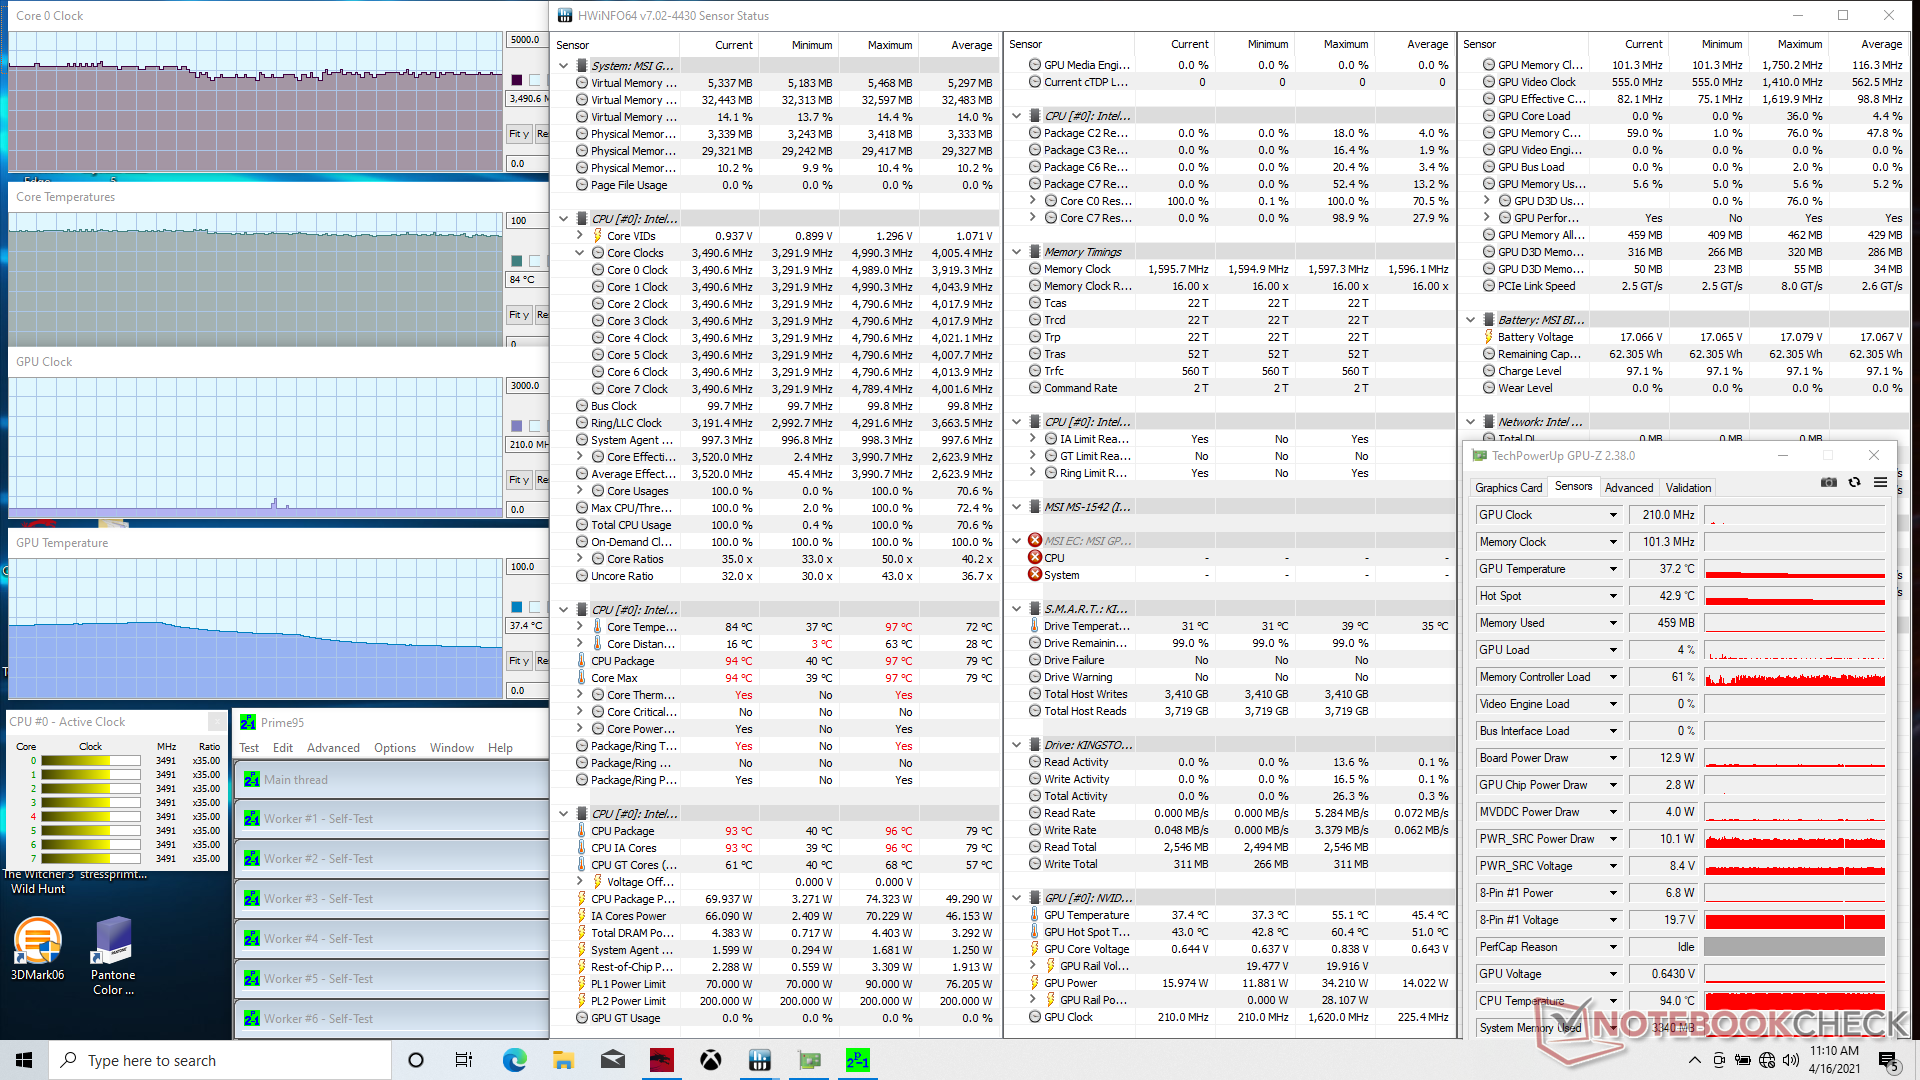
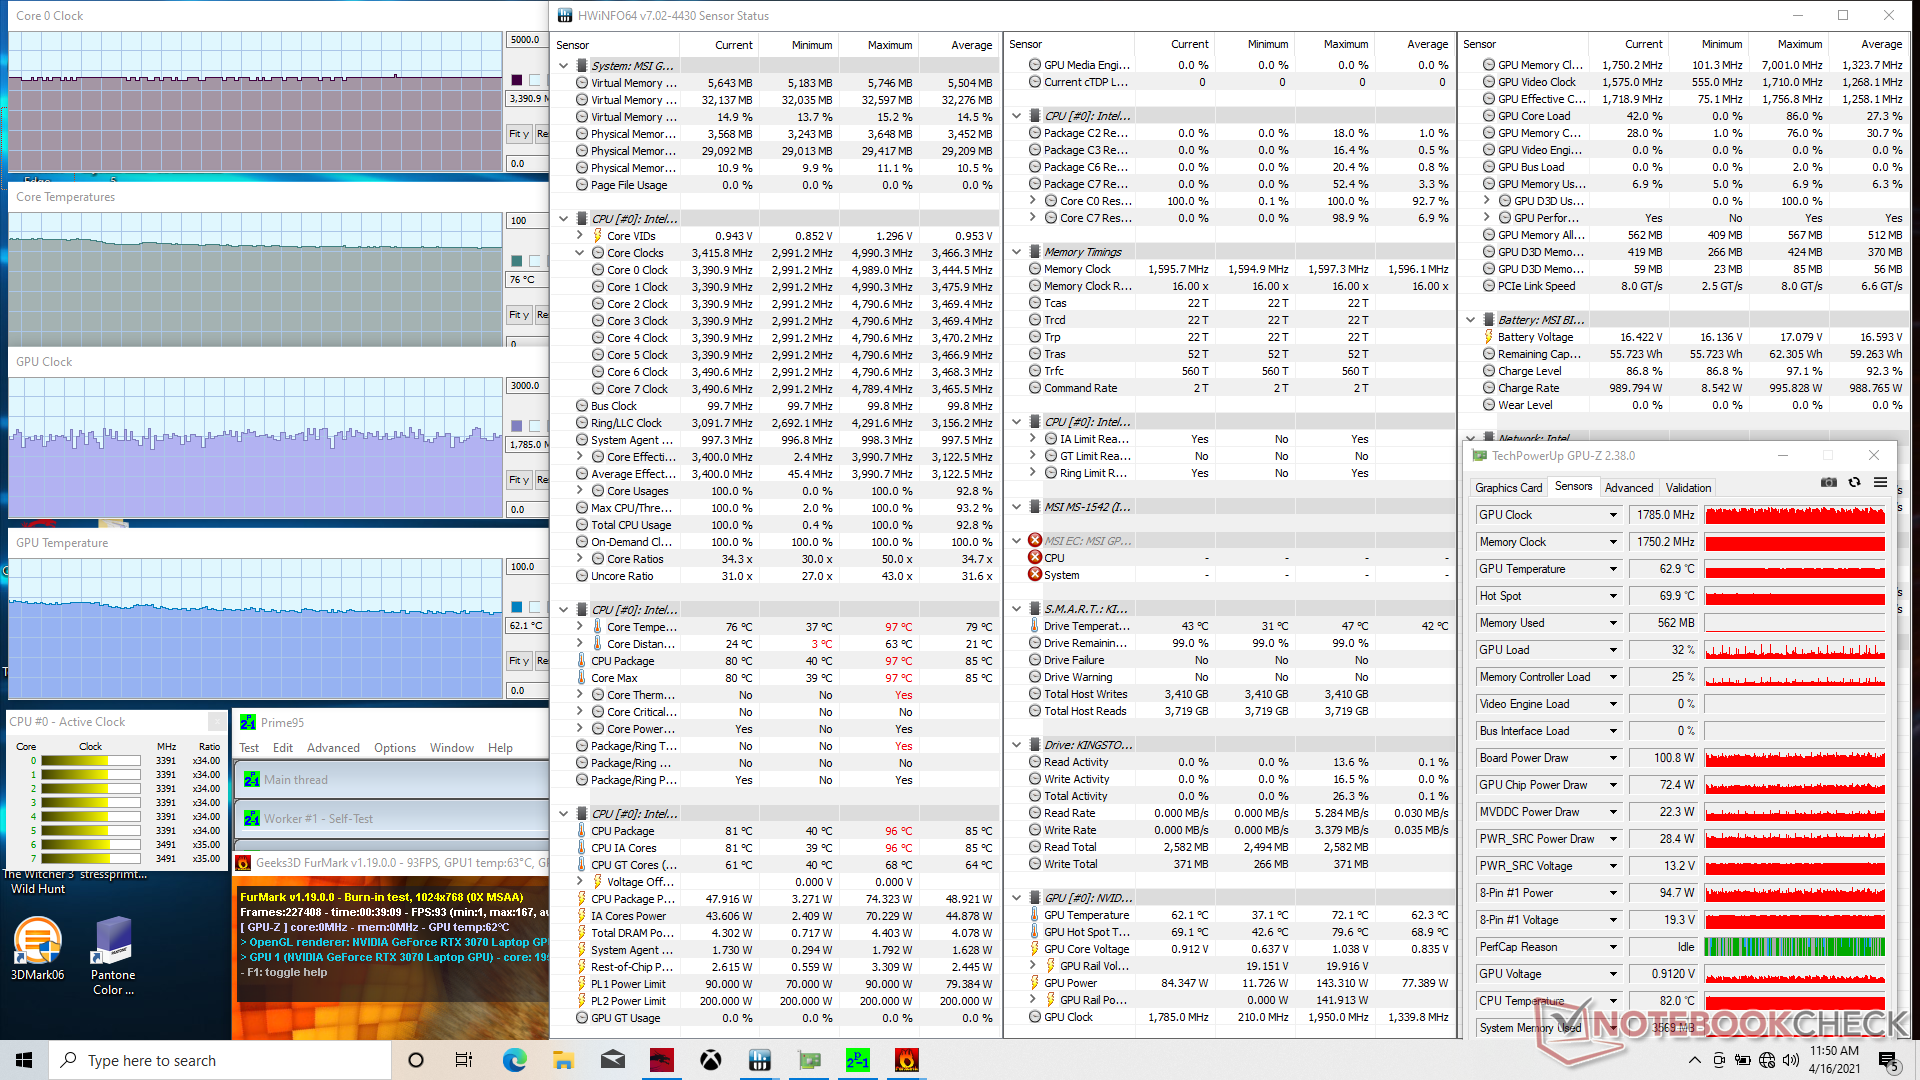
Ao executar Prime95 para tensionar o processador, as taxas de relógio da CPU aumentariam para 4 GHz até atingir uma temperatura central de 88 C cerca de 20 segundos depois. Depois disso, as taxas de clock cairiam constantemente e se estabilizariam na faixa de 3,2 a 3,4 GHz a fim de manter uma temperatura central ligeiramente mais fria de 85 C. A ativação do modo Cooler Boost resultaria em apenas mudanças muito pequenas nas taxas de clock e temperatura da CPU.
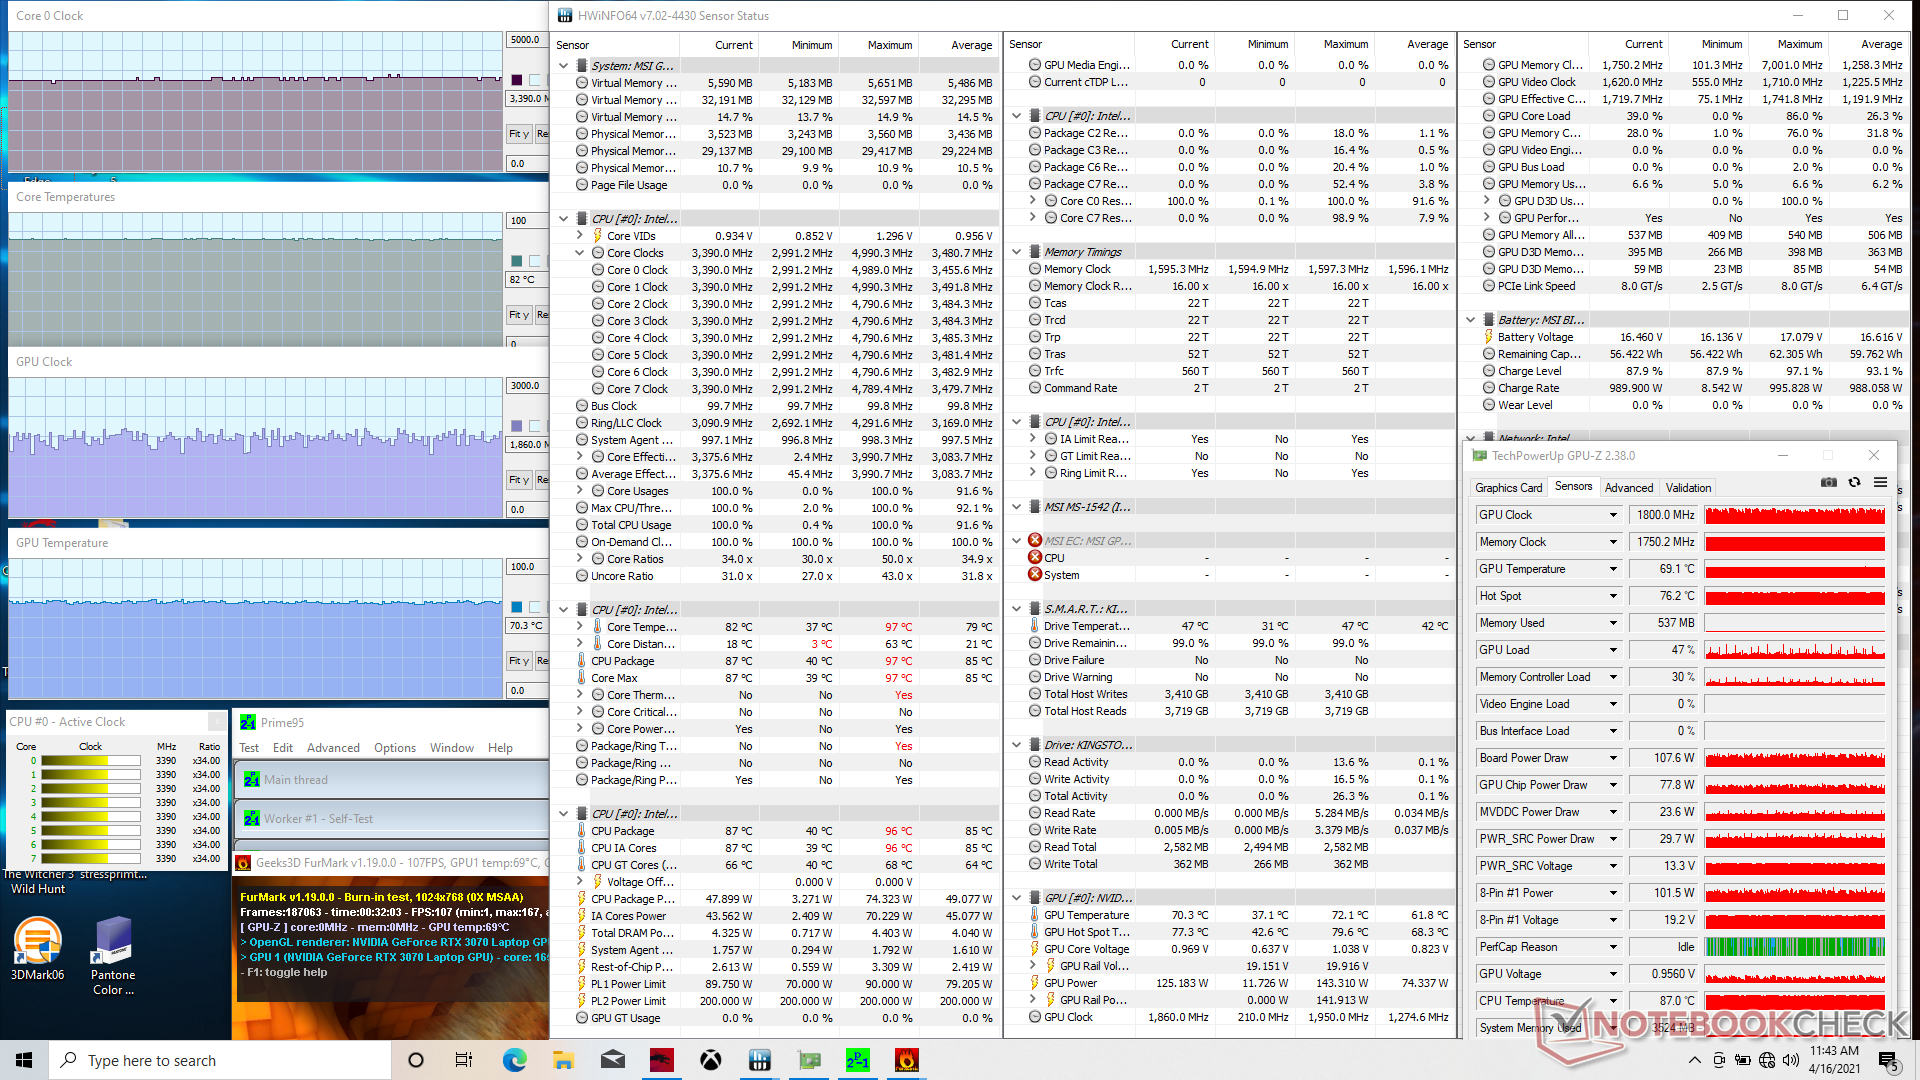
A execução simultânea de Prime95 e FurMark resultaria em temperaturas estáveis de CPU e GPU de 82 C e 70 C, respectivamente. Se o Cooler Boost estiver ligado, as temperaturas centrais cairiam em cerca de 8 C cada.
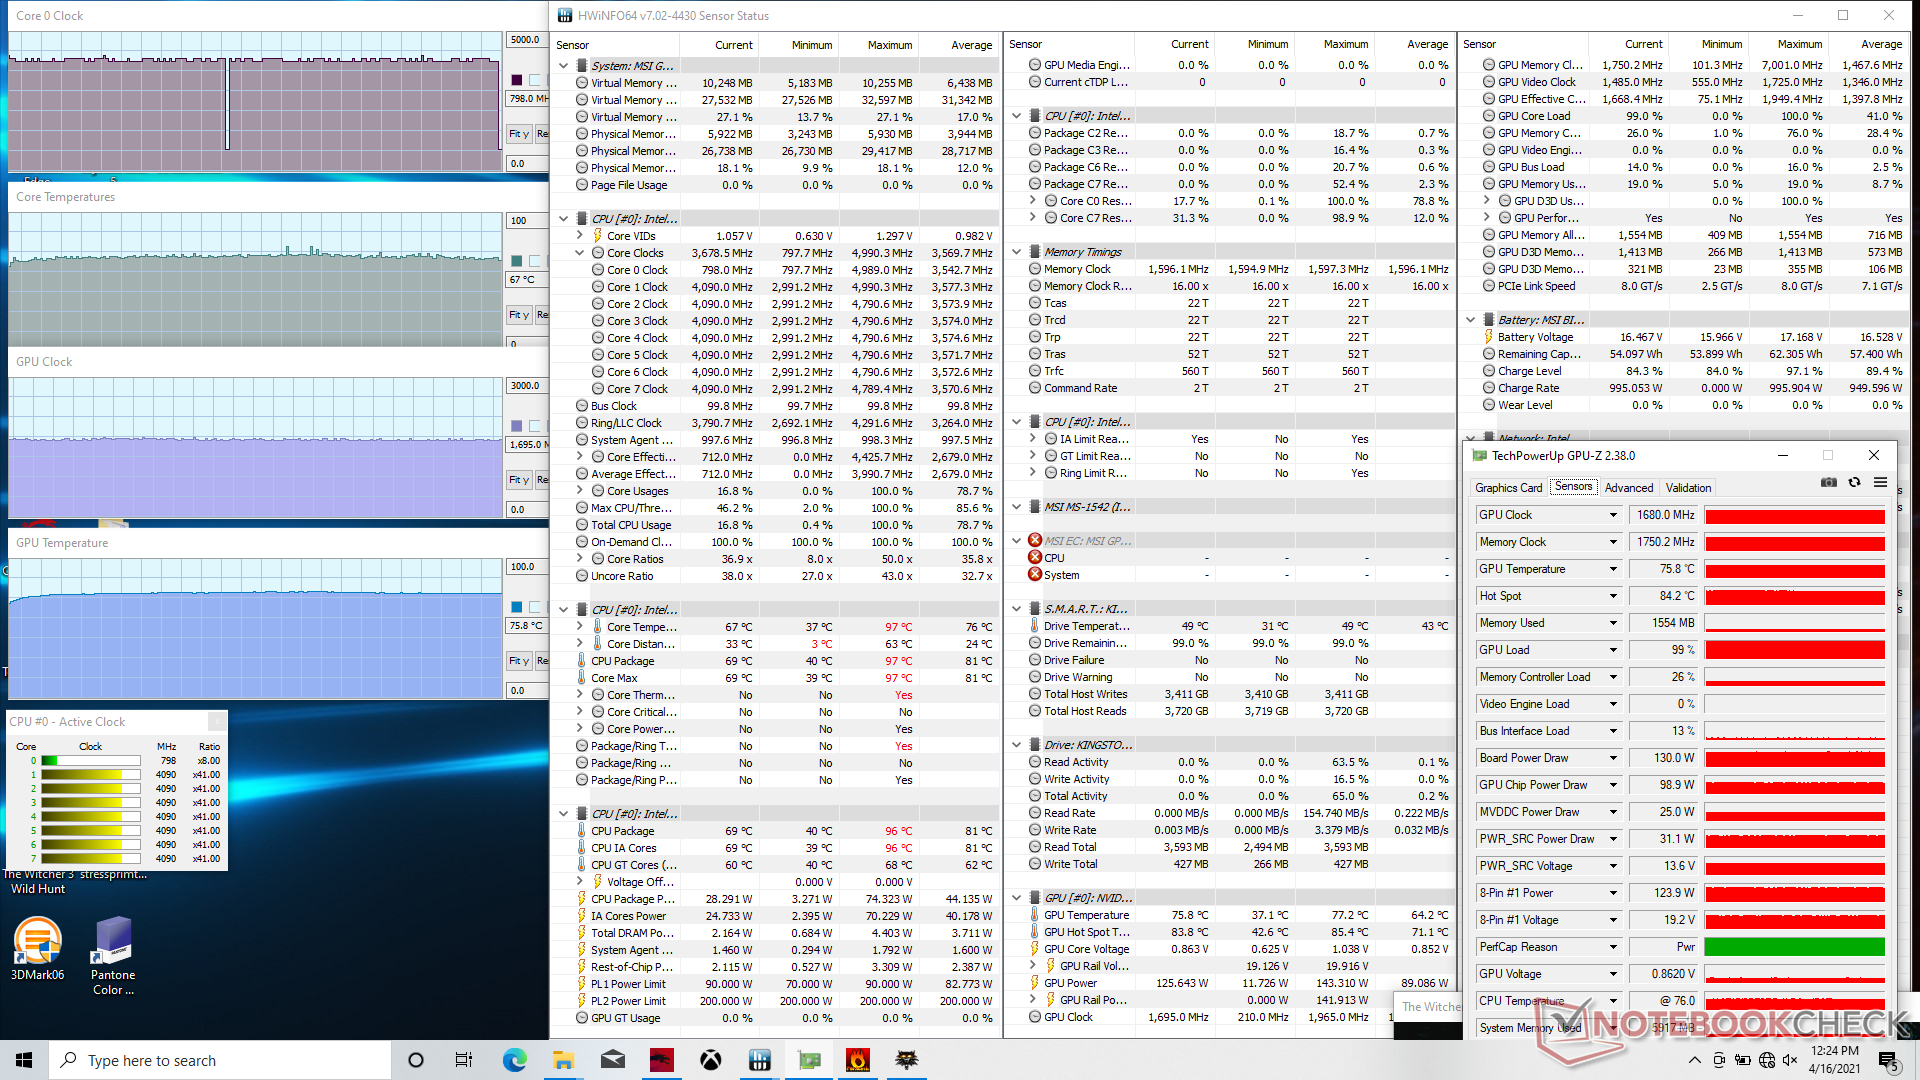
Ao rodar Witcher 3 para representar o estresse dos jogos no mundo real, as temperaturas centrais se estabilizariam na faixa de 67 C a 76 C se o Cooler Boost estivesse desligado e de 63 a 69 C se o Cooler Boost estivesse ligado. As taxas de relógio GPU também aumentariam ligeiramente de 1680 MHz para 1755 MHz com um consumo de energia da placa de 120 W para 130 W, conforme anunciado pelo fabricante. A execução deste mesmo teste no GP65 resultaria em temperaturas mais quentes de CPU e GPU de 96 C e 79 C.
A execução em baterias limitará o desempenho. Um teste Fire Strike sobre a energia da bateria retornou pontuações de Física e Gráficos de 12004 e 6385 pontos, respectivamente, em comparação com 20842 e 28490 pontos quando em rede elétrica.

| RelógioCPU (GHz) | RelógioGPU (MHz) | Temperaturamédiada CPU (°C) | Temperaturamédiada GPU (°C) | |
| System Idle | -- | ----39 | 41 | |
| Prime95 Stress (Cooler Boost off) | 3.2 - 3.4 | --85 | 47 | |
| Prime95 Stress (Cooler Boost on) | 3.3 - 3.5 | --84 | 37 | |
| Prime95 + FurMark Stress (Cooler Boost off) | 3.3 - 3.4 | ~1800 | 82 | 70 |
| Prime95 + FurMark Stress (Cooler Boost on) | 3.4 | ~1800 | 76 | 62 |
| Witcher 3 Stress (Cooler Boost off) | 4.0 | 1680 | 67 | 76 |
| Witcher 3 Stress (Cooler Boost on) | 4.0 | 1755 | 63 | 69 |
Oradores


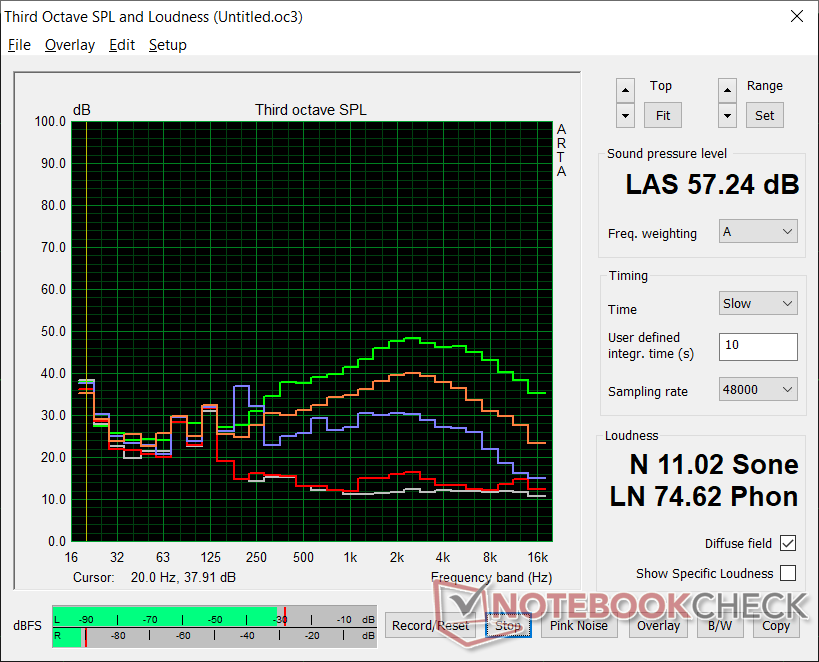
MSI GP66 Leopard 10UG análise de áudio
(±) | o volume do alto-falante é médio, mas bom (###valor### dB)
Graves 100 - 315Hz
(-) | quase nenhum baixo - em média 18.4% menor que a mediana
(±) | a linearidade dos graves é média (11% delta para a frequência anterior)
Médios 400 - 2.000 Hz
(±) | médios mais altos - em média 5.1% maior que a mediana
(+) | médios são lineares (4.6% delta para frequência anterior)
Altos 2 - 16 kHz
(±) | máximos mais altos - em média 5.9% maior que a mediana
(±) | a linearidade dos máximos é média (9.2% delta para frequência anterior)
Geral 100 - 16.000 Hz
(±) | a linearidade do som geral é média (19.3% diferença em relação à mediana)
Comparado com a mesma classe
» 65% de todos os dispositivos testados nesta classe foram melhores, 8% semelhantes, 27% piores
» O melhor teve um delta de 6%, a média foi 18%, o pior foi 132%
Comparado com todos os dispositivos testados
» 47% de todos os dispositivos testados foram melhores, 8% semelhantes, 46% piores
» O melhor teve um delta de 4%, a média foi 23%, o pior foi 134%
Apple MacBook 12 (Early 2016) 1.1 GHz análise de áudio
(+) | os alto-falantes podem tocar relativamente alto (###valor### dB)
Graves 100 - 315Hz
(±) | graves reduzidos - em média 11.3% menor que a mediana
(±) | a linearidade dos graves é média (14.2% delta para a frequência anterior)
Médios 400 - 2.000 Hz
(+) | médios equilibrados - apenas 2.4% longe da mediana
(+) | médios são lineares (5.5% delta para frequência anterior)
Altos 2 - 16 kHz
(+) | agudos equilibrados - apenas 2% longe da mediana
(+) | os máximos são lineares (4.5% delta da frequência anterior)
Geral 100 - 16.000 Hz
(+) | o som geral é linear (10.2% diferença em relação à mediana)
Comparado com a mesma classe
» 7% de todos os dispositivos testados nesta classe foram melhores, 2% semelhantes, 90% piores
» O melhor teve um delta de 5%, a média foi 18%, o pior foi 53%
Comparado com todos os dispositivos testados
» 5% de todos os dispositivos testados foram melhores, 1% semelhantes, 94% piores
» O melhor teve um delta de 4%, a média foi 23%, o pior foi 134%
Energy Management
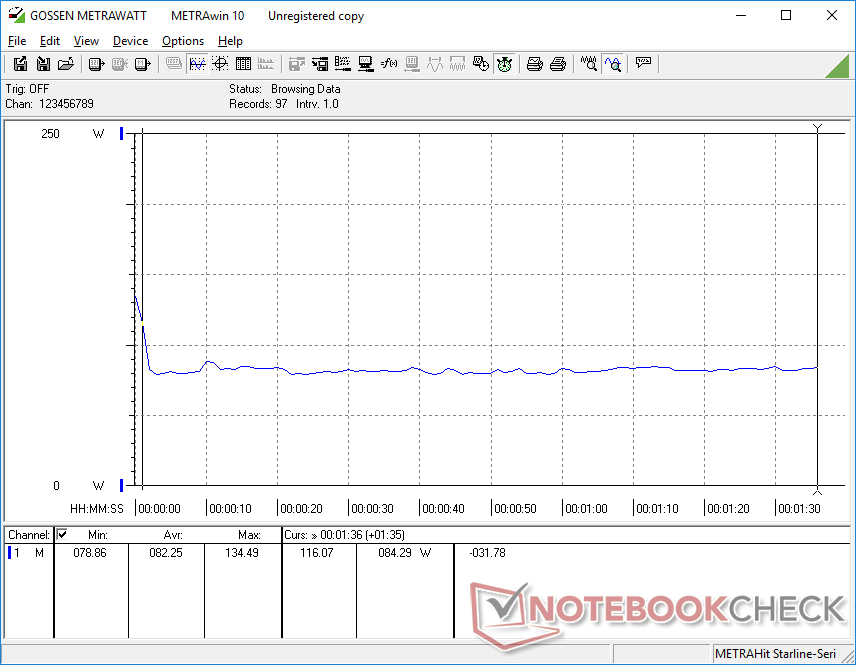
Consumo de energia
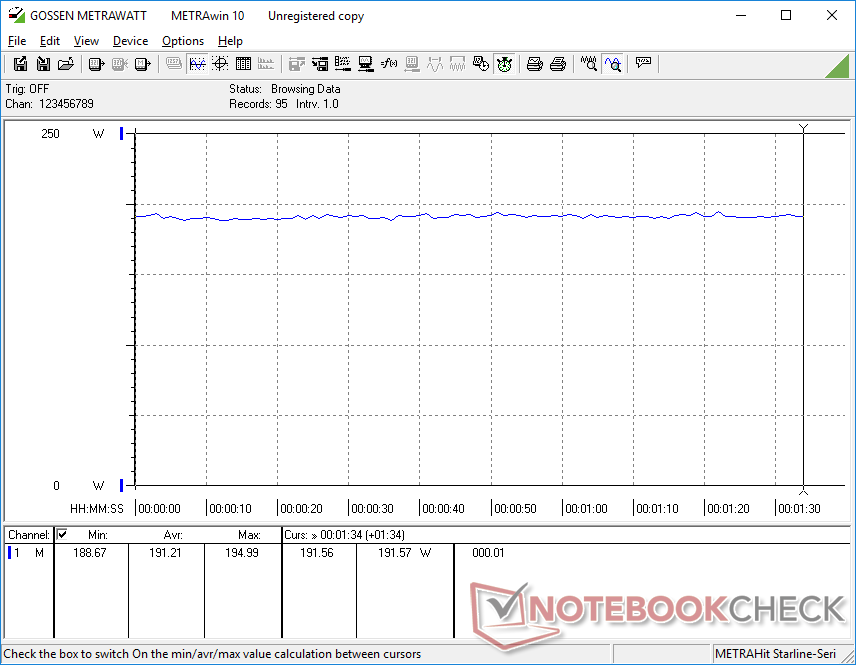
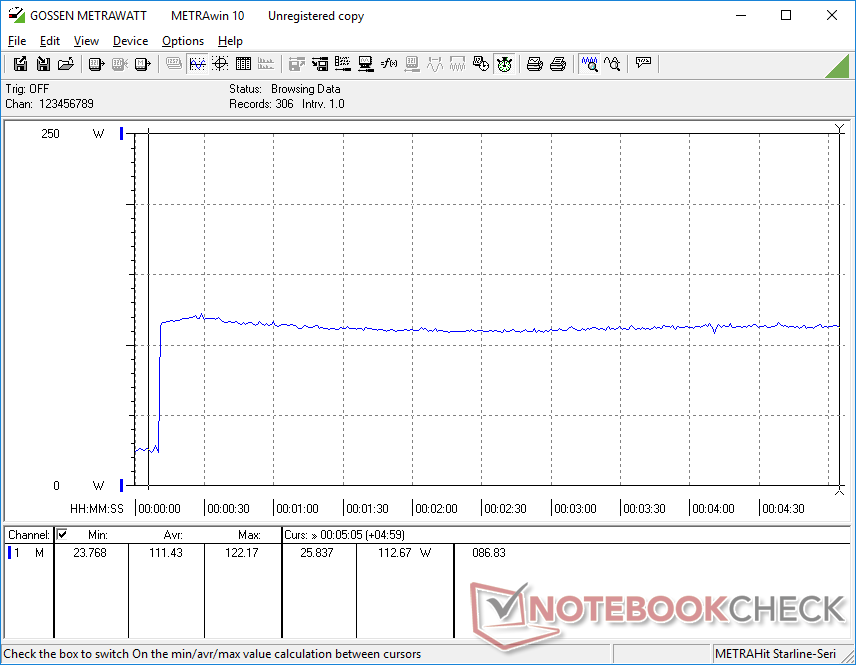
O consumo geral de energia está muito mais próximo do GP65 do que esperávamos. Por exemplo, ociosos na área de trabalho consumiriam entre 13 W e 23 W, o que quase corresponde ao GP65. Rodando Witcher 3 seria em média 191 W a apenas 3% a mais do que na GP65, oferecendo um aumento de 40% a 45% no desempenho gráfico. O aumento de gen-to-gen no desempenho por watt é impressionante a este respeito
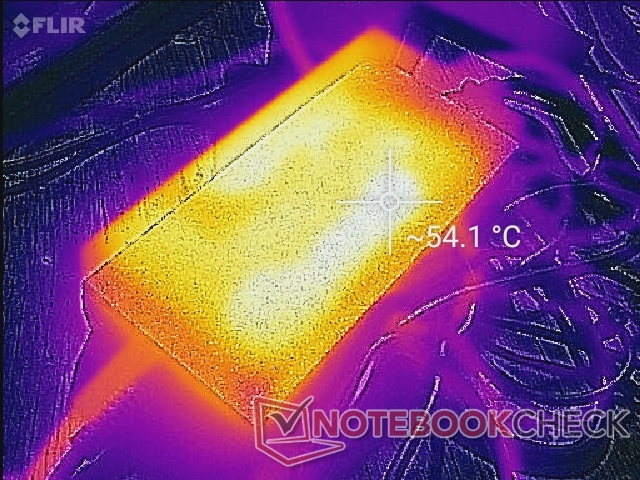
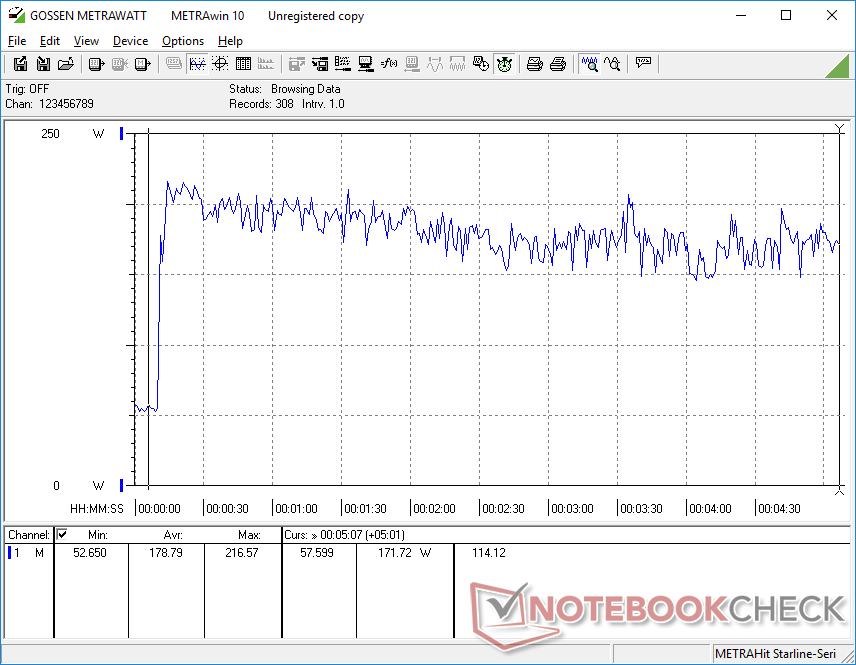
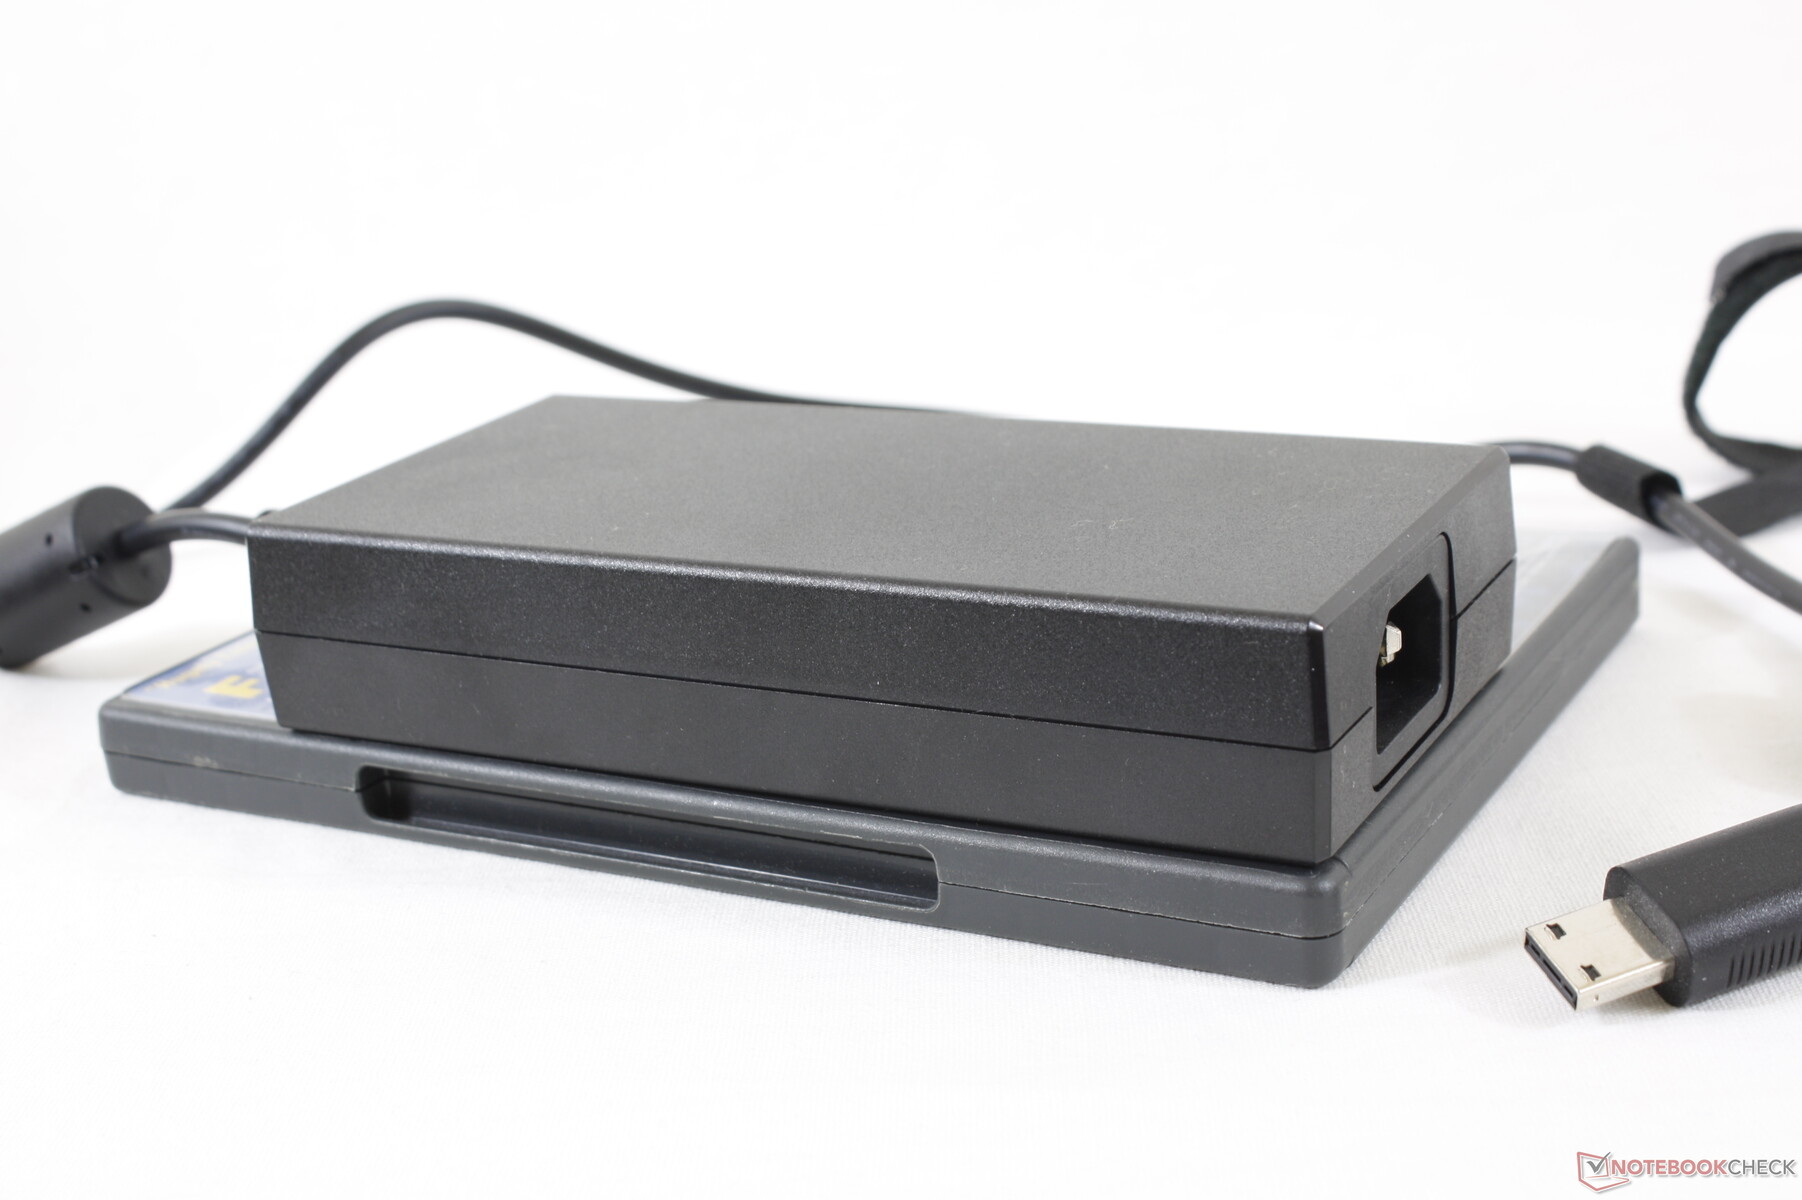
Somos capazes de registrar um consumo máximo de 216 W a partir do tamanho médio (~15,3 x 7,3 x 3,0 cm) adaptador de 230 W AC.
| desligado | |
| Ocioso | |
| Carga |
|
Key:
min: | |
| MSI GP66 Leopard 10UG i7-10870H, GeForce RTX 3070 Laptop GPU, Kingston OM8PCP31024F, IPS, 1920x1080, 15.6" | MSI GP65 10SFK-047US i7-10750H, GeForce RTX 2070 Mobile, Samsung SSD PM981 MZVLB1T0HALR, IPS, 1920x1080, 15.6" | Alienware m15 R4 i9-10980HK, GeForce RTX 3070 Laptop GPU, Micron 2300 1TB MTFDHBA1T0TDV, IPS, 1920x1080, 15.6" | Aorus 15P XC i7-10870H, GeForce RTX 3070 Laptop GPU, ESR512GTLCG-EAC-4, IPS, 1920x1080, 15.6" | Asus ROG Zephyrus G15 GA503Q R9 5900HS, GeForce RTX 3080 Laptop GPU, SK Hynix HFM001TD3JX013N, IPS-Level, 2560x1440, 15.6" | MSI GF65 Thin 10UE i7-10750H, GeForce RTX 3060 Laptop GPU, Samsung SSD PM981 MZVLB1T0HALR, IPS, 1920x1080, 15.6" | |
|---|---|---|---|---|---|---|
| Power Consumption | -2% | -68% | -8% | 21% | 29% | |
| Idle Minimum * (Watt) | 15.3 | 14.2 7% | 35 -129% | 14 8% | 10 35% | 5.4 65% |
| Idle Average * (Watt) | 21.2 | 18.8 11% | 39 -84% | 17 20% | 12 43% | 12.8 40% |
| Idle Maximum * (Watt) | 22.3 | 23.9 -7% | 48 -115% | 33 -48% | 17 24% | 19.5 13% |
| Load Average * (Watt) | 82.3 | 96.9 -18% | 135 -64% | 96 -17% | 108 -31% | 86.6 -5% |
| Witcher 3 ultra * (Watt) | 191.2 | 185 3% | 194 -1% | 179 6% | 123 36% | 115.7 39% |
| Load Maximum * (Watt) | 216.6 | 233.4 -8% | 252 -16% | 256 -18% | 182 16% | 175.2 19% |
* ... menor é melhor
Vida útil da bateria
A capacidade da bateria aumentou de 51 Wh no GP65 para 65 Wh no GP66. Os tempos de execução da WLAN agora também são muito mais longos em pouco mais de 5 horas para ser quase 1,5 horas a mais do que o que gravamos no GP65.
A duração máxima da bateria, no entanto, poderia ter sido melhor. Ajustar o sistema no modo Super Battery com brilho no mínimo e o iGPU ativo resultaria em um tempo total de execução de apenas 6,5 horas, o que não é muito mais longo do que nossas configurações WLAN.
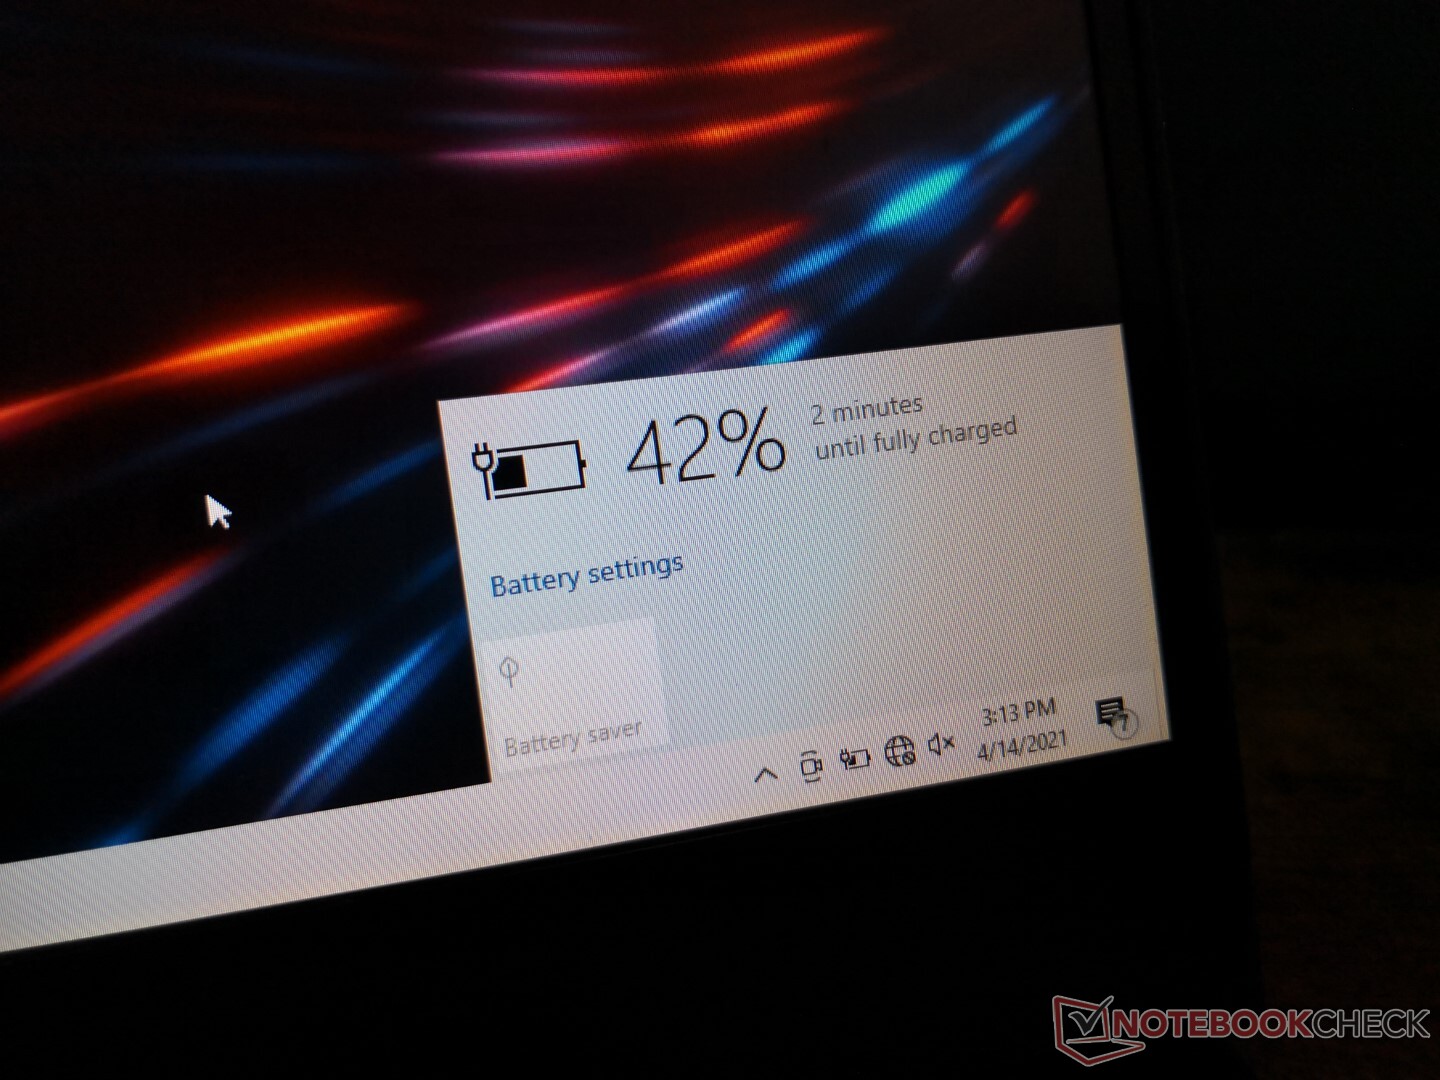
A taxa de recarga de capacidade vazia a plena é muito lenta em mais de 4 horas com o adaptador AC incluído. Suspeitamos que haja um bug de carga porque o tempo estimado de recarga também pode, às vezes, ser impreciso. A maioria dos outros laptops irá recarregar totalmente em apenas 1,5 a 2 horas em comparação.
A bateria recarregará ainda mais lentamente ou não recarregará de forma alguma quando estiver rodando jogos. Por exemplo, jogando Witcher 3 no adaptador AC a 20% de carga da bateria durante uma hora carregaria a bateria a apenas 23% apenas (ou + 3% no decorrer de uma hora).
| MSI GP66 Leopard 10UG i7-10870H, GeForce RTX 3070 Laptop GPU, 65 Wh | MSI GP65 10SFK-047US i7-10750H, GeForce RTX 2070 Mobile, 51 Wh | Alienware m15 R4 i9-10980HK, GeForce RTX 3070 Laptop GPU, 86 Wh | Aorus 15P XC i7-10870H, GeForce RTX 3070 Laptop GPU, 99 Wh | Asus ROG Zephyrus G15 GA503Q R9 5900HS, GeForce RTX 3080 Laptop GPU, 90 Wh | MSI GF65 Thin 10UE i7-10750H, GeForce RTX 3060 Laptop GPU, 51 Wh | |
|---|---|---|---|---|---|---|
| Duração da bateria | -27% | -34% | 42% | 72% | 23% | |
| Reader / Idle (h) | 6.6 | 3.7 -44% | 9.5 44% | 12.1 83% | 11.1 68% | |
| WiFi v1.3 (h) | 5.1 | 3.7 -27% | 2.7 -47% | 6.7 31% | 9.4 84% | 4.6 -10% |
| Load (h) | 1 | 0.9 -10% | 1.5 50% | 1.5 50% | 1.1 10% |
Pro
Contra
Veredicto
Após dois anos com o GP65 o GP66 é uma renovação completa e uma enorme melhoria em geral. Pode ter ficado um pouco maior de gen para gen, mas o aumento de tamanho parece justificado considerando o salto no desempenho gráfico, melhorias no ruído do ventilador, temperaturas centrais mais baixas, design mais elegante e maior vida útil da bateria. As impressões gerais são muito próximas do GE66, que supostamente é o modelo mais avançado.
O GP66 perfura acima de seu peso médio para ser tão bom quanto muitos modelos superiores.
Há um enorme asterisco acima da "gama média", no entanto, como o GP66 não é barato no momento, apesar de sua classificação. Os preços variam enormemente de US$ 2.500 a US$ 3.000 para estar na categoria de alta gama ou entusiasta. Esperamos que esta seja apenas uma questão de fornecimento que possa ser resolvida em pouco tempo, pois podemos definitivamente ver o GP66 se tornar um modelo popular por causa de seus atributos acima da média em todos os lugares.
Independentemente de seu preço high-end, este ainda é um laptop de gama média e, portanto, os usuários devem estar cientes de suas deficiências. Não há Thunderbolt, câmera IR, ou leitor de cartões SD, por exemplo, e a tela é fraca em relação à maioria dos outros laptops para jogos. A taxa de recarga lenta e inconsistente da bateria certamente merece uma olhada mais de perto. Até lá, não espere que a bateria seja carregada a uma taxa decente quando estiver jogando.
Preço e disponibilidade
MSI GP66 Leopard 10UG
- 04/18/2021 v7 (old)
Allen Ngo
Price comparison

