Para gamers e criadores de conteúdo: Lenovo Legion 5 Pro Notebook Review
No ano passado, a Lenovo entregou um laptop de alta tecnologia excepcionalmente impressionante e extremamente popular no Legion 5 Pro. Já testamos a versão RTX 3070 Ti da Nvidia, então pensamos agora em dar uma olhada mais de perto na versão RTX 3060 de 120W ligeiramente mais barata. Para os jogadores que priorizam a relação custo-benefício e que estão satisfeitos em rodar a 60 FPS nos últimos jogos em QHD, ou para os criativos que se concentram no desempenho da CPU, a Lenovo reuniu aqui uma combinação convincente. Os competidores incluirão ambos outros laptops RTX-3060 com CPUs comparáveis Intel i7 ou AMD Ryzen 7, tais como as recentemente testadas HP Omen 16ou cadernos significativamente mais caros, como o Gigabyte Aero 16 com um i9 a bordo. Esta última será dificilmente desenvolvida para desenvolver seu potencial de desempenho no mesmo grau
Possíveis concorrentes em comparação
Avaliação | Data | Modelo | Peso | Altura | Size | Resolução | Preço |
|---|---|---|---|---|---|---|---|
| 86.6 % v7 (old) | 07/2022 | Lenovo Legion 5 Pro 16IAH7H i7-12700H, GeForce RTX 3060 Laptop GPU | 2.6 kg | 27 mm | 16.00" | 2560x1600 | |
| 85.5 % v7 (old) | 05/2022 | HP Omen 16-b1090ng i7-12700H, GeForce RTX 3070 Ti Laptop GPU | 2.3 kg | 23 mm | 16.10" | 2560x1440 | |
| 86 % v7 (old) | 04/2022 | HP Omen 16-c0077ng R7 5800H, Radeon RX 6600M | 2.3 kg | 26 mm | 16.10" | 2560x1440 | |
| 84.7 % v7 (old) | 03/2022 | Gigabyte Aero 16 YE5 i9-12900HK, GeForce RTX 3080 Ti Laptop GPU | 2.3 kg | 22.4 mm | 16.00" | 3840x2400 | |
| 86.7 % v7 (old) | 03/2022 | Alienware x14 i7 RTX 3060 i7-12700H, GeForce RTX 3060 Laptop GPU | 1.8 kg | 14.5 mm | 14.00" | 1920x1080 | |
| 88 % v7 (old) | 03/2022 | Lenovo Legion 5 Pro 16 G7 i7 RTX 3070Ti i7-12700H, GeForce RTX 3070 Ti Laptop GPU | 2.6 kg | 26.6 mm | 16.00" | 2560x1600 |
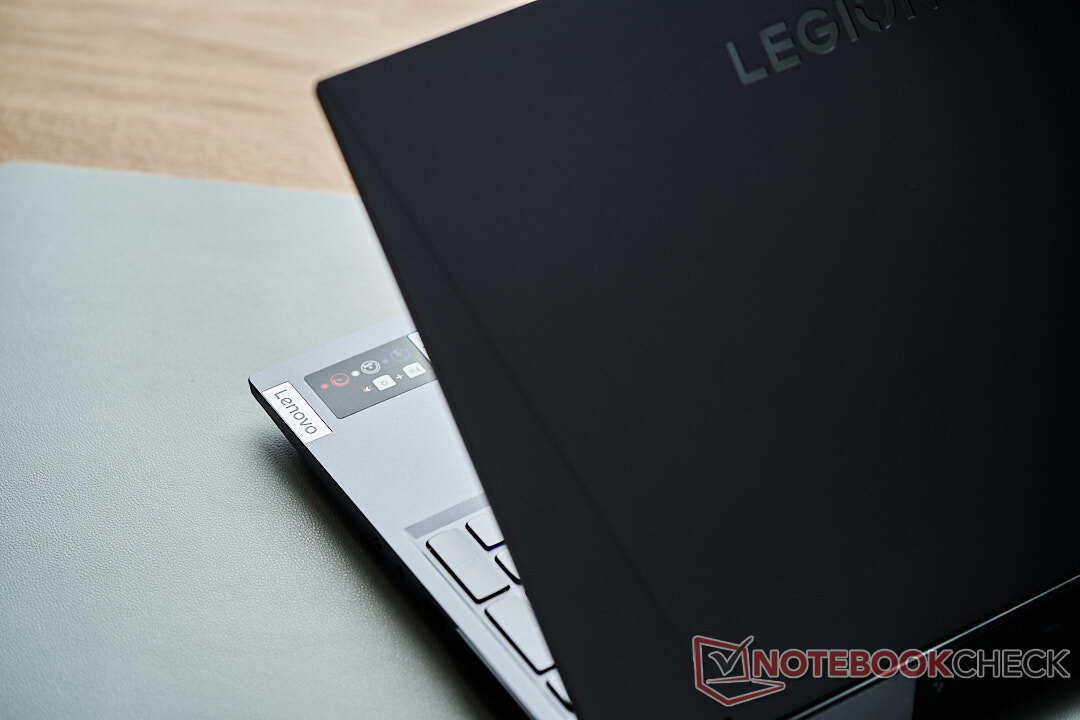
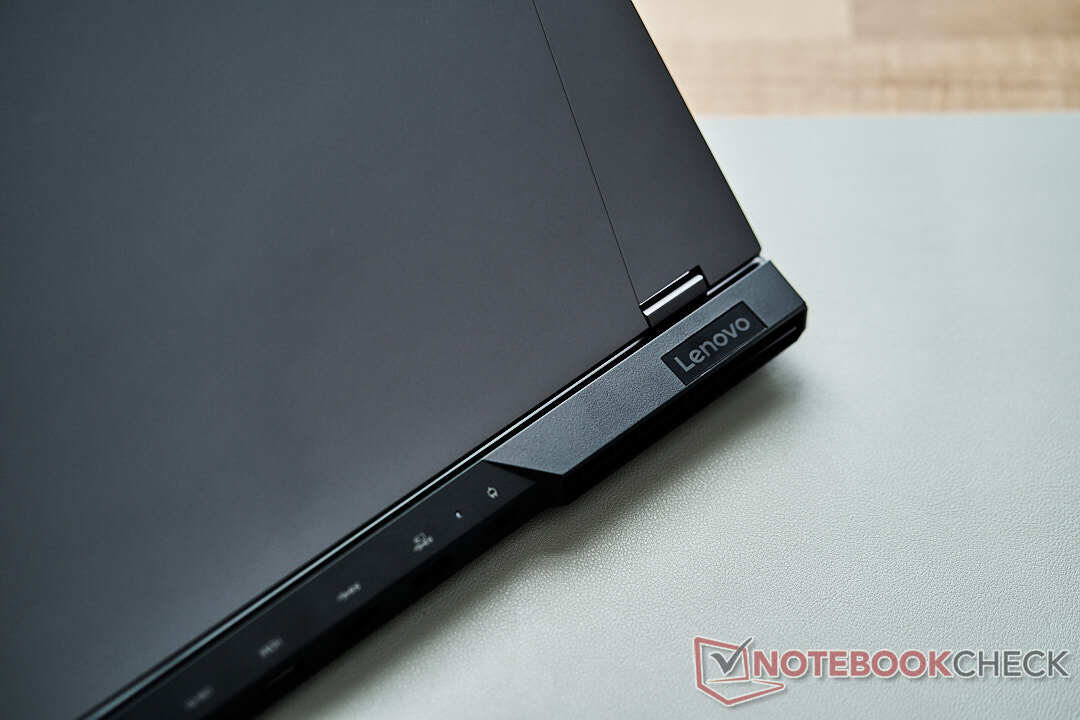
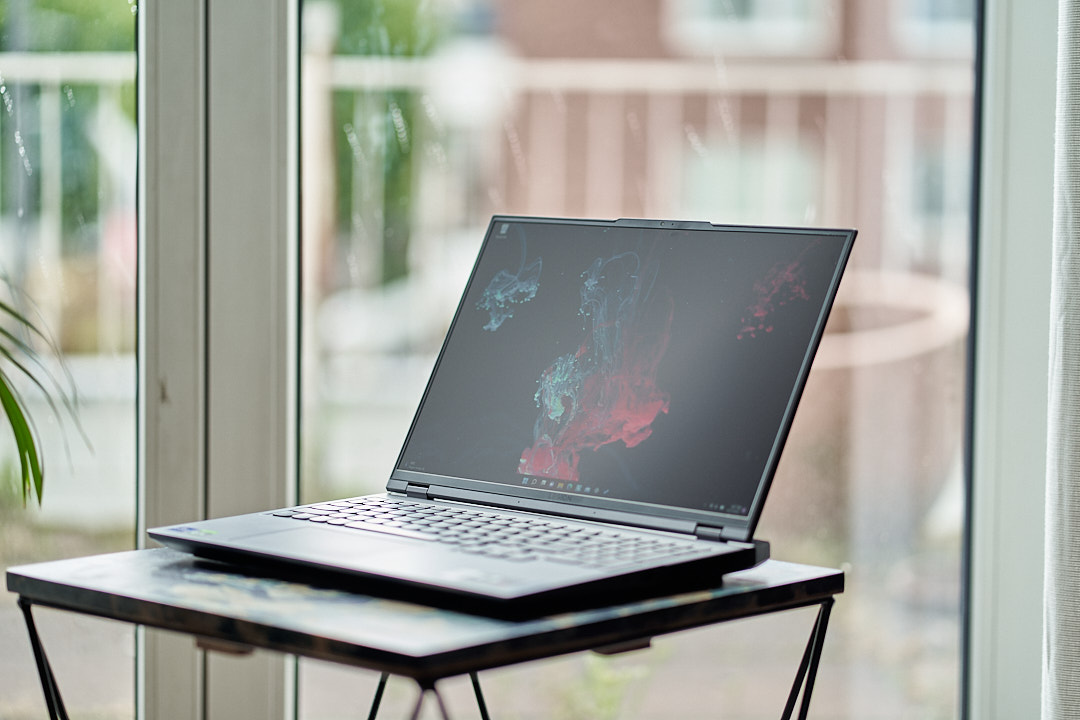
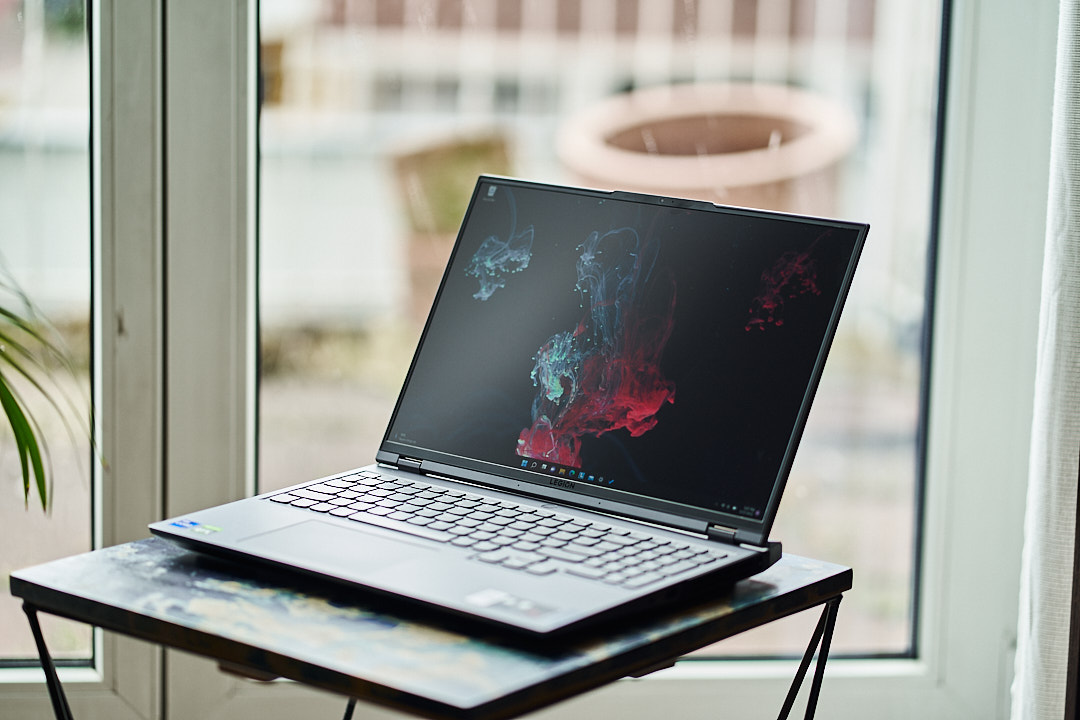
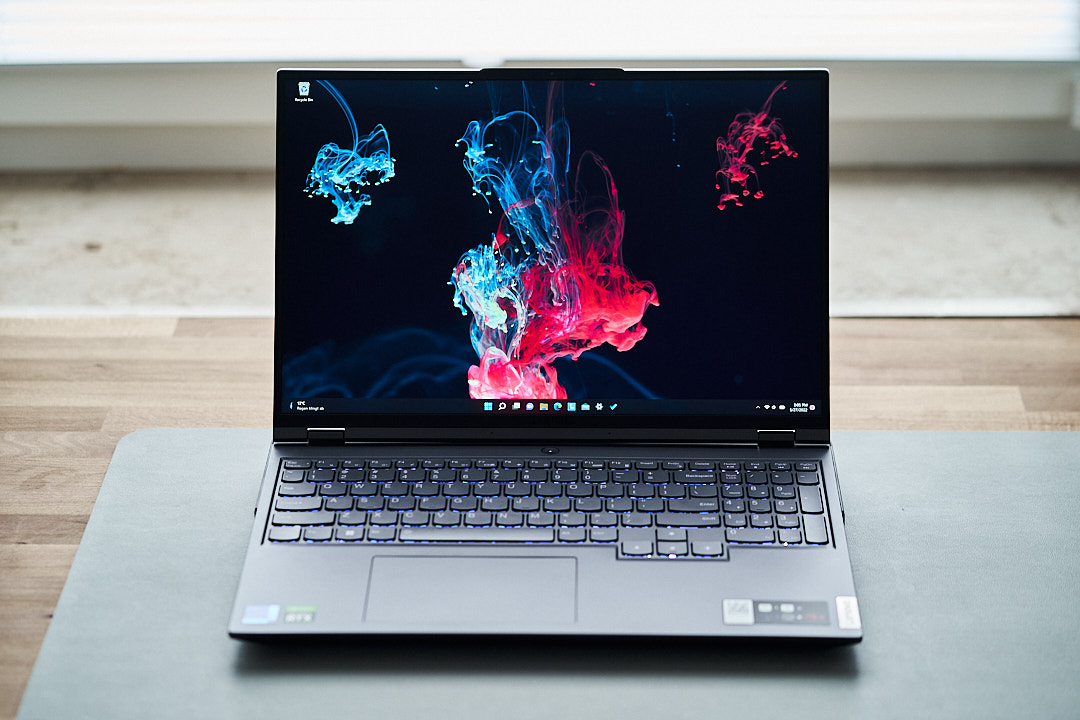
Case - Legion 5 Pro com bastante metal
A Lenovo fornece uma caixa metálica sólida para o Legion 5 Pro. Sua fabricação é impecável, o laptop de 16 polegadas de qualidade de jogo escoa e nem o manuseio casual ou deliberado resulta em superfícies flexionadas ou evoca ruídos desagradáveis de rangidos. Mesmo a tampa, que muitas vezes é um calcanhar de Aquiles em muitos laptops competitivos, é testada com firmeza, deixando a tela rigidamente na posição desejada.
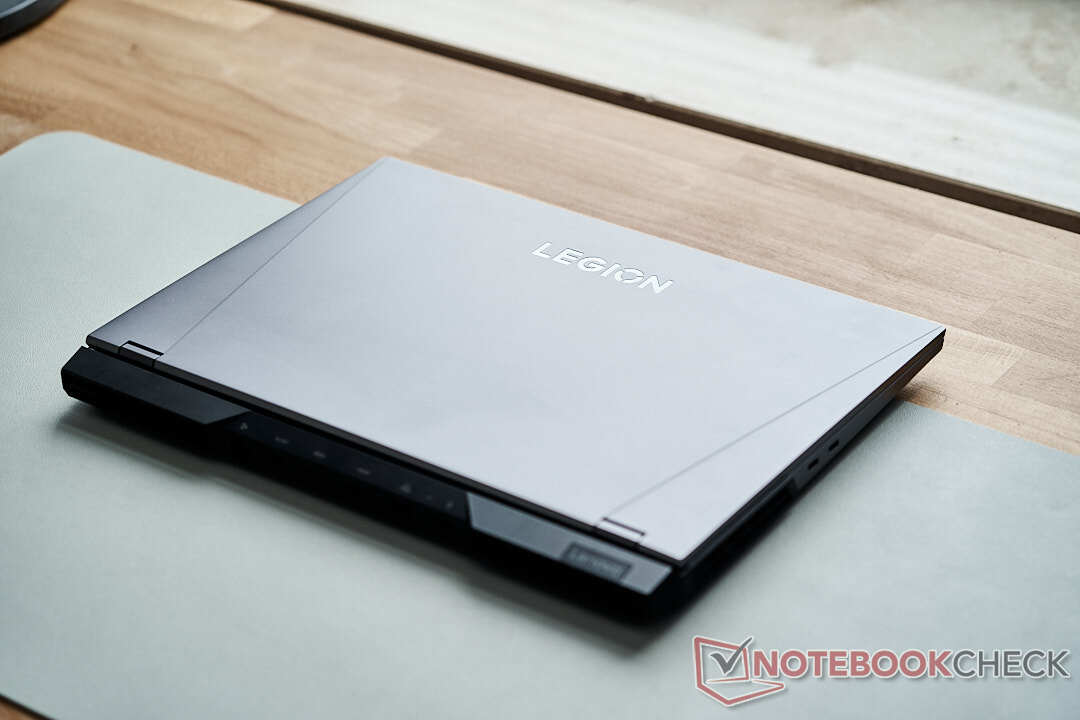
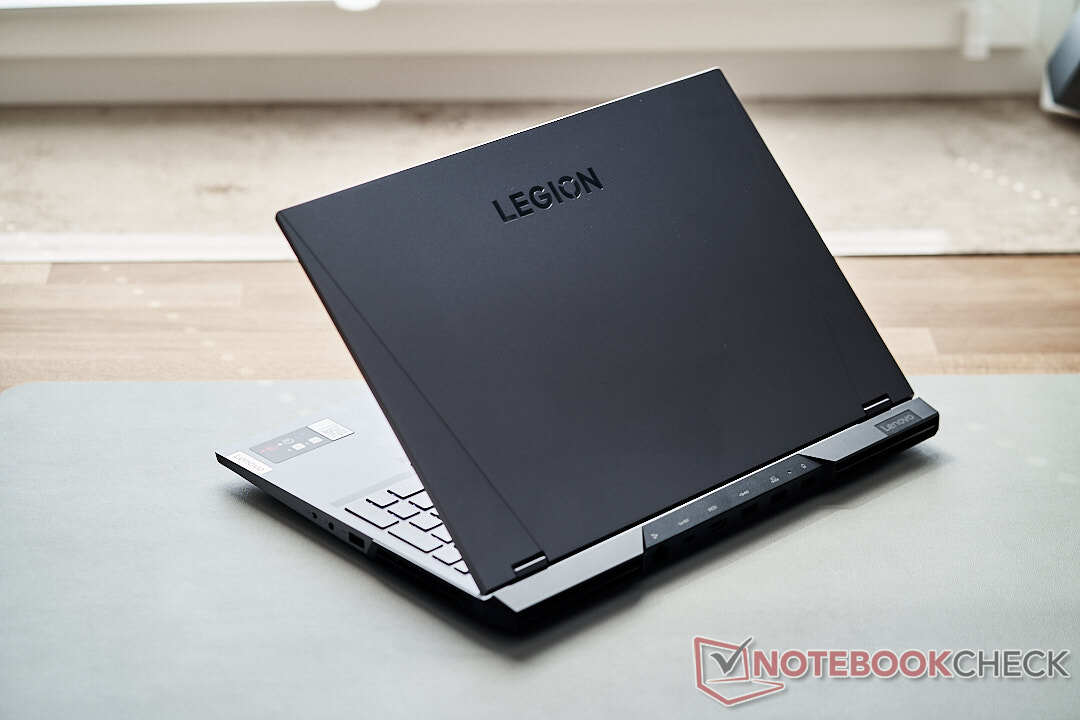
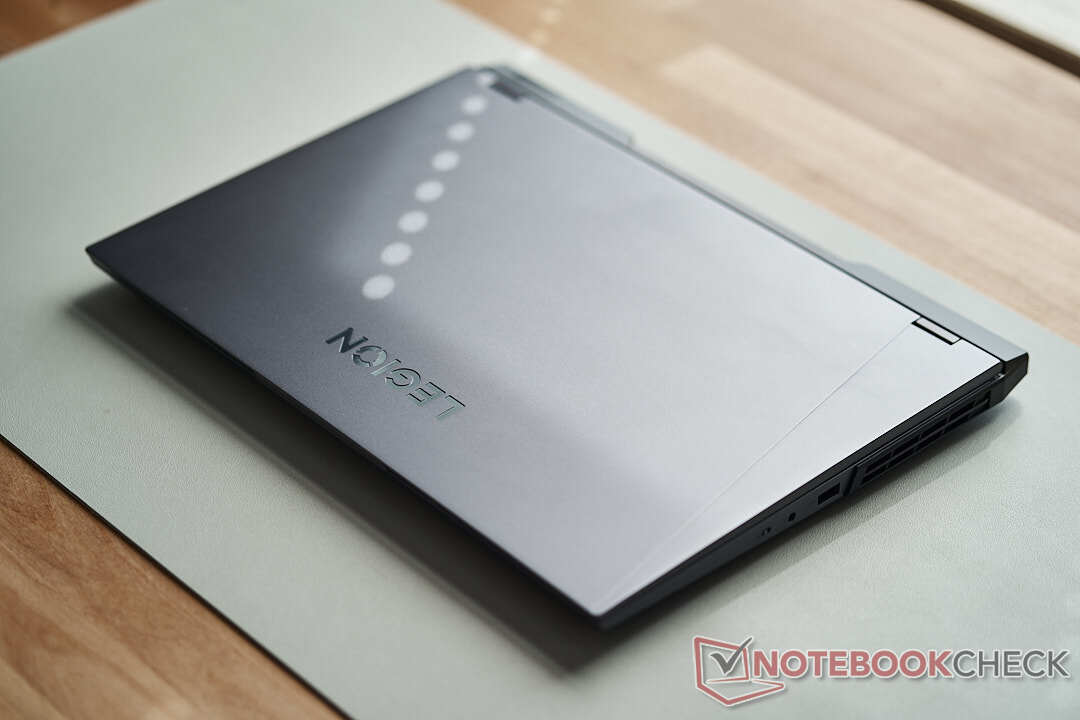
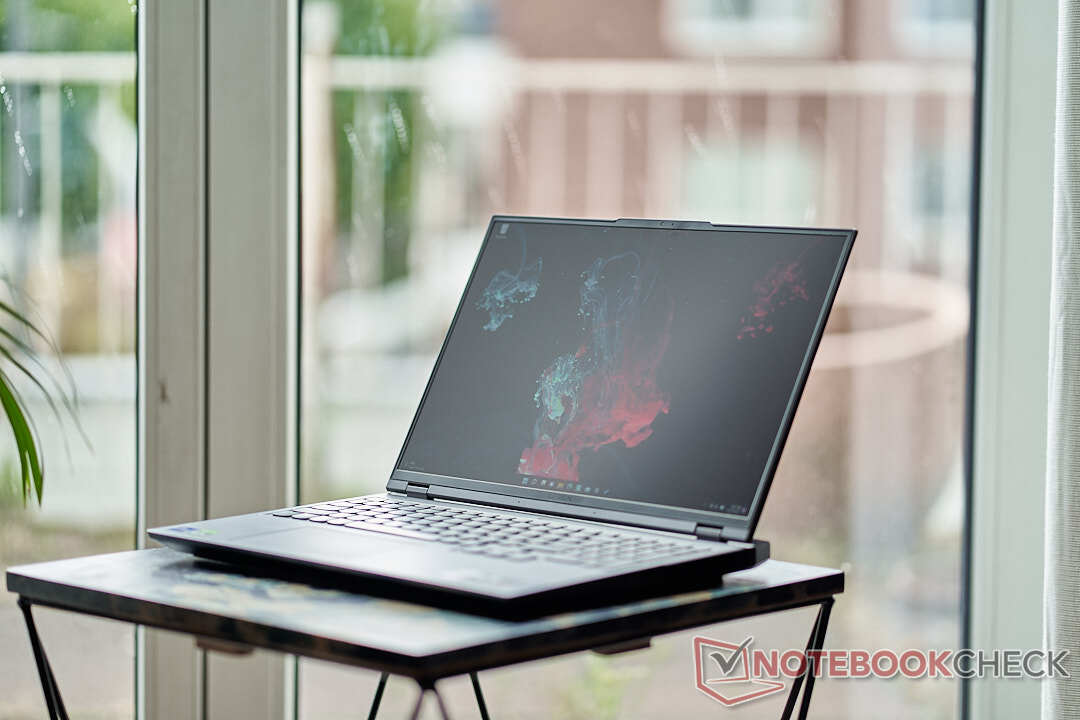
Em termos de peso, o uso pesado de materiais metálicos é perceptível. O Legion é um dos dispositivos mais pesados de todos os comparáveis. As aberturas de refrigeração estão espalhadas pela base da unidade. A Lenovo está encurtando a tendência de apresentar dispositivos cada vez mais finos e menores e tem claramente focado na robustez e no potencial de resfriamento para esta potente exposição de hardware.
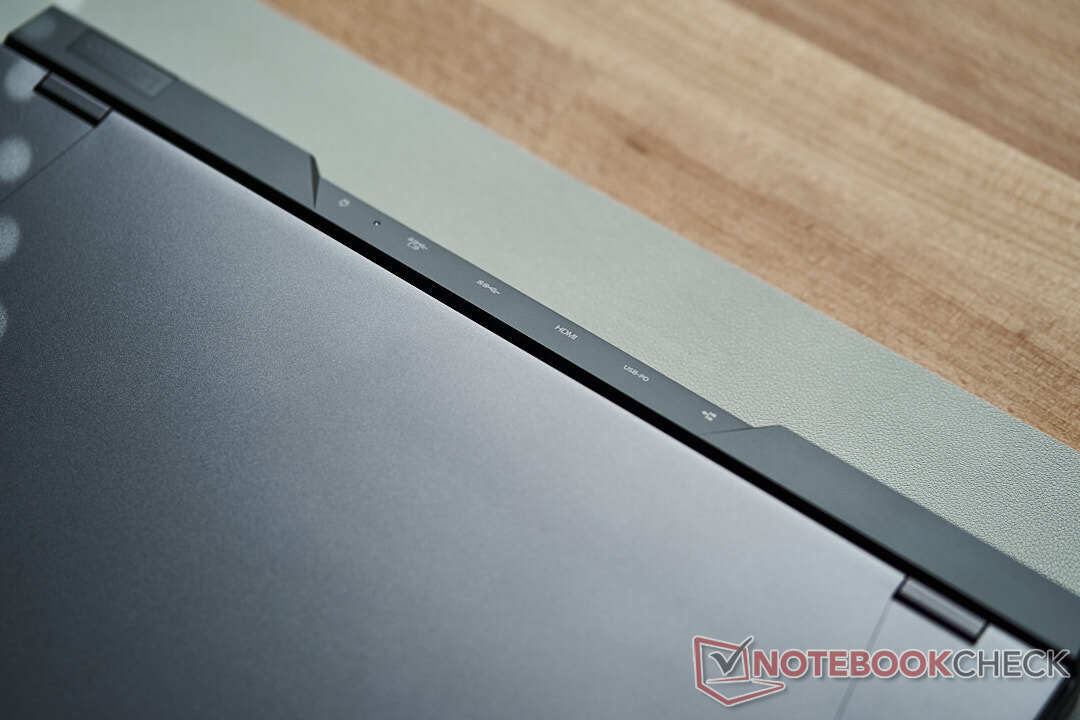
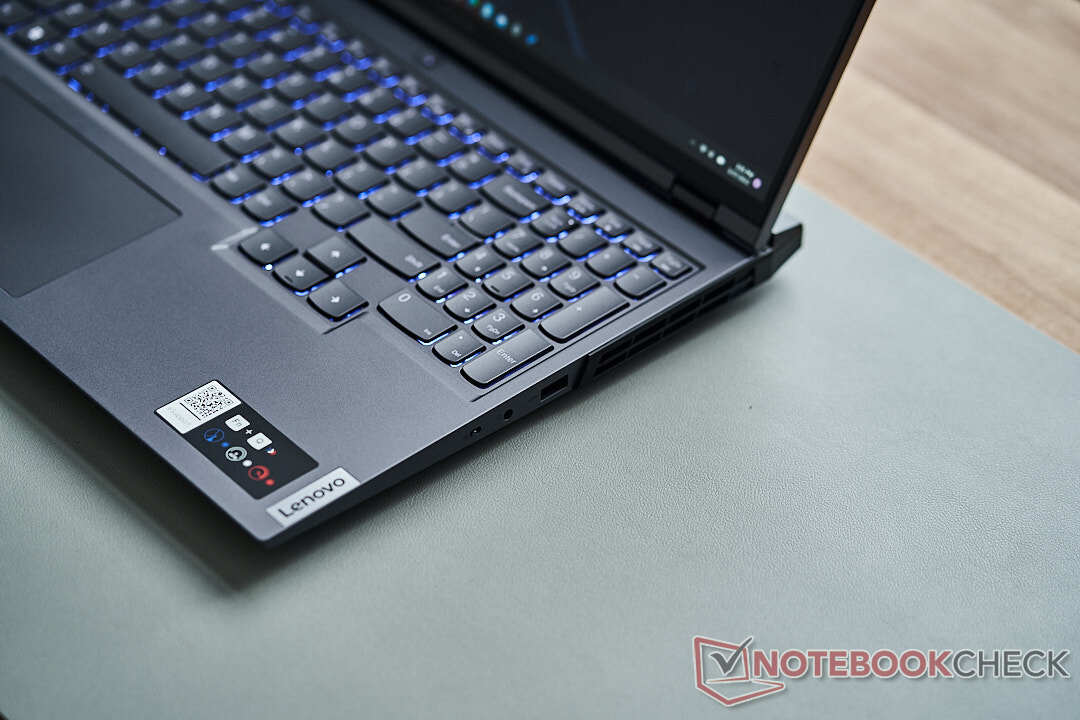
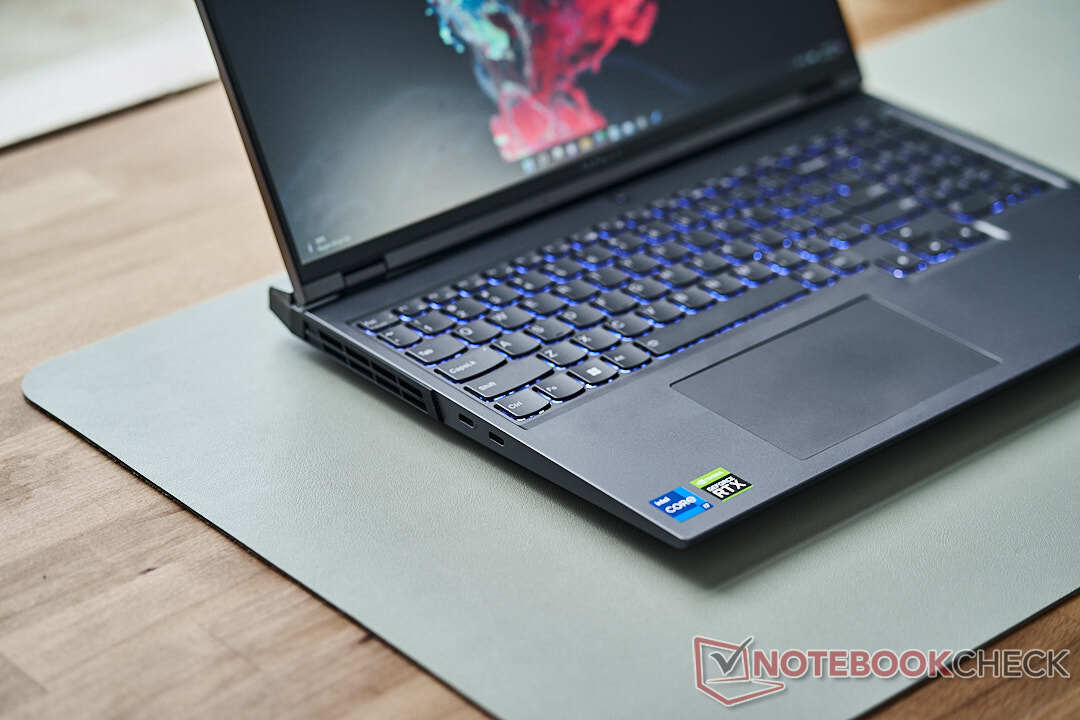
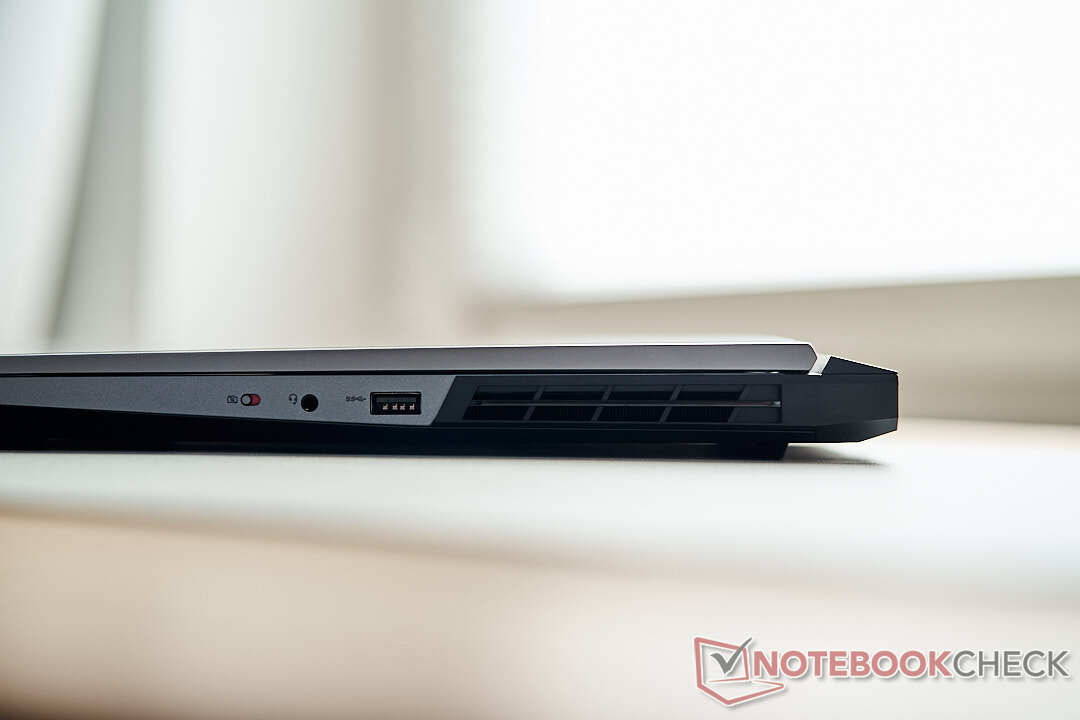
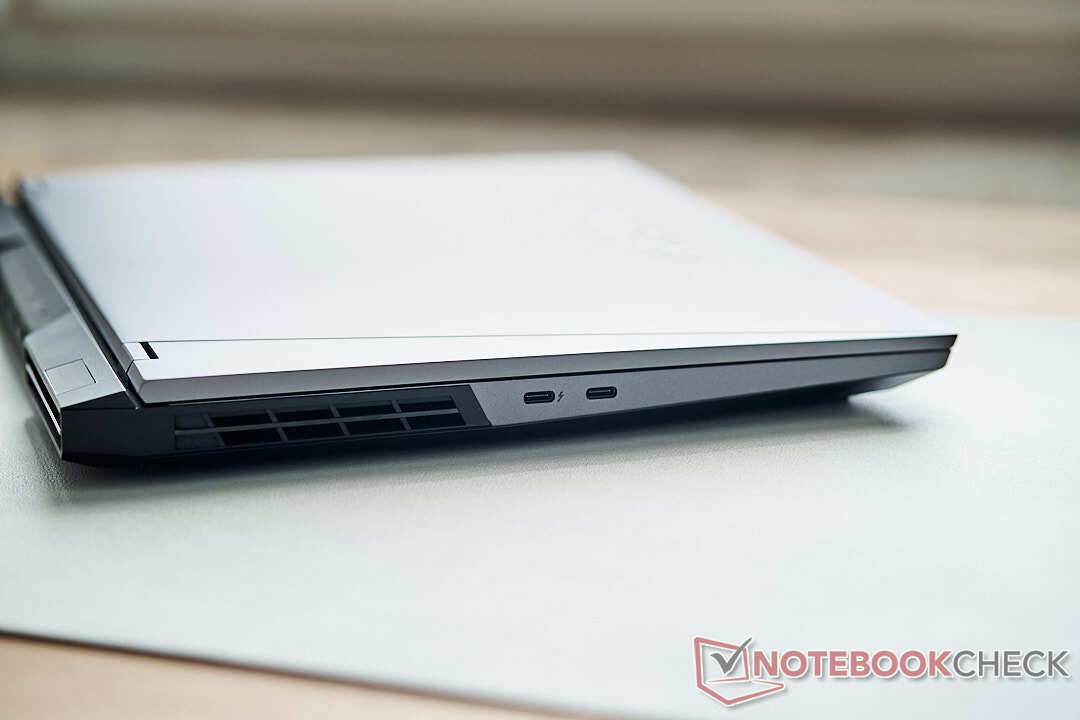
Conectividade - Está tudo aí com Thunderbolt 4 e USB-C Power Delivery
A Lenovo também dá um bom exemplo em termos do tipo e número de portas e slots que estão distribuídos em três lados do case. Ergonomicamente, ela favorece os usuários destros fornecendo apenas uma única porta USB-A (USB 3.2 Gen 1) no lado direito da caixa. Isto reduz o risco de ficar enredado em cabos de exibição ou de rede com o mouse. A título de exemplo, esta porta é ideal para dongles sem fio para dispositivos periféricos.
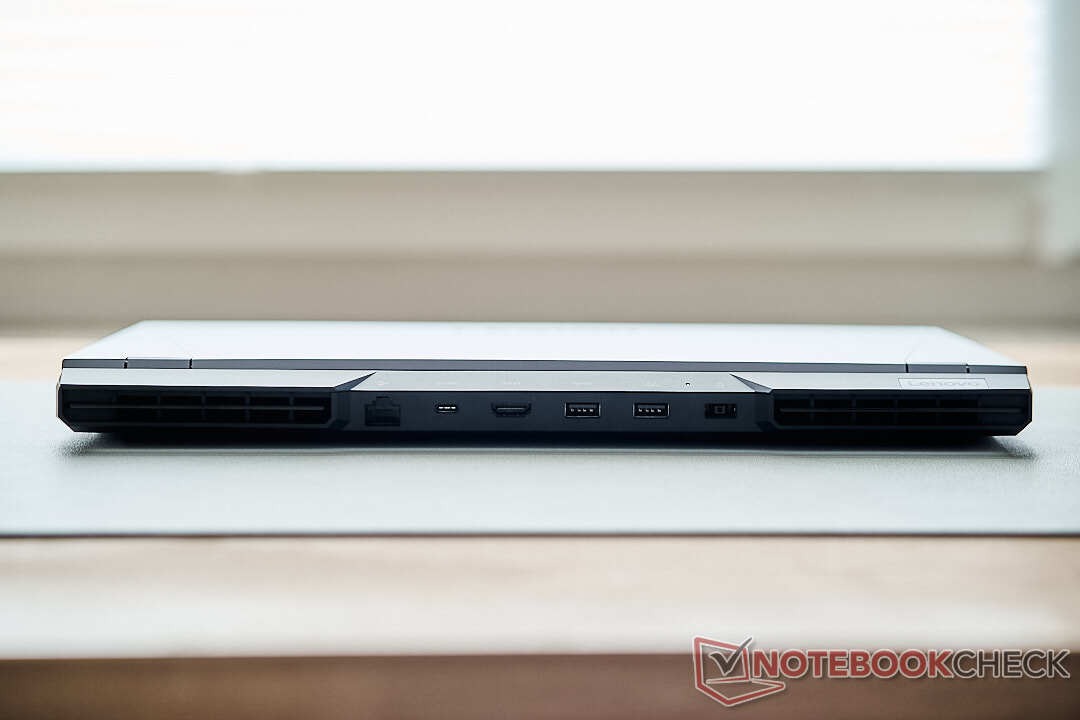
À esquerda há duas portas USB-C de última geração, uma é Thunderbolt 4 e a outra está em conformidade com o padrão USB 3.2 Gen 2 com suporte completo de 20 Gbit/s e Displayport 1.4. O restante das portas pode ser encontrado na parte de trás da caixa, onde a Lenovo explorou totalmente o espaço disponível. Além de duas outras portas USB-A 3.2 Gen-1, há uma terceira porta USB-C, através da qual o laptop também pode ser carregado até 135 W. A conectividade é complementada por uma porta HDMI e uma porta RJ45 para redes com fio. O slot da tomada elétrica também está na parte de trás da caixa.
Dada a variedade e colocação de portas e slots, o Legion 5 Pro pode ser prontamente implantado como um dispositivo de reposição de mesa com múltiplos monitores e periféricos, e como um dispositivo móvel é equipado para qualquer situação. Há também a oportunidade de limitar o uso de dongles para o adaptador DisplayPort.
Comunicação
O Legion 5 Pro está equipado com o extremamente popular módulo Intel AX211 WLAN. Com Wi-Fi 6E a bordo, ele não fornece apenas o padrão Wi-Fi mais atual. O cartão oferece todo o seu potencial e ocupa a primeira posição entre os dispositivos comparáveis. Não é apenas que a velocidade de transferência de dados é impressionante, mas também que não desaponta como um notebook de jogos no uso diário. Com taxas de transferência estáveis e rápidas, mesmo grandes downloads de jogos não têm nenhuma conseqüência. Uma porta Gigabit Ethernet está disponível para conexões com fio. Aqui teríamos preferido a porta mais rápida de 2,5 GbE, já que ela já está instalada em muitos dispositivos concorrentes. As vantagens de velocidade em redes comensuráveis ou ao conectar a sistemas NAS são enormes e teriam sido bem combinadas com o resto da configuração de hardware.
| Networking | |
| iperf3 transmit AX12 | |
| Alienware x14 i7 RTX 3060 | |
| Média Intel Wi-Fi 6E AX211 (1003 - 1501, n=4) | |
| HP Omen 16-c0077ng | |
| iperf3 receive AX12 | |
| Média Intel Wi-Fi 6E AX211 (1178 - 1623, n=4) | |
| Alienware x14 i7 RTX 3060 | |
| HP Omen 16-c0077ng | |
| iperf3 receive AXE11000 6GHz | |
| Lenovo Legion 5 Pro 16IAH7H | |
| Média da turma Gaming (975 - 1775, n=35, últimos 2 anos) | |
| Média Intel Wi-Fi 6E AX211 (700 - 1857, n=226) | |
| iperf3 transmit AXE11000 6GHz | |
| Lenovo Legion 5 Pro 16IAH7H | |
| Média da turma Gaming (723 - 1868, n=36, últimos 2 anos) | |
| Média Intel Wi-Fi 6E AX211 (385 - 1851, n=226) | |
Webcam
No que diz respeito à webcam, a Lenovo oferece uma tarifa padrão; infelizmente, não é melhor do que a que estamos acostumados com laptops para jogos há anos. A qualidade da imagem é sem dúvida aceitável para uma ou outra chamada de zoom, mas aqui gostaríamos de ter visto melhorias gerais na rendição de cores, resolução e faixa dinâmica.

")
")
Acessórios
Além do laptop em si, somentea fonte de alimentação está na caixa. Isto foi padronizado para todas as configurações Legion 5 Pro, portanto nosso modelo RTX-3060 também recebe a fonte de alimentação de 300 W, de certa forma superdimensionada. O peso adicional de 1 kg (~2,2 lb) apenas para a fonte de alimentação deve ser levado em conta se você planeja estar na estrada com o Legion.
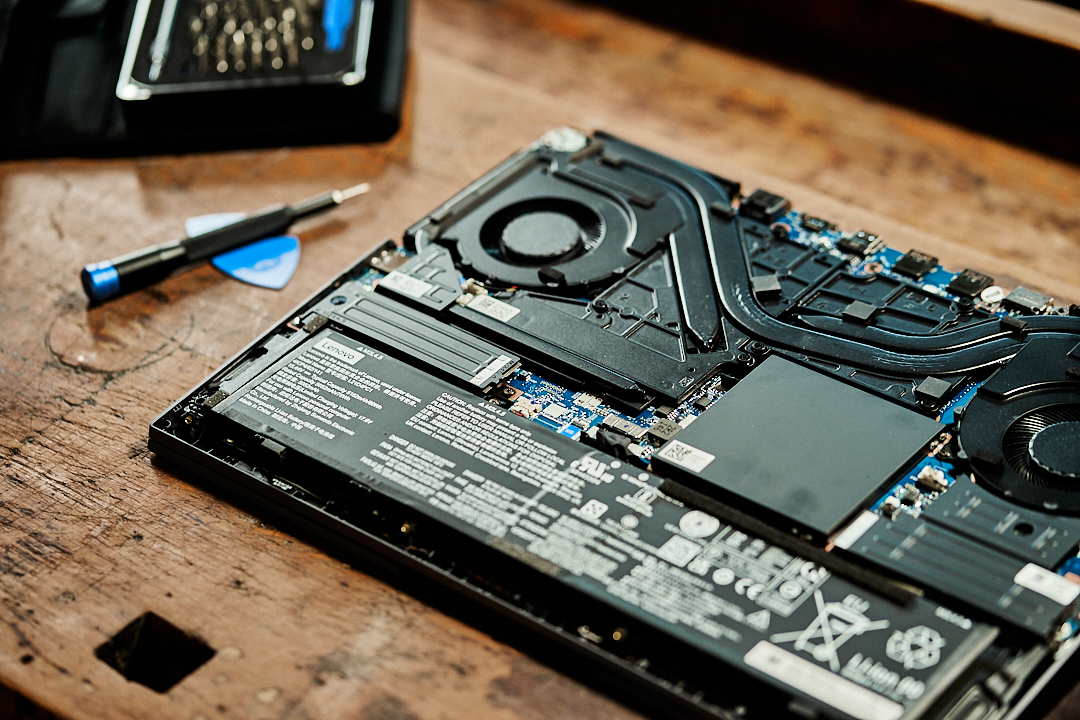
Manutenção
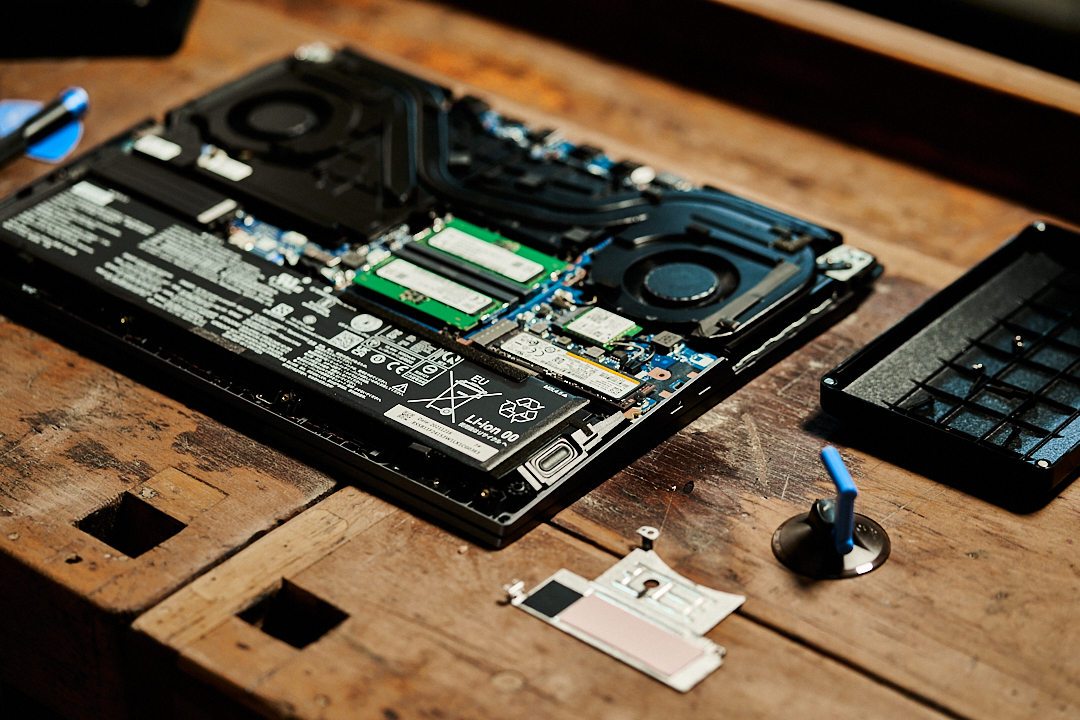
Para reparos ou atualizações, o Legion requer que dez parafusos de cabeça Philips sejam afrouxados. A Lenovo usa três tamanhos diferentes, portanto, você deve ter o cuidado de lembrar onde pertencem os diferentes parafusos. A remoção da placa de base requer mais esforço do que gostaríamos. Particularmente os elementos plásticos no terço posterior da placa são fixados de forma muito apertada. Trabalhamos progressivamente do centro da frente para a parte de trás da placa com ajudas apropriadas. Para soltar as tampas plásticas, talvez seja melhor usar ferramentas apropriadas de iFixit (link de afiliado). Alternativamente, pode-se usar um cartão de crédito de plástico com força aplicada habilmente até que eles se soltem.
Dentro do caso, podemos esperar um quadro arrumado e, acima de tudo, uma visão da elaborada solução de resfriamento para o poderoso hardware. Em princípio, os usuários têm acesso aos dois slots M.2 e à RAM. Para resfriá-los, dissipadores de calor maciços cobrem os acionamentos rápidos, e a RAM está sob uma cobertura de plástico.
Garantia
Na Alemanha, a Legion 5 Pro Lenovo está coberta por uma garantia básica de 2 anos de carry-in.
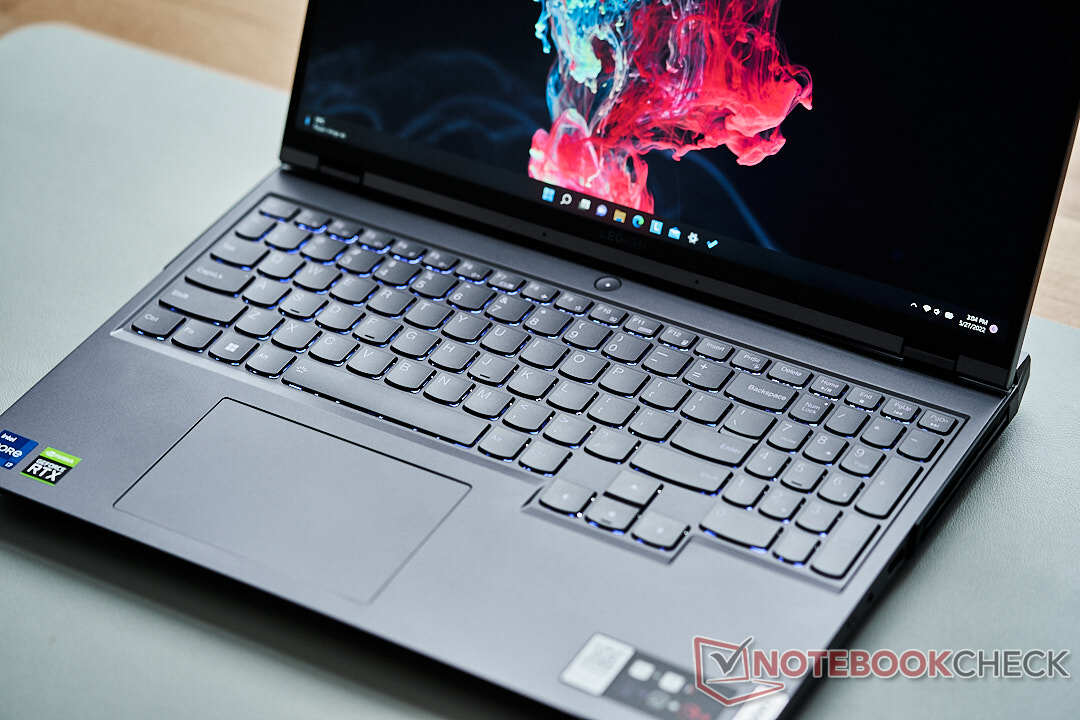
Dispositivos de entrada - uma solução convincente e abrangente tanto para jogadores quanto para criadores de conteúdo
Teclado
O desempenho do teclado para sessões de jogos intensivas é nada menos que notável neste dispositivo de dezesseis polegadas. As chaves chiclet com sua forma e curvatura um tanto incomum oferecem um ponto de pressão palpável, resistência agradável, bem como um curso sólido. A retroiluminação das teclas RGB pode ser ajustada para quatro zonas no teclado e a iluminação funciona bem. Visualmente, as teclas ligeiramente menores no teclado numérico e as teclas de seta de tamanho regular não são tão bem definidas como poderiam ser, mas não há motivo para reclamação em termos puramente funcionais.
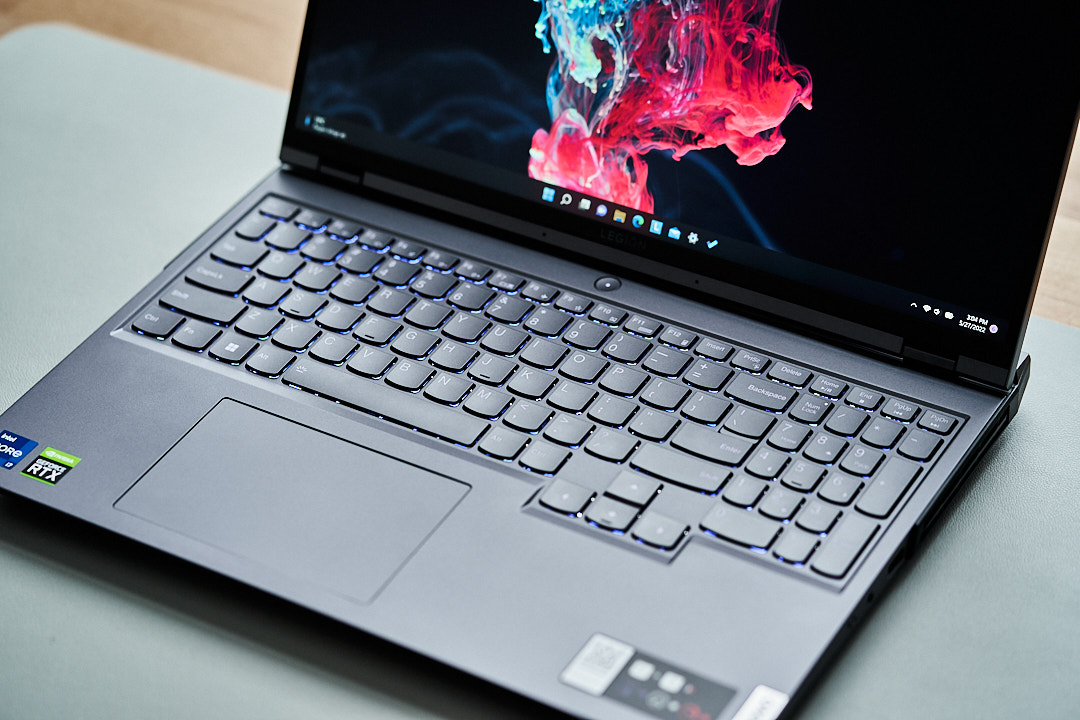
Touchpad
O touchpad é suficientemente grande para um laptop para jogos e permite um deslizamento suave em sua superfície. As propriedades alegres ao rolar e clicar são de alta qualidade. O touchpad do mouse é deslocado ligeiramente para a esquerda, o que ocasionalmente leva a um clique com o botão direito em vez de um clique com o esquerdo quando usado de forma muito casual. Como resultado da alta taxa de atualização de 165 Hz usando o Legion pareceu muito suave e preciso. Embora a maioria dos jogadores utilize um mouse, ninguém deve ter problemas de navegação no Windows ou de rolagem em websites.
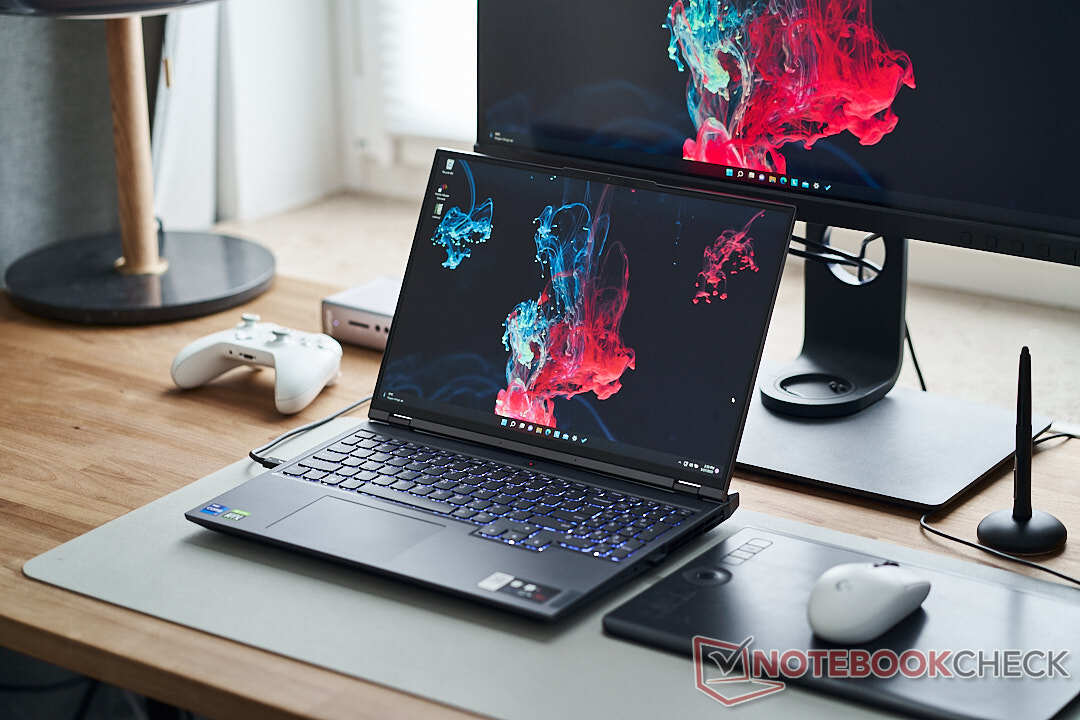
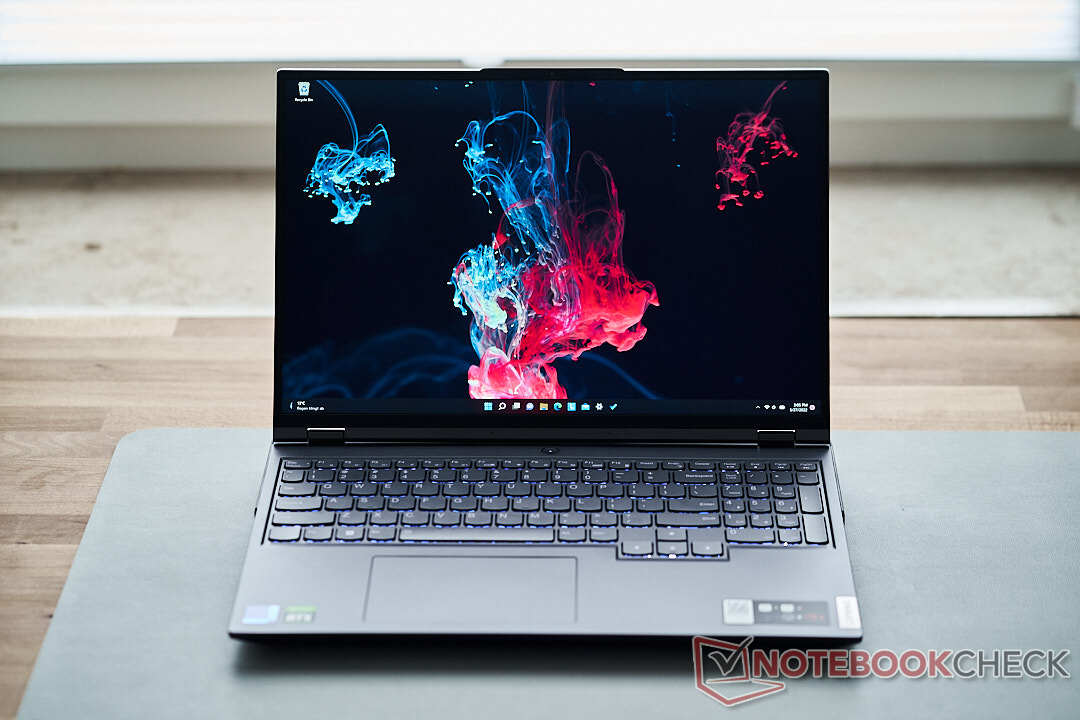
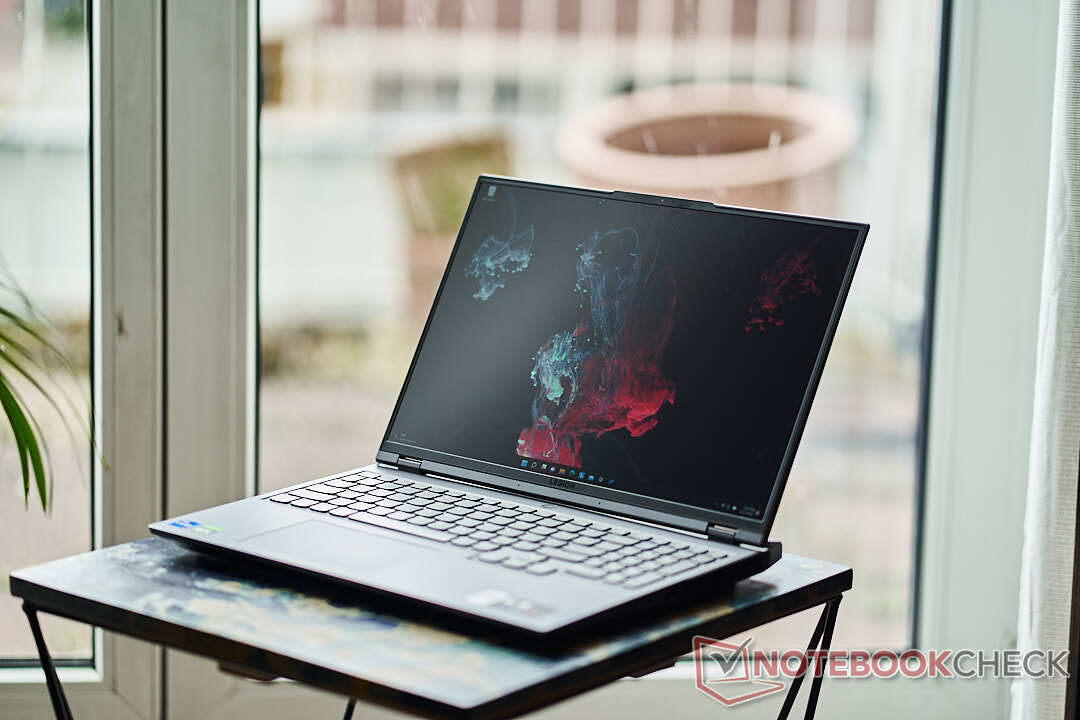
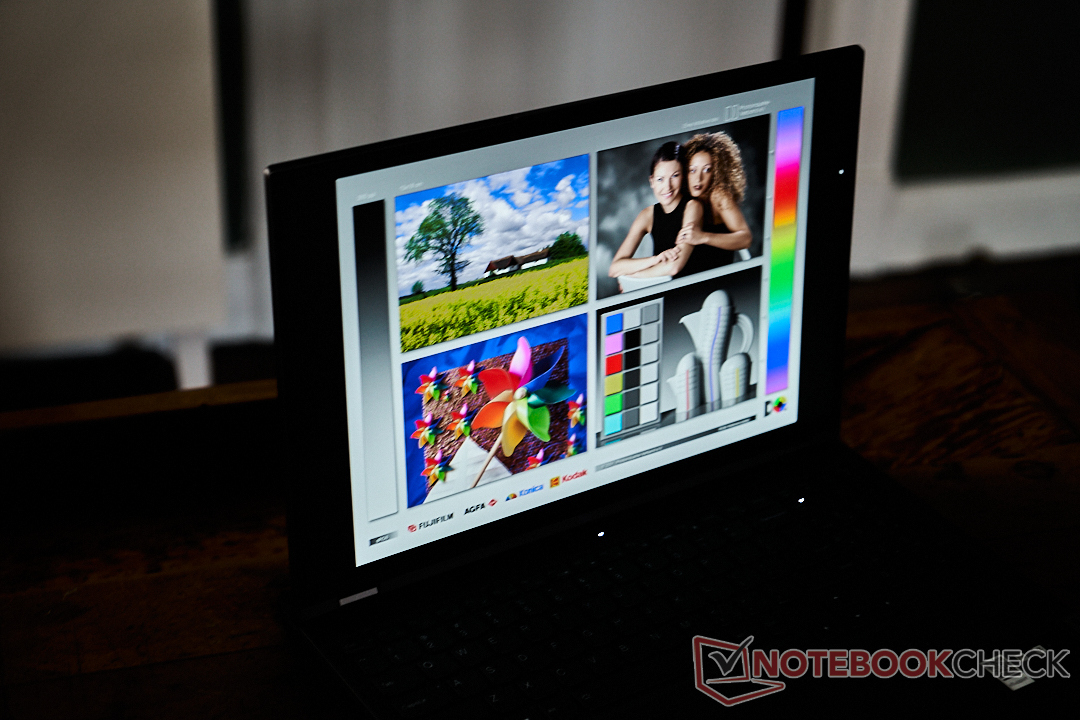
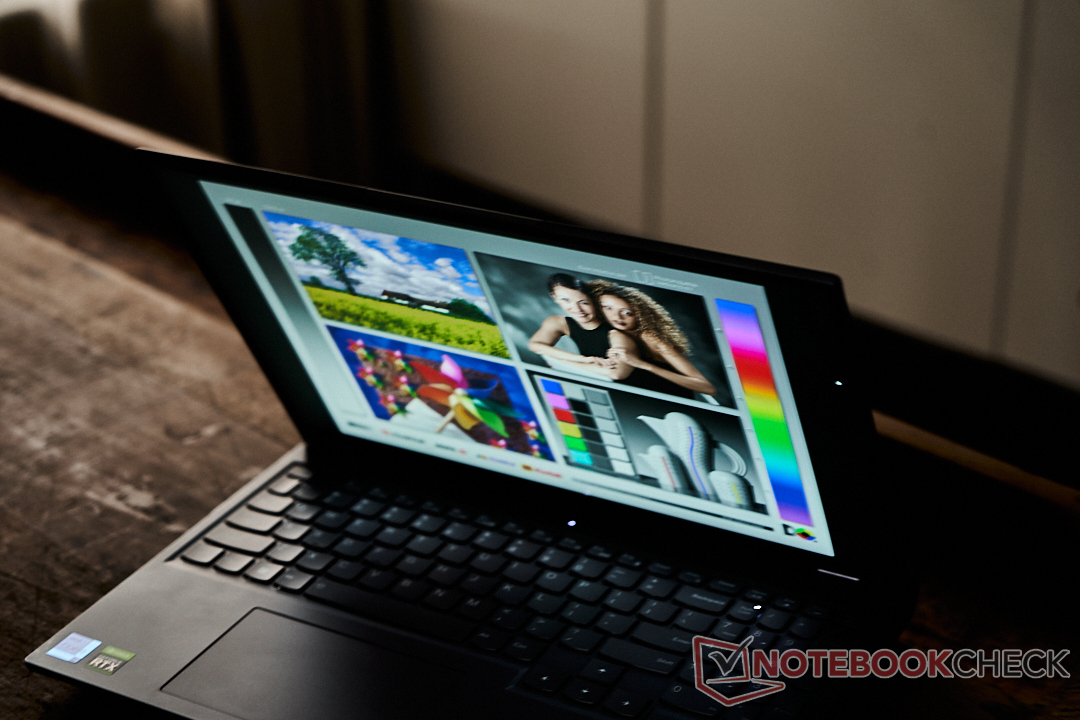
Visor - rápido 165 Hz atende a resolução G-Sync e WQHD

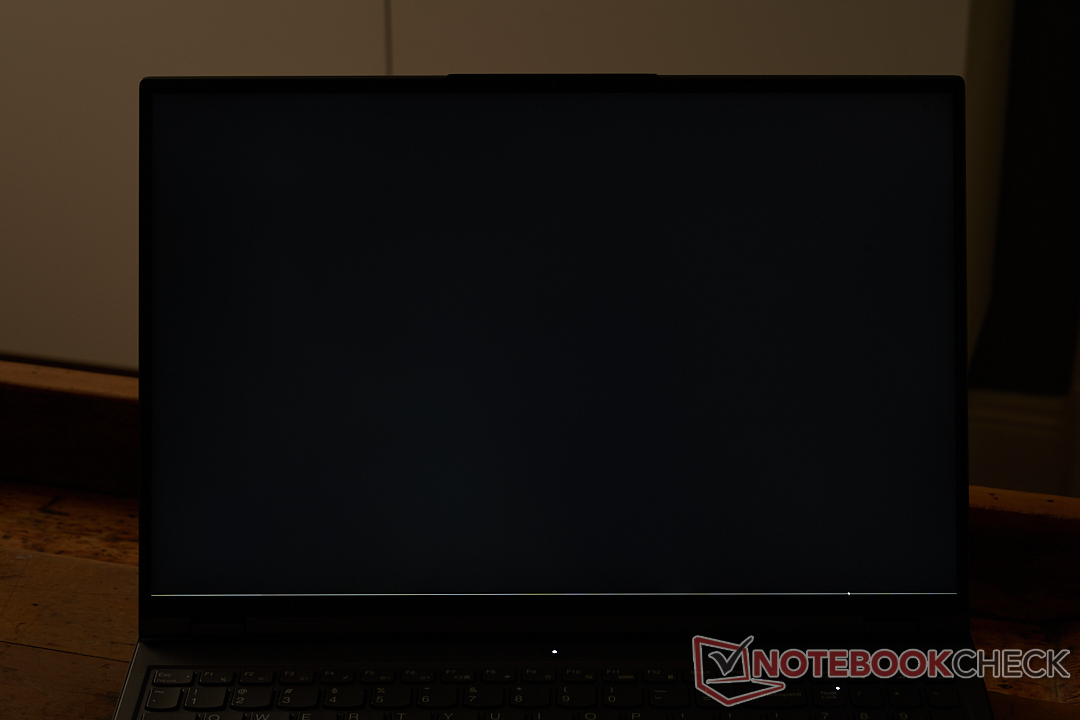
as telas de 16 polegadas estão se tornando cada vez mais padrão nos últimos notebooks de jogos, e a versão Legion é um excelente exemplo. Há muito a oferecer aqui para os jogadores, escritores de conteúdo, bem como para o uso diário. A tela mate oferece contraste IPS típico e excelente legibilidade a partir de praticamente qualquer ângulo. Em comparação com a concorrência, a Lenovo tem o mais alto nível de brilho máximo, embora a luminância da tela em apenas cerca de 85% pudesse ser melhor.
A resolução QHD na versão 16:10 com 2.560 por 1.600 pixels proporciona uma imagem clara em cada cenário de uso, e a combinação do display fosco e seu alto nível de brilho torna viável o uso em ambientes externos. Os jogadores irão apreciar a alta taxa de atualização de 165 Hz e os tempos de resposta agradavelmente rápidos. Embora esta tela não represente um sério desafio para a tela de 360 Hz de 4 ms na tela recentemente testada MSI Vetor GP76ainda corta a mostarda para os atiradores rápidos.
| |||||||||||||||||||||||||
iluminação: 85 %
Contraste: 1144:1 (Preto: 0.45 cd/m²)
ΔE ColorChecker Calman: 2.38 | ∀{0.5-29.43 Ø4.71}
calibrated: 1.1
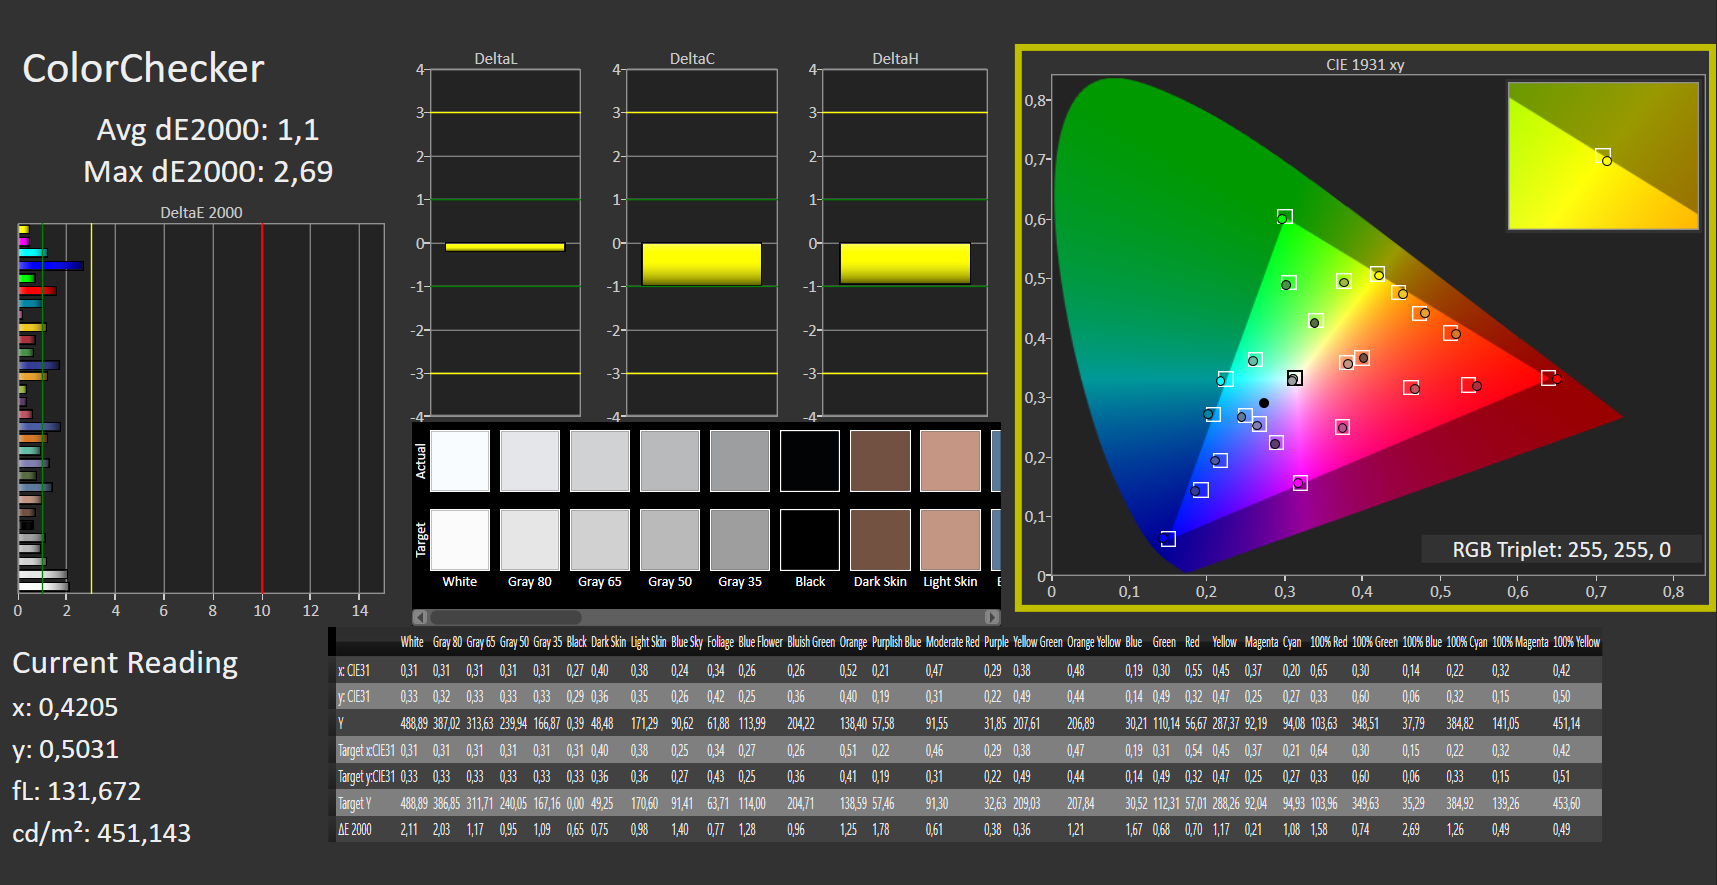
ΔE Greyscale Calman: 2.71 | ∀{0.09-98 Ø4.96}
70.45% AdobeRGB 1998 (Argyll 3D)
98.38% sRGB (Argyll 3D)
68.53% Display P3 (Argyll 3D)
Gamma: 2.49
CCT: 6117 K
| Lenovo Legion 5 Pro 16IAH7H BOE CCQ_NE160QDM_NY1, IPS, 2560x1600, 16" | HP Omen 16-b1090ng BOE09E5, IPS, 2560x1440, 16.1" | HP Omen 16-c0077ng BOE09E5, IPS, 2560x1440, 16.1" | Gigabyte Aero 16 YE5 Samsung SDC416B, AMOLED, 3840x2400, 16" | Alienware x14 i7 RTX 3060 SHP154D, IPS, 1920x1080, 14" | |
|---|---|---|---|---|---|
| Display | 3% | -0% | 24% | ||
| Display P3 Coverage (%) | 68.53 | 71 4% | 68.8 0% | 99.6 45% | |
| sRGB Coverage (%) | 98.38 | 97.9 0% | 96.9 -2% | 100 2% | |
| AdobeRGB 1998 Coverage (%) | 70.45 | 73.3 4% | 71.1 1% | 87.6 24% | |
| Response Times | -31% | -30% | 75% | 2% | |
| Response Time Grey 50% / Grey 80% * (ms) | 14 ? | 14.5 ? -4% | 13 ? 7% | 2.4 ? 83% | 9.6 ? 31% |
| Response Time Black / White * (ms) | 6 ? | 9.4 ? -57% | 10 ? -67% | 2 ? 67% | 7.6 ? -27% |
| PWM Frequency (Hz) | 60 ? | ||||
| Screen | -44% | -27% | 406% | -8% | |
| Brightness middle (cd/m²) | 515 | 335 -35% | 297 -42% | 368 -29% | 434 -16% |
| Brightness (cd/m²) | 475 | 319 -33% | 283 -40% | 368 -23% | 411 -13% |
| Brightness Distribution (%) | 85 | 90 6% | 91 7% | 93 9% | 89 5% |
| Black Level * (cd/m²) | 0.45 | 0.28 38% | 0.22 51% | 0.01 98% | 0.25 44% |
| Contrast (:1) | 1144 | 1196 5% | 1350 18% | 36800 3117% | 1736 52% |
| Colorchecker dE 2000 * | 2.38 | 4.38 -84% | 3.25 -37% | 2.33 2% | 3 -26% |
| Colorchecker dE 2000 max. * | 4.37 | 9.48 -117% | 6.33 -45% | 4.34 1% | 7.1 -62% |
| Colorchecker dE 2000 calibrated * | 1.1 | 1.33 -21% | 1.11 -1% | 0.7 36% | |
| Greyscale dE 2000 * | 2.71 | 7 -158% | 6.97 -157% | 0.8 70% | 5.1 -88% |
| Gamma | 2.49 88% | 2.103 105% | 2.3 96% | 2.119 104% | 2.19 100% |
| CCT | 6117 106% | 6244 104% | 6050 107% | 6569 99% | 6204 105% |
| Média Total (Programa/Configurações) | -24% /
-32% | -19% /
-22% | 241% /
340% | 6% /
1% |
* ... menor é melhor
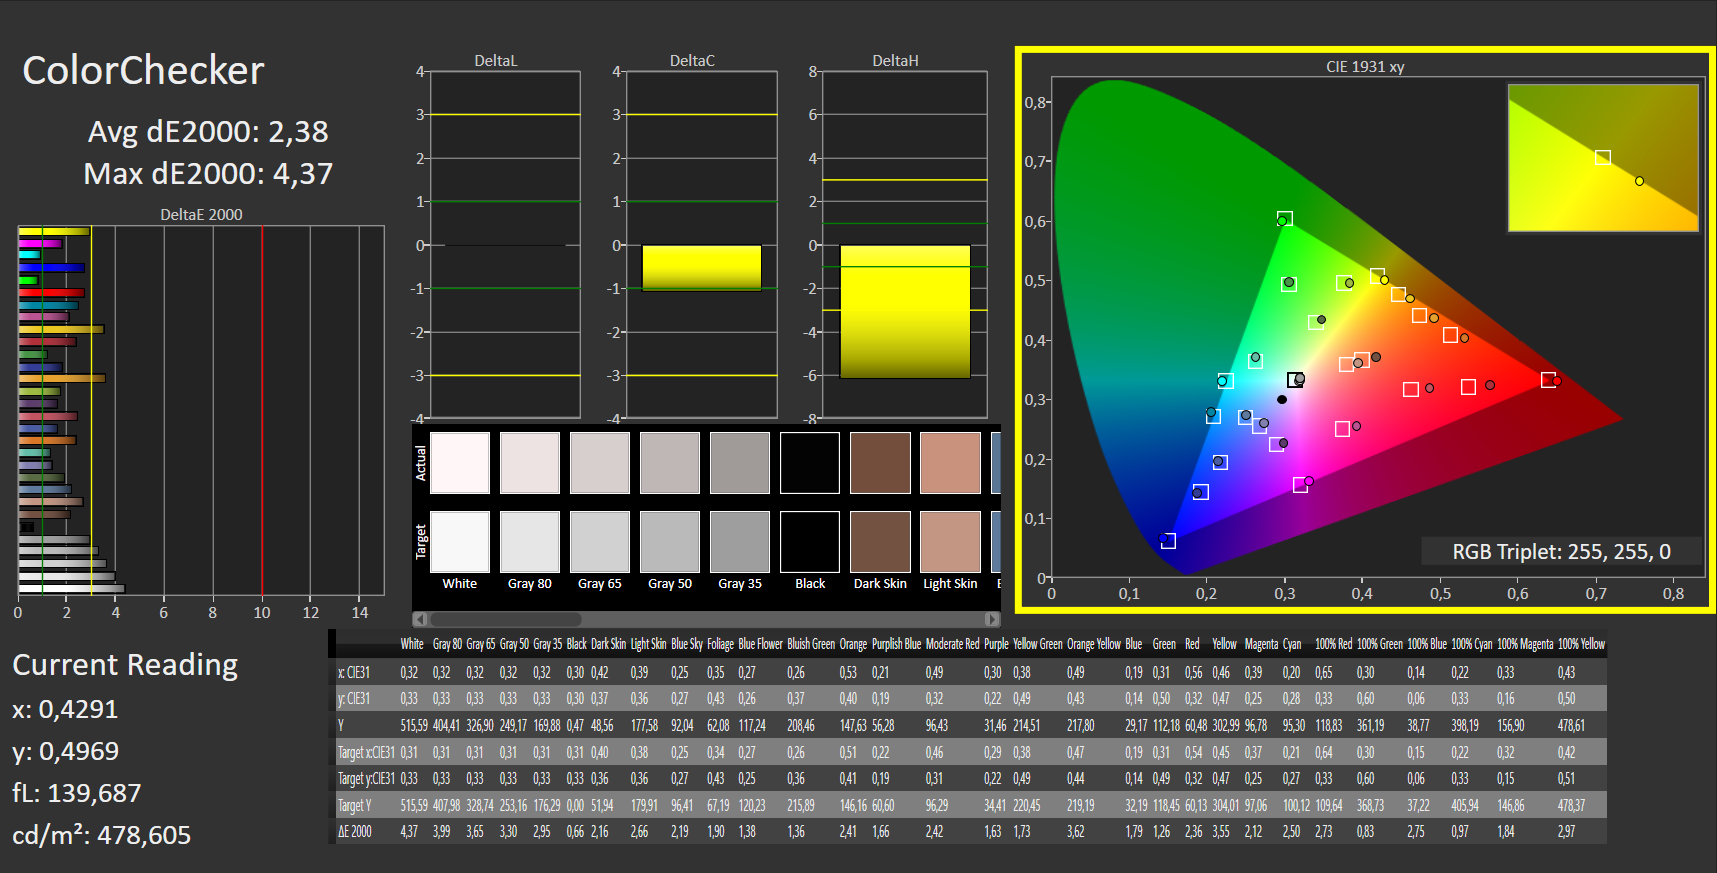
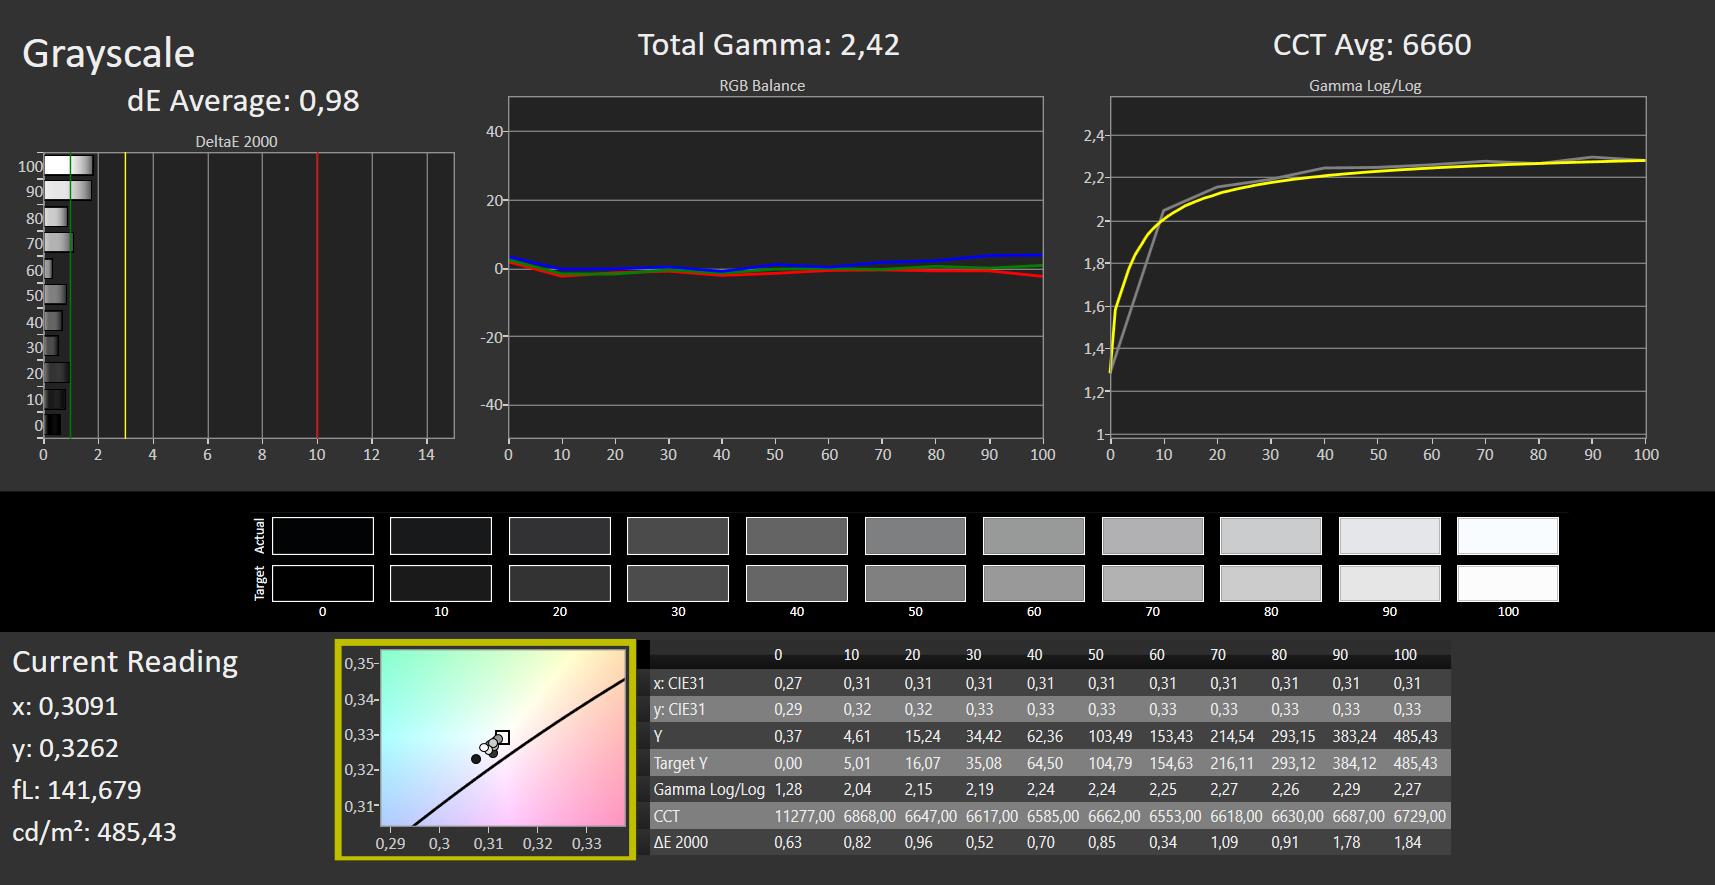
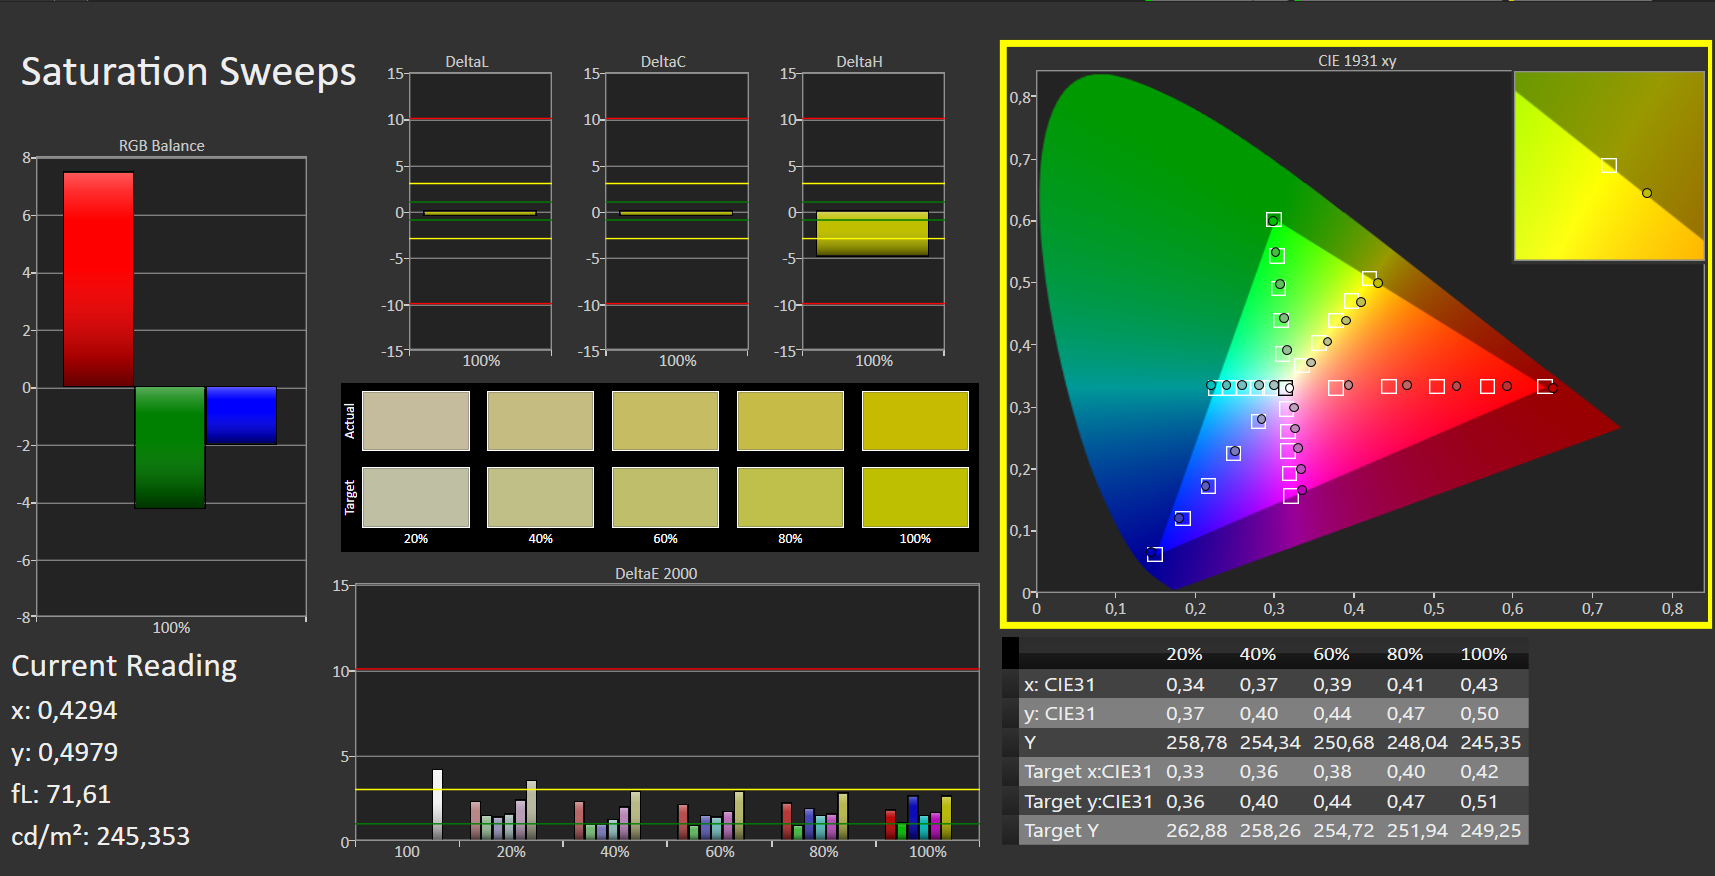
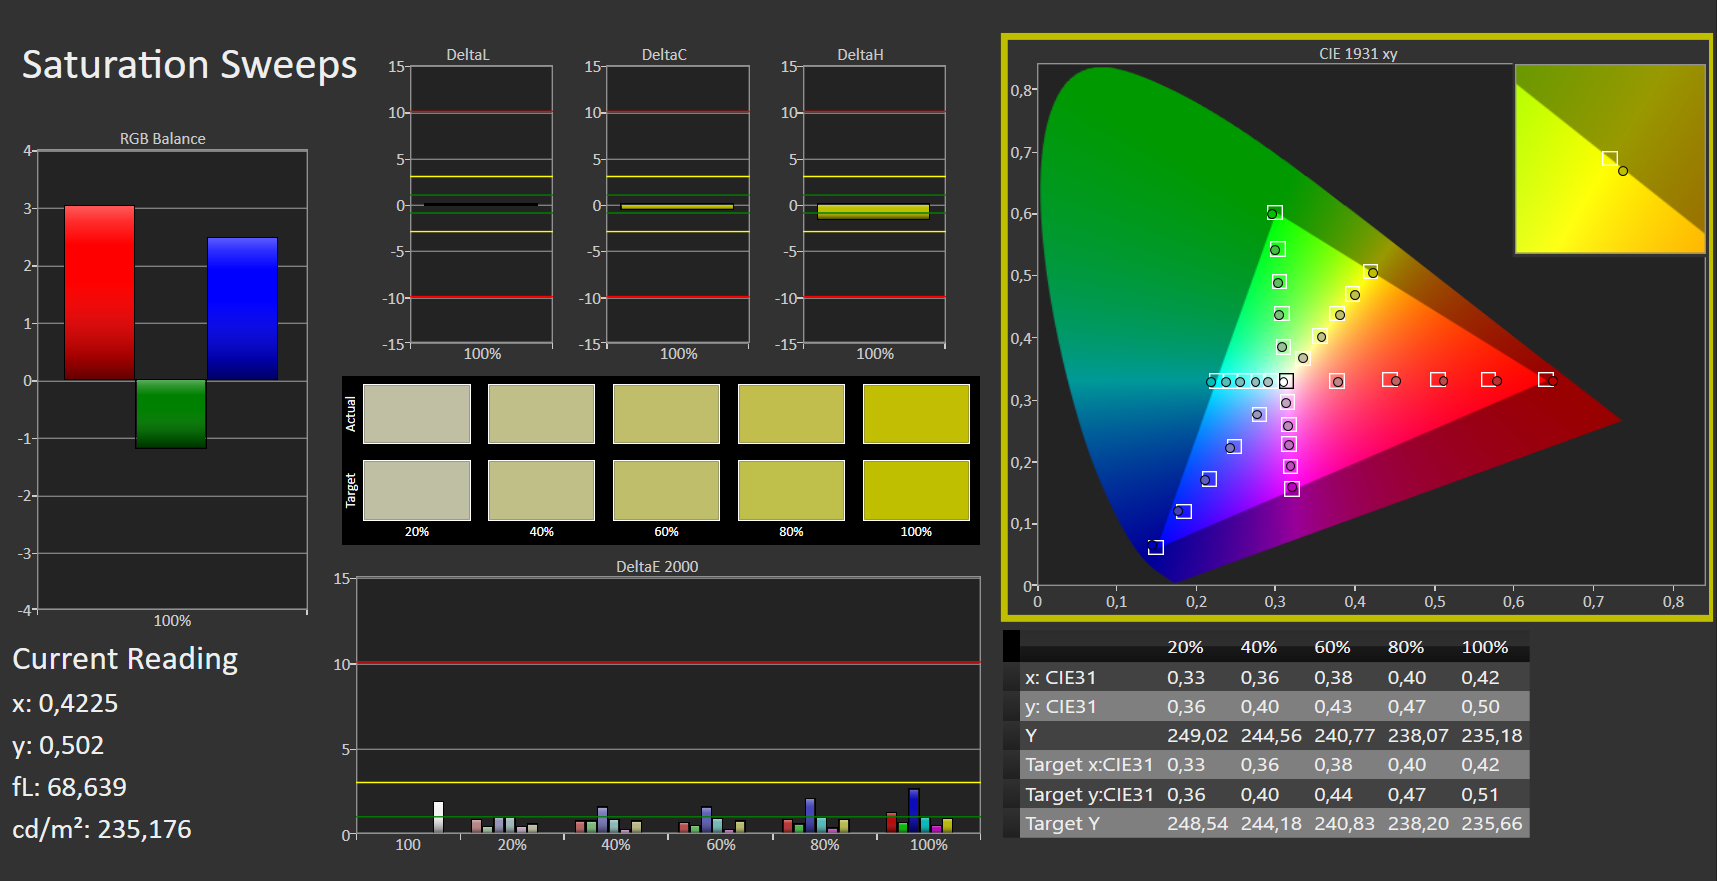
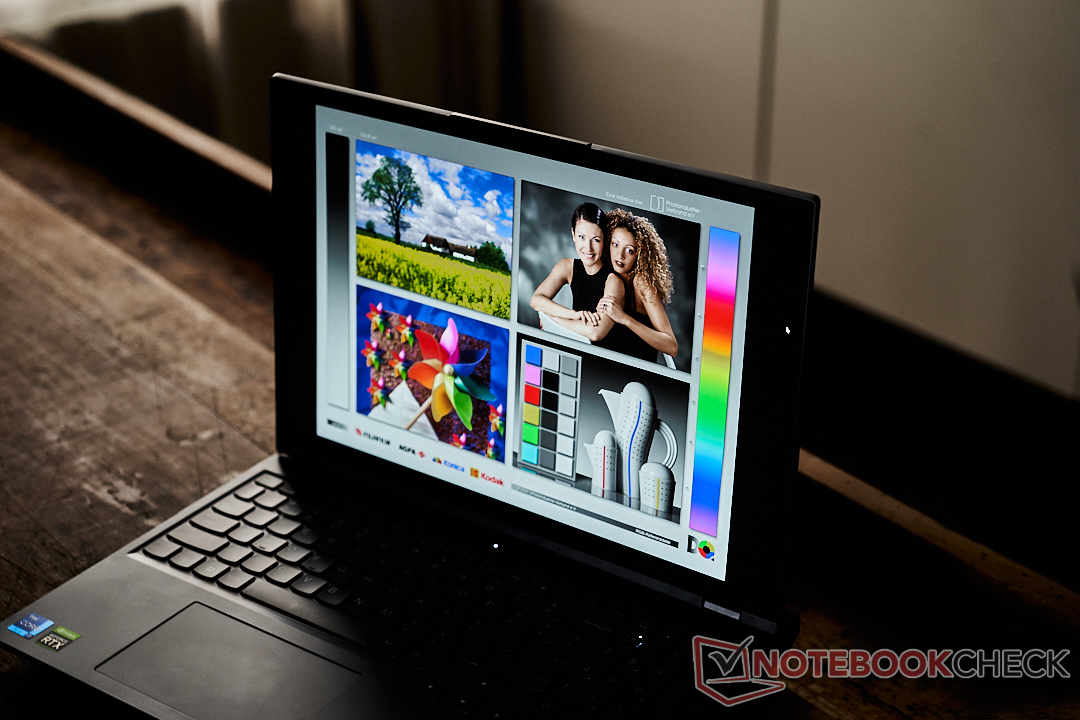
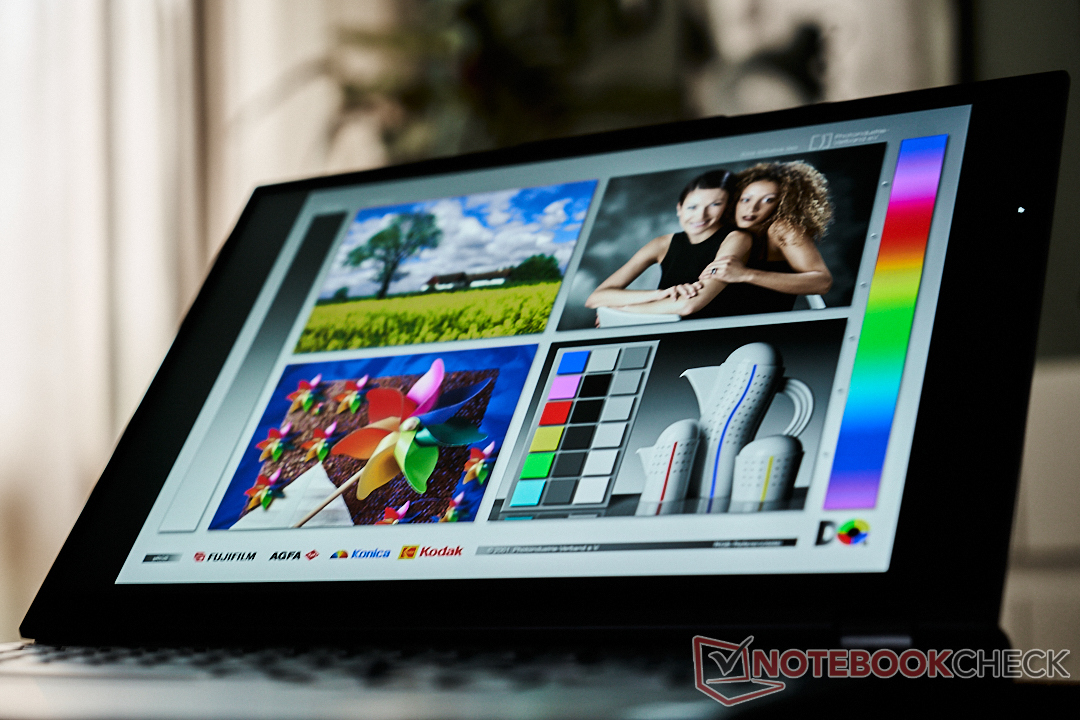
Com valores sólidos para espaços de cores comuns e boa calibração de fábrica, a reprodução de cores no Legion 5 Pro é inquestionavelmente adequada para uso diário. Com uma diferença média de cores de cerca de 2,5 DeltaE ex funciona, a reprodução de cores no dispositivo de 16 polegadas está imediatamente pronta para a edição de imagens semi-profissionais, enquanto os profissionais podem obter ainda mais do mostrador com alguma calibração manual.
Nossa calibração com equipamento profissional reduz o DeltaE a menos de 1 (o perfil está disponível acima para download) e assim proporciona uma excelente reprodução de cores dentro dos limites do sRGB. Para poder prescindir de um monitor externo para aplicações profissionais e de cor crítica, gostaríamos de ter uma melhor cobertura nos espaços de cor AdobeRGB e DCI-P3. A este respeito, especialmente os fotógrafos e editores de imagem saem um pouco curtos. Para os videógrafos que produzem principalmente para a web, no entanto, a exibição é mais do que adequada
A aplicação de cores X-Rite na Lenovo permite que ela ofereça várias predefinições adicionais para espaços de cores freqüentemente usados, algo que é extremamente útil para o trabalho diário de conteúdo criativo. Por exemplo, o modo sRGB pode ser de interesse para o design online, enquanto os videógrafos que utilizam o perfil Rec709 podem até colorir o material de vídeo com algum grau de confiança.
Exibir tempos de resposta
| ↔ Tempo de resposta preto para branco | ||
|---|---|---|
| 6 ms ... ascensão ↗ e queda ↘ combinadas | ↗ 2 ms ascensão |  |
| ↘ 4 ms queda | ||
| A tela mostra taxas de resposta muito rápidas em nossos testes e deve ser muito adequada para jogos em ritmo acelerado. Em comparação, todos os dispositivos testados variam de 0.1 (mínimo) a 240 (máximo) ms. » 19 % de todos os dispositivos são melhores. Isso significa que o tempo de resposta medido é melhor que a média de todos os dispositivos testados (19.8 ms). | ||
| ↔ Tempo de resposta 50% cinza a 80% cinza | ||
| 14 ms ... ascensão ↗ e queda ↘ combinadas | ↗ 6 ms ascensão |  |
| ↘ 8 ms queda | ||
| A tela mostra boas taxas de resposta em nossos testes, mas pode ser muito lenta para jogadores competitivos. Em comparação, todos os dispositivos testados variam de 0.165 (mínimo) a 636 (máximo) ms. » 28 % de todos os dispositivos são melhores. Isso significa que o tempo de resposta medido é melhor que a média de todos os dispositivos testados (31 ms). | ||
Cintilação da tela / PWM (modulação por largura de pulso)
| Tela tremeluzindo / PWM não detectado |  | ||
[pwm_comparison] Em comparação: 52 % de todos os dispositivos testados não usam PWM para escurecer a tela. Se PWM foi detectado, uma média de 7757 (mínimo: 5 - máximo: 343500) Hz foi medida. | |||
Como já mencionado, o alto nível de brilho de mais de 500 cd/m² ajuda ao ar livre. A luz direta do sol ainda deve ser evitada, mas isso se aplica à maioria das telas de todos os laptops. O revestimento fosco certamente impede que você veja mais de si mesmo do que o conteúdo da tela.
Desempenho - i7-12700H desenfreado encontra rápido RTX 3060
Embora a Lenovo tenha sido capaz de entregar mais do que a maioria de seus concorrentes até agora (uma infinidade de portos, um excelente case e uma grande exibição), o desempenho que ela oferece é praticamente inigualável. A i7 supera sua concorrência, ainda que esteja parcialmente equipada com processadores i9. O RTX 3060 também oferece um desempenho totalmente impressionante. Para atingir tal desempenho de sistema estelar, a Lenovo sustenta seus componentes principais com 16 GB de RAM DDR5 4800 de última geração e uma matriz NVME SSD RAID-0 de 2 TB com capacidade de resposta.
Condições de teste
O software Vantage que vem com a unidade pode ser um pouco exagerado, mas oferece três modos de desempenho diferentes. Todos os nossos testes de desempenho foram realizados em modo de potência, que faz jus ao seu nome e fornece ao i7 até 120 W para pico e 100 W para potência constante. O LED colorido no botão de potência muda, servindo como indicador visual (vermelho: modo de potência, branco: equilibrado, azul: silencioso). O modo silencioso também faz jus ao seu nome: após um pico inicial de 120 W, o processador consome 65 W, e os ventiladores soam agradavelmente controlados. Se você não está necessariamente procurando as pontuações mais altas do Cinebench, então o modo balanceado também é uma boa escolha para computação com CPU intensiva. O consumo de energia é de cerca de 85-90 W, mas comparado com o modo de energia, o ruído dos ventiladores é um pouco mais silencioso.
Processador
Estamos em meados de 2022 e a i7-12700H se tornou um conhecido familiar. Tornou-se o padrão da Intel para criadores de conteúdo rápido e notebooks de jogos. O desempenho varia muito de dispositivo para dispositivo e depende tanto da configuração do fabricante quanto do gerenciamento de resfriamento de um dispositivo específico.
O i7 é a principal potência da última geração do Alder Lake da Intel e fornece seis núcleos de desempenho com suporte a hiper-rotação e taxas de relógio de 2,4 a 4,7 GHz. As tarefas de fundo ou suporte multi-core são fornecidas pelos oito núcleos de eficiência (1,8-3,5 GHz) e completam os 14 núcleos entregando um total de 20 roscas.
A Lenovo permite que a CPU trabalhe sem restrições no Legion, permitindo que o notebook de 16 polegadas chegue facilmente ao topo da tabela líder assim que o desempenho multi-core for um requisito. Alguns notebooks oferecem um pouco mais de desempenho de um só núcleo, e os notebooks com i9 têm uma ligeira vantagem aqui. Entretanto, o desempenho de um só núcleo é relevante para muito poucas aplicações atualmente e tal vantagem de desempenho é praticamente indetectável no uso diário.
O Legion 5 Pro corta um número excelente, especialmente sob carga constante: Enquanto muitos notebooks só podem manter o desempenho de seu hardware para a famosa primeira ou segunda tiragem Cinebench, o Legion 5 Pro oferece desempenho persistente sem flutuações. Há sempre potência suficiente para jogos, bem como para aplicações de conteúdo criativo.
Além de nossas sequências de teste padronizadas, também usamos o laptop com nosso canal no YouTube. Cortamos, colorimos e exportamos nossos vídeos com o BlackMagics DaVinci Resolve 17. Em contraste com as aplicações comuns da Adobe, que usam principalmente apenas o processador, a CPU e a GPU são usadas igualmente neste software de edição. Devido aos generosos níveis de potência, nosso material fonte (4k, BlackMagic RAW) foi processado sem nenhum problema e sem queda de quadros. Além disso, a edição de imagem na PhaseOnes Capture One e o líder de classe Photoshop não nos causaram problemas.
Cinebench R15 Multi Loop
Cinebench R23: Multi Core | Single Core
Cinebench R20: CPU (Multi Core) | CPU (Single Core)
Cinebench R15: CPU Multi 64Bit | CPU Single 64Bit
Blender: v2.79 BMW27 CPU
7-Zip 18.03: 7z b 4 | 7z b 4 -mmt1
Geekbench 5.5: Multi-Core | Single-Core
HWBOT x265 Benchmark v2.2: 4k Preset
LibreOffice : 20 Documents To PDF
R Benchmark 2.5: Overall mean
| CPU Performance rating | |
| Média da turma Gaming | |
| Gigabyte Aero 16 YE5 | |
| Lenovo Legion 5 Pro 16IAH7H | |
| HP Omen 16-b1090ng | |
| Alienware x14 i7 RTX 3060 | |
| Média Intel Core i7-12700H | |
| HP Omen 16-c0077ng -1! | |
| Cinebench R23 / Multi Core | |
| Média da turma Gaming (10488 - 42661, n=107, últimos 2 anos) | |
| Lenovo Legion 5 Pro 16IAH7H | |
| Gigabyte Aero 16 YE5 | |
| HP Omen 16-b1090ng | |
| Alienware x14 i7 RTX 3060 | |
| Média Intel Core i7-12700H (4032 - 19330, n=64) | |
| HP Omen 16-c0077ng | |
| Cinebench R23 / Single Core | |
| Média da turma Gaming (1166 - 2415, n=107, últimos 2 anos) | |
| Gigabyte Aero 16 YE5 | |
| HP Omen 16-b1090ng | |
| Alienware x14 i7 RTX 3060 | |
| Média Intel Core i7-12700H (778 - 1826, n=63) | |
| Lenovo Legion 5 Pro 16IAH7H | |
| HP Omen 16-c0077ng | |
| Cinebench R20 / CPU (Multi Core) | |
| Média da turma Gaming (4029 - 16433, n=106, últimos 2 anos) | |
| Lenovo Legion 5 Pro 16IAH7H | |
| Gigabyte Aero 16 YE5 | |
| Alienware x14 i7 RTX 3060 | |
| Média Intel Core i7-12700H (1576 - 7407, n=64) | |
| HP Omen 16-b1090ng | |
| HP Omen 16-c0077ng | |
| Cinebench R20 / CPU (Single Core) | |
| Média da turma Gaming (442 - 913, n=106, últimos 2 anos) | |
| HP Omen 16-b1090ng | |
| Gigabyte Aero 16 YE5 | |
| Alienware x14 i7 RTX 3060 | |
| Média Intel Core i7-12700H (300 - 704, n=64) | |
| Lenovo Legion 5 Pro 16IAH7H | |
| HP Omen 16-c0077ng | |
| Cinebench R15 / CPU Multi 64Bit | |
| Média da turma Gaming (1578 - 6330, n=105, últimos 2 anos) | |
| Lenovo Legion 5 Pro 16IAH7H | |
| HP Omen 16-b1090ng | |
| Gigabyte Aero 16 YE5 | |
| Alienware x14 i7 RTX 3060 | |
| Média Intel Core i7-12700H (1379 - 2916, n=70) | |
| HP Omen 16-c0077ng | |
| Cinebench R15 / CPU Single 64Bit | |
| Média da turma Gaming (188.8 - 350, n=106, últimos 2 anos) | |
| Gigabyte Aero 16 YE5 | |
| HP Omen 16-b1090ng | |
| Média Intel Core i7-12700H (113 - 263, n=65) | |
| Alienware x14 i7 RTX 3060 | |
| Lenovo Legion 5 Pro 16IAH7H | |
| HP Omen 16-c0077ng | |
| Blender / v2.79 BMW27 CPU | |
| HP Omen 16-c0077ng | |
| Média Intel Core i7-12700H (168 - 732, n=63) | |
| Alienware x14 i7 RTX 3060 | |
| Gigabyte Aero 16 YE5 | |
| HP Omen 16-b1090ng | |
| Lenovo Legion 5 Pro 16IAH7H | |
| Média da turma Gaming (79 - 330, n=104, últimos 2 anos) | |
| 7-Zip 18.03 / 7z b 4 | |
| Média da turma Gaming (33491 - 148086, n=105, últimos 2 anos) | |
| HP Omen 16-b1090ng | |
| Lenovo Legion 5 Pro 16IAH7H | |
| Gigabyte Aero 16 YE5 | |
| Alienware x14 i7 RTX 3060 | |
| Média Intel Core i7-12700H (22844 - 73067, n=63) | |
| 7-Zip 18.03 / 7z b 4 -mmt1 | |
| Média da turma Gaming (4199 - 7436, n=105, últimos 2 anos) | |
| Gigabyte Aero 16 YE5 | |
| HP Omen 16-b1090ng | |
| Média Intel Core i7-12700H (2743 - 5972, n=63) | |
| Alienware x14 i7 RTX 3060 | |
| Lenovo Legion 5 Pro 16IAH7H | |
| HP Omen 16-c0077ng | |
| Geekbench 5.5 / Multi-Core | |
| Média da turma Gaming (6460 - 28263, n=105, últimos 2 anos) | |
| Gigabyte Aero 16 YE5 | |
| HP Omen 16-b1090ng | |
| Alienware x14 i7 RTX 3060 | |
| Lenovo Legion 5 Pro 16IAH7H | |
| Média Intel Core i7-12700H (5144 - 13745, n=64) | |
| HP Omen 16-c0077ng | |
| Geekbench 5.5 / Single-Core | |
| Média da turma Gaming (986 - 2474, n=105, últimos 2 anos) | |
| Gigabyte Aero 16 YE5 | |
| HP Omen 16-b1090ng | |
| Alienware x14 i7 RTX 3060 | |
| Média Intel Core i7-12700H (803 - 1851, n=64) | |
| Lenovo Legion 5 Pro 16IAH7H | |
| HP Omen 16-c0077ng | |
| HWBOT x265 Benchmark v2.2 / 4k Preset | |
| Média da turma Gaming (11.5 - 44.4, n=105, últimos 2 anos) | |
| Lenovo Legion 5 Pro 16IAH7H | |
| HP Omen 16-b1090ng | |
| Gigabyte Aero 16 YE5 | |
| Alienware x14 i7 RTX 3060 | |
| Média Intel Core i7-12700H (4.67 - 21.8, n=64) | |
| HP Omen 16-c0077ng | |
| LibreOffice / 20 Documents To PDF | |
| HP Omen 16-c0077ng | |
| Média da turma Gaming (33.2 - 88.8, n=105, últimos 2 anos) | |
| Média Intel Core i7-12700H (34.2 - 95.3, n=63) | |
| HP Omen 16-b1090ng | |
| Lenovo Legion 5 Pro 16IAH7H | |
| Alienware x14 i7 RTX 3060 | |
| Gigabyte Aero 16 YE5 | |
| R Benchmark 2.5 / Overall mean | |
| HP Omen 16-c0077ng | |
| Lenovo Legion 5 Pro 16IAH7H | |
| Média Intel Core i7-12700H (0.4441 - 1.052, n=63) | |
| Alienware x14 i7 RTX 3060 | |
| HP Omen 16-b1090ng | |
| Média da turma Gaming (0.3439 - 0.759, n=106, últimos 2 anos) | |
| Gigabyte Aero 16 YE5 | |
* ... menor é melhor
AIDA64: FP32 Ray-Trace | FPU Julia | CPU SHA3 | CPU Queen | FPU SinJulia | FPU Mandel | CPU AES | CPU ZLib | FP64 Ray-Trace | CPU PhotoWorxx
| Performance rating | |
| Média da turma Gaming | |
| HP Omen 16-c0077ng | |
| Lenovo Legion 5 Pro 16IAH7H | |
| Alienware x14 i7 RTX 3060 | |
| Média Intel Core i7-12700H | |
| Gigabyte Aero 16 YE5 | |
| HP Omen 16-b1090ng | |
| AIDA64 / FP32 Ray-Trace | |
| Média da turma Gaming (10227 - 85542, n=105, últimos 2 anos) | |
| Lenovo Legion 5 Pro 16IAH7H | |
| Lenovo Legion 5 Pro 16IAH7H | |
| HP Omen 16-c0077ng | |
| Média Intel Core i7-12700H (2585 - 17957, n=64) | |
| Alienware x14 i7 RTX 3060 | |
| Gigabyte Aero 16 YE5 | |
| HP Omen 16-b1090ng | |
| AIDA64 / FPU Julia | |
| Média da turma Gaming (51376 - 238426, n=105, últimos 2 anos) | |
| HP Omen 16-c0077ng | |
| Lenovo Legion 5 Pro 16IAH7H | |
| Lenovo Legion 5 Pro 16IAH7H | |
| Média Intel Core i7-12700H (12439 - 90760, n=64) | |
| Alienware x14 i7 RTX 3060 | |
| Gigabyte Aero 16 YE5 | |
| HP Omen 16-b1090ng | |
| AIDA64 / CPU SHA3 | |
| Média da turma Gaming (2180 - 10115, n=105, últimos 2 anos) | |
| Lenovo Legion 5 Pro 16IAH7H | |
| Lenovo Legion 5 Pro 16IAH7H | |
| HP Omen 16-c0077ng | |
| Média Intel Core i7-12700H (833 - 4242, n=64) | |
| Gigabyte Aero 16 YE5 | |
| Alienware x14 i7 RTX 3060 | |
| HP Omen 16-b1090ng | |
| AIDA64 / CPU Queen | |
| Média da turma Gaming (49785 - 173351, n=90, últimos 2 anos) | |
| Gigabyte Aero 16 YE5 | |
| HP Omen 16-b1090ng | |
| Alienware x14 i7 RTX 3060 | |
| HP Omen 16-c0077ng | |
| Lenovo Legion 5 Pro 16IAH7H | |
| Média Intel Core i7-12700H (57923 - 103202, n=63) | |
| AIDA64 / FPU SinJulia | |
| Média da turma Gaming (4424 - 33636, n=105, últimos 2 anos) | |
| HP Omen 16-c0077ng | |
| Lenovo Legion 5 Pro 16IAH7H | |
| Lenovo Legion 5 Pro 16IAH7H | |
| Gigabyte Aero 16 YE5 | |
| Alienware x14 i7 RTX 3060 | |
| HP Omen 16-b1090ng | |
| Média Intel Core i7-12700H (3249 - 9939, n=64) | |
| AIDA64 / FPU Mandel | |
| Média da turma Gaming (25115 - 128721, n=105, últimos 2 anos) | |
| HP Omen 16-c0077ng | |
| Lenovo Legion 5 Pro 16IAH7H | |
| Lenovo Legion 5 Pro 16IAH7H | |
| Média Intel Core i7-12700H (7135 - 44760, n=64) | |
| Gigabyte Aero 16 YE5 | |
| Alienware x14 i7 RTX 3060 | |
| HP Omen 16-b1090ng | |
| AIDA64 / CPU AES | |
| Lenovo Legion 5 Pro 16IAH7H | |
| Lenovo Legion 5 Pro 16IAH7H | |
| HP Omen 16-c0077ng | |
| Média da turma Gaming (39258 - 247074, n=105, últimos 2 anos) | |
| Alienware x14 i7 RTX 3060 | |
| Gigabyte Aero 16 YE5 | |
| Média Intel Core i7-12700H (31839 - 144360, n=64) | |
| HP Omen 16-b1090ng | |
| AIDA64 / CPU ZLib | |
| Média da turma Gaming (574 - 2531, n=105, últimos 2 anos) | |
| Lenovo Legion 5 Pro 16IAH7H | |
| Lenovo Legion 5 Pro 16IAH7H | |
| Alienware x14 i7 RTX 3060 | |
| Gigabyte Aero 16 YE5 | |
| Média Intel Core i7-12700H (305 - 1171, n=64) | |
| HP Omen 16-b1090ng | |
| HP Omen 16-c0077ng | |
| AIDA64 / FP64 Ray-Trace | |
| Média da turma Gaming (5509 - 45446, n=105, últimos 2 anos) | |
| Lenovo Legion 5 Pro 16IAH7H | |
| Lenovo Legion 5 Pro 16IAH7H | |
| HP Omen 16-c0077ng | |
| Média Intel Core i7-12700H (1437 - 9692, n=64) | |
| Alienware x14 i7 RTX 3060 | |
| Gigabyte Aero 16 YE5 | |
| HP Omen 16-b1090ng | |
| AIDA64 / CPU PhotoWorxx | |
| Alienware x14 i7 RTX 3060 | |
| Média da turma Gaming (12271 - 89891, n=105, últimos 2 anos) | |
| HP Omen 16-b1090ng | |
| Gigabyte Aero 16 YE5 | |
| Lenovo Legion 5 Pro 16IAH7H | |
| Lenovo Legion 5 Pro 16IAH7H | |
| Média Intel Core i7-12700H (12863 - 52207, n=64) | |
| HP Omen 16-c0077ng | |
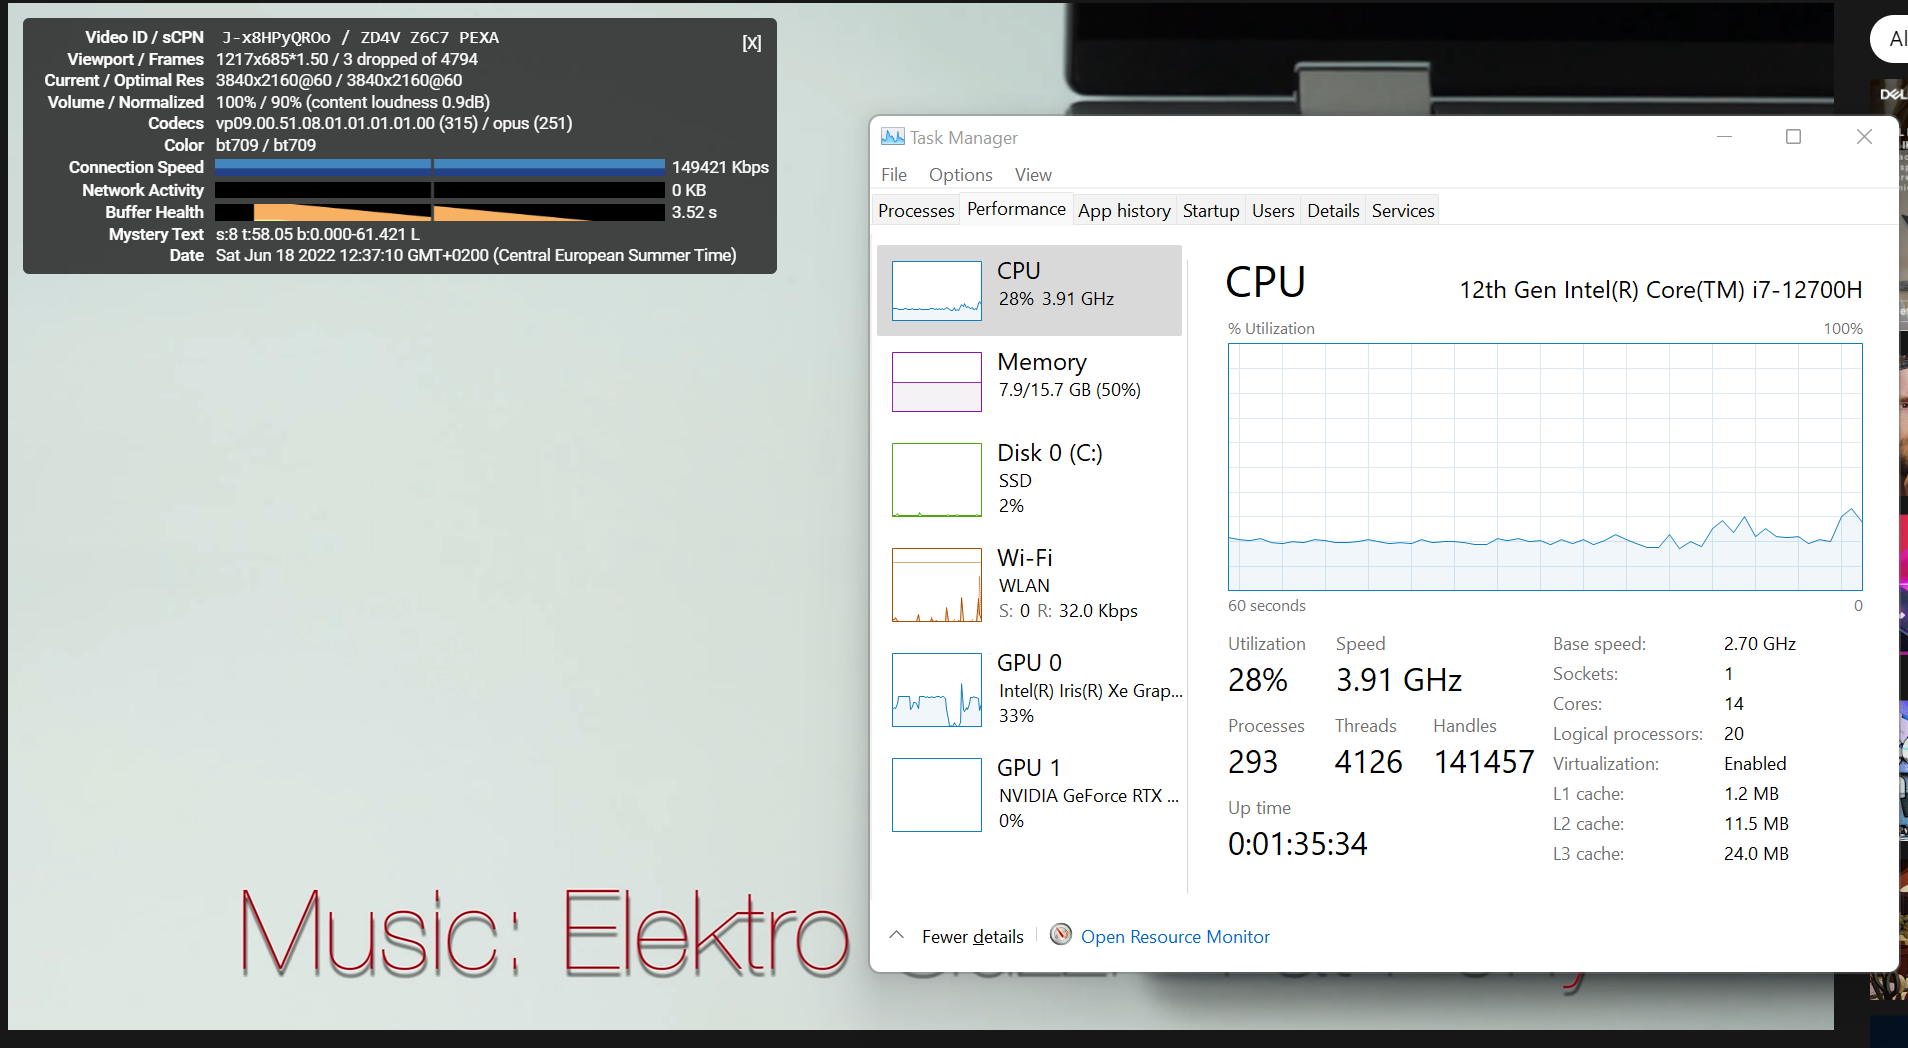
Desempenho do sistema
O desempenho do sistema deste laptop de gaveta superior é irrefutável, e apesar da 'pequena' placa gráfica Ampere, nossa configuração de teste está muito bem posicionada em relação a outros laptops. Como mostram tanto os resultados de nosso PC Mark quanto nossas próprias observações, o Legion domina as tarefas diárias à velocidade da luz e nada o desviará de seus passos. É fácil editar uma imagem no Photoshop, saltar para um programa de edição de vídeo e assistir a um vlog de 4k no YouTube ao longo do caminho; e ainda há uma ampla capacidade mesmo com uma tonelada de abas do navegador abertas.
CrossMark: Overall | Productivity | Creativity | Responsiveness
| PCMark 10 / Score | |
| Média da turma Gaming (5828 - 12414, n=93, últimos 2 anos) | |
| Gigabyte Aero 16 YE5 | |
| Lenovo Legion 5 Pro 16IAH7H | |
| HP Omen 16-b1090ng | |
| Média Intel Core i7-12700H, NVIDIA GeForce RTX 3060 Laptop GPU (5986 - 8156, n=12) | |
| Alienware x14 i7 RTX 3060 | |
| HP Omen 16-c0077ng | |
| PCMark 10 / Essentials | |
| Lenovo Legion 5 Pro 16IAH7H | |
| Gigabyte Aero 16 YE5 | |
| Média da turma Gaming (8810 - 11935, n=97, últimos 2 anos) | |
| Média Intel Core i7-12700H, NVIDIA GeForce RTX 3060 Laptop GPU (9289 - 12144, n=12) | |
| HP Omen 16-c0077ng | |
| Alienware x14 i7 RTX 3060 | |
| HP Omen 16-b1090ng | |
| PCMark 10 / Productivity | |
| Média da turma Gaming (6845 - 25323, n=95, últimos 2 anos) | |
| Gigabyte Aero 16 YE5 | |
| Alienware x14 i7 RTX 3060 | |
| HP Omen 16-b1090ng | |
| Lenovo Legion 5 Pro 16IAH7H | |
| HP Omen 16-c0077ng | |
| Média Intel Core i7-12700H, NVIDIA GeForce RTX 3060 Laptop GPU (6161 - 10362, n=12) | |
| PCMark 10 / Digital Content Creation | |
| Média da turma Gaming (7602 - 19954, n=95, últimos 2 anos) | |
| Gigabyte Aero 16 YE5 | |
| Lenovo Legion 5 Pro 16IAH7H | |
| HP Omen 16-b1090ng | |
| Média Intel Core i7-12700H, NVIDIA GeForce RTX 3060 Laptop GPU (8950 - 12554, n=12) | |
| HP Omen 16-c0077ng | |
| Alienware x14 i7 RTX 3060 | |
| CrossMark / Overall | |
| Gigabyte Aero 16 YE5 | |
| Média da turma Gaming (1366 - 2409, n=94, últimos 2 anos) | |
| Alienware x14 i7 RTX 3060 | |
| Média Intel Core i7-12700H, NVIDIA GeForce RTX 3060 Laptop GPU (1649 - 2017, n=11) | |
| Lenovo Legion 5 Pro 16IAH7H | |
| CrossMark / Productivity | |
| Gigabyte Aero 16 YE5 | |
| Média da turma Gaming (1386 - 2254, n=94, últimos 2 anos) | |
| Alienware x14 i7 RTX 3060 | |
| Média Intel Core i7-12700H, NVIDIA GeForce RTX 3060 Laptop GPU (1536 - 1958, n=11) | |
| Lenovo Legion 5 Pro 16IAH7H | |
| CrossMark / Creativity | |
| Média da turma Gaming (1343 - 2786, n=94, últimos 2 anos) | |
| Gigabyte Aero 16 YE5 | |
| Alienware x14 i7 RTX 3060 | |
| Média Intel Core i7-12700H, NVIDIA GeForce RTX 3060 Laptop GPU (1816 - 2084, n=11) | |
| Lenovo Legion 5 Pro 16IAH7H | |
| CrossMark / Responsiveness | |
| Gigabyte Aero 16 YE5 | |
| Alienware x14 i7 RTX 3060 | |
| Lenovo Legion 5 Pro 16IAH7H | |
| Média da turma Gaming (1226 - 2334, n=94, últimos 2 anos) | |
| Média Intel Core i7-12700H, NVIDIA GeForce RTX 3060 Laptop GPU (1210 - 2207, n=11) | |
| PCMark 10 Score | 7531 pontos | |
Ajuda | ||
| AIDA64 / Memory Copy | |
| Alienware x14 i7 RTX 3060 | |
| Média da turma Gaming (21750 - 129946, n=105, últimos 2 anos) | |
| HP Omen 16-b1090ng | |
| Gigabyte Aero 16 YE5 | |
| Lenovo Legion 5 Pro 16IAH7H | |
| Lenovo Legion 5 Pro 16IAH7H | |
| Média Intel Core i7-12700H (25615 - 80511, n=64) | |
| HP Omen 16-c0077ng | |
| AIDA64 / Memory Read | |
| Alienware x14 i7 RTX 3060 | |
| Média da turma Gaming (22956 - 118858, n=105, últimos 2 anos) | |
| HP Omen 16-b1090ng | |
| Gigabyte Aero 16 YE5 | |
| Lenovo Legion 5 Pro 16IAH7H | |
| Lenovo Legion 5 Pro 16IAH7H | |
| Média Intel Core i7-12700H (25586 - 79442, n=64) | |
| HP Omen 16-c0077ng | |
| AIDA64 / Memory Write | |
| Média da turma Gaming (22297 - 135096, n=105, últimos 2 anos) | |
| HP Omen 16-b1090ng | |
| Alienware x14 i7 RTX 3060 | |
| Gigabyte Aero 16 YE5 | |
| Lenovo Legion 5 Pro 16IAH7H | |
| Lenovo Legion 5 Pro 16IAH7H | |
| Média Intel Core i7-12700H (23679 - 88660, n=64) | |
| HP Omen 16-c0077ng | |
| AIDA64 / Memory Latency | |
| Lenovo Legion 5 Pro 16IAH7H | |
| Lenovo Legion 5 Pro 16IAH7H | |
| Alienware x14 i7 RTX 3060 | |
| Média da turma Gaming (75.3 - 259, n=105, últimos 2 anos) | |
| HP Omen 16-b1090ng | |
| Gigabyte Aero 16 YE5 | |
| HP Omen 16-c0077ng | |
| Média Intel Core i7-12700H (76.2 - 133.9, n=62) | |
* ... menor é melhor
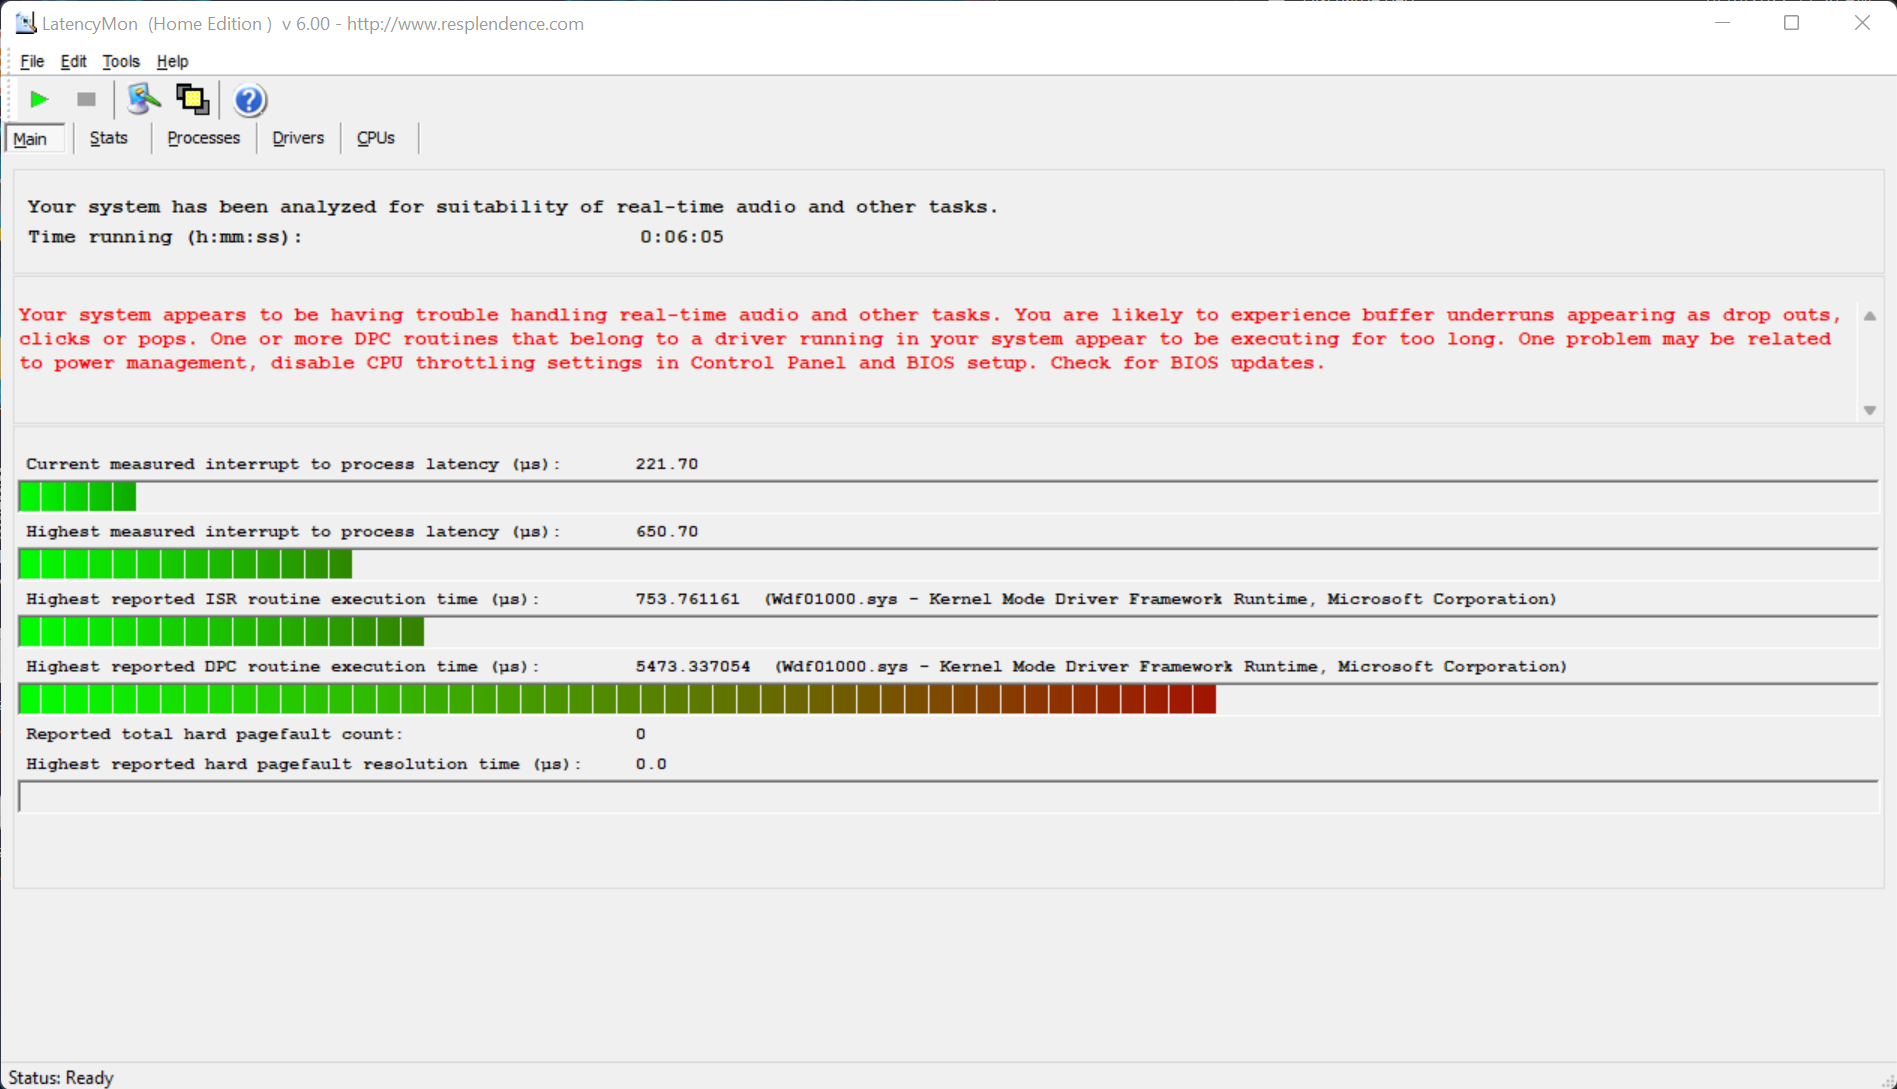
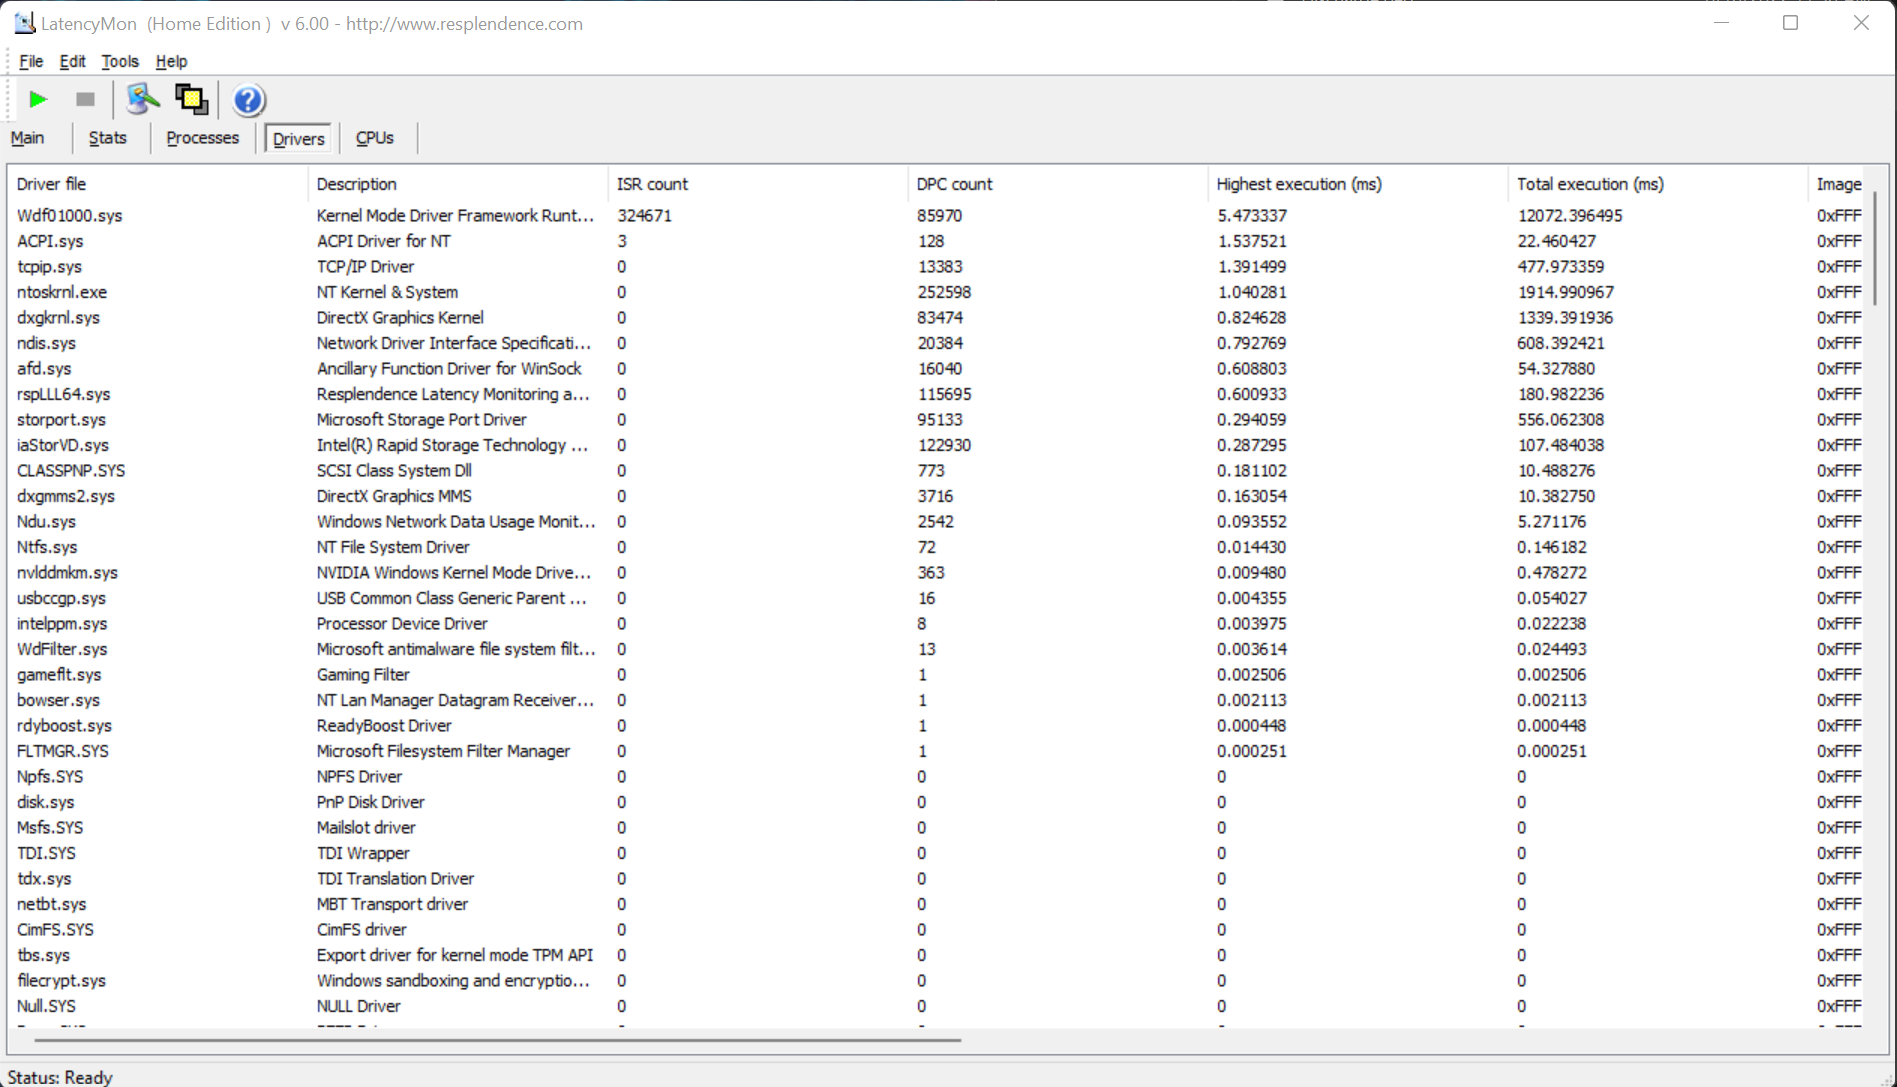
Latência do DPC
Os resultados dos testes LatencyMon de nosso dispositivo de revisão são em parte muito melhores do que os da concorrência, mas o Legion não é o dispositivo de escolha quando se trata de edição de áudio em tempo real. Entretanto, dado que é essencialmente um laptop para jogos, e dado que nosso vídeo no YouTube caiu apenas alguns quadros, os resultados do LatencyMon podem ser aceitáveis. Entretanto, a carga da CPU/GPU durante a reprodução do vídeo 4K foi de fato bastante alta e gostaríamos de ter visto uma implantação um pouco mais eficaz dos recursos do sistema.
| DPC Latencies / LatencyMon - interrupt to process latency (max), Web, Youtube, Prime95 | |
| HP Omen 16-c0077ng | |
| Alienware x14 i7 RTX 3060 | |
| HP Omen 16-b1090ng | |
| Lenovo Legion 5 Pro 16IAH7H | |
| Gigabyte Aero 16 YE5 | |
* ... menor é melhor
Dispositivos de armazenamento
Os últimos SSDs NVME PCI-E Gen 4 já estão em vigor tão rapidamente que suas diferenças de desempenho no uso diário dificilmente desempenham um papel e são quase imperceptíveis. No entanto, a Lenovo decidiu incluir dois de seus expoentes mais rápidos em um array RAID-0 no Legion 5i Pro.
Enquanto cada um destes SSDs pontua bem individualmente e lidera nossas tabelas de desempenho, eles quase dobram suas taxas de leitura e escrita em uma matriz dupla. Cerca de 12 GB em medidas de pico soa extremamente impressionante no papel, mas provavelmente não há muitas aplicações que se beneficiarão de tais velocidades de break-neck. Naturalmente, isto não é de forma alguma uma reclamação, dado que há 2 TB de espaço total de armazenamento disponível para jogos, imagens ou dados de vídeo de alta resolução. Especialmente no trabalho diário, o incômodo de ter que trabalhar com vários discos rígidos externos torna-se evitável. O teste de resistência do SSD mostra quedas repetidas após períodos mais longos. Isto pode ser uma indicação de temperaturas excessivamente altas, que ocorrem sob alta carga constante de SSD.

* ... menor é melhor
Disk Throttling: DiskSpd Read Loop, Queue Depth 8
Desempenho da GPU
Como com a CPU, as ferramentas de modelagem não são mais adequadas para avaliar de forma confiável o desempenho das placas gráficas. A Nvidia deixa muita margem de manobra para os fabricantes em termos de consumo de energia e, portanto, às vezes é difícil prever como um chip gráfico irá se comportar nos laptops modernos. Mais uma vez, a Lenovo está dando aqui um bom exemplo: O RTX 3060 de gama média usa um contínuo de 120 W no Legion 5 e tem um máximo de cerca de 140 W. Enquanto o 3070 Ti em seu modelo irmão (veja nossa revisão aqui) é cerca de 20% mais rápido, o 3080 Ti no Gigabyte Aero 16, por exemplo, está apenas alguns pontos percentuais à frente. A placa menor Ampere também tem um bom desempenho em comparação com laptops com a mesma GPU. A Legion 5 Pro com a RTX 3060 está 14% acima da média da categoria, e até supera em 20% o desempenho da 3060 no Alienware x14.
| 3DMark 11 Performance | 27368 pontos | |
| 3DMark Cloud Gate Standard Score | 55891 pontos | |
| 3DMark Fire Strike Score | 20491 pontos | |
| 3DMark Fire Strike Extreme Score | 10399 pontos | |
| 3DMark Time Spy Score | 9640 pontos | |
| 3DMark Steel Nomad Score | 1882 pontos | |
| 3DMark Steel Nomad Light Score | 8440 pontos | |
Ajuda | ||
Desempenho nos jogos
Benchmarks sintéticos à parte, a impressão excepcionalmente boa persiste para os jogos. O desempenho é excelente e permite cerca de 60 FPS em alto detalhe em quase todos os títulos atuais. Se a taxa de atualização nativa da tela de QHD ficar sem vapor, a resolução deve ser reduzida para Full HD e possivelmente até HD.
| The Witcher 3 - 1920x1080 Ultra Graphics & Postprocessing (HBAO+) | |
| Média da turma Gaming (104.7 - 240, n=7, últimos 2 anos) | |
| Lenovo Legion 5 Pro 16 G7 i7 RTX 3070Ti | |
| HP Omen 16-b1090ng | |
| Gigabyte Aero 16 YE5 | |
| Lenovo Legion 5 Pro 16IAH7H | |
| HP Omen 16-c0077ng | |
| Média NVIDIA GeForce RTX 3060 Laptop GPU (58.2 - 91.5, n=48) | |
| Alienware x14 i7 RTX 3060 | |
| Alienware x14 i7 RTX 3060 | |
| F1 2021 - 1920x1080 Ultra High Preset + Raytracing AA:T AF:16x | |
| Lenovo Legion 5 Pro 16 G7 i7 RTX 3070Ti | |
| Lenovo Legion 5 Pro 16IAH7H | |
| Gigabyte Aero 16 YE5 | |
| Alienware x14 i7 RTX 3060 | |
| Média NVIDIA GeForce RTX 3060 Laptop GPU (67 - 112.8, n=9) | |
| Far Cry 6 - 1920x1080 Ultra Graphics Quality + HD Textures AA:T | |
| Média da turma Gaming (n=1últimos 2 anos) | |
| Lenovo Legion 5 Pro 16IAH7H | |
| Média NVIDIA GeForce RTX 3060 Laptop GPU (59.8 - 94.3, n=6) | |
| Tiny Tina's Wonderlands | |
| 1920x1080 High Preset (DX12) | |
| Média da turma Gaming (72.1 - 203, n=4, últimos 2 anos) | |
| HP Omen 16-b1090ng | |
| Lenovo Legion 5 Pro 16IAH7H | |
| Média NVIDIA GeForce RTX 3060 Laptop GPU (94.8 - 102.7, n=2) | |
| 1920x1080 Badass Preset (DX12) | |
| Média da turma Gaming (55 - 159.4, n=4, últimos 2 anos) | |
| HP Omen 16-b1090ng | |
| Lenovo Legion 5 Pro 16IAH7H | |
| Média NVIDIA GeForce RTX 3060 Laptop GPU (72.3 - 80.5, n=3) | |
O RTX 3060 também pode manter um desempenho constante, como nossos benchmarks e especialmente nosso Witcher 3 programa de teste. No teste de 30 minutos, as taxas de atualização só caem por alguns quadros no início e podem então ser mantidas permanentemente sem mais quedas.
Para o máximo desempenho no display interno, a Lenovo equipa o Legion 5 Pro com uma chave MUX e Advanced Optimus para contornar a GPU. Usando o software Vantage da Lenovo, a GPU também pode ser overclockada com a chave. Em nossos testes, isto foi perceptível com uma velocidade média do relógio central 50-100 MHz mais alta.
Witcher 3 FPS-Diagram
| baixo | média | alto | ultra | QHD DLSS | QHD FSR | QHD | 4K DLSS | 4K FSR | 4K | |
|---|---|---|---|---|---|---|---|---|---|---|
| GTA V (2015) | 185.4 | 181.3 | 161.8 | 107.8 | 83.1 | |||||
| The Witcher 3 (2015) | 389 | 276.8 | 184.6 | 88.2 | ||||||
| Dota 2 Reborn (2015) | 172.1 | 159.4 | 148.9 | 142.8 | ||||||
| Civilization 6 (2016) | 349 | 149 | 131 | |||||||
| Final Fantasy XV Benchmark (2018) | 199.2 | 117.8 | 87.2 | 63.8 | ||||||
| X-Plane 11.11 (2018) | 150.4 | 138 | 105.6 | |||||||
| World of Tanks enCore (2018) | 121.1 | |||||||||
| Far Cry 5 (2018) | 165 | 135 | 128 | 120 | 90 | |||||
| Strange Brigade (2018) | 393 | 235 | 186.6 | 160.7 | ||||||
| Apex Legends (2019) | 164.7 | 163.9 | 135.1 | 92.4 | 73.5 | 48.6 | ||||
| Borderlands 3 (2019) | 72.1 | 51.3 | ||||||||
| Gears Tactics (2020) | 109 | 73.3 | ||||||||
| Valorant (2020) | 189.4 | 304 | ||||||||
| Assassin´s Creed Valhalla (2020) | 152 | 106 | 85 | 62 | 53 | |||||
| F1 2021 (2021) | 360 | 287 | 227 | 112.8 | ||||||
| Far Cry 6 (2021) | 148.1 | 119.8 | 104.1 | 94.3 | 70.3 | |||||
| Cyberpunk 2077 1.6 (2022) | 61.9 | 38.6 | ||||||||
| Tiny Tina's Wonderlands (2022) | 180.27 | 147.17 | 102.73 | 80.51 | 56.25 | |||||
| F1 22 (2022) | 184.2 | 171.6 | 141.2 | 50.4 | 31.4 | |||||
| FIFA 23 (2022) | 116.9 | 118.2 | 111.9 | 88.9 | 62.8 | |||||
| A Plague Tale Requiem (2022) | 40.5 | 28.8 | ||||||||
| Uncharted Legacy of Thieves Collection (2022) | 57 | 34.3 | ||||||||
| Call of Duty Modern Warfare 2 2022 (2022) | 76 | 54 | ||||||||
| Spider-Man Miles Morales (2022) | 75.8 | 63.8 | ||||||||
| Starfield (2023) | 40.1 | 35.3 | 28.6 | 18.8 | ||||||
| Baldur's Gate 3 (2023) | 90.6 | 60.6 | ||||||||
| Cyberpunk 2077 (2023) | 107.6 | 85.8 | 73.3 | 63.6 | 46 | 38.2 | 22.2 | 17 | ||
| Counter-Strike 2 (2023) | 122.9 | 82.2 | 49.2 | |||||||
| EA Sports FC 24 (2023) | 125.6 | 101 | 58.2 | |||||||
| Total War Pharaoh (2023) | 97.3 | 69.3 | 36.5 | |||||||
| The Finals (2023) | 120.9 | 75.4 | 35 | |||||||
| Helldivers 2 (2024) | 73.9 | 37.9 | 27.6 | |||||||
| Horizon Forbidden West (2024) | 33.3 | 26.7 | 12.1 | |||||||
| Senua's Saga Hellblade 2 (2024) | 23.9 | 17.7 | 9.25 | |||||||
| F1 24 (2024) | 130.9 | 106.2 | 66.3 | 31 | 31.3 | 29.4 | 19.8 | 15.3 | 14 | 9.08 |
| Black Myth: Wukong (2024) | 41 | 32 | 18 | 15 | ||||||
| Star Wars Outlaws (2024) | 29.8 | 27.8 | 23.7 | 19.2 | 25.2 | 17.8 | ||||
| Space Marine 2 (2024) | 61.9 | 56.9 | 43 | 22.5 | ||||||
| Final Fantasy XVI (2024) | 49.7 | 43.8 | 40.9 | |||||||
| EA Sports FC 25 (2024) | 73.6 | 58 | 32.3 | |||||||
| Stalker 2 (2024) | 54.7 | 16.1 | 11.6 | 13.9 | 4 | |||||
| Marvel Rivals (2024) | 81 | 64 | 57 | 34 | 21 | |||||
| Kingdom Come Deliverance 2 (2025) | 60.4 | 44.2 | 43.6 | 31.6 | ||||||
| Monster Hunter Wilds (2025) | 59.6 | 49.3 | 27 | 25.5 | 18.8 | |||||
| Civilization 7 (2025) | 110.3 | 103.2 | 70.8 | 46.5 | 30.6 | |||||
| The Elder Scrolls IV Oblivion Remastered (2025) | 69 | 58.9 | 49.4 | 19.7 | 11.9 | |||||
| Doom: The Dark Ages (2025) | 62.5 | 58.1 | 50.4 | 49.9 | 40.9 | 44.8 | 31.6 | 12.7 | 10.3 | 10.4 |
| F1 25 (2025) | 186.8 | 165.1 | 126.5 | 10.4 | 10.7 | 6 | 4.54 | 1.697 | ||
| Borderlands 4 (2025) | 39.1 | 30.7 | 23.2 | 13.8 | ||||||
| Battlefield 6 (2025) | 94.1 | 82.3 | 67.9 | 45.2 | 41.1 | 26.9 | ||||
| The Outer Worlds 2 (2025) | 86.1 | 64.3 | 47.1 | 23.4 | 14.6 | |||||
| ARC Raiders (2025) | 143.8 | 90.5 | 70 | 37.5 | 27.2 | |||||
| Anno 117: Pax Romana (2025) | 80 | 59.2 | 44.6 | 24.3 | 24.9 | 17.2 | ||||
| Call of Duty Black Ops 7 (2025) | 122 | 111 | 83 | 27 | 15 | 3 | ||||
| Resident Evil Requiem (2026) | 86.1 | 60.6 | 57 | |||||||
| Death Stranding 2 (2026) | 67 | 57.2 | 51.8 | 38.8 | 42 | 26 | ||||
| Crimson Desert (2026) | 84.9 | 52 | 48.8 | 41.7 | 35 | 31.9 | ||||
| Pragmata (2026) | 58.2 | 53.8 | 39.5 | 25.2 | 19.1 | |||||
| War Thunder (2026) | 245 | 261 | 240 | 62.3 | 37.7 | 19.6 | ||||
| Forza Horizon 6 (2026) | 79 | 47 | 21 | 19 | 14 | |||||
| 007 First Light (2026) | 53.9 | 51.1 | 44.7 | 41.6 | 35.5 | 13.2 |
Emissões - Gamer típico
Ruído do sistema
Embora a Lenovo forneça uma permissão muito generosa para o consumo de energia tanto para a CPU quanto para a GPU, a Legion 5 se comporta de forma pouco marcante quando comparada com a concorrência no teste de ruído. Embora os ventiladores também funcionem durante atividades simples, não achamos isto irritante. Como os ventiladores não pulsam e registram sua instalação com um aumento lento da velocidade e sem freqüências de interferência incômodas, também é possível cortar vídeos ou editar imagens sem os fones de ouvido ligados. Assim que a CPU e a placa gráfica funcionarem a até 120 W, o calor residual resultante deve ser dissipado da caixa. Quando isto ocorre, os ventiladores entram em ação, mas mantêm suas características discretas mesmo em velocidades mais altas.
Entretanto, você deve manter seus fones de ouvido ou o fone de ouvido em stand-by ao colocá-lo em funcionamento, isto se aplica a praticamente todos os laptops em 2022, mesmo quando o hardware não é tão efetivamente explorado como no Legion 5 Pro.
Barulho
| Ocioso |
| 28.7 / 32 / 32 dB |
| Carga |
| 45.2 / 54.4 dB |
 | ||
30 dB silencioso 40 dB(A) audível 50 dB(A) ruidosamente alto |
||
min: | ||
| Lenovo Legion 5 Pro 16IAH7H GeForce RTX 3060 Laptop GPU, i7-12700H, 2x Samsung PM9A1 MZVL21T0HCLR (RAID 0) | HP Omen 16-b1090ng GeForce RTX 3070 Ti Laptop GPU, i7-12700H, WDC PC SN810 1TB | HP Omen 16-c0077ng Radeon RX 6600M, R7 5800H, Samsung PM981a MZVLB1T0HBLR | Gigabyte Aero 16 YE5 GeForce RTX 3080 Ti Laptop GPU, i9-12900HK, Phison ESR01TBMFCT | Alienware x14 i7 RTX 3060 GeForce RTX 3060 Laptop GPU, i7-12700H, WDC PC SN810 1TB | |
|---|---|---|---|---|---|
| Noise | -4% | -3% | -1% | 10% | |
| desligado / ambiente * (dB) | 24.6 | 26 -6% | 25 -2% | 25 -2% | 24.7 -0% |
| Idle Minimum * (dB) | 28.7 | 30 -5% | 25 13% | 30 -5% | 24.7 14% |
| Idle Average * (dB) | 32 | 31 3% | 31.2 2% | 32 -0% | 24.7 23% |
| Idle Maximum * (dB) | 32 | 33 -3% | 33.8 -6% | 33 -3% | 30.9 3% |
| Load Average * (dB) | 45.2 | 49 -8% | 55.4 -23% | 45 -0% | 40 12% |
| Load Maximum * (dB) | 54.4 | 57 -5% | 56 -3% | 52 4% | 51.5 5% |
| Witcher 3 ultra * (dB) | 53 | 50 | 51.5 |
* ... menor é melhor
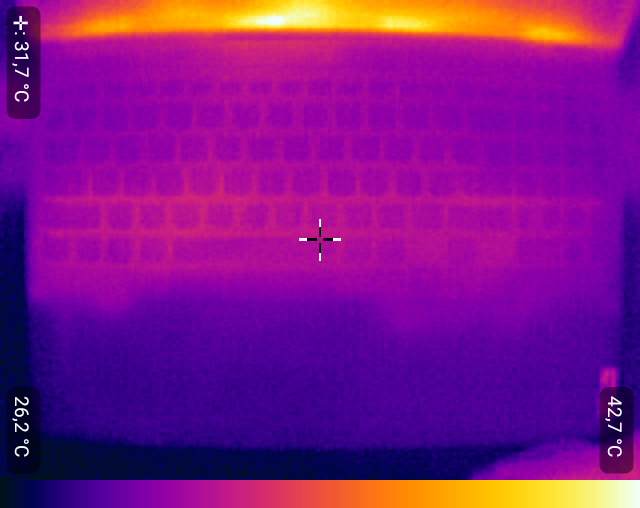
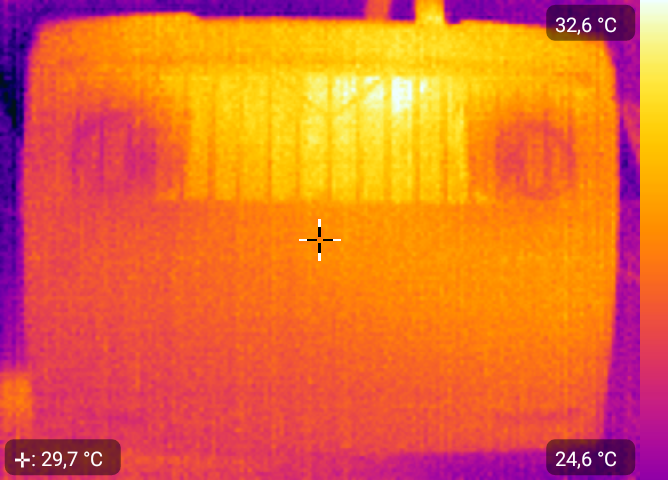
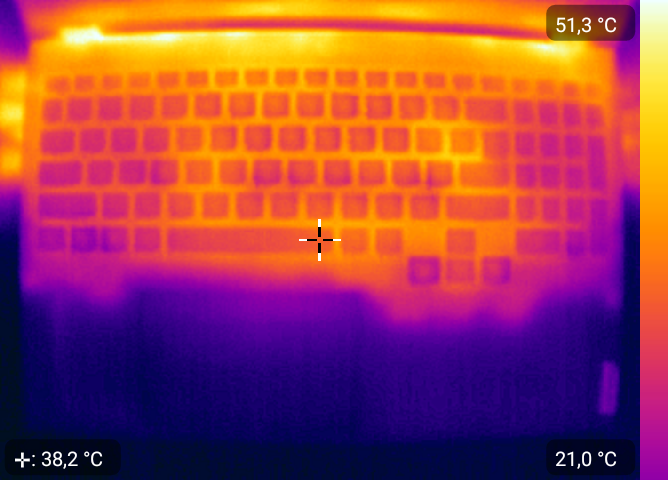
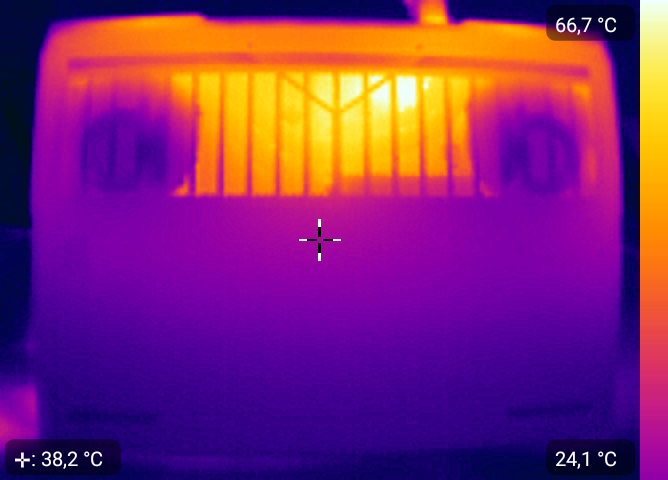
Temperatura
As superfícies metálicas superiores desta unidade de 16 polegadas aquecem moderadamente sob carga. Também pode ficar muito quente perto da tela, mas nem o teclado nem o descanso para o pulso estavam desagradavelmente quentes durante nossos testes. Na parte inferior e nas proximidades dos elementos de resfriamento na parte de trás do laptop, ele pode ficar razoavelmente quente. Digamos que o Legion prefere ficar empoleirado em uma mesa enquanto joga.
(-) A temperatura máxima no lado superior é 45.8 °C / 114 F, em comparação com a média de 40.4 °C / 105 F , variando de 21.2 a 68.8 °C para a classe Gaming.
(-) A parte inferior aquece até um máximo de 66.3 °C / 151 F, em comparação com a média de 43.2 °C / 110 F
(+) Em uso inativo, a temperatura média para o lado superior é 27.8 °C / 82 F, em comparação com a média do dispositivo de 33.9 °C / ### class_avg_f### F.
(+) Os apoios para as mãos e o touchpad são mais frios que a temperatura da pele, com um máximo de 29 °C / 84.2 F e, portanto, são frios ao toque.
(±) A temperatura média da área do apoio para as mãos de dispositivos semelhantes foi 28.8 °C / 83.8 F (-0.2 °C / -0.4 F).
| Lenovo Legion 5 Pro 16IAH7H Intel Core i7-12700H, NVIDIA GeForce RTX 3060 Laptop GPU | HP Omen 16-b1090ng Intel Core i7-12700H, NVIDIA GeForce RTX 3070 Ti Laptop GPU | HP Omen 16-c0077ng AMD Ryzen 7 5800H, AMD Radeon RX 6600M | Gigabyte Aero 16 YE5 Intel Core i9-12900HK, NVIDIA GeForce RTX 3080 Ti Laptop GPU | Alienware x14 i7 RTX 3060 Intel Core i7-12700H, NVIDIA GeForce RTX 3060 Laptop GPU | |
|---|---|---|---|---|---|
| Heat | 12% | 9% | -2% | 11% | |
| Maximum Upper Side * (°C) | 45.8 | 41 10% | 40.6 11% | 49 -7% | 51.3 -12% |
| Maximum Bottom * (°C) | 66.3 | 62 6% | 36 46% | 55 17% | 44.4 33% |
| Idle Upper Side * (°C) | 30.4 | 25 18% | 31.3 -3% | 33 -9% | 27.2 11% |
| Idle Bottom * (°C) | 30.4 | 26 14% | 36 -18% | 33 -9% | 26.6 12% |
* ... menor é melhor
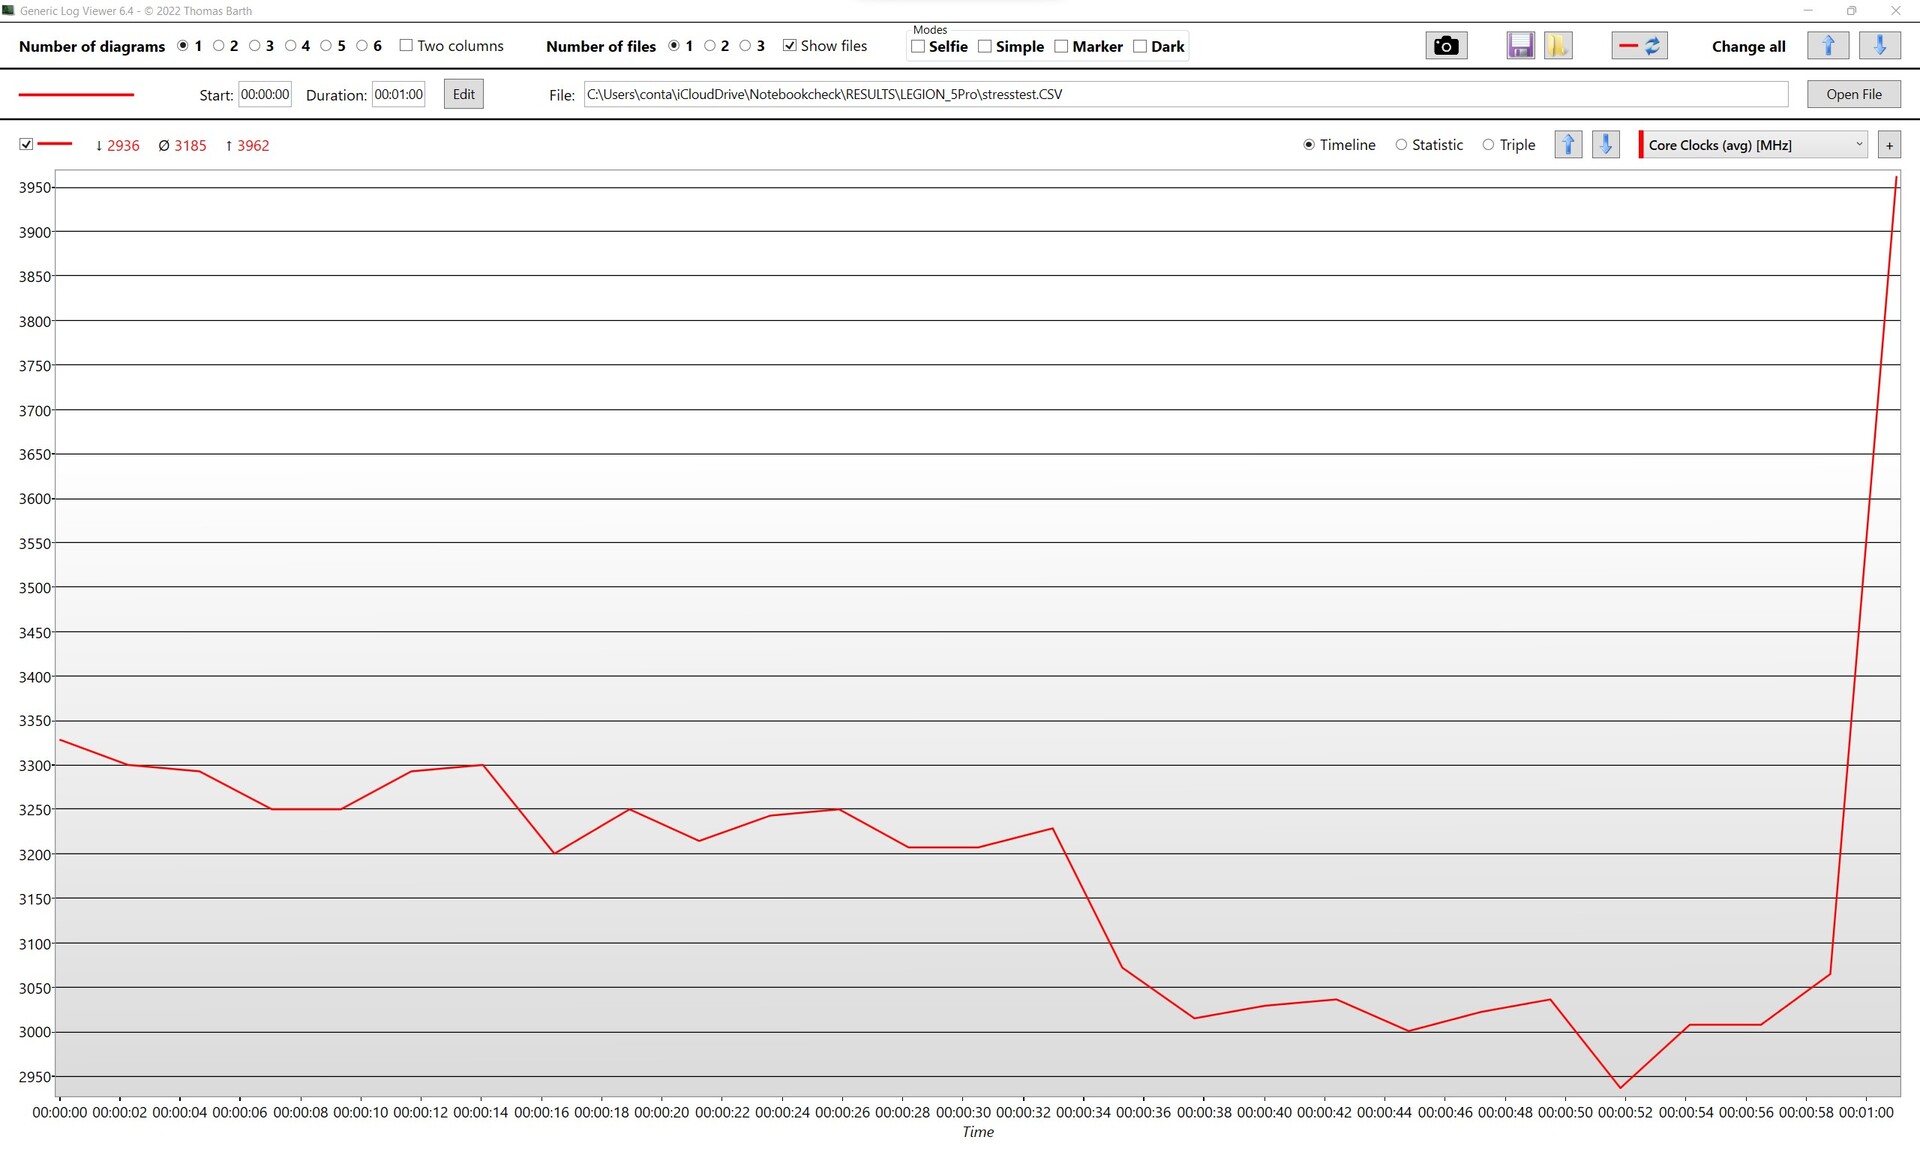
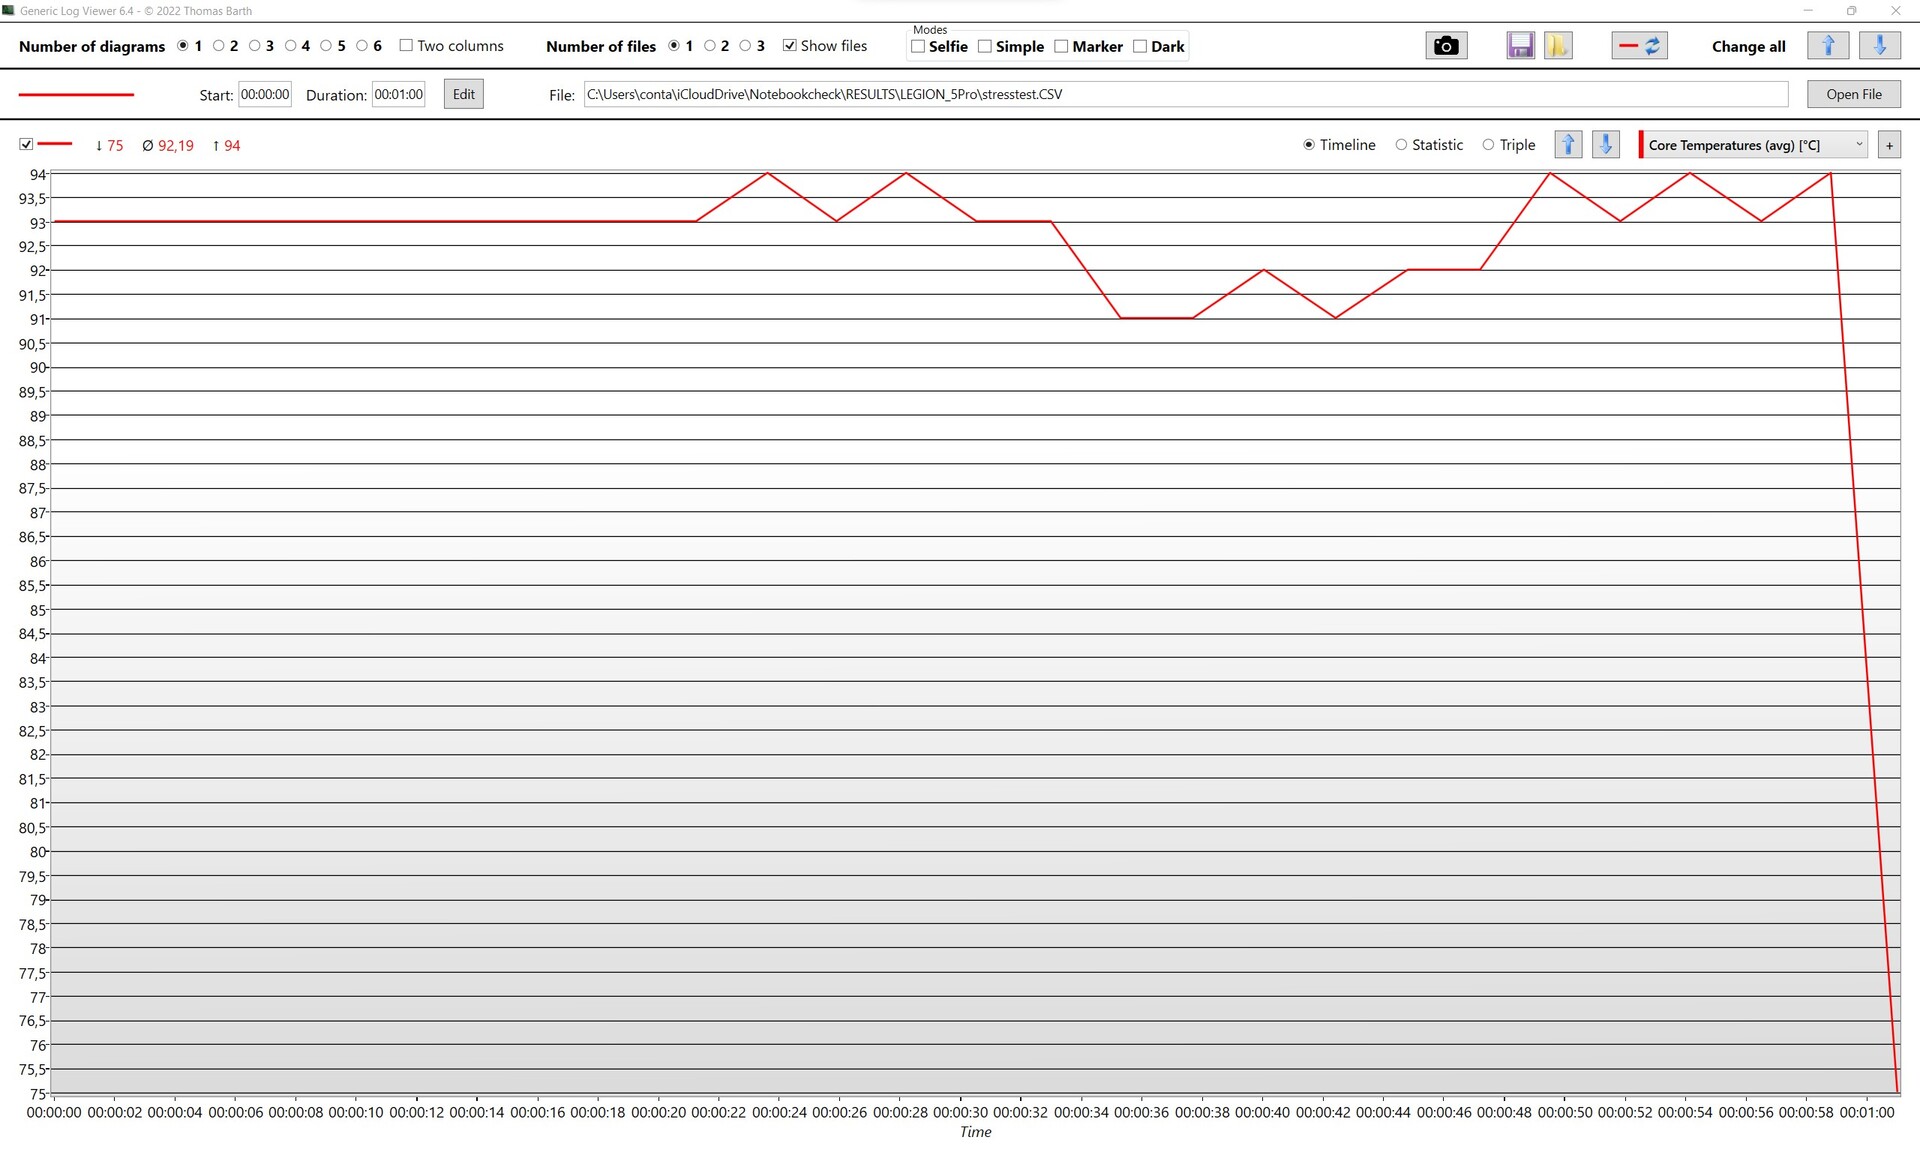
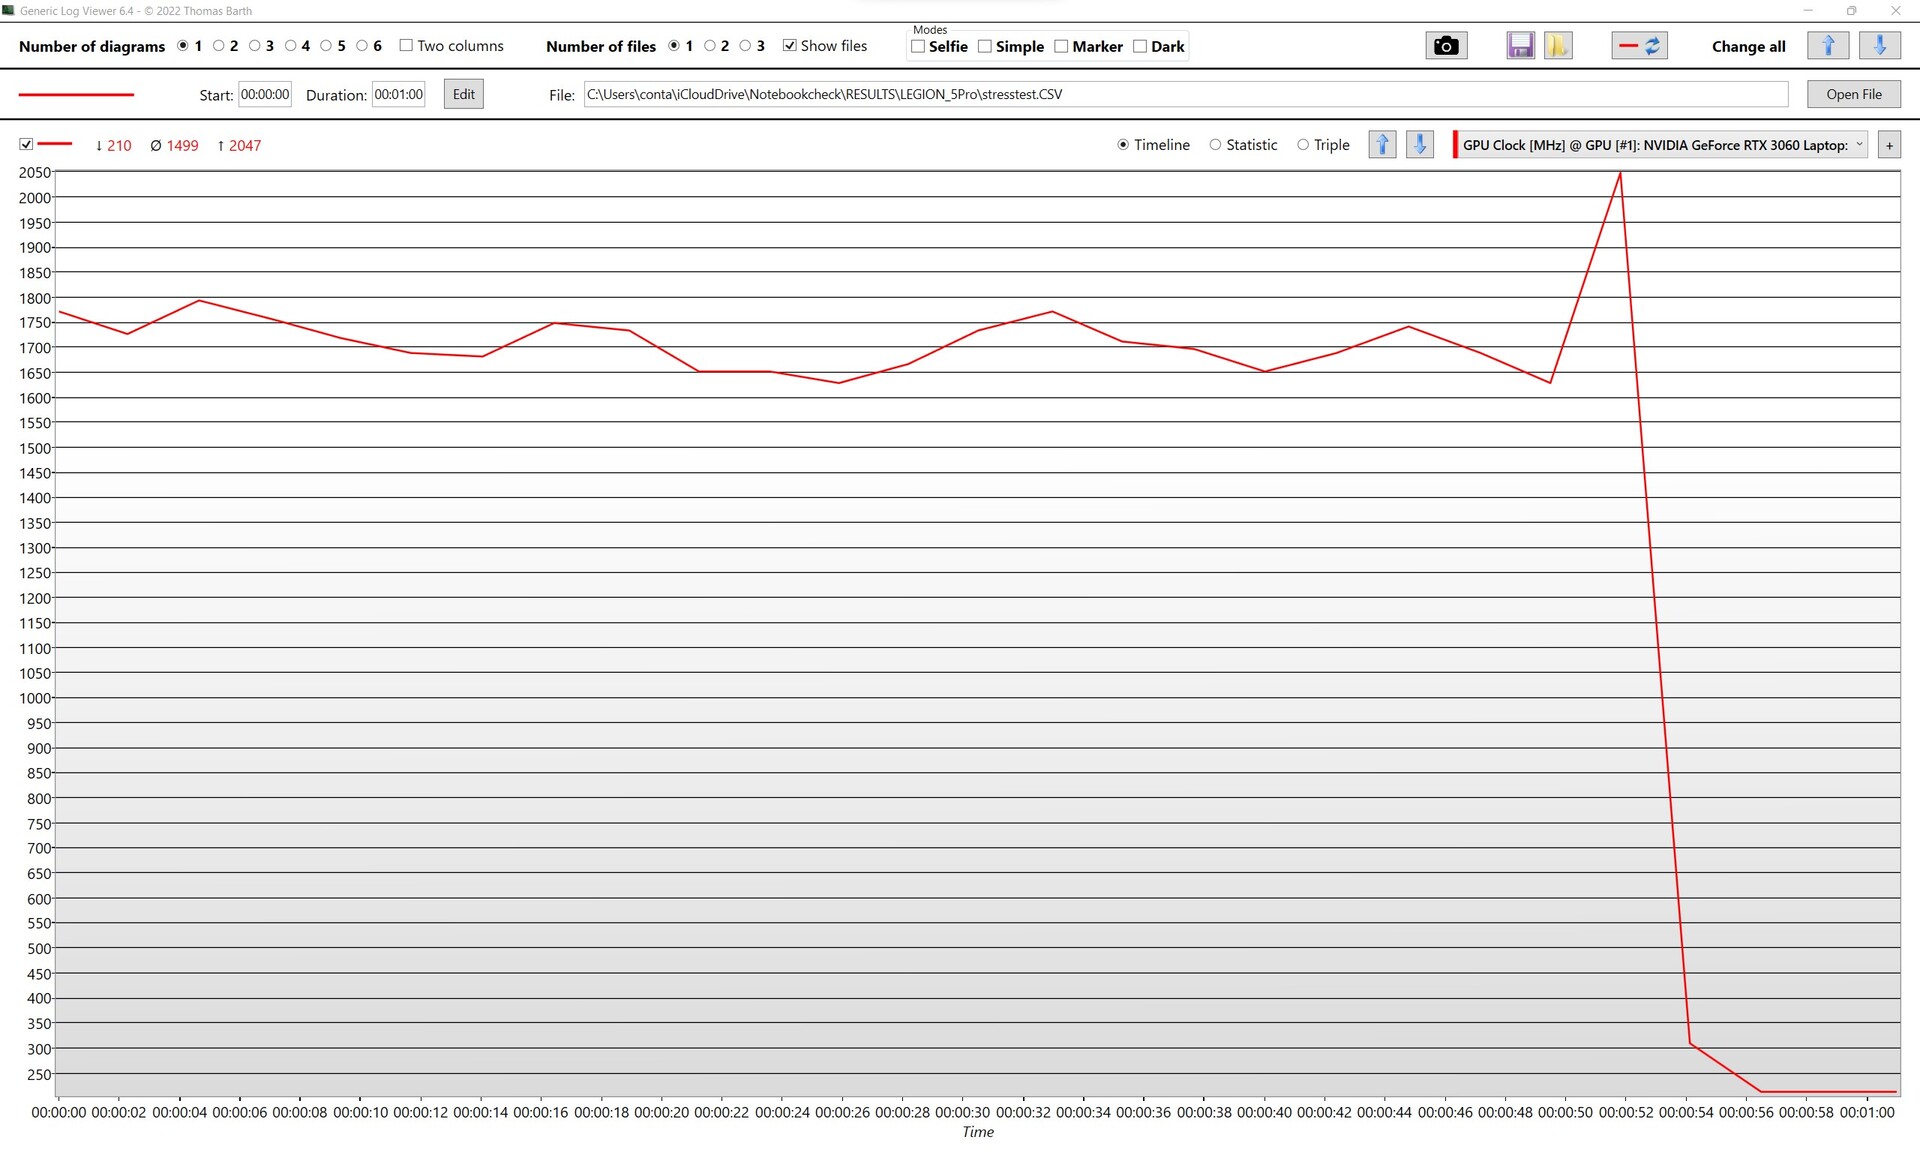
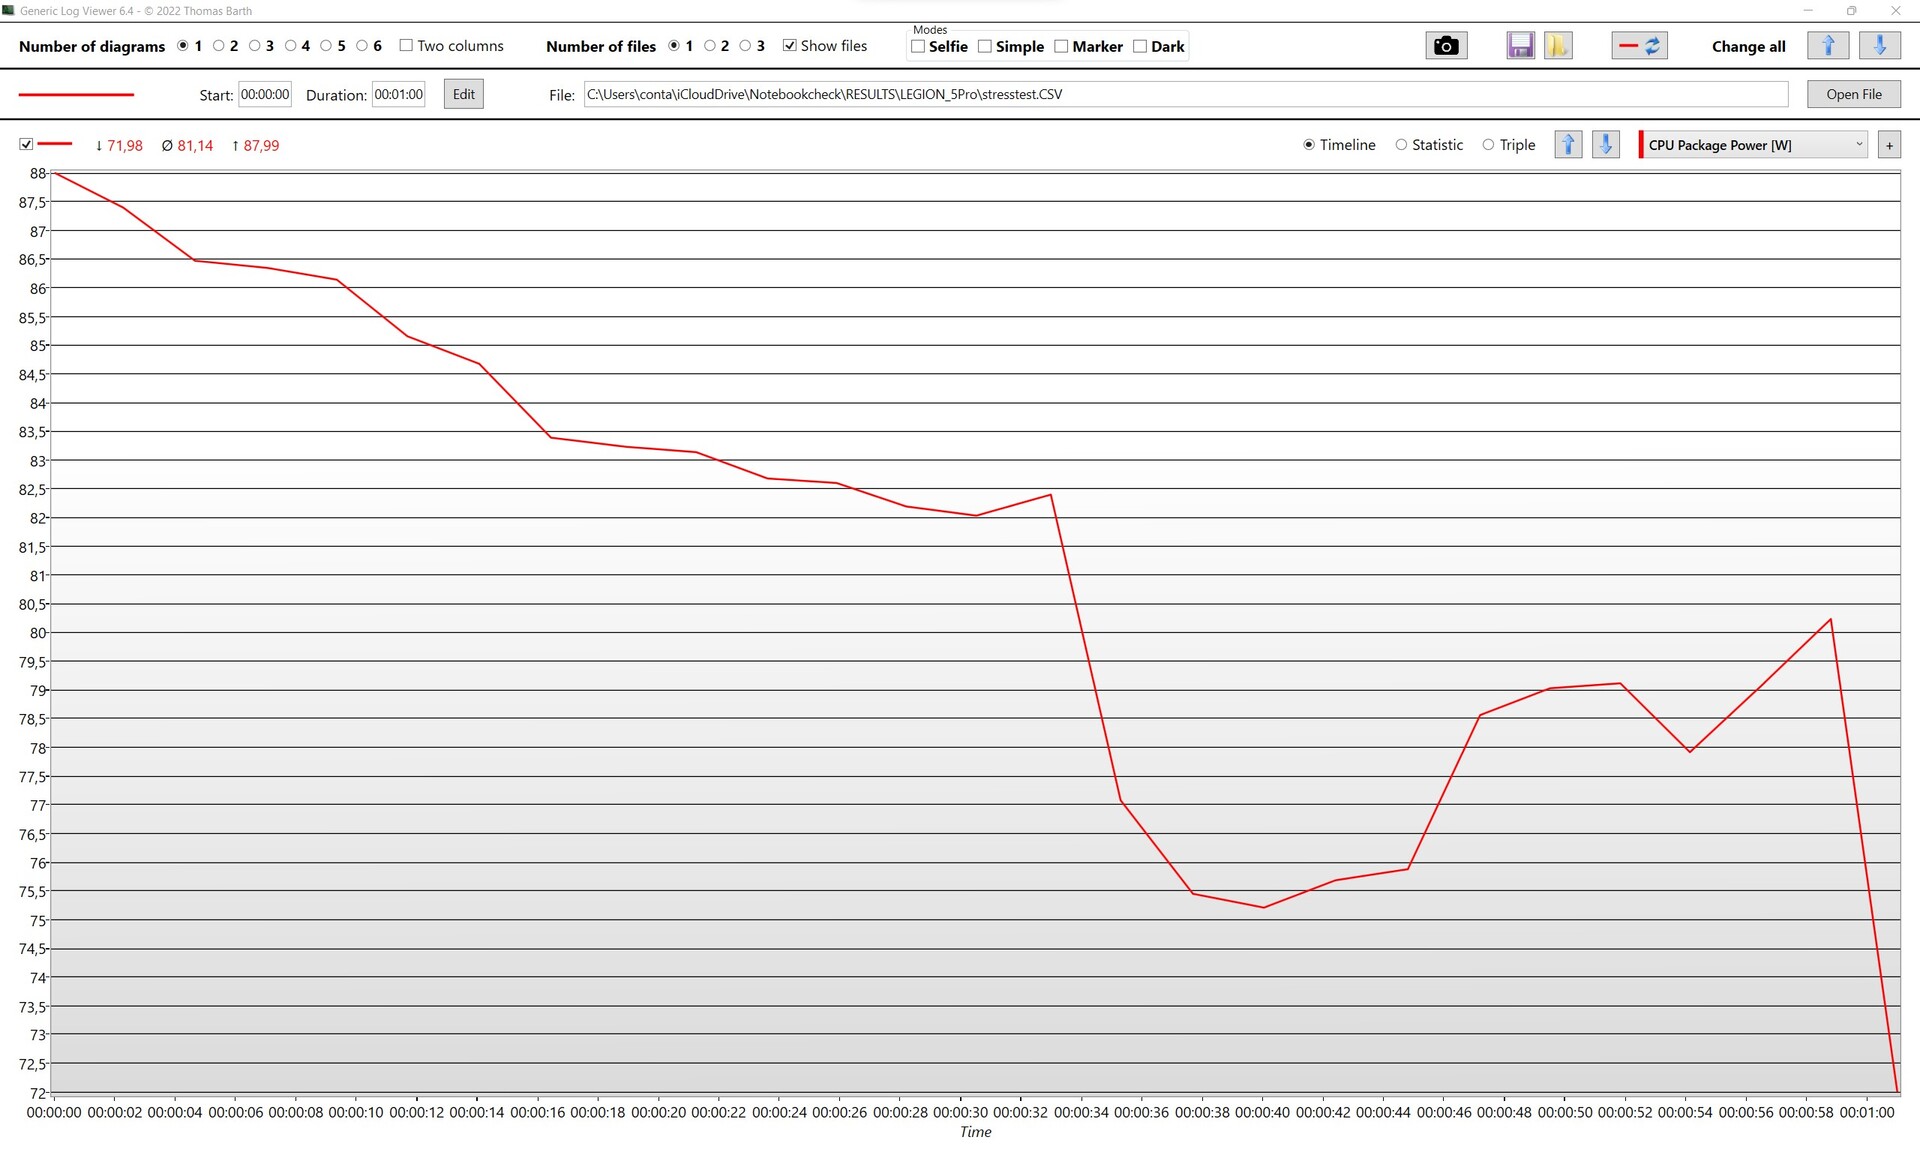
| Relógio CPU (GHz) | Relógio GPU (MHz) | durchschnittlich. CPU-Temperatur (°C) | durchschnittliche GPU-Temperatur (°C) | |
| Sistema ocioso | 3.910 | 210 | 46 | 48 |
| Prime95 Stress | 3.352 | 210 | 91 | 61 |
| Prime95 + FurMark Stress | 2.773 | 1.568 | 93 | 86 |
| Witcher 3 Stress | 3.800 | 1.810 | 79 | 86 |
Teste de estresse
Em nosso teste de estresse de uma hora usando Prime 95 e FurMark, quisemos explorar questões extremas de calor e/ou consumo de energia. Nem mesmo em um cenário que geralmente nunca ocorreria sob padrões normais de uso, a Legion 5 Pro dobrou. Embora as temperaturas fossem altas, elas estavam dentro das especificações da Intel e Nvidia e as taxas de relógio ainda eram aceitáveis. Nem o i7 nem o RTX 3060 caíram abaixo de suas taxas de relógio de base, e as taxas de relógio do processador e da placa gráfica permaneceram consistentemente altas em jogos normais.
Oradores
Os alto-falantes integrados fazem seu trabalho mais do que apropriadamente para o estranho vídeo do YouTube ou mesmo para uma noite de cinema. A qualidade é realmente excelente, e infelizmente não é típica dos laptops. Isso é algo em que gostaríamos de ver um pouco mais de atenção de quase todos os fabricantes.
No Legion 5, as freqüências médias e triplas são completamente satisfatórias e fornecem um som claro, enquanto o volume pode precisar ser ligeiramente maior para salas ou grupos maiores de pessoas. Infelizmente, quase perdemos completamente os baixos, mas isso não é nada incomum para os laptops. Em contraste com as outras categorias de produtos, este dispositivo de 16 polegadas oferece apenas a tarifa padrão. Mas para um laptop para jogos, que o provável jogador provavelmente usa com um fone de ouvido a maior parte do tempo, isto é aceitável em nossa opinião.
Lenovo Legion 5 Pro 16IAH7H análise de áudio
(±) | o volume do alto-falante é médio, mas bom (###valor### dB)
Graves 100 - 315Hz
(-) | quase nenhum baixo - em média 21.7% menor que a mediana
(±) | a linearidade dos graves é média (12.8% delta para a frequência anterior)
Médios 400 - 2.000 Hz
(±) | médios mais altos - em média 5% maior que a mediana
(+) | médios são lineares (3.4% delta para frequência anterior)
Altos 2 - 16 kHz
(+) | agudos equilibrados - apenas 1.7% longe da mediana
(+) | os máximos são lineares (4.1% delta da frequência anterior)
Geral 100 - 16.000 Hz
(±) | a linearidade do som geral é média (18% diferença em relação à mediana)
Comparado com a mesma classe
» 56% de todos os dispositivos testados nesta classe foram melhores, 9% semelhantes, 36% piores
» O melhor teve um delta de 6%, a média foi 18%, o pior foi 132%
Comparado com todos os dispositivos testados
» 38% de todos os dispositivos testados foram melhores, 8% semelhantes, 54% piores
» O melhor teve um delta de 4%, a média foi 23%, o pior foi 134%
HP Omen 16-b1090ng análise de áudio
(+) | os alto-falantes podem tocar relativamente alto (###valor### dB)
Graves 100 - 315Hz
(-) | quase nenhum baixo - em média 24.4% menor que a mediana
(±) | a linearidade dos graves é média (13.8% delta para a frequência anterior)
Médios 400 - 2.000 Hz
(+) | médios equilibrados - apenas 1.9% longe da mediana
(+) | médios são lineares (2.8% delta para frequência anterior)
Altos 2 - 16 kHz
(+) | agudos equilibrados - apenas 2.2% longe da mediana
(+) | os máximos são lineares (3.8% delta da frequência anterior)
Geral 100 - 16.000 Hz
(±) | a linearidade do som geral é média (15.1% diferença em relação à mediana)
Comparado com a mesma classe
» 32% de todos os dispositivos testados nesta classe foram melhores, 6% semelhantes, 62% piores
» O melhor teve um delta de 6%, a média foi 18%, o pior foi 132%
Comparado com todos os dispositivos testados
» 21% de todos os dispositivos testados foram melhores, 4% semelhantes, 75% piores
» O melhor teve um delta de 4%, a média foi 23%, o pior foi 134%
Gestão de energia - altos níveis de potência requerem muita energia
Consumo de energia
As metas de alta potência para o hardware instalado são perceptíveis no consumo de energia: Mesmo em modo inativo, o Legion às vezes consome mais que o dobro de energia em comparação com a concorrência. Sob carga, acontece que a grande fonte de energia de 300 W é um pouco grande demais, mas certamente não muito especificada. O Legion sem dúvida lidera o campo no consumo de energia com um consumo máximo de 240 W, mas tendo em vista o desempenho entregue que é absolutamente aceitável.
| desligado | |
| Ocioso | |
| Carga |
|
Key:
min: | |
| Lenovo Legion 5 Pro 16IAH7H i7-12700H, GeForce RTX 3060 Laptop GPU, 2x Samsung PM9A1 MZVL21T0HCLR (RAID 0), IPS, 2560x1600, 16" | HP Omen 16-b1090ng i7-12700H, GeForce RTX 3070 Ti Laptop GPU, WDC PC SN810 1TB, IPS, 2560x1440, 16.1" | HP Omen 16-c0077ng R7 5800H, Radeon RX 6600M, Samsung PM981a MZVLB1T0HBLR, IPS, 2560x1440, 16.1" | Gigabyte Aero 16 YE5 i9-12900HK, GeForce RTX 3080 Ti Laptop GPU, Phison ESR01TBMFCT, AMOLED, 3840x2400, 16" | Alienware x14 i7 RTX 3060 i7-12700H, GeForce RTX 3060 Laptop GPU, WDC PC SN810 1TB, IPS, 1920x1080, 14" | Apple MacBook Pro 16 2021 M1 Pro M1 Pro, M1 Pro 16-Core GPU, Apple SSD AP1024R, Mini-LED, 3456x2234, 16.2" | Média NVIDIA GeForce RTX 3060 Laptop GPU | Média da turma Gaming | |
|---|---|---|---|---|---|---|---|---|
| Power Consumption | 42% | 29% | 5% | 54% | 63% | 41% | 29% | |
| Idle Minimum * (Watt) | 22.8 | 4 82% | 12 47% | 26 -14% | 7.9 65% | 5 78% | 10.4 ? 54% | 13 ? 43% |
| Idle Average * (Watt) | 26.5 | 10 62% | 12.8 52% | 30 -13% | 11.1 58% | 15.1 43% | 14.5 ? 45% | 19 ? 28% |
| Idle Maximum * (Watt) | 41 | 19 54% | 18.5 55% | 37 10% | 11.8 71% | 15.5 62% | 21.4 ? 48% | 24.6 ? 40% |
| Load Average * (Watt) | 191 | 114 40% | 190 1% | 127 34% | 107.4 44% | 54 72% | 109.3 ? 43% | 110.7 ? 42% |
| Witcher 3 ultra * (Watt) | 194.7 | 183.2 6% | 194 -0% | 176 10% | 111 43% | |||
| Load Maximum * (Watt) | 238 | 221 7% | 200 16% | 236 1% | 140.4 41% | 90 62% | 206 ? 13% | 259 ? -9% |
* ... menor é melhor
Witcher 3 power consumption / Stress test
Power consumption external monitor
Vida útil da bateria
Nosso teste mostra o lado sombra de alta demanda de energia sem estar ligado a uma tomada de parede. Aqui, a concorrência deixa o Legion por pó. A Lenovo não ganhou um prêmio de resistência pelas 3,5 horas que conseguiu em nosso teste de navegação na web com um brilho de tela fixo de 150 lêndeas. 30 minutos de duração sob carga também não são competitivos. Aproximadamente 2 horas de jogo dão ao Legion alguns pontos de consolação. Mas também aqui pensamos que os resultados precisam ser considerados no contexto do provável uso diário. Provavelmente você não compra um caderno de jogos tão poderoso para escrever e-mails o dia todo em um café ou para receber uma maratona em série enquanto acampa.
| Lenovo Legion 5 Pro 16IAH7H i7-12700H, GeForce RTX 3060 Laptop GPU, 80 Wh | HP Omen 16-b1090ng i7-12700H, GeForce RTX 3070 Ti Laptop GPU, 83 Wh | HP Omen 16-c0077ng R7 5800H, Radeon RX 6600M, 70 Wh | Gigabyte Aero 16 YE5 i9-12900HK, GeForce RTX 3080 Ti Laptop GPU, 99 Wh | Alienware x14 i7 RTX 3060 i7-12700H, GeForce RTX 3060 Laptop GPU, 80 Wh | Média da turma Gaming | |
|---|---|---|---|---|---|---|
| Duração da bateria | 137% | 36% | 109% | 62% | 117% | |
| H.264 (h) | 4.1 | 7 71% | 7.5 83% | 9.4 129% | 8.32 ? 103% | |
| WiFi v1.3 (h) | 3.6 | 5.6 56% | 6.1 69% | 6.4 78% | 8.9 147% | 7.11 ? 98% |
| Witcher 3 ultra (h) | 2.1 | 1.4 -33% | 0.8 -62% | |||
| Load (h) | 0.6 | 1.9 217% | 1.6 167% | 0.8 33% | 1.502 ? 150% | |
| Reader / Idle (h) | 10.1 | 8.9 | 8.27 ? |
Pro
Contra
Veredicto - Um pacote bem equilibrado que mostra o que uma CPU e uma GPU podem realmente alcançar
A Lenovo está novamente fazendo muito bem este ano depois de ter entregue o Legion 5 Pro que foi um dos mais populares cadernos de jogos do mercado no ano passado. O case é claramente voltado para o mercado de jogos, mas os logotipos que chamam a atenção têm sido de bom gosto, proporcionando assim uma passagem fácil para este dispositivo de 16 polegadas como um cavalo de batalha de desempenho.
Tanto os gamers quanto os editores/videógrafos de imagem ficarão satisfeitos com a enorme variedade de opções de conectividade. É refrescante ver a Lenovo resistindo à tendência de renunciar a portas e slots essenciais em favor de caixas mais finas. A tela de 16 polegadas 16:10 QHD também oferece poucas razões para críticas. Para jogos, é irrepreensível e é mais do que apenas disparado pelo RTX 3060. Enquanto gostaríamos de ter mais cobertura AdobeRGB para edição de imagens profissionais ou fotógrafos, os editores de vídeo também terão aqui o valor de seu dinheiro. O software X-Rite incluído está disponível com perfis sRGB e Rec.709 chave na mão - isso é um enorme bônus.
A característica de destaque do Legion 5 Pro é seu desempenho. Os componentes instalados são implantados com fineza e fornecem uma vitrine do que eles são capazes de fazer. Isto se aplica tanto ao excepcionalmente potente i7-12700H quanto ao RTX 3060 de alta qualidade. É difícil imaginar que se possa exigir mais e, como tal, é uma prova de futuro por alguns anos ainda.
Foi necessário algum esforço para encontrar quaisquer falhas de substância, e mesmo quando o fizemos, elas são insignificantes no contexto de um laptop para jogos (por exemplo, a duração da bateria); ou elas contribuem de alguma forma para outros pontos fortes. O Legion 5 Pro pode ser ligeiramente maior, mais pesado e mais volumoso que seus concorrentes, mas é isso que prepara o caminho para um sistema de resfriamento eficaz e montes de conectividade. Se você está realmente atrás de algo um pouco mais leve, talvez queira dar uma olhada no HP Omen 16 (revisão no YouTube). Seu desempenho de CPU está longe do do Legion, mas com um RTX 3070 Ti você obtém um desempenho significativamente melhor da GPU e uma caixa mais fina. Se sua vida cotidiana tem mais a ver com o trabalho real, talvez você queira dar uma olhada no Gigabyte Aero 16. Embora o preço mais alto da i9 mal valha a pena (em nosso teste Cinebench R23 é até mesmo vencido pela i7 no Legion 5 Pro), o RTX 3080 Ti e o grande painel OLED são sapatos para edição de vídeo e foto.
Preço e Disponibilidade
Com um preço de cerca de 1.800 Euros (US$ 1.825) para a unidade SSD de 1 TB, a Lenovo Legion 5 Pro é um equipamento quase perfeito para cada aplicação e pode, com toda a confiança, reduzir a sobretaxa de 3070 Ti da concorrência com seu RTX 3060.
Lenovo Legion 5 Pro 16IAH7H
- 07/25/2022 v7 (old)
Alexander Wätzel
Price comparison

